Daily Report : TradingEdge Weekly for Dec 8 - New high surge, recovering financials, commodity struggles

| View/Print a PDF version of this Report |
Headlines
|
TradingEdge Weekly for Dec 8 - New high surge, recovering financials, commodity struggles: This week, we saw that there was a surge in stocks hitting one-month highs. That helped trigger a plunge in implied volatility expectations. More indicators are lining up on the bullish side, helped (finally) by a breadth surge in the financial sector. Natural gas is entering a seasonal weak spot. Using seasonal cycles to creates a silver trading system. |
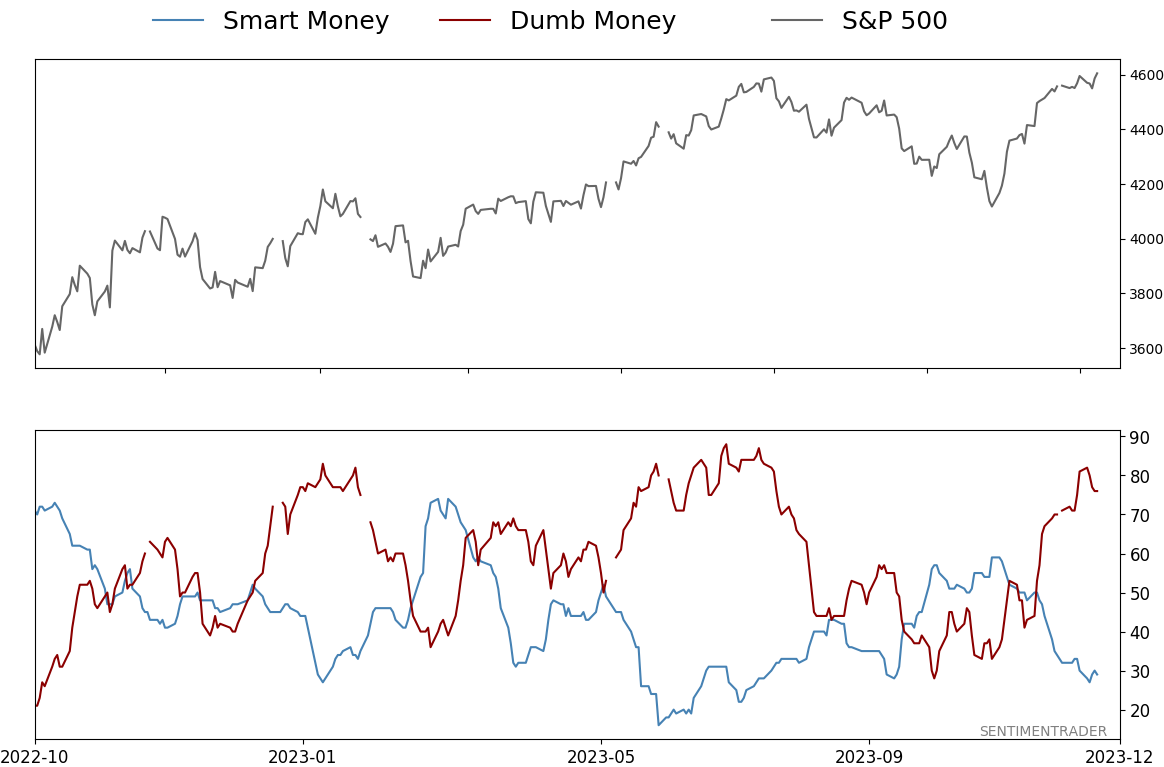
Smart / Dumb Money Confidence
|
|
Risk Levels
|

|


|
Research
TradingEdge Weekly for Dec 8 - New high surge, recovering financials, commodity strugglesBy Jason GoepfertBOTTOM LINEThis week, we saw that there was a surge in stocks hitting one-month highs. That helped trigger a plunge in implied volatility expectations. More indicators are lining up on the bullish side, helped (finally) by a breadth surge in the financial sector. Natural gas is entering a seasonal weak spot. Using seasonal cycles to creates a silver trading system. FORECAST / TIMEFRAME |
Key points:
- There has been a plethora one one-month highs in S&P 500 stocks
- The jump in new short-term highs helped trigger a plunge in implied volatility
- More and more indicators are flashing green for stocks
- Our short- and medium-term Risk Levels hit a combined record high
- Finally, the financial sector saw a compelling breadth thrust among its member stocks
- Natural gas is entering a seasonal weak spot
- Commodities, in general, have fared poorly and that bodes ill for the coming months
- Keeping an eye on silver cycles including a cycles-based trading system
- A clear window for corn
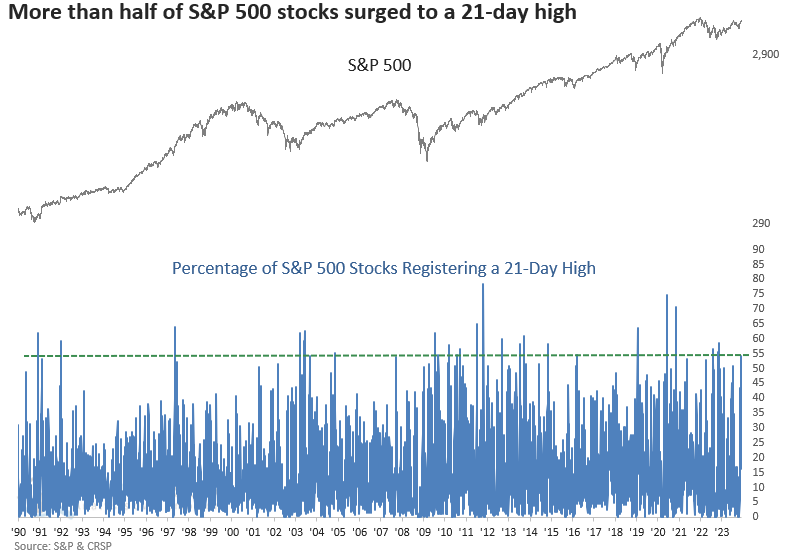
A plethora of one-month highs
With a quick reversal in many stocks, Dean noted that the percentage of S&P 500 stocks registering a 21-day high surged above 54%. Similar expansions in new highs led to additional upside momentum for stocks.
When the percentage of S&P 500 stocks registering a 21-day high exceeds 54%, like now, it's a good indication of a bullish trend backdrop, which is why this breadth indicator is a component in the TCTM Composite Thrust Model. The previous signal triggered an alert in October 2022, leading to an 8.8% gain in the S&P 500 over the subsequent six months.
While performance metrics have consistently surpassed study period results since 1931, the overall outlook was adversely affected by the secular bear market of 1929-49. Since 1950, the S&P 500 was higher 90% of the time a year later, with signals before the 1987 crash accounting for two out of the three total losses. Since the 1987 crash, this indicator has a perfect record a year later.
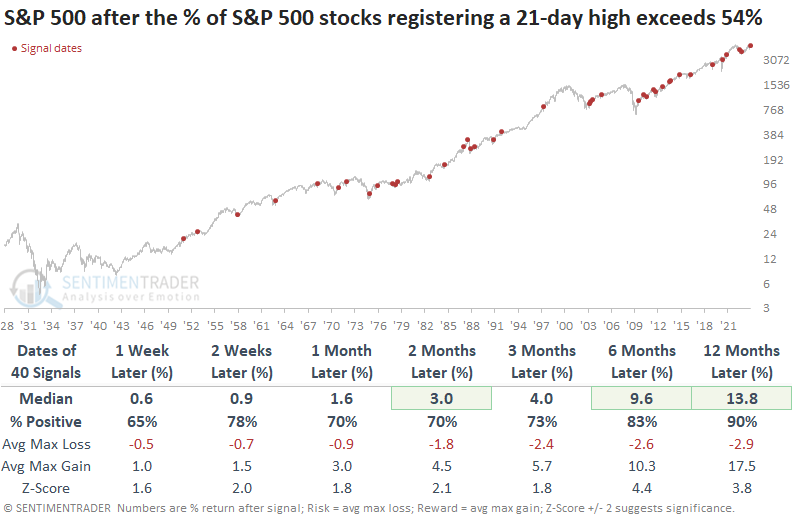
Value/cyclical-oriented groups fueled the expansion in the new high list. The significant increase in new highs from financial sector stocks is noteworthy, especially given the systemic importance of this group, which tends to underperform before recessions and bear markets (see more on financials below).
Volatility expectations plunged and stayed there
For the first time since December 2019, the VIX "fear gauge" has cycled from at least a few days in elevated territory to a relatively long streak in the complacent zone.
Knee-jerk contrarians love to suggest buying stocks when "fear" is high and selling them when it's low. In practice, however, it has most often benefited investors who do the opposite, at least for a while. If we look at that December 2019 precedent, it was, indeed, good for bulls...for a while. Then the pandemic hit, and all hell broke loose.
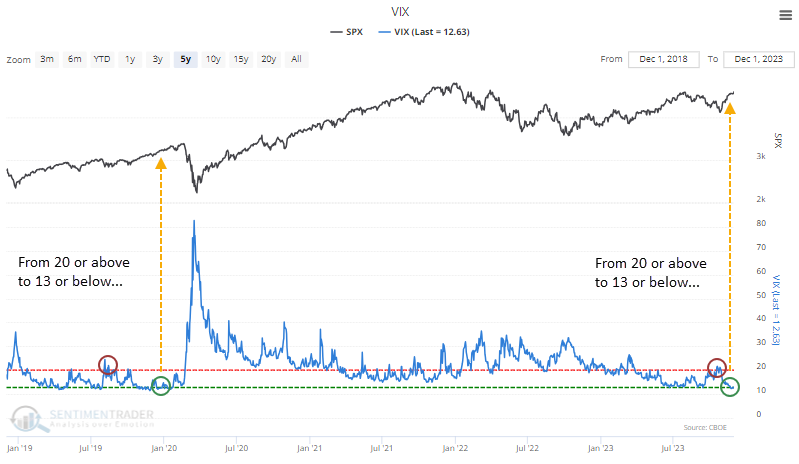
That's an extraordinary instance, however. Historically, it has proven to be better to be a bull when relative fear turns to relative complacency. Over the next couple of months, the S&P sported a negative return only once (the 2020 doozy). Even that one ended up showing a substantial gain a year later.
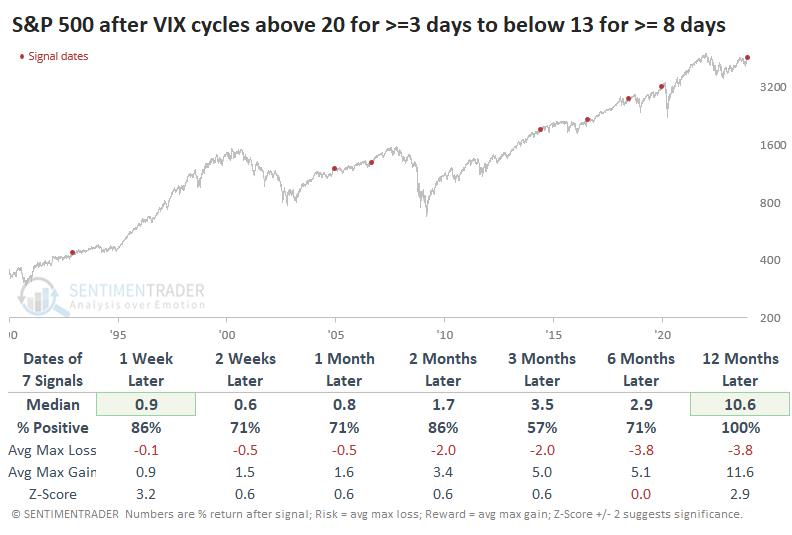
For the VIX itself, it typically continued to decline in the short-term. But it rose most of the time two months and beyond, even though stocks also tended to rise. There is not a precise inverse correlation between stocks and implied volatility.
If we combine the indicator and the calendar, looking at times when the VIX held below 13 for at least 8 trading days while we were in December, the handful of signals showed gains or minimal losses at worst across all time frames except for the one that triggered right before the 2020 pandemic.
More signals flash green for stocks
Jay noted that a variety of breadth, price action, and risk level measures have recently been flashing green.
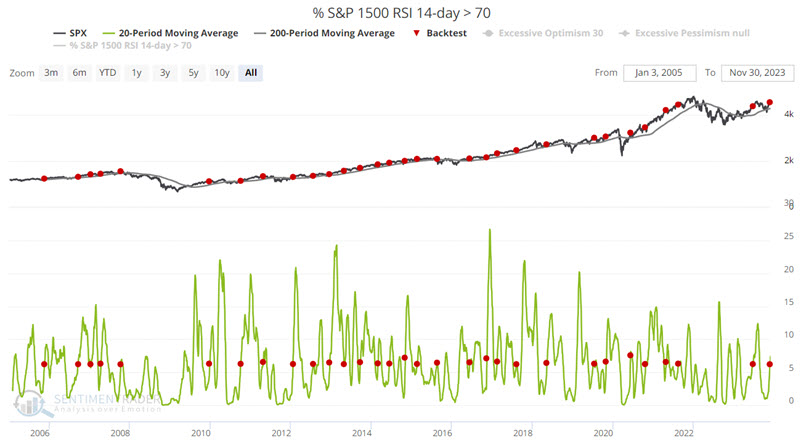
The S&P 1500 RSI 14-day > 70 indicator is calculated by determining the 14-day RSI values for each of the S&P 1500 symbols and then calculating the percentage of them at extreme values.
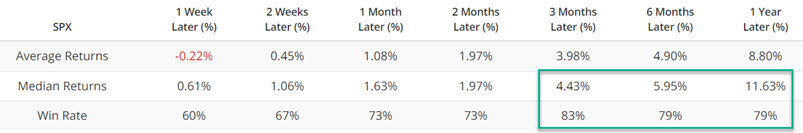
The chart below displays those dates when the 20-day moving average of the S&P 1500 RSI 14-day > 70 indicator crossed above 6.2% for the first time in three months while the S&P 500 index is above its 200-day moving average. This scenario essentially highlights a reversal from an oversold condition within an ongoing uptrend.
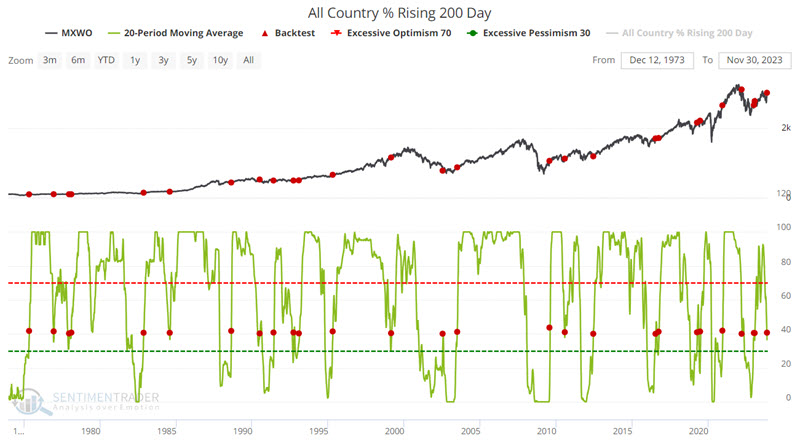
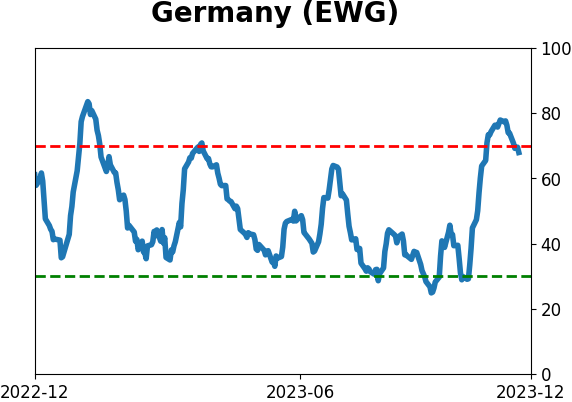
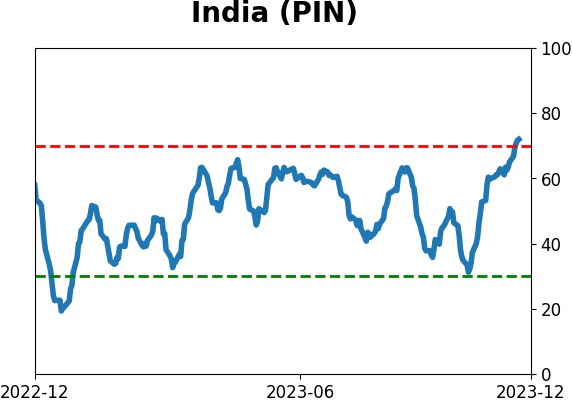
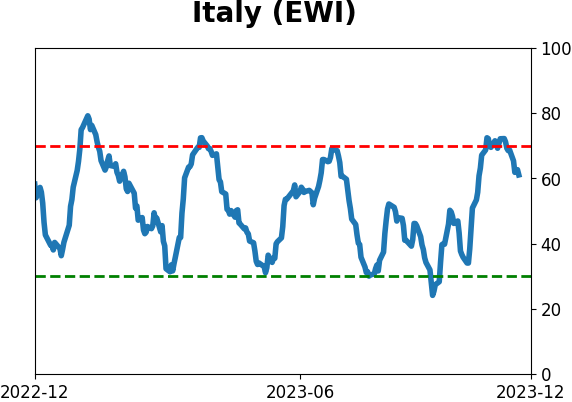
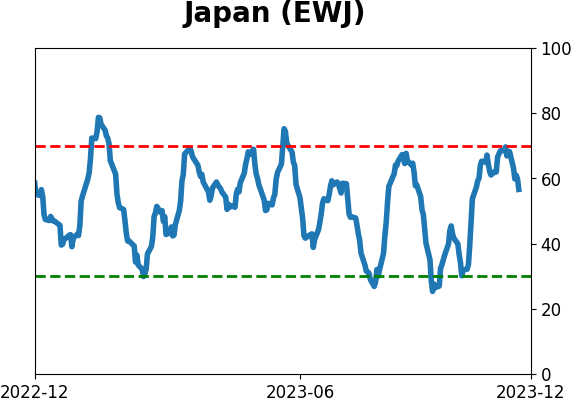
As the name implies, the All Country % Rising 200-Day indicator shows the percentage of major country equity indexes (currently numbering more than 20) with a rising 200-day moving average.
The chart below displays those dates when the 20-day moving average of the All Country % Rising 200 Day indicator crossed above 40%. This action often occurs in the relatively early stages of a bull market as the number of country equity indexes reverses higher from a low level.
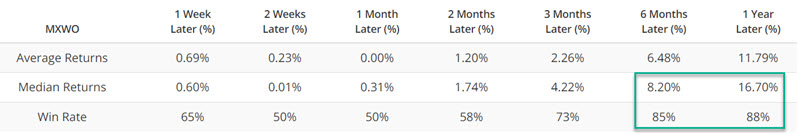
The key things to note are the exceptionally high Win Rates for six-month and twelve-month periods and the well-above-average Median Returns for twelve months.
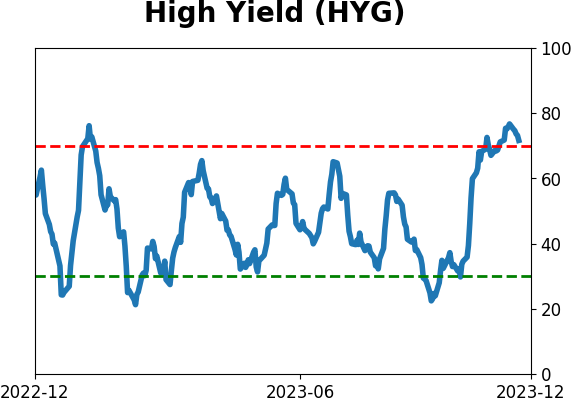
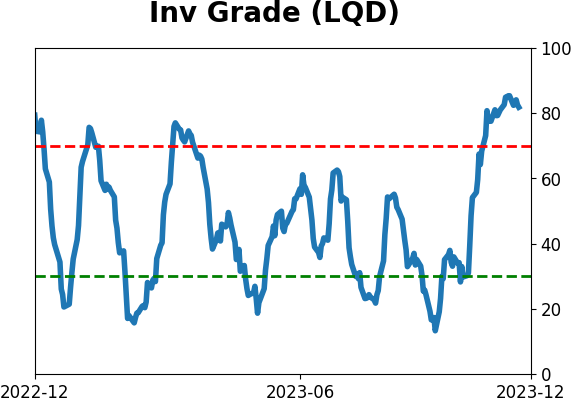
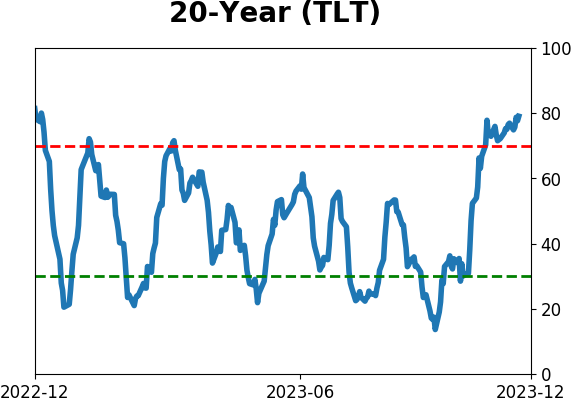
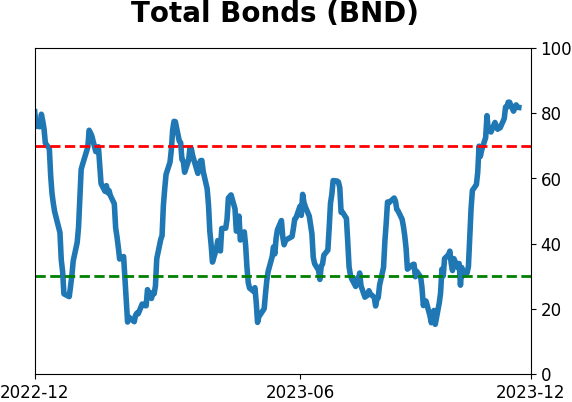
Jay also looked at buying climaxes within the Nasdaq 100 and sentiment toward bonds, both of which tended to show gains in stocks when witnessing similar readings to what they did recently.
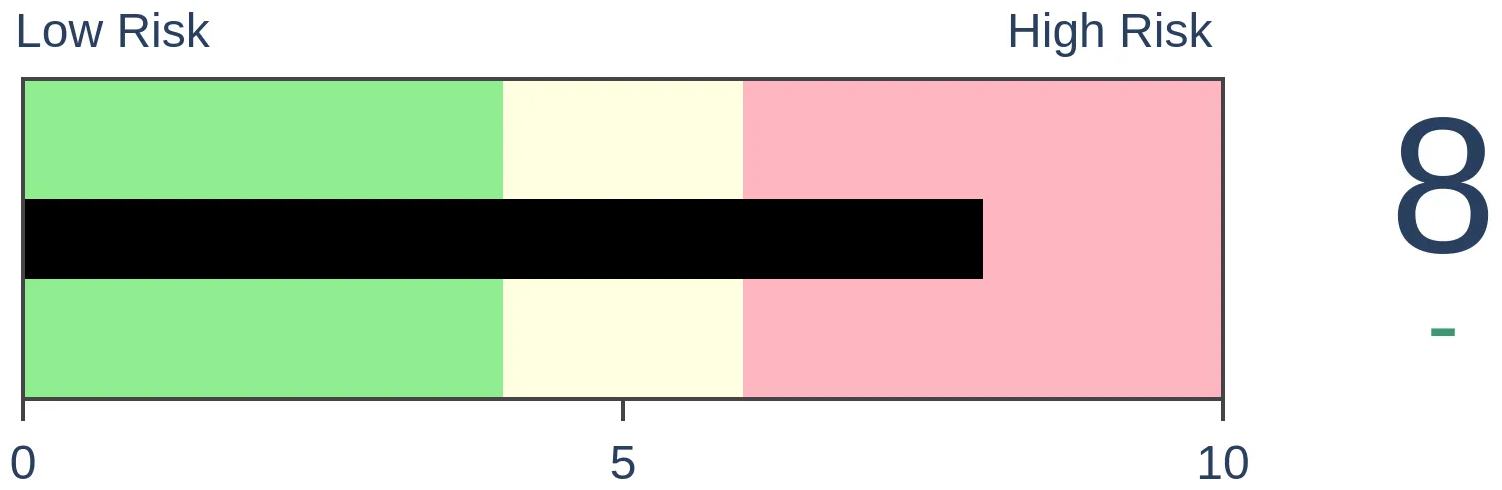
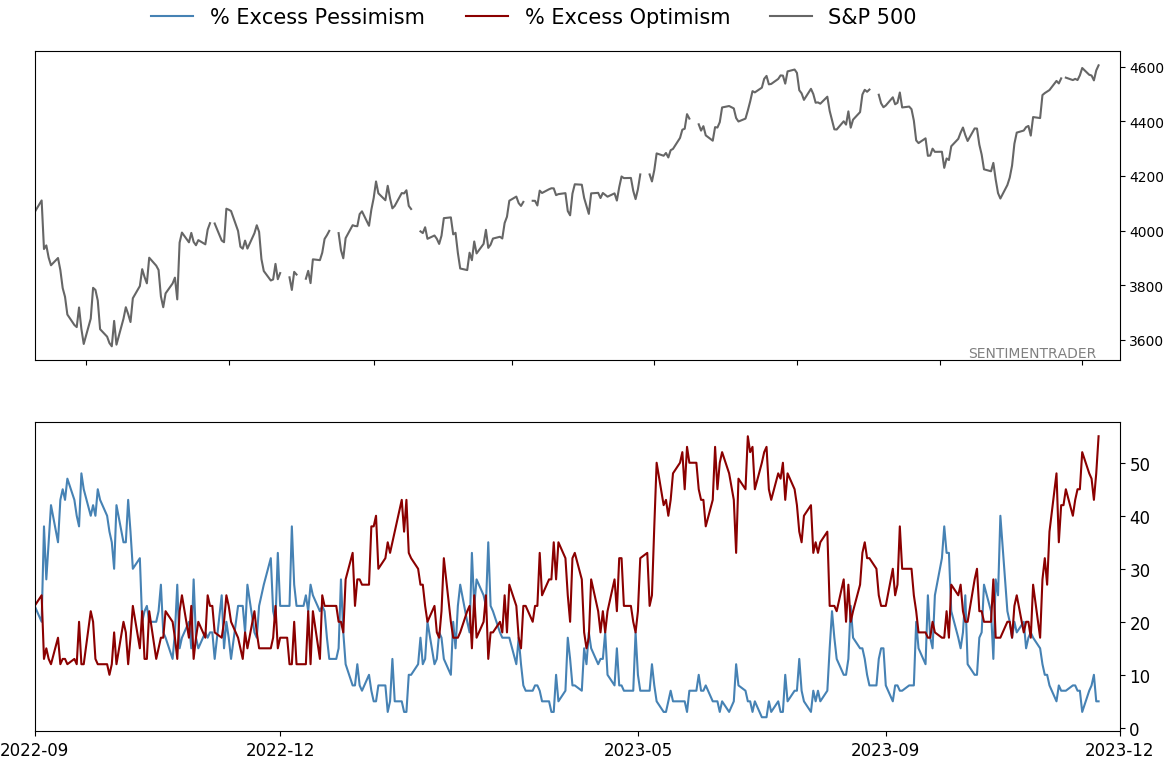
Risk has never been higher (but...)
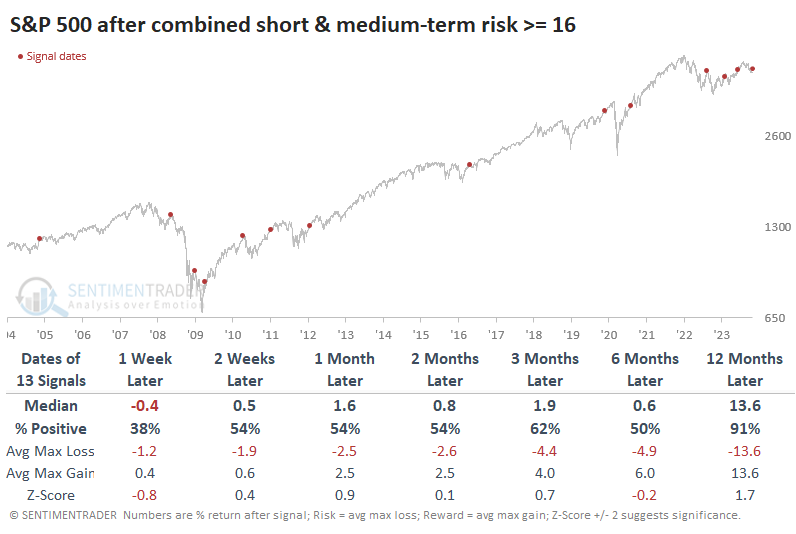
By last Friday, the sharp and persistent rally in stocks pushed our Short-term Risk Level to 9, the maximum reading for all intents and purposes.
The same thing happened to the Medium-term Risk Level. This is the first time since we began these calculations in 2004 that both reached a practical maximum value on the same day.
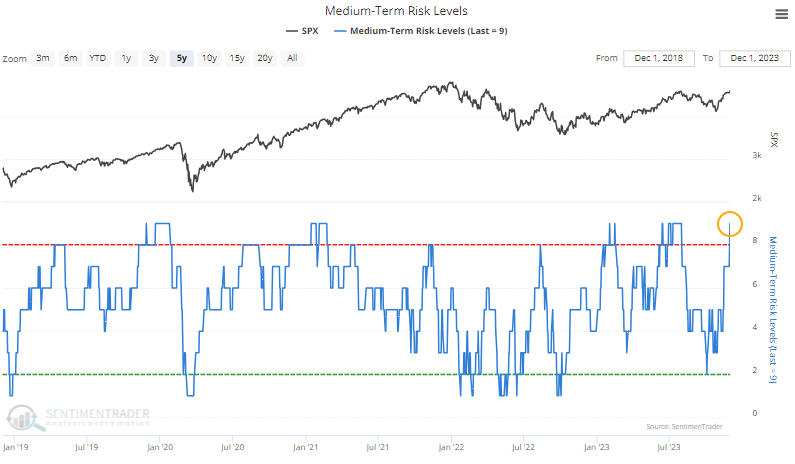
The levels are calculated using short-term and medium-term sentiment indicators and the market environment. If we see high optimism in a bear market, the Risk Level will be high; pessimism in a bull market will press the Risk Level lower. It takes truly extreme optimism in bull markets to show a high Risk Level and excessive pessimism in bear markets to show low Risk Levels.
We typically don't see extremely high optimism during ongoing bear markets. Sellers never allow buyers to get overly optimistic before overwhelming them with offers.
One thing to note is something we often point out - if investors shrugged off extreme sentiment and kept buying in the short-term, that same mentality showed a strong tendency to stick around long-term, too. Each time the S&P 500 rallied in the week after these extreme combined Risk Level readings, it showed even more gains in the months ahead. When sellers dominated, however, forward returns were a lot dicier.
Context is important. Knee-jerk contrarians like to assume that all bullishness is terrible for future returns and vice-versa, but it just doesn't work that way; high optimism can be good as long as it doesn't scare away buyers and embolden sellers.
When we see extreme readings in sentiment, like now, and buyers are still willing to step up to the plate, it tends to be a reliable sign that they will continue to do so for months. The following week or so will help us determine just how committed recent buyers are to this market.
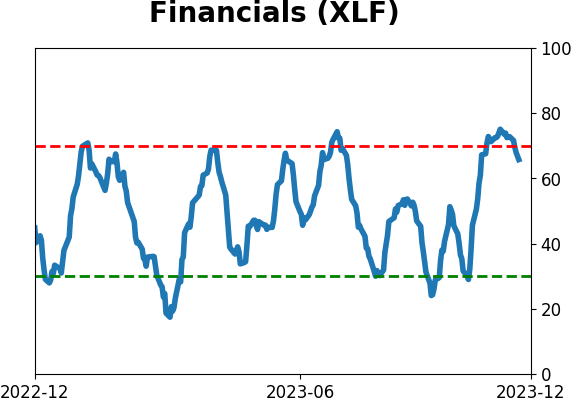
Financials finally enjoy a breadth surge
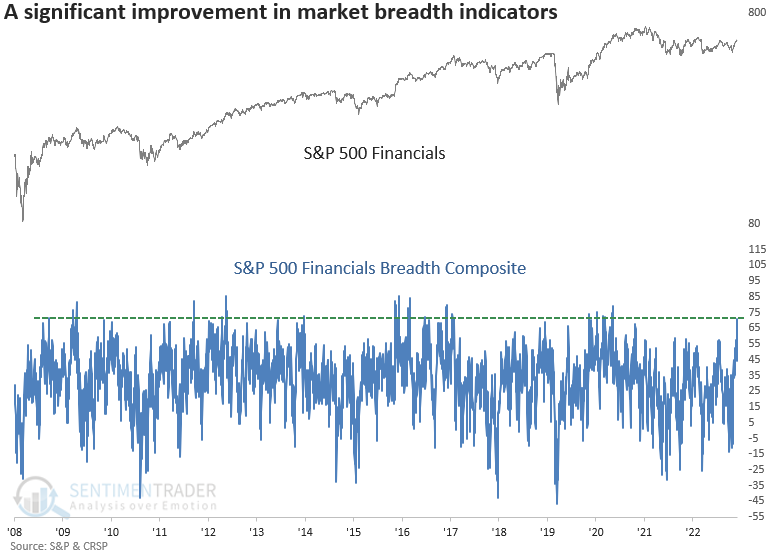
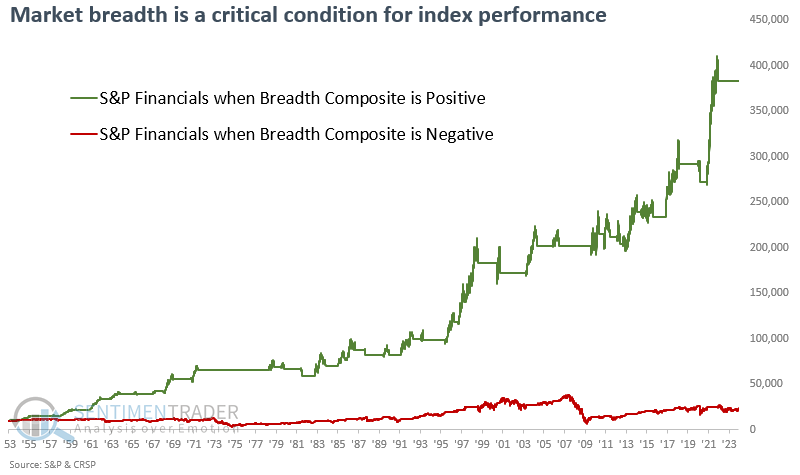
Dean highlighted a breadth composite for the S&P 500 Financials that surged to the highest level in more than two years. Similar increases in the composite generated favorable results for financials and the broad market.
Confirmation of the rally's sustainability gained further credence last week when market breadth indicators shifted upwards, indicating widespread participation.
Nowhere was that more evident than in the financial sector, where a breadth composite containing six indicators with various duration lengths exploded to the highest level in more than two years, triggering a buy signal for the group. The previous signal generated an alert in November 2020, leading to an almost 16% gain over the following three months.
Whenever the S&P 500 Financials breadth composite surges above 67%, returns, win rates, and z-scores for the financials sector are excellent across all time horizons. The signal showed a gain at some point over the subsequent three months in 38 out of 39 precedents.
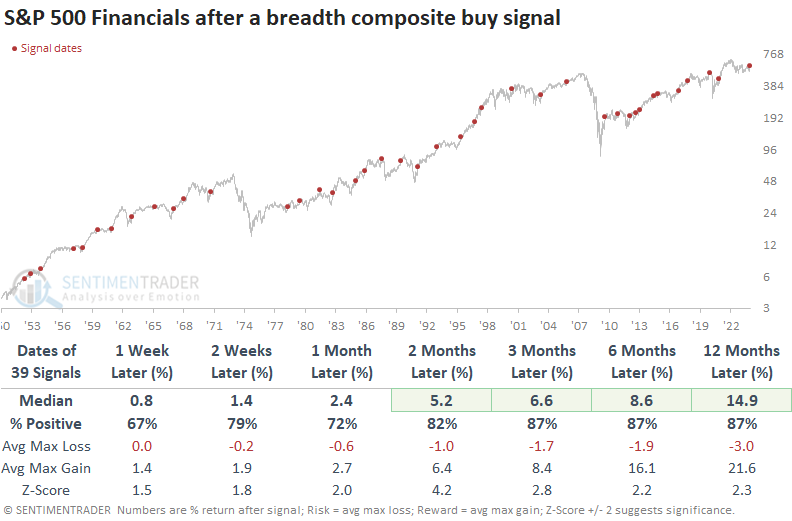
When market breadth indicators for the financials sector show a high level of participation, like now, it's typically associated with an overall bullish backdrop. Returns, win rates, and z-scores are outstanding for the S&P 500 but even so, financials consistently outperformed the S&P 500 across all time frames.
The breadth composite can be used as a standalone risk-on signal or as a trading system. The trading system generates a buy signal when the composite exceeds 67%, similar to the standalone threshold. However, the system issues a sell signal when the composite falls below 1%.
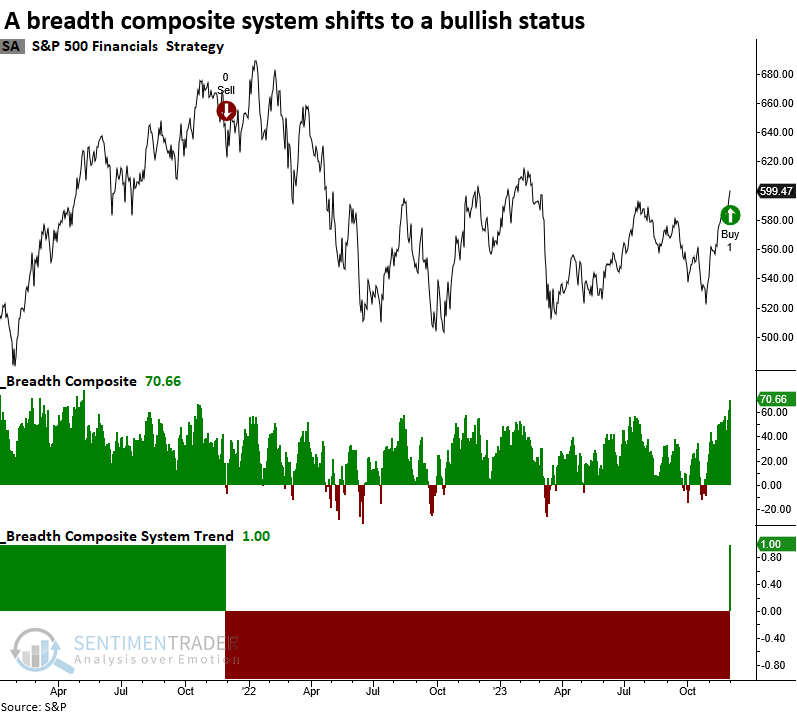
Utilizing the threshold levels for buy and sell signals, an initial $10,000 investment in the S&P 500 Financials catapults to $383,000 during positive composite periods. Conversely, during negative phases, the initial investment inches up to just $23,000.
Dean also showed that the percentage of S&P 500 Financial sector stocks registering a 21-day high exceeded 78% for only the 14th time since March 2009.
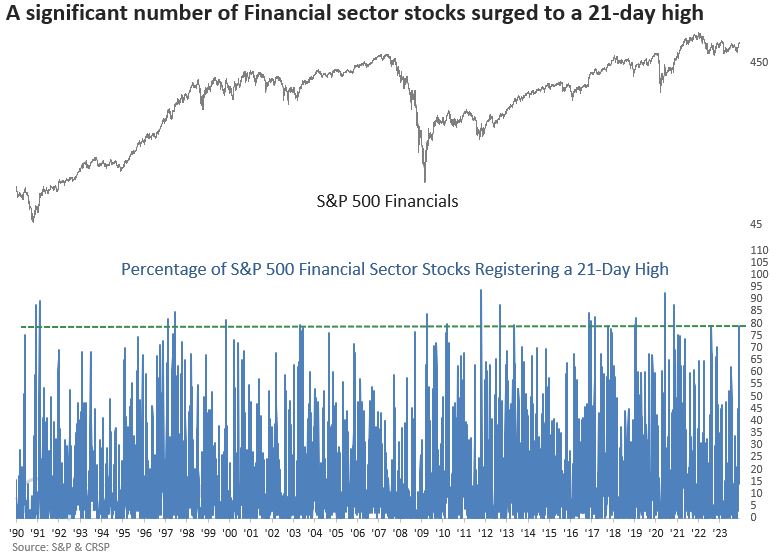
When more than 75% of S&P 500 Financial sector stocks hit a 21-day high, the group showed a reasonable consistent upward bias over time. However, since 1987, results have been less favorable.
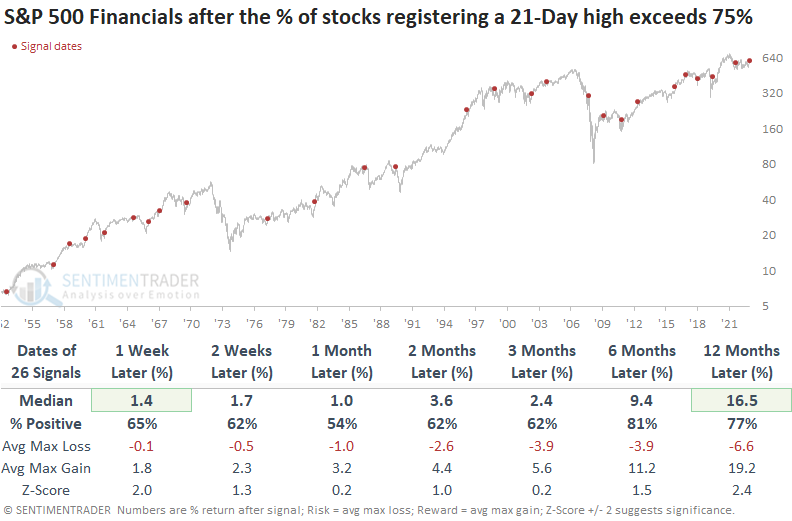
Results for the S&P 500 are solid when 21-day highs in the financial sector expand, like now, especially over the subsequent six and twelve-month horizons.
A bad time for gas
Natural gas has plunged in recent weeks, reaching a relatively oversold level. Nevertheless, Jay showed that this highly cyclical market is entering a period that often witnesses extreme weakness.
Conventional wisdom suggests a reflex rally of some sort is due. However, this market is entering a seasonally unfavorable period that extends from Trading Day of Year #236 through TDY #31 of the following year. For 2023-24, this period extends from the close on 2023-12-04 through the close on 2004-02-15.
The chart below displays the cumulative $ +(-) for holding a long position in natural gas futures only from TDY #236 through TDY #31 the following year since natural gas started trading in 1990.
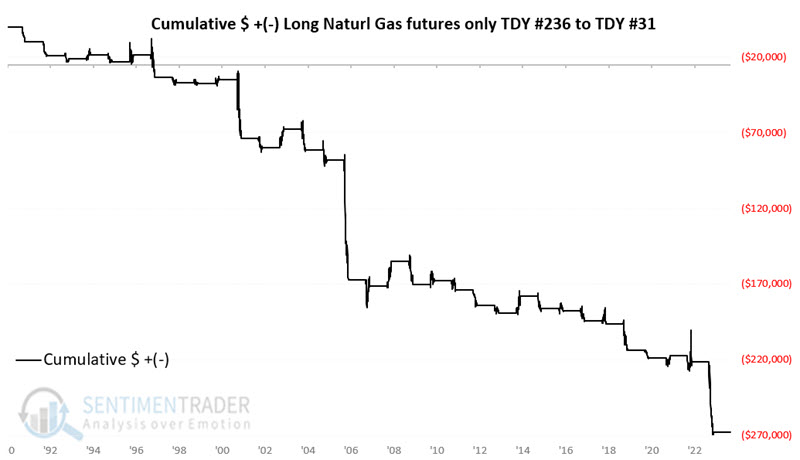
During this seasonal window, natural gas declined for 25 out of 33 years. Likewise, significant $5,000 or more moves have skewed to the negative side 17 times to only three times to the positive side.
Natural gas futures trading is only for very well-capitalized traders. On the other hand, ETFs can allow anyone to access the market. The United States Natural Gas Fund (UNG) is designed to track the price of natural gas futures. Even more so than many other commodity-related ETFs, UNG has a nasty long-term downward bias due to persistent contango in the futures market.
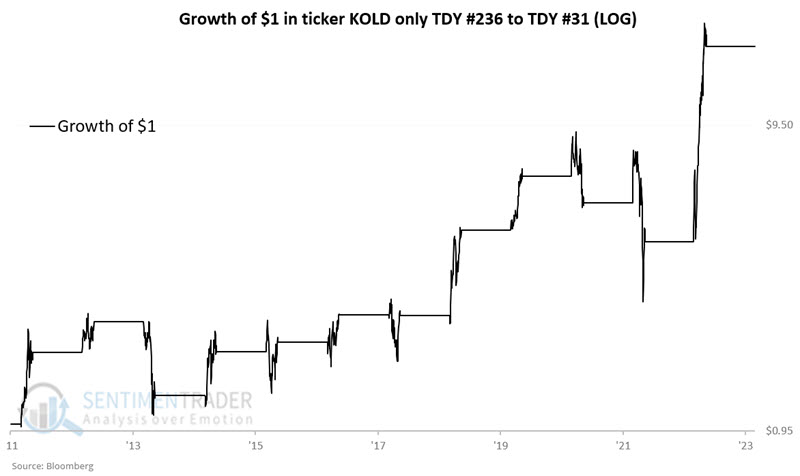
Aggressive traders who want to play the short side and are willing to accept a very high degree of risk and volatility might look at ticker KOLD. The ProShares UltraShort Bloomberg Natural Gas ETF (KOLD) is designed to track two times the inverse daily performance for natural gas futures. But make no mistake about the highly volatile and risky nature of investing in this ETF.
For better or worse, the chart and table below display the results for holding a long position in ticker KOLD only from TDY #236 through TDY #31 the following year since trading inception in 2011. Over eleven years, the cumulative gain is +1,619%, albeit with several harrowing drawdowns interspersed.
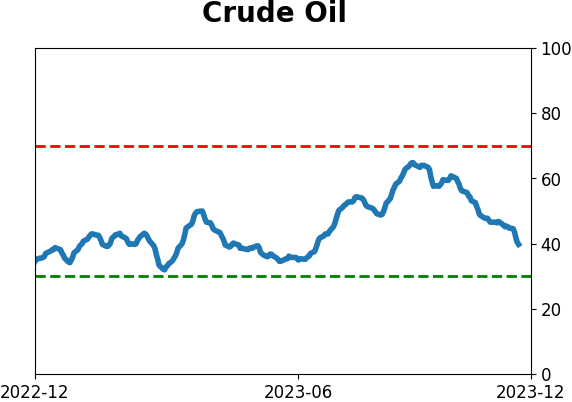
It may be a bad time for commodities in general
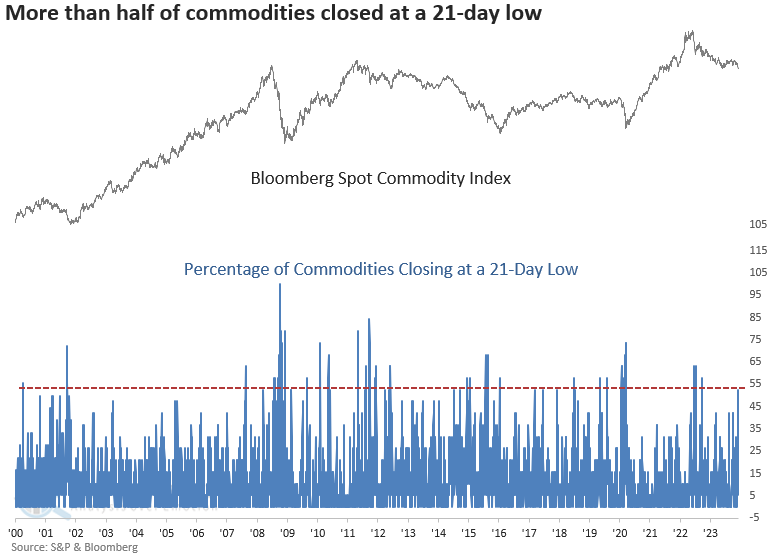
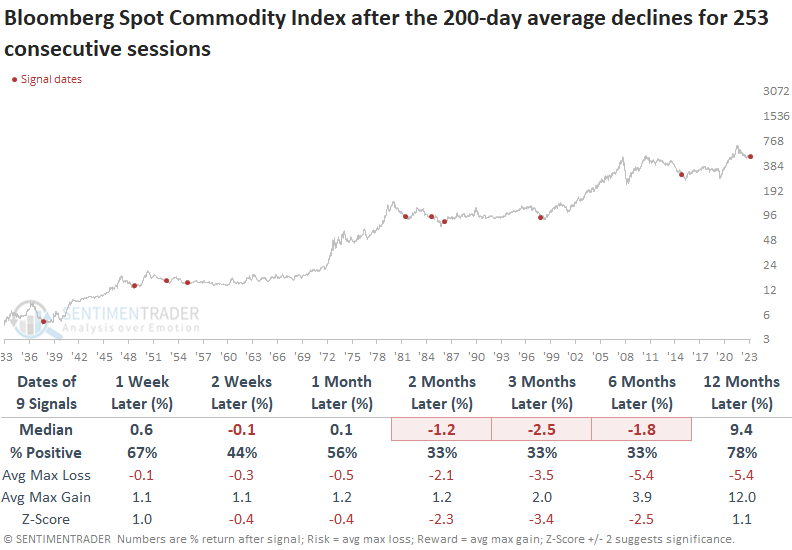
Dean showed that the percentage of commodities closing at a 21-day low spiked above 50%, and similar expansions in new lows led to an unfavorable outlook for the Bloomberg Spot Commodity Index.
Over the past few months, the Bloomberg Spot Commodity Index bounced around in a range until Wednesday, when it broke lower and closed at a new 1-year low. In doing so, the percentage of commodities registering a 21-day low soared above 50%.
When the Bloomberg Spot Commodity Index resides below its 200-day average, like now, and the percentage of commodities closing at a 21-day low spikes above 50%, the outlook for the commodity index suggests the long-term downtrend will persist.
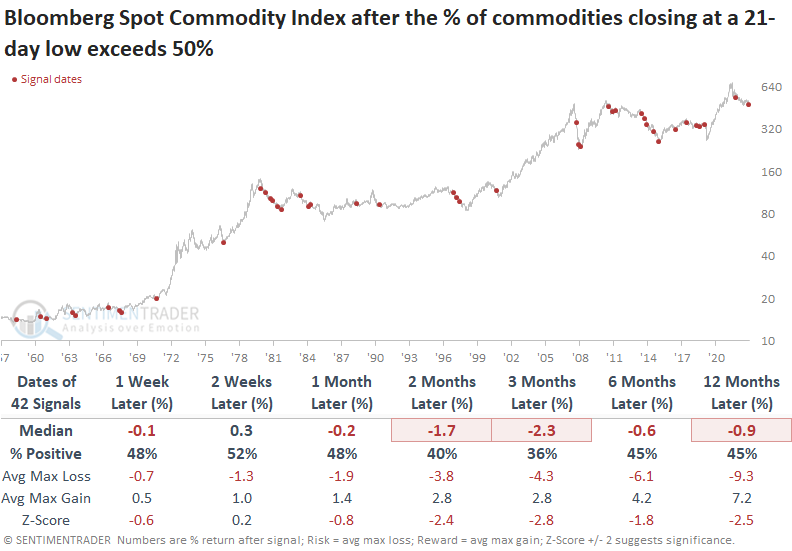
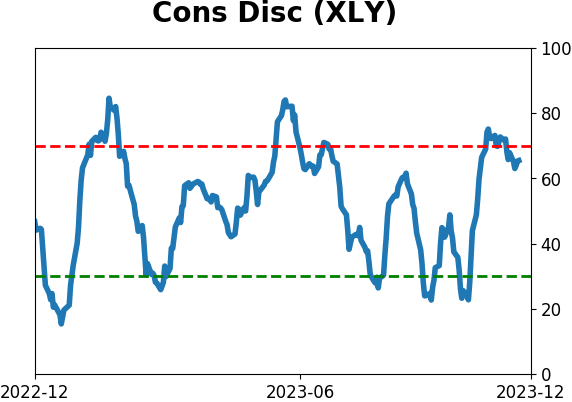
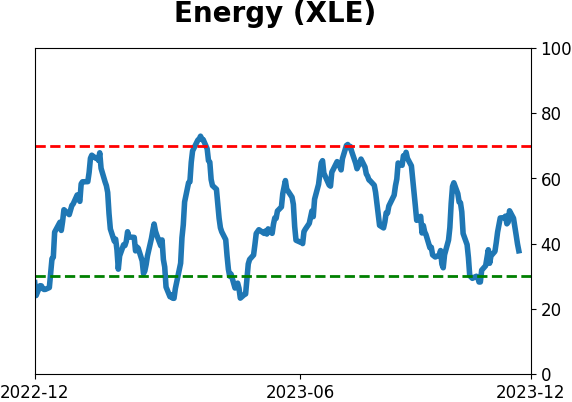
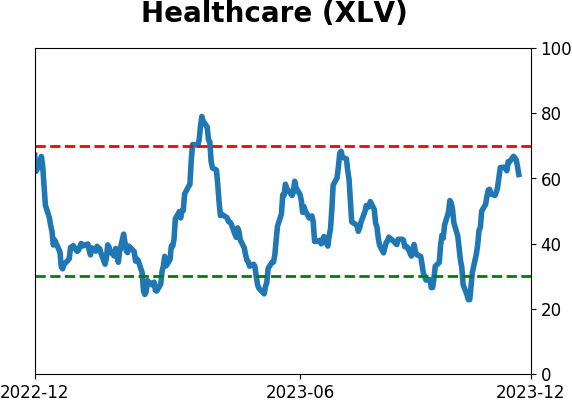
Commodity-based sectors such as Energy and Materials struggled across all time frames when most commodities registered new lows in a downtrend. Conversely, growth-oriented groups like Consumer Discretionary and Technology thrived over the subsequent year.
Thanks to this continued pressure, the 200-day moving average for the Bloomberg Spot Commodity Index has declined for a year, registering the 10th most prolonged count in history.
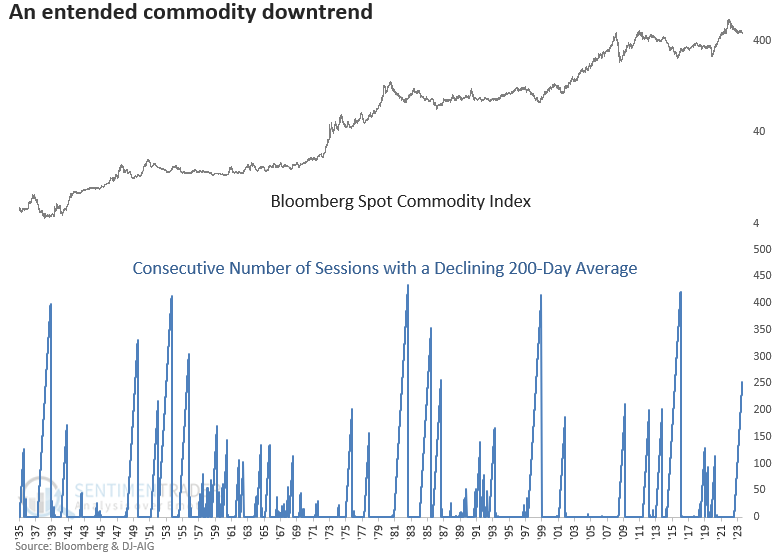
Even though it has been in a downtrend for an extended period, there remains a distinct risk of experiencing additional downside price action over the next six months.
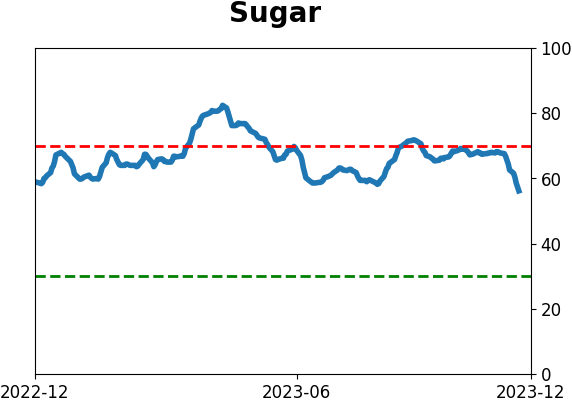
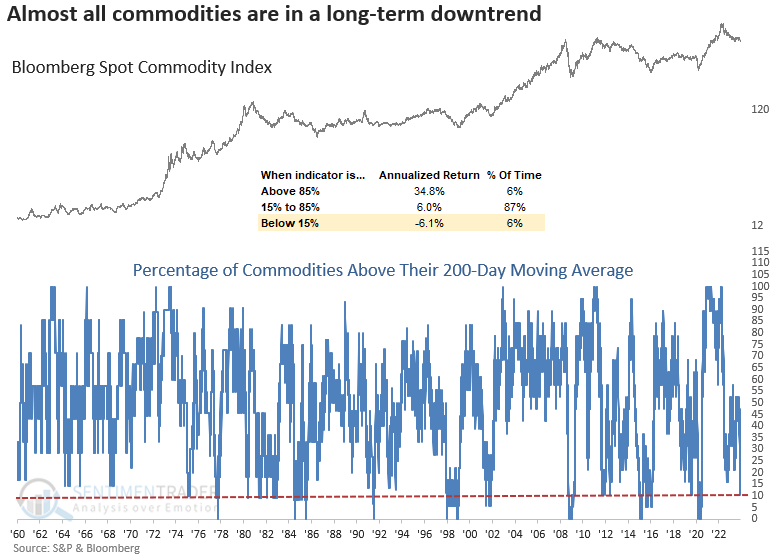
Drilling down to individual contracts, the percentage of commodities trading above their 200-day moving average declined to 10%, reaching the lowest level since the Covid crash. Comparable levels were associated with negative annualized returns for the Bloomberg Spot Commodity Index.
One of the more pronounced declines for all the commodities included in our breadth series occurred in sugar. It fell 16% in ten sessions, a swoon not seen since the Covid drawdown. Whenever sugar prices dropped by 15% or more in ten sessions, and within a month of hitting a 1-year high, the negative price momentum tended to beget more negative momentum over the subsequent three months.
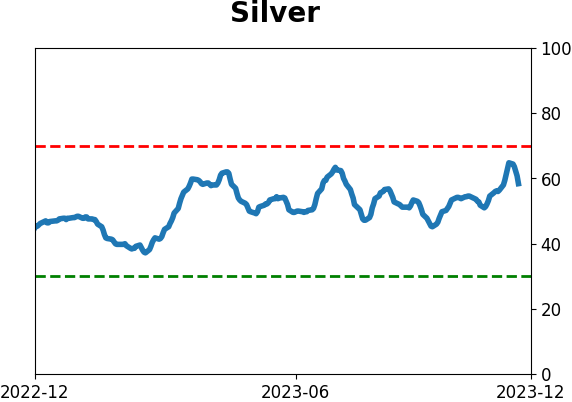
Keeping an eye on silver cycles
Silver has essentially been locked in a large trading range for roughly the last decade. Jay noted that several long-term cycles suggest that traders keep an eye on silver in hopes of a meaningful run to the upside in the years ahead.
The model that Jay constructed combines three distinct - but often overlapping - seasonal windows:
- Six favorable months of the year for silver
- The 8-year cycle for silver
- The 30-year cycle for commodities
We will look at price data for silver futures starting in 1950 for testing purposes. Each full point of price movement (1.00) for silver is worth $5,000 in futures contract value. Note that before the 1970s, the price of silver was heavily manipulated by the government (which was still using silver to make coins and thus wanted to keep costs low).
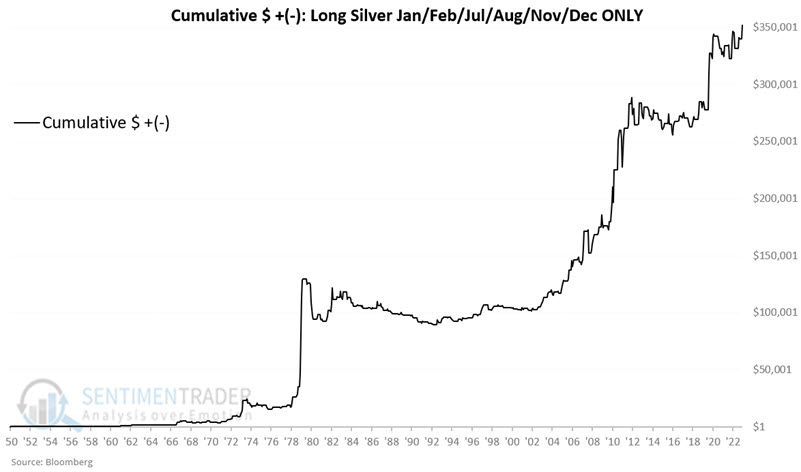
1. Six favorable months of the year for silver
The following six months of the year are deemed "favorable": January, February, July, August, November and December. The chart below displays the hypothetical cumulative $+(-) from holding a long position in silver only during the favorable months listed above. The cumulative hypothetical gain was $352,052. During the other six months, the cumulative hypothetical loss was -$229,692.
2. The 8-year cycle for silver
We will start the eight-year cycle after the close on 1952-12-31. The first four years of each cycle are considered "favorable" for silver, and the second four years are considered "unfavorable."
Let's look at the unfavorable four-year periods since we're still in that window for a year. The table below reflects the dollar value change from holding a hypothetical long position in silver futures.
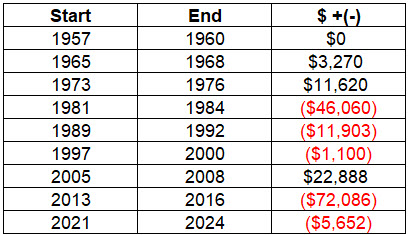
A four-calendar year cycle is not a "precision timing tool." That said, this cycle has done an excellent job of pointing silver traders in the proper direction. The current cycle will end on 2024-12-31, at which point a new favorable four-year period will begin and last through the end of 2028.
3. The 30-year cycle for commodities
The following 15-year periods are deemed "favorable" for commodities:
- 1933-06-30 to 1948-06-30
- 1963-06-30 to 1978-06-30
- 1993-06-30 to 2008-06-30
- 2023-06-30 to 2038-06-30
The chart below displays the hypothetical cumulative $+(-) from holding a long position in silver only during the favorable 15-year periods listed above, starting in 1953.
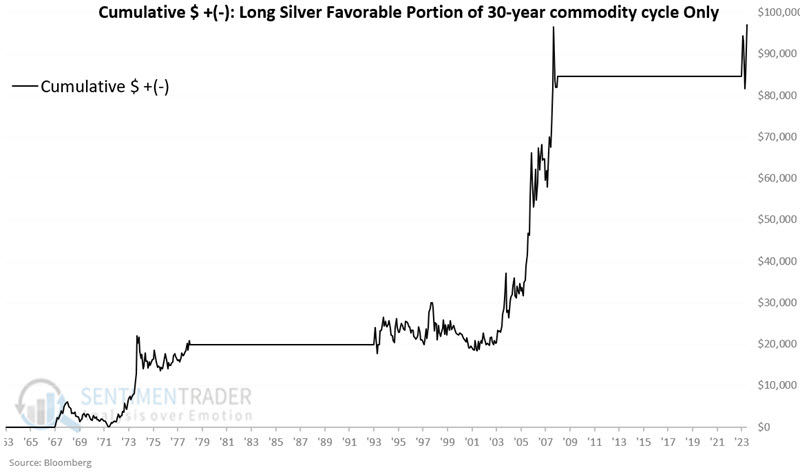
Next week, Jay will combine the three cycles in one model labeled the JK Seasonal Silver Model.
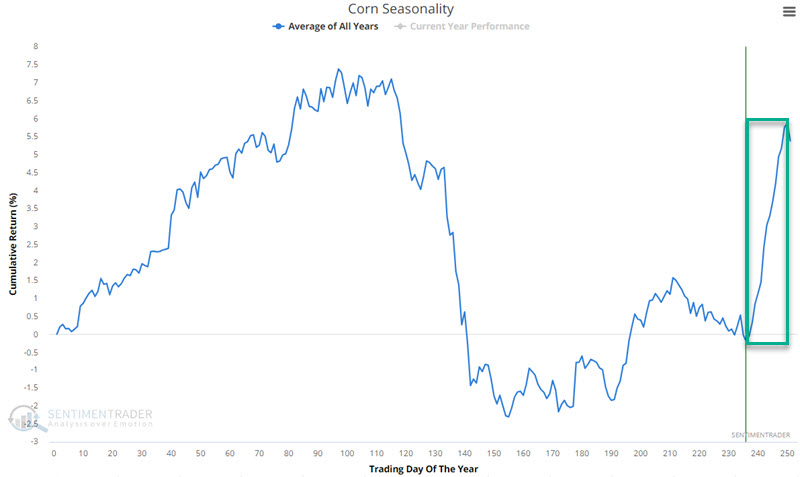
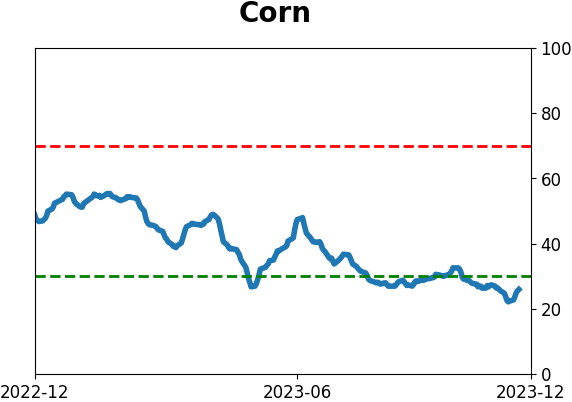
A clear window for corn
A short timeframe during December has tended to see higher prices for corn futures. Jay showed that this period has seen corn gain in price 89% of the time since 1961.
In this piece, we want to focus on the shorter-term window - Trading Day of the Year (TDY) #236 through TDY #250 - highlighted below. For 2023, this period runs from the close on December 8 through the close on December 29.
The chart below displays the cumulative dollar return achieved by holding a long 1-lot position in corn futures only during this period every year starting in 1960.
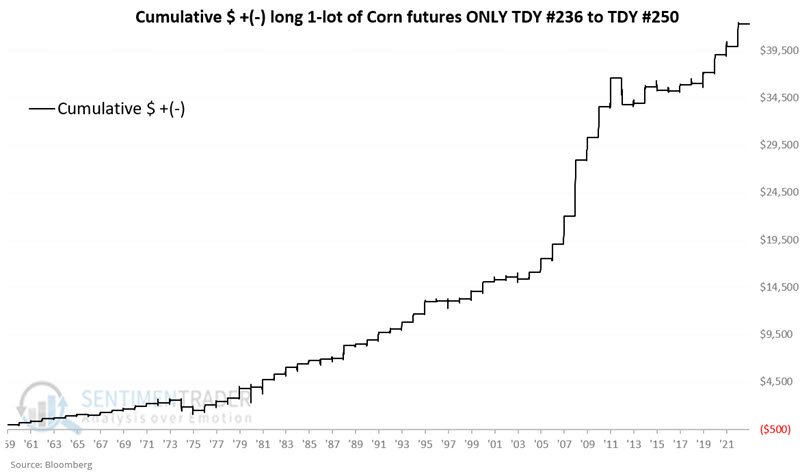
Over the past 63 years, corn futures gained 56 times during this roughly 3-week period. The lopsided nature of gains versus losses over $1,000 (14-to-1) suggests a true edge. However, the sheer size of 2012's loss of -$2,813 reminds us of the need for risk management in every trade, regardless of any perceived edge. For the record, the 2nd largest loss during this window was -$700 in 1974.
The Teucrium Corn Fund ETF (ticker CORN) may be an alternative for non-futures traders to play the corn market. Ticker CORN can be traded like shares of stock and is designed to expose traders to fluctuations in the price of corn.
About TradingEdge Weekly...
The goal of TradingEdge Weekly is to summarize some of the research published to SentimenTrader over the past week. Sometimes there is a lot to digest, and this summary highlights the highest conviction or most compelling ideas we discussed. This is NOT the published research; rather, it pulls out some of the most relevant parts. It includes links to the published research for convenience, and if you don't subscribe to those products, it will present the options for access.
Indicators at Extremes
|
|
|
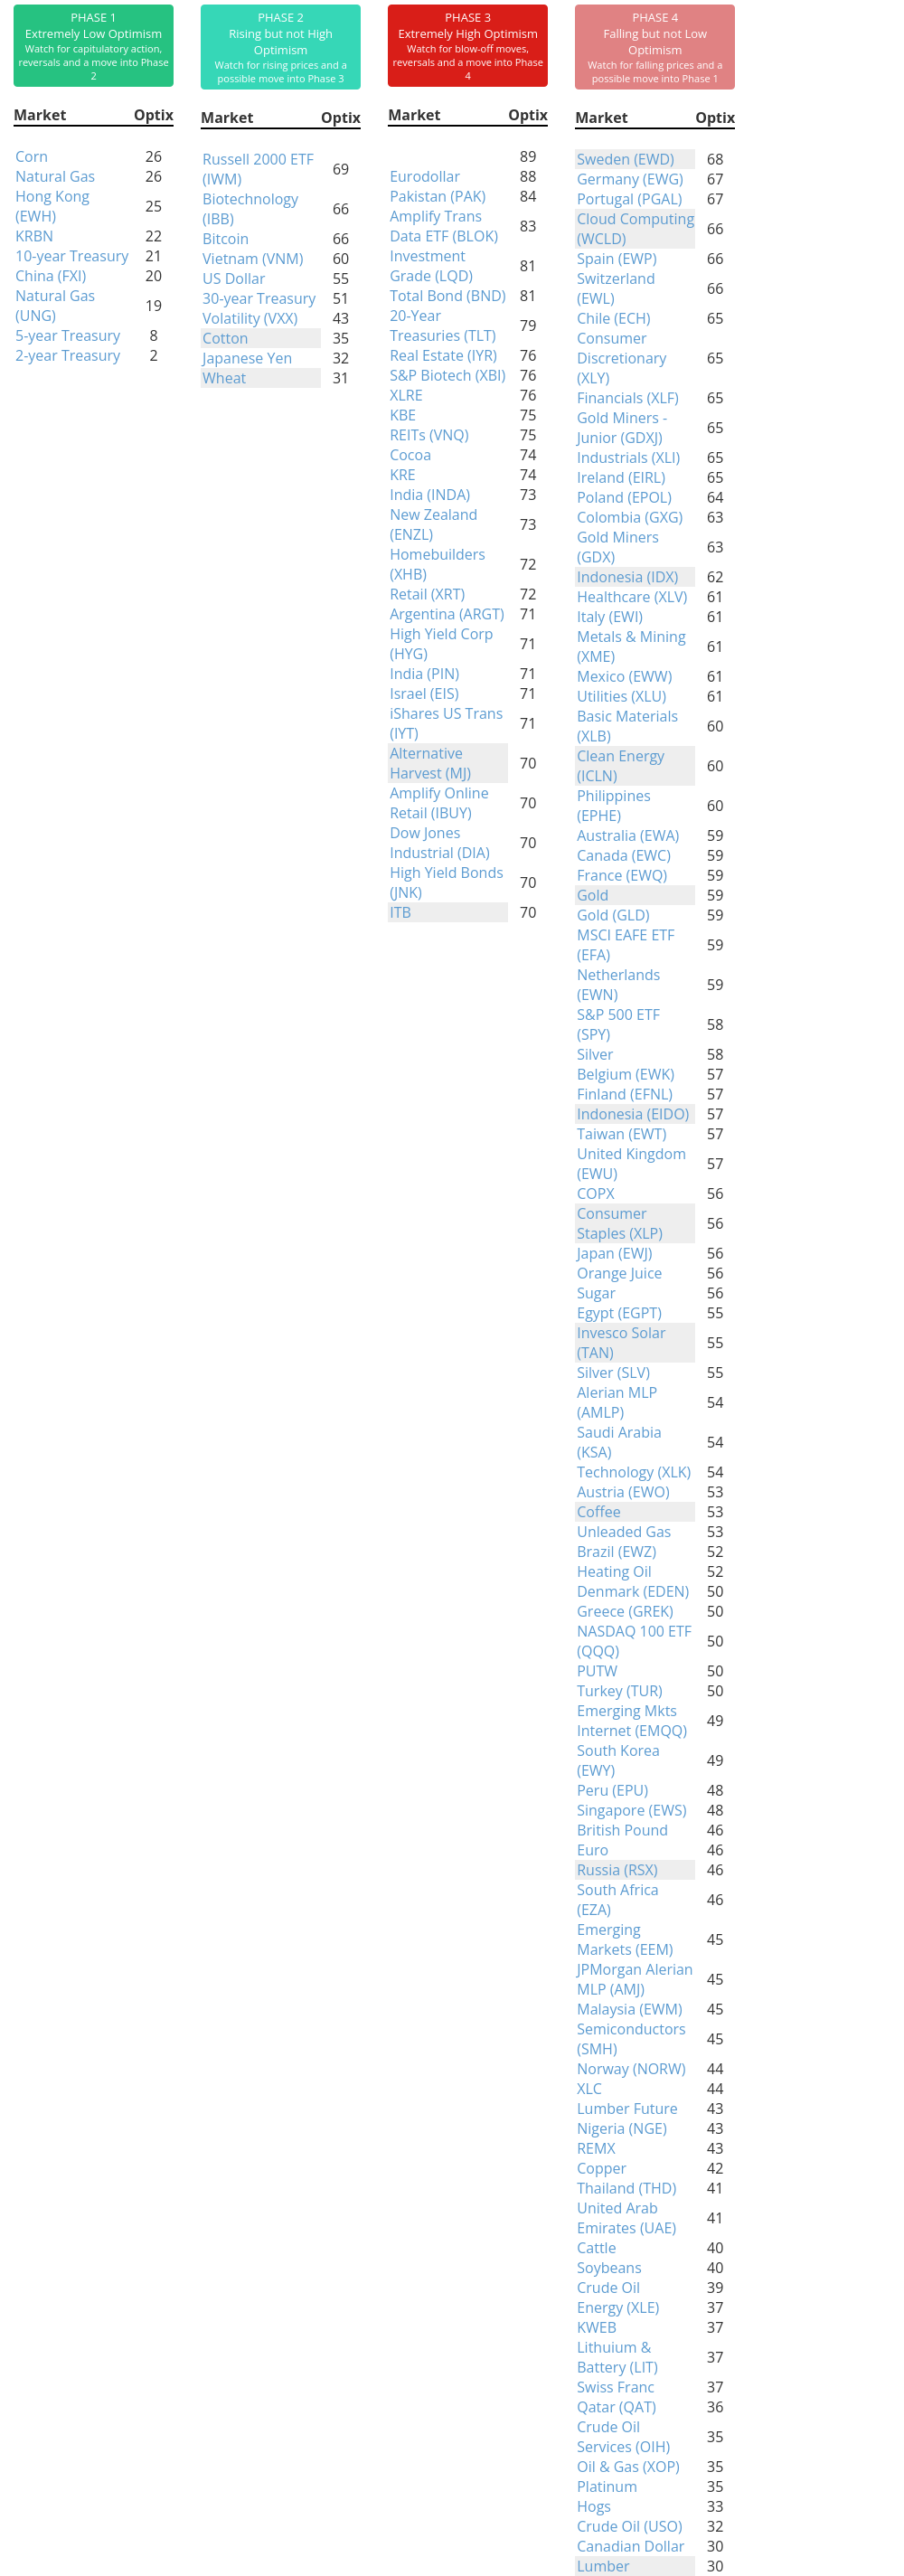
Phase Table
|
|
|
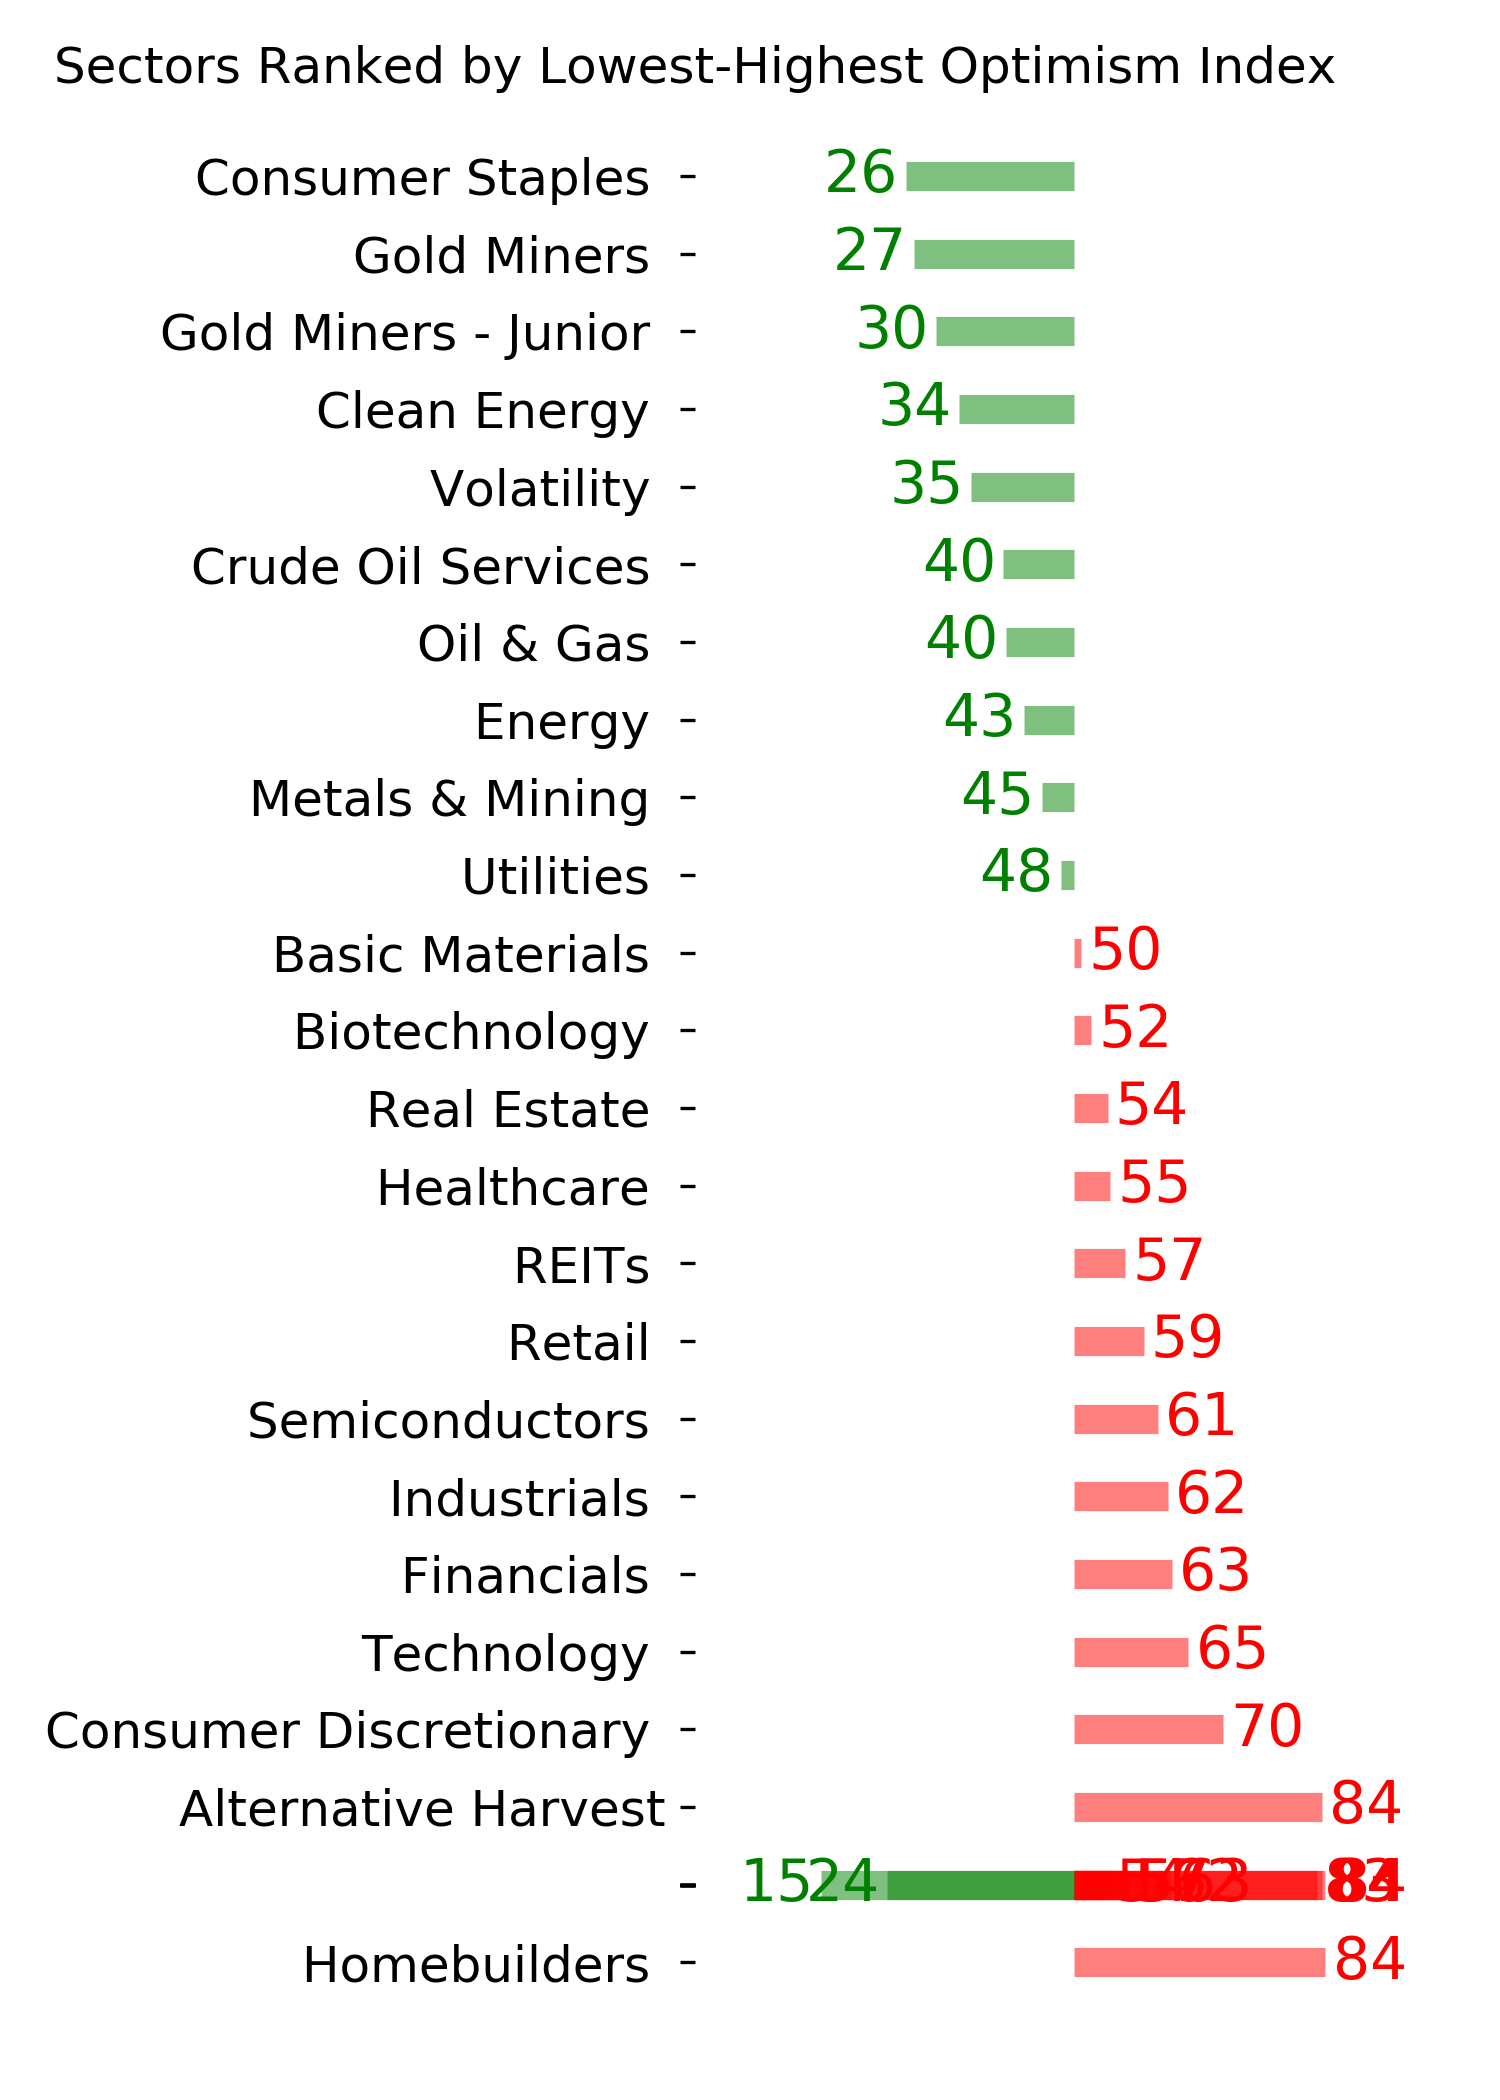
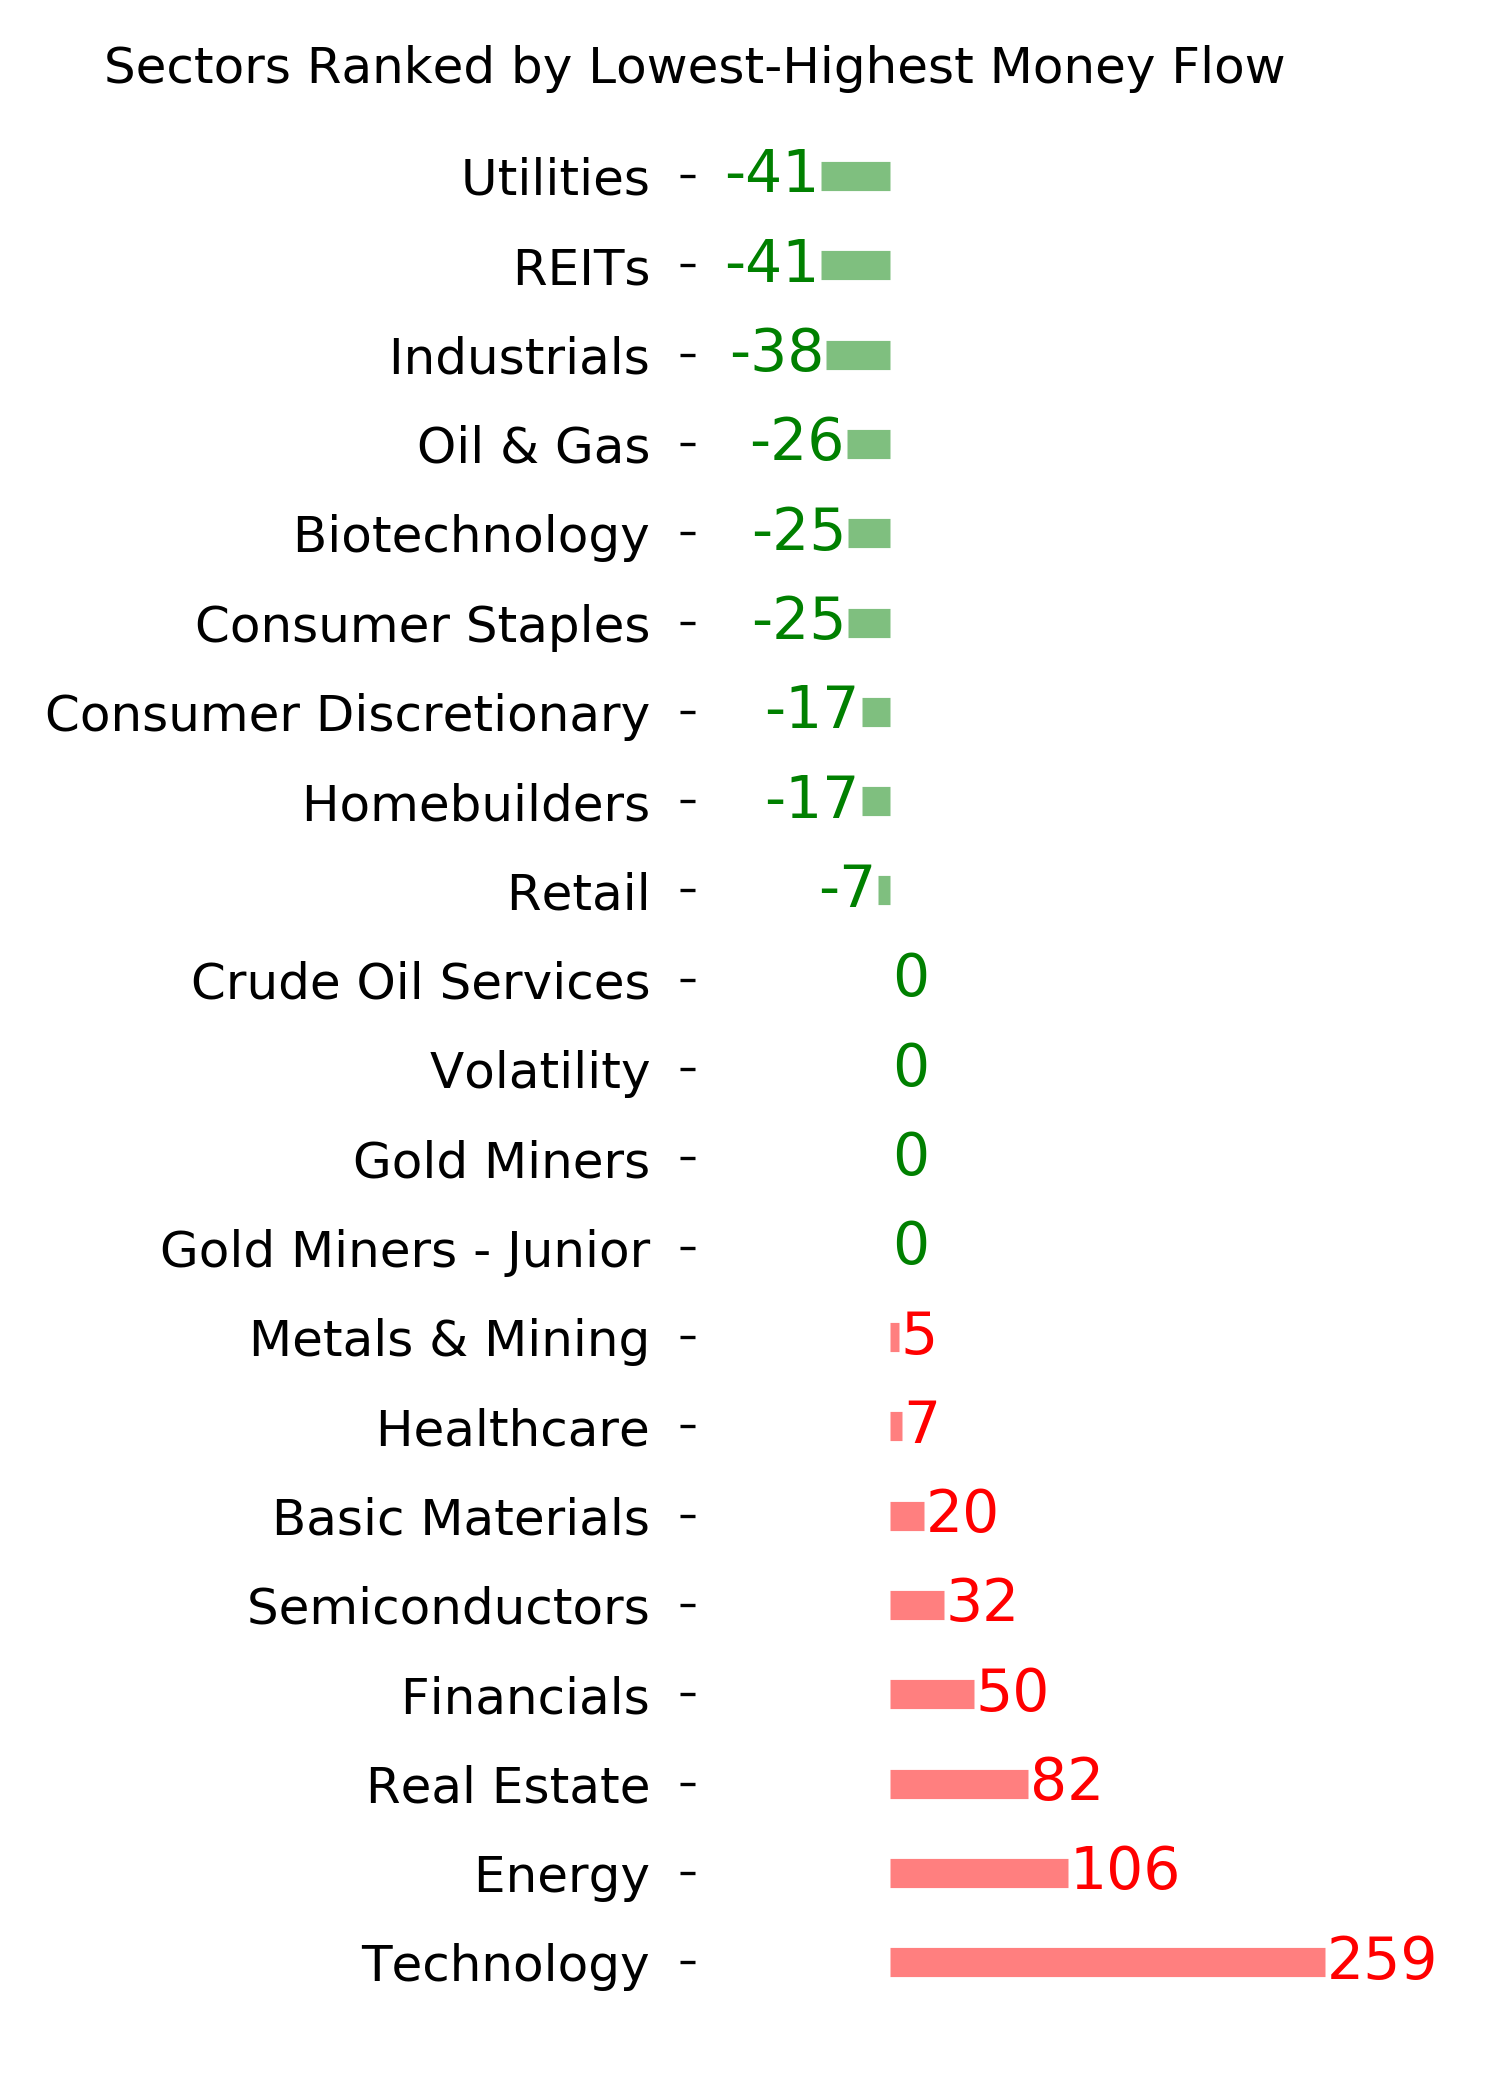
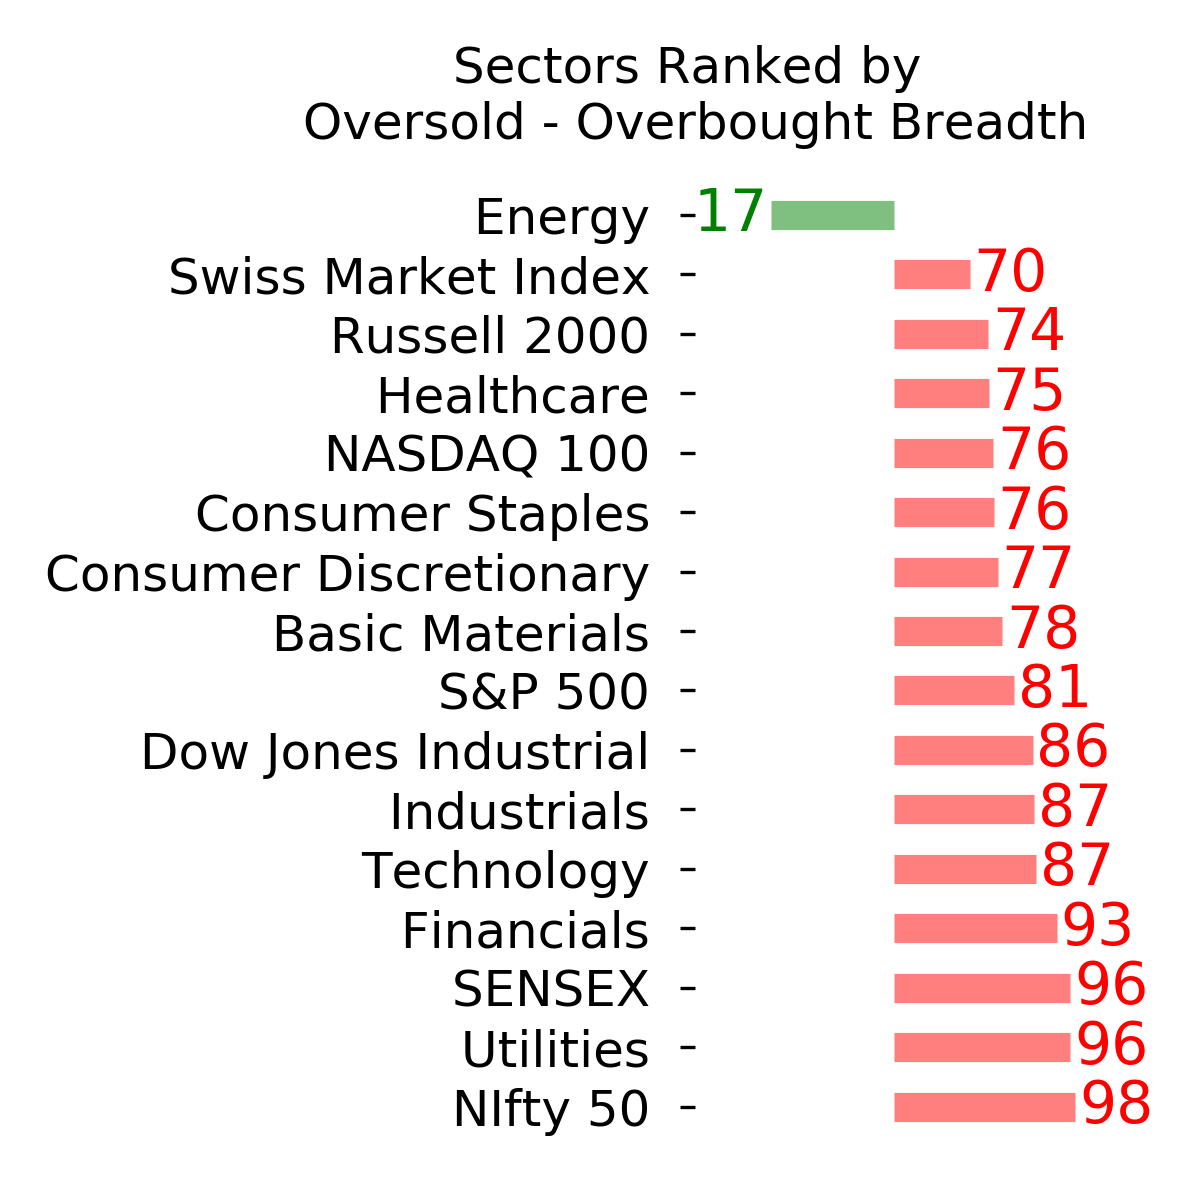
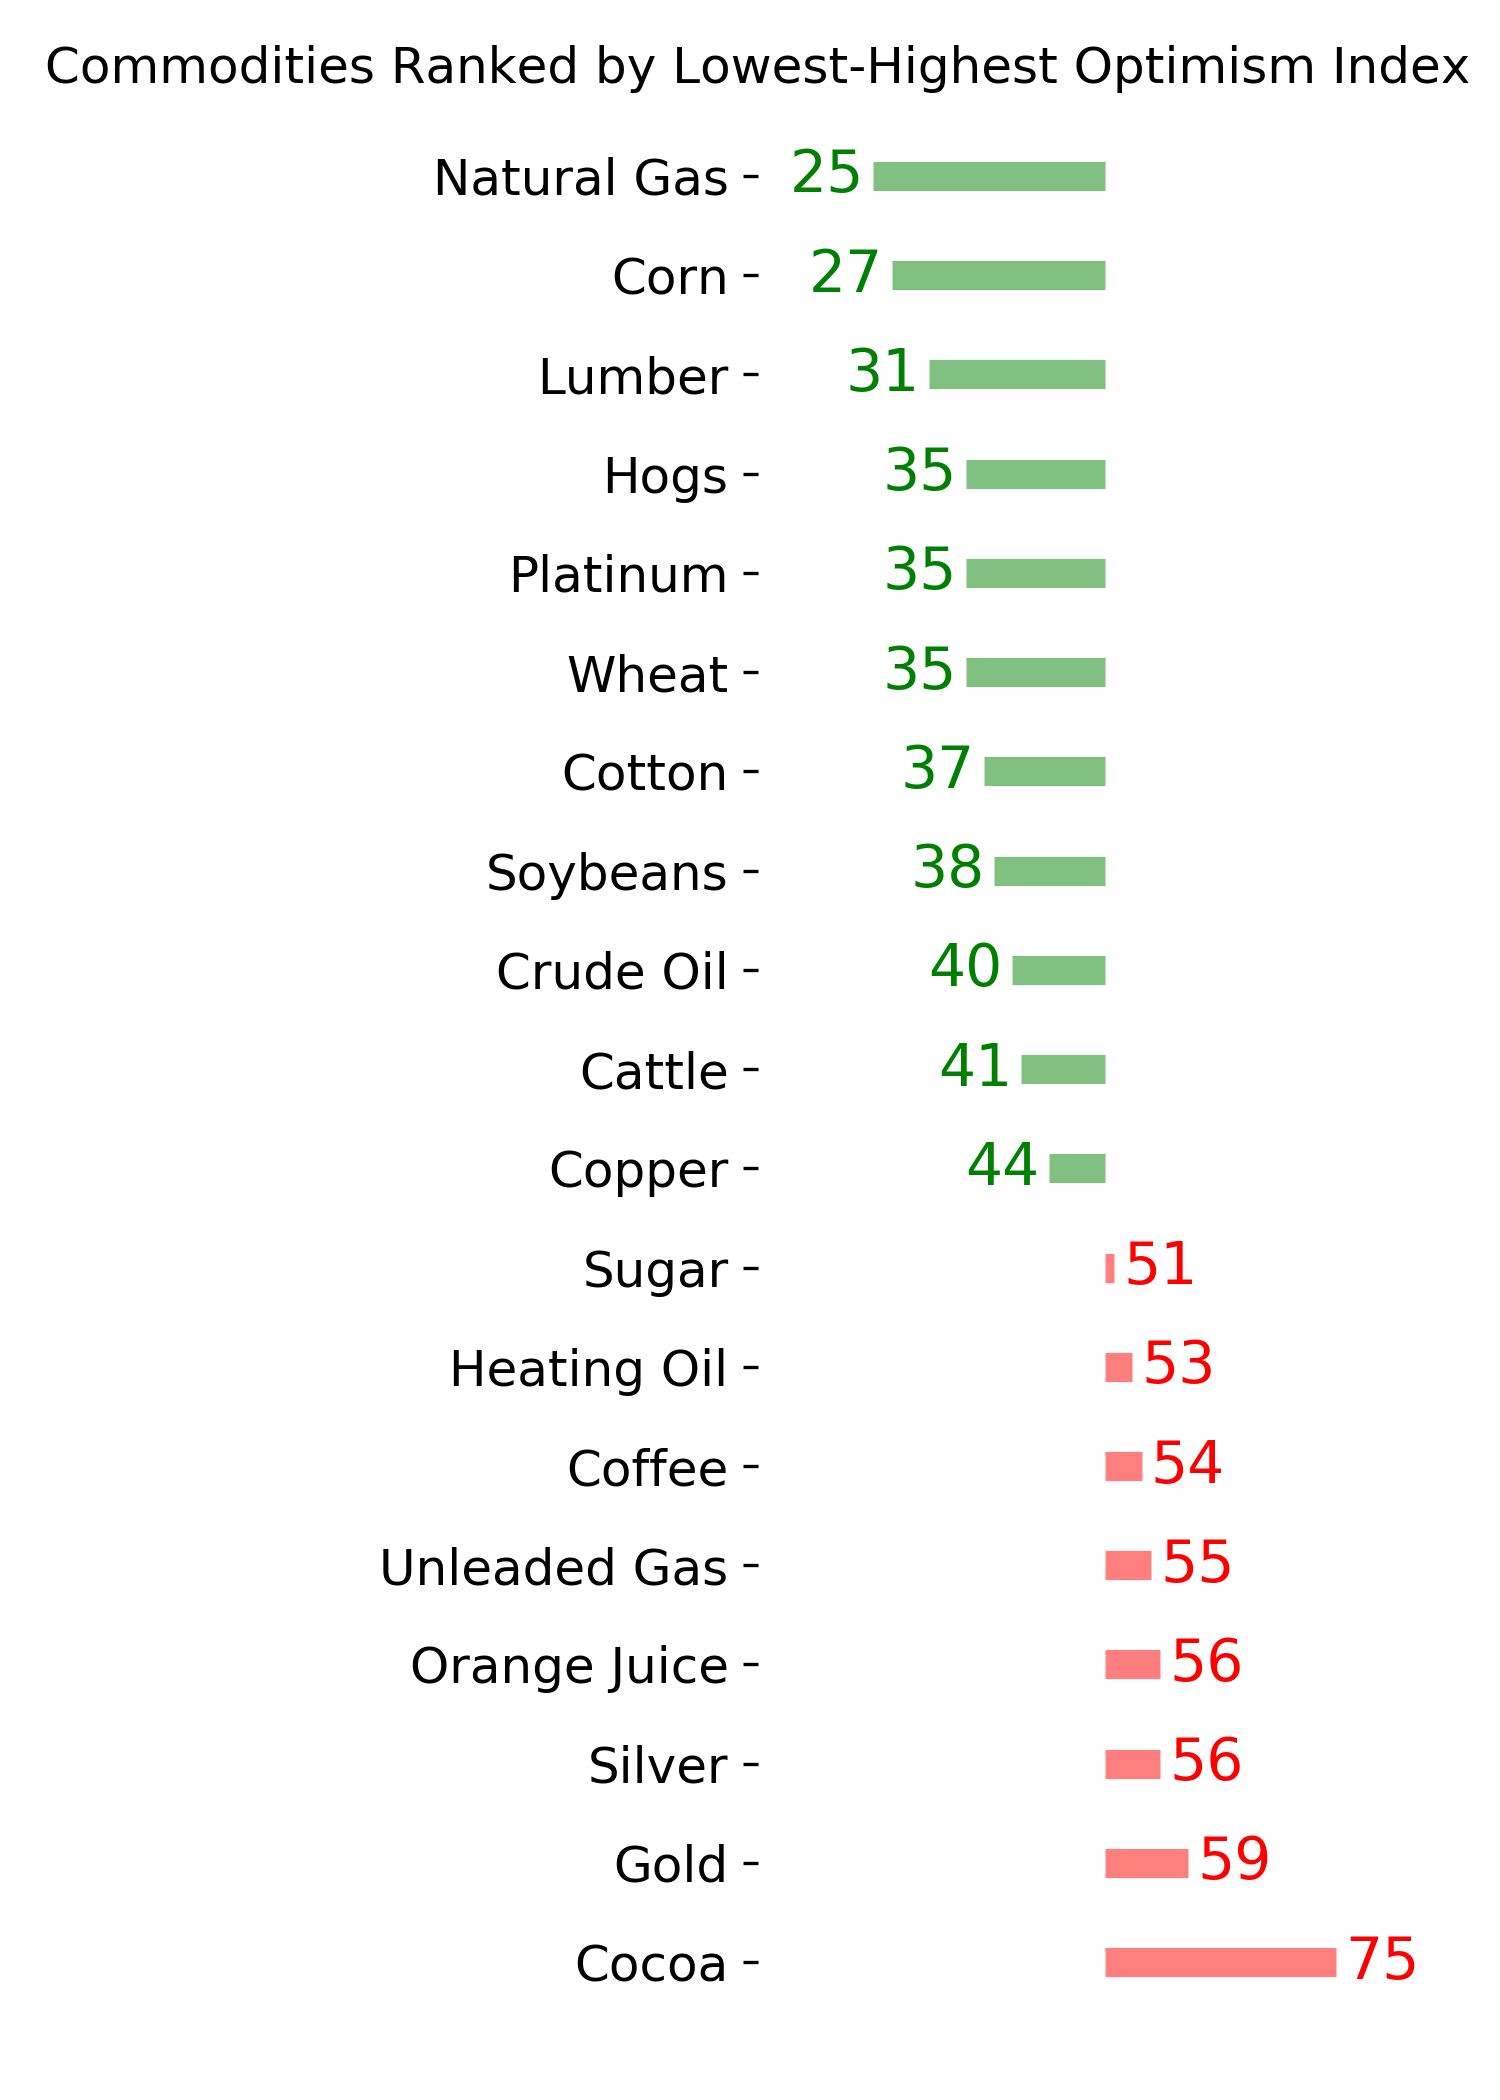
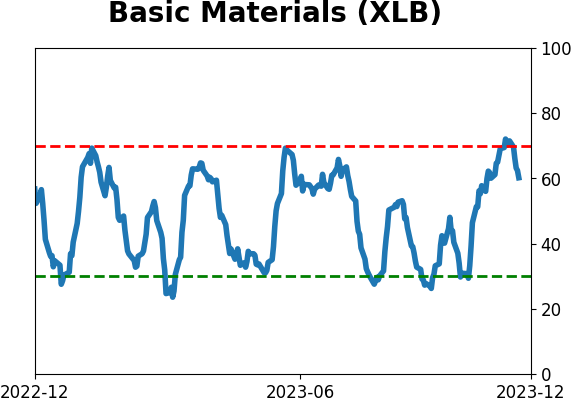
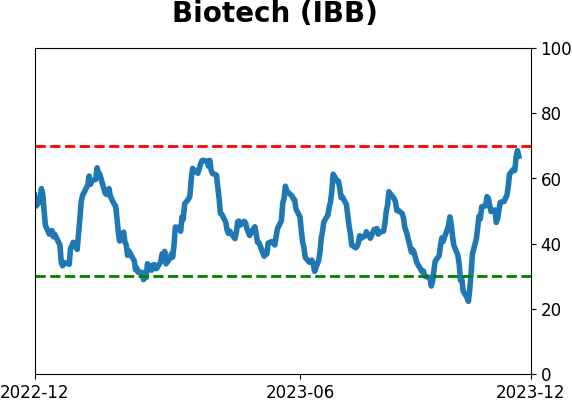
Ranks
|
|
|
|
|
|
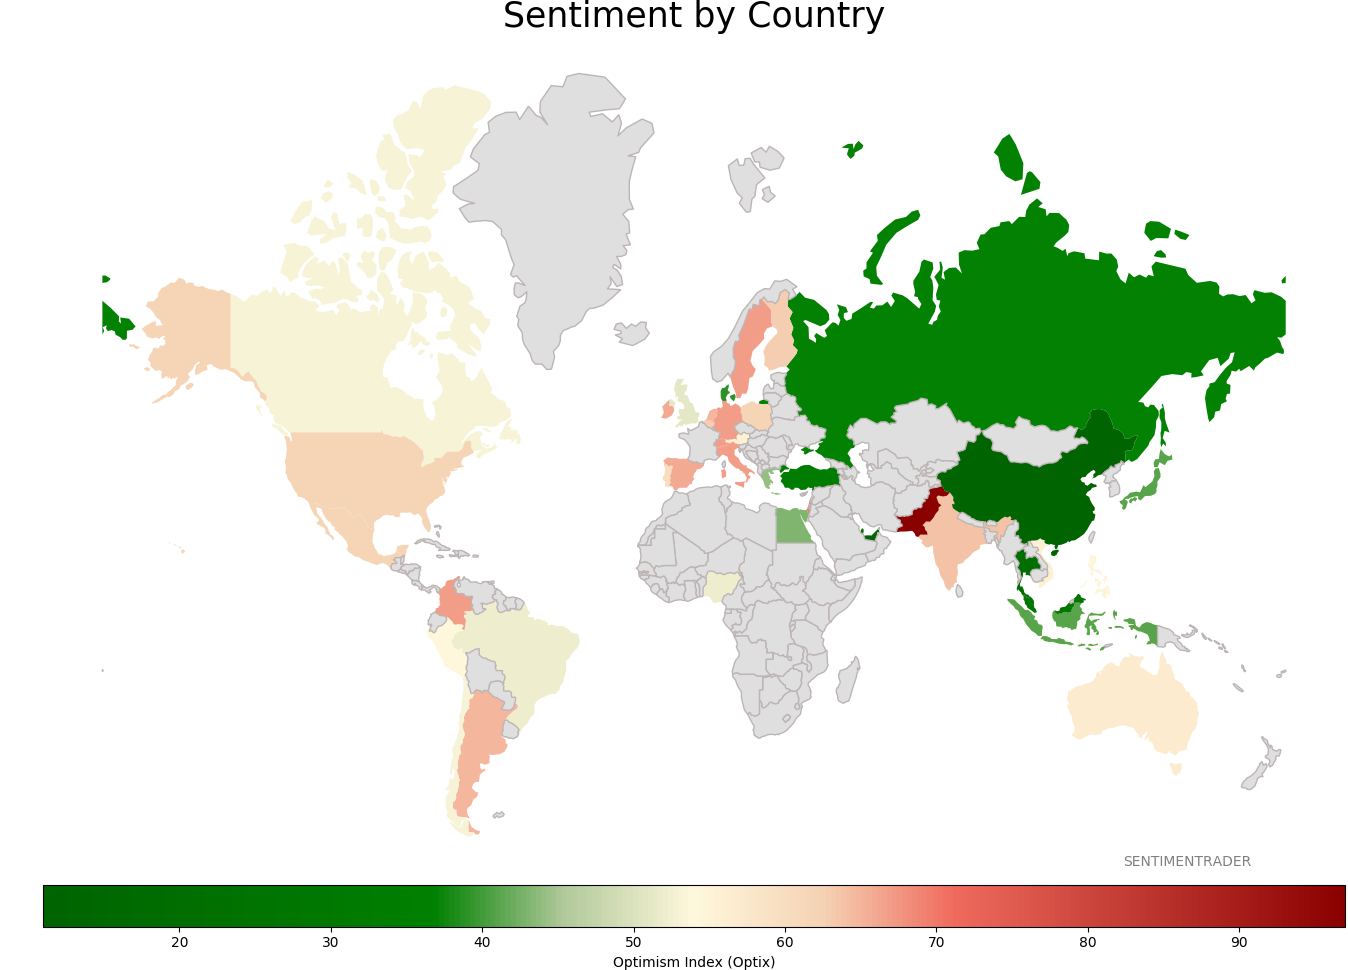
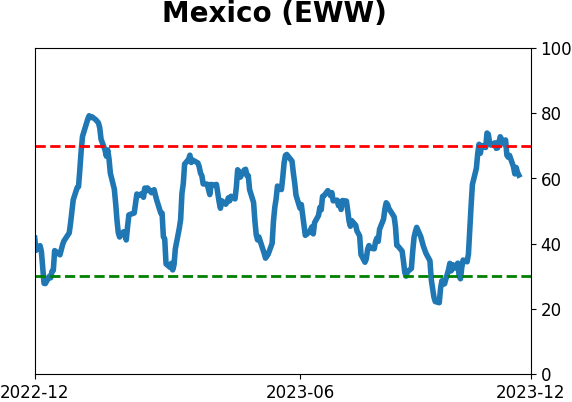
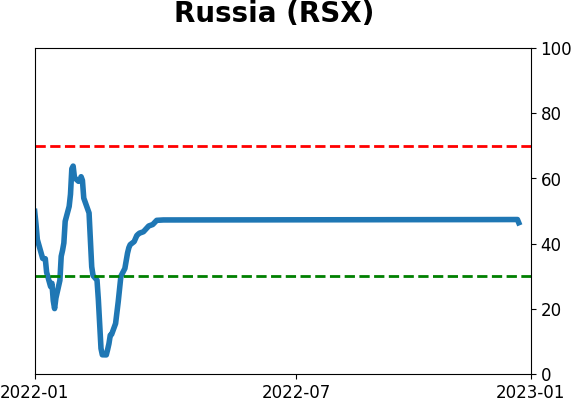
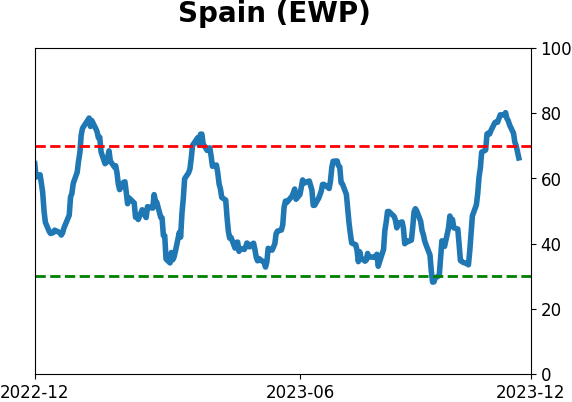
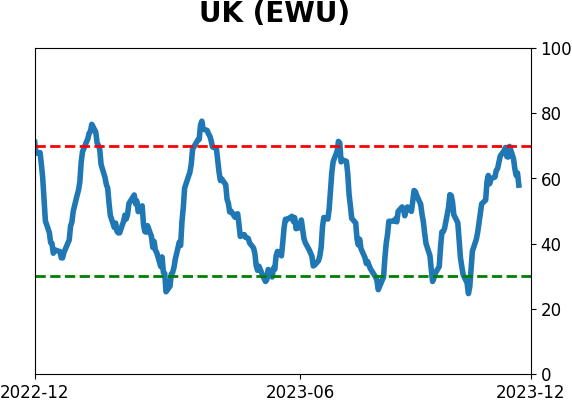
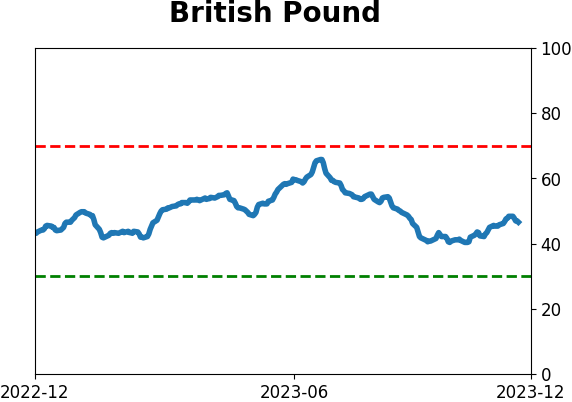
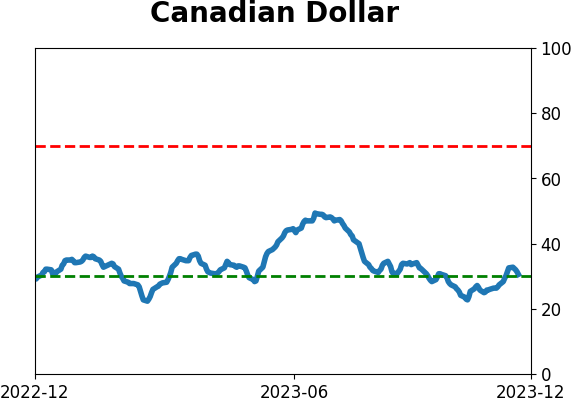
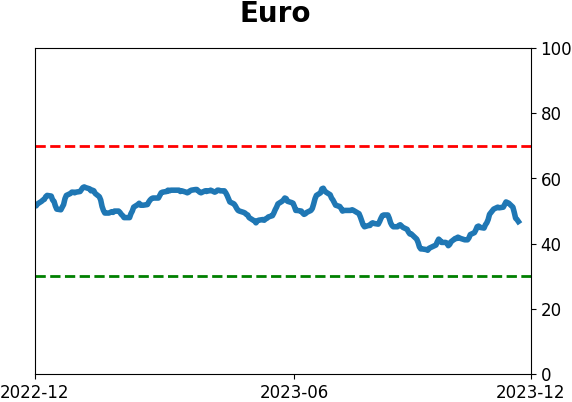
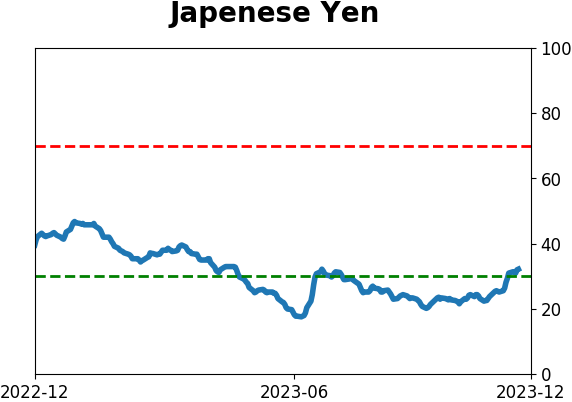
Sentiment Around The World
|
|
|
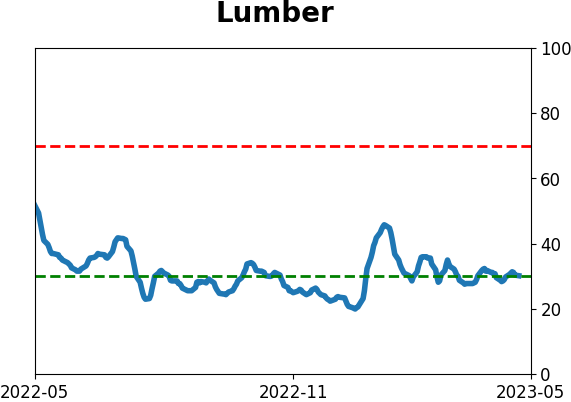
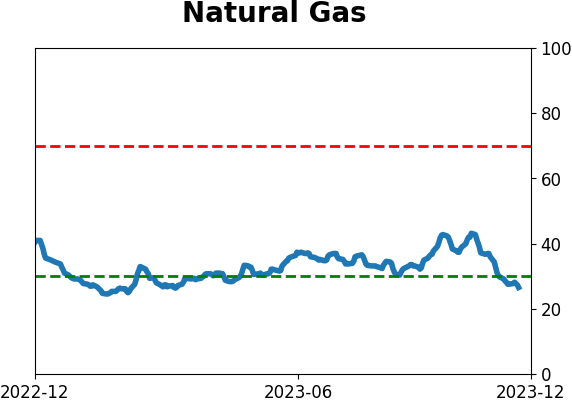
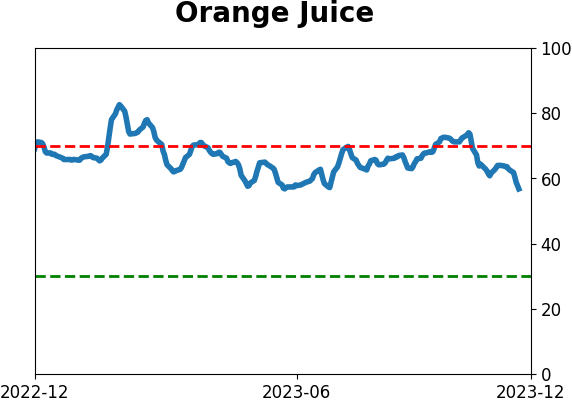
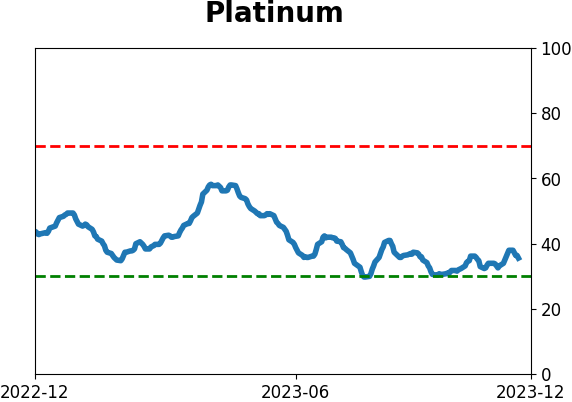
Optimism Index Thumbnails
|
|
|
|
|
|
|
|
|
|
|
|
|
|
|
|
|
|
|
|
|