Headlines
|
|
Wall Street is tepid on the prospects for 2023:
On Wall Street, strategists tend to form their analysis from the top down, while analysts compile their outlook from the bottom up. Both have led to the same conclusion: stocks are in store for a tough 2023. The only issue is that both groups tend to be consistent contrary indicators.
|
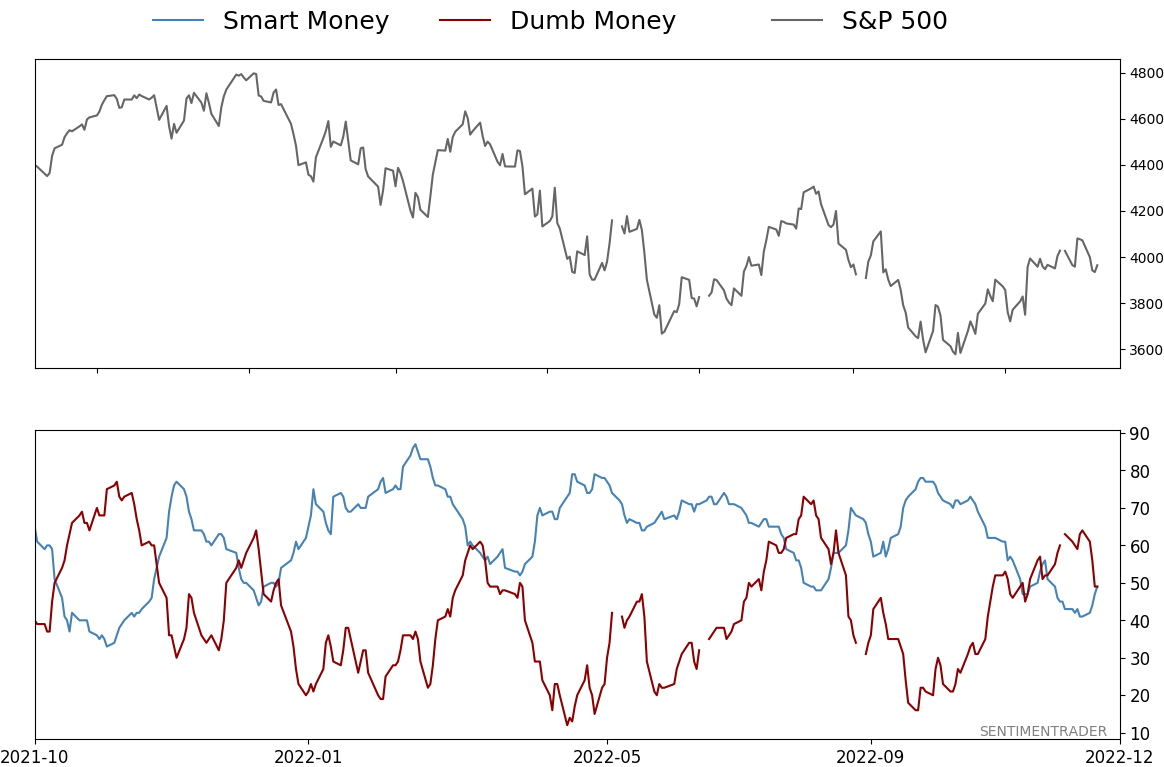
Smart / Dumb Money Confidence
|
Smart Money Confidence: 49%
Dumb Money Confidence: 49%
|
|
Risk Levels
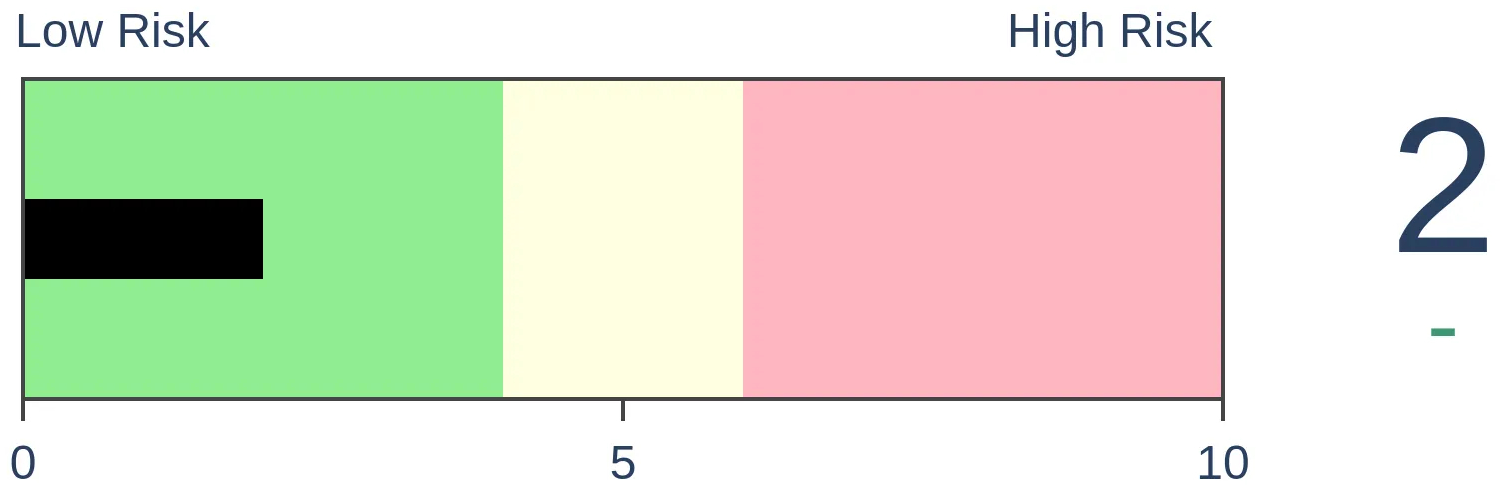
Stocks Short-Term
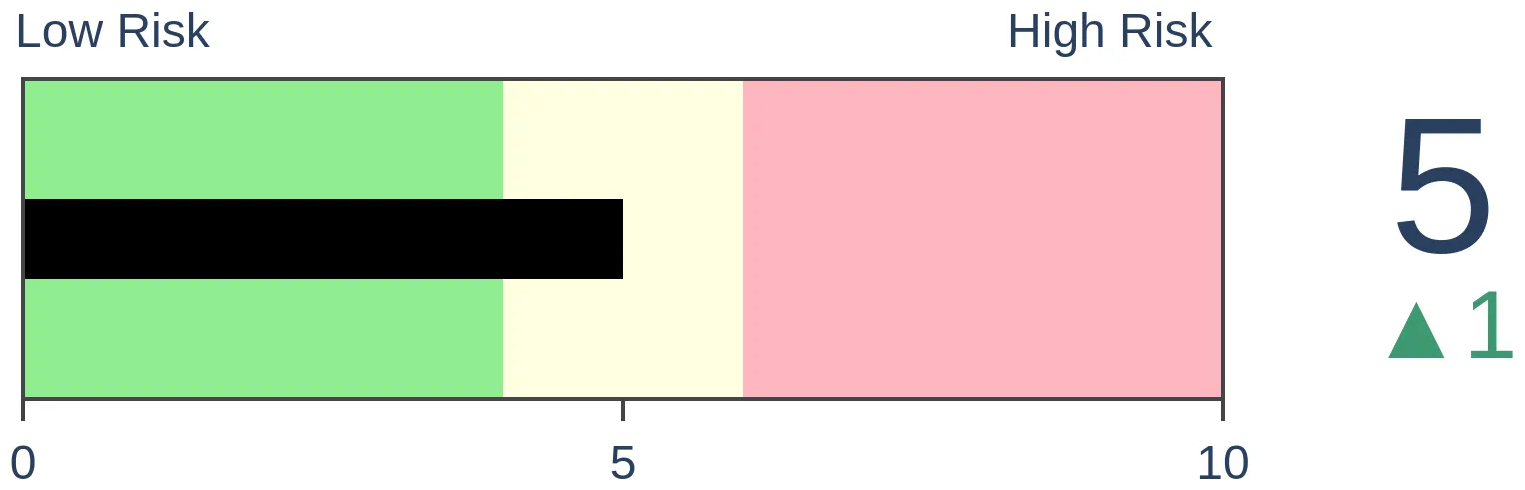
|
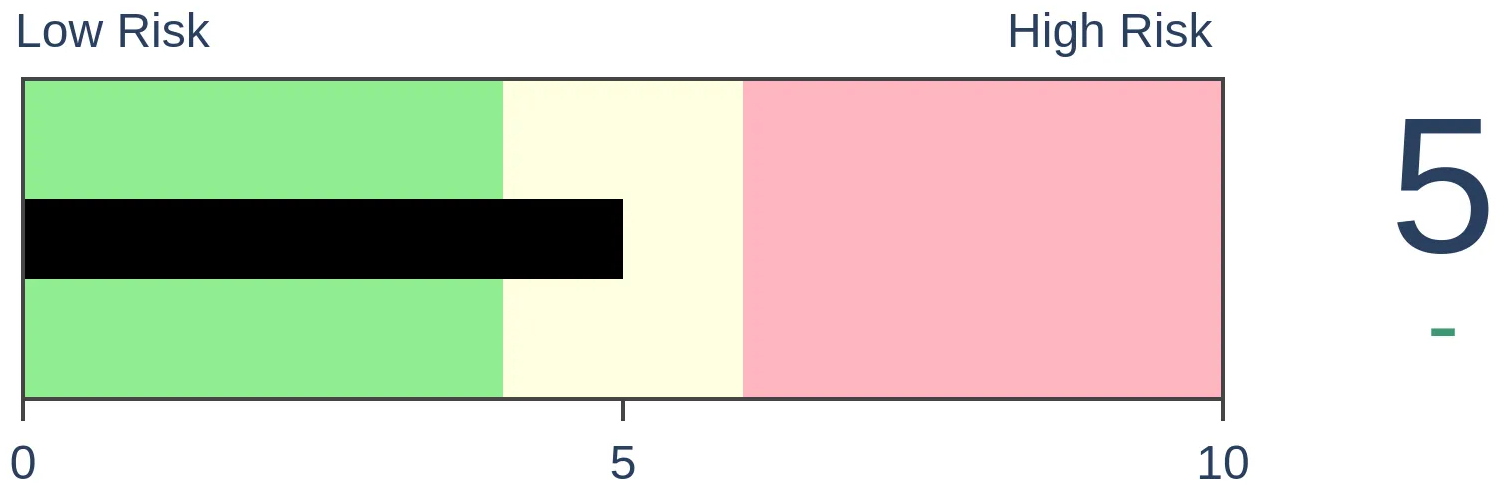
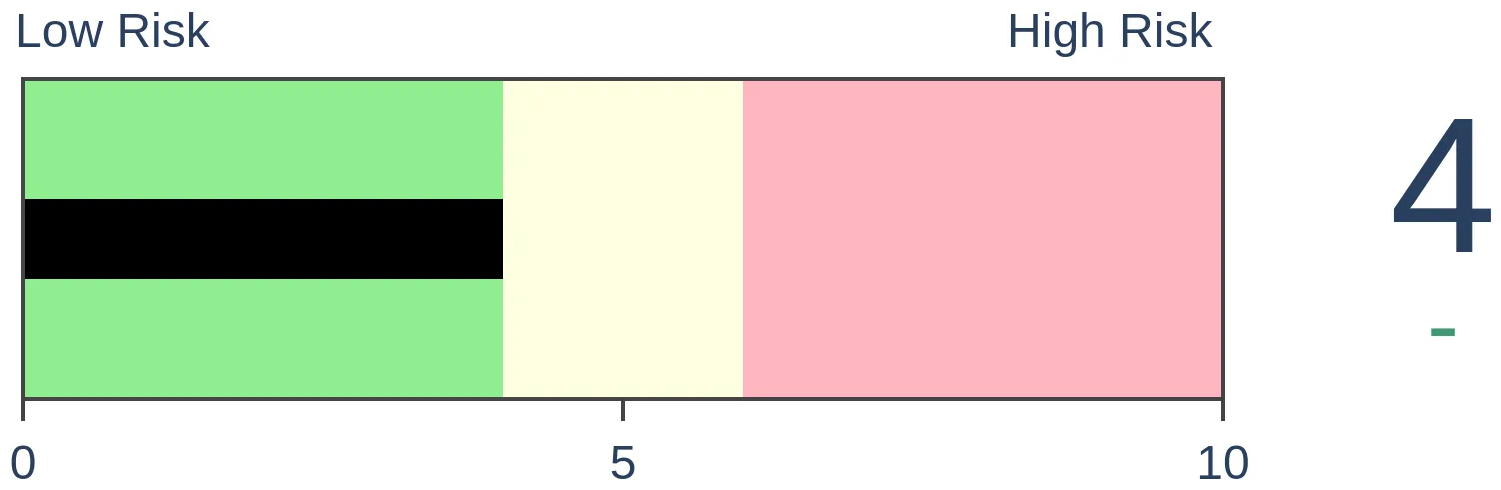
Stocks Medium-Term

|
|
Bonds
|
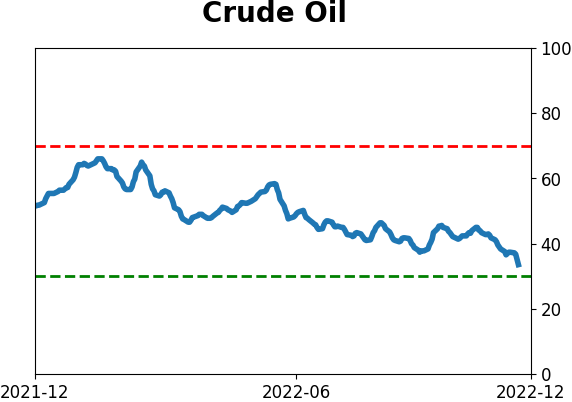
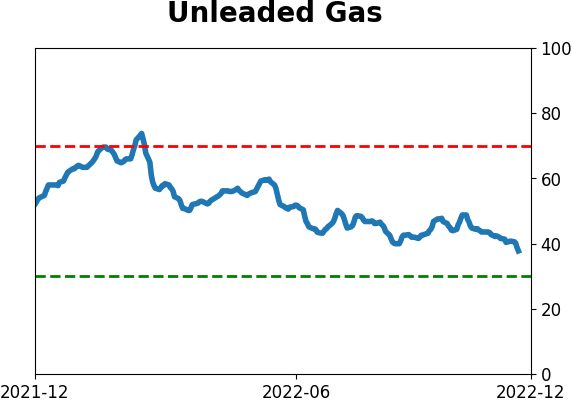
Crude Oil
|
|
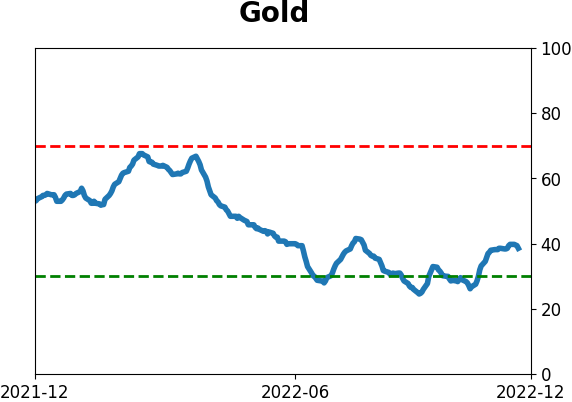
Gold

|
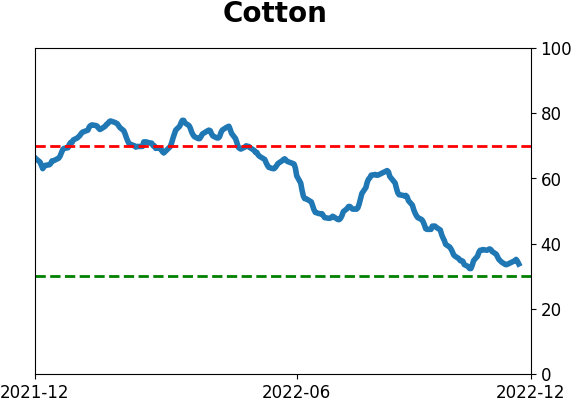
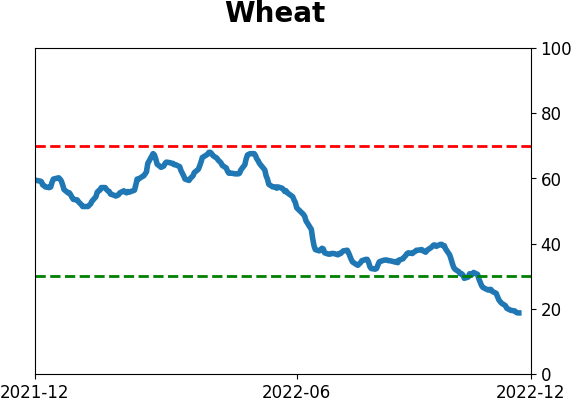
Agriculture
|
|
Research
By Jason Goepfert
BOTTOM LINE
On Wall Street, strategists tend to form their analysis from the top down, while analysts compile their outlook from the bottom up. Both have led to the same conclusion: stocks are in store for a tough 2023. The only issue is that both groups tend to be consistent contrary indicators.
FORECAST / TIMEFRAME
None
|
Key points:
- Wall Street strategists have a low opinion on prospects for the S&P 500 in 2023
- Analysts, who take a bottom-up view, are just now recovering from record pessimism
- Both factors tend to precede above-average returns for stocks
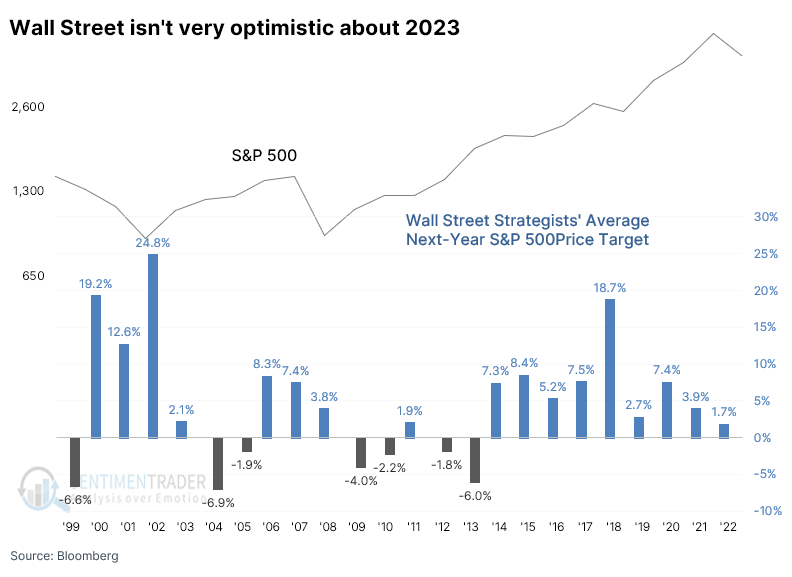
Strategists aren't buying into the idea of a bullish 2023
Bloomberg recently noted that Wall Street strategists are the most pessimistic they've been in 22 years on stocks.
The average forecast of handicappers tracked by Bloomberg calls for a decline in the S&P 500 next year, the first time the aggregate prediction has been negative since at least 1999. Most of them turned progressively more dour as the worst year in the market since the financial crisis moved toward its end.
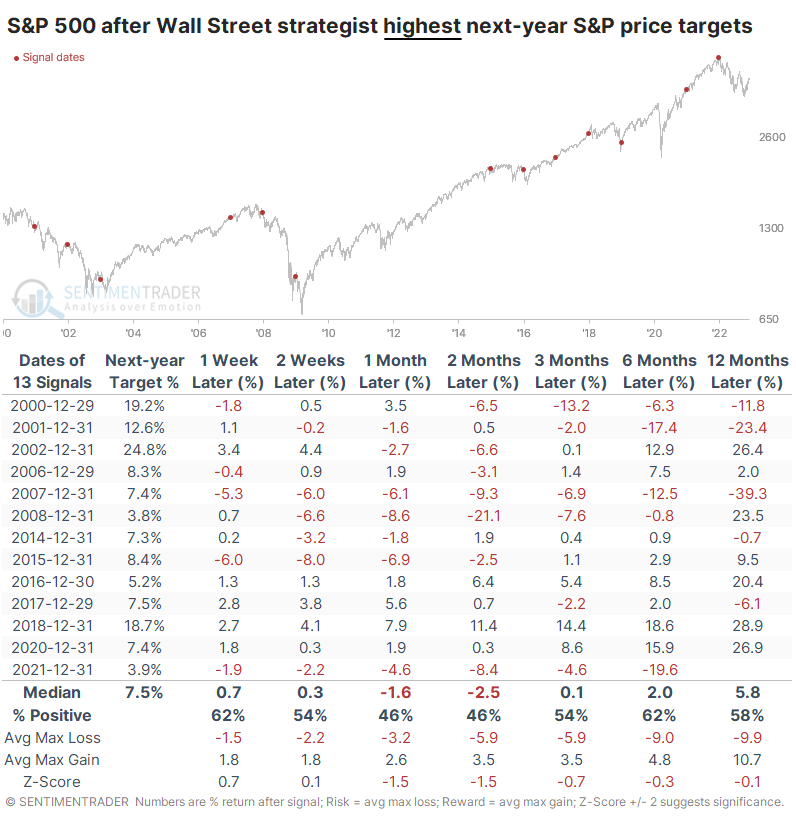
We've looked at this data many times over the years and use a different methodology. The tally of strategists' next-year price targets has been inconsistent - sometimes it's updated early in December, sometimes later in the month, and sometimes not until January. For this view, we're only looking at the latest average of strategists' next-year price target for the S&P 500 at the end of December each year.
Since the month hasn't ended yet, this will change depending on the level of the S&P and whether they do another tally of strategist estimates. There is quite a difference with Bloomberg's analysis, but the overall gist is the same - Wall Street isn't too hip on the prospects for next year.
When strategists were the least optimistic about next-year returns for the S&P, the index tended to do pretty well. Since 2005, it has shown a gain during the first two weeks of the year every time. This happened before the pandemic shutdown, which preceded a terrible loss in the following months. The others, however, mostly receded gains.
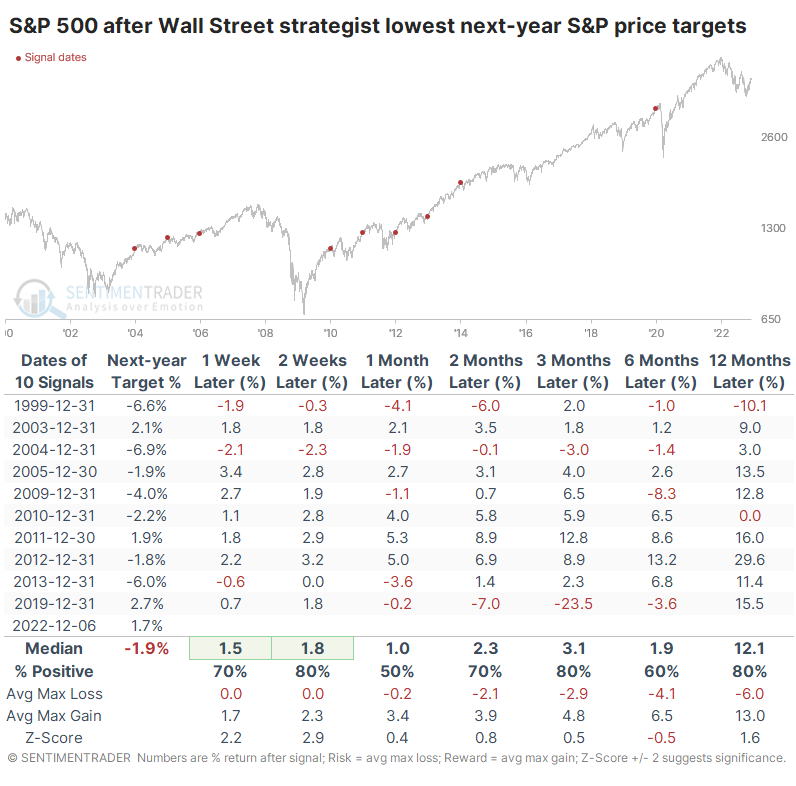
Let's look at the years when strategists were the most optimistic about the following year. In those cases, the S&P's returns tended to be worse across virtually all time frames, less consistent, and with more risk.
Analysts aren't very optimistic, either
On Wall Street, strategists take a top-down view, starting with global and domestic macro, economic, and fundamental considerations, and work their way down. Analysts tend to do the opposite, focusing on the micro of individual company earnings prospects.
Those analyses have been just as depressing as the ones that strategists are considering.
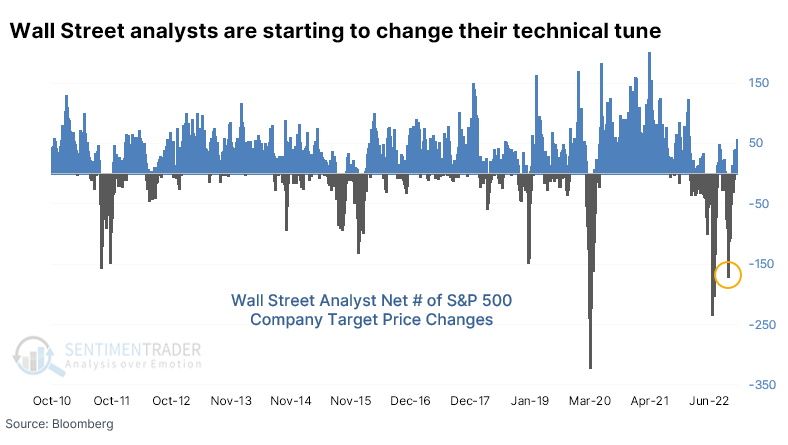
A few weeks ago, analysts were busy downgrading the price targets on their companies. There were more than a net 150 downgrades in a single day, the 3rd-most in 12 years. It has since recovered, and analysts are upgrading some targets as stocks rally, but it still hasn't recovered from the multitude of downgrades in recent months.
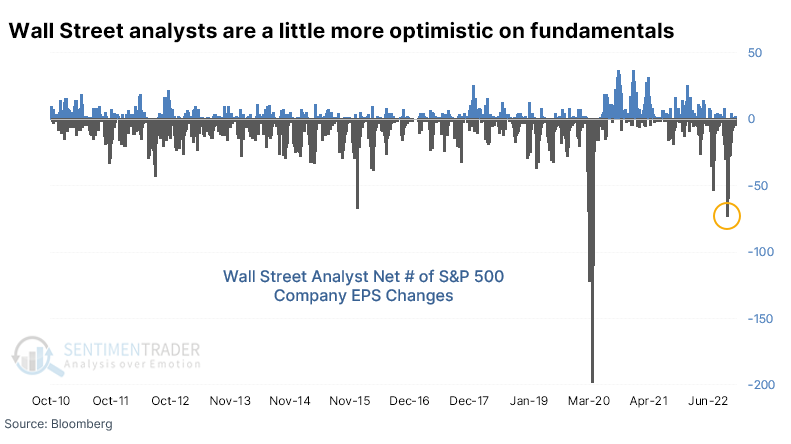
Analysts are even more pessimistic about stocks' fundamental prospects. They were recently downgrading the earnings per share estimates at the 2nd-greatest pace since 2010 and have just started to ease off the brakes.
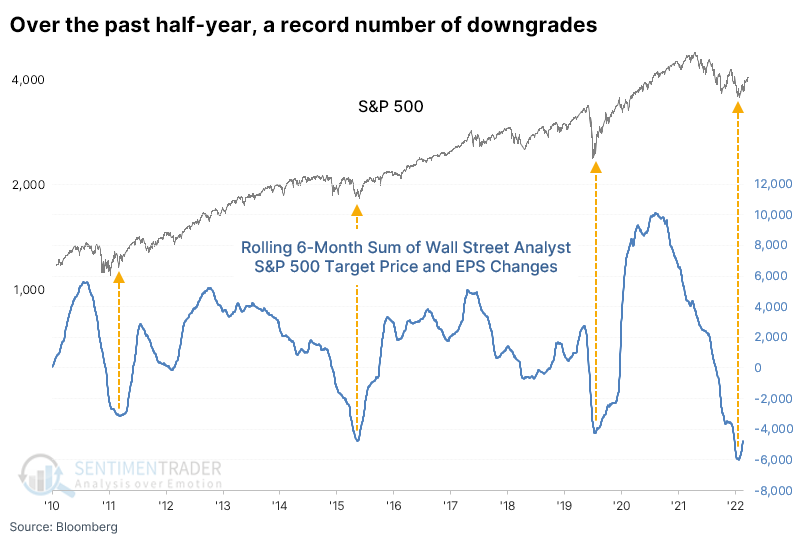
When we look at a rolling sum of net upgrades minus downgrades, both technical and fundamental, across all stocks in the S&P 500, the past six months witnessed a record number of downgrades. Three other times the combined net rolling sum exceeded -3,000, each coinciding with major lows in the S&P. Of course, the argument can be made that the sample size is too small and history too limited to draw any conclusions. Fair enough, but we can only work with the available data.
What the research tells us...
In October, there was solid evidence that investors had reached a point of maximum pessimism. Sentiment has recovered along with stock prices, but some holdouts remain. October's pessimism was rampant, and it will take time to fully recover (if it's allowed during a bear market). One of those holdouts is Wall Street, a consistent contrary indicator at extremes. This year has slapped the Street upside the head, and its denizens haven't been quick to embrace a bullish thesis. That is usually a good sign for the rest of us.
Indicators at Extremes
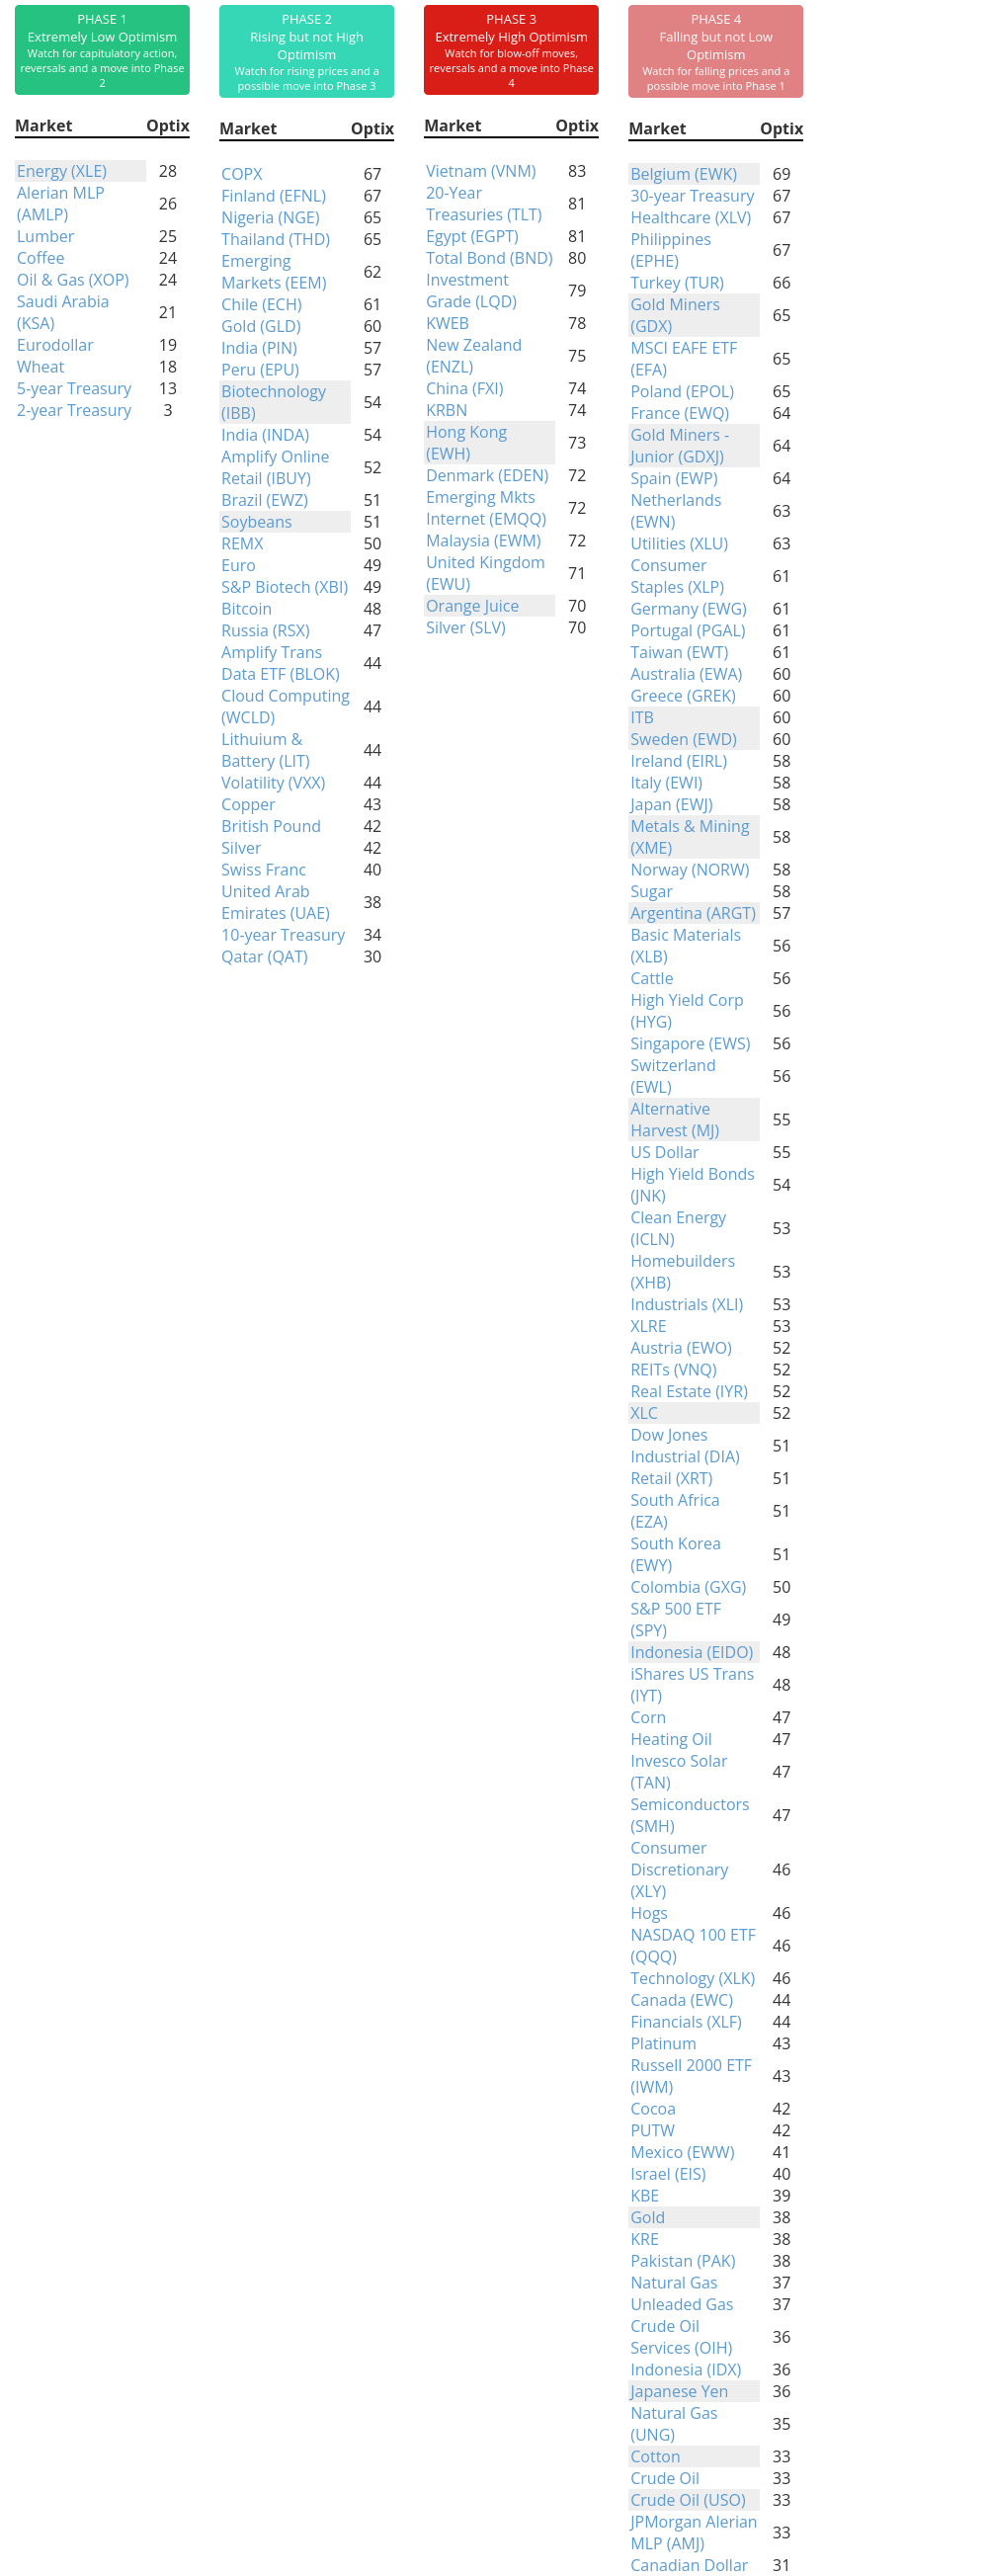
Phase Table
Ranks
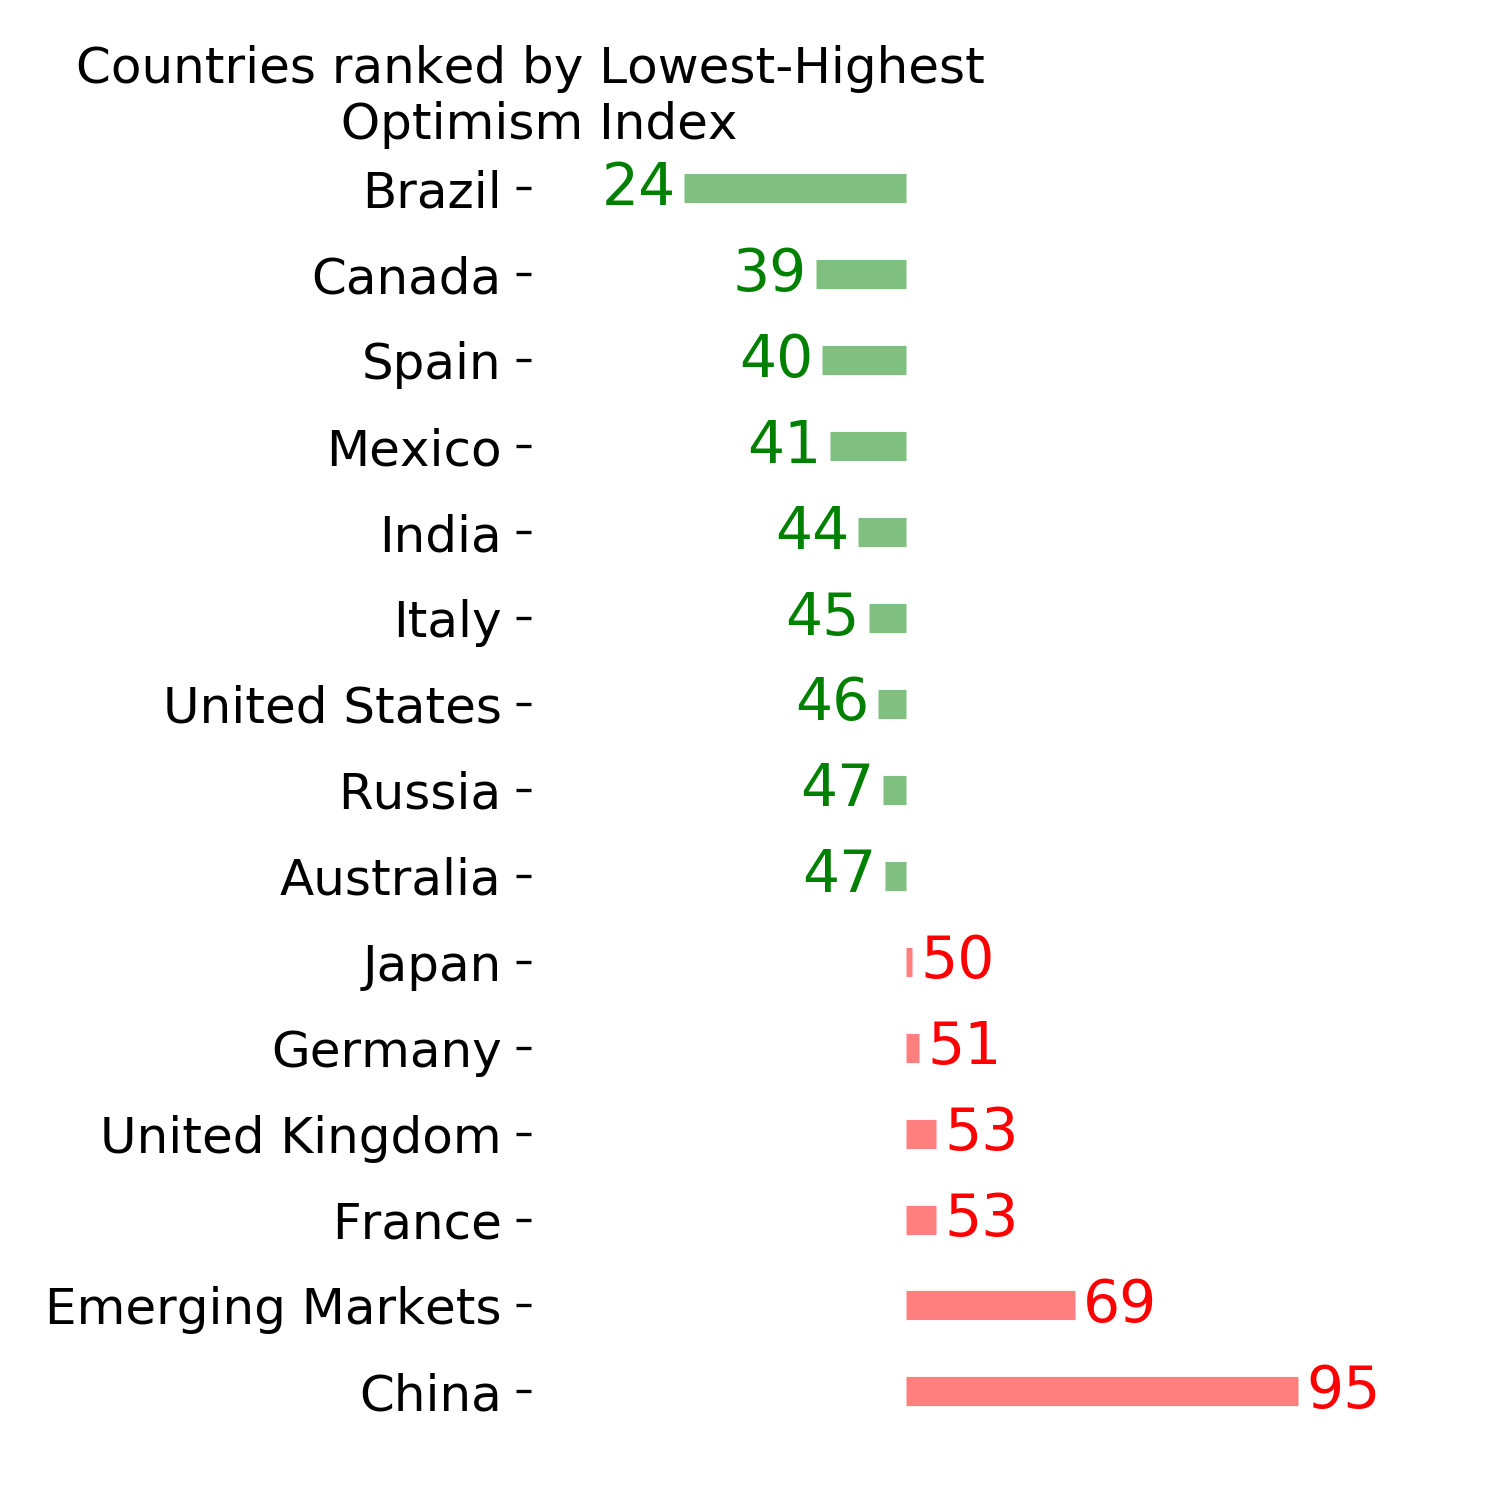
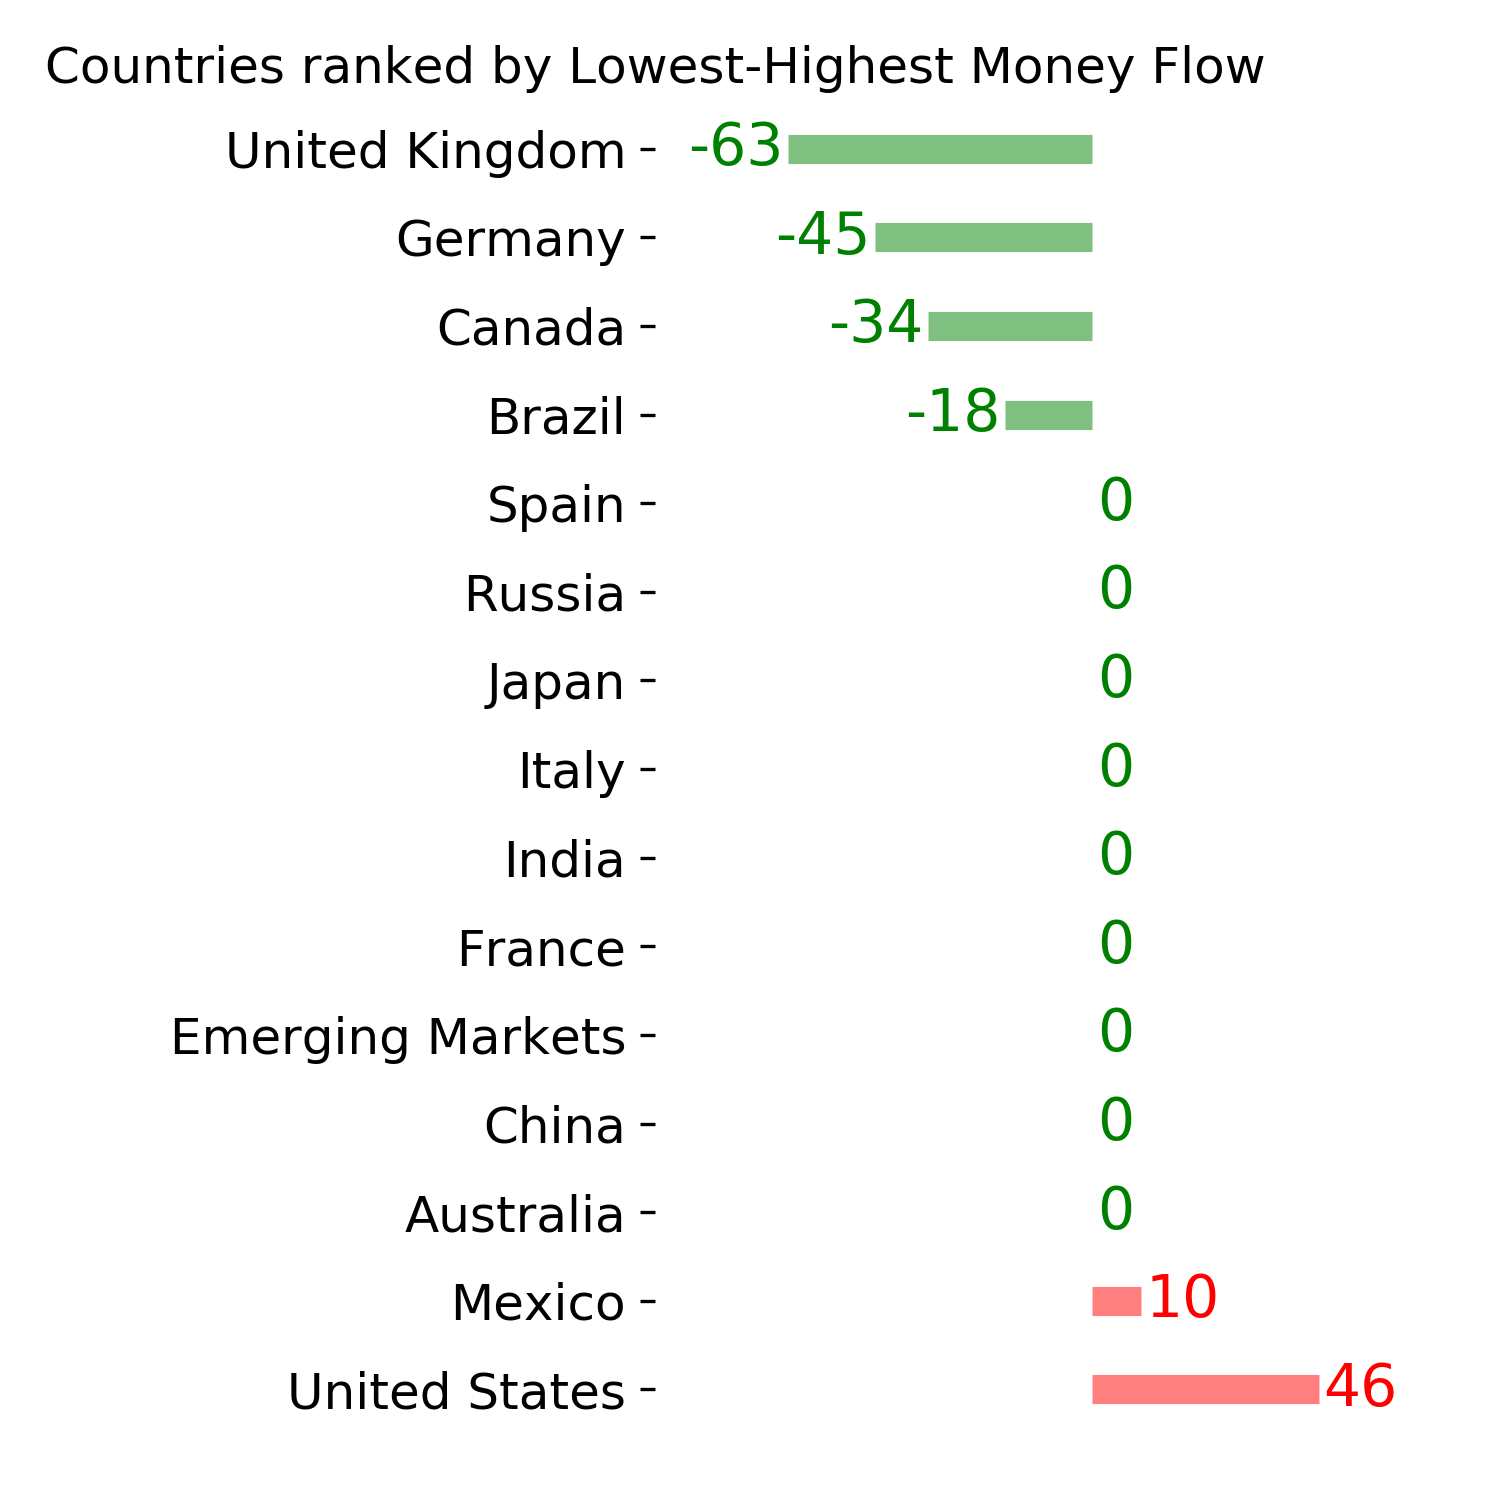
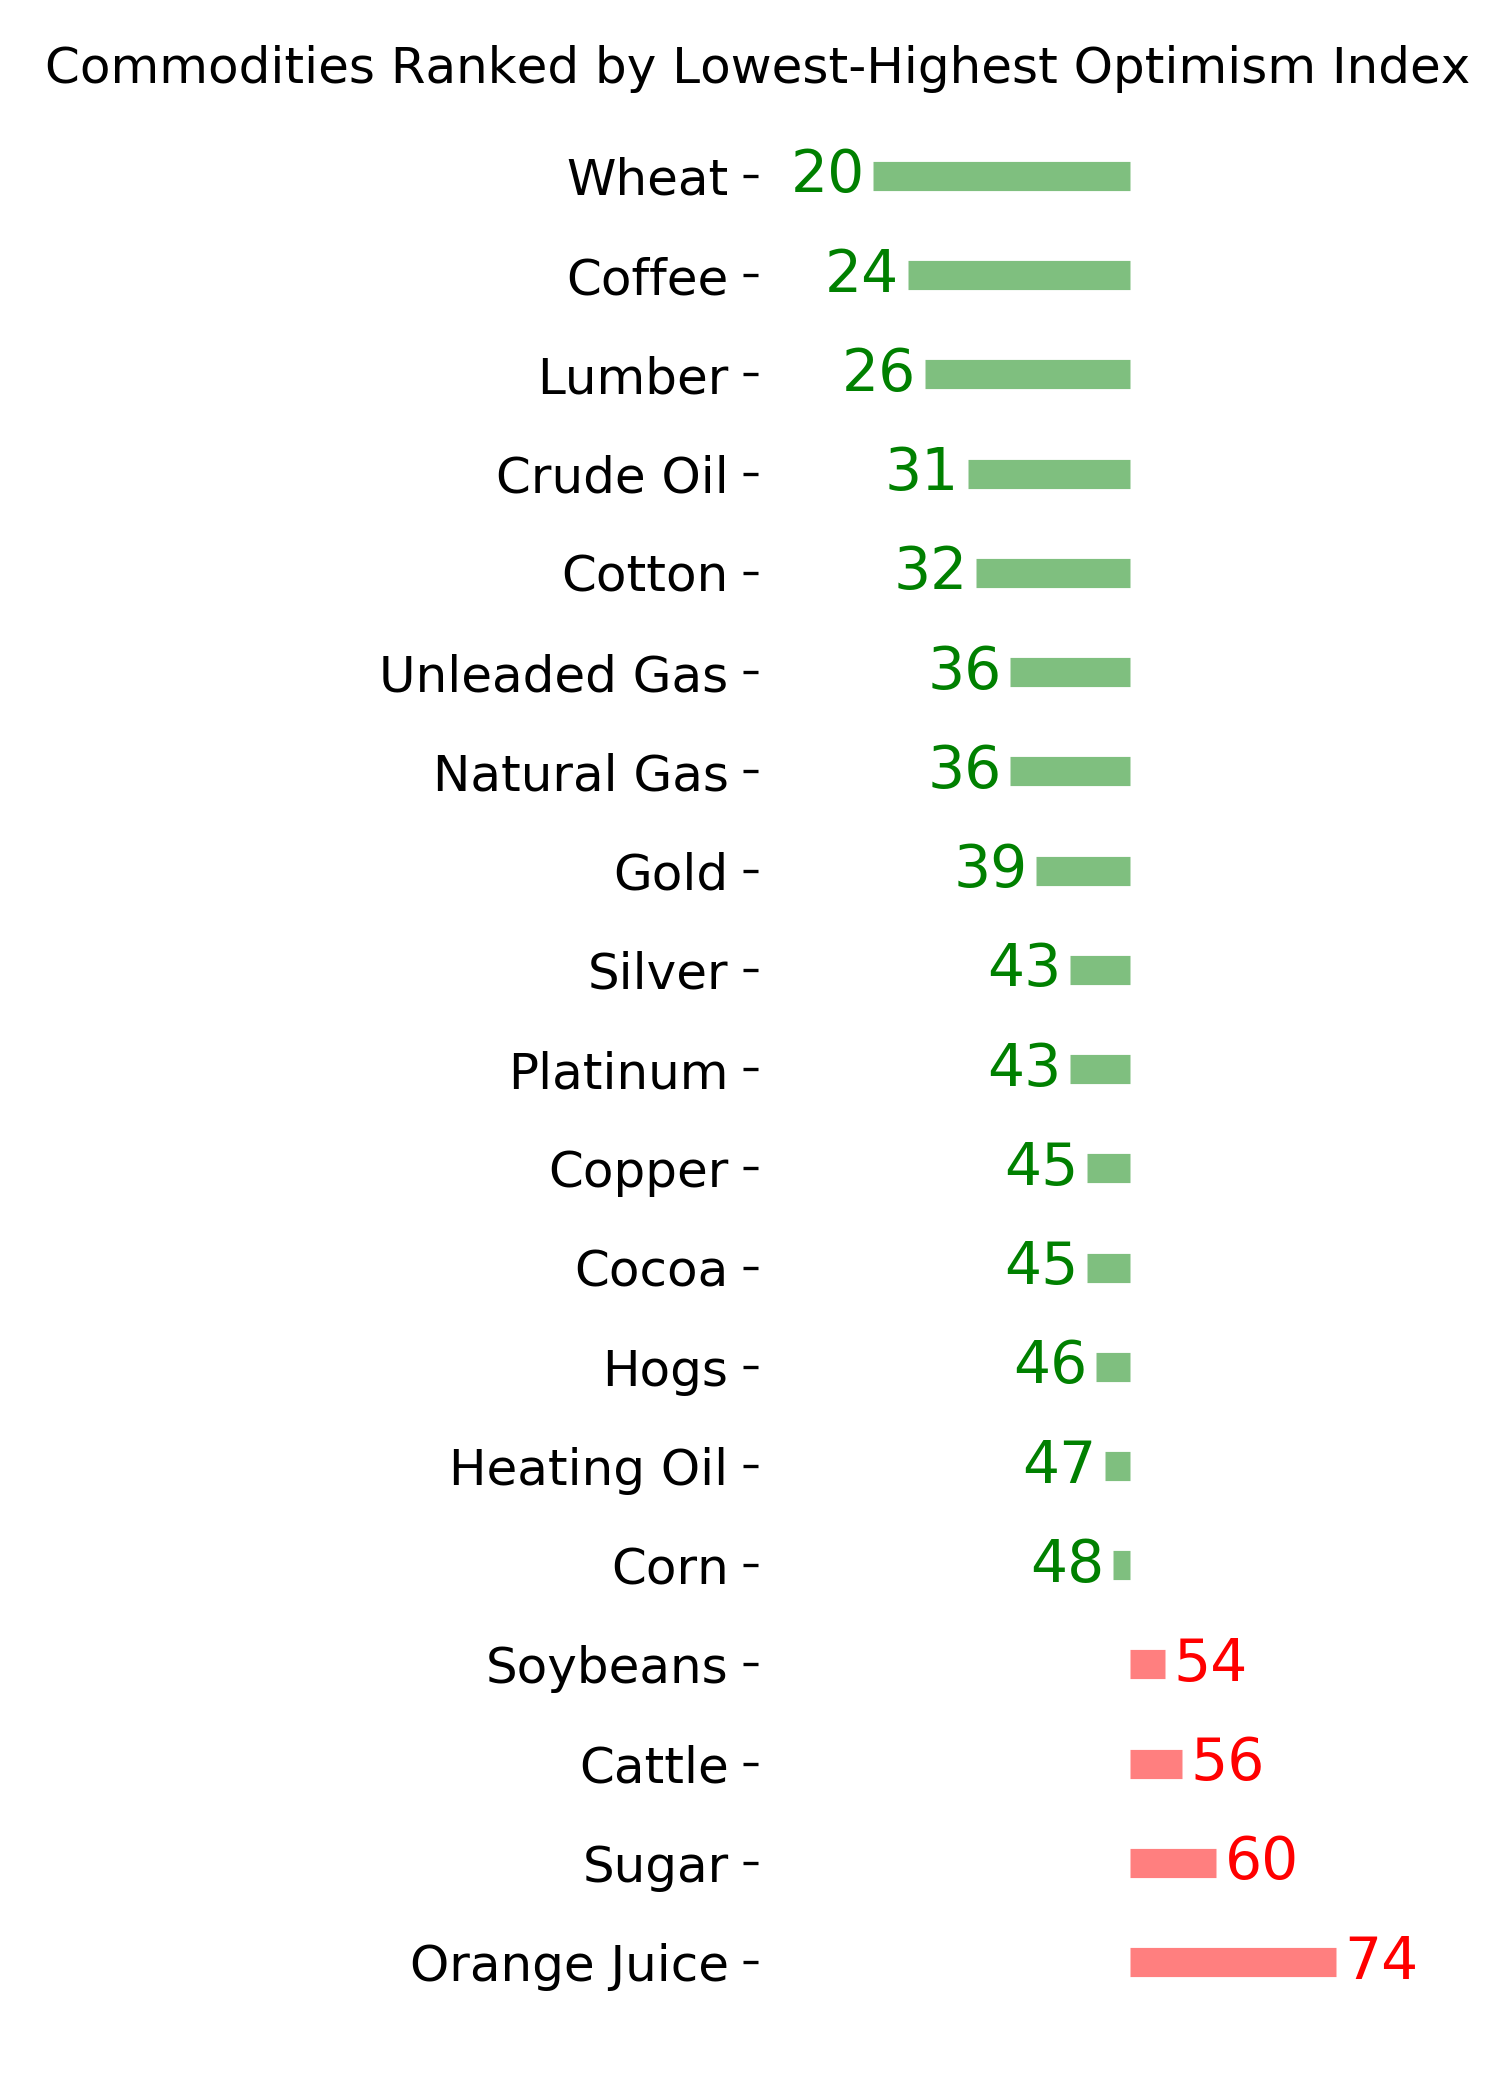
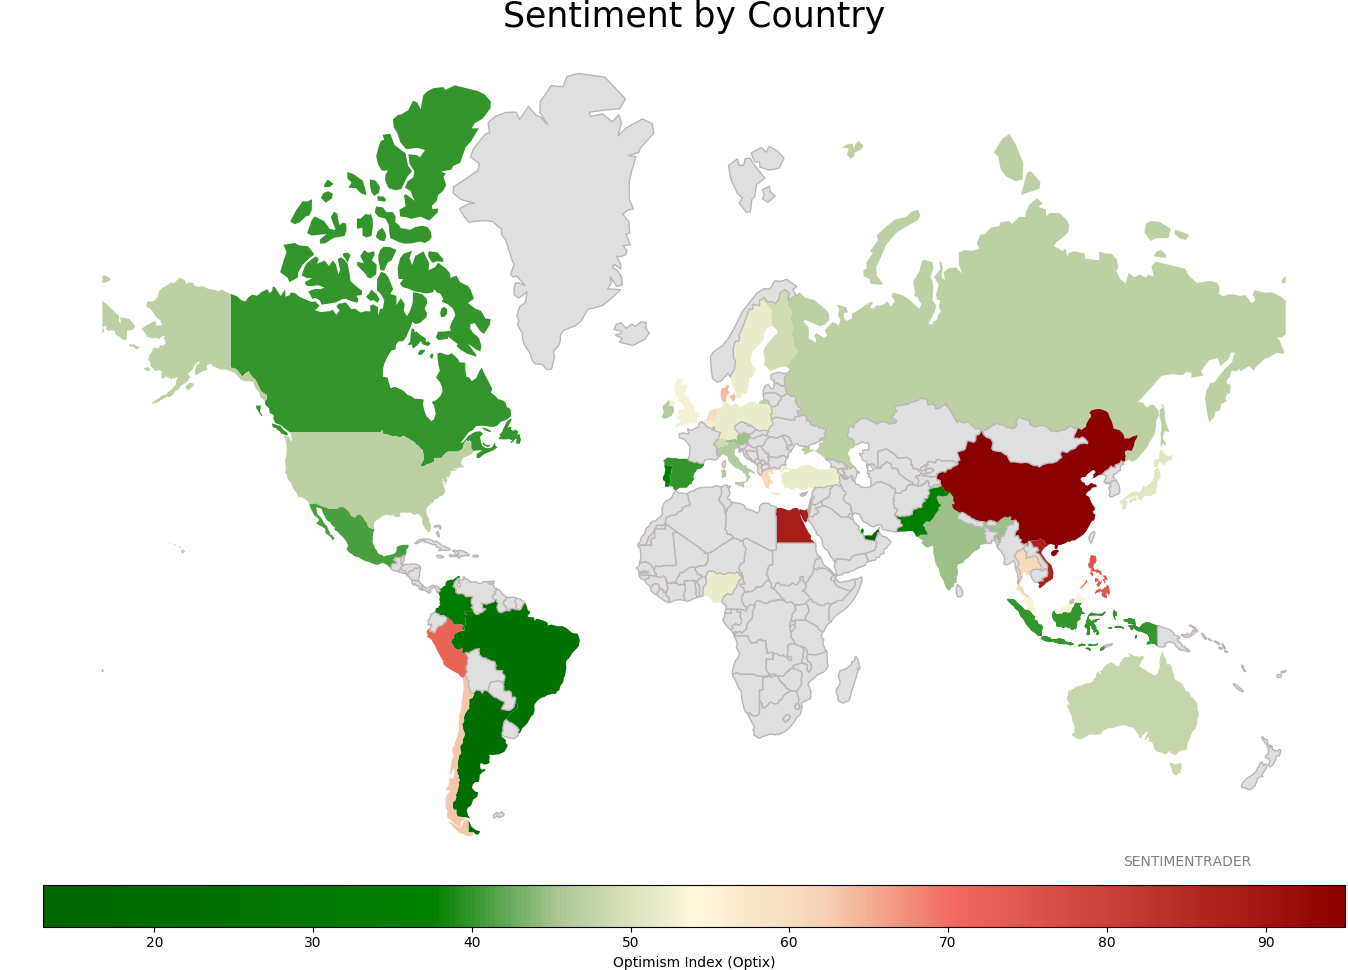
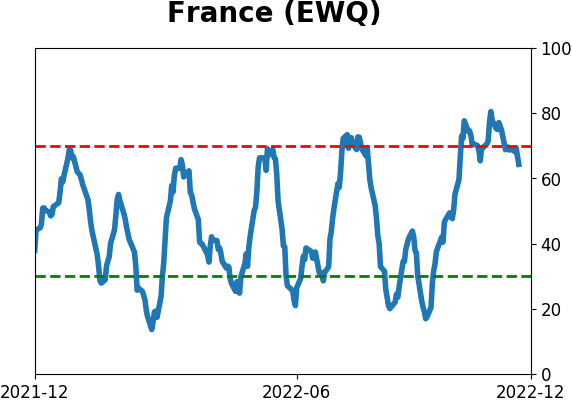
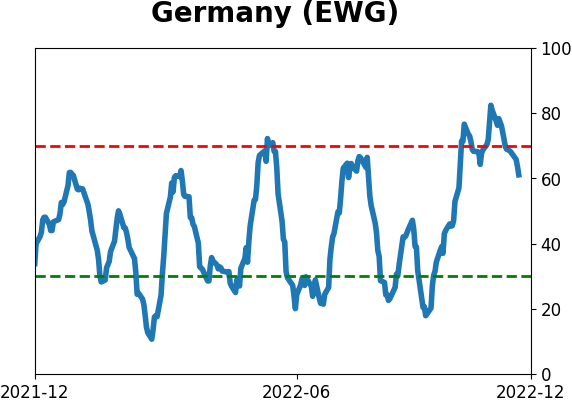
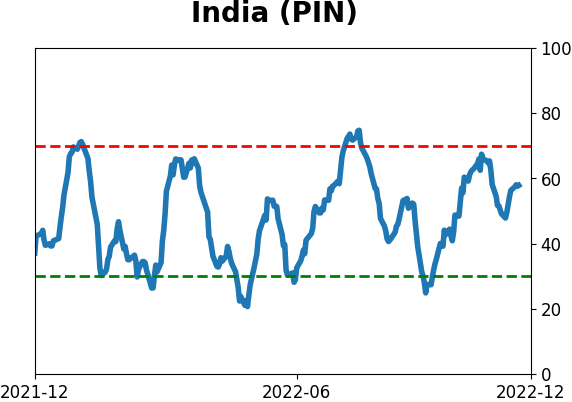
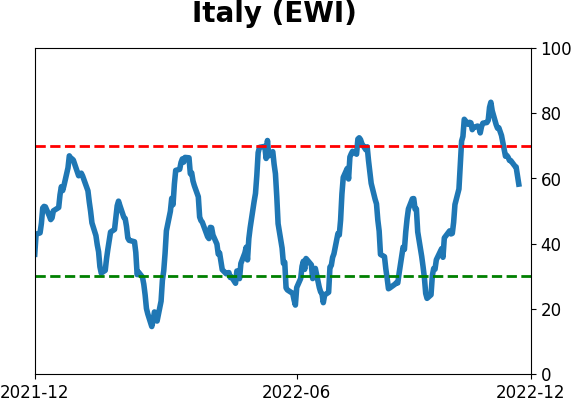
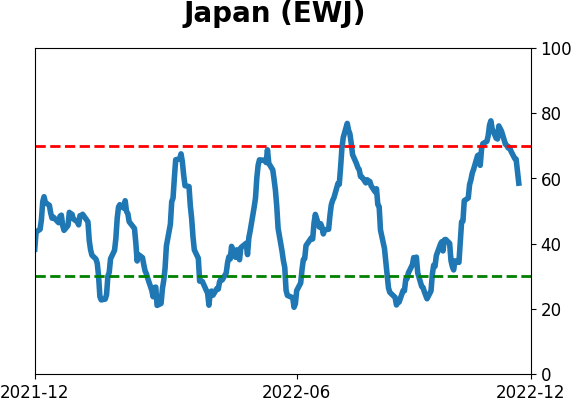
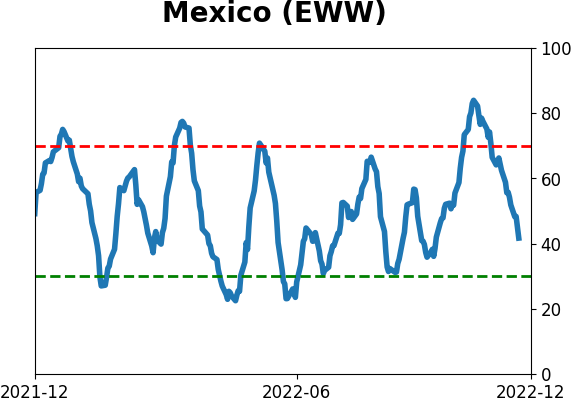
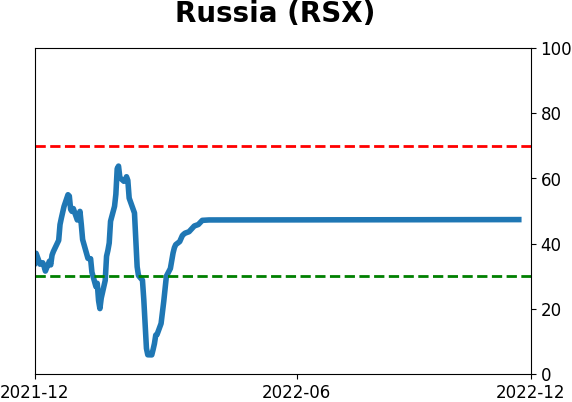
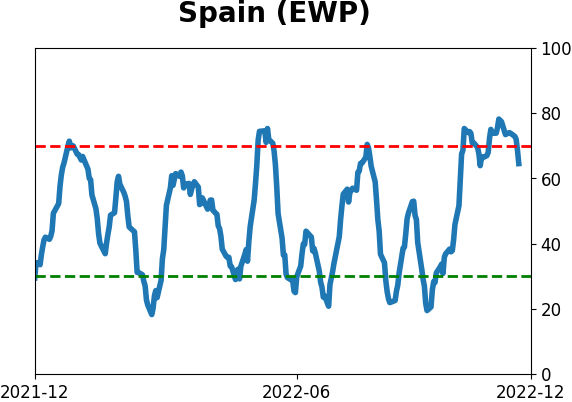
Sentiment Around The World
Optimism Index Thumbnails
|
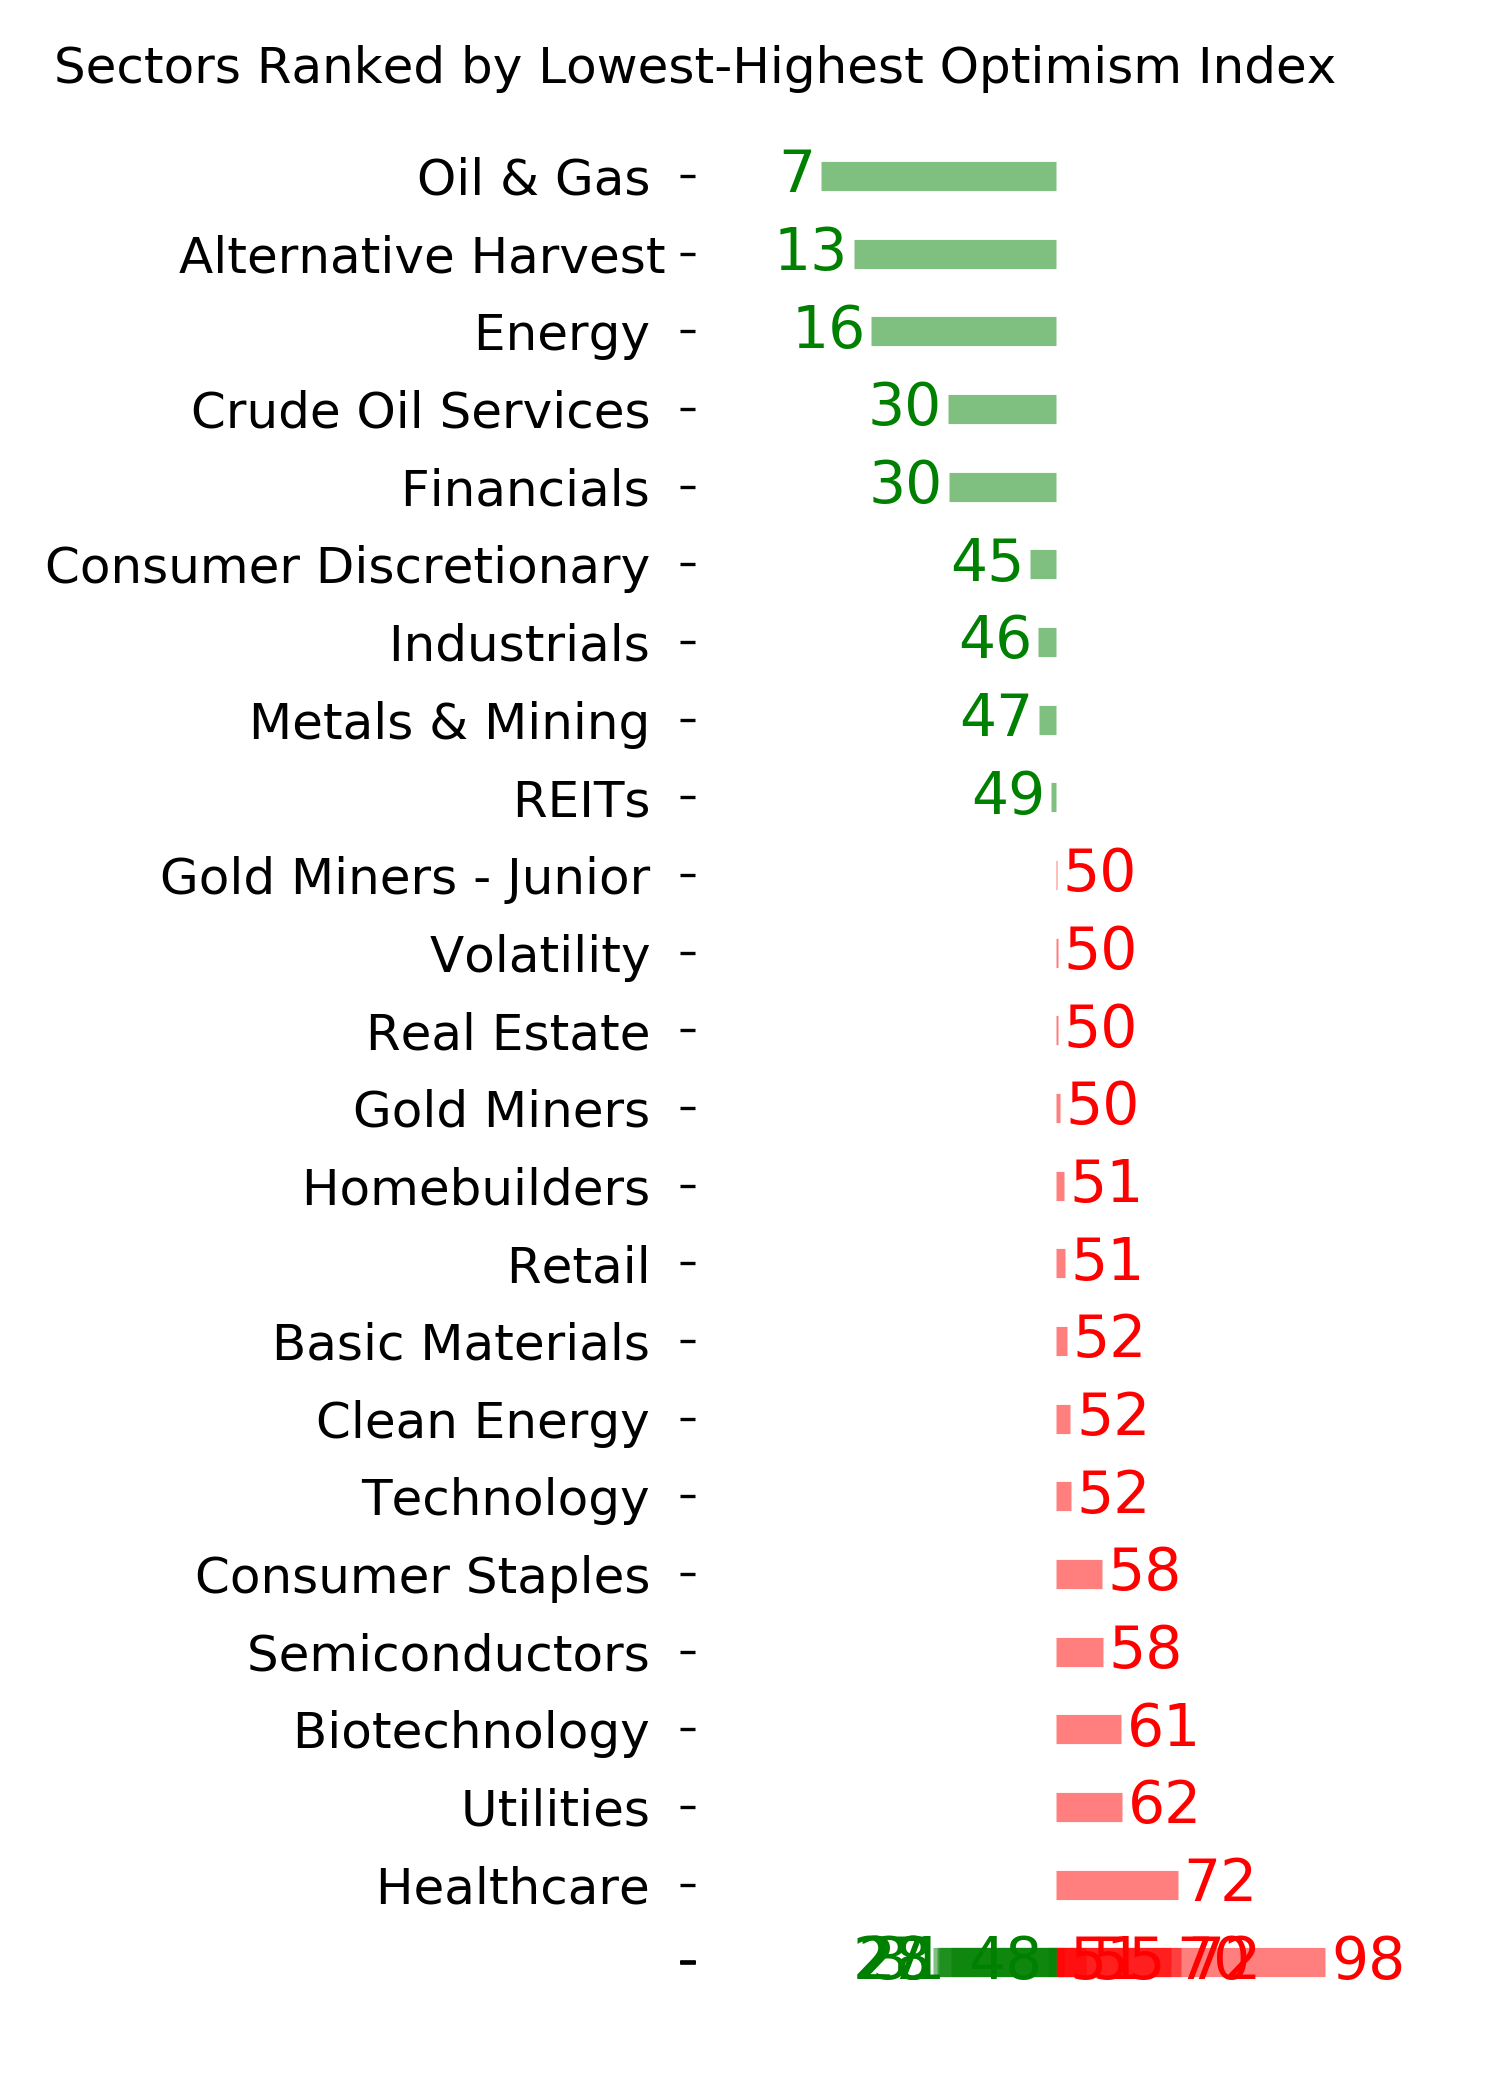
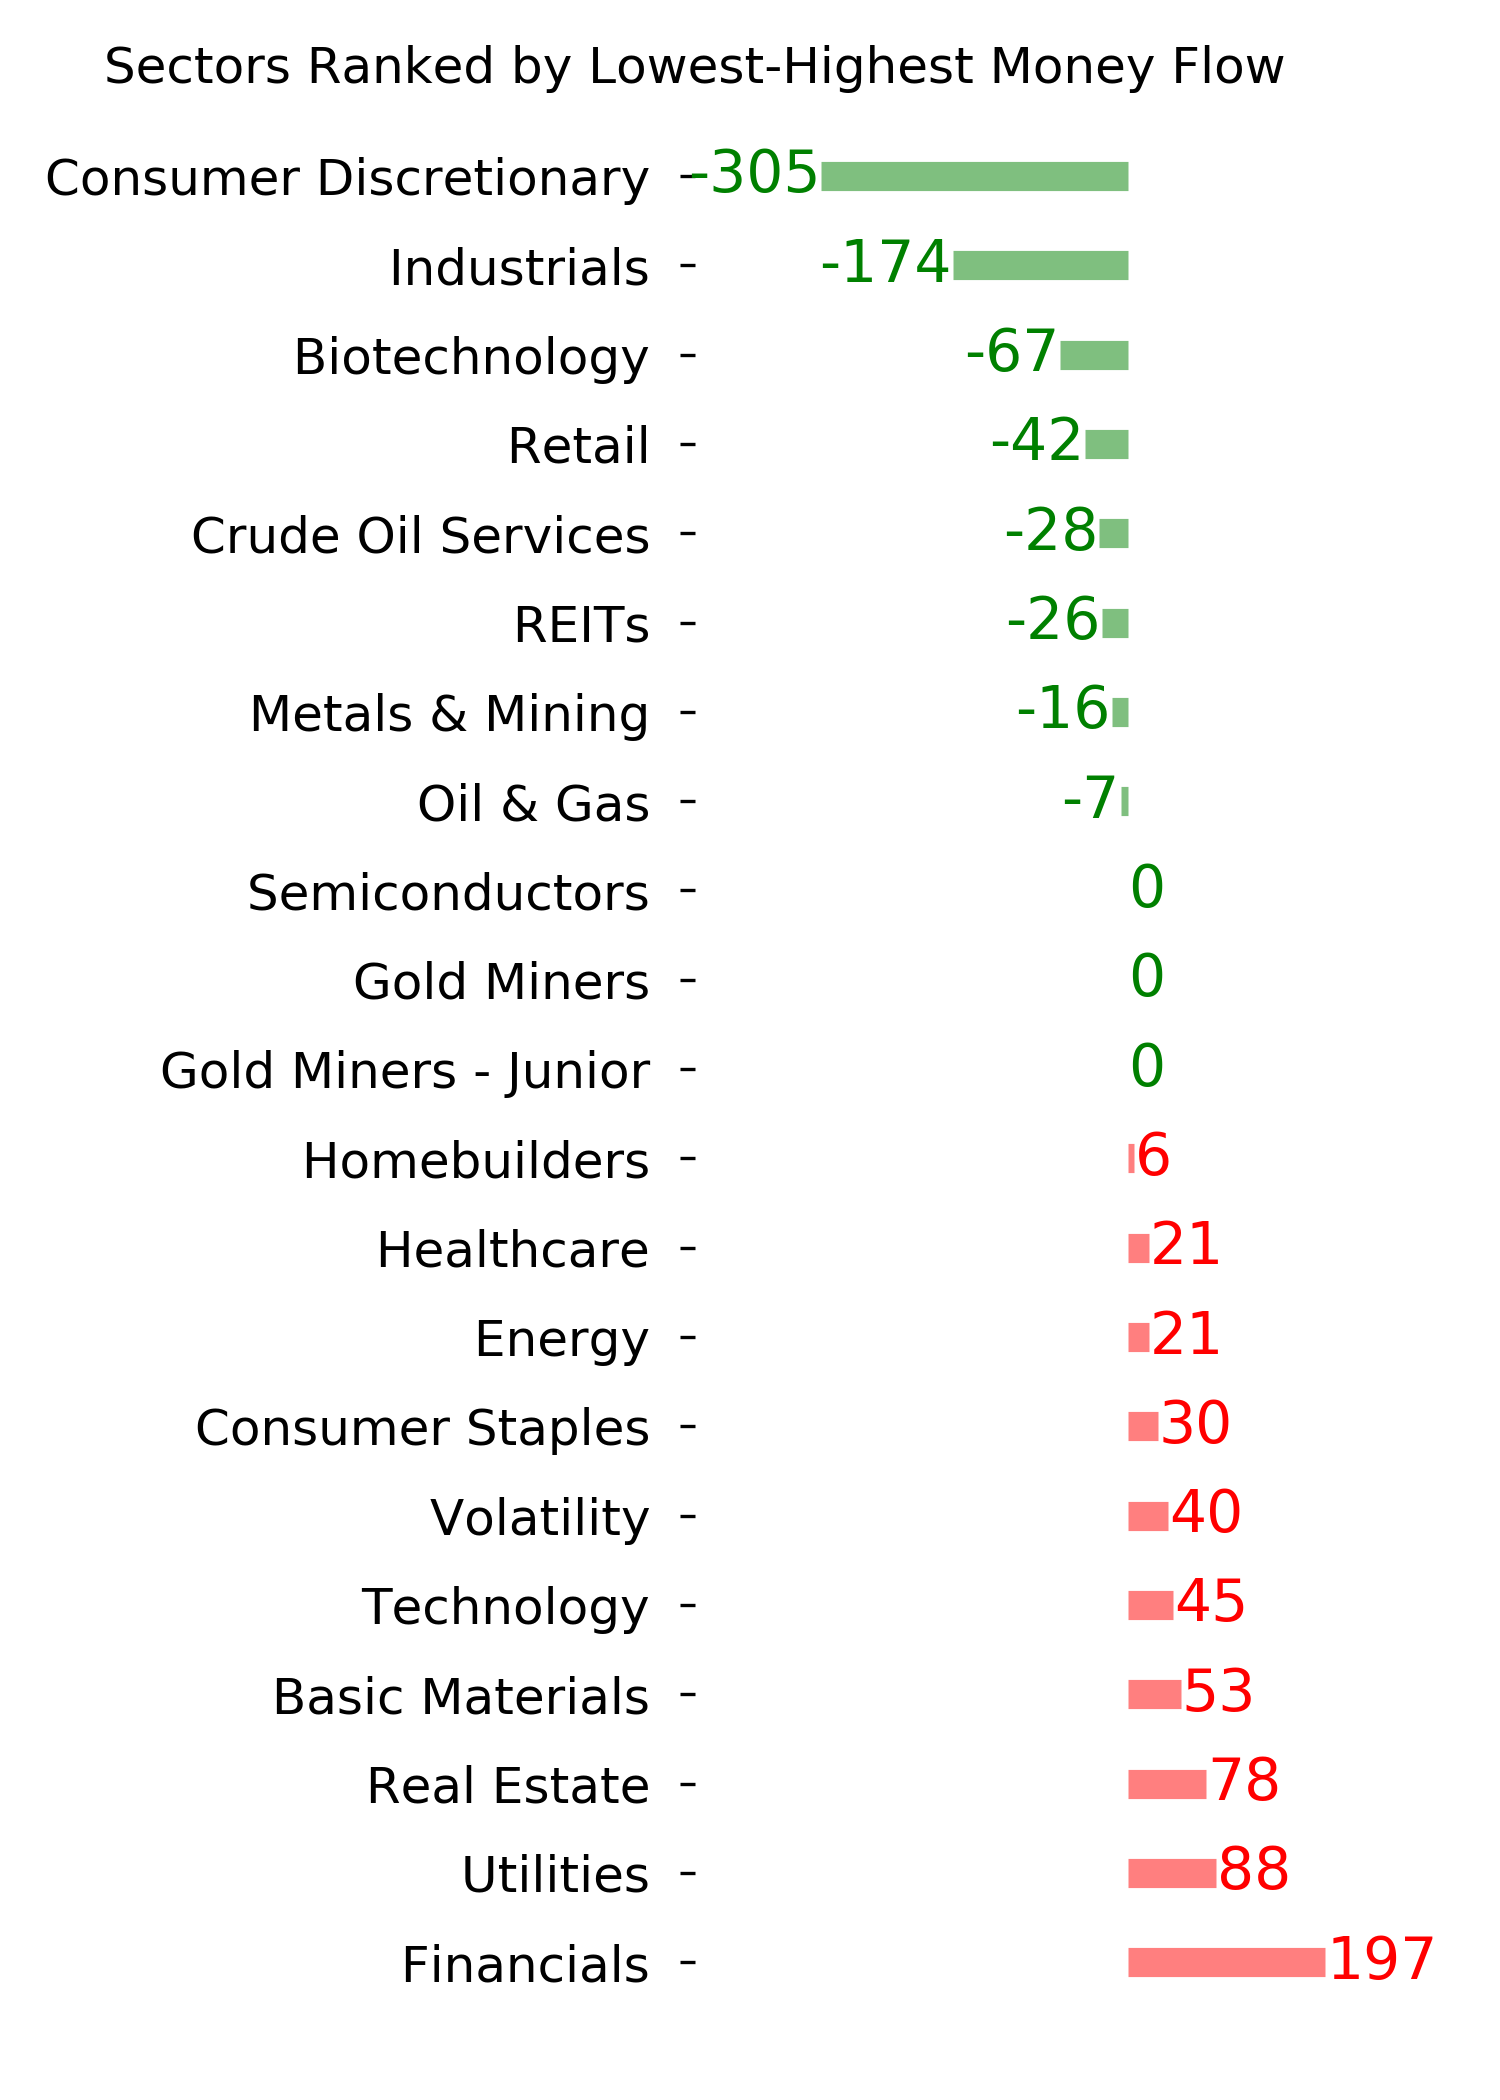
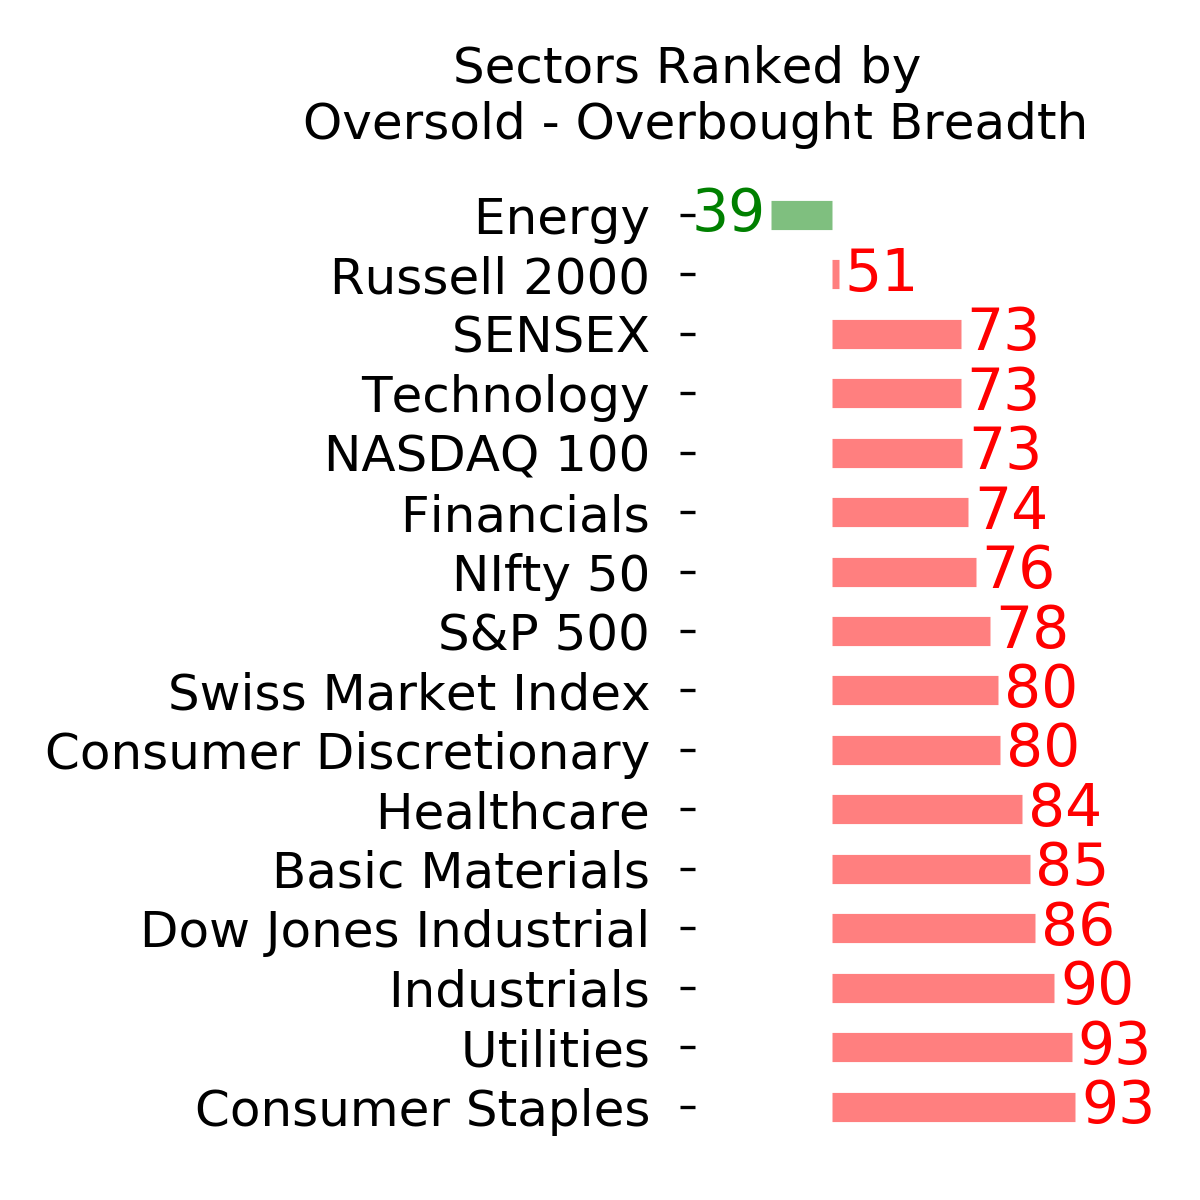
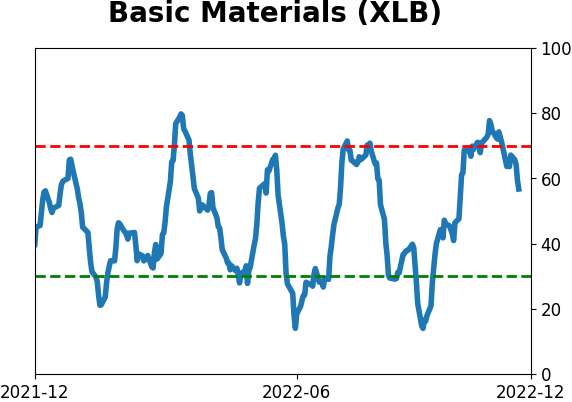
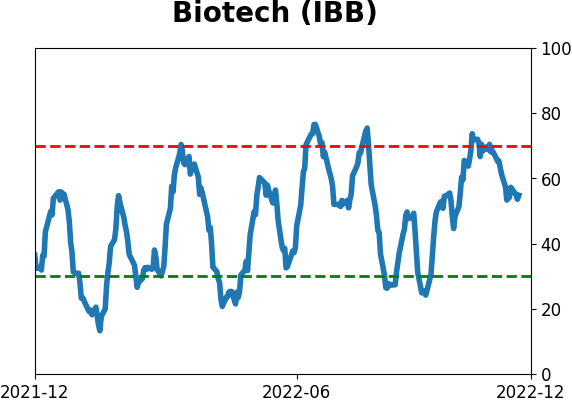
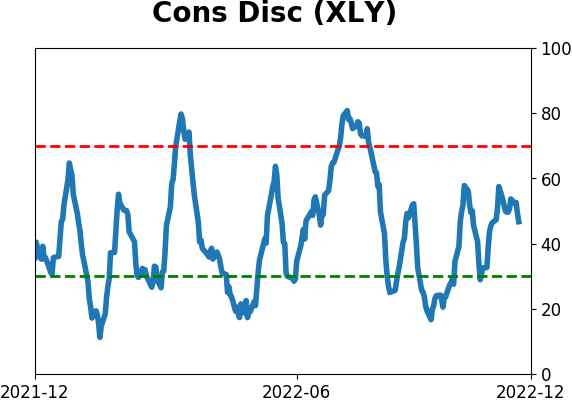
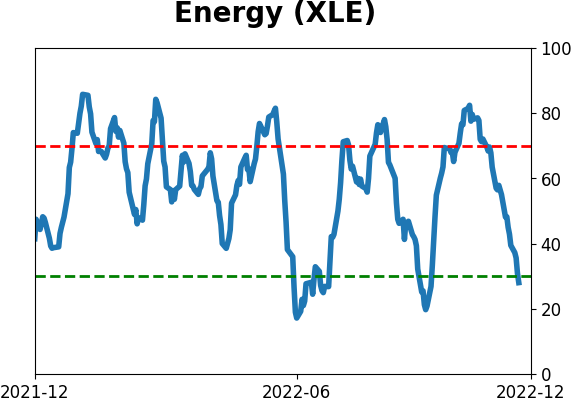
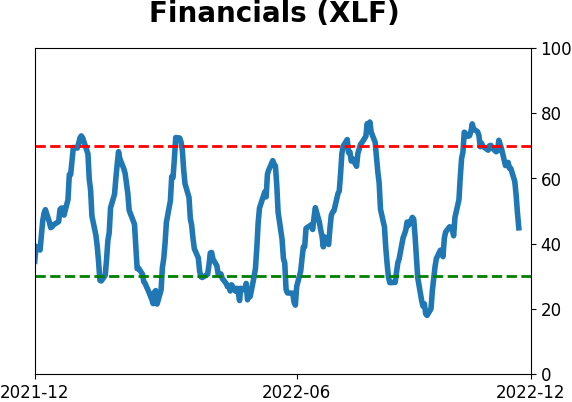
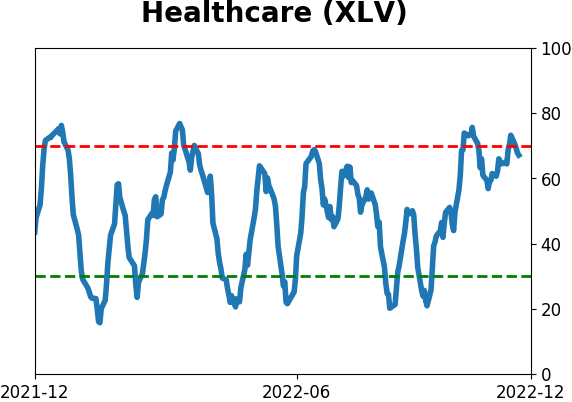
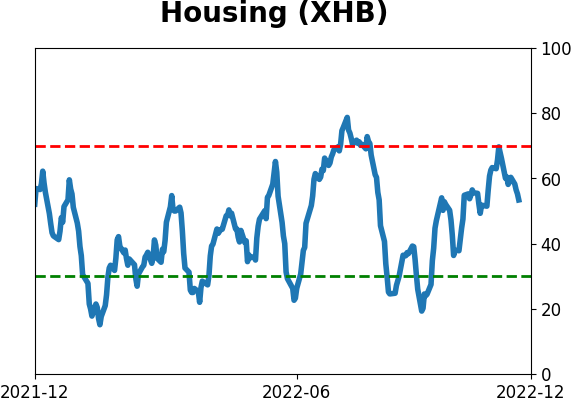
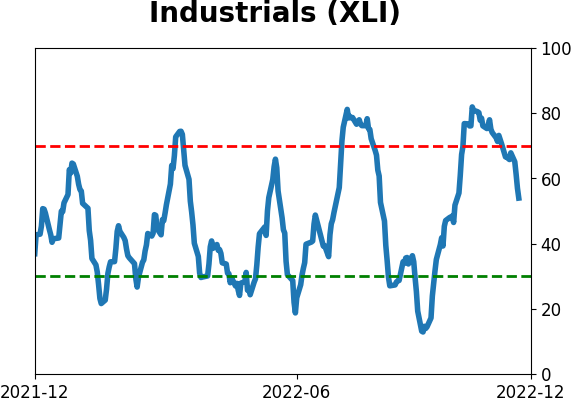
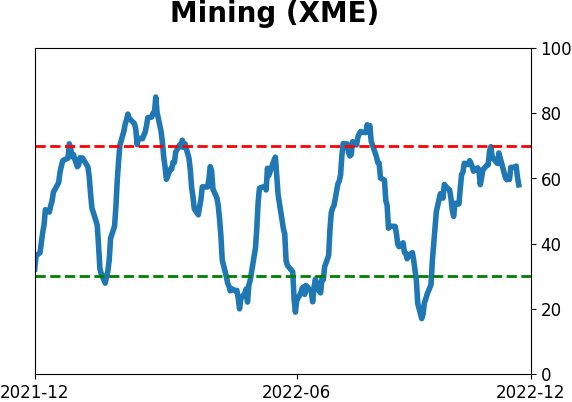
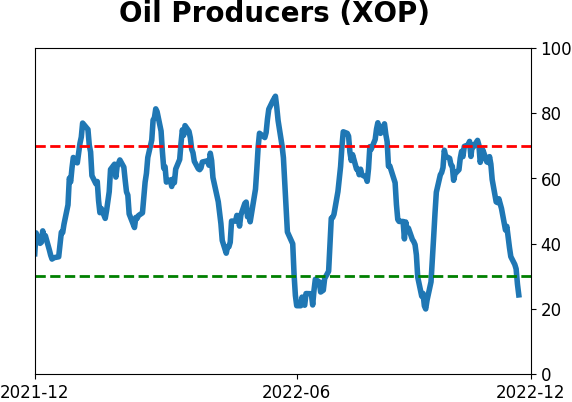
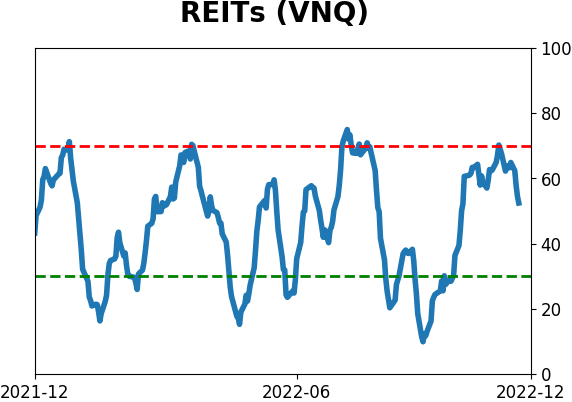
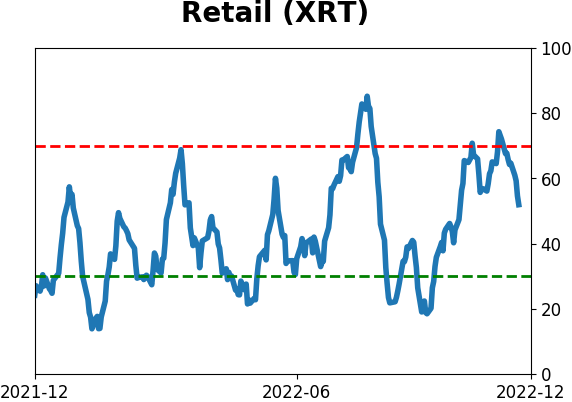
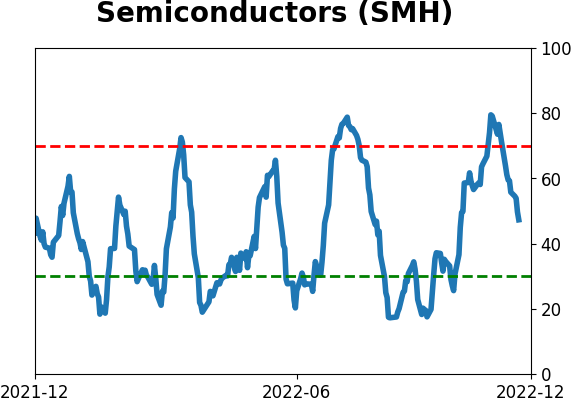
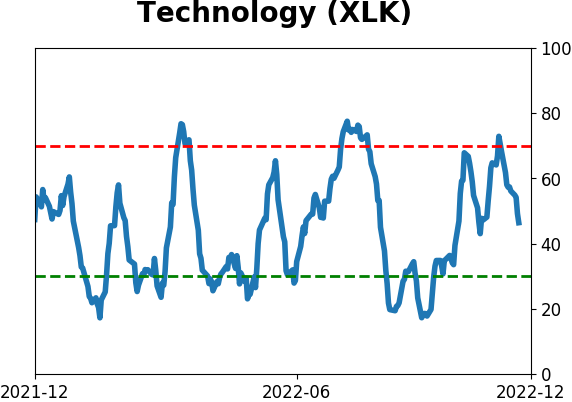
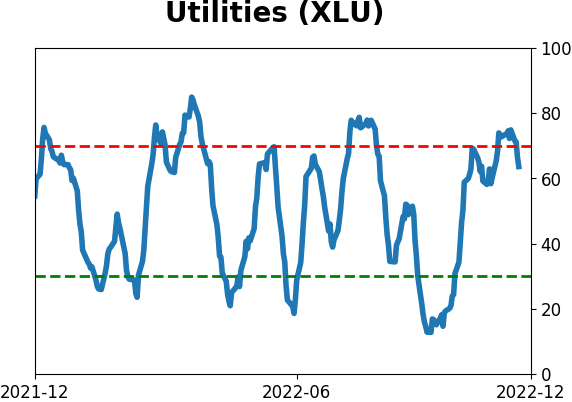
Sector ETF's - 10-Day Moving Average
|
|
|
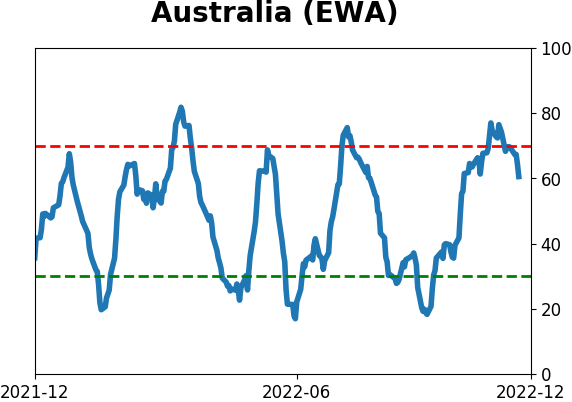
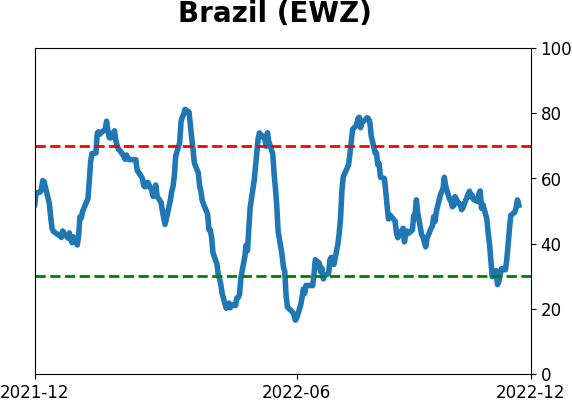
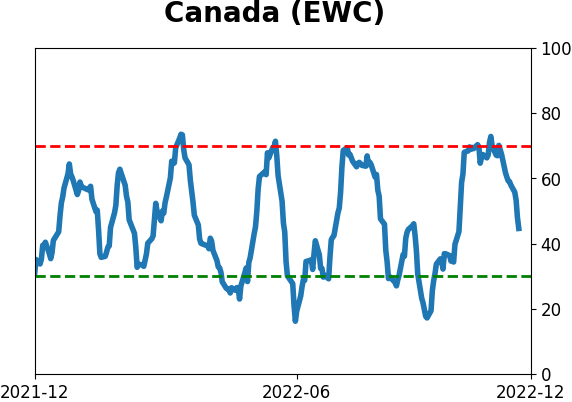
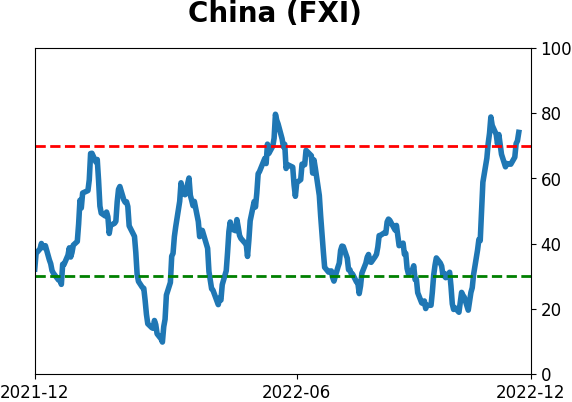
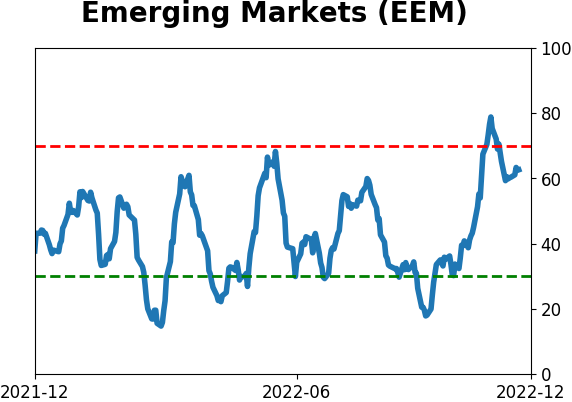
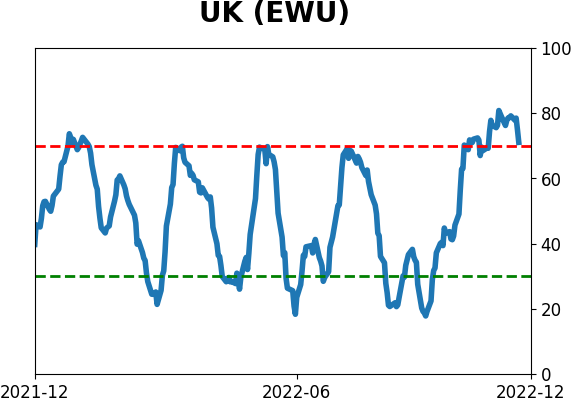
Country ETF's - 10-Day Moving Average
|
|
|
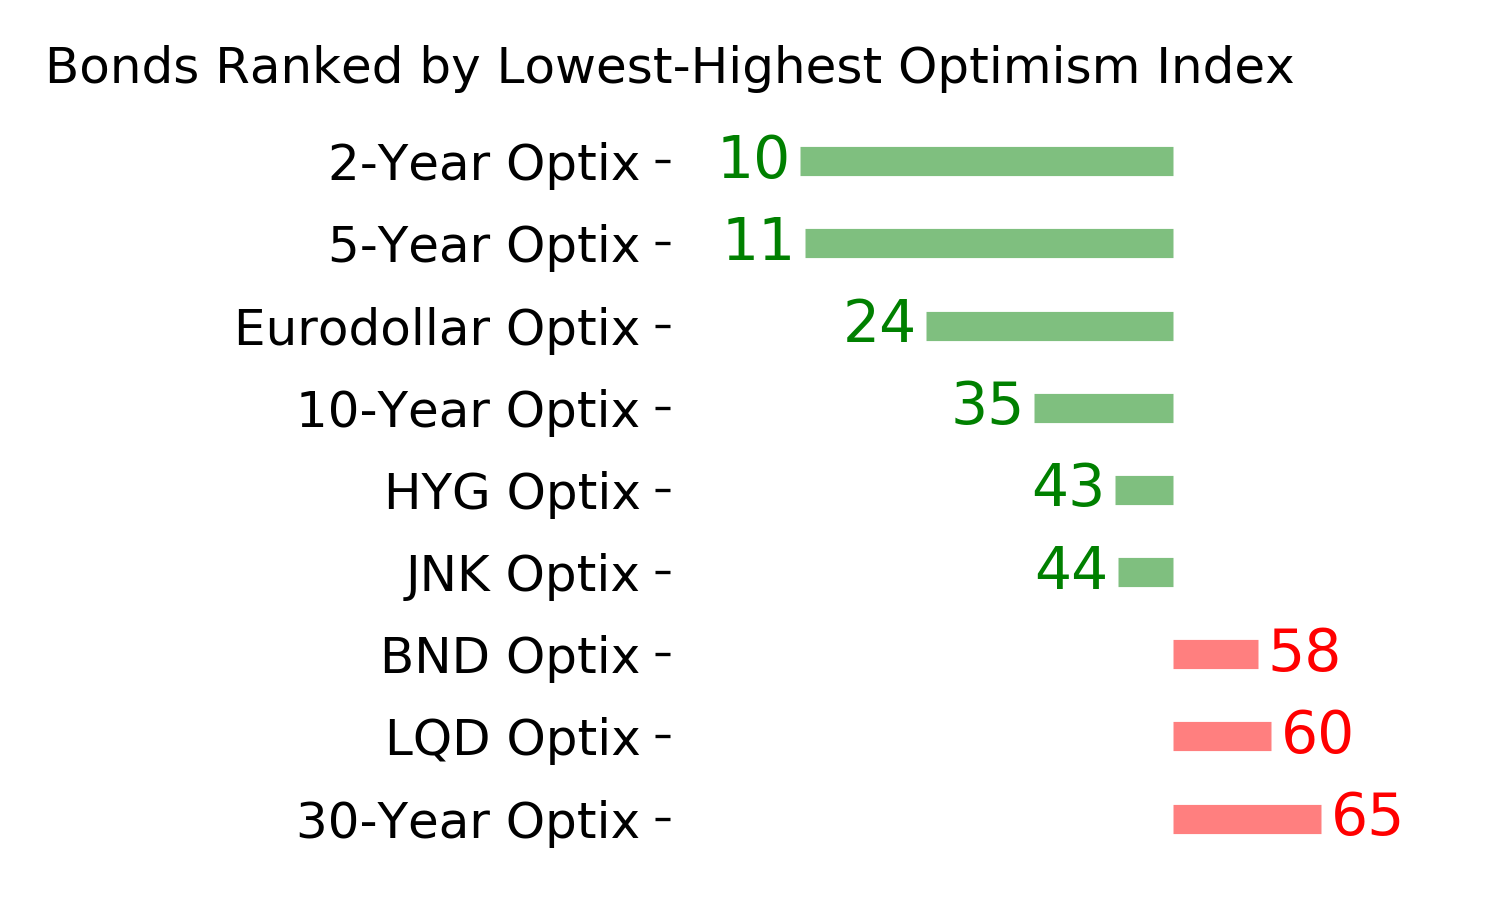
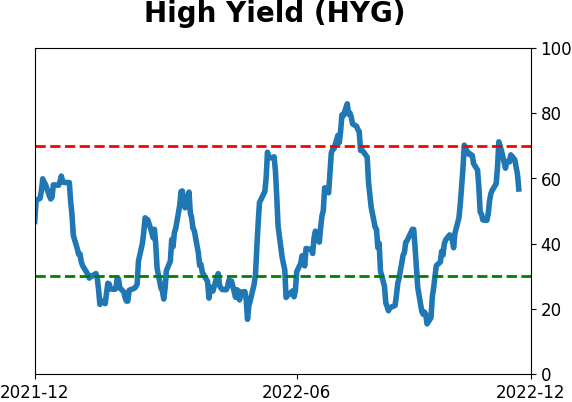
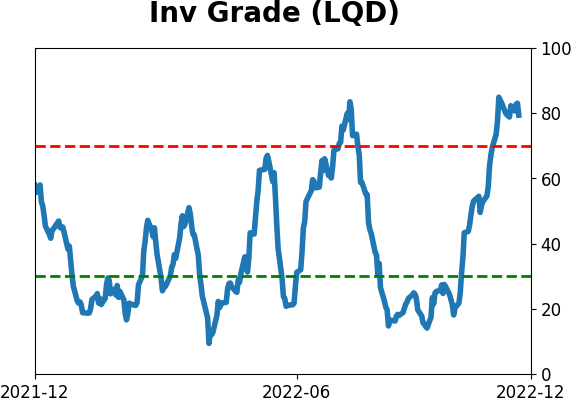
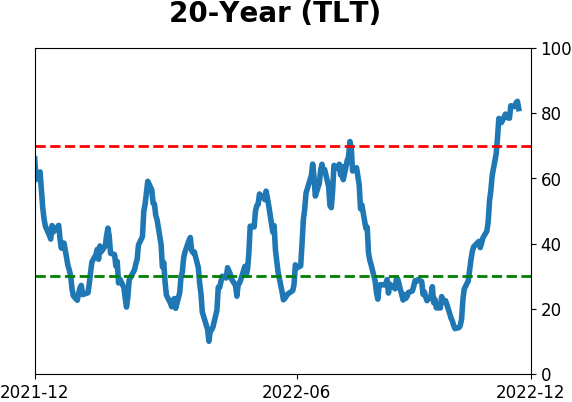
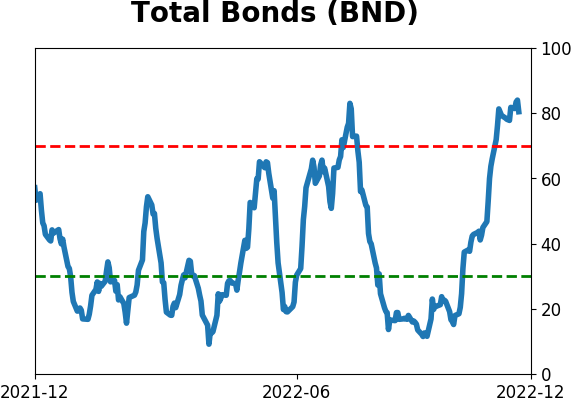
Bond ETF's - 10-Day Moving Average
|
|
|
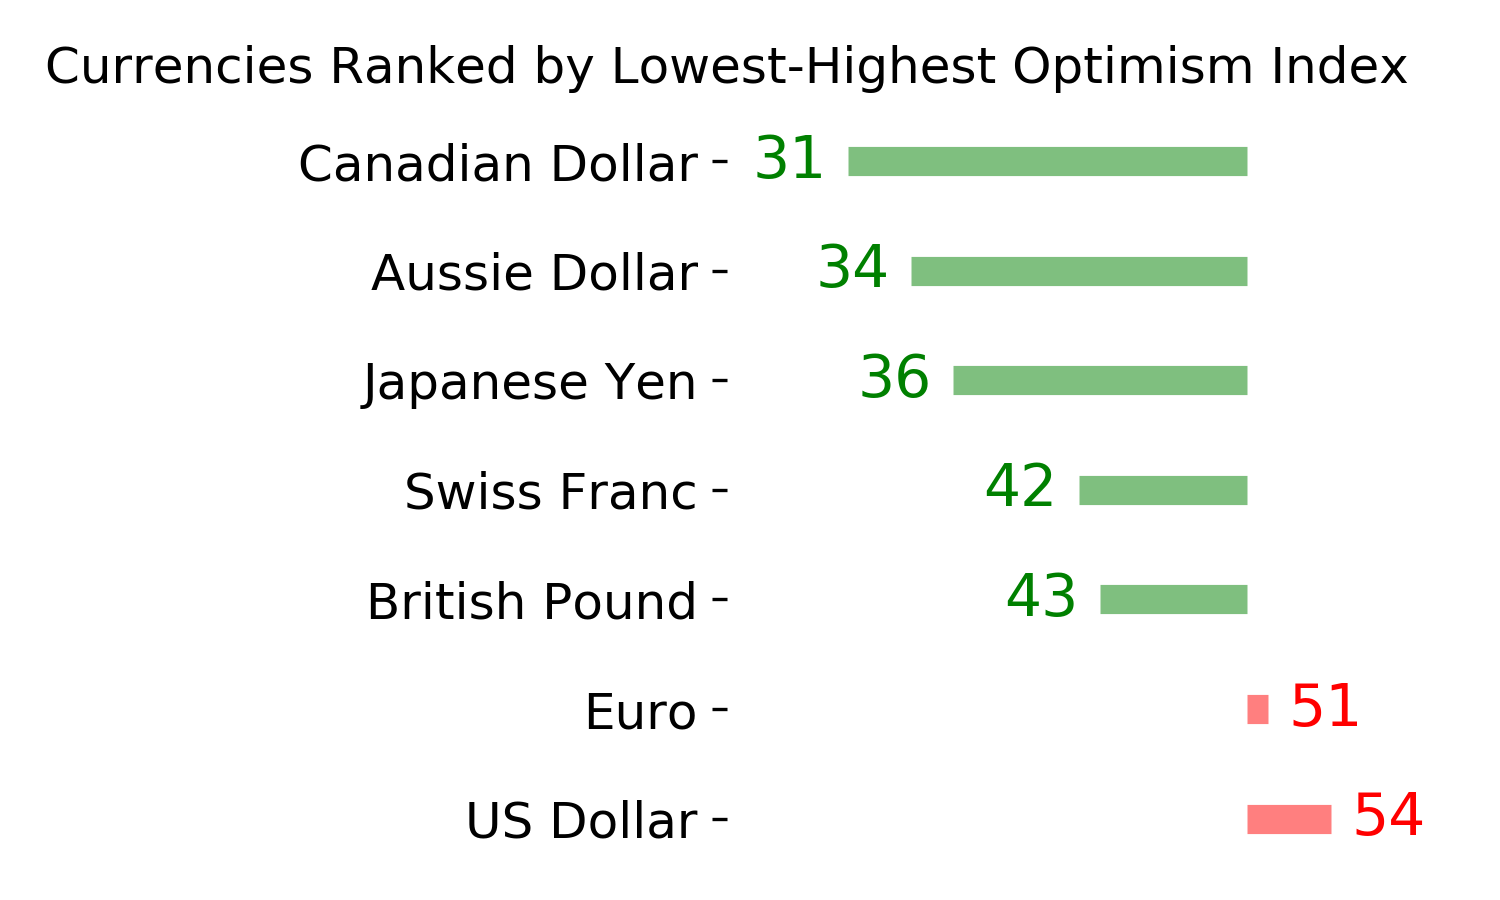
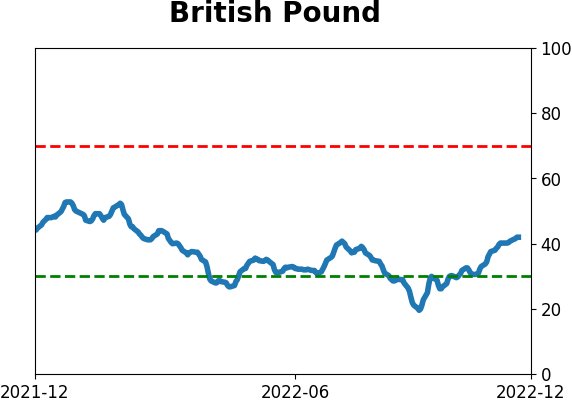
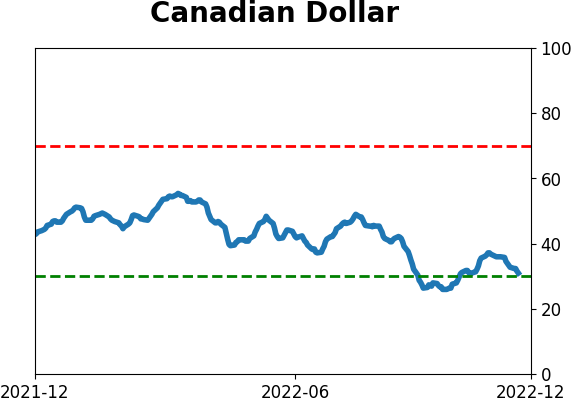
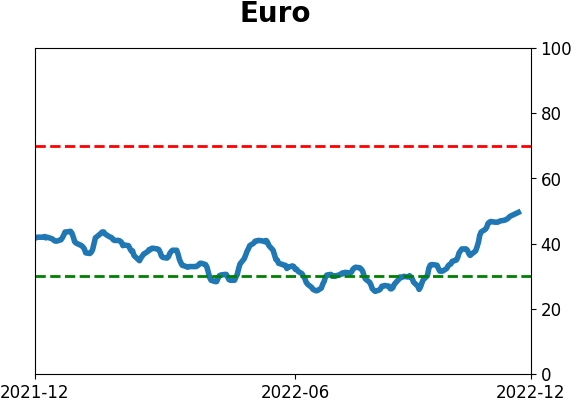
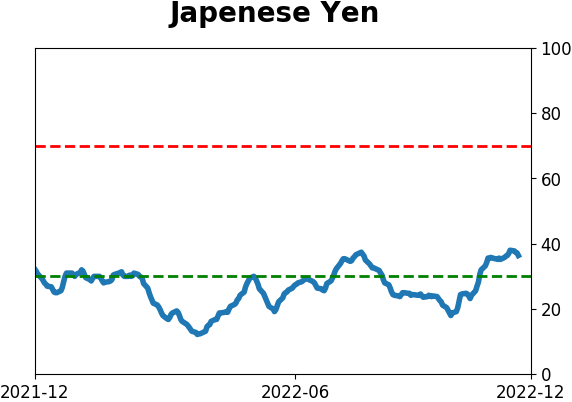
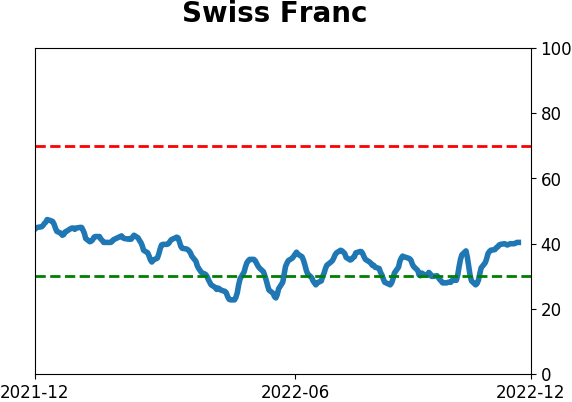
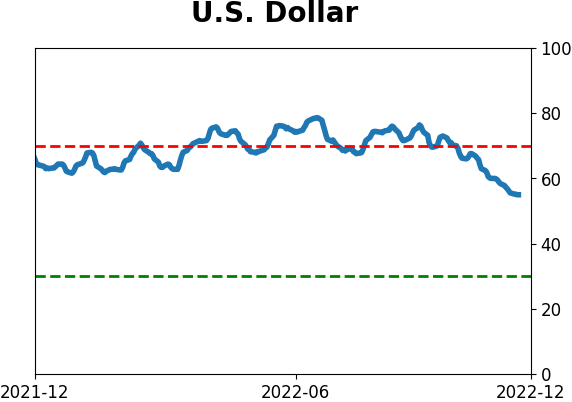
Currency ETF's - 5-Day Moving Average
|
|
|
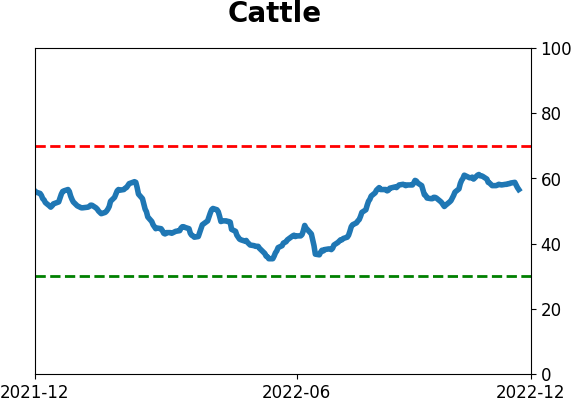
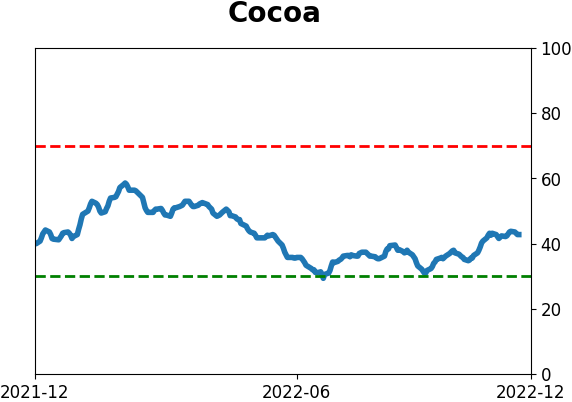
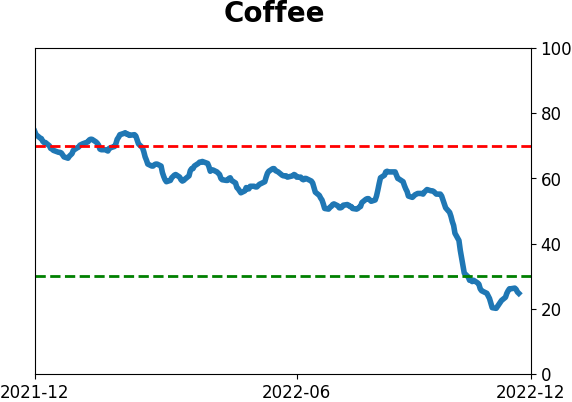
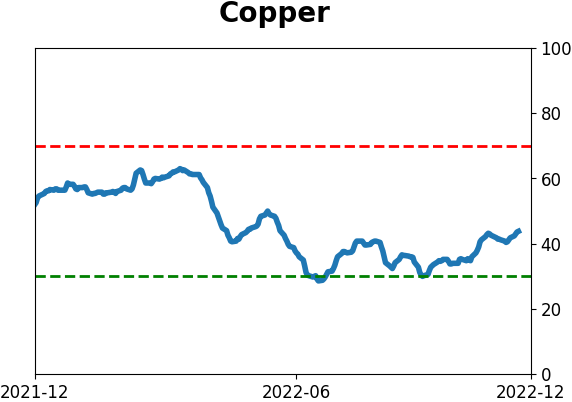
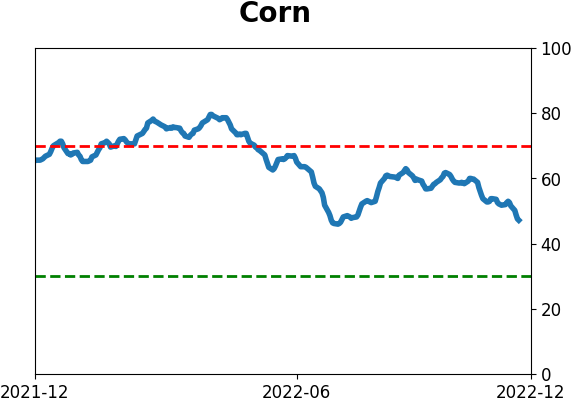
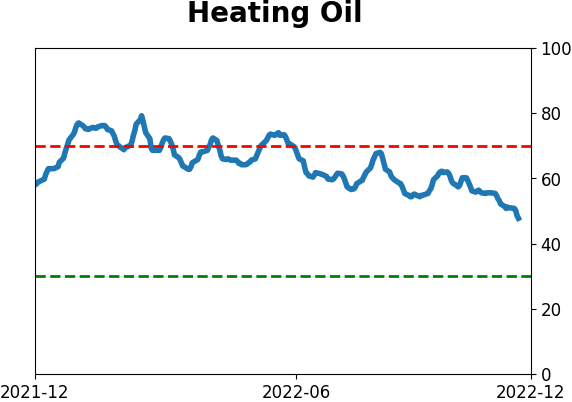
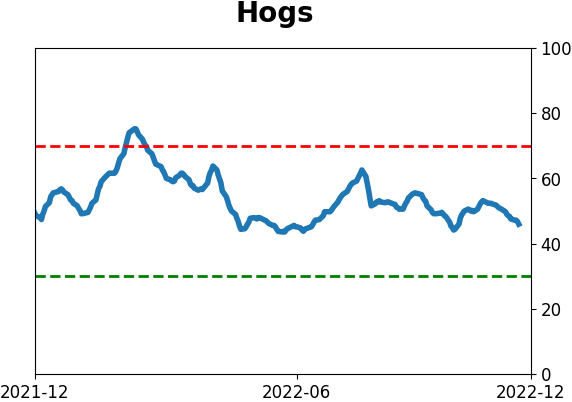
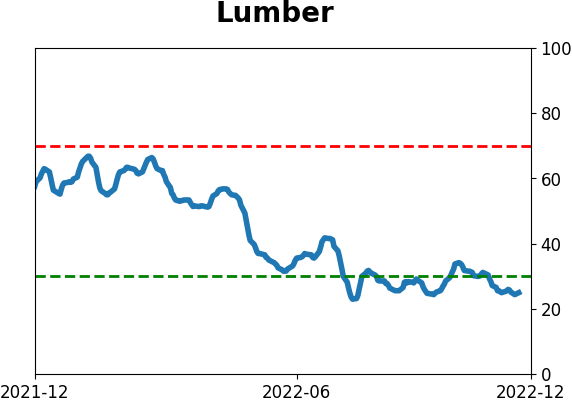
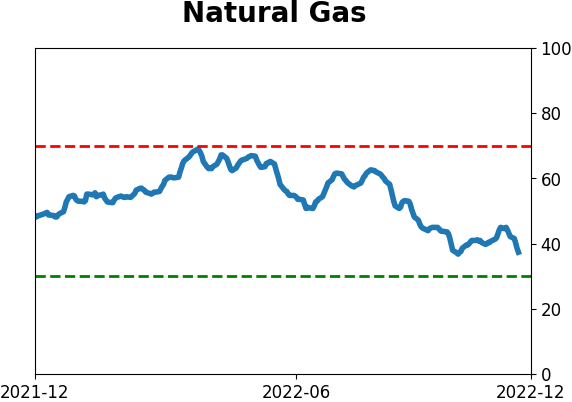
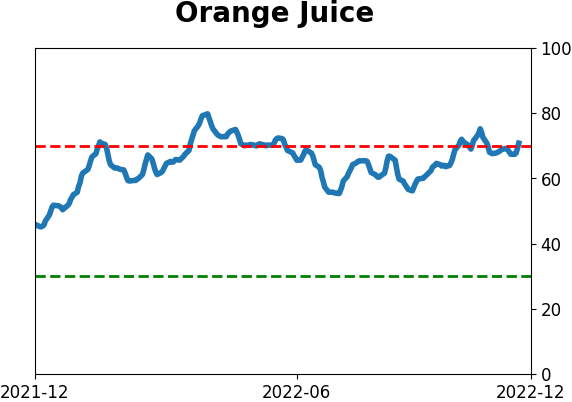
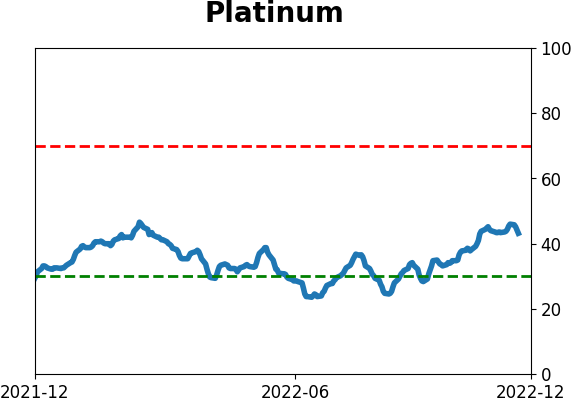
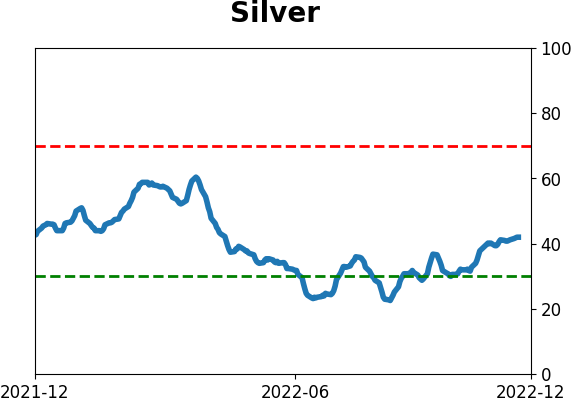
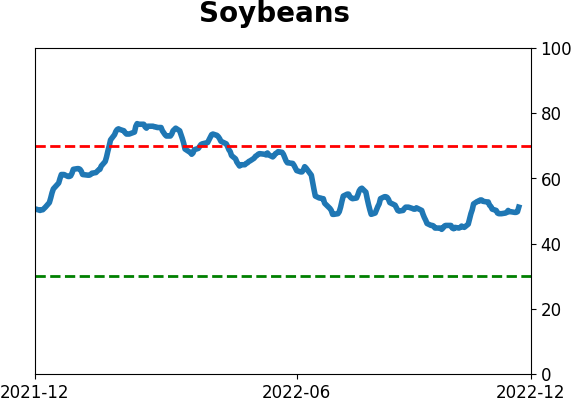
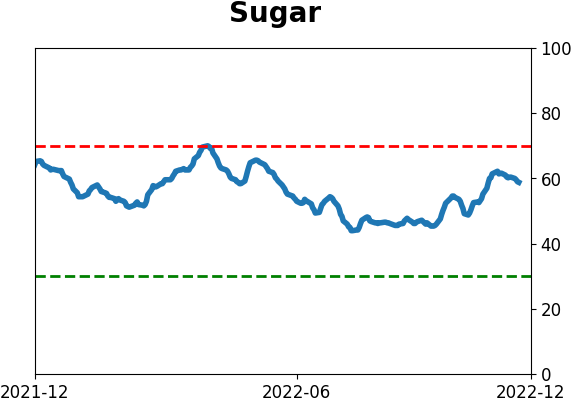
Commodity ETF's - 5-Day Moving Average
|
|