Headlines
|
|
The downtrend in commodities resumes:
The commodities market experienced a significant downturn on Wednesday, marked by a notable increase in new lows. The expansion in new lows suggests the Bloomberg Spot Commodity Index will resume the downtrend that began in June 2022, and the Energy and Materials sectors could struggle.
|
Smart / Dumb Money Confidence
|
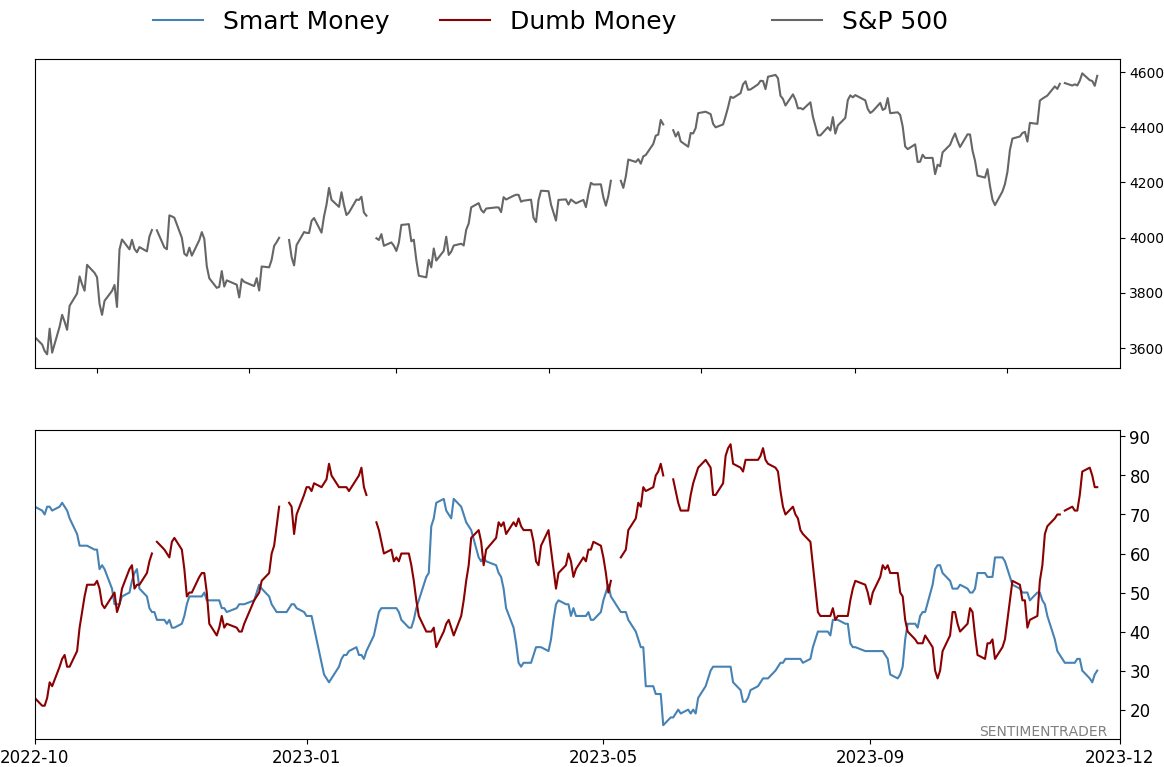
Smart Money Confidence: 30%
Dumb Money Confidence: 77%
|
|
Risk Levels
Stocks Short-Term
|
Stocks Medium-Term
|
|
Bonds

|
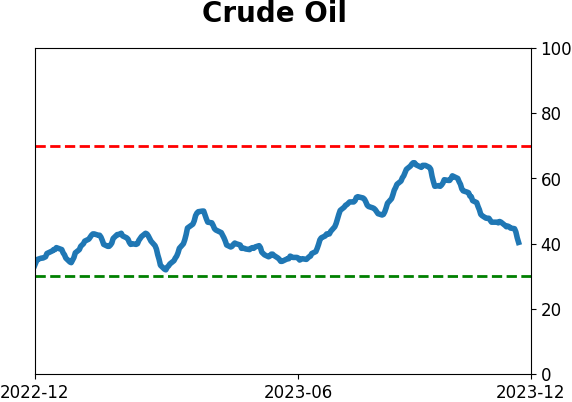
Crude Oil
|
|
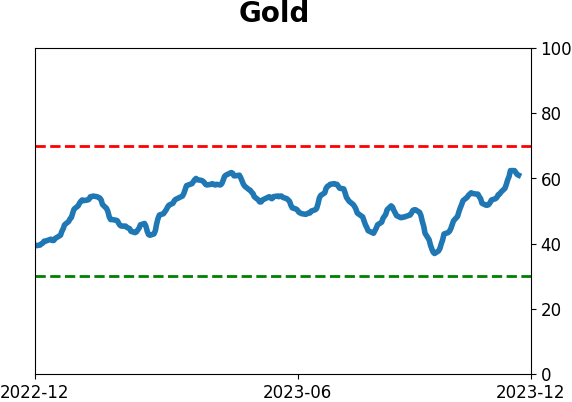
Gold

|
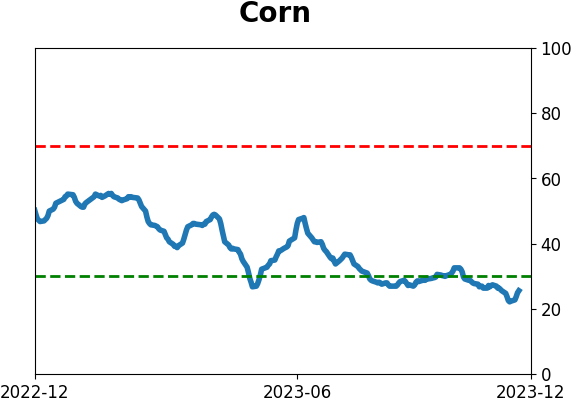
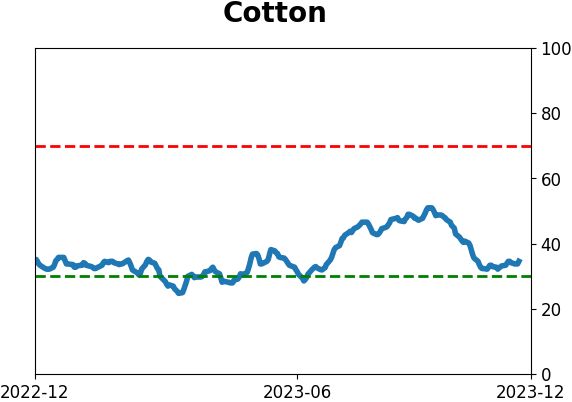
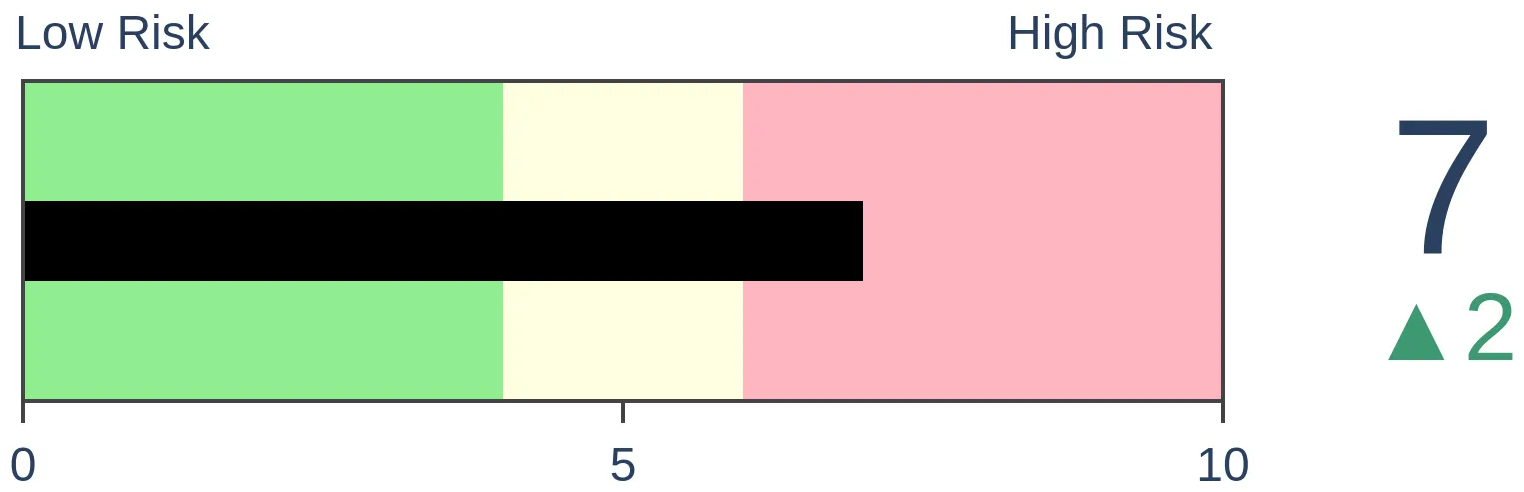
Agriculture
|
|
Research
By Dean Christians
BOTTOM LINE
The commodities market experienced a significant downturn on Wednesday, marked by a notable increase in new lows. The expansion in new lows suggests the Bloomberg Spot Commodity Index will resume the downtrend that began in June 2022, and the Energy and Materials sectors could struggle.
FORECAST / TIMEFRAME
None
|
Key points:
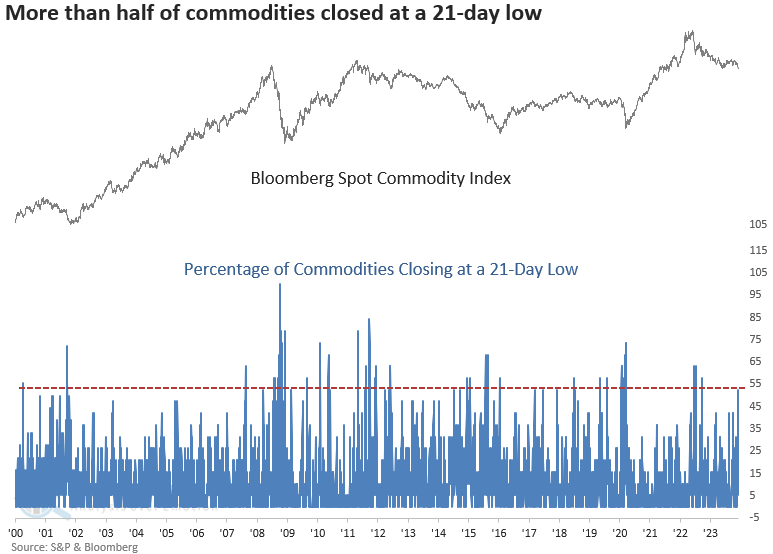
- The percentage of commodities closing at a 21-day low spiked above 50%
- Similar expansions in new lows led to an unfavorable outlook for the Bloomberg Spot Commodity Index
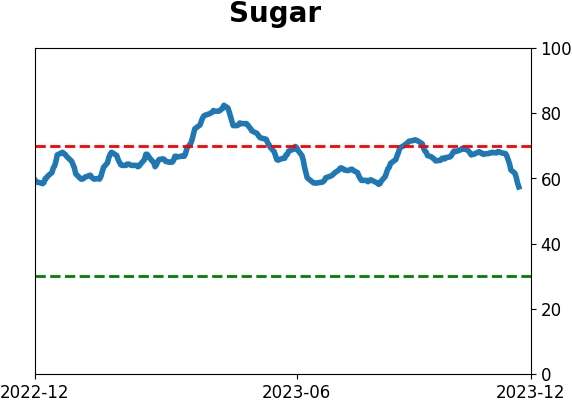
- The steep decline in sugar over the last ten sessions suggests additional downside follow-through
A surge in new lows suggests the downtrend in commodities will persist
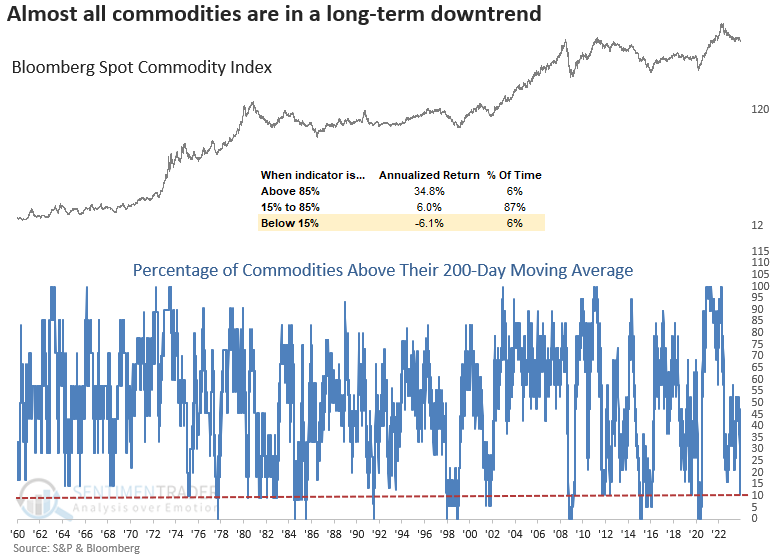
In September, the Bloomberg Spot Commodity Index closed above its 200-day average for the first time in a year. Historically, long-term trend change signals after an extended period below the average tend to represent bullish turns.
At the time, energy, the largest weighting in the index, was driving the positive price action. Under the surface, participation was lacking, with fewer than 50% of commodities trading above their 200-day average, which I noted as a concern.
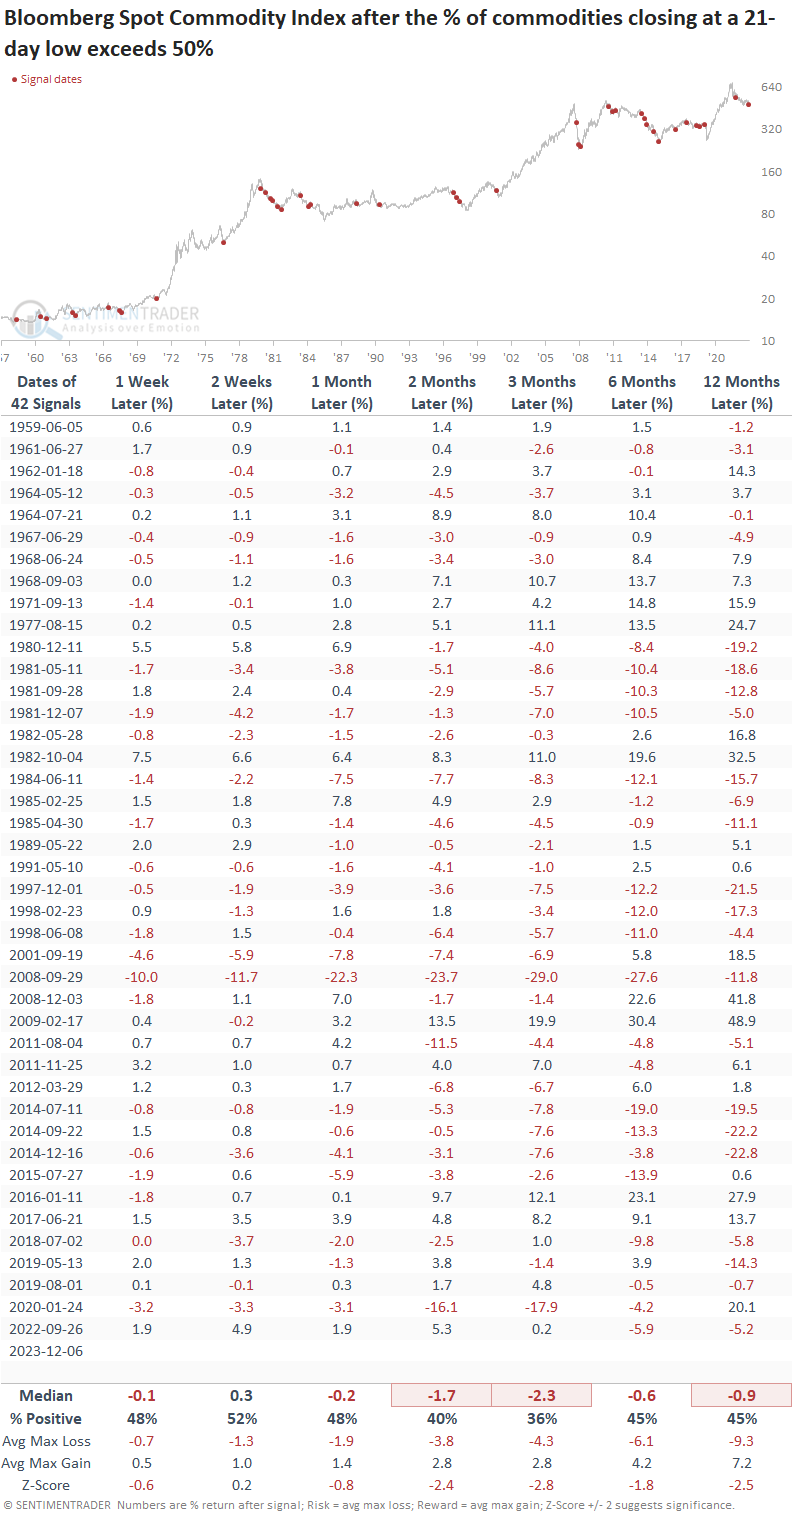
Since the trend change signal, the Bloomberg Spot Commodity Index bounced around in a range until Wednesday, when it broke lower and closed at a new 1-year low. In doing so, the percentage of commodities registering a 21-day low soared above 50%, reaching the highest level since the peak in the commodity index in 2022.
Similar expansions in 21-day lows preceded negative returns
When the Bloomberg Spot Commodity Index resides below its 200-day average, like now, and the percentage of commodities closing at a 21-day low spikes above 50%, the outlook for the commodity index suggests the long-term downtrend will persist.
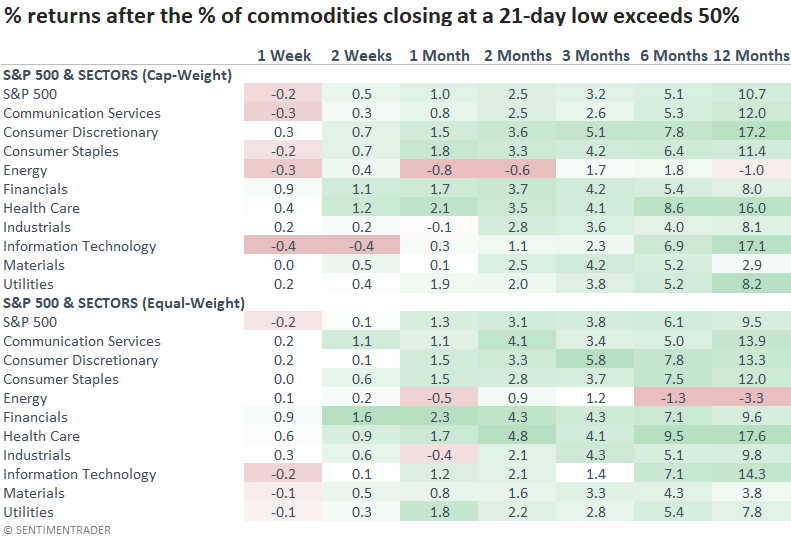
The read-through for stocks
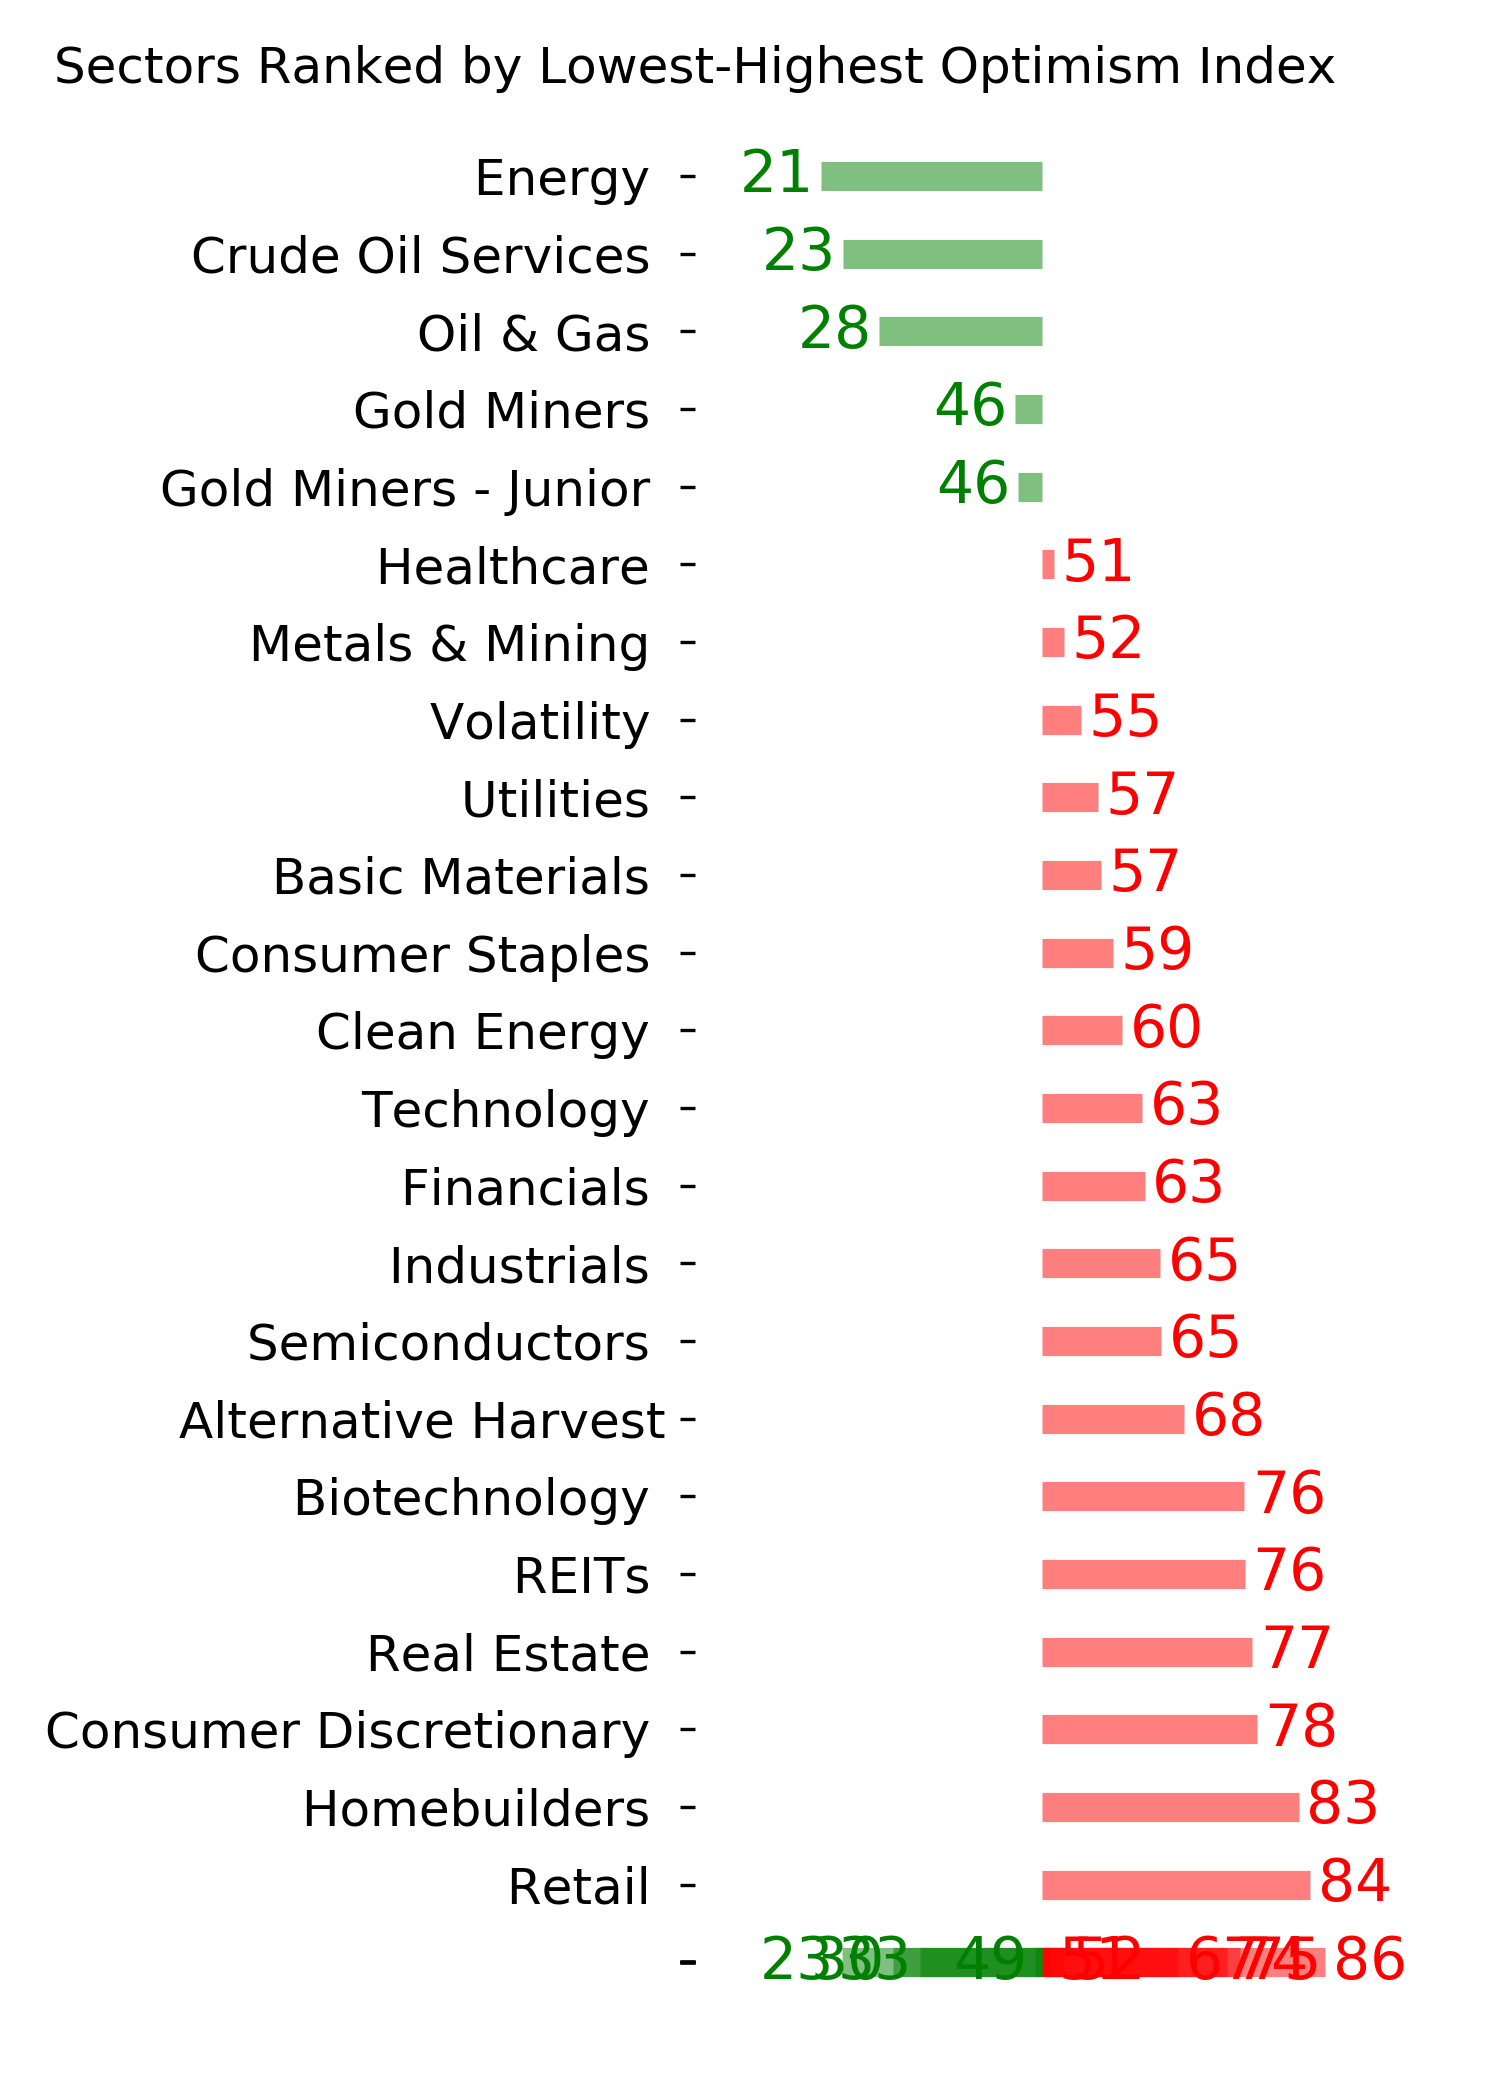
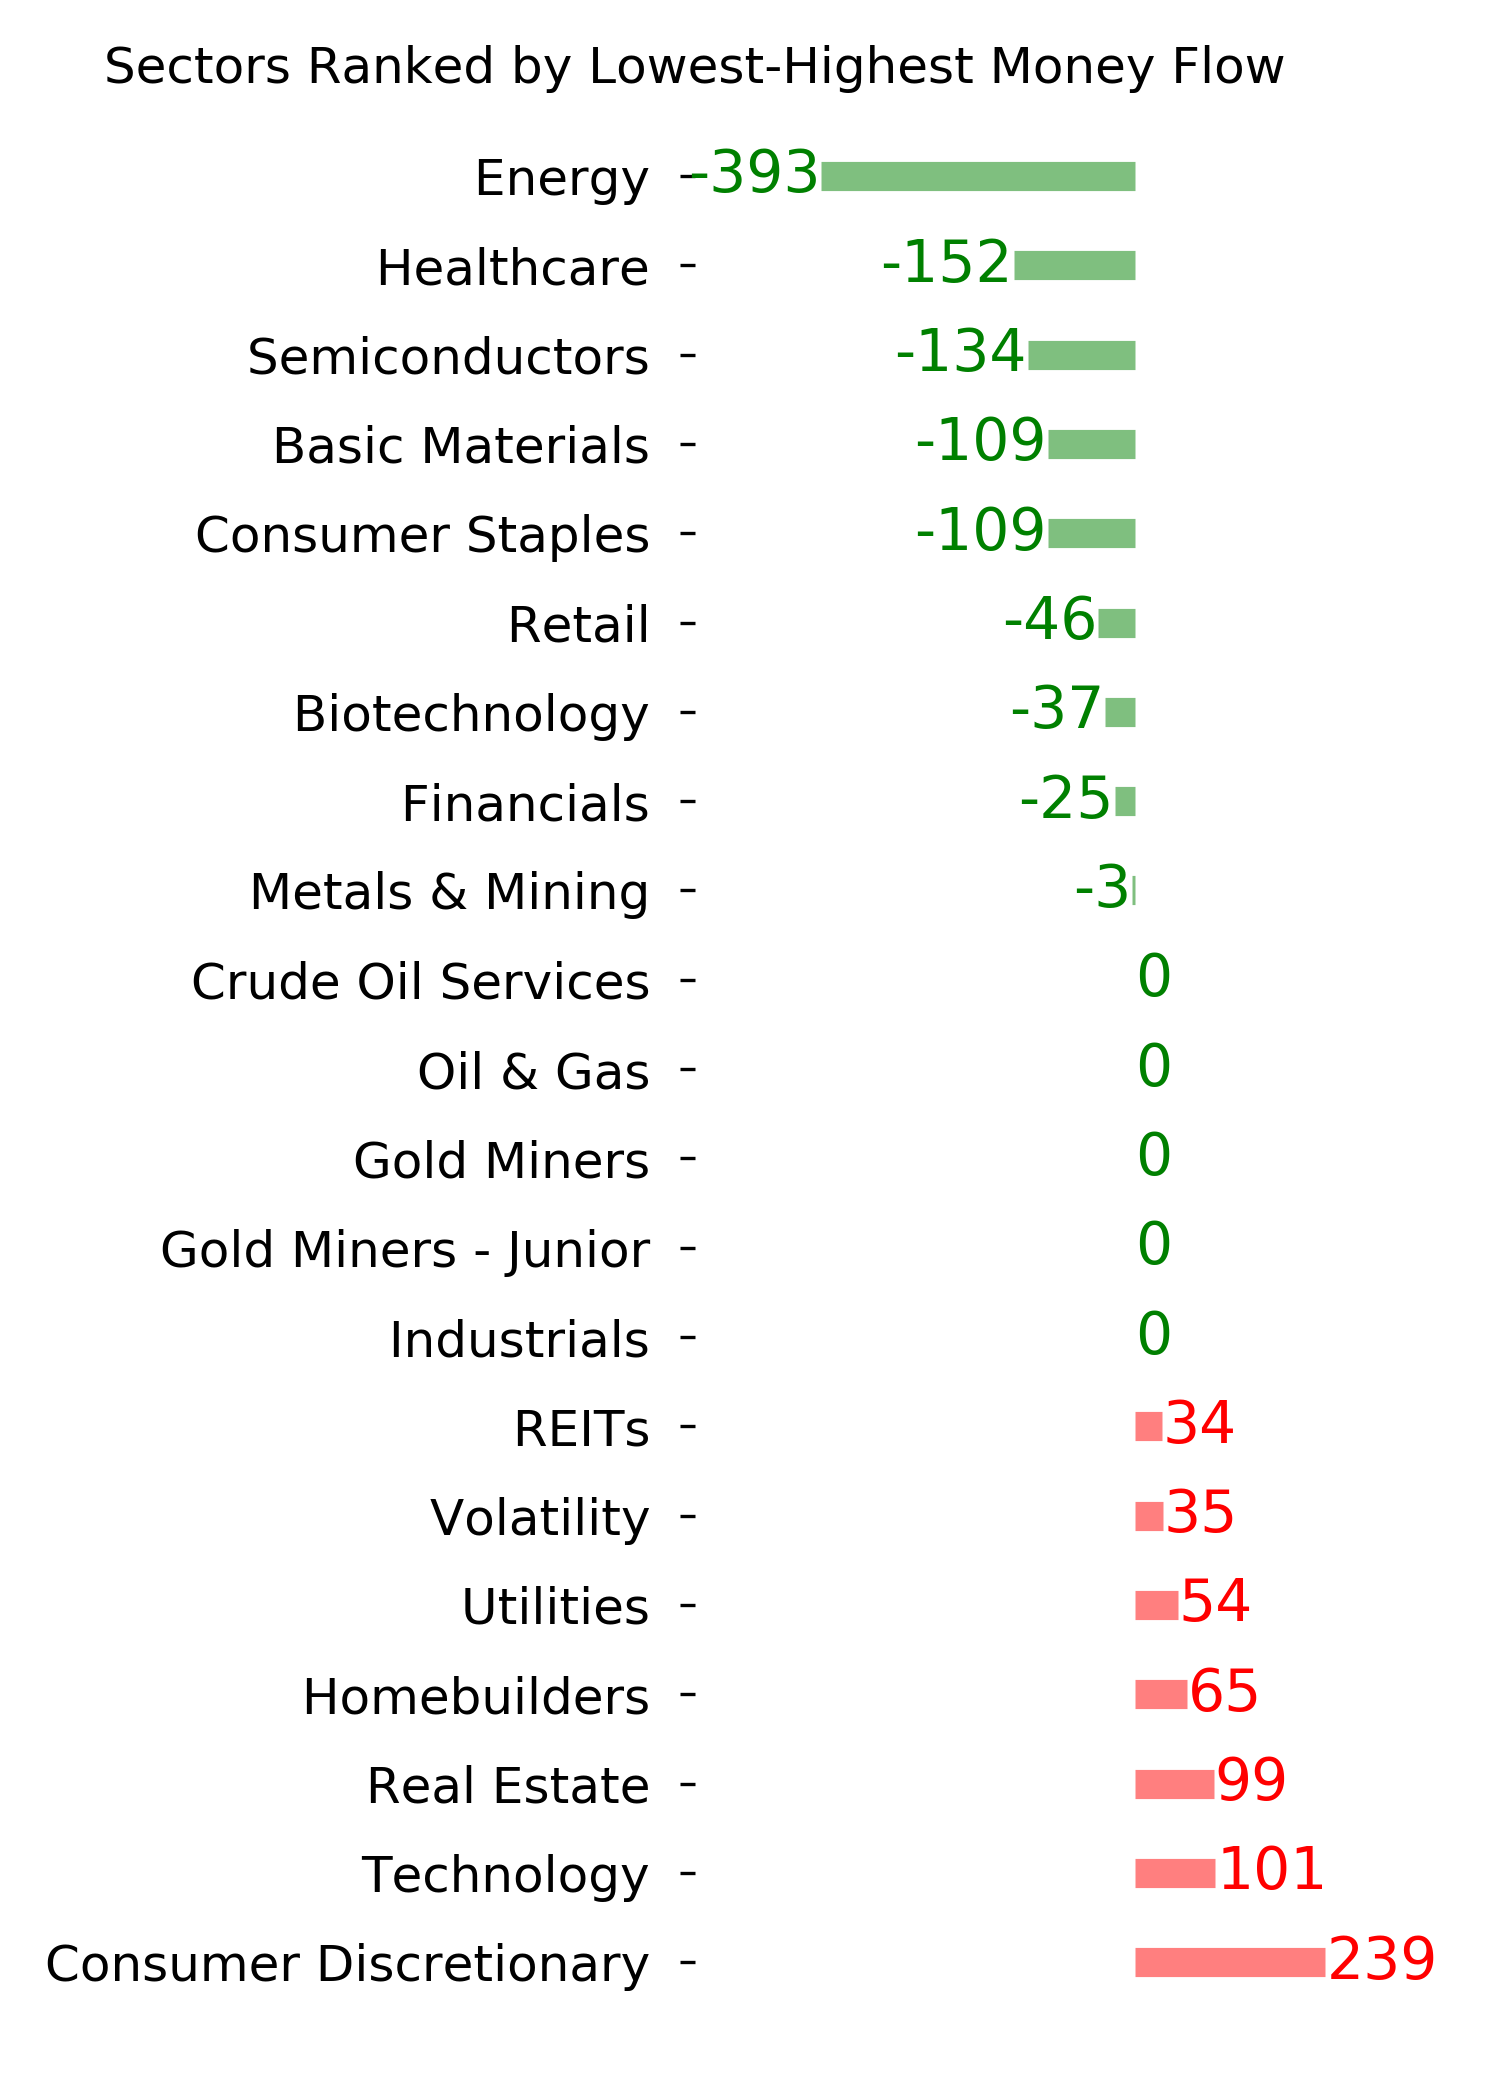
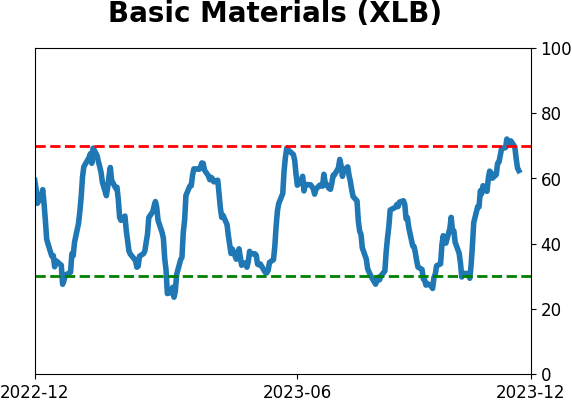
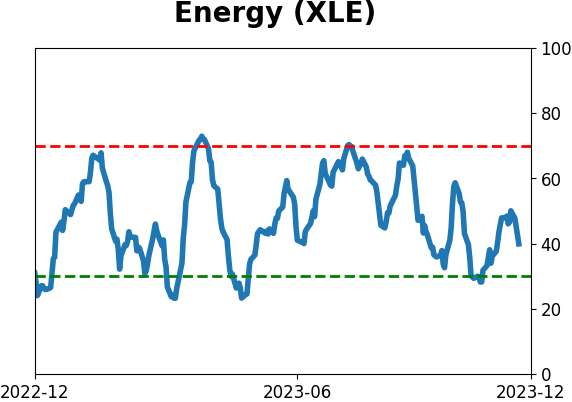
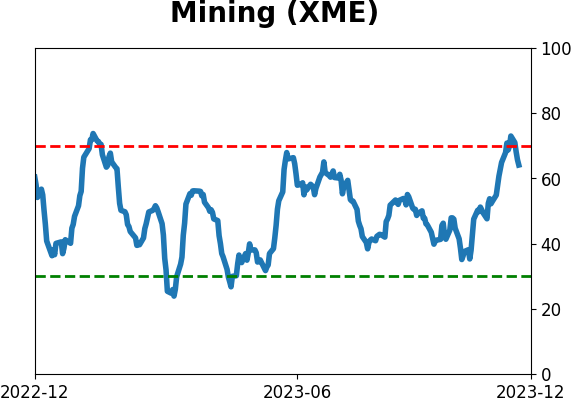
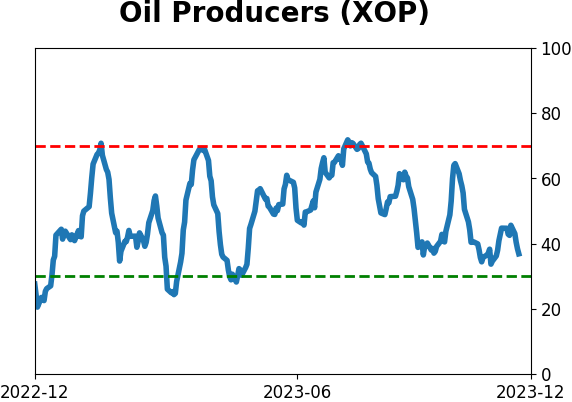
Commodity-based sectors such as Energy and Materials struggle across all time frames when most commodities register new lows in a downtrend.
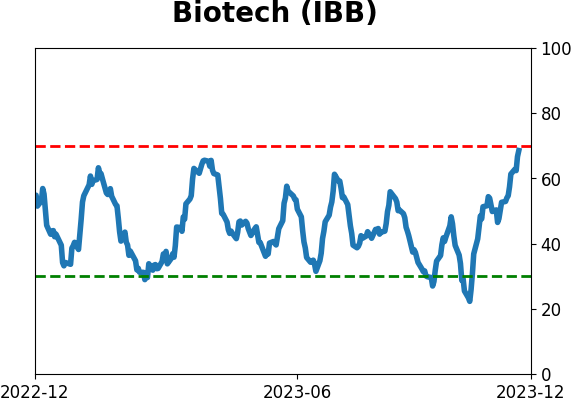
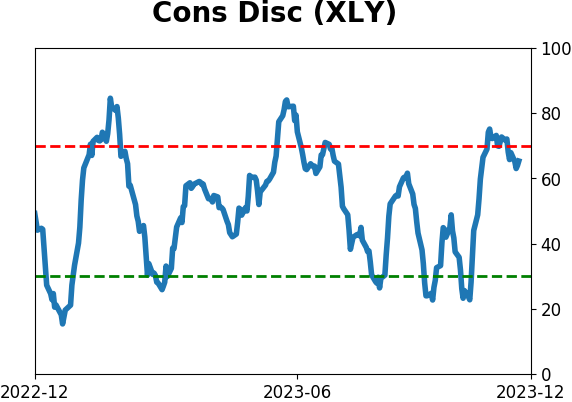
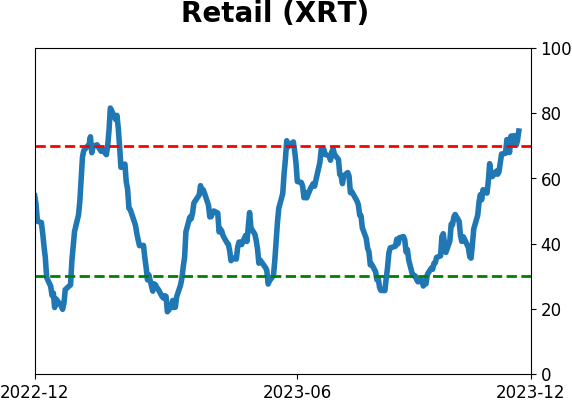
Conversely, growth-oriented groups like Consumer Discretionary and Technology thrive over the subsequent year.
A historical perspective on long-term downtrends
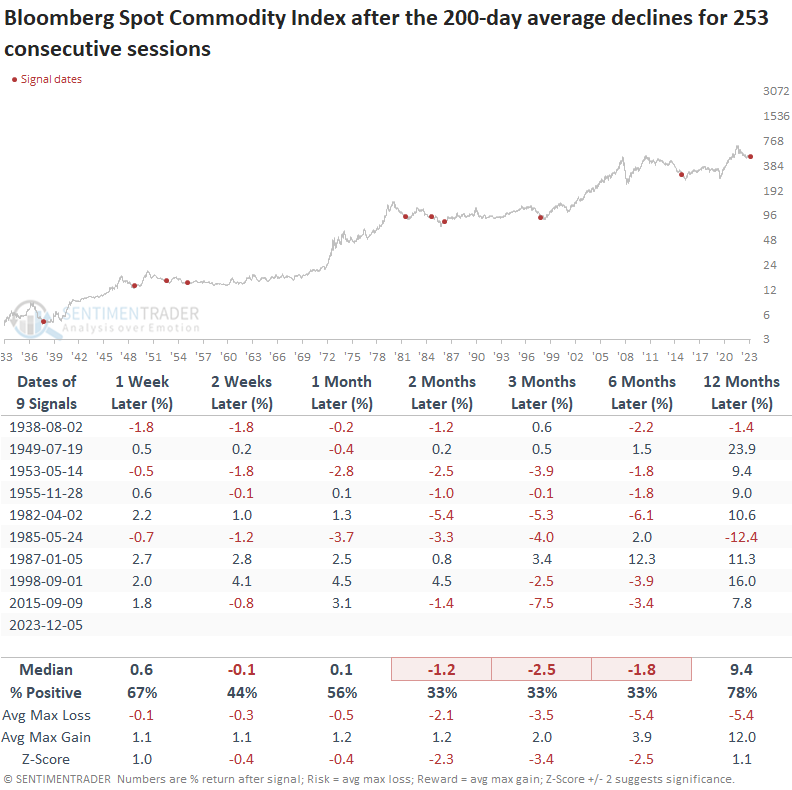
The 200-day moving average for the Bloomberg Spot Commodity Index has declined for a year, registering the 10th most prolonged count in history.
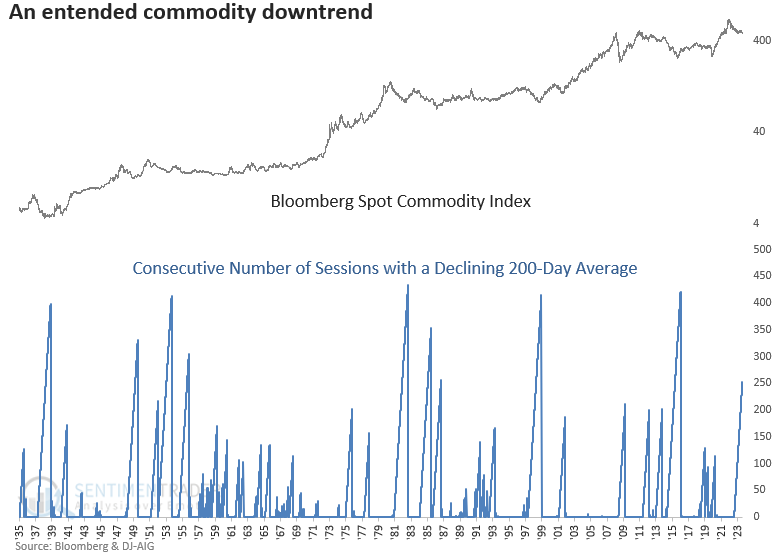
Even though the Bloomberg Spot Commodity Index has been in a downtrend for an extended period, there remains a distinct risk of experiencing additional downside price action over the subsequent six months.
Commodity breadth
The percentage of commodities trading above their 200-day moving average declined to 10%, reaching the lowest level since the Covid crash.
Comparable levels were associated with negative annualized returns for the Bloomberg Spot Commodity Index.
A swift decline in sugar
One of the more pronounced declines for all the commodities included in our breadth series occurred in sugar. It fell 16% in ten sessions, a swoon not seen since the Covid drawdown.
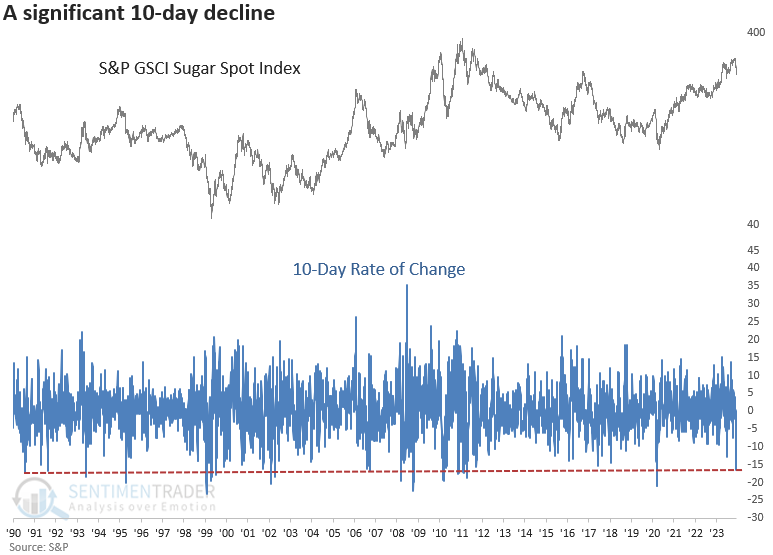
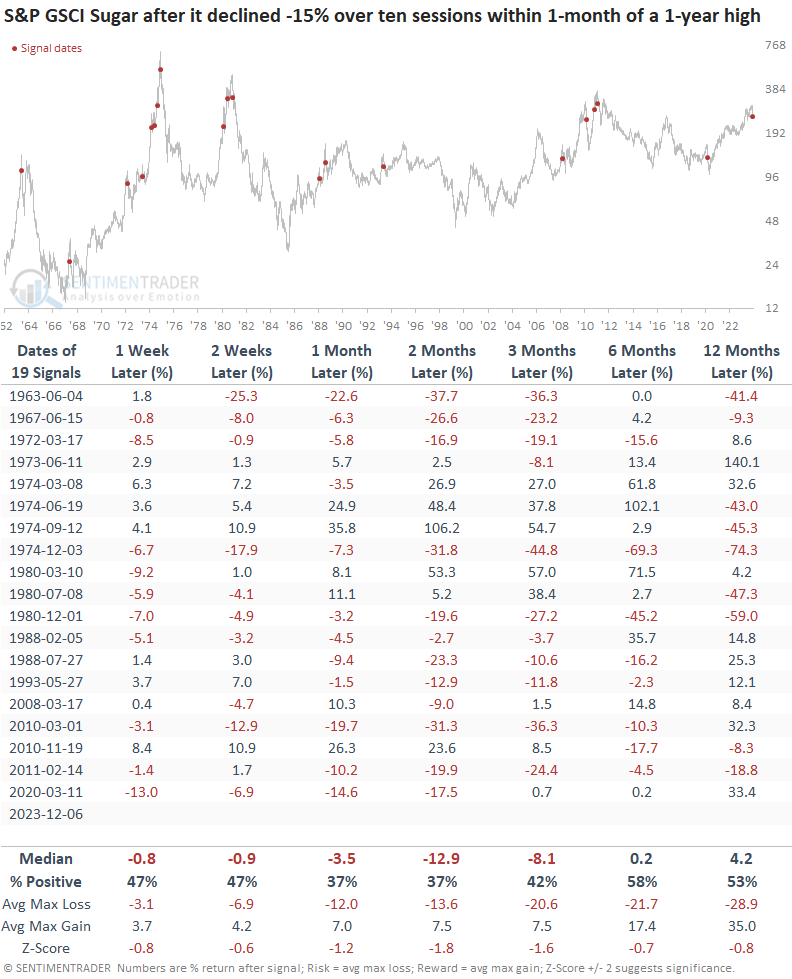
Whenever sugar prices dropped by 15% or more in ten sessions, and within a month of hitting a 1-year high, the negative price momentum tended to beget more negative momentum over the subsequent three months.
What the research tells us...
After consolidating for six months, the Bloomberg Spot Commodity Index breached support, concluding the period by closing at a fresh one-year low. The decline in commodity prices triggered an uptick in new lows, indicating a revival of the long-term downtrend initiated in June 2022. Given the current challenges facing commodities, investors should use extreme caution when considering allocations to sectors closely tied to them, such as energy and materials. One of the more pronounced declines occurred in sugar when it dropped 16% in ten days. Similar swoons led to additional downside.
Indicators at Extremes
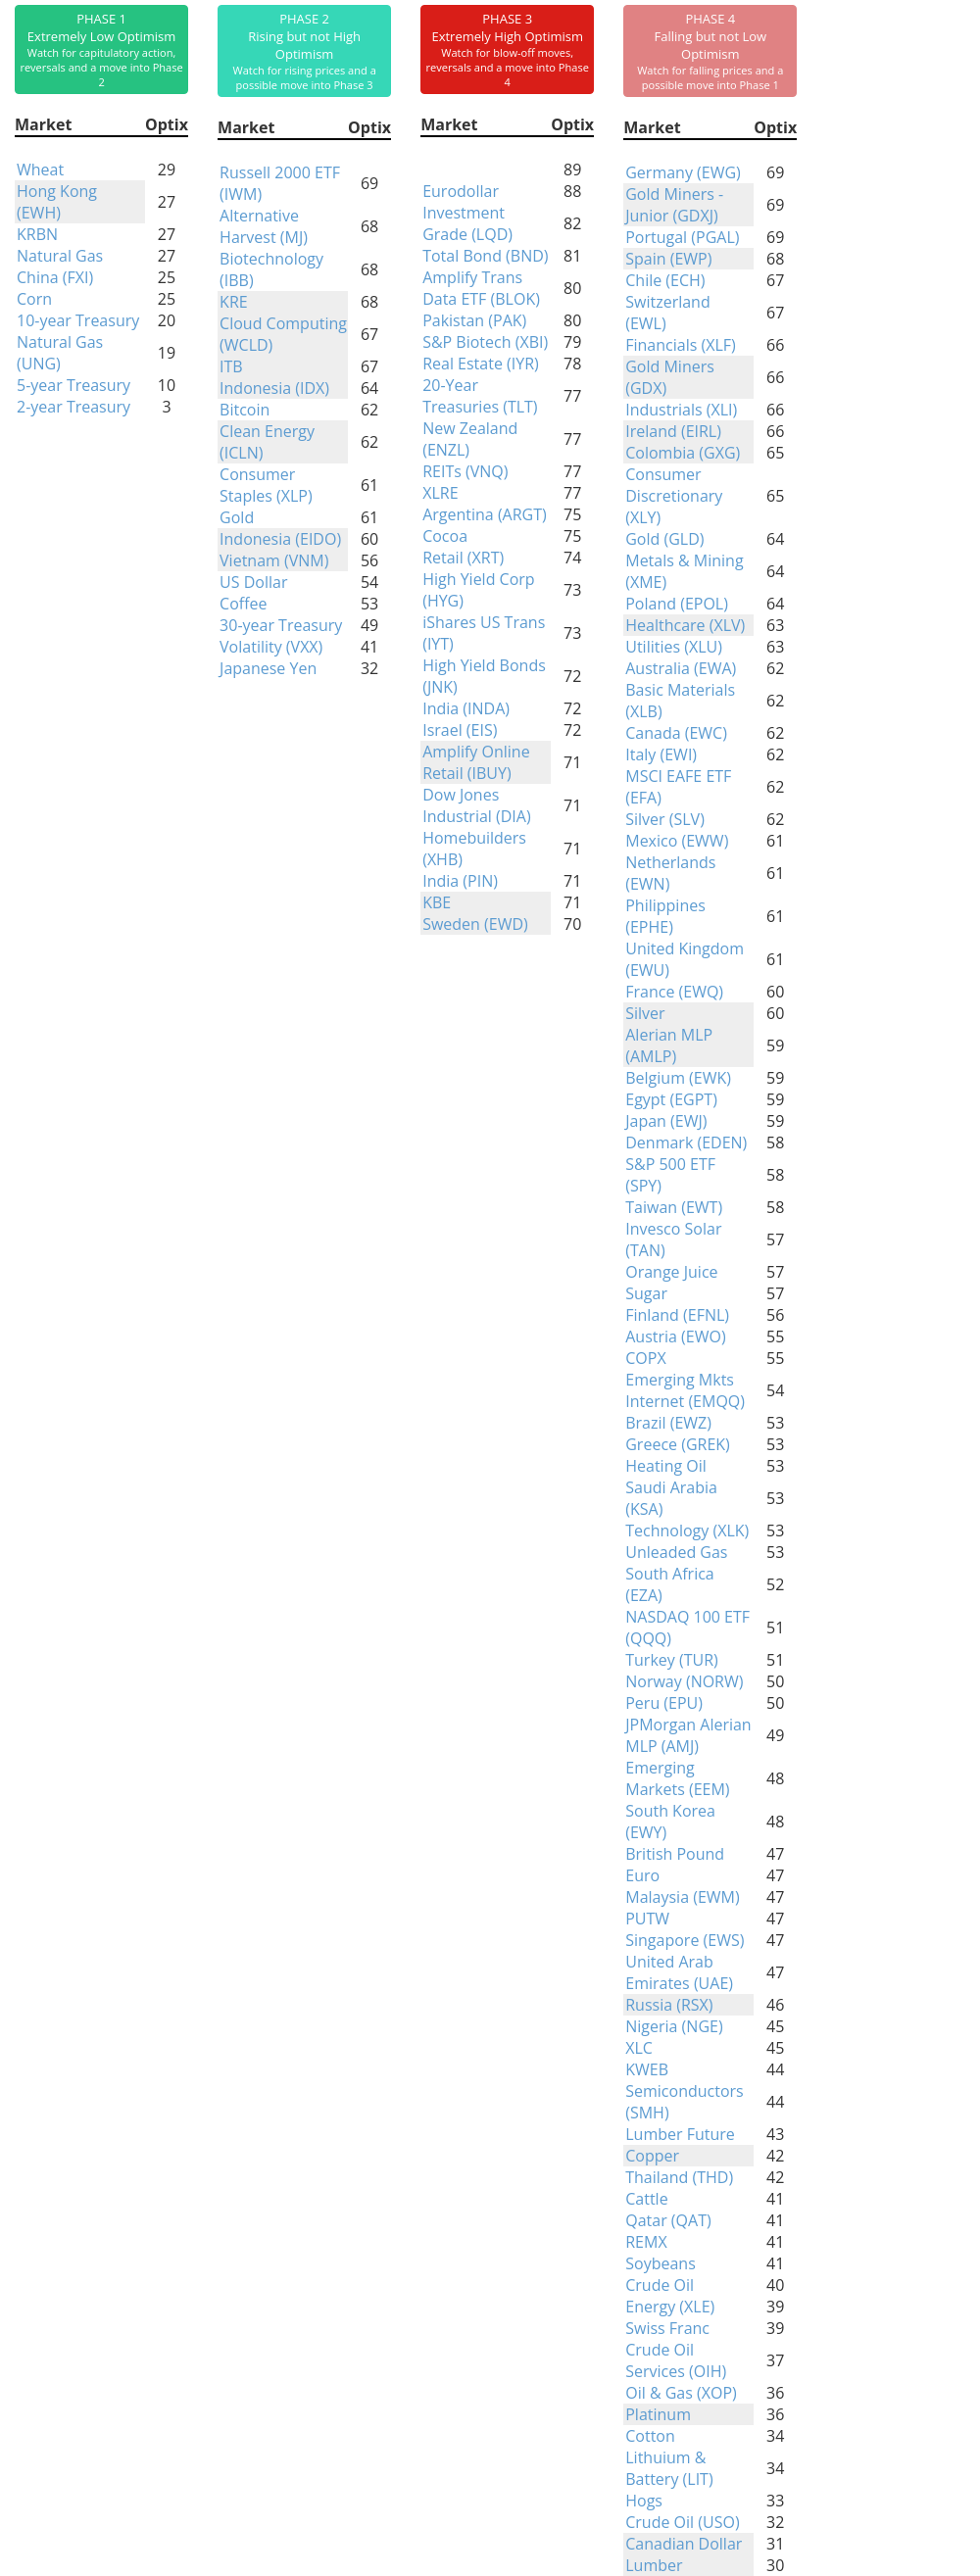
Phase Table
Ranks
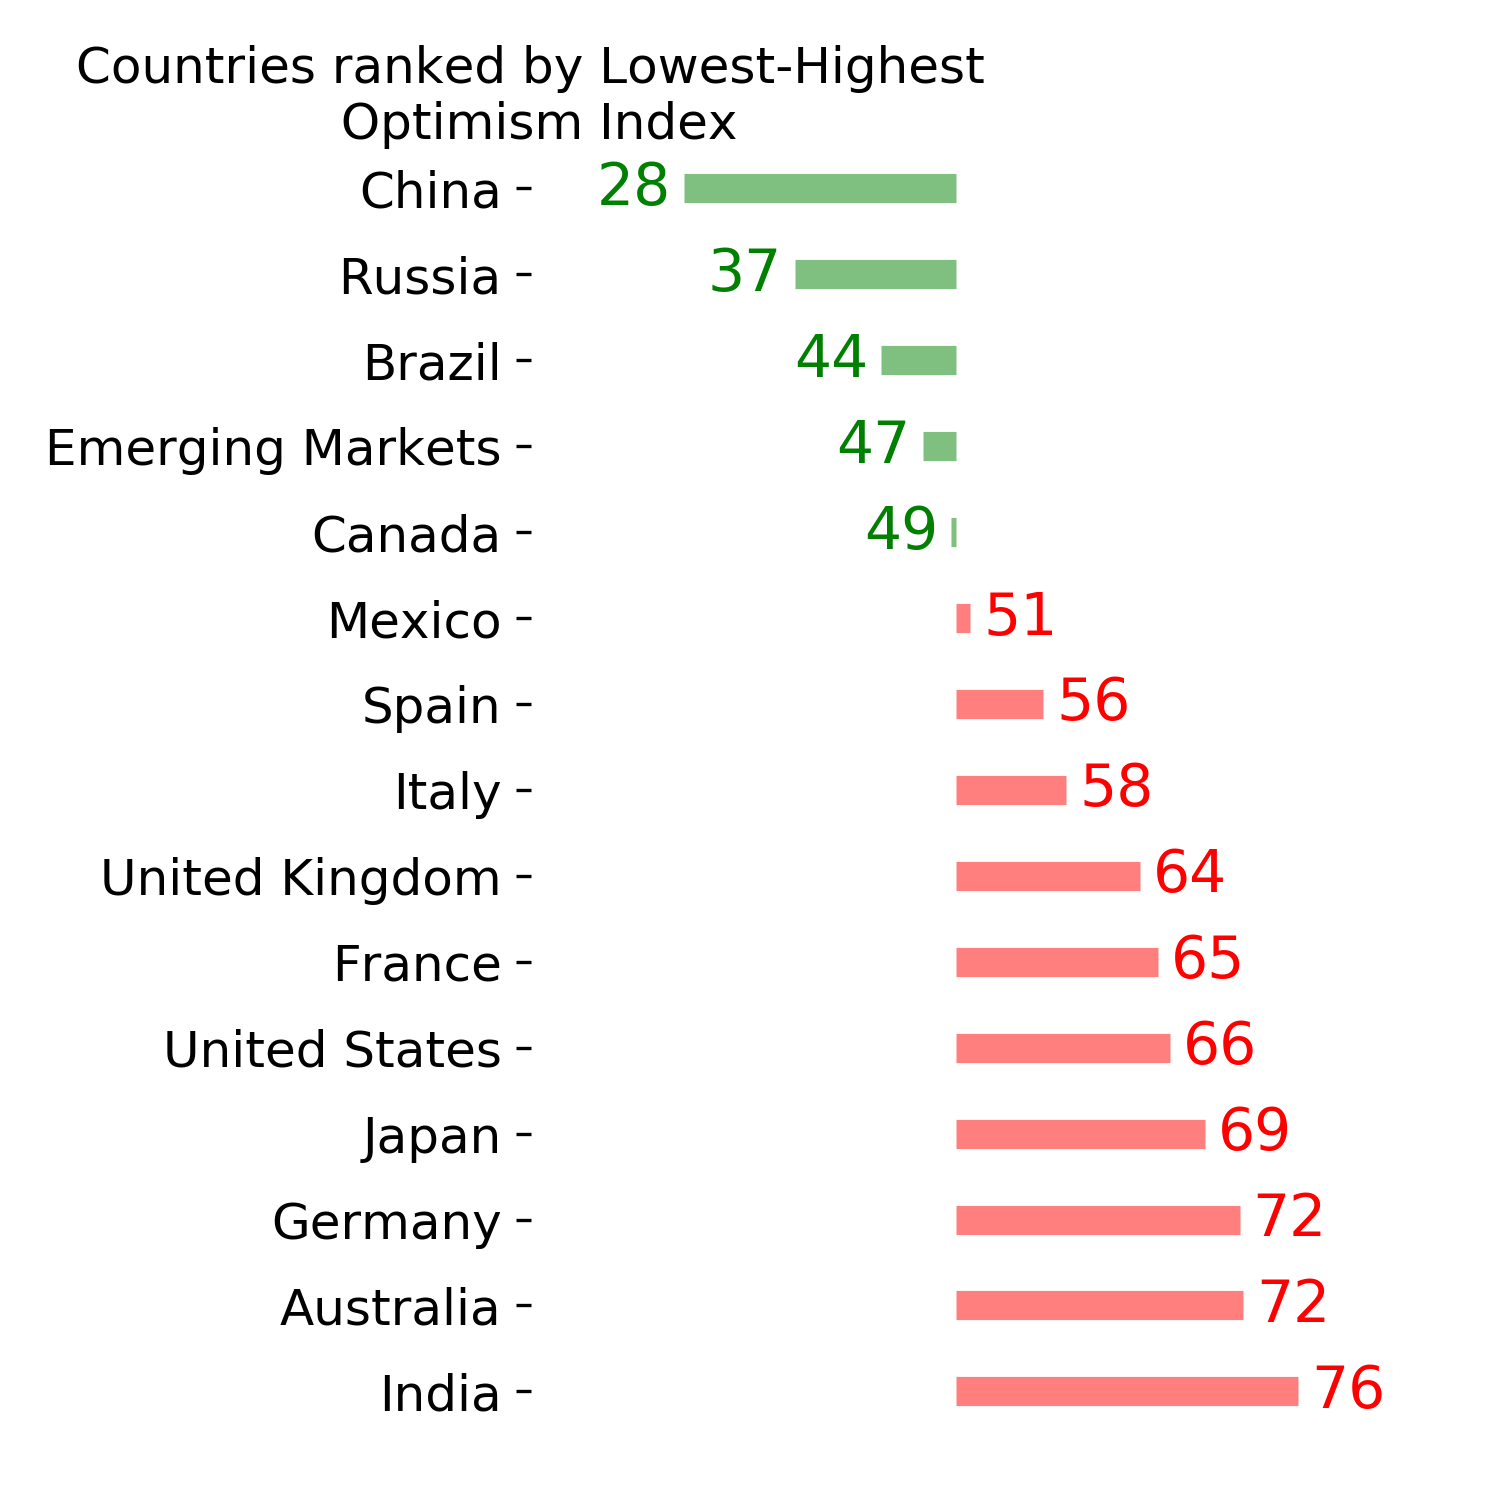
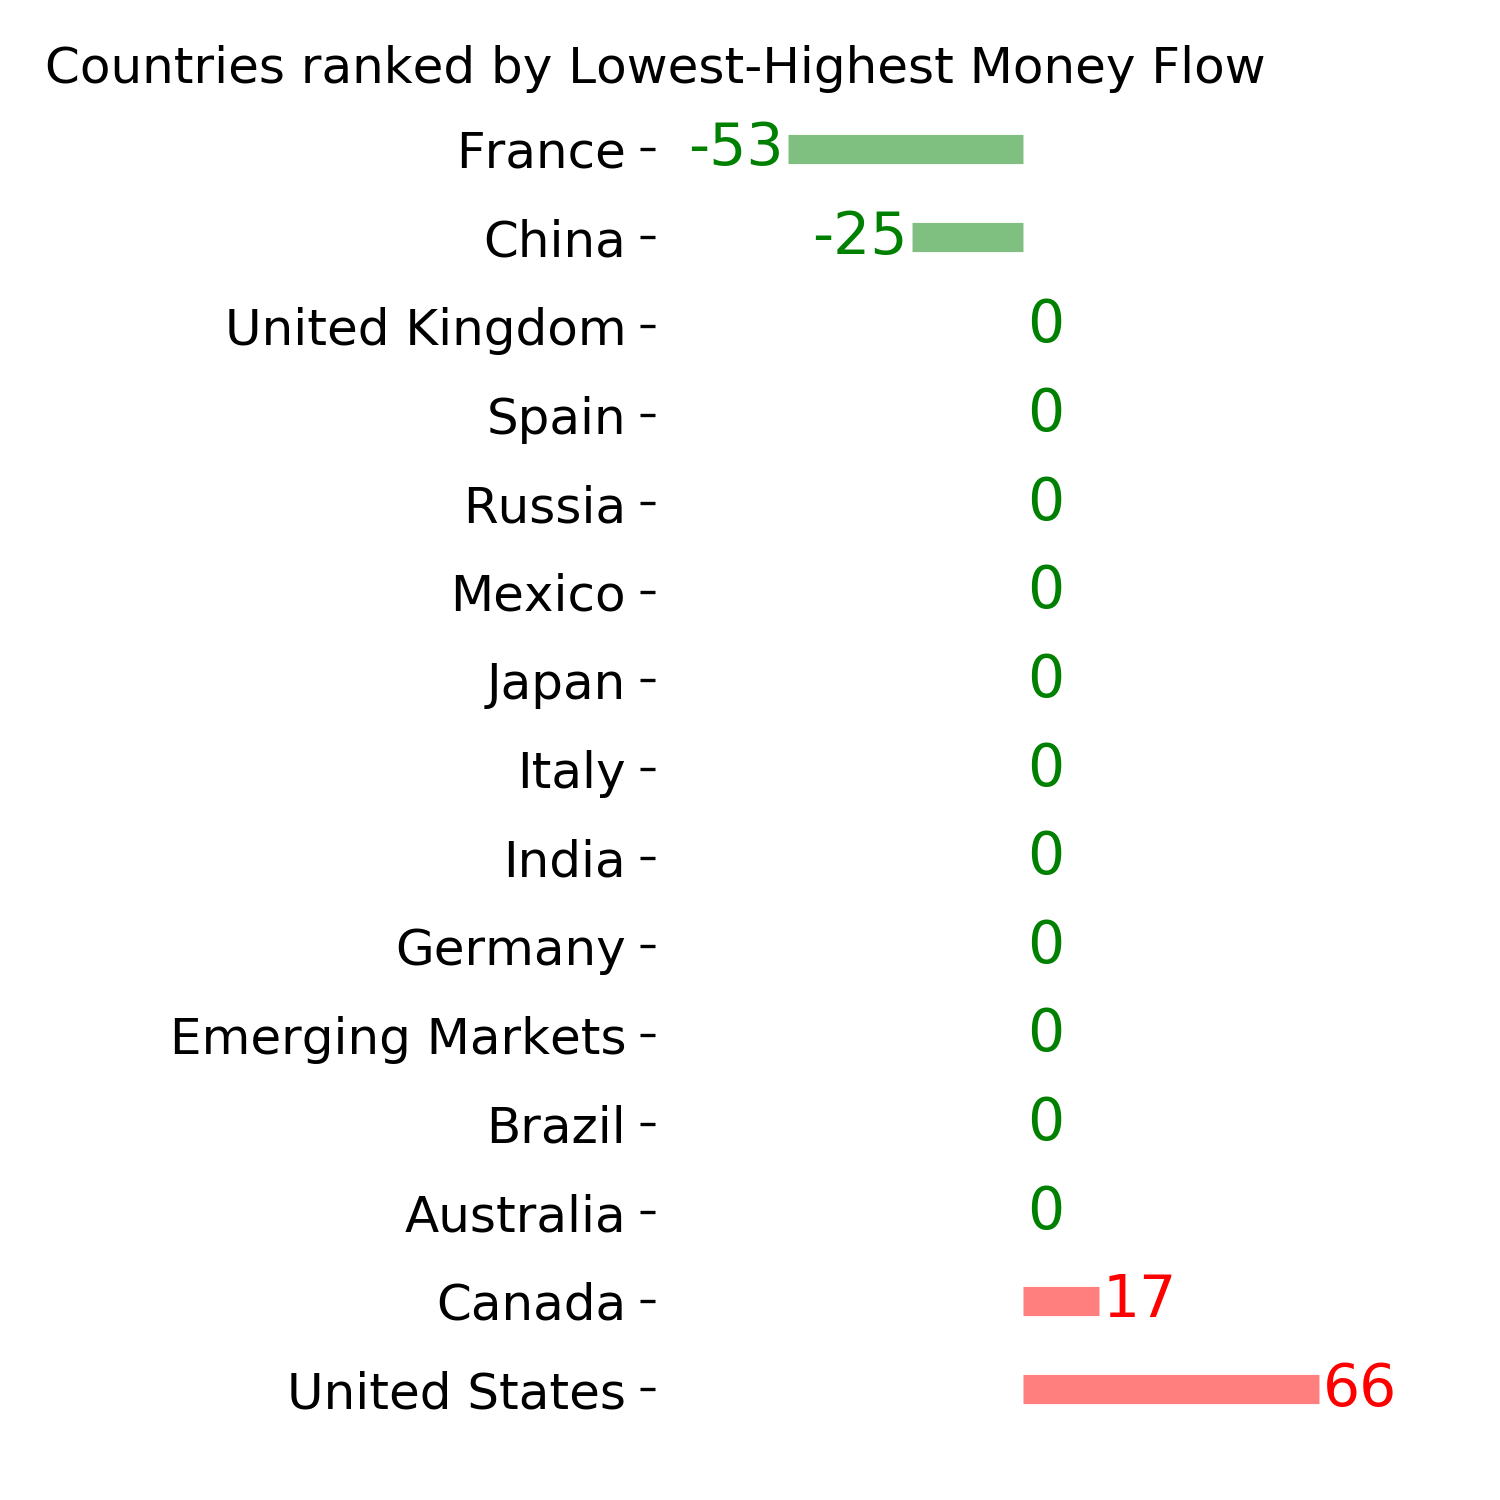
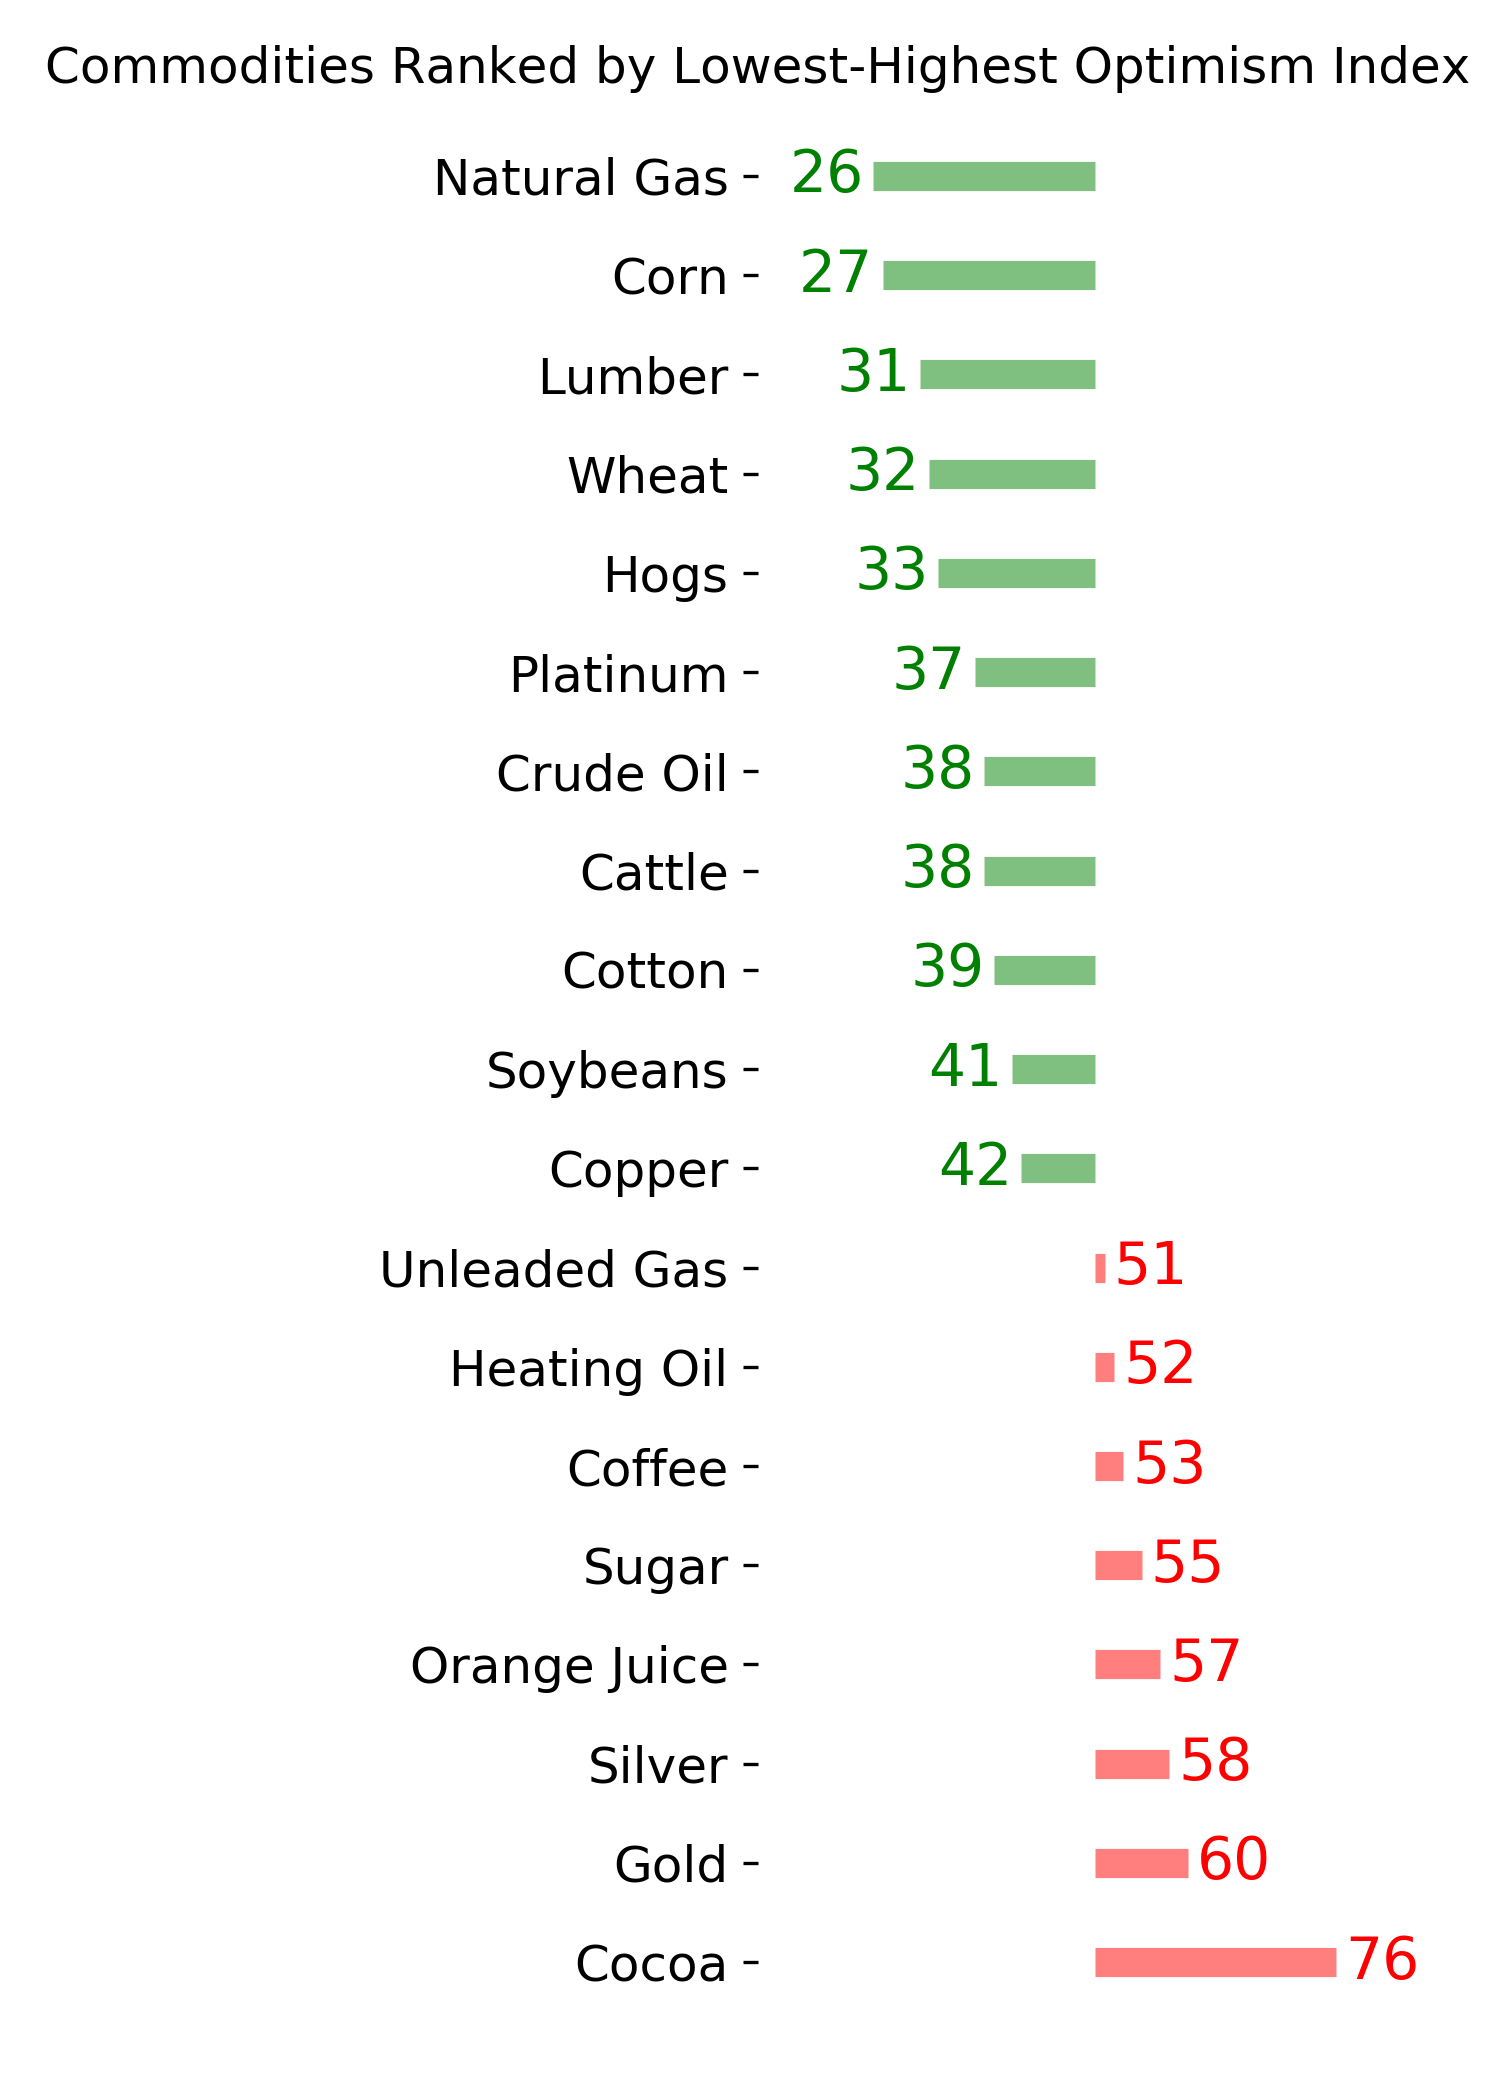
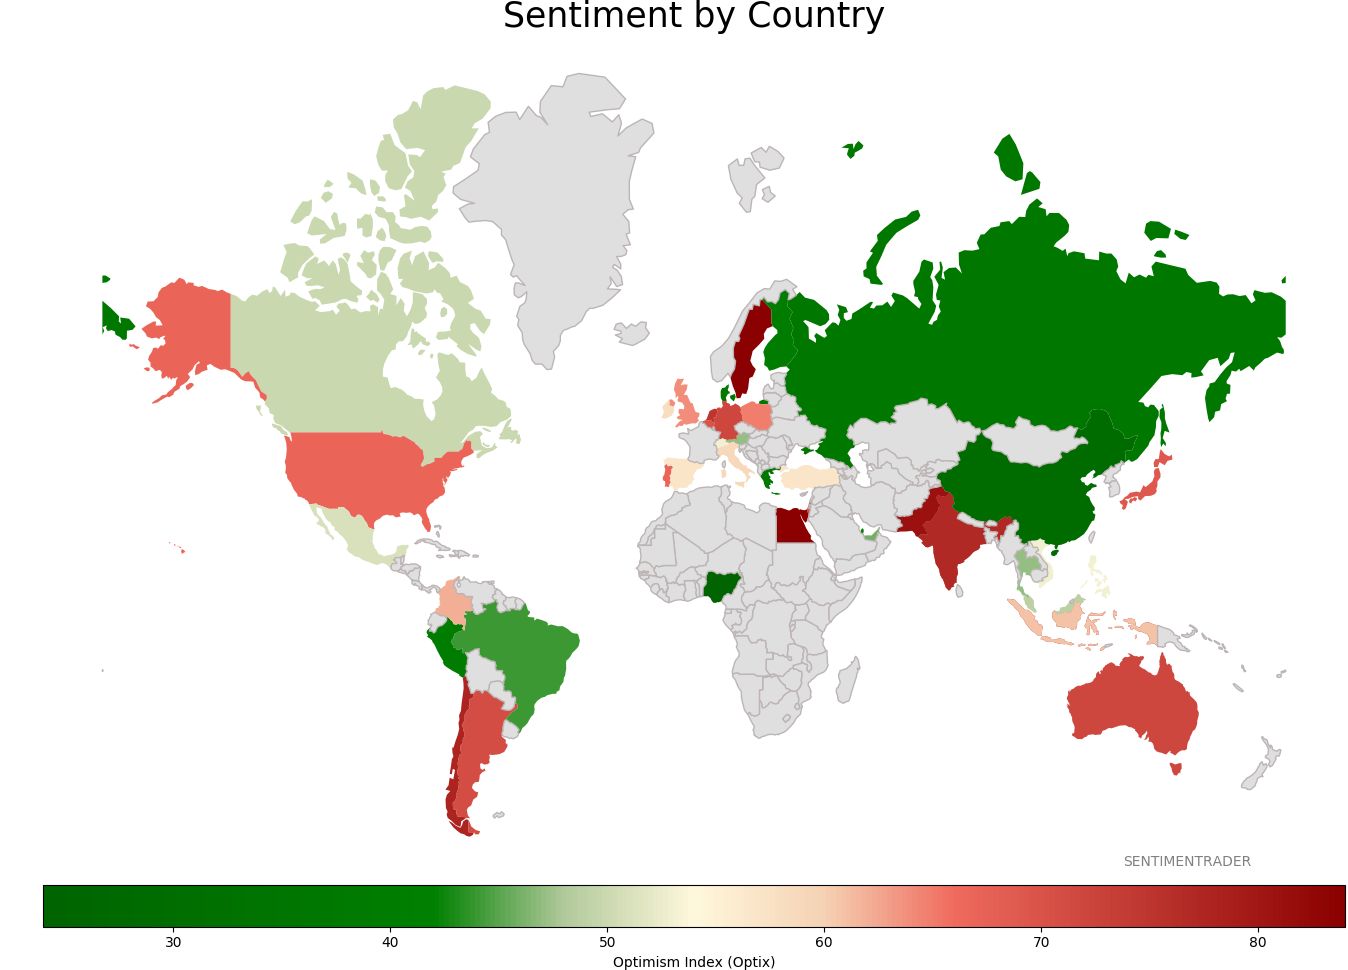
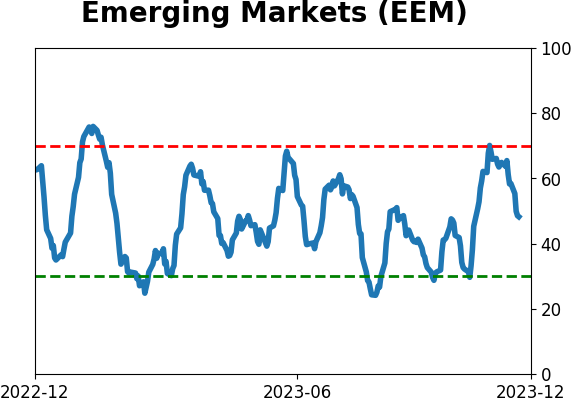
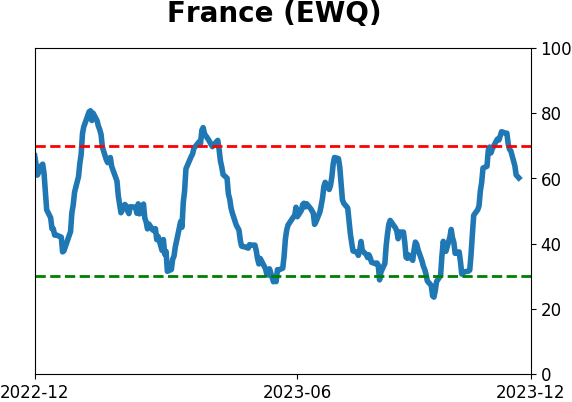
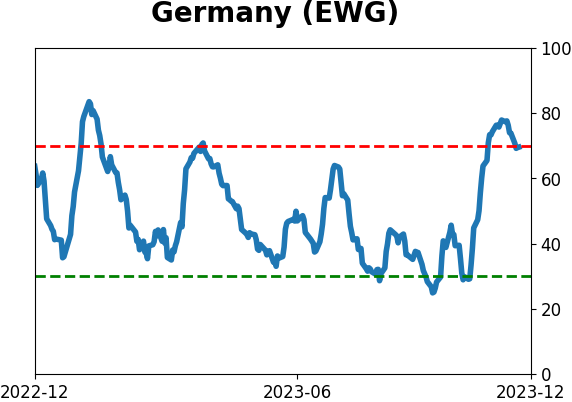
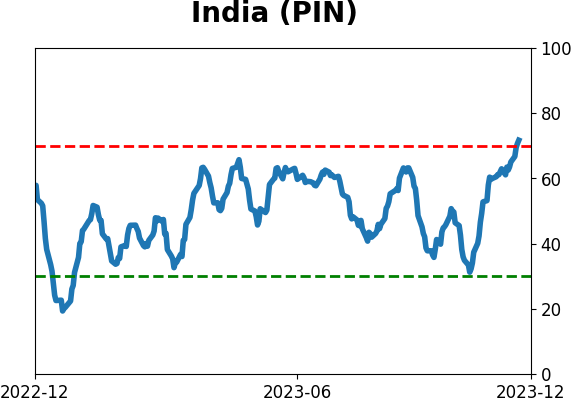
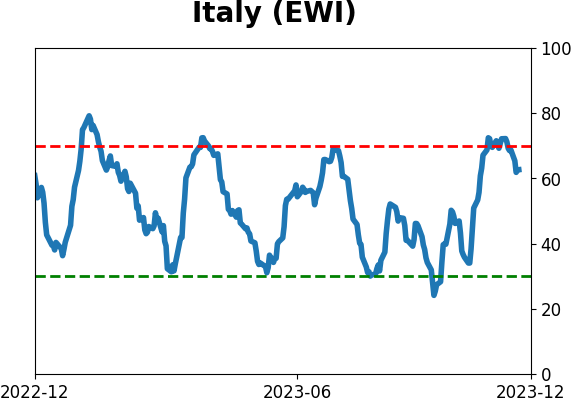
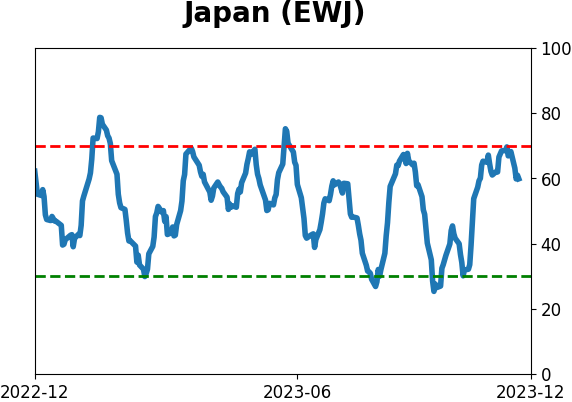
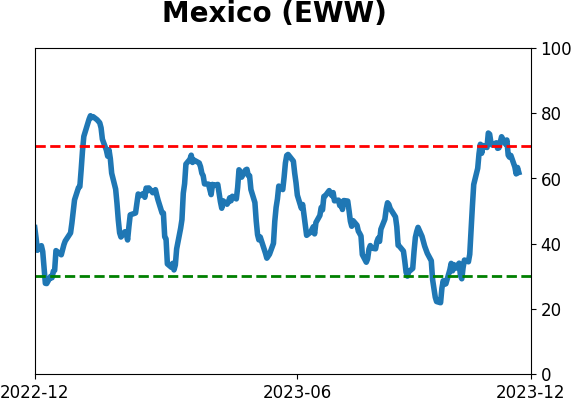
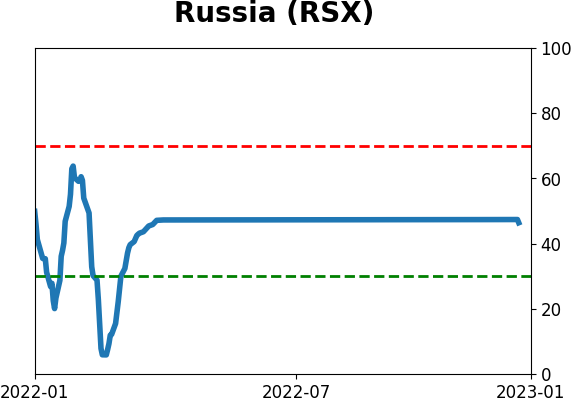
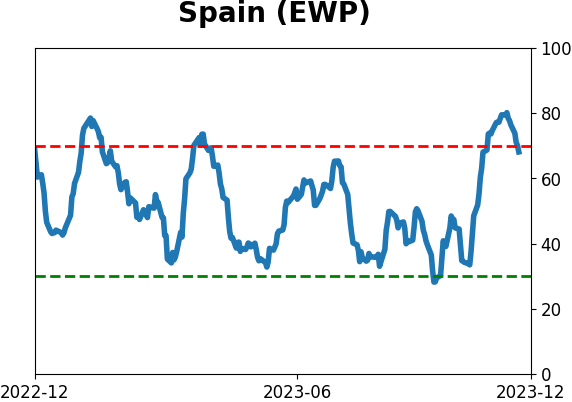
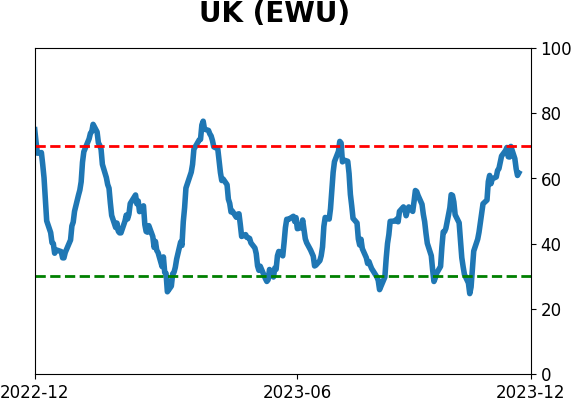
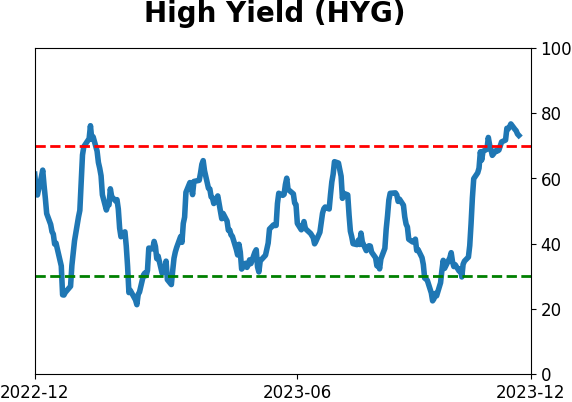
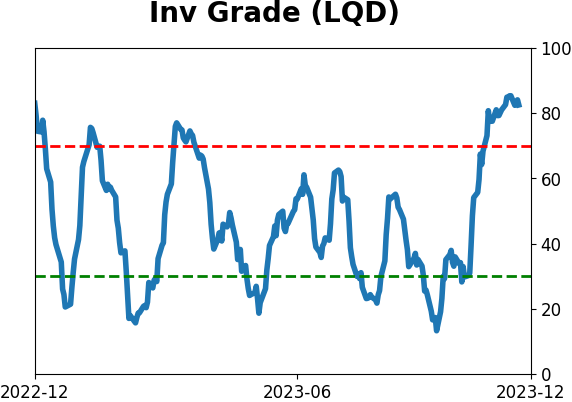
Sentiment Around The World
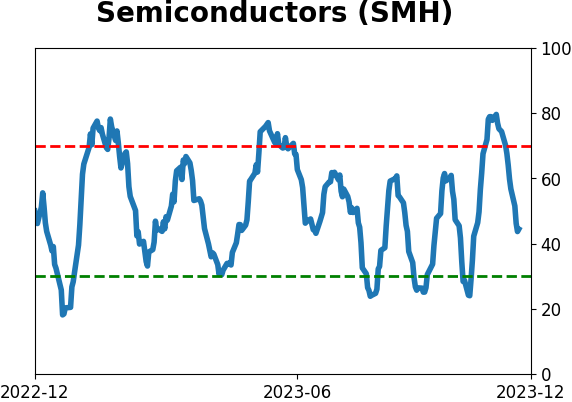
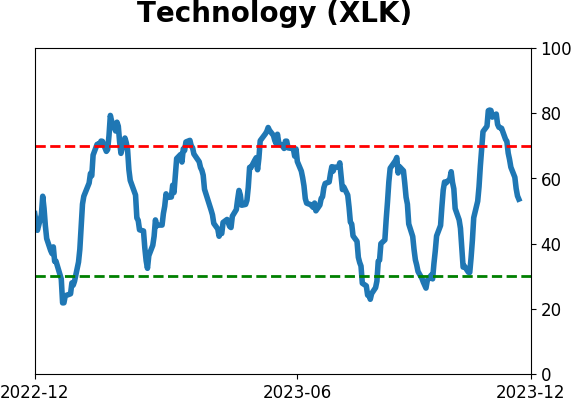
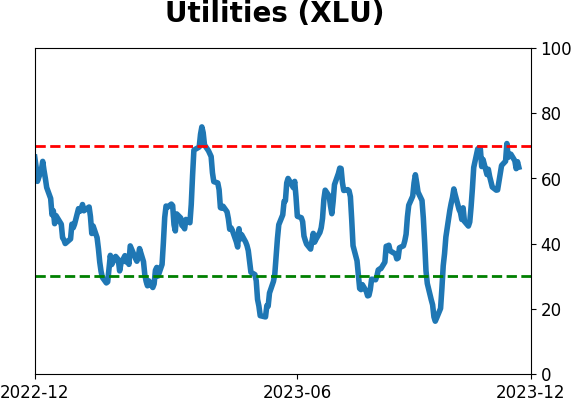
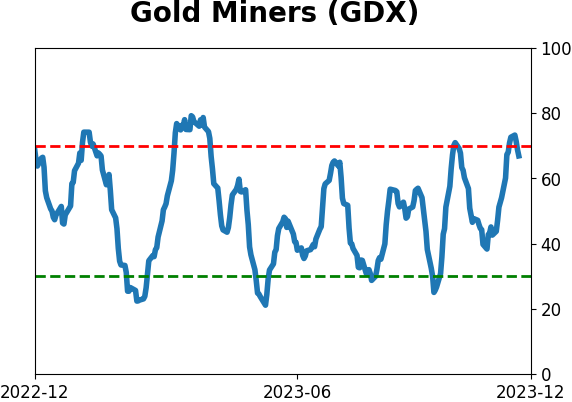
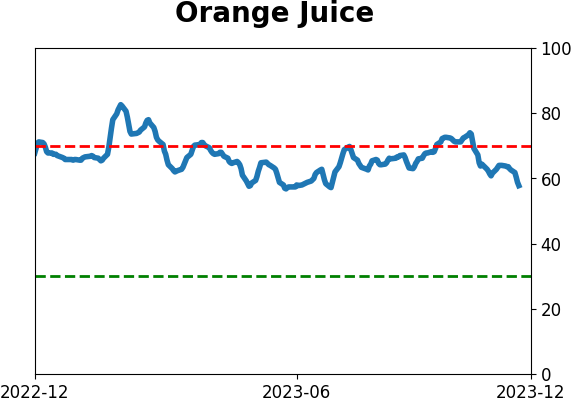
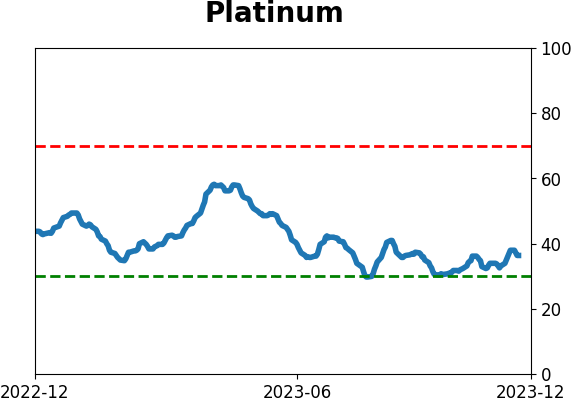
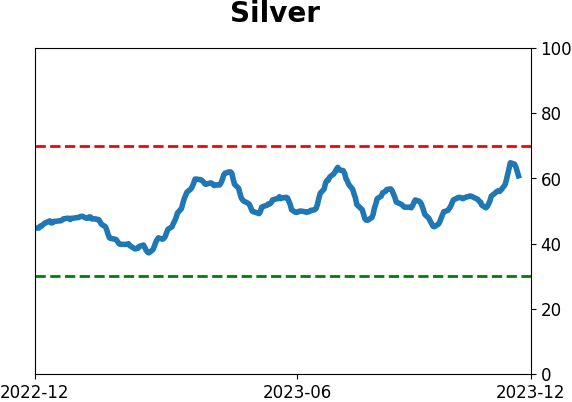
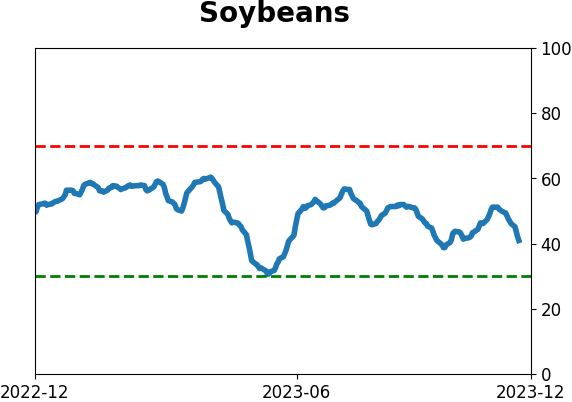
Optimism Index Thumbnails
|
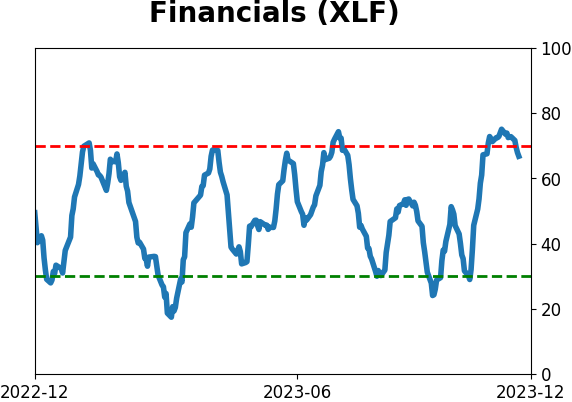
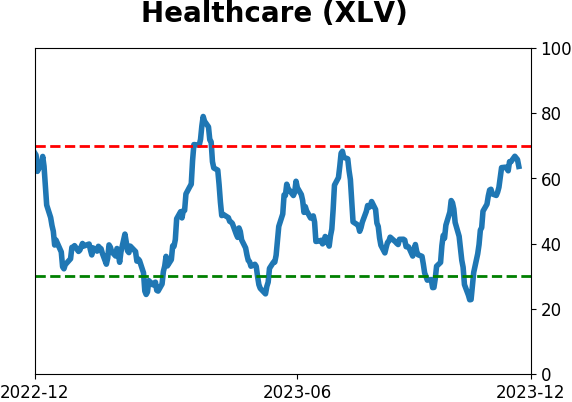
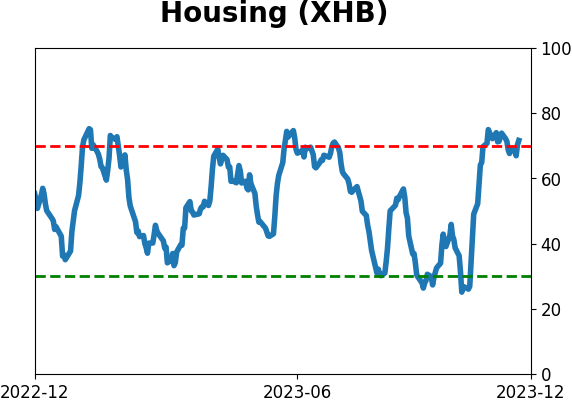
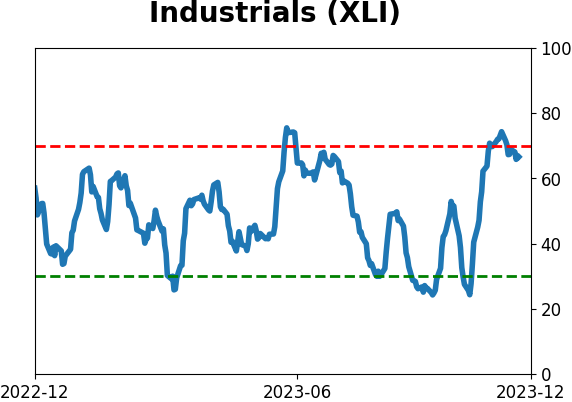
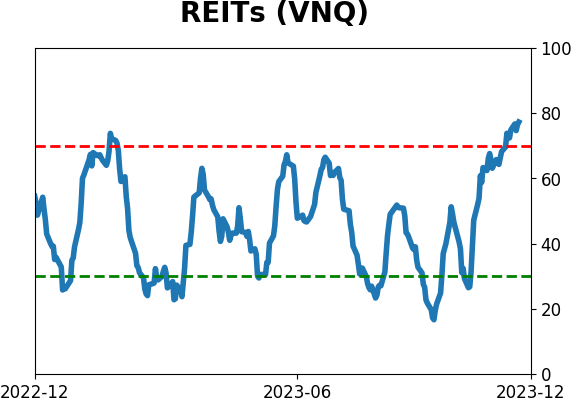
Sector ETF's - 10-Day Moving Average
|
|
|
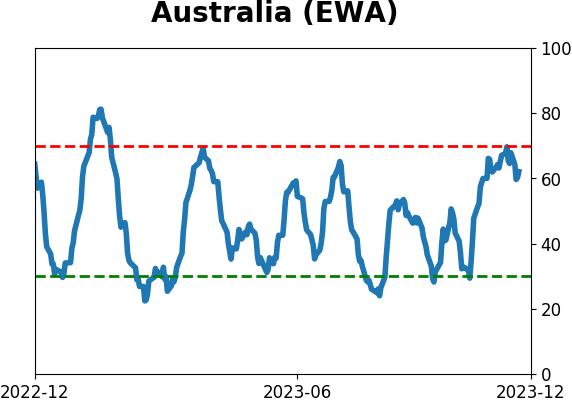
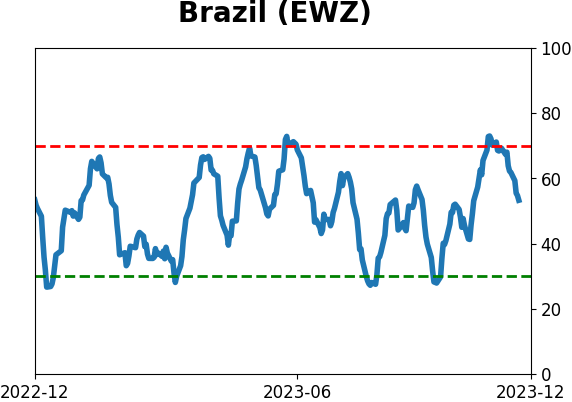
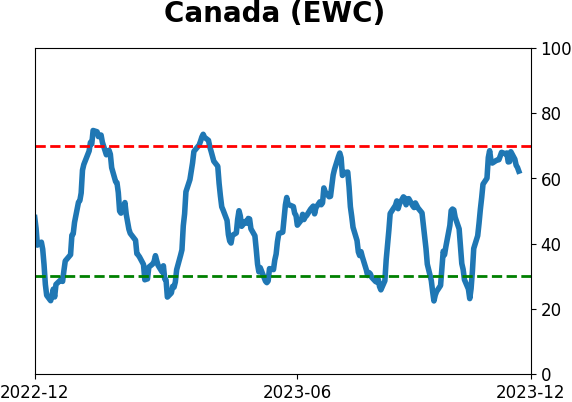
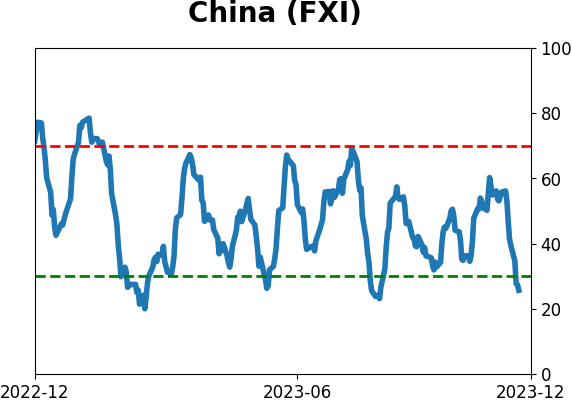
Country ETF's - 10-Day Moving Average
|
|
|
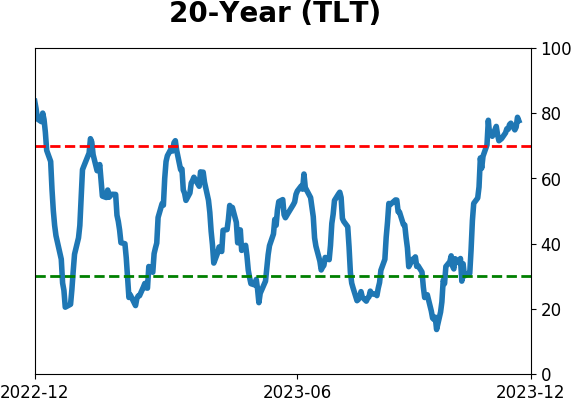
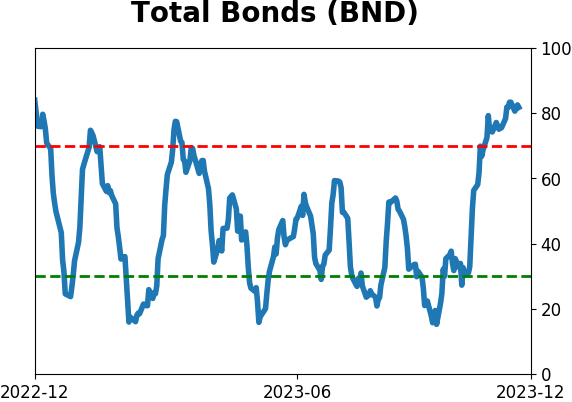
Bond ETF's - 10-Day Moving Average
|
|
|
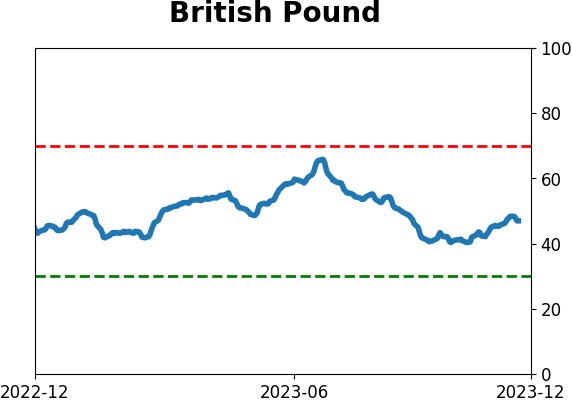
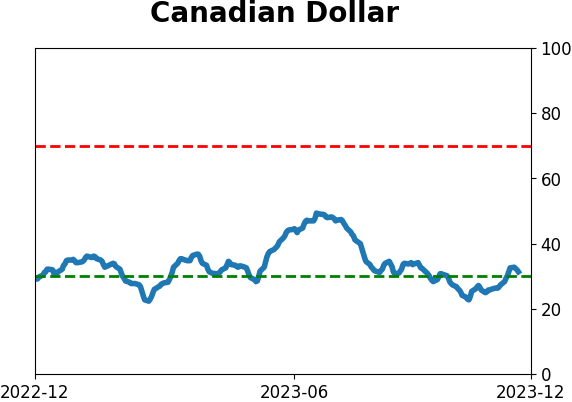
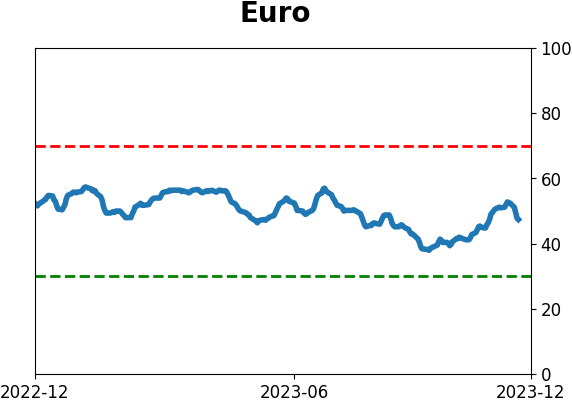
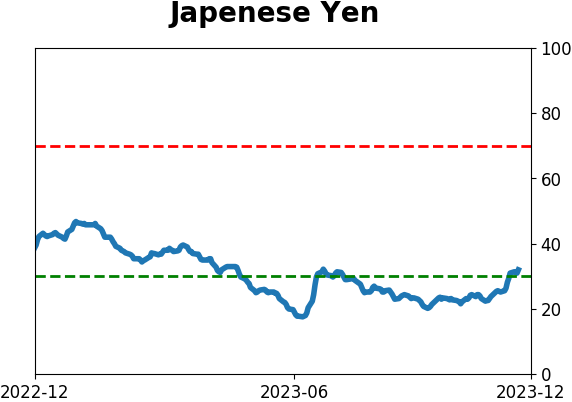
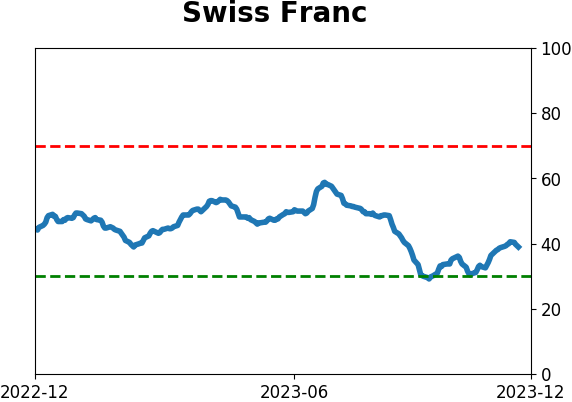
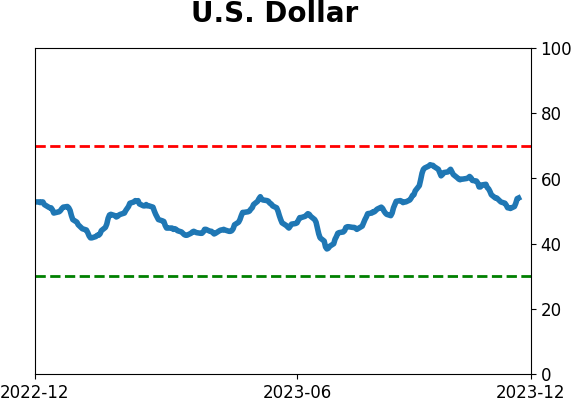
Currency ETF's - 5-Day Moving Average
|
|
|
Commodity ETF's - 5-Day Moving Average
|
|