Headlines
|
|
What happens when the Dow claws back most of its losses:
The Dow Jones Industrial Average retraced more than 70% of its decline in a short period of time. Similar retracements tended to lead to gains over the next year, with only a single loss. Even though the Dow retraced more than the S&P 500, it still tended to underperform that index in the months ahead.
|
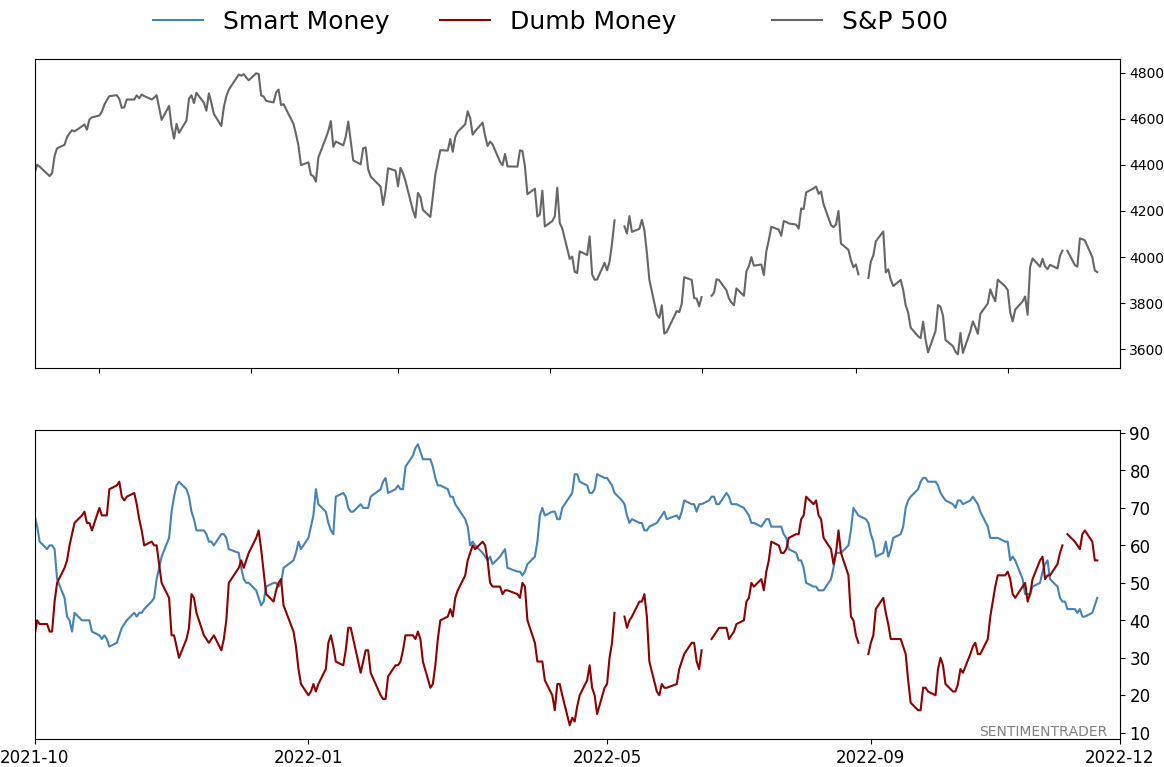
Smart / Dumb Money Confidence
|
Smart Money Confidence: 46%
Dumb Money Confidence: 56%
|
|
Risk Levels
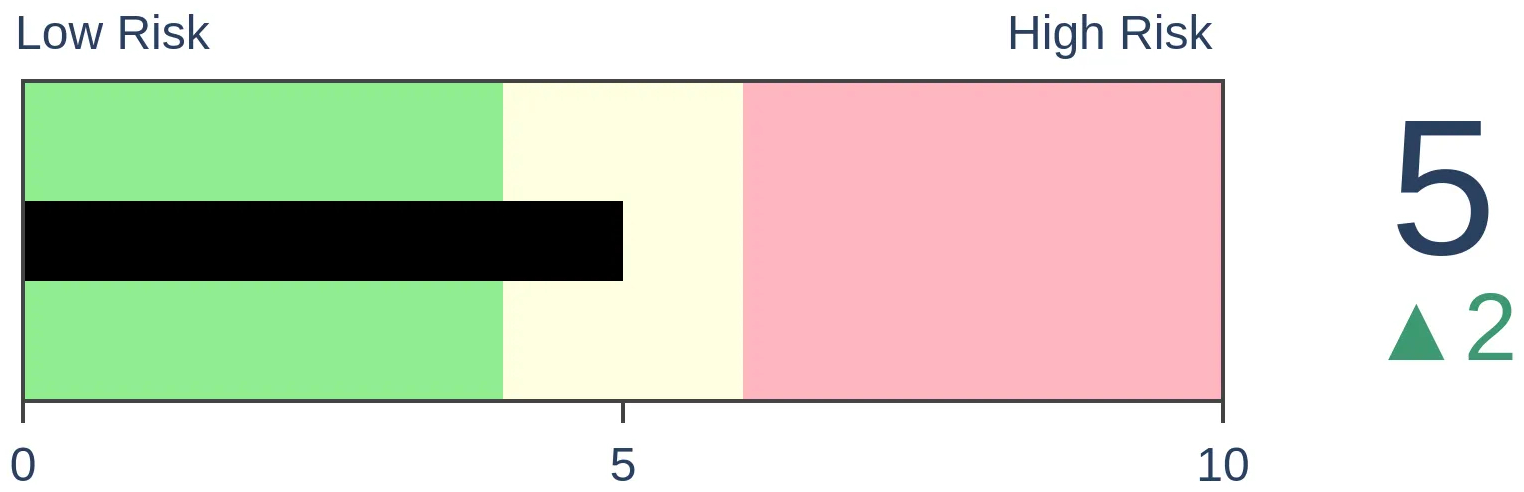
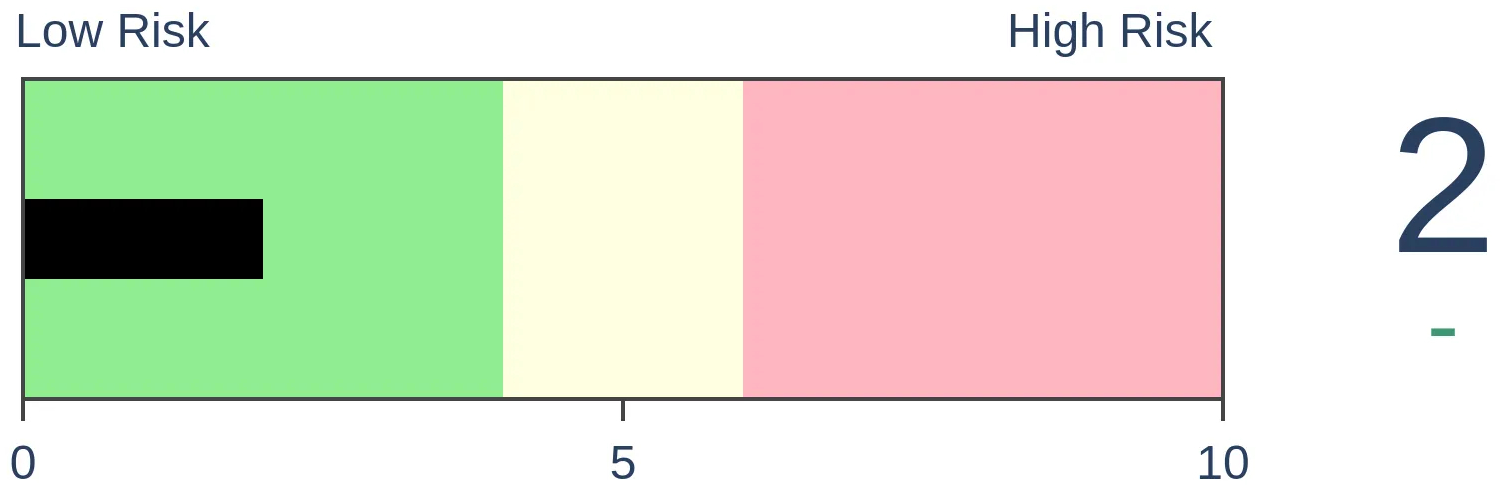
Stocks Short-Term
|
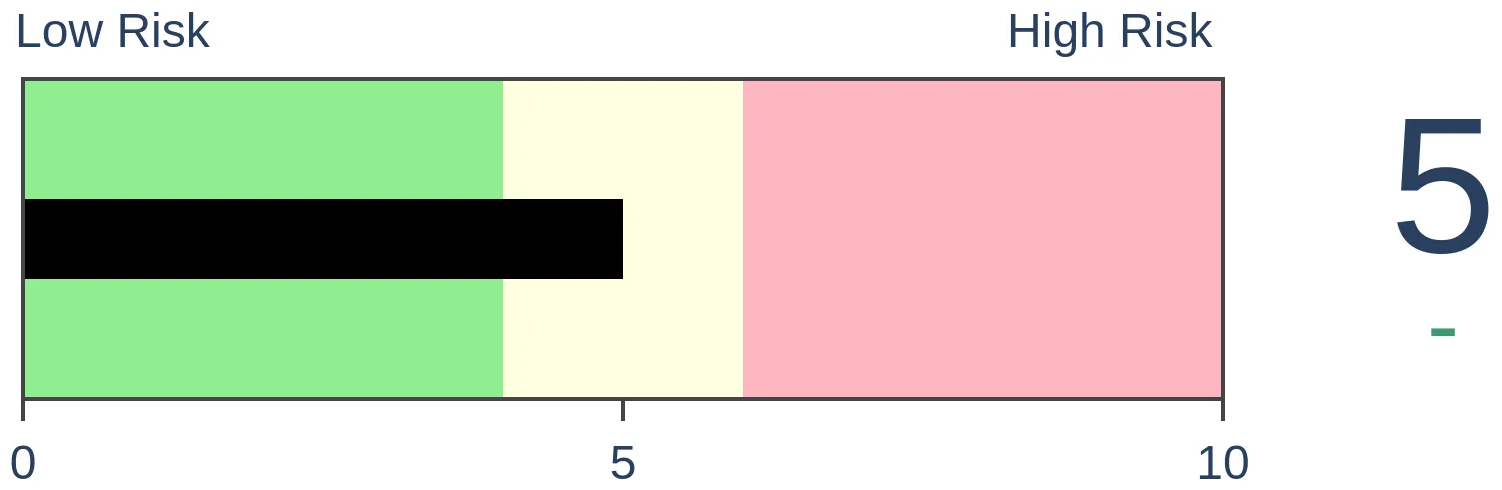
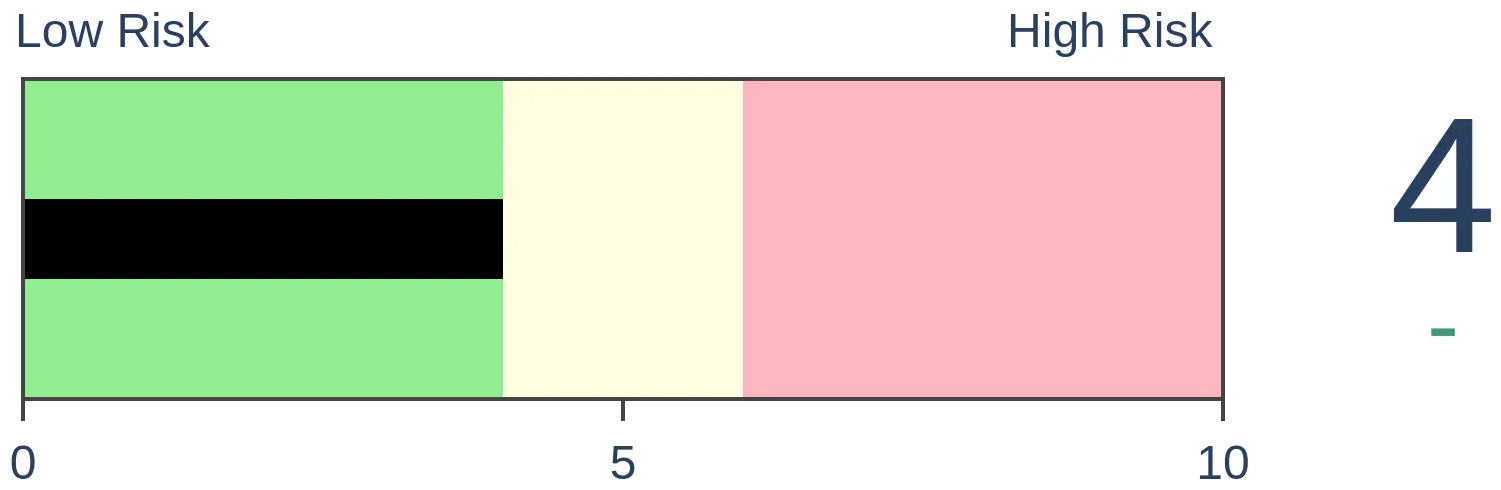
Stocks Medium-Term

|
|
Bonds
|
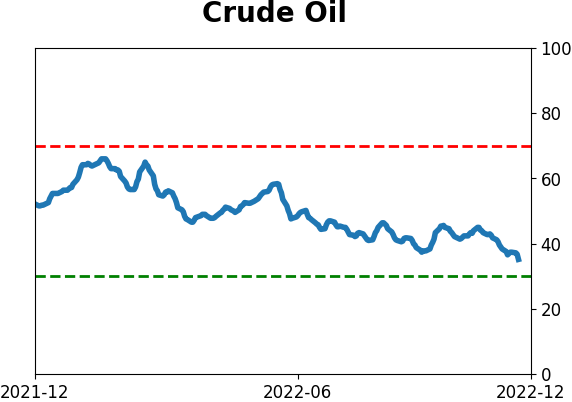
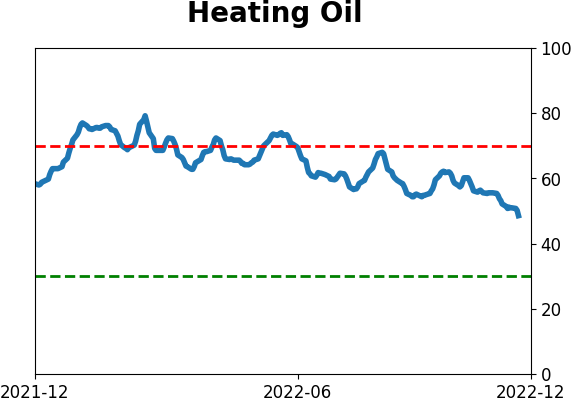
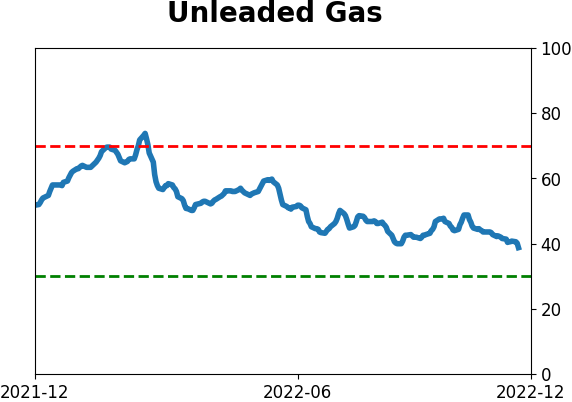
Crude Oil
|
|
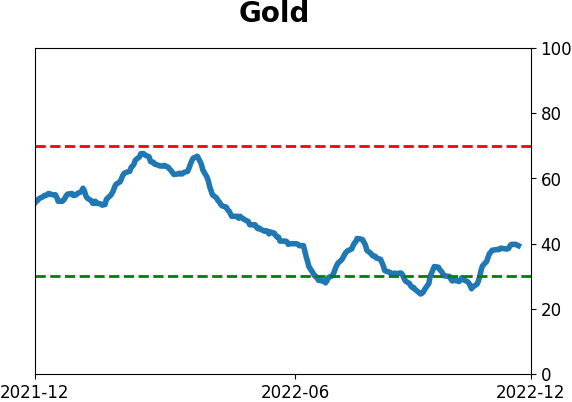
Gold
|
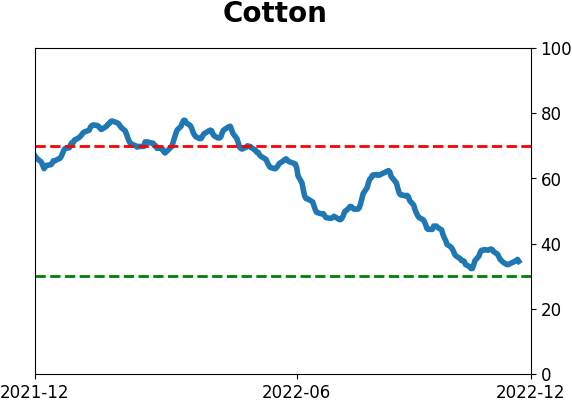
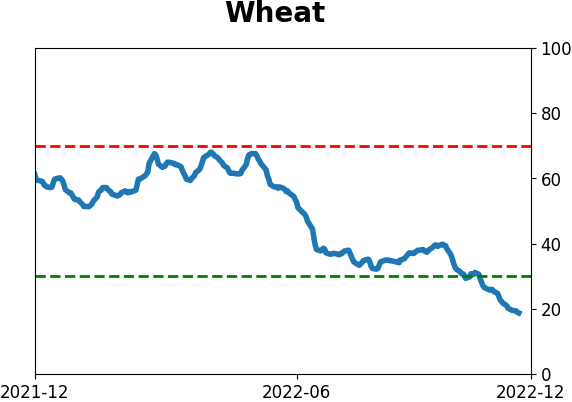
Agriculture

|
|
Research
By Jason Goepfert
BOTTOM LINE
The Dow Jones Industrial Average retraced more than 70% of its decline in a short period of time. Similar retracements tended to lead to gains over the next year, with only a single loss. Even though the Dow retraced more than the S&P 500, it still tended to underperform that index in the months ahead.
FORECAST / TIMEFRAME
None
|
Key points:
- The Dow Industrials clawed back more than 70% of its losses before a pullback this week
- Such a large retracement in such a short time period has preceded 1-year gains with a single exception
- When the Dow retraces more than the S&P 500, it still tended to underperform relative to the S&P
The Dow clawed back most of its losses
In April 2020, we looked at the idea that it's the retracement that counts. Investors don't particularly care how much stocks or indexes have rallied off a low; they care about how much of their losses have been erased.
In full disclosure, we looked at a similar analysis for the Nasdaq in April of this year, and it resulted in the worst loss ever, so there's that.
During this cycle, Industrial stocks have been the star. And the most venerable index of them all, the Dow Jones Industrial Average, retraced more than 70% of its decline in fewer than three months. There is no particular meaning to 70%; it's not some absurd Fibonacci number or common delineator like 75%. It's simply a round number. But it's more than the Dow retraced during its rally into August.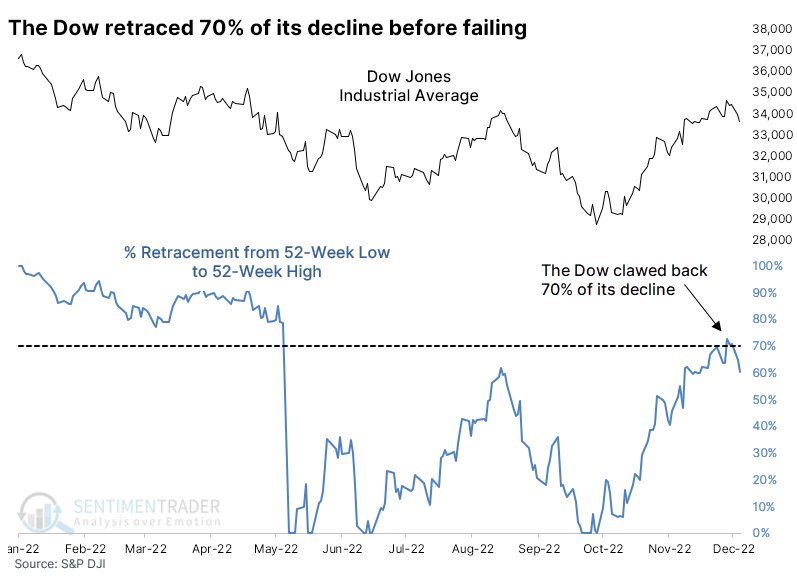
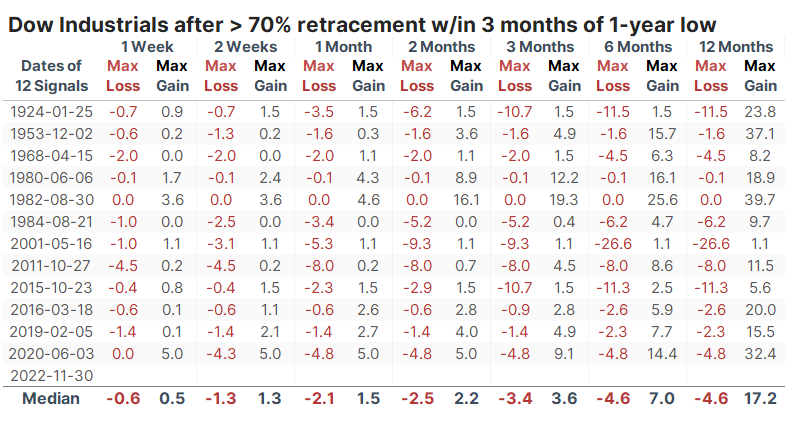
The table below shows every time since 1900 when the Dow retraced at least 70% of its decline from a 52-week high to a 52-week low. We filtered the table only to include those instances when the retracement was quick - fewer than three months.
Shorter-term returns were mixed, with a slight negative bias. They gradually improved, and the Dow suffered only one moderate loss over the next year. There aren't too many investors who would have considered the signal in 2001 anything other than a miserable failure, but the Dow held up better than most other indexes.
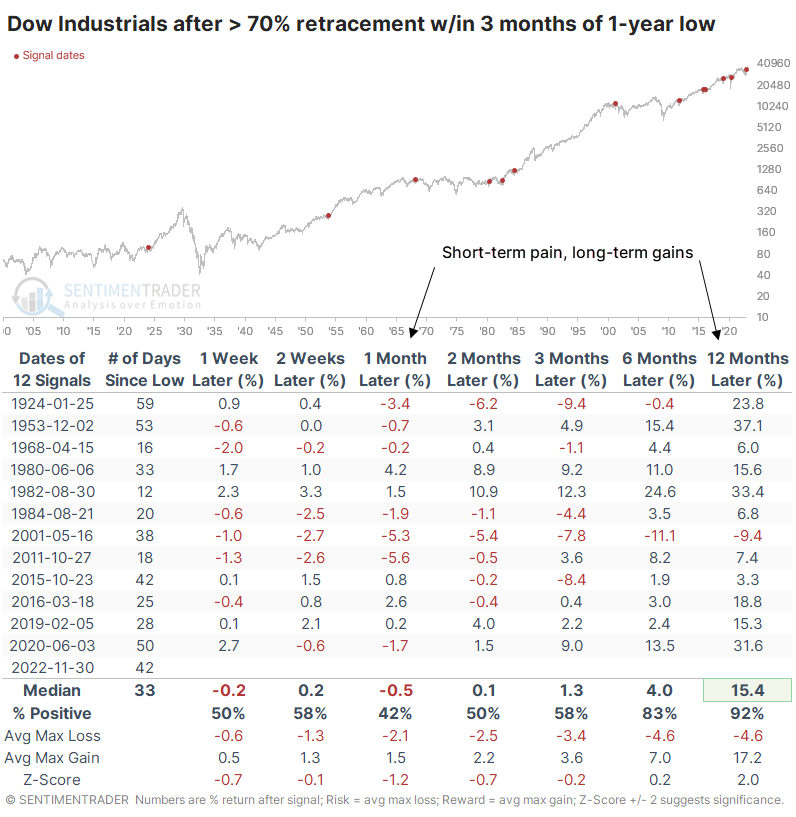
A table of maximum losses and gains over each time frame shows that the Dow generally suffered minimal losses in the months ahead, but there weren't many outsized gains, either. Over the next year, there was only one loss of more than -11.5% but seven gains of more than +11.5%.
Since this triggered, the Dow has declined nearly 3%, which is one of the larger losses during the first week following the signals. There wasn't much of a correlation between short-term drawdowns and long-term returns. While it seems concerning that this one has been an immediate failure, there isn't enough information to suggest that it totally invalidates the long-term positive bias following quick retracements.
The Dow versus the S&P 500
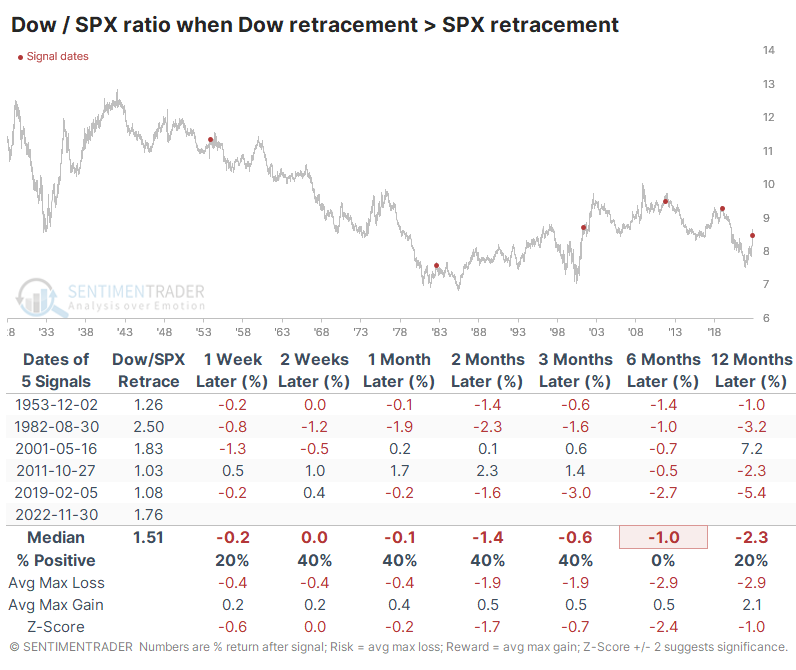
Most indexed equity assets are tied to the S&P 500, and that index hasn't retraced as much of its decline as the Dow. If we look at the times when the Dow retraced more of its decline than the S&P, it wasn't a great sign for the Dow relative to the S&P. Over the next six months, the Dow lost ground relative to the S&P every time.
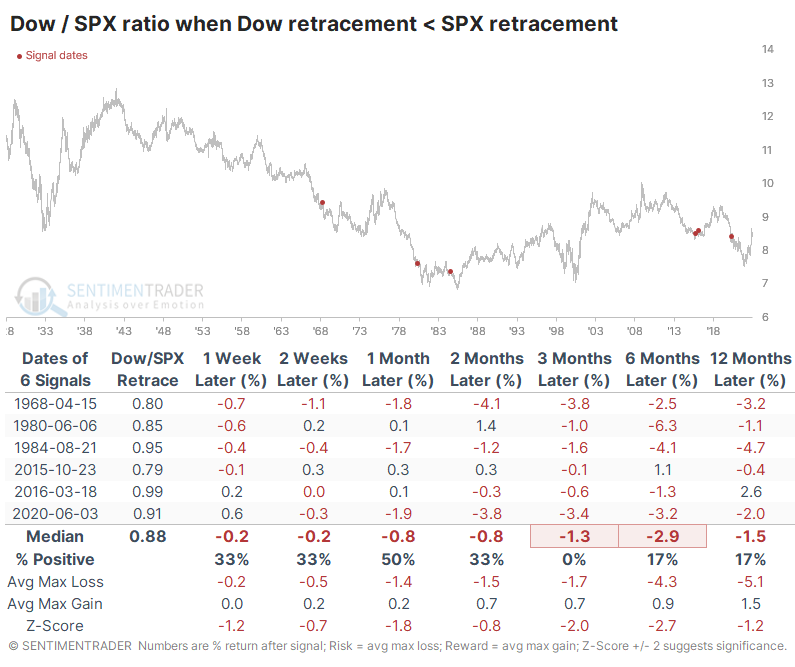
But it was better than the alternative when the Dow retraced less of its decline than the S&P. In those cases, the Dow still lost more than the S&P, but with larger average losses.
What the research tells us...
Historically, when an index can claw back much of its losses over a short time frame, it dramatically impacts investor sentiment. There is no hard-and-fast rule about what retracement level matters the most as long as it's "a lot." It's fair to say the Dow has clawed back a lot of its losses, and over the past 122 years, that has suggested the worst was usually over. It wasn't perfect, and anyone relying on this in 2001 had cause to be disappointed. But that was the only outlier, as other signals preceded decent gains over the next year.
Indicators at Extremes
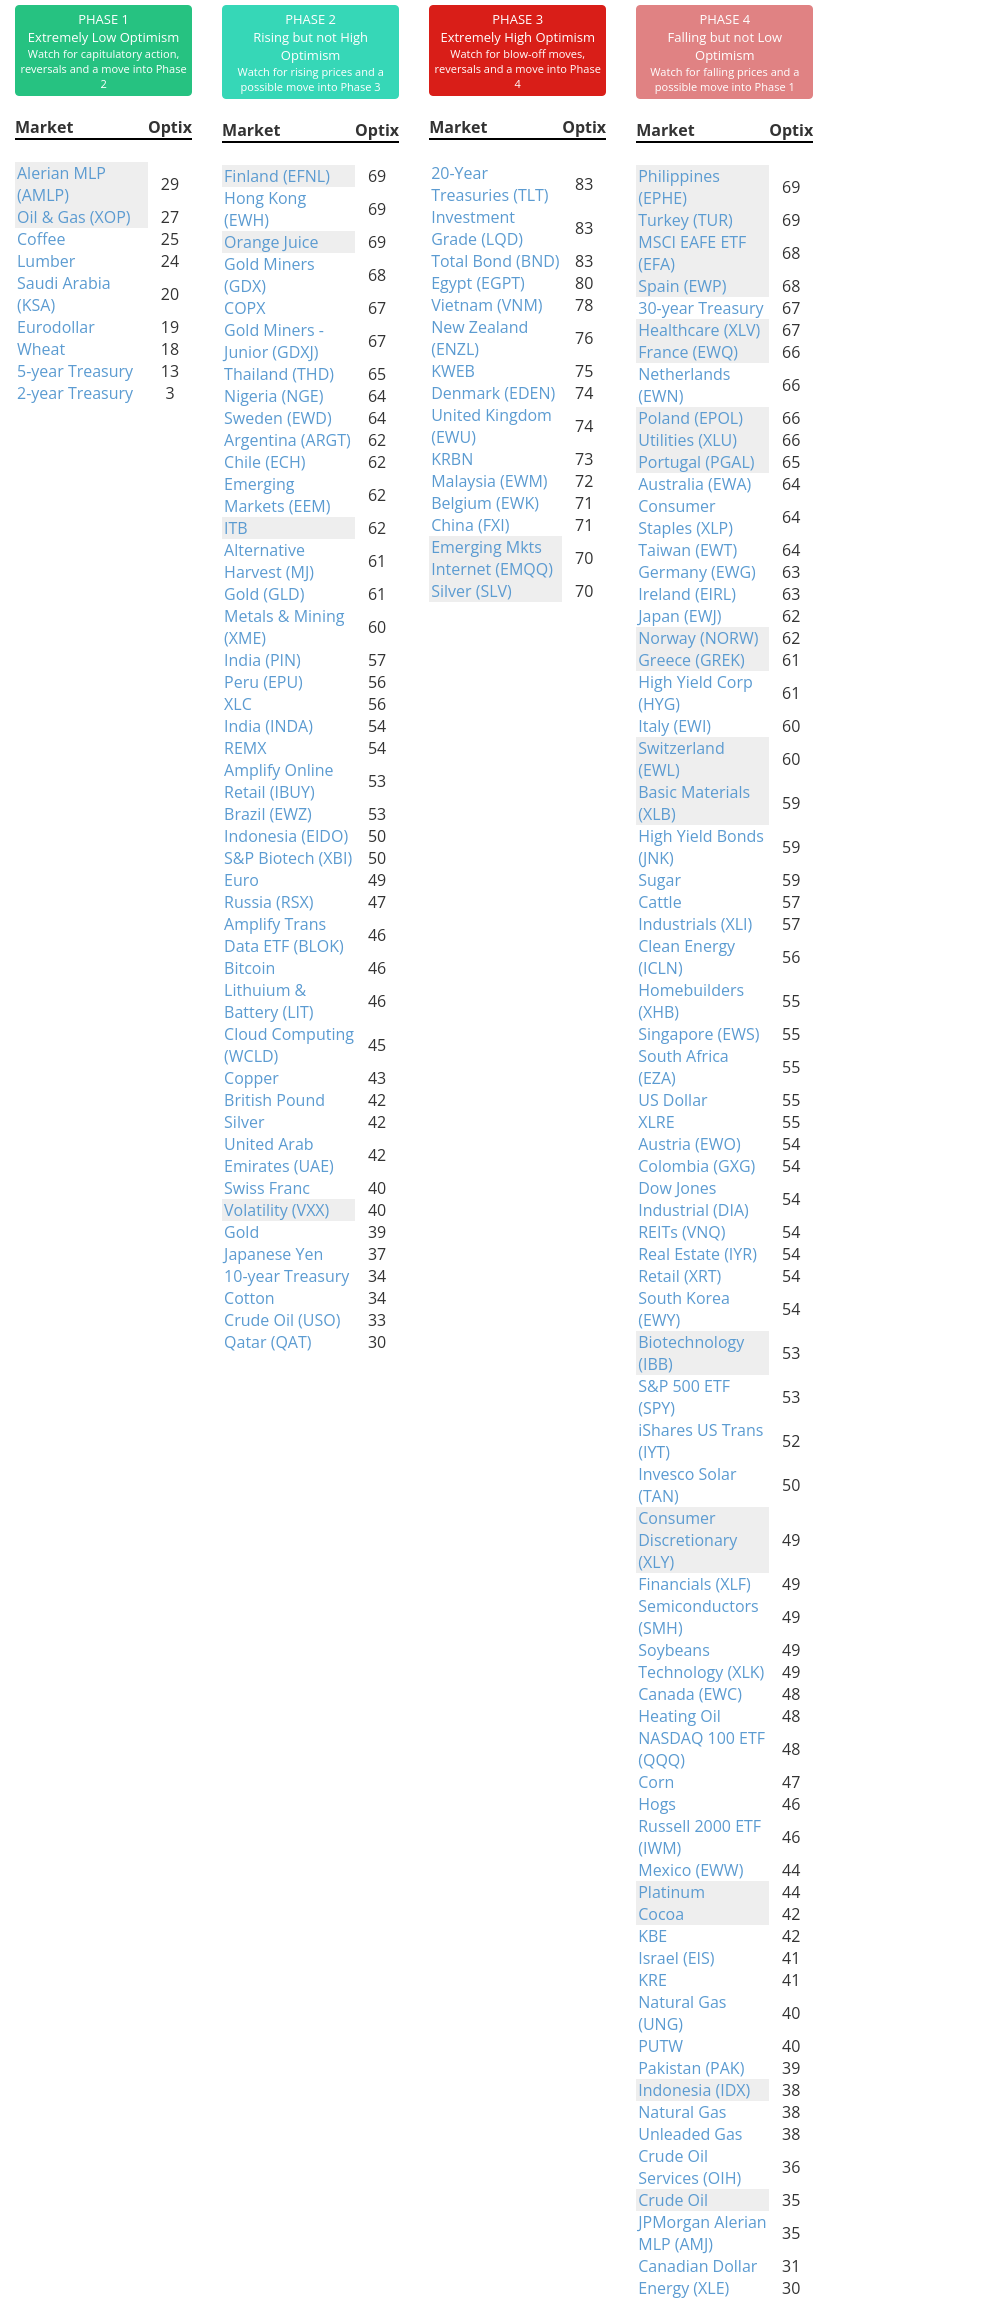
Phase Table
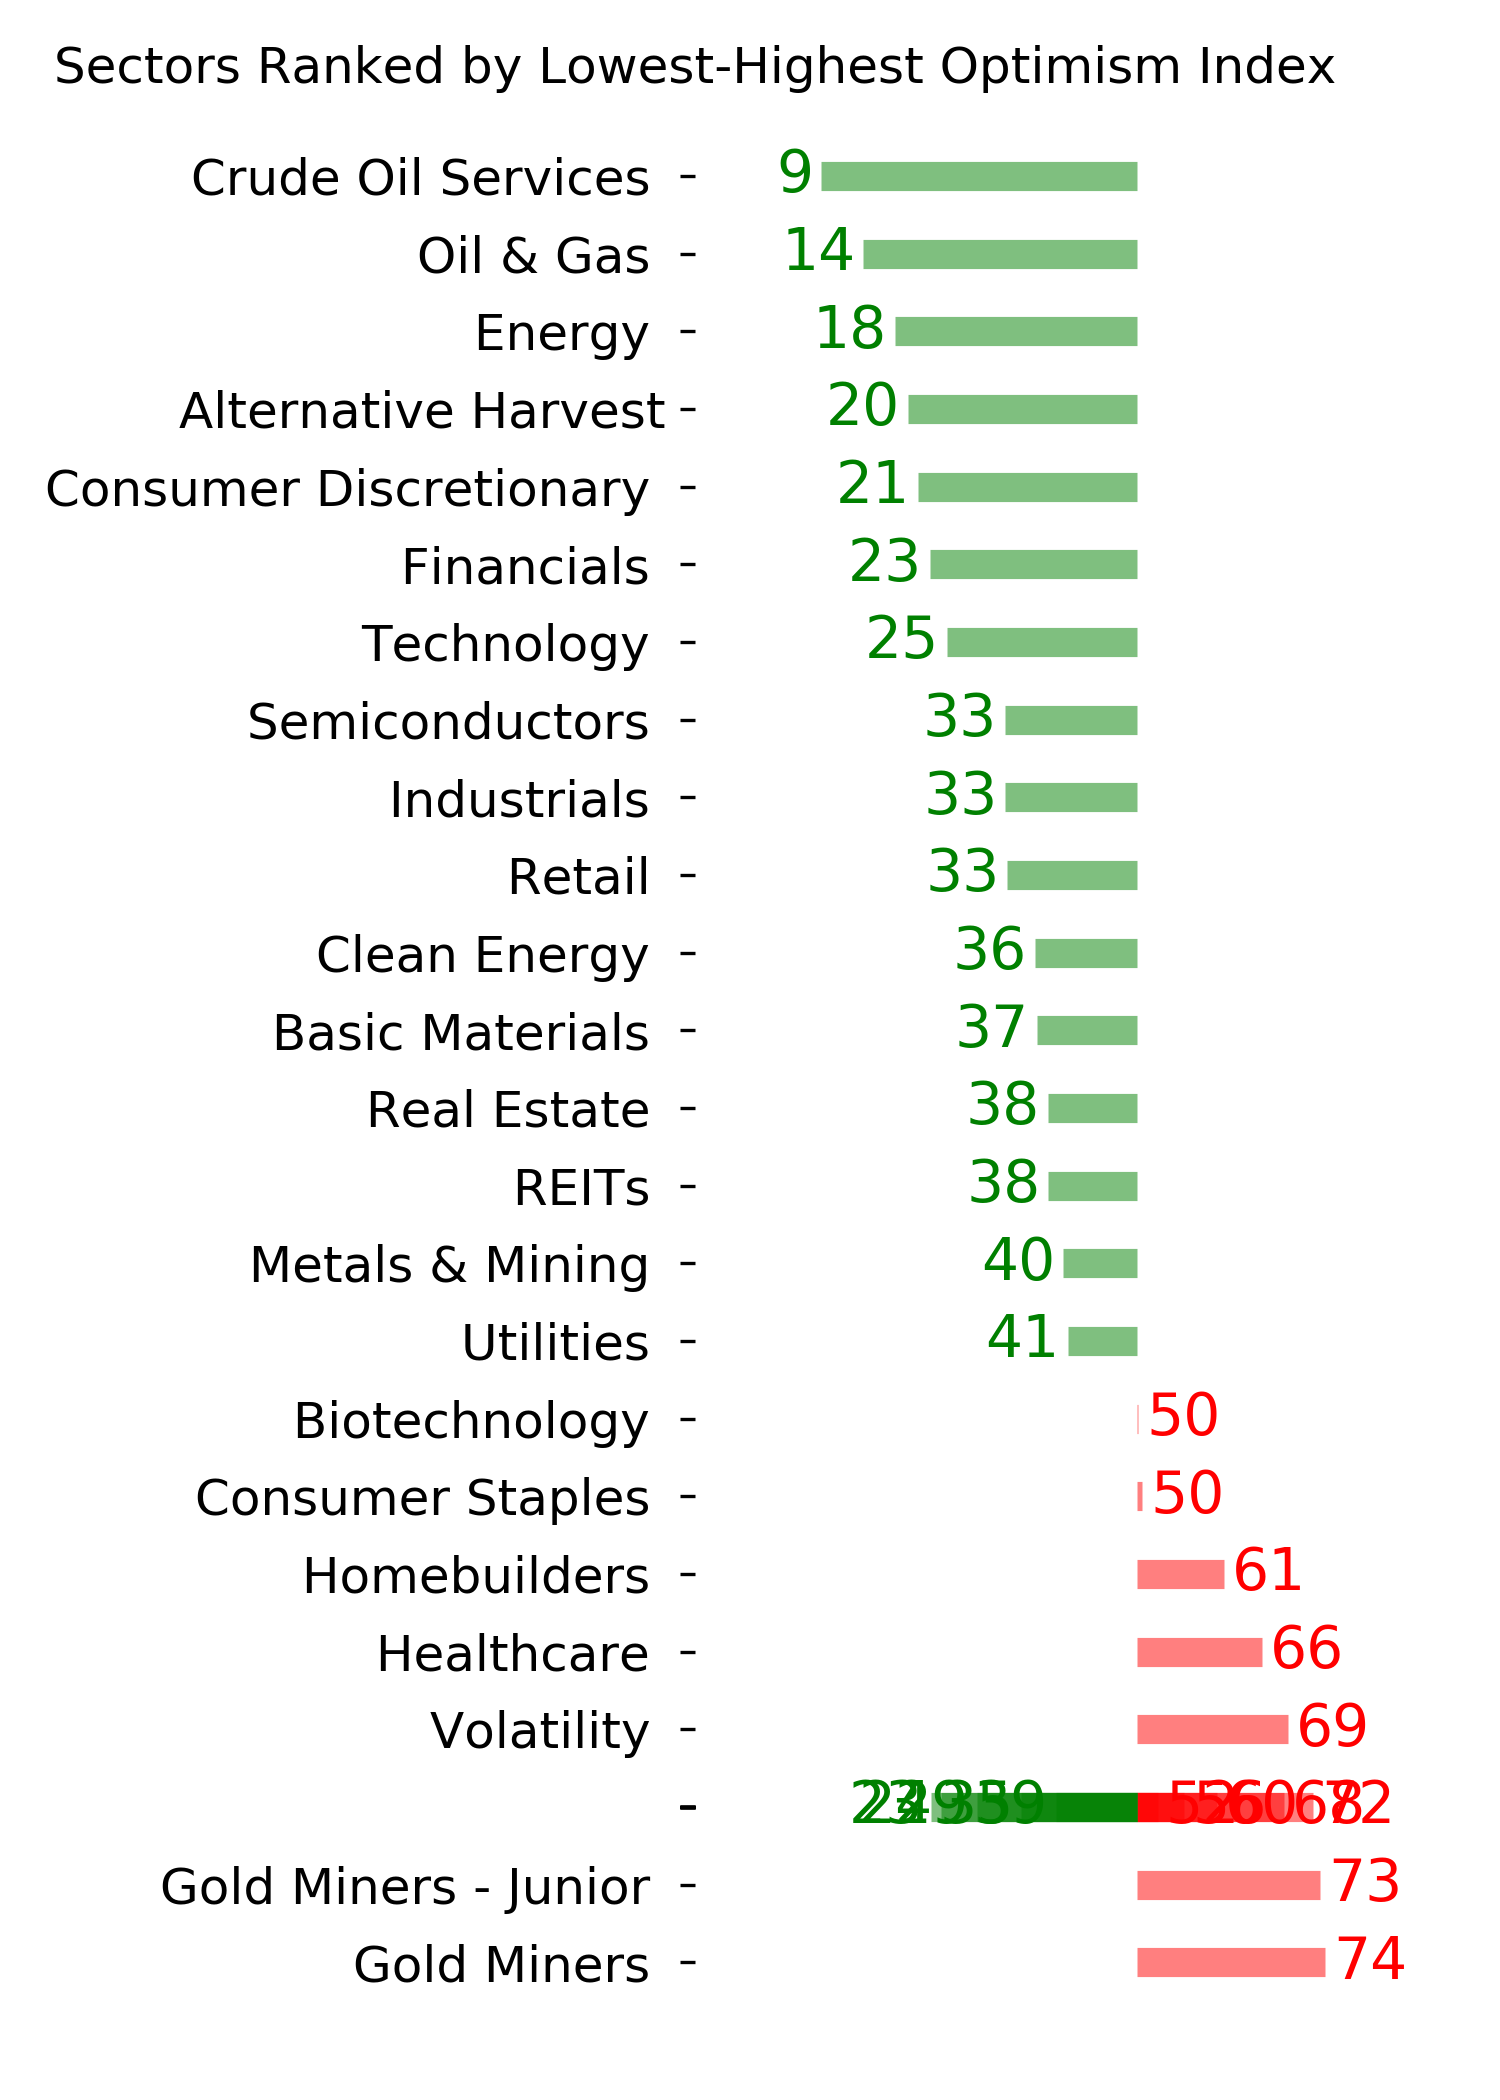
Ranks
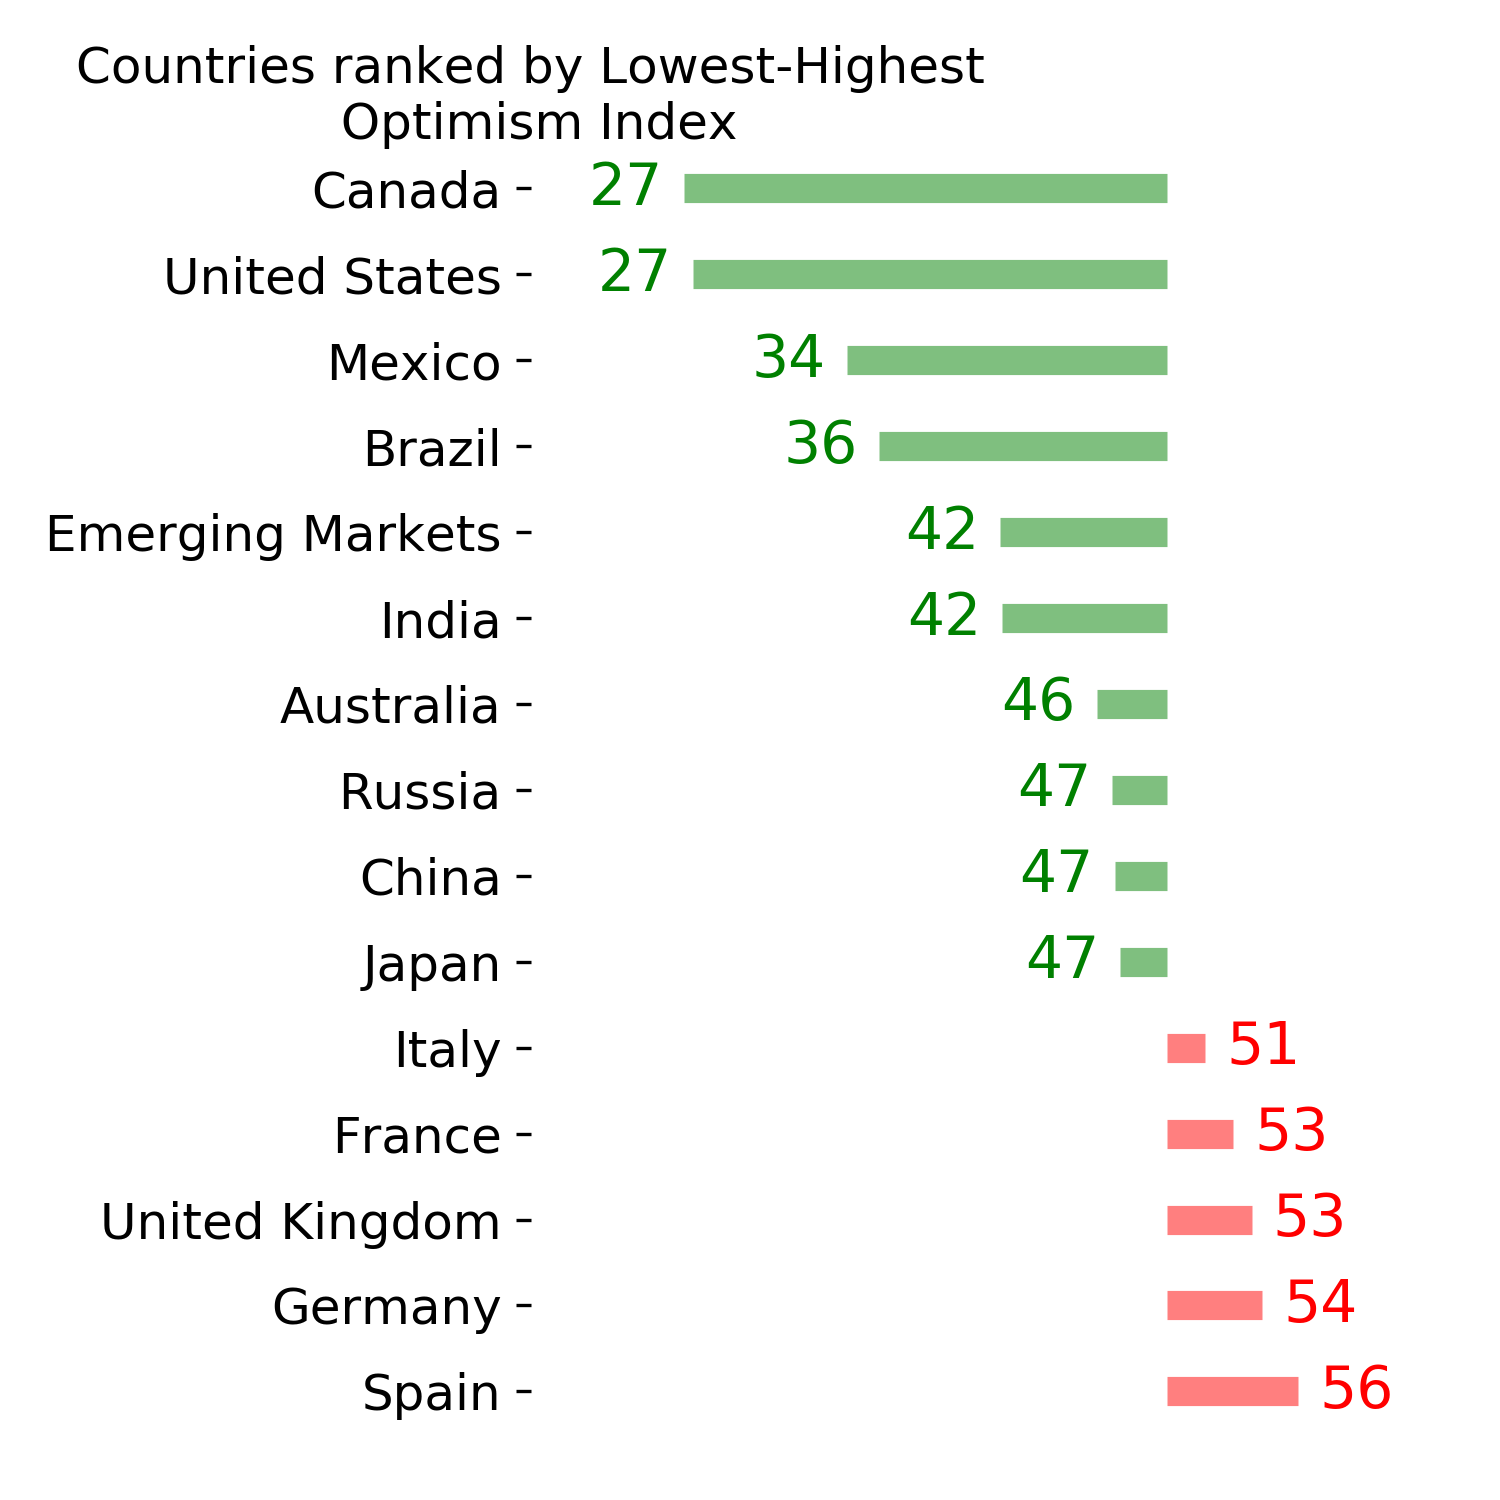
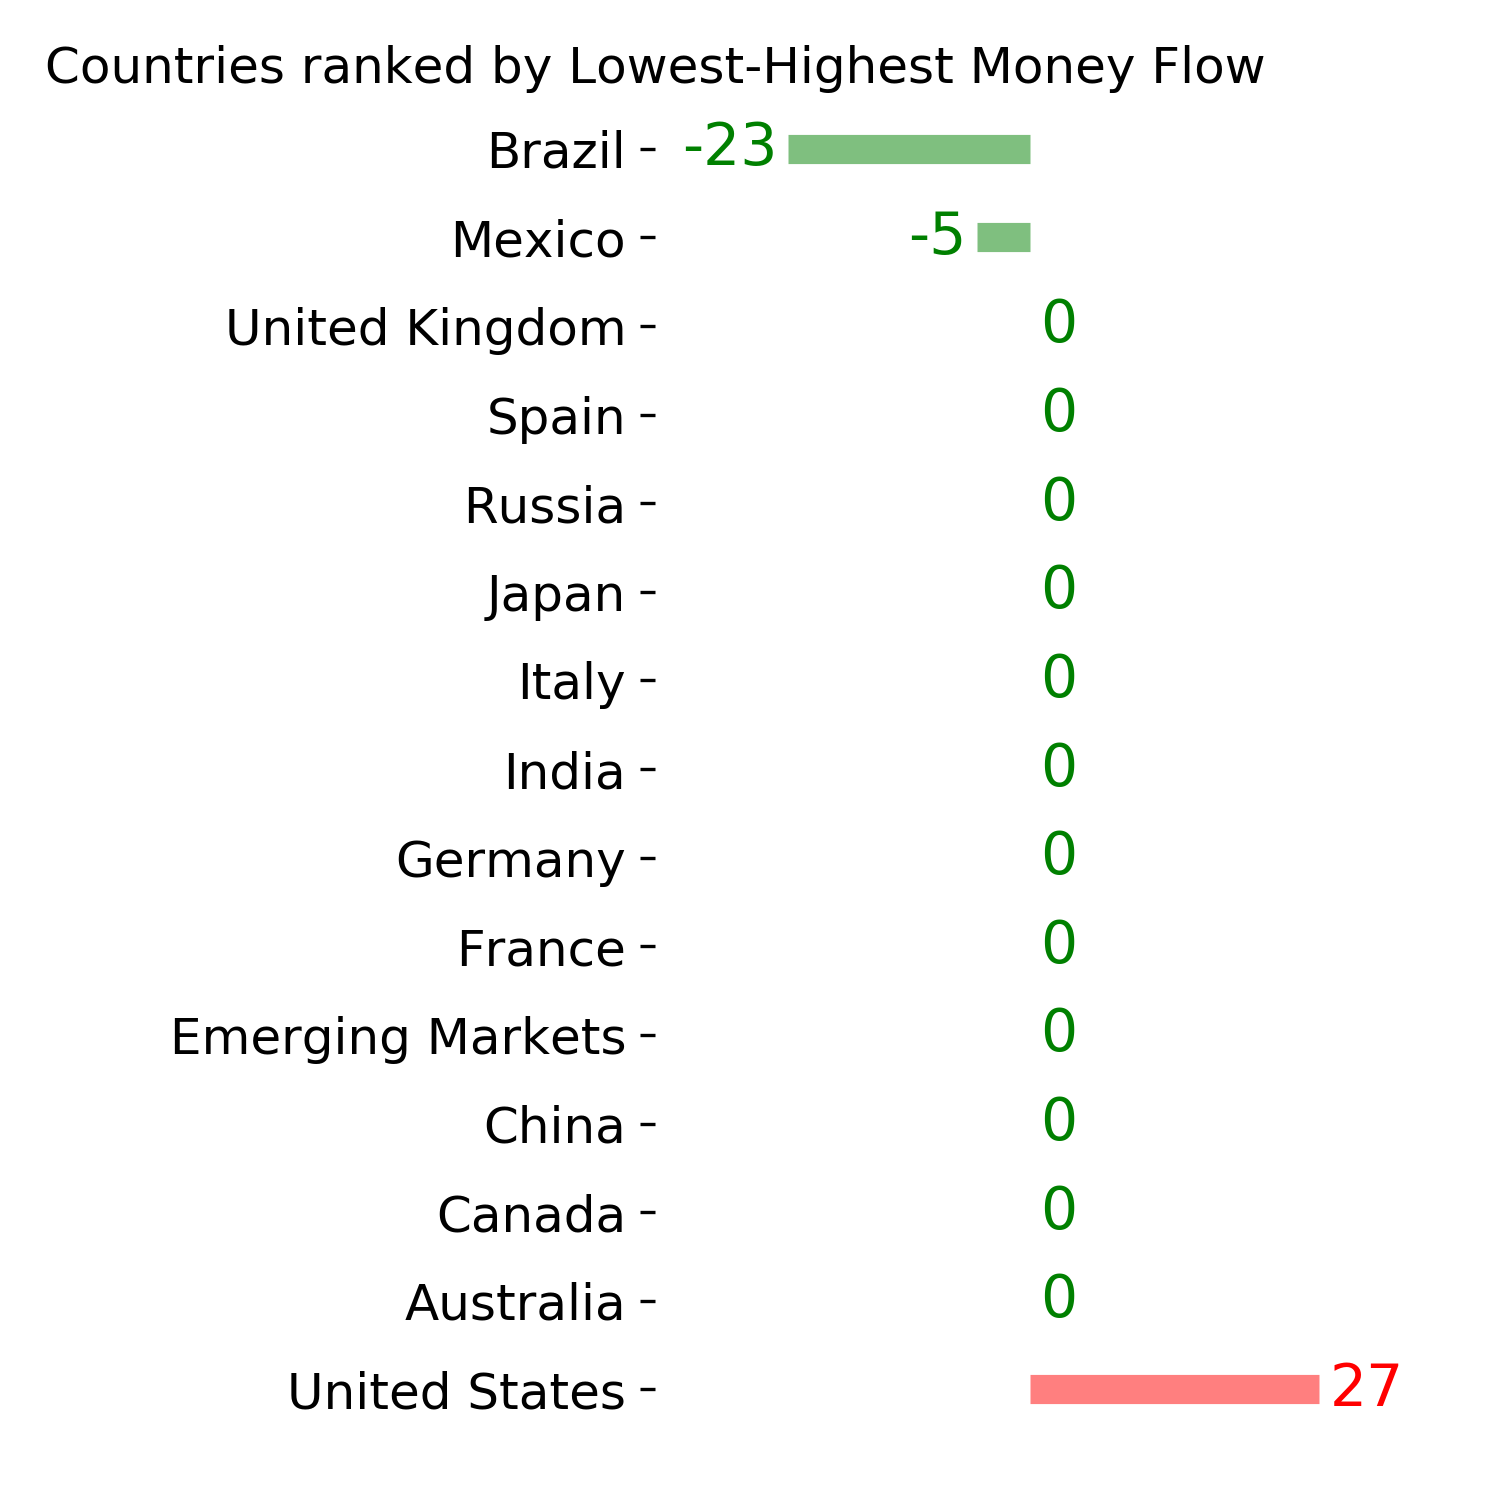
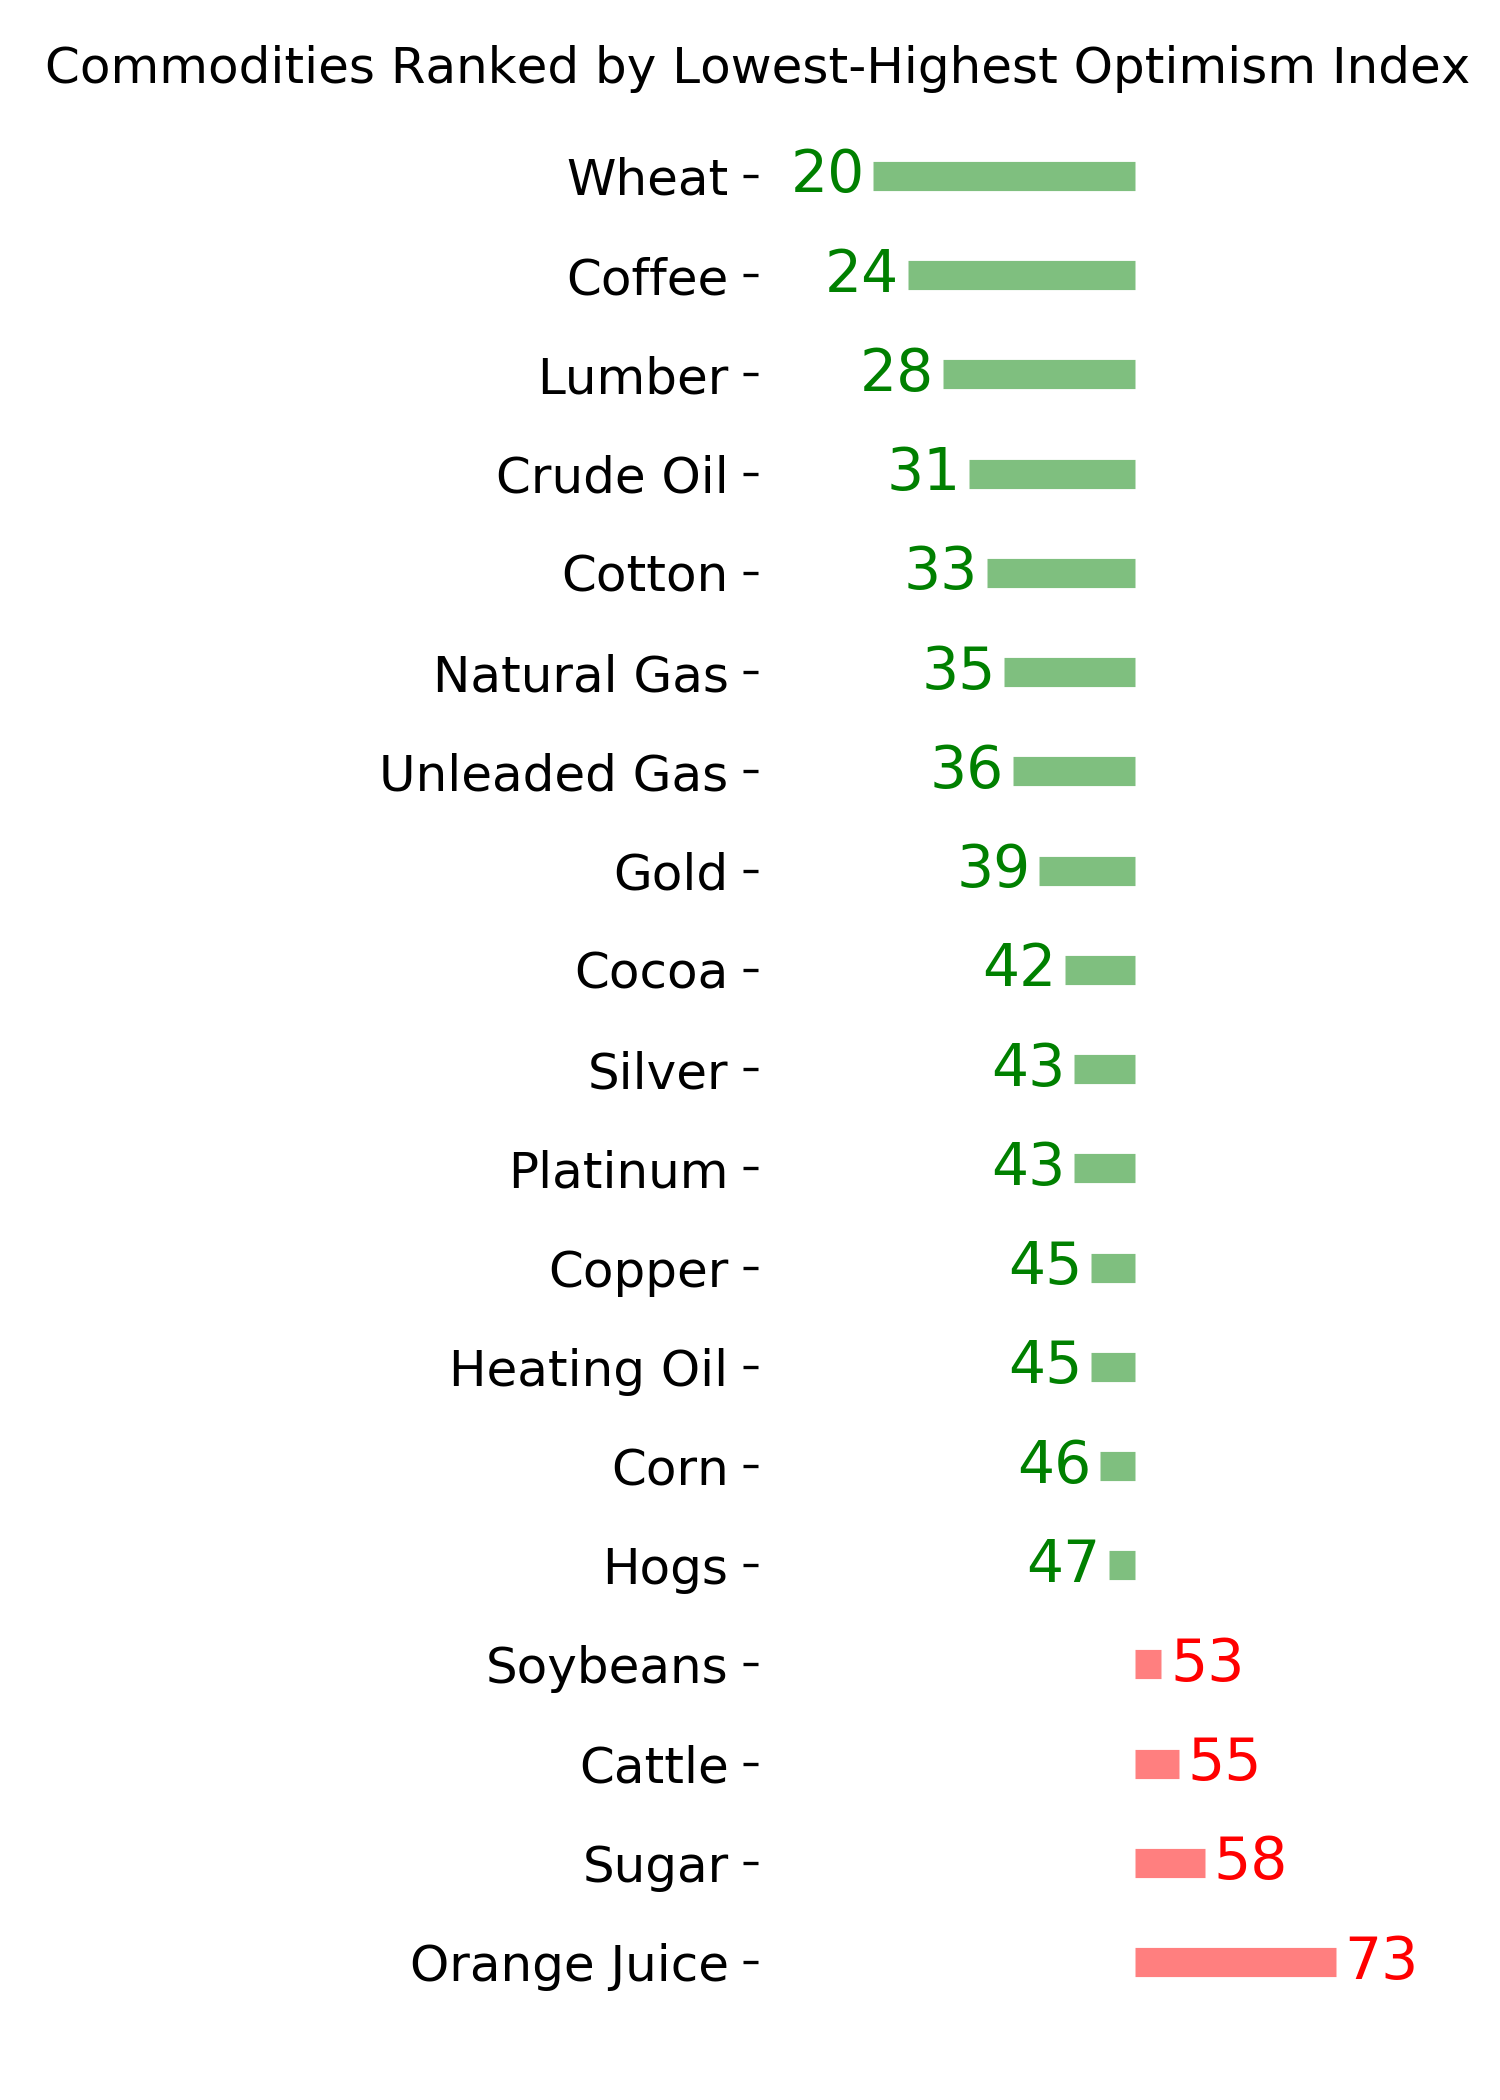
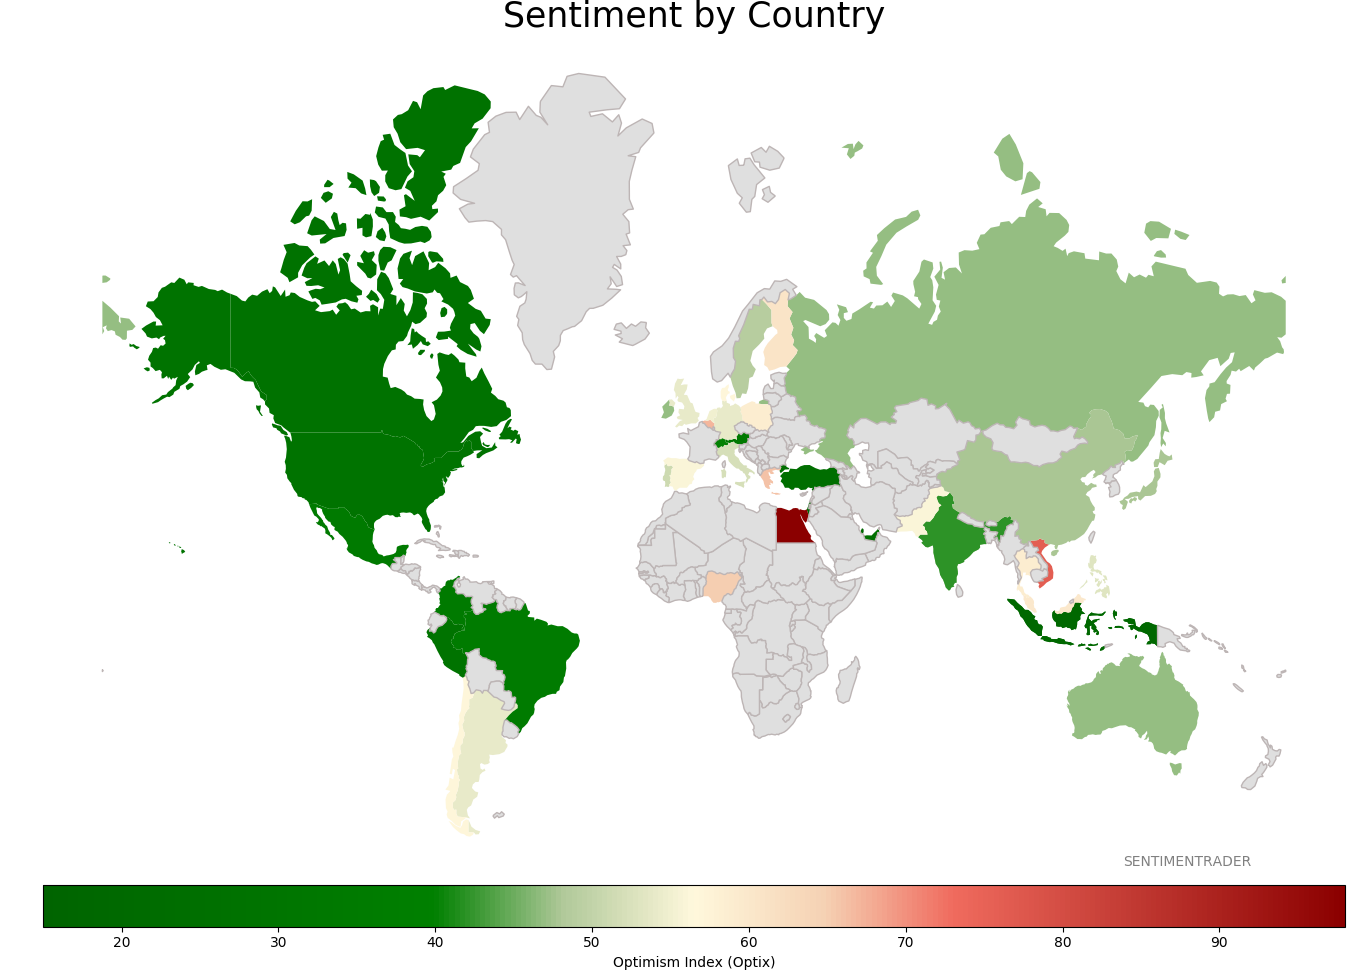
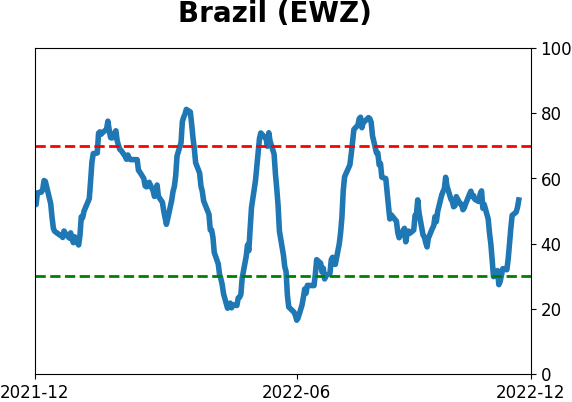
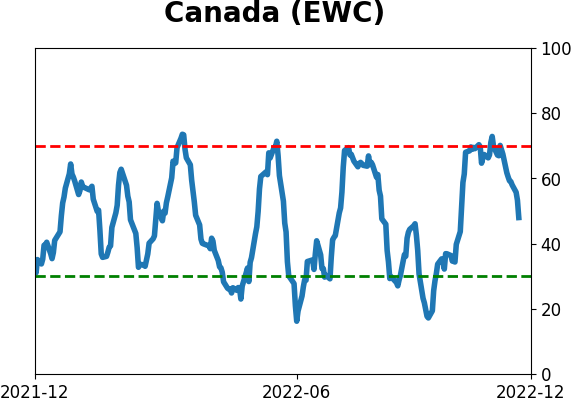
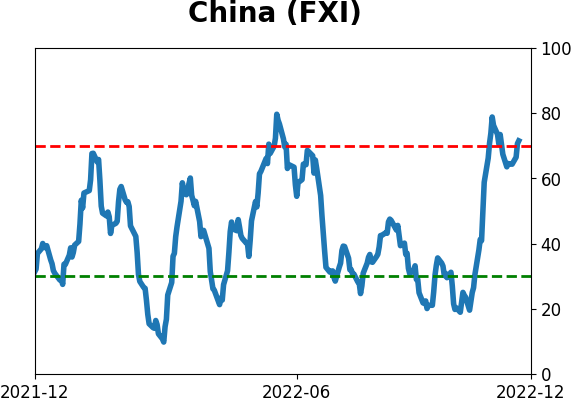
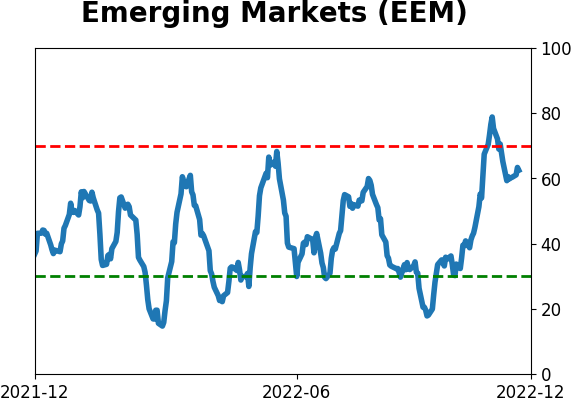
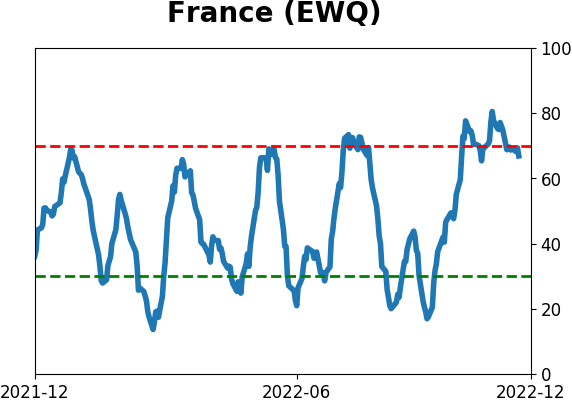
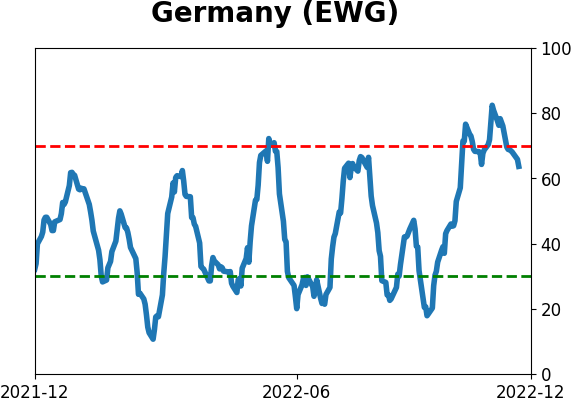
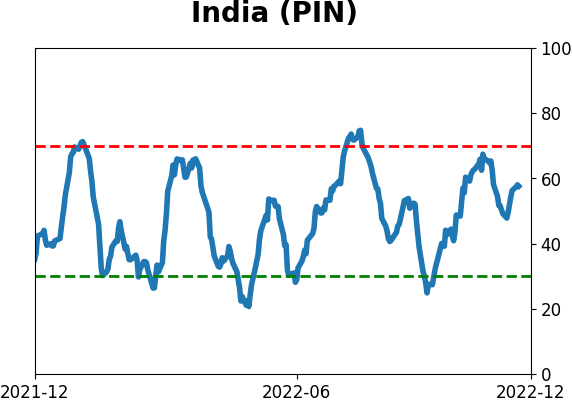
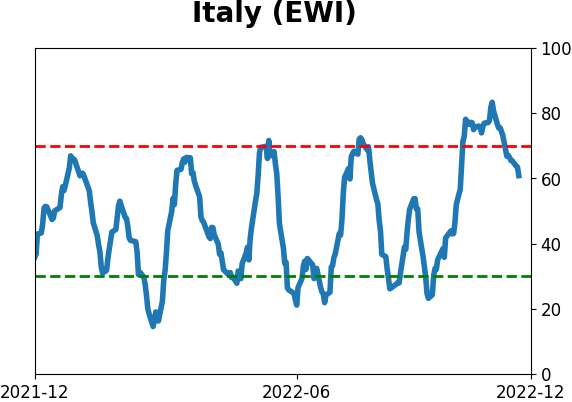
Sentiment Around The World
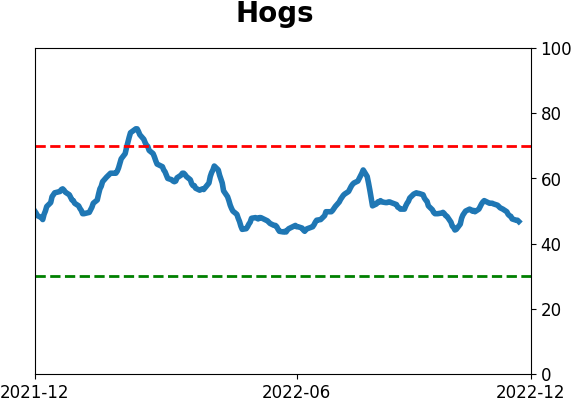
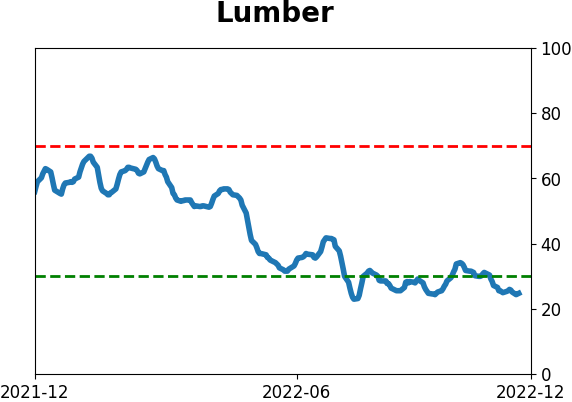
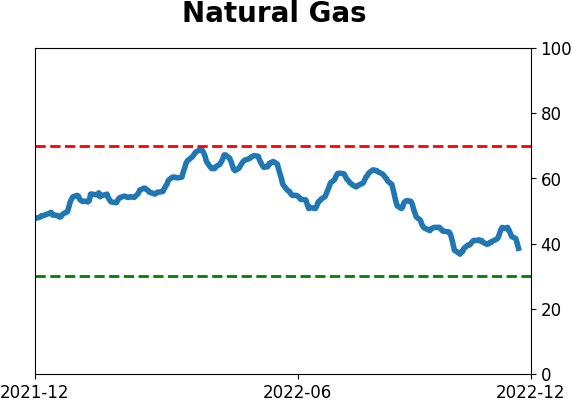
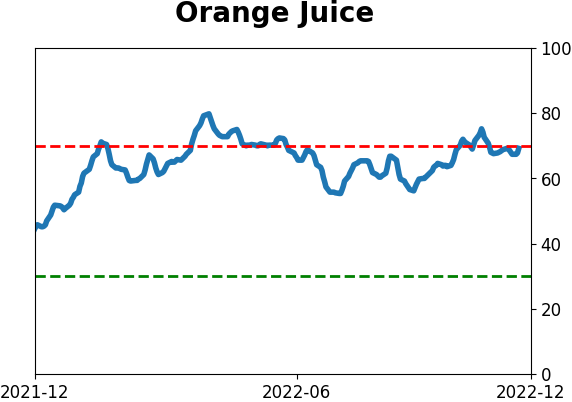
Optimism Index Thumbnails
|
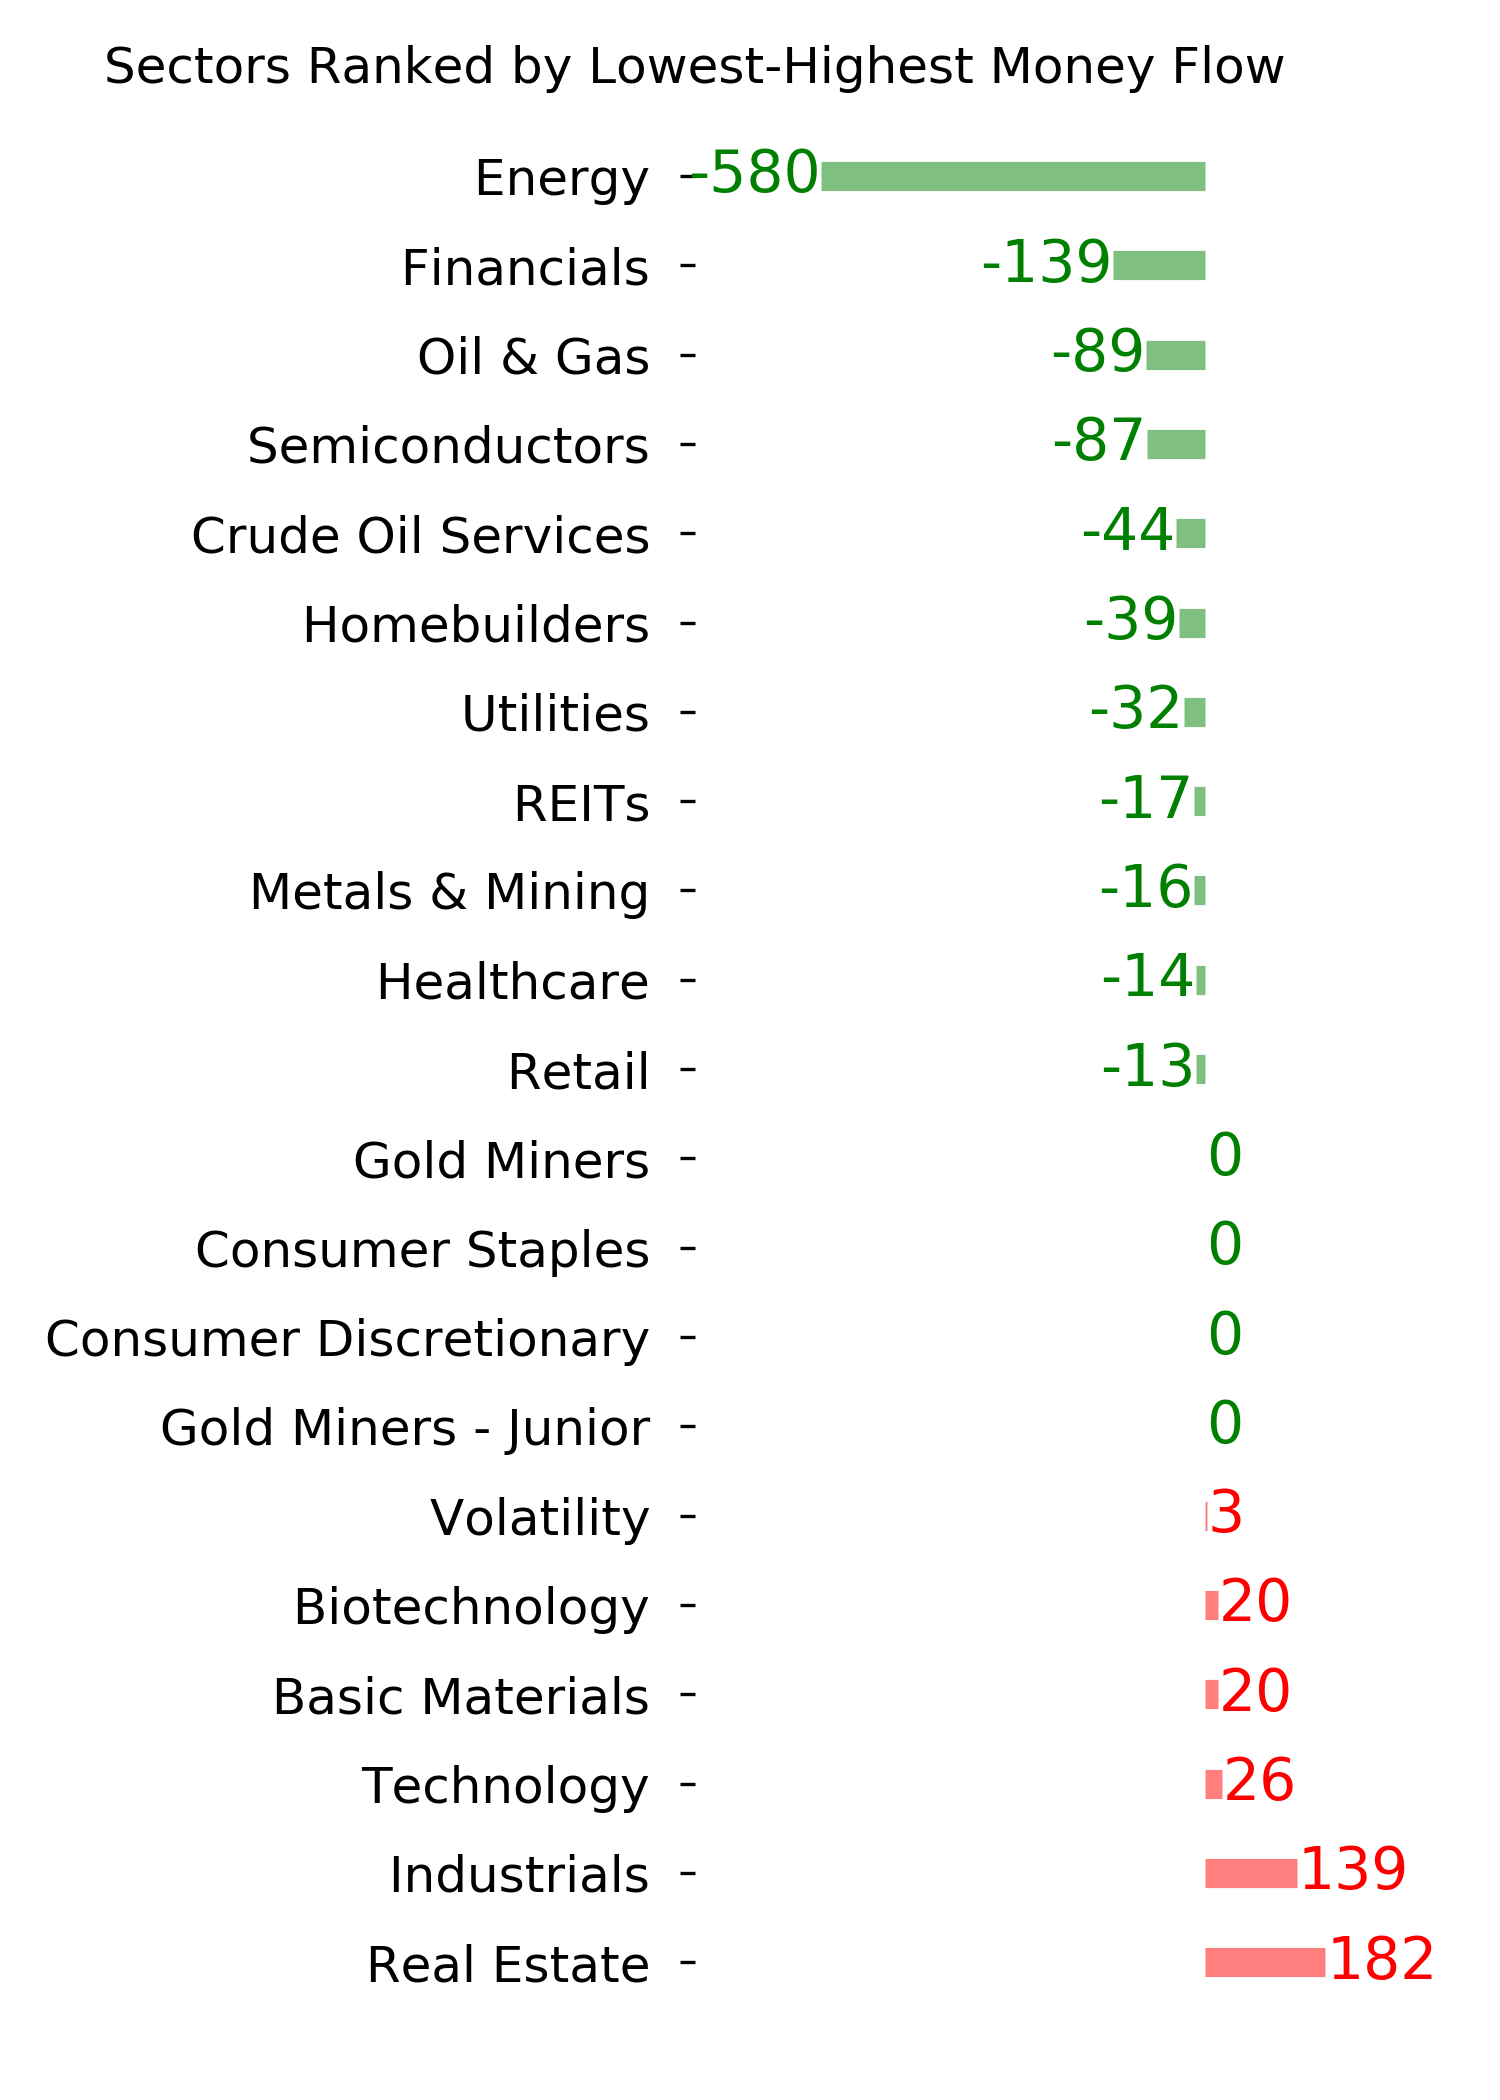
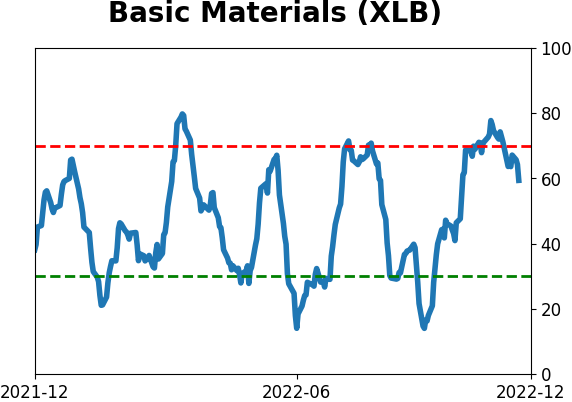
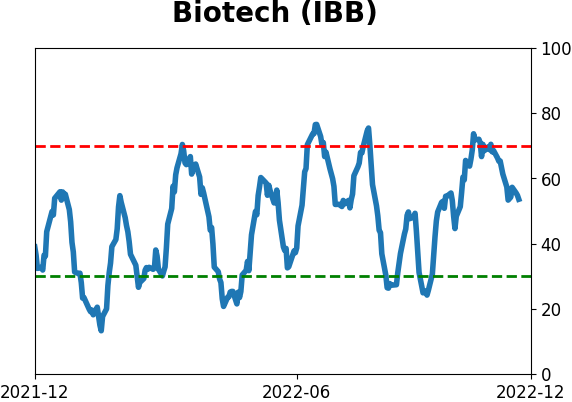
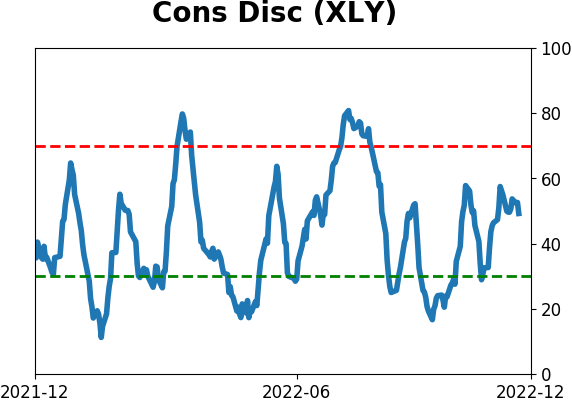
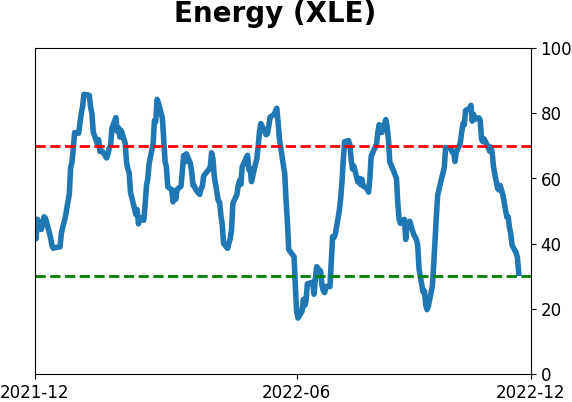
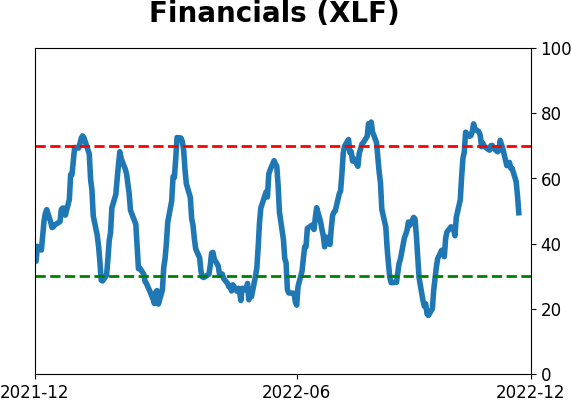
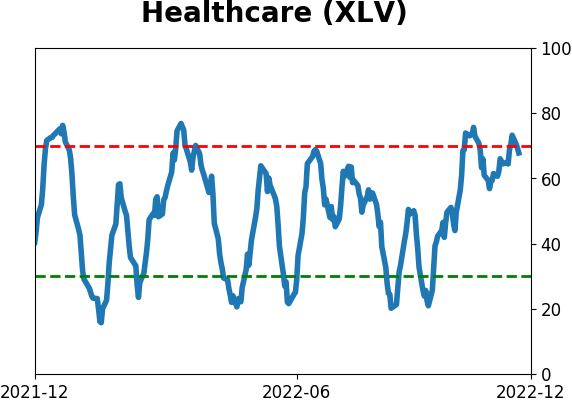
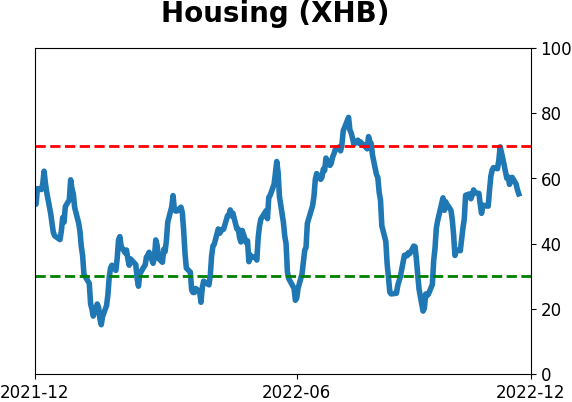
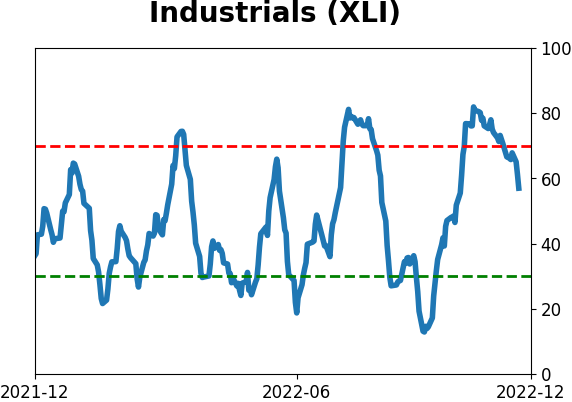
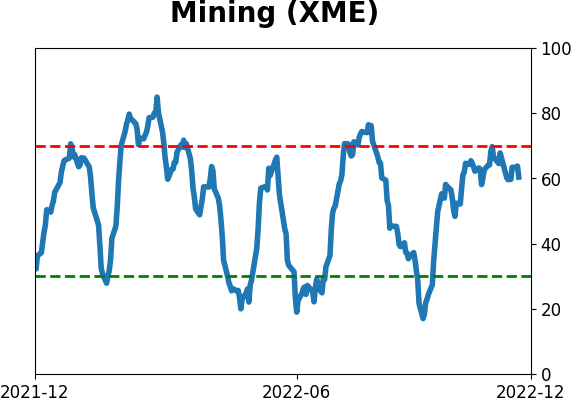
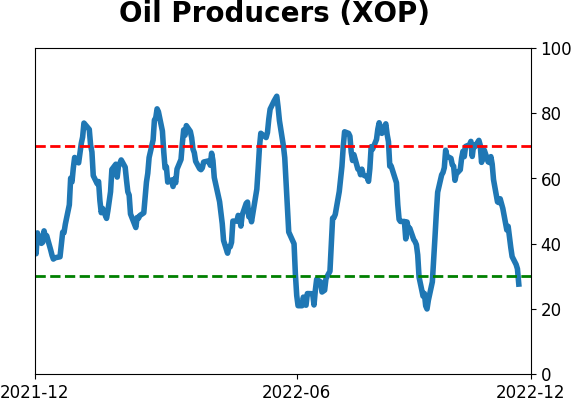
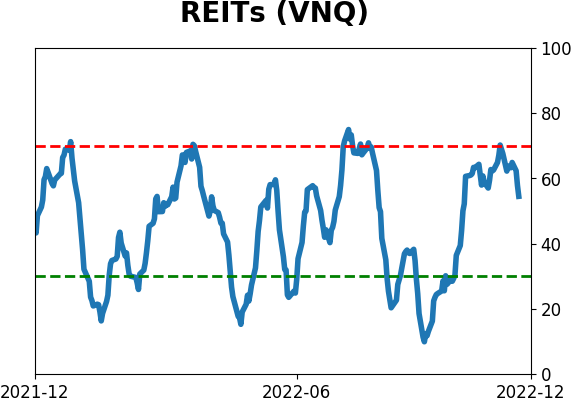
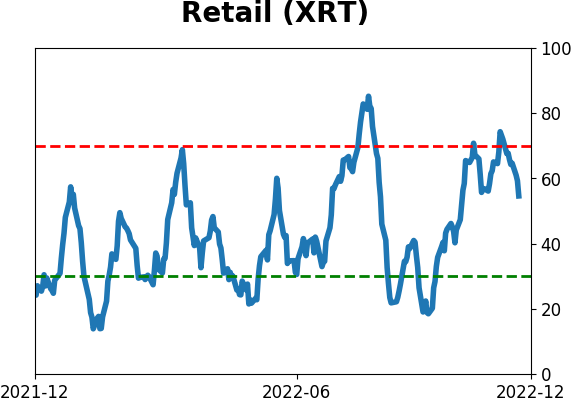
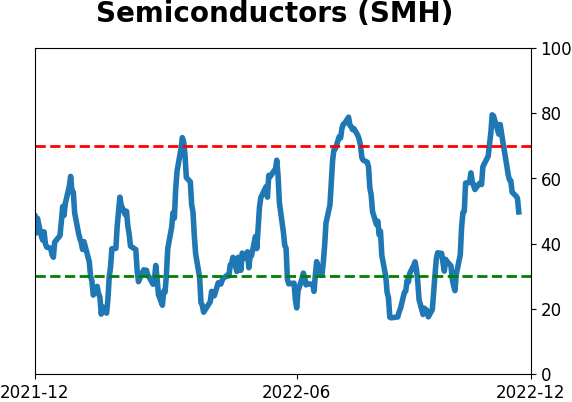
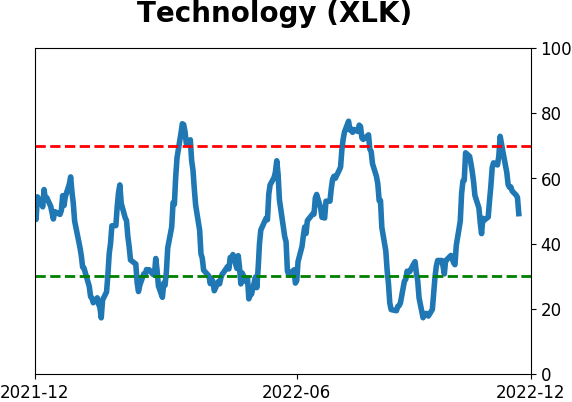
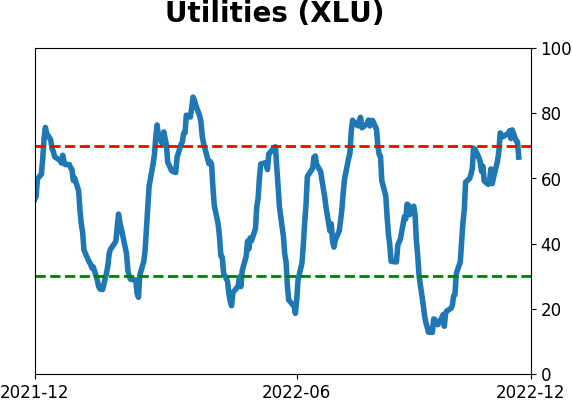
Sector ETF's - 10-Day Moving Average
|
|
|
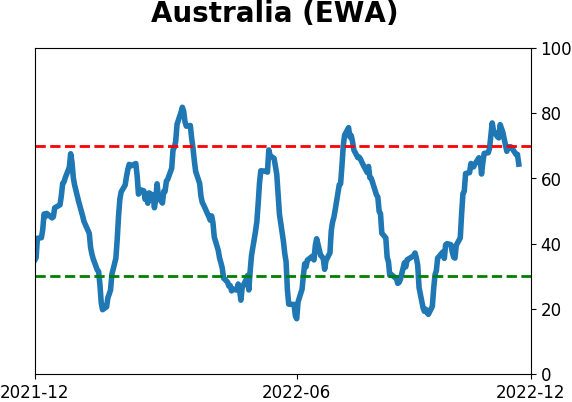
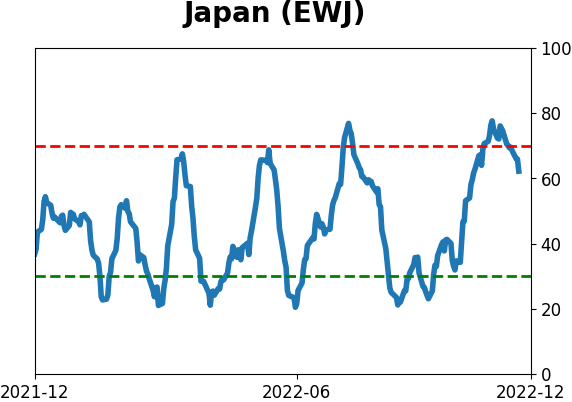
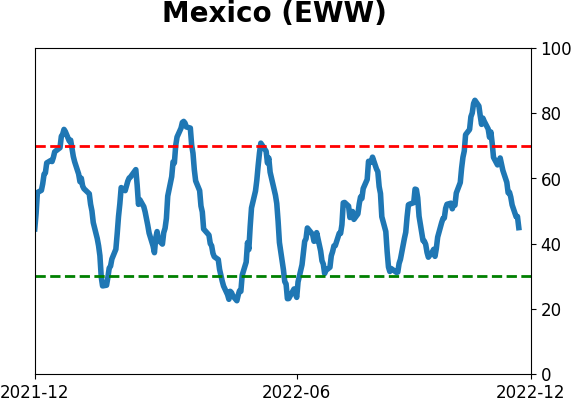
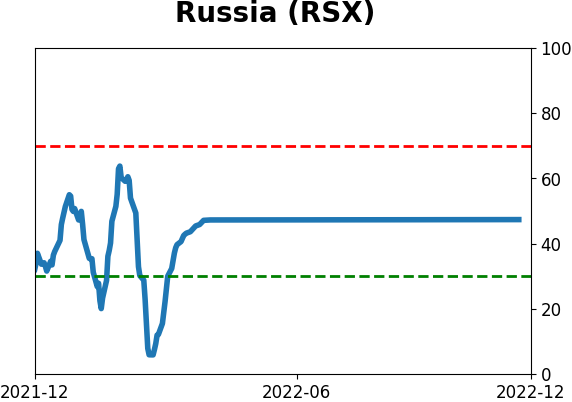
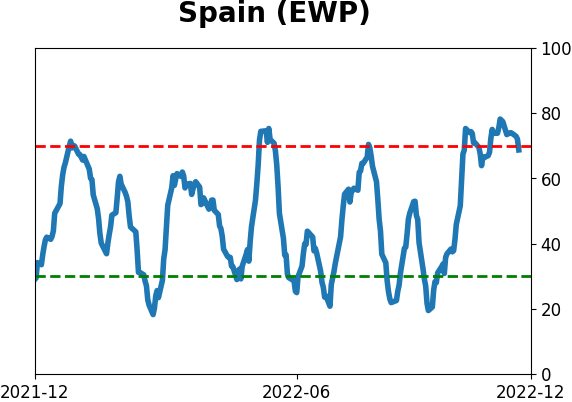
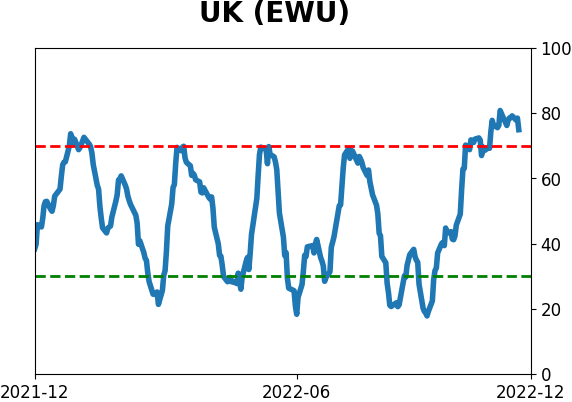
Country ETF's - 10-Day Moving Average
|
|
|
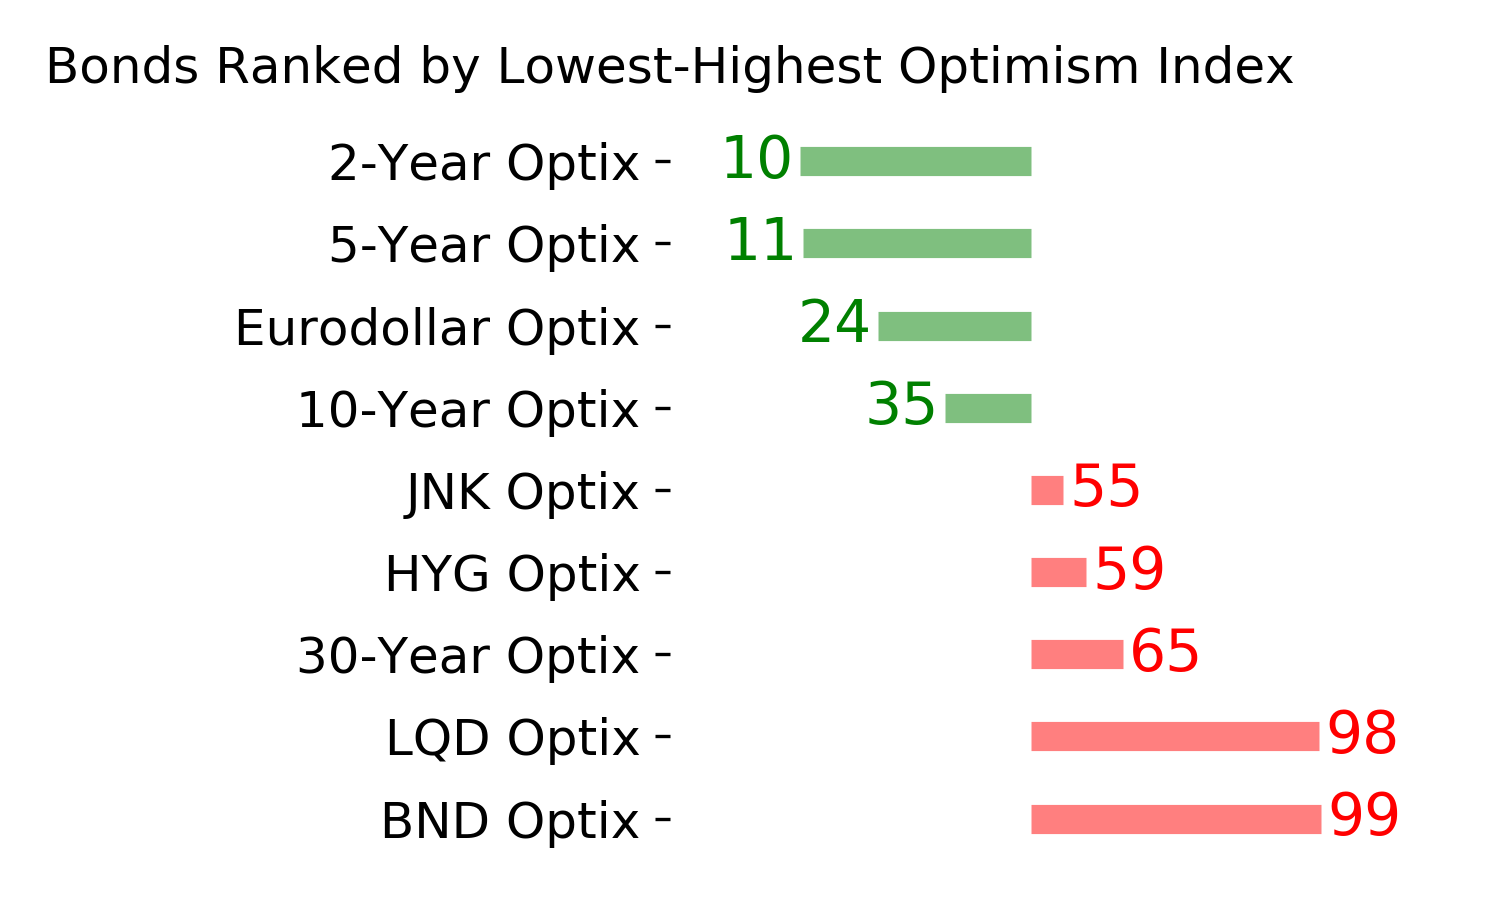
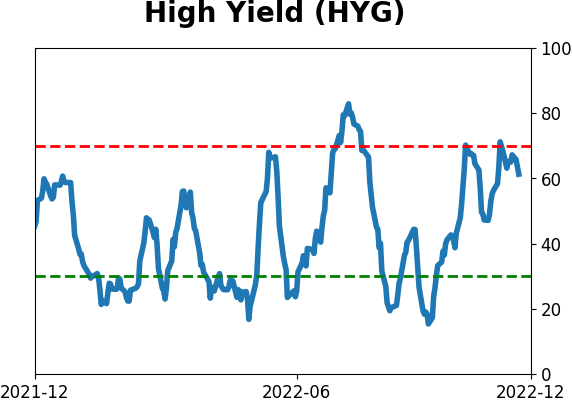
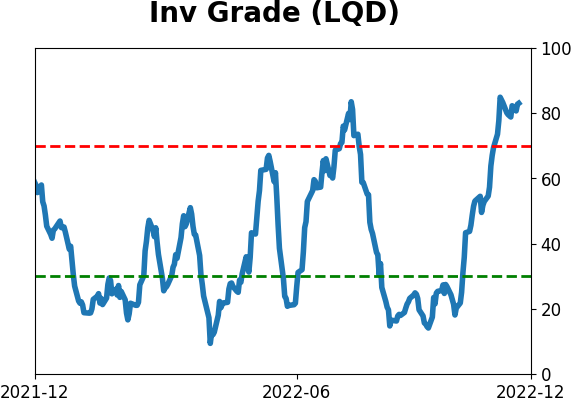
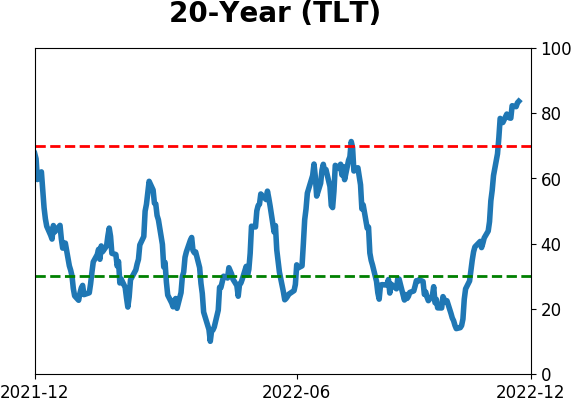
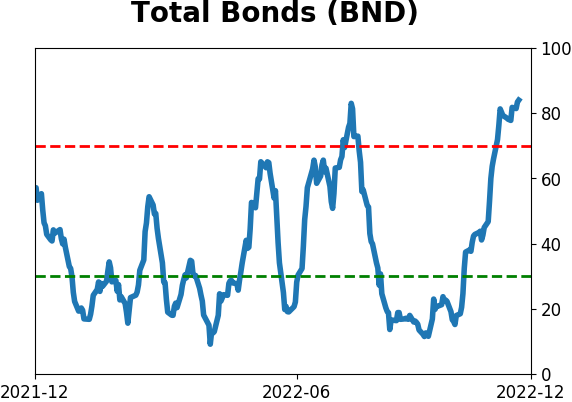
Bond ETF's - 10-Day Moving Average
|
|
|
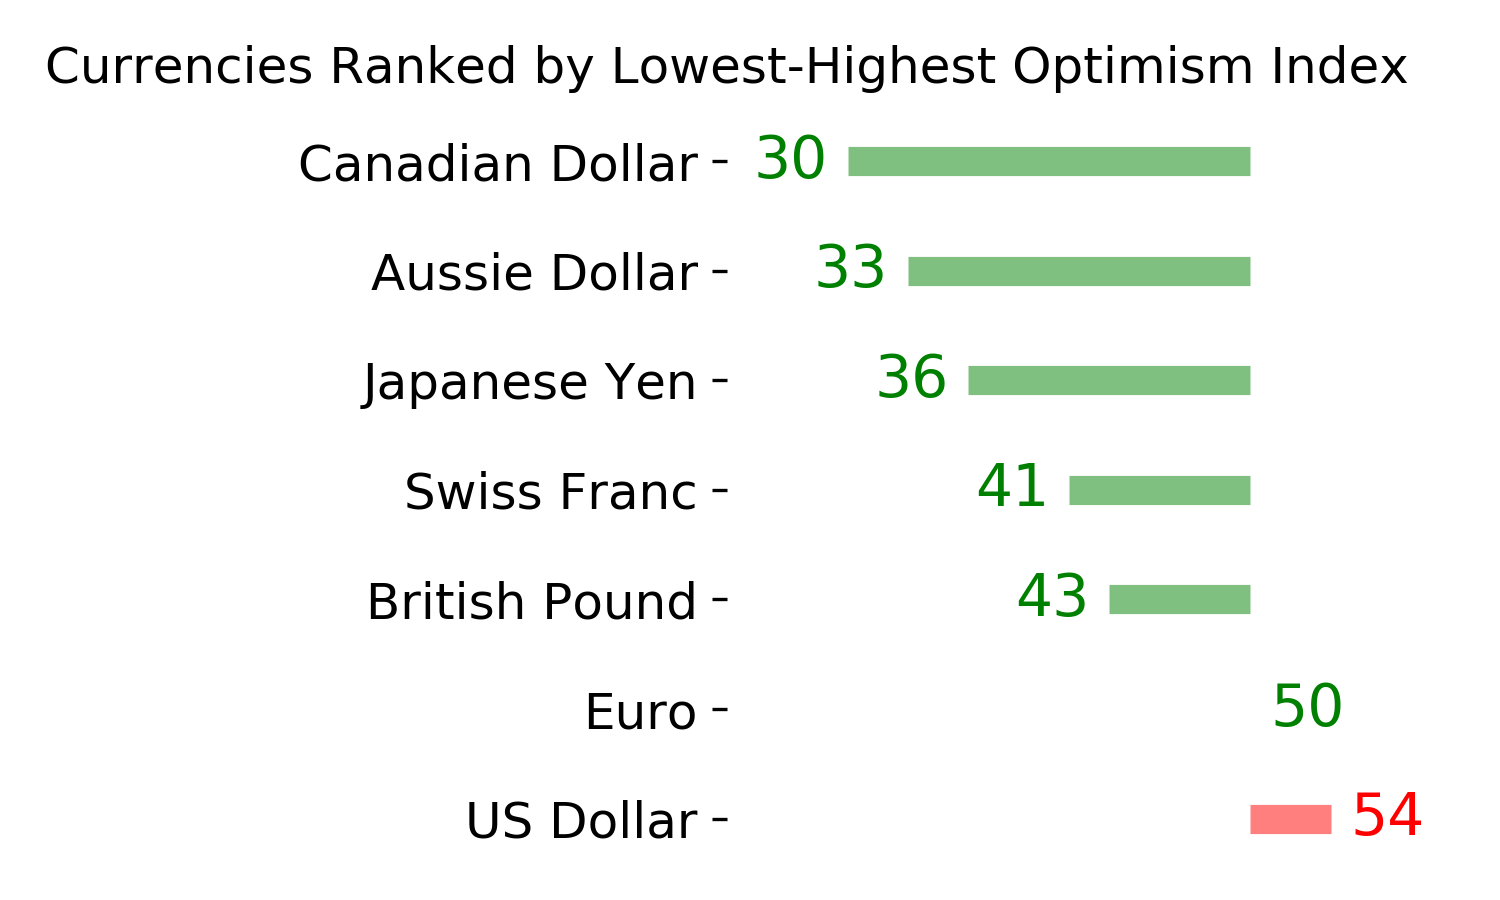
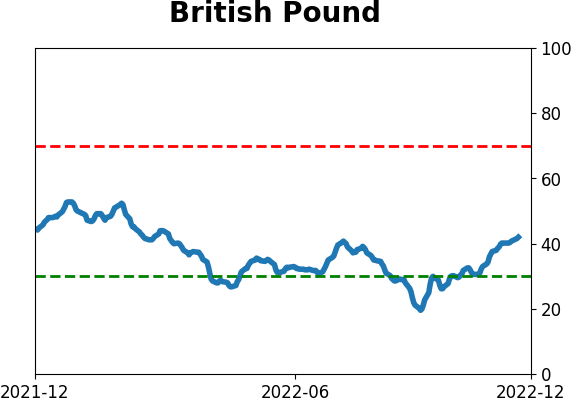
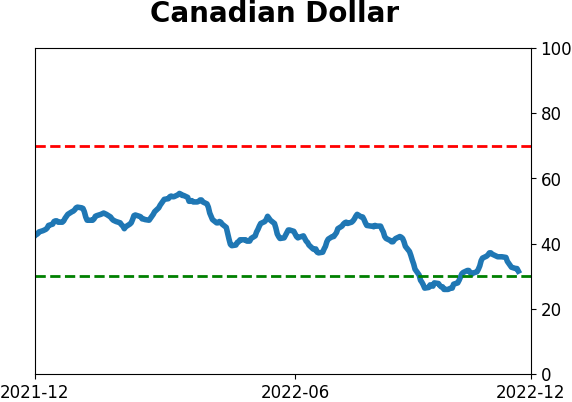
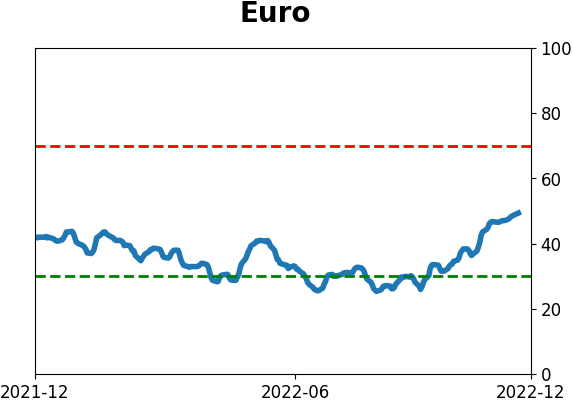
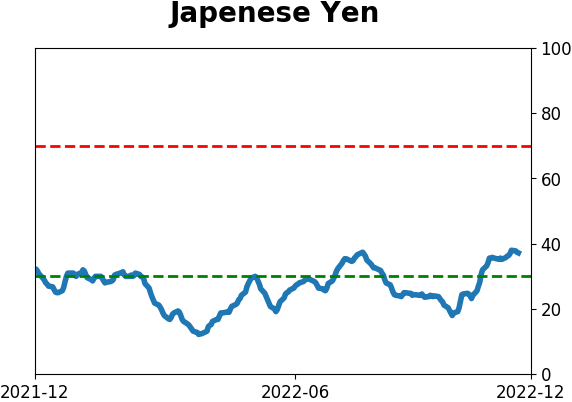
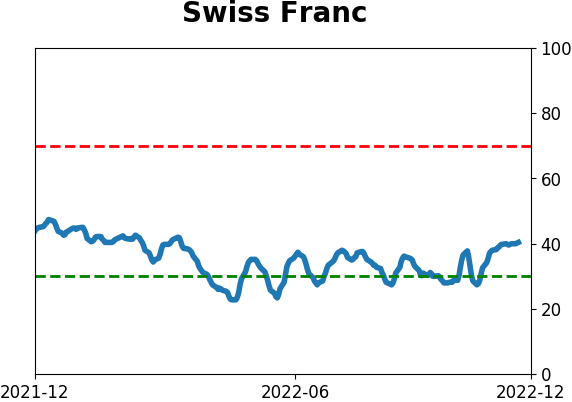
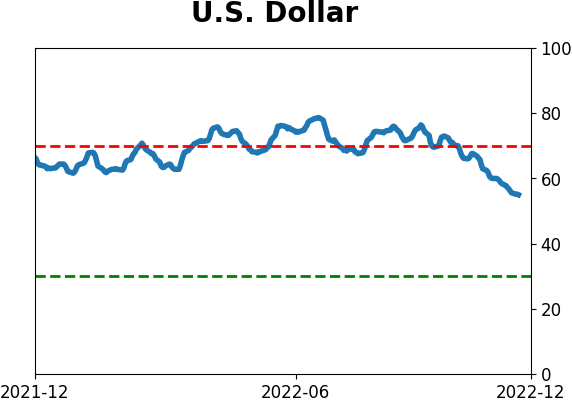
Currency ETF's - 5-Day Moving Average
|
|
|
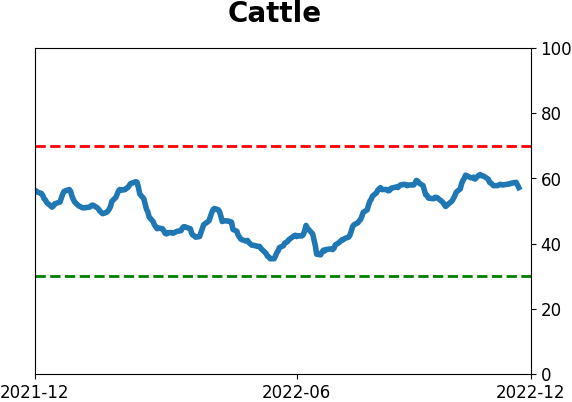
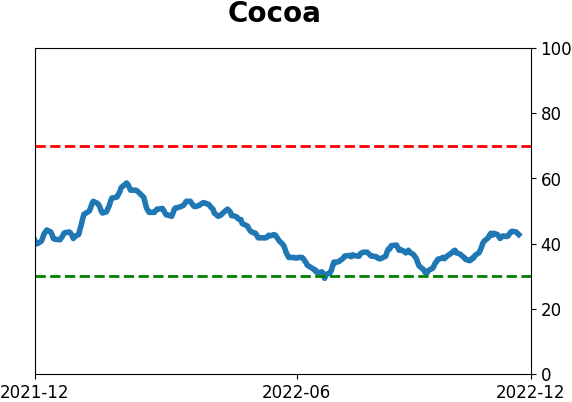
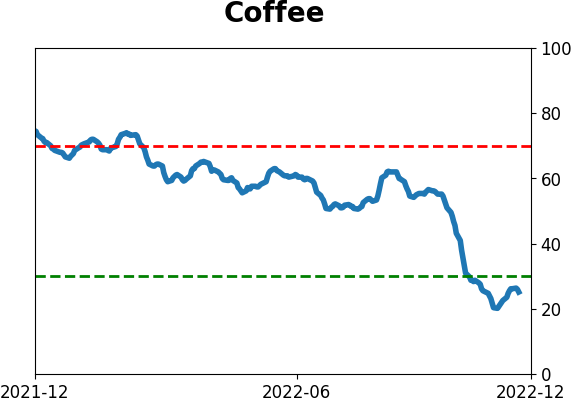
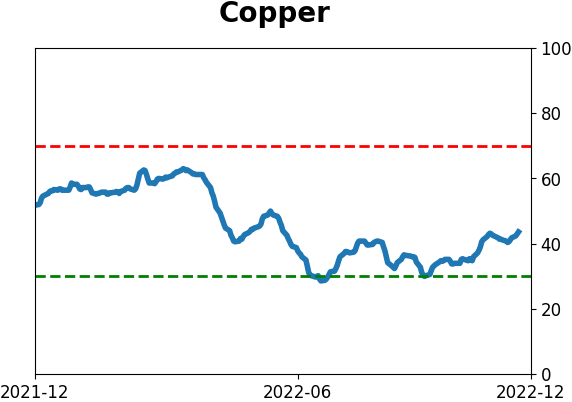
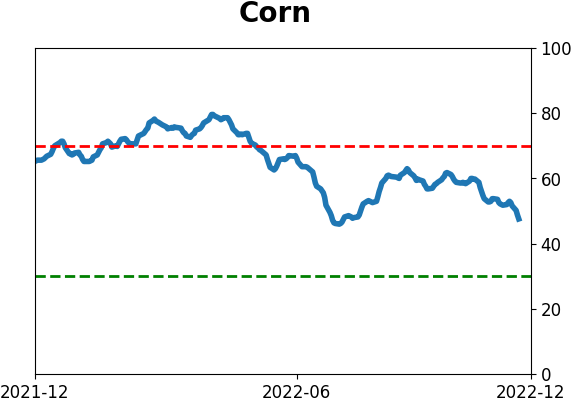
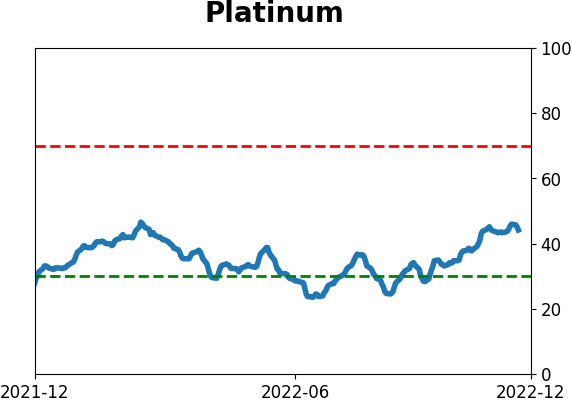
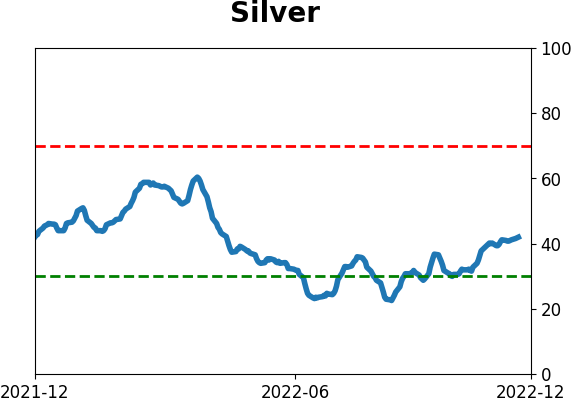
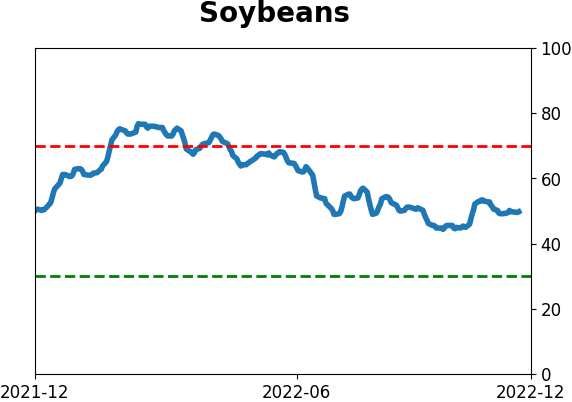
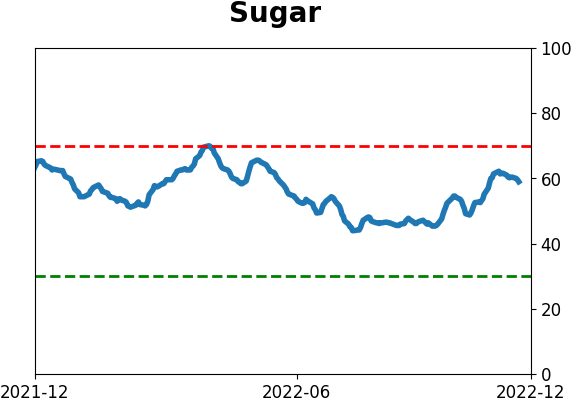
Commodity ETF's - 5-Day Moving Average
|
|