Headlines
|
|
Gold miners recover but have more work to do:
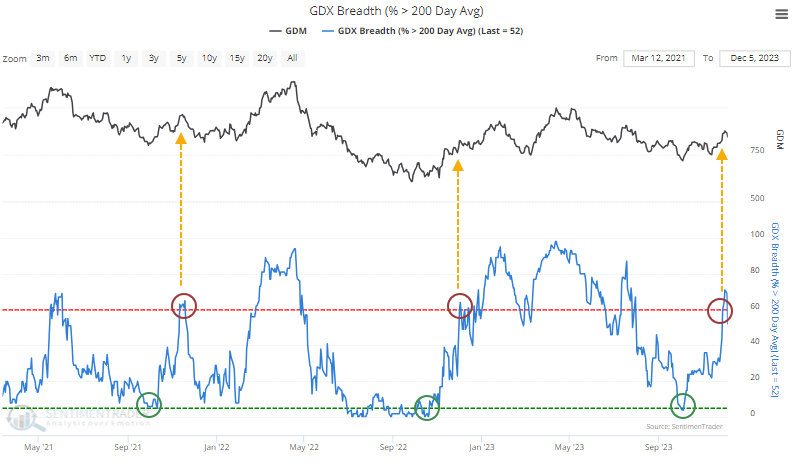
Over the past two months, gold mining stocks went from nearly universal downtrends to what looks like a healthy environment, with more than 60% of them trading above their 200-day moving averages. The group has had a very difficult time holding positive momentum, and how the next two months unfold should say a lot about their prospects.
|
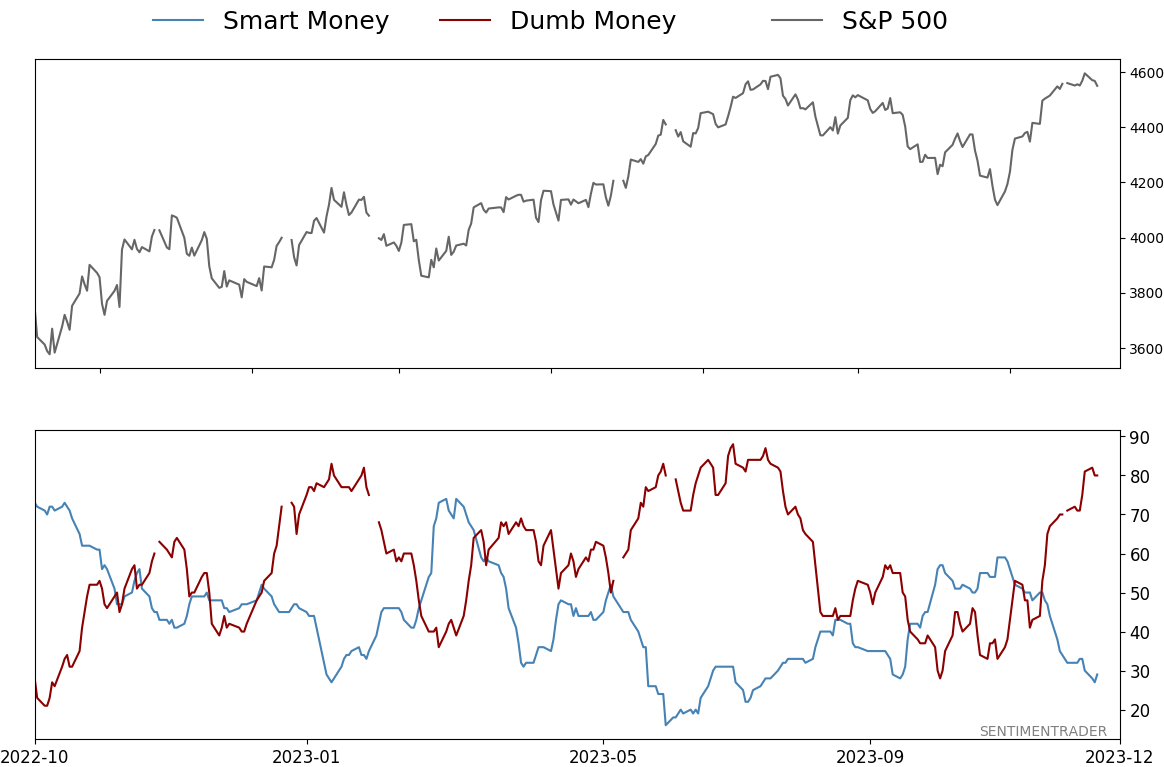
Smart / Dumb Money Confidence
|
Smart Money Confidence: 29%
Dumb Money Confidence: 80%
|
|
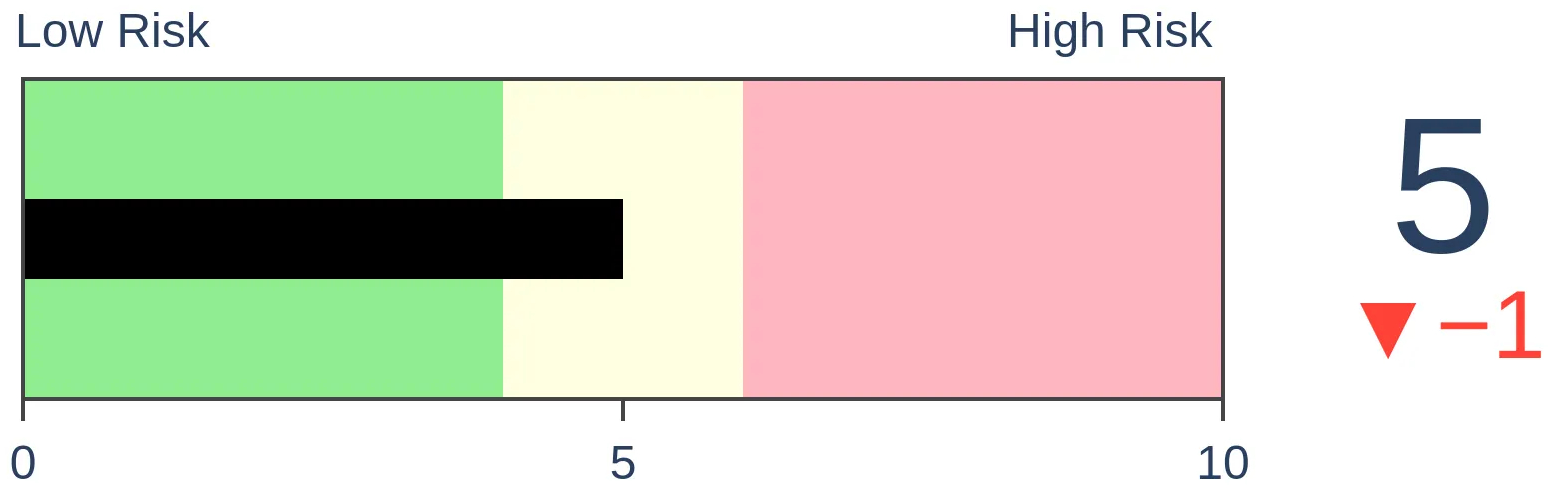
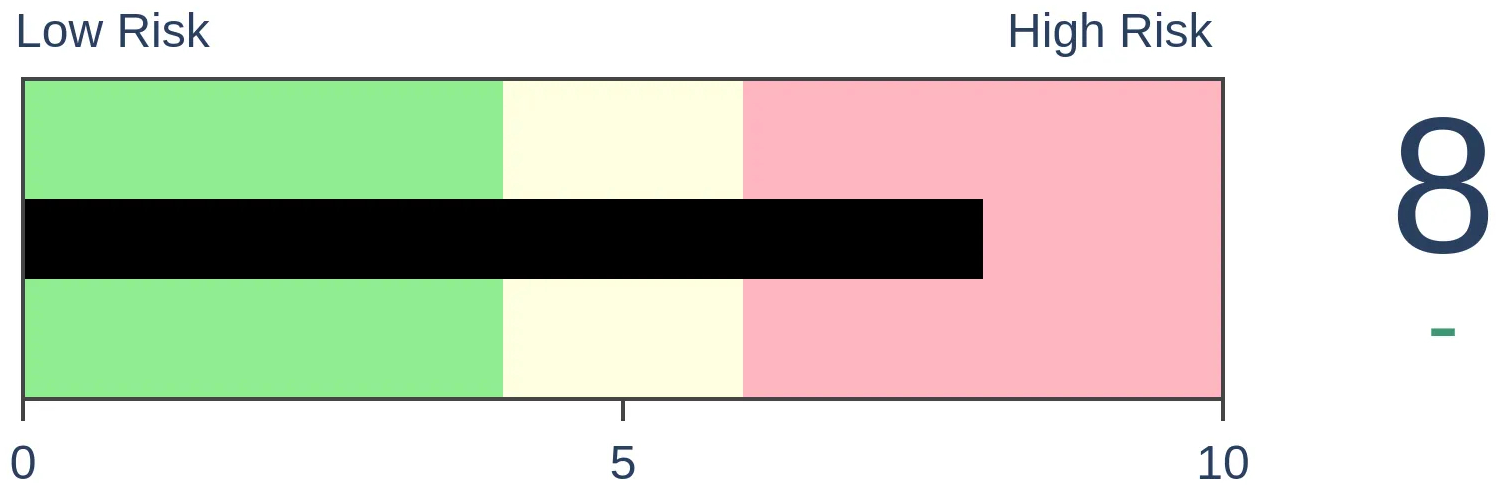
Risk Levels
Stocks Short-Term
|
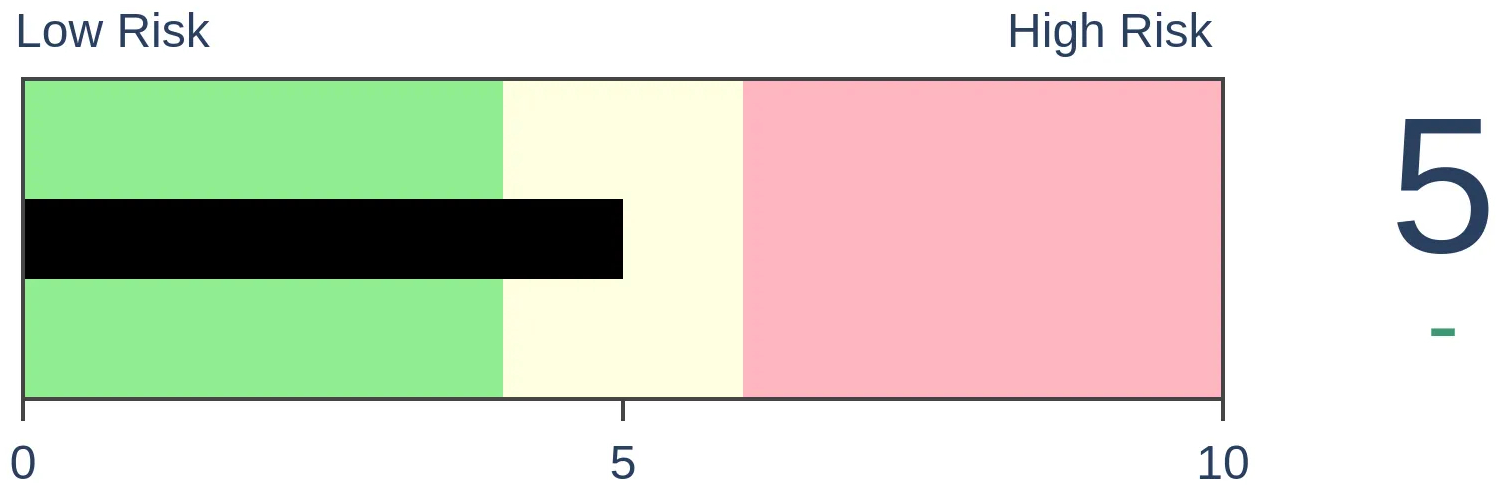
Stocks Medium-Term
|
|
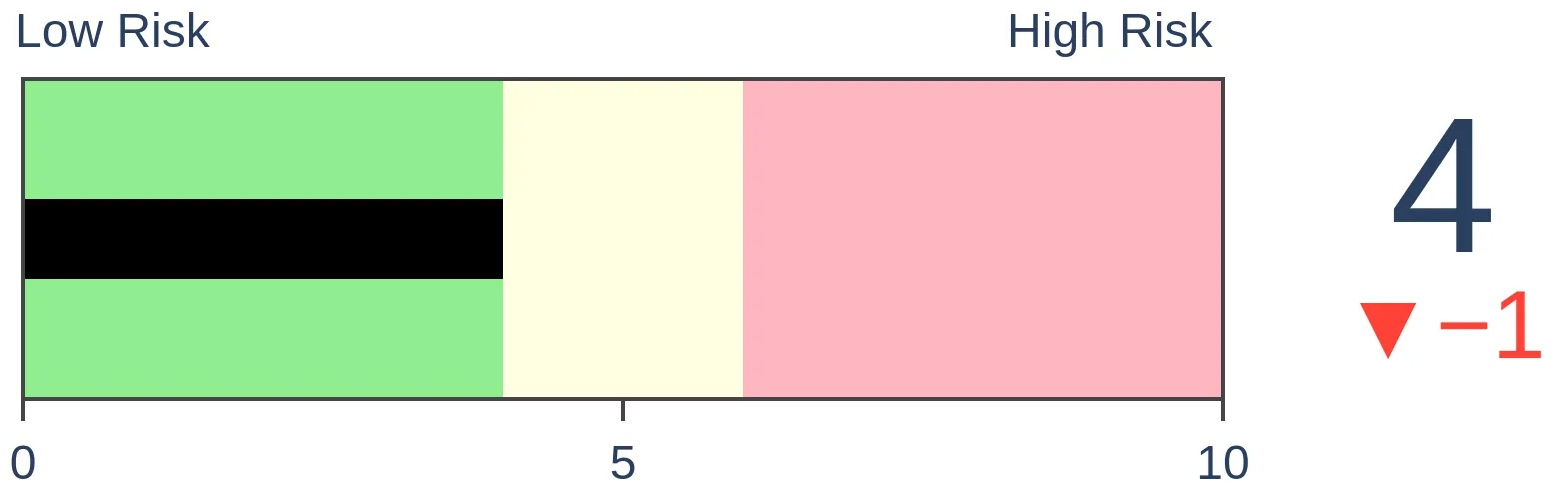
Bonds
|
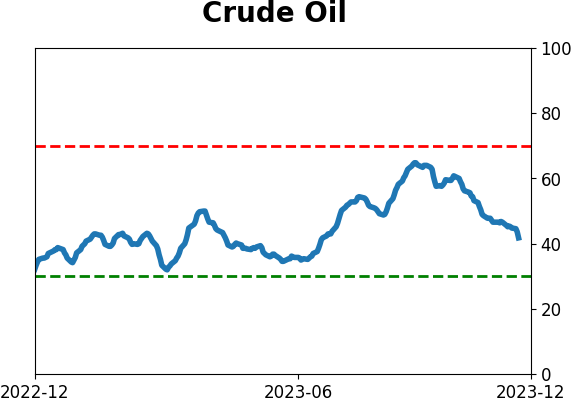
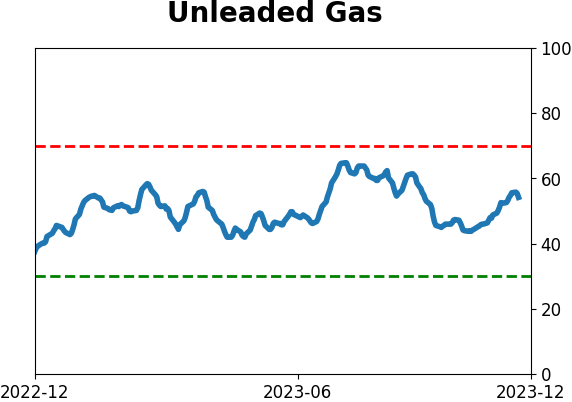
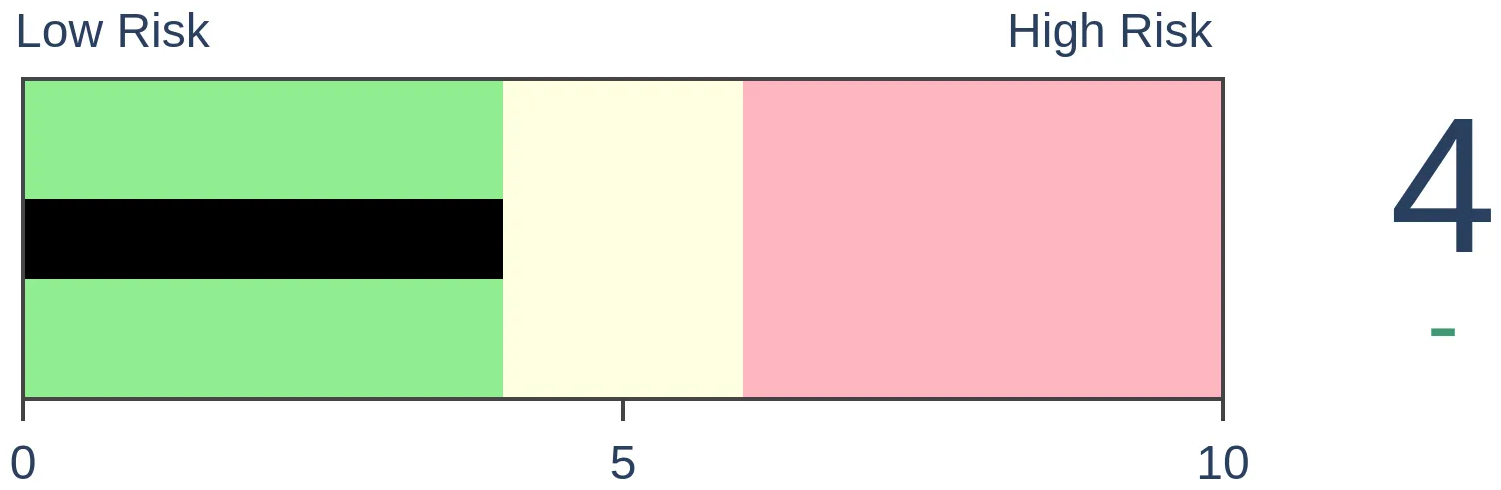
Crude Oil
|
|
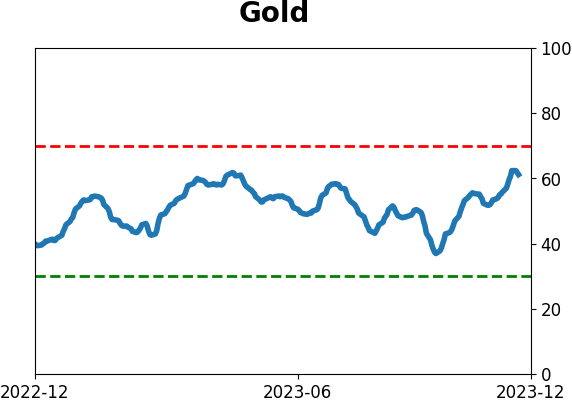
Gold
|
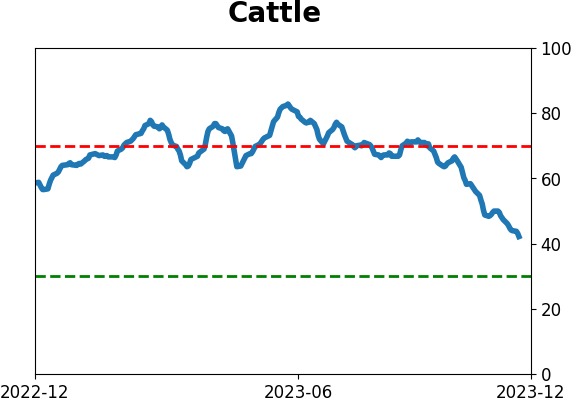
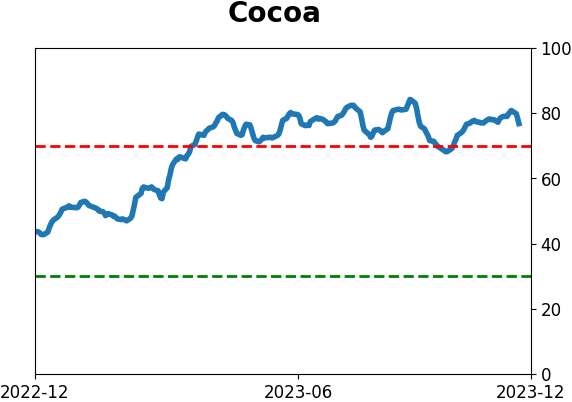
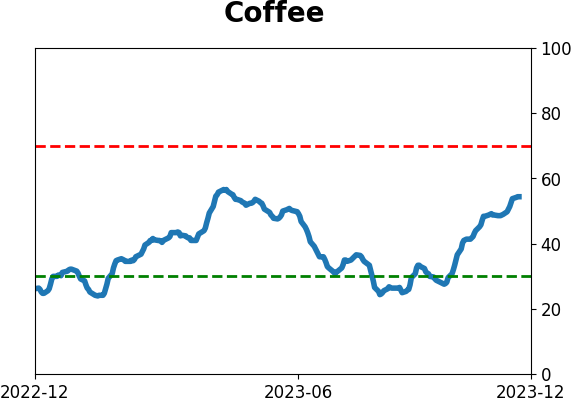
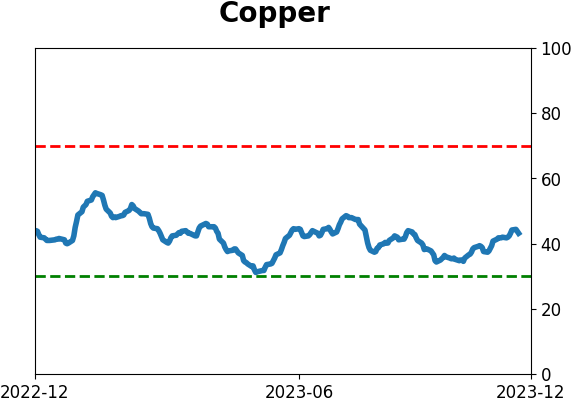
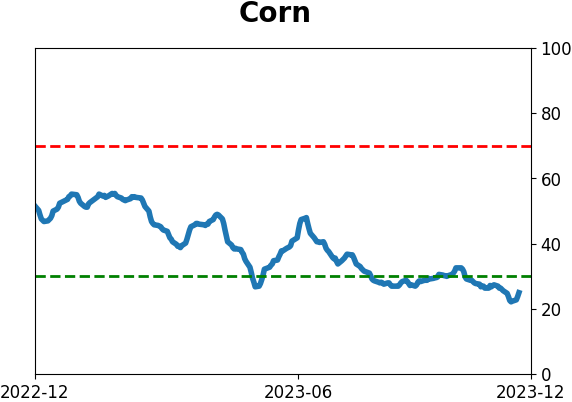
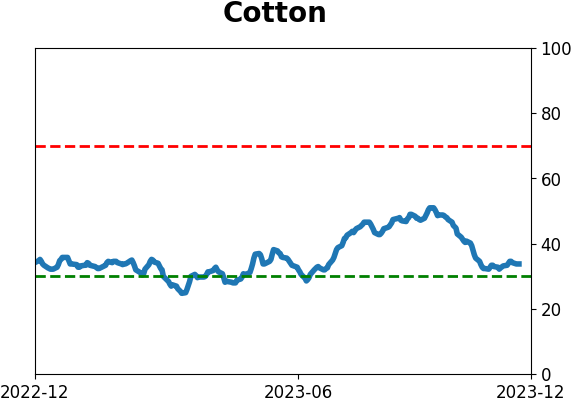
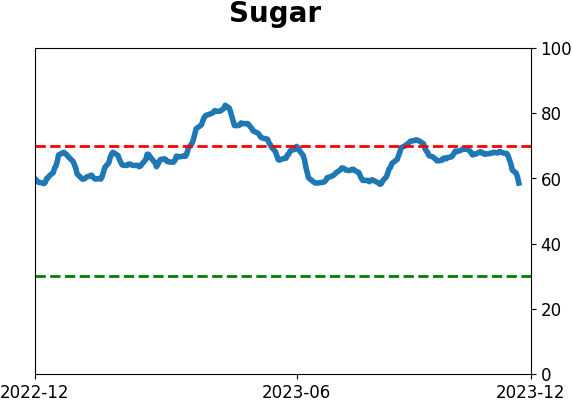
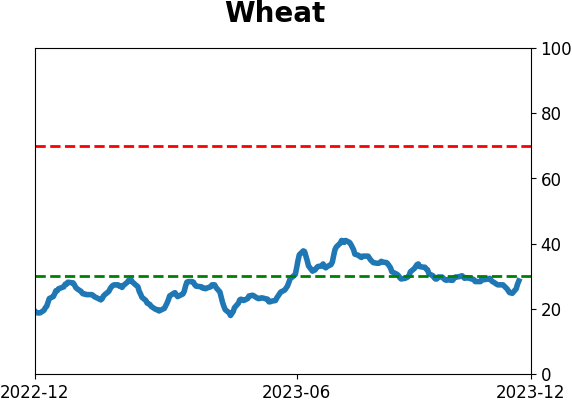
Agriculture

|
|
Research
By Jason Goepfert
BOTTOM LINE
Over the past two months, gold mining stocks went from nearly universal downtrends to what looks like a healthy environment, with more than 60% of them trading above their 200-day moving averages. The group has had a very difficult time holding positive momentum, and how the next two months unfold should say a lot about their prospects.
FORECAST / TIMEFRAME
None
|
Key points:
- Gold mining stocks have shown an impressive recovery in long-term uptrends
- Over the past 40 years, the group has had an extremely difficult time holding positive momentum
- How the next two months unfold should say a lot about the longer-term prospects
It's tough to be a gold bug
After gold enjoyed an explosive rally once it broke to an all-time high, it drug gold miners with it. For a while, then it all reversed.
This is par for the course for gold bugs, who have suffered this type of price action for decades. Out of almost all niche sectors, it has been among the most difficult for gold mining stocks to keep up positive momentum.
Many of the stocks had been doing quite well already. The percentage of gold miners above their 200-day moving average reached washout levels in October then recovered to encompass more than 60% of them. That's the typical threshold we use for healthy markets; sustainable bull markets - in most sectors - happen when 60% or more of the constituent stocks hold above their long-term moving averages.
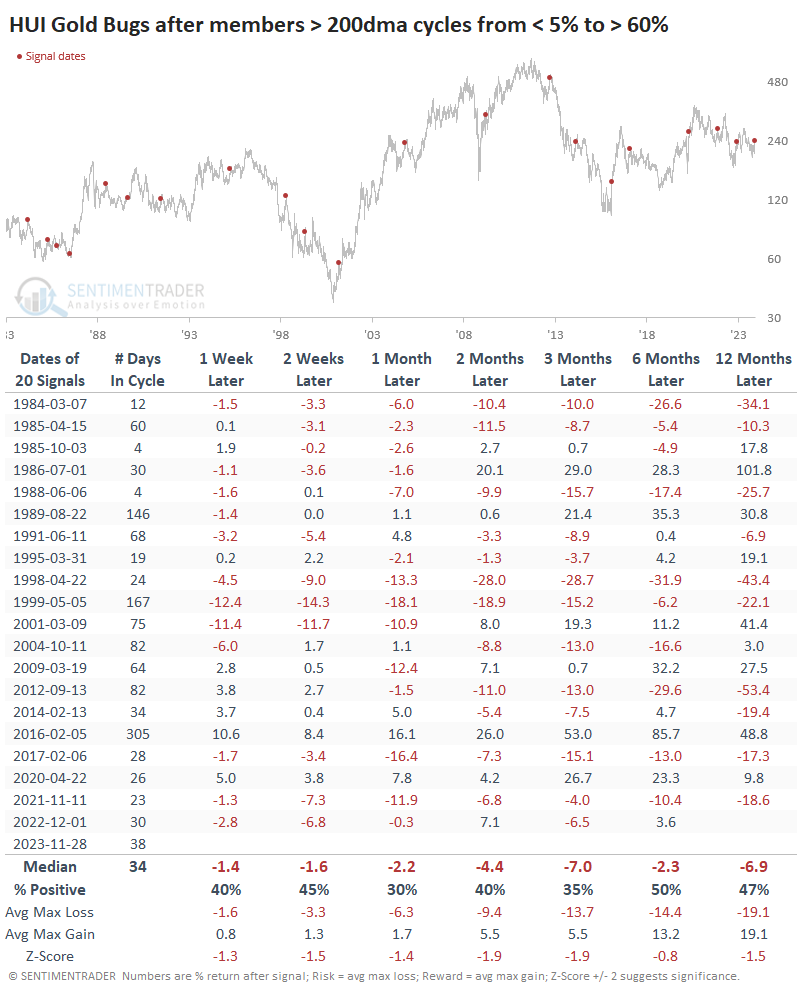
This is nothing new to anyone who has followed our research over the years, but gold miners have a miserable track record when it comes to internal momentum signals.
The table below shows every time over the past 40 years when fewer than 5% of gold miners were trading above their 200-day moving averages, then more than 60% of them were. Losses were the norm.
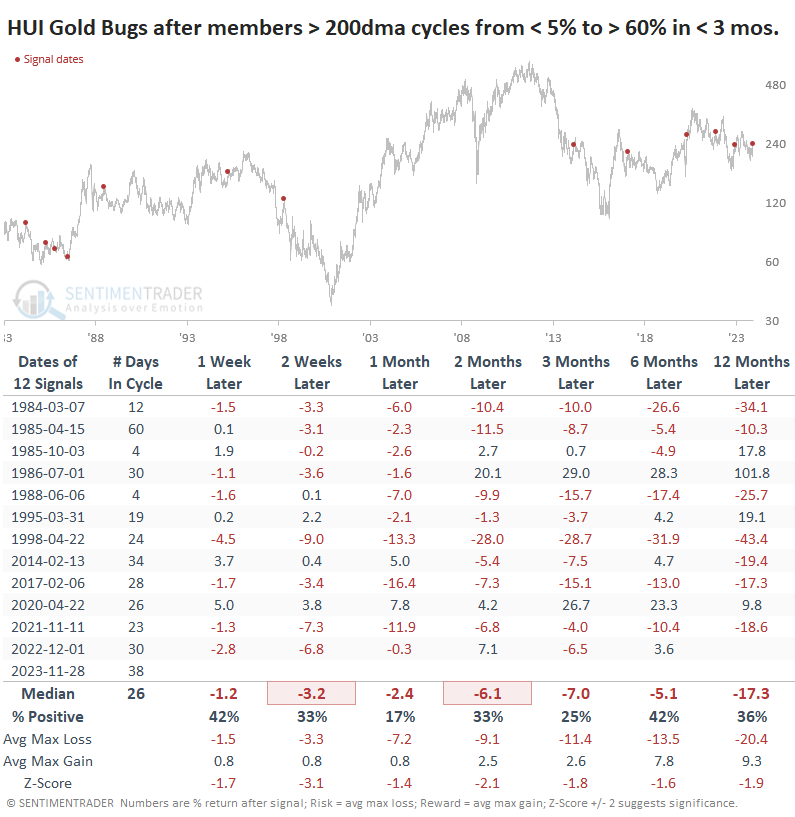
It got even worse when the investors turned on a dime. The following table filters the table to only include signals when the reversal signal triggered within three months. These whipsaws in investor behavior showed a strong tendency to reverse again. Over the next month, the HUI Gold Bugs index sported a gain after only 2 out of 12 signals, and one of those quickly turned into a loss.
Why the next two months should be important
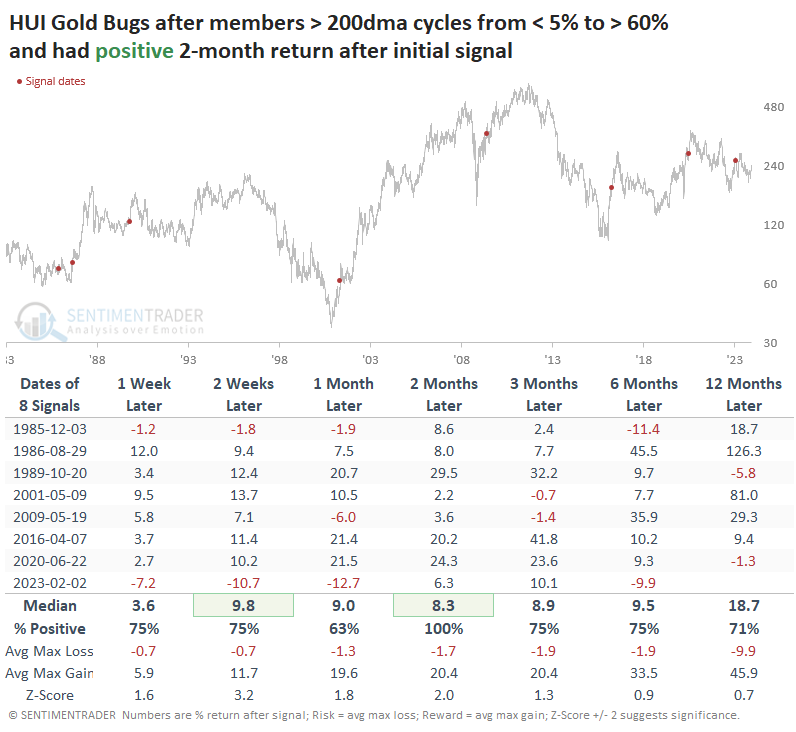
Let's go back to the first table, times when miners showed an internal momentum reversal, regardless of how long it took.
One thing we've noticed in the past is that during the few structural cycles when mining stocks do well, investors ignore short-term overbought readings and continue to buy. All other times, they don't. That's true for most markets, but it tends to be especially true here.
The table below shows those signals that suffered a loss two months after the original signal (when members above their 200-day average cycled from fewer than 5% to more than 60%). When there was a negative reaction during those first two months, then the following months also showed a very strong tendency to suffer further losses.
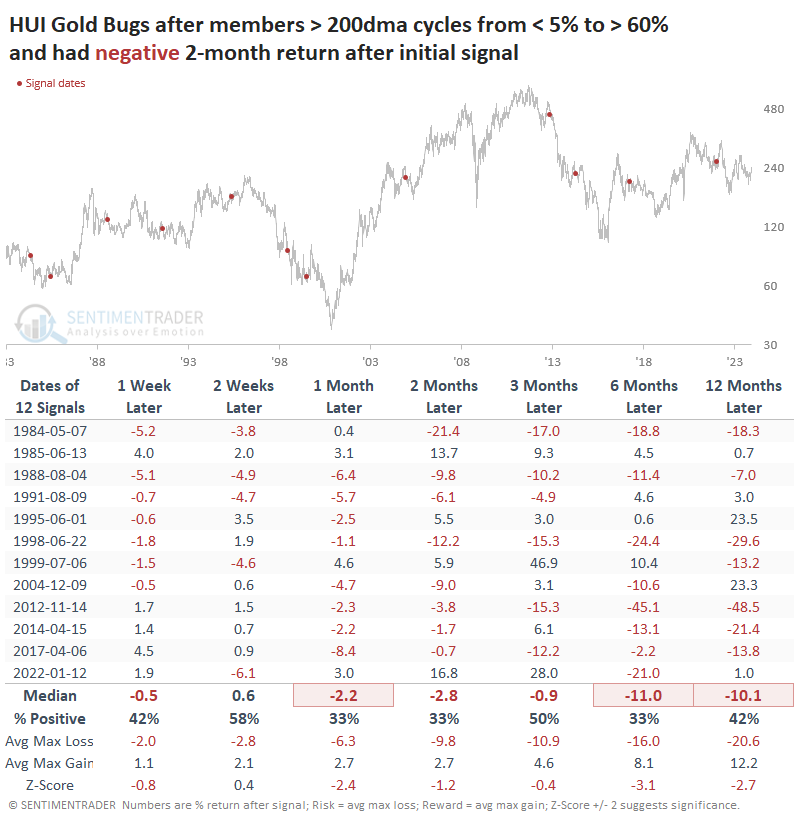
It was a starkly different outcome when investors reacted favorably during the first couple of months. After those positive reactions, then the following months showed a strong tendency to see even more gains. This is not tautological - the signals in the table are AFTER the first two months, so it does not include the gains during the original two months.
What the research tells us...
Gold bugs tend to be a rather miserly group, and it's hard to blame them. Just when things look best for their favored investment, forward returns tend to be the worst. It's hard to be optimistic when you get slapped almost every time the sun comes out (try being a Minnesota Vikings fan).
While it may be frustrating to wait two months to see how a signal pans out, for this particular group, it has given compelling reasons. After a recovery in internal momentum, the next two months have very often forecasted quite well how the ensuing months would unfold. Continued positive price action in the Gold Bugs index had a strong record of preceding even further gains, and vice-versa. It hasn't started all that well for the bugs but we'll have to see where the index trades at the end of January.
Indicators at Extremes
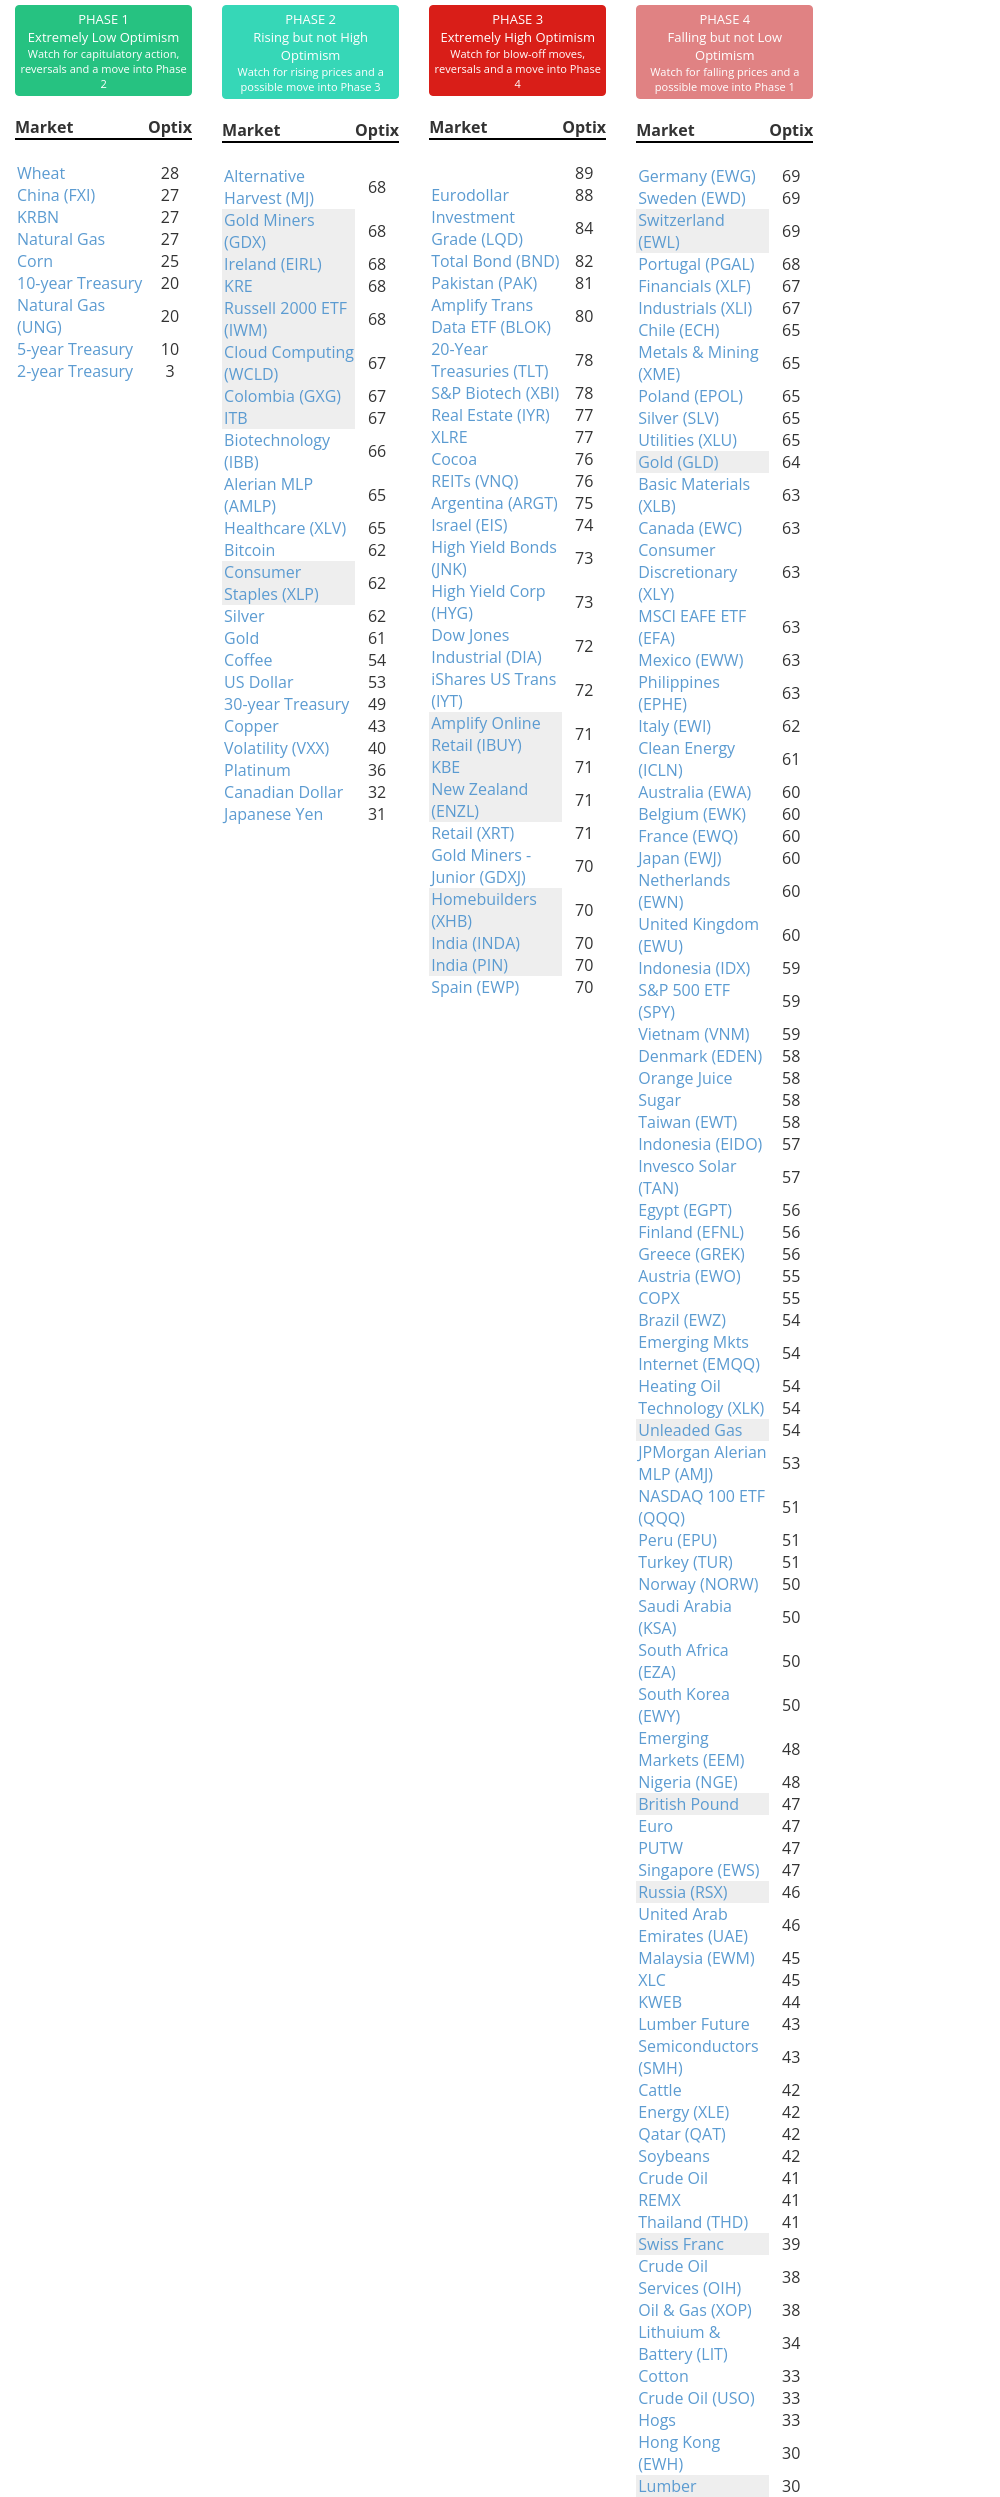
Phase Table
Ranks
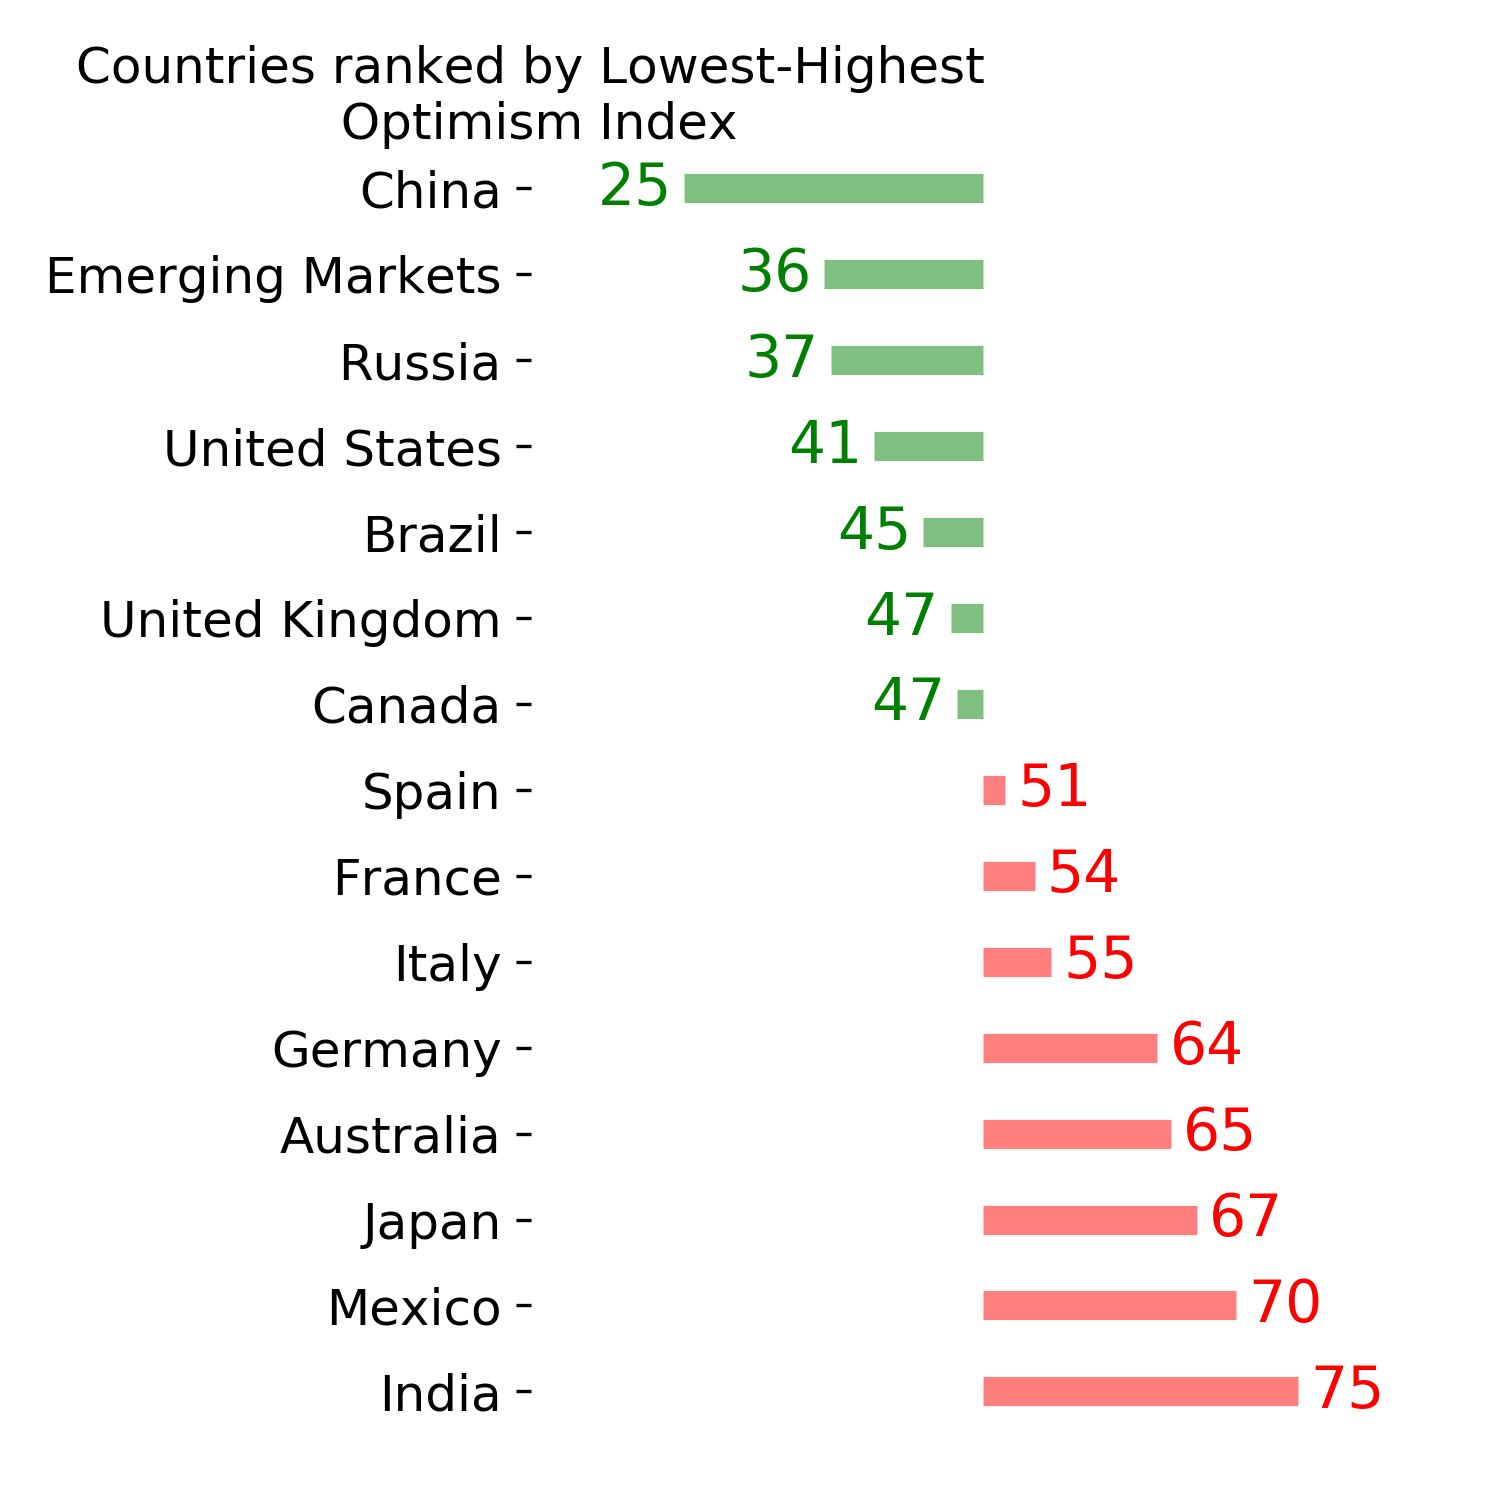
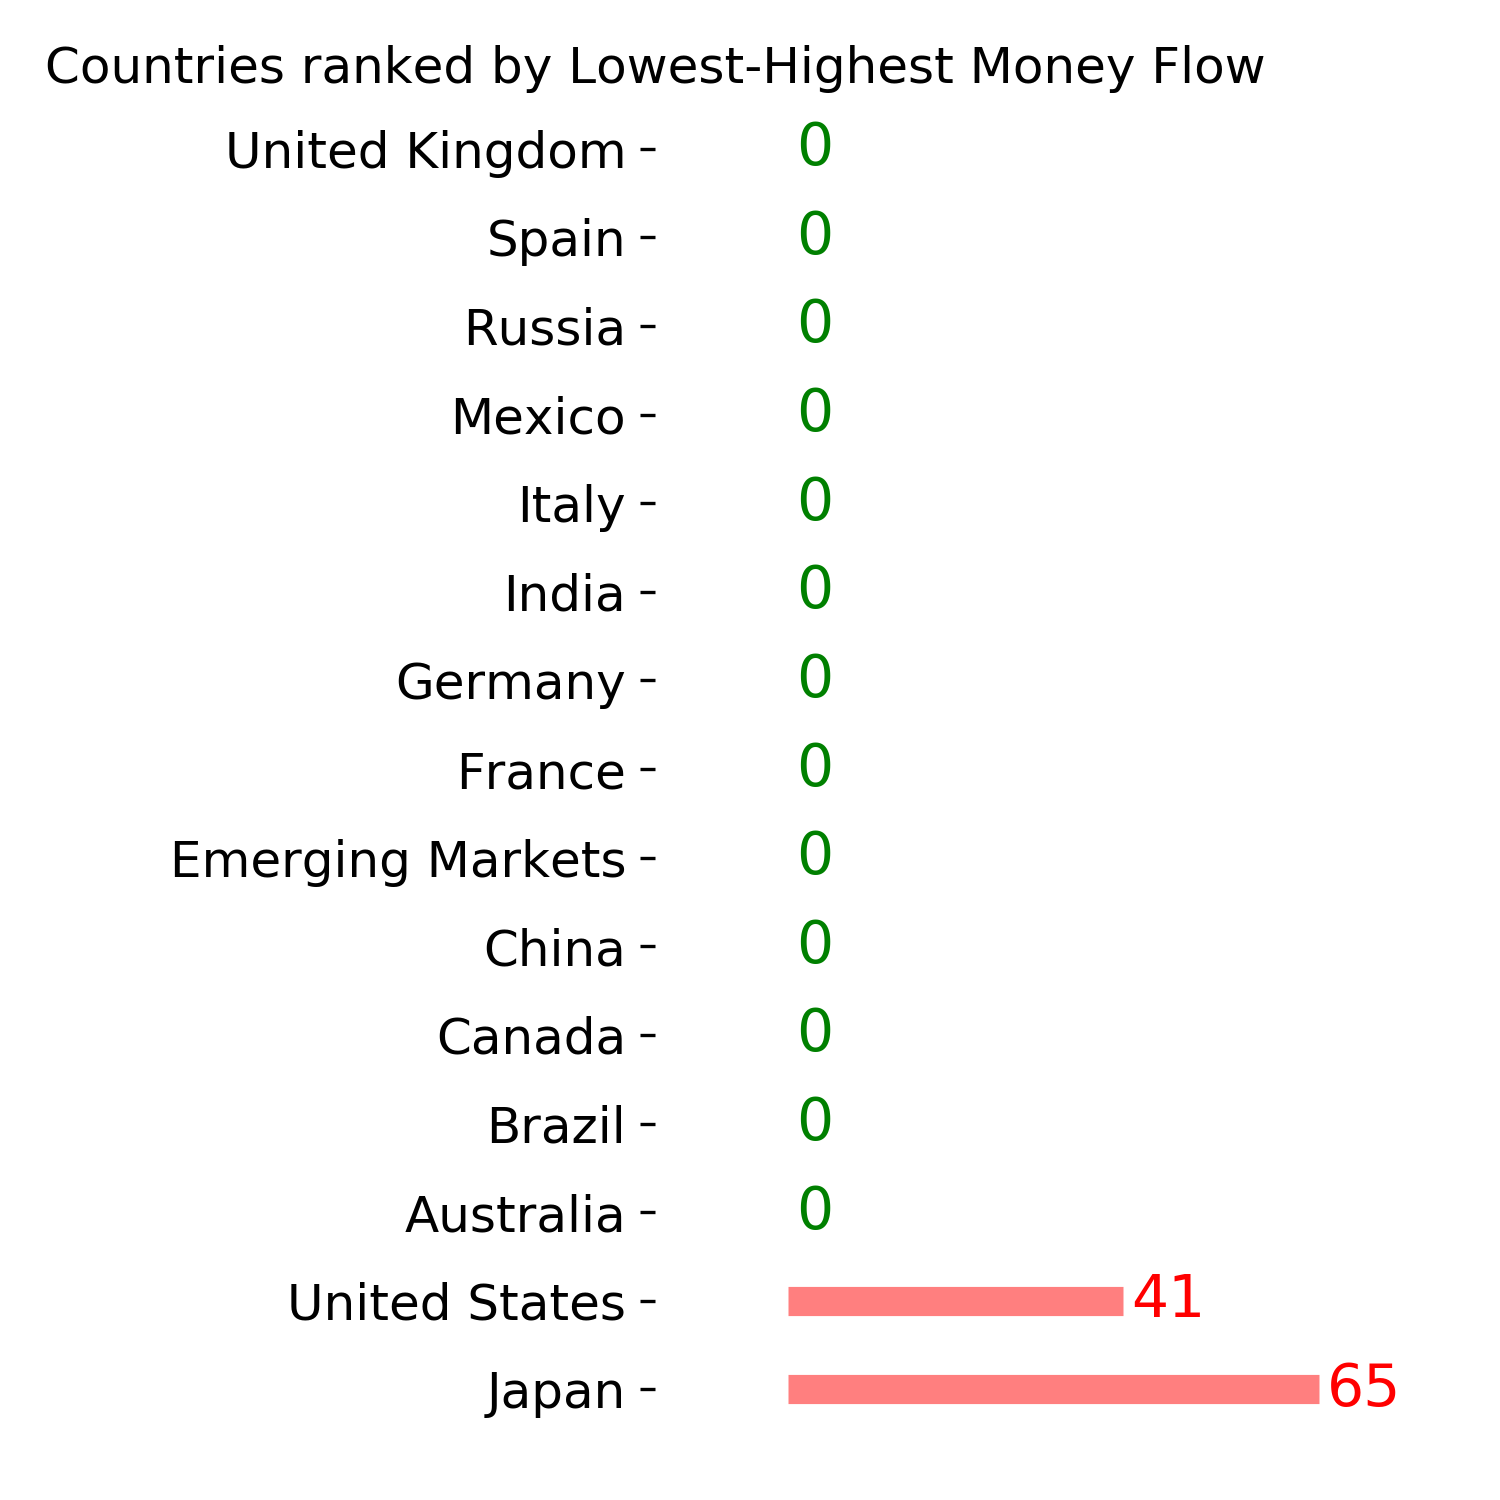
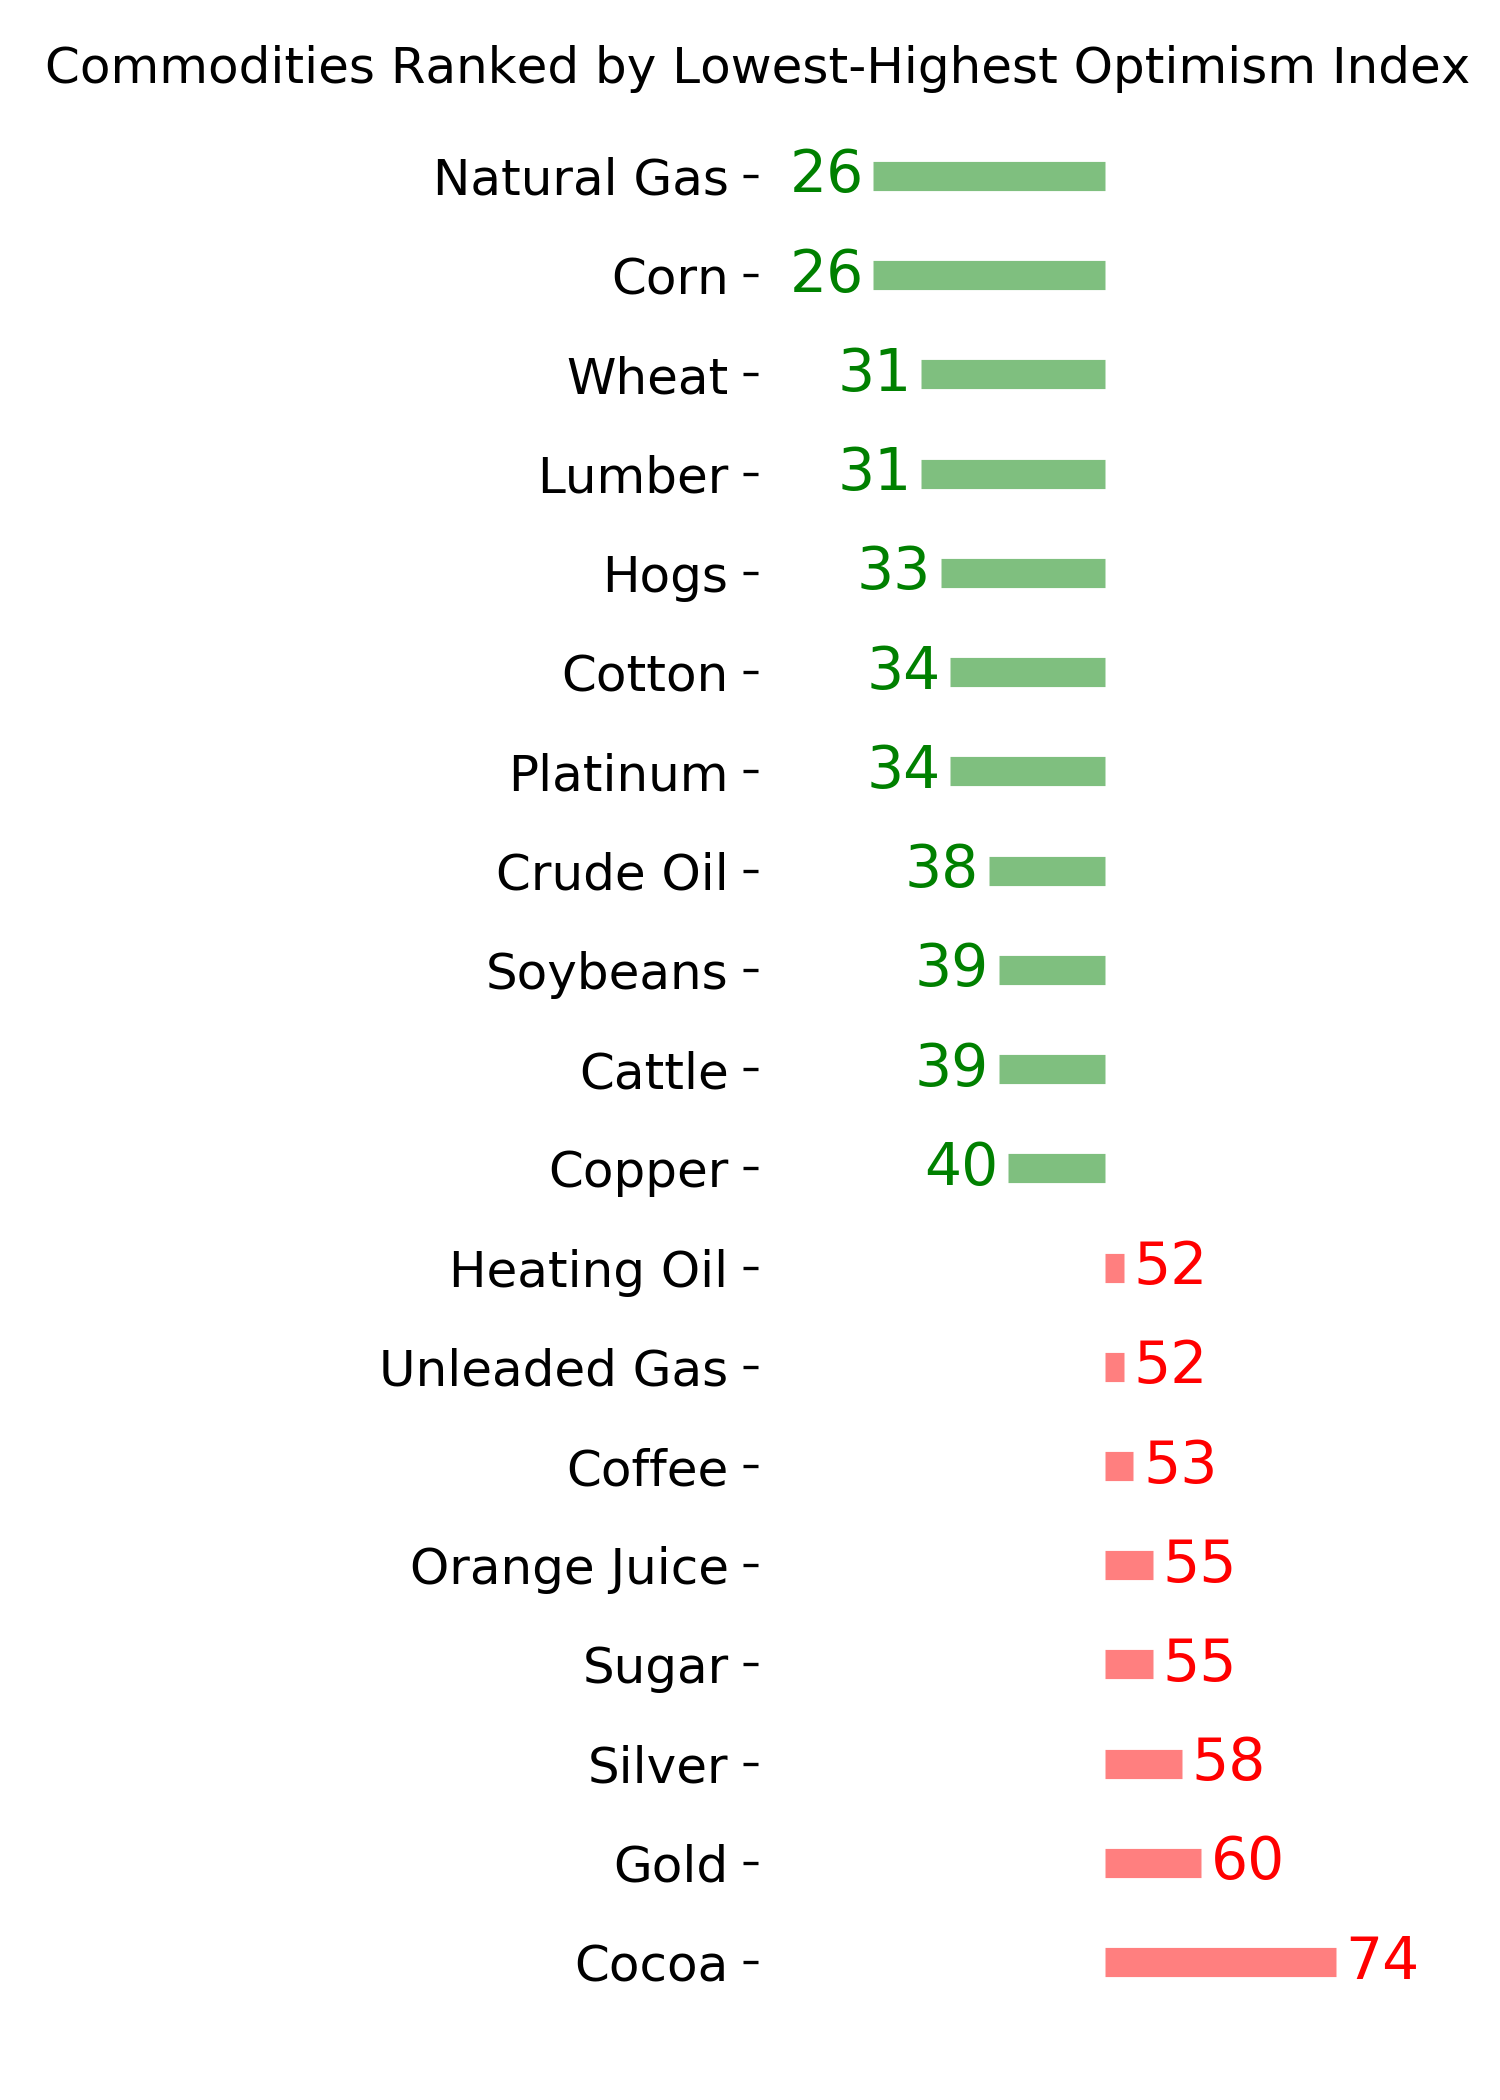
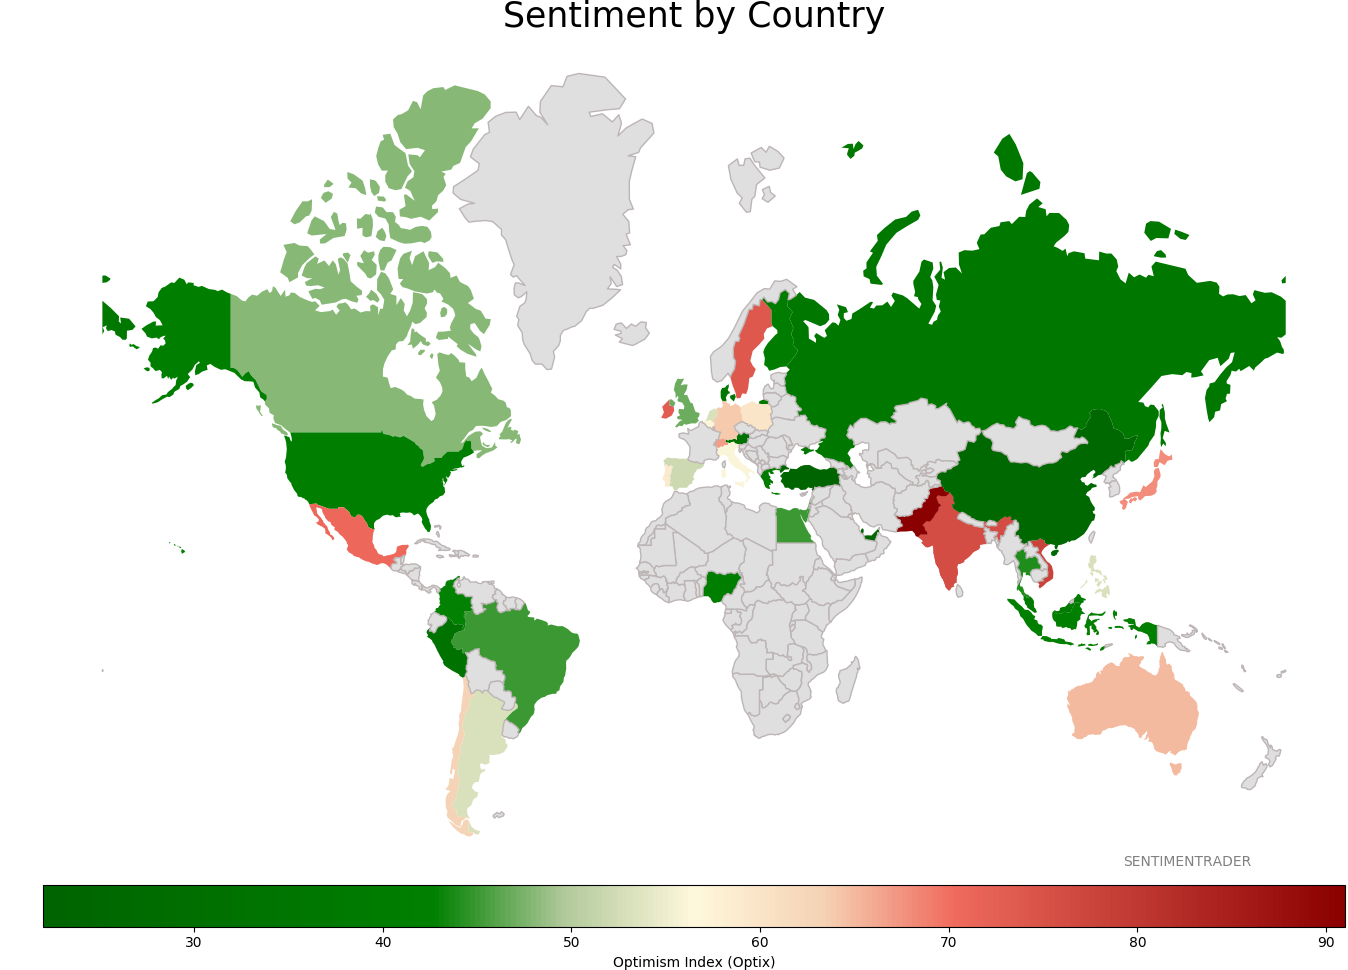
Sentiment Around The World
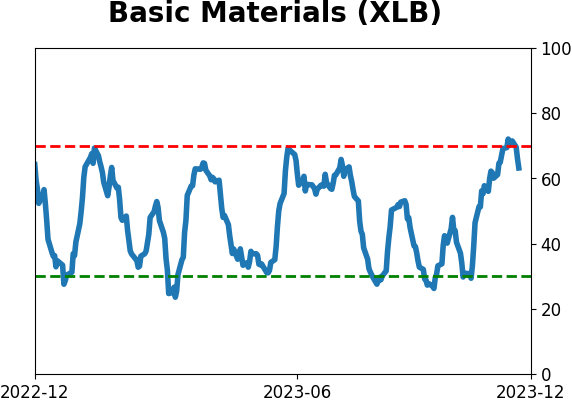
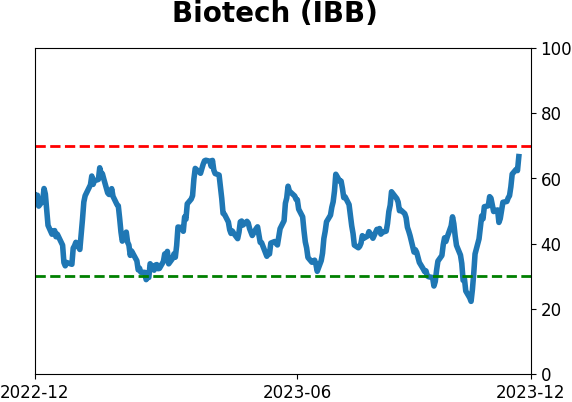
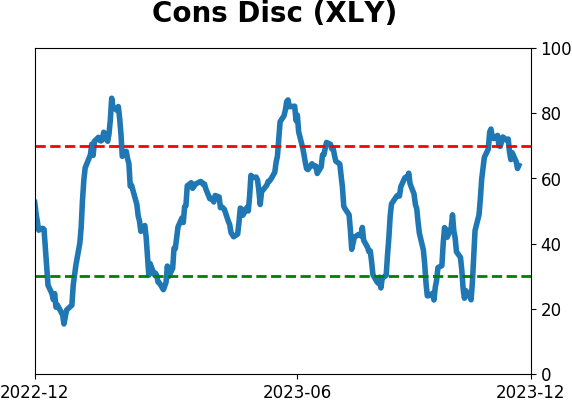
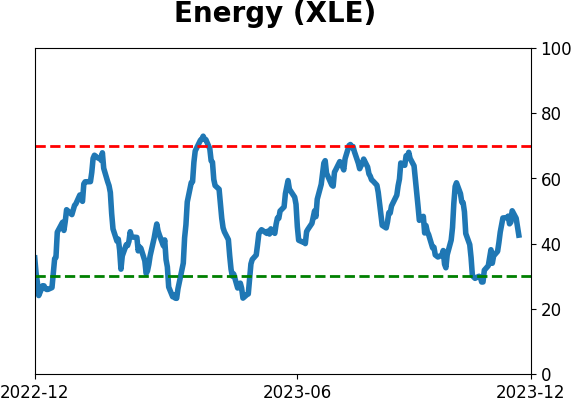
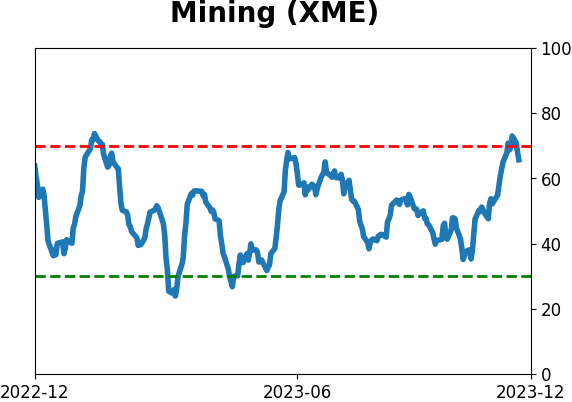
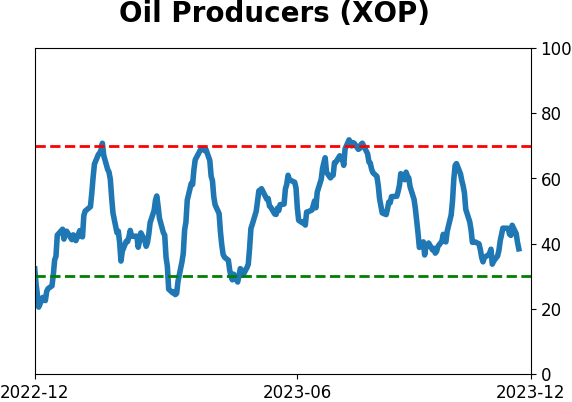
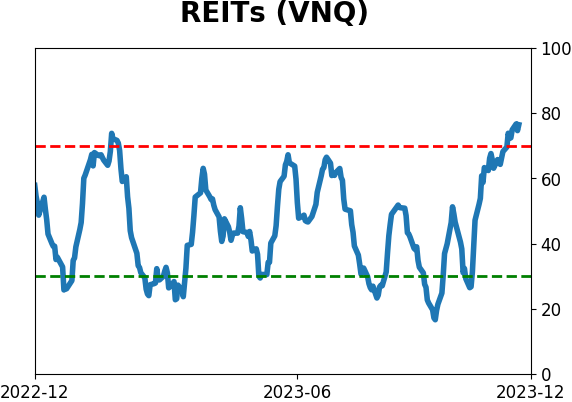
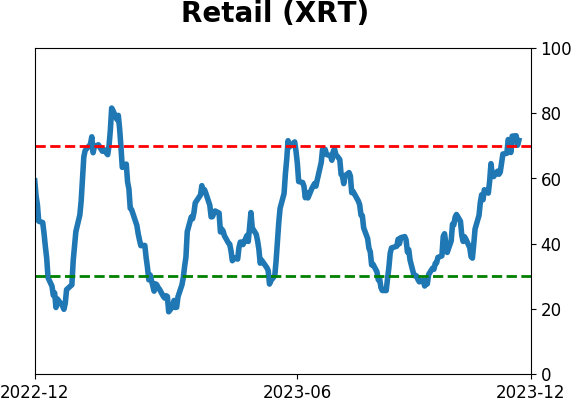
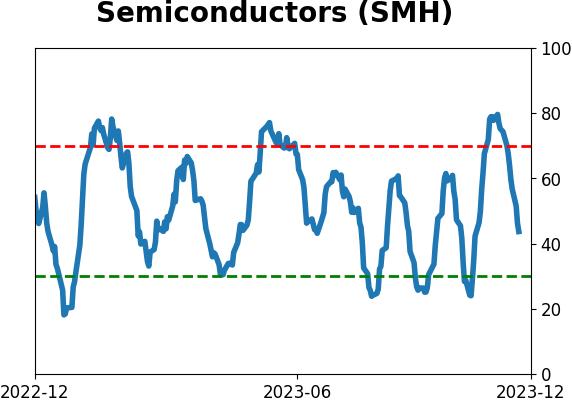
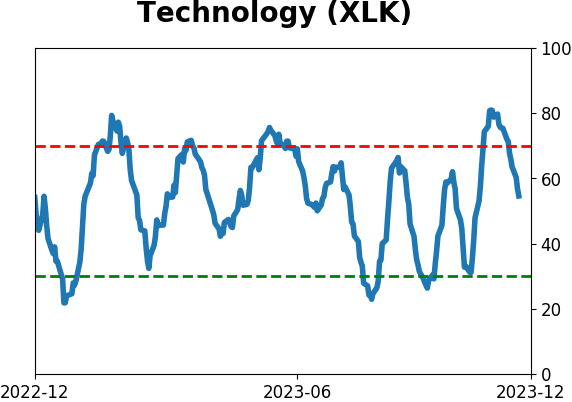
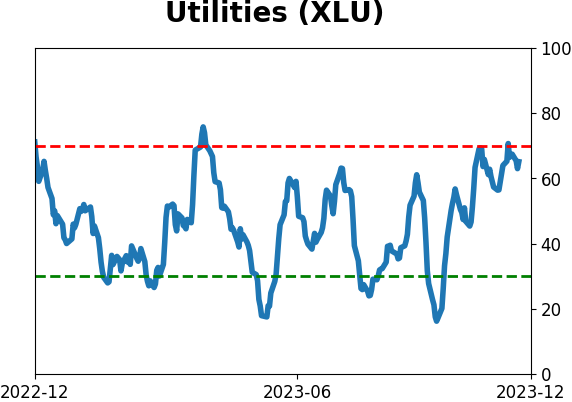
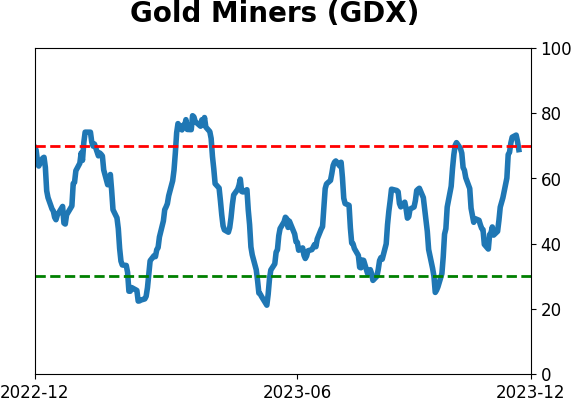
Optimism Index Thumbnails
|
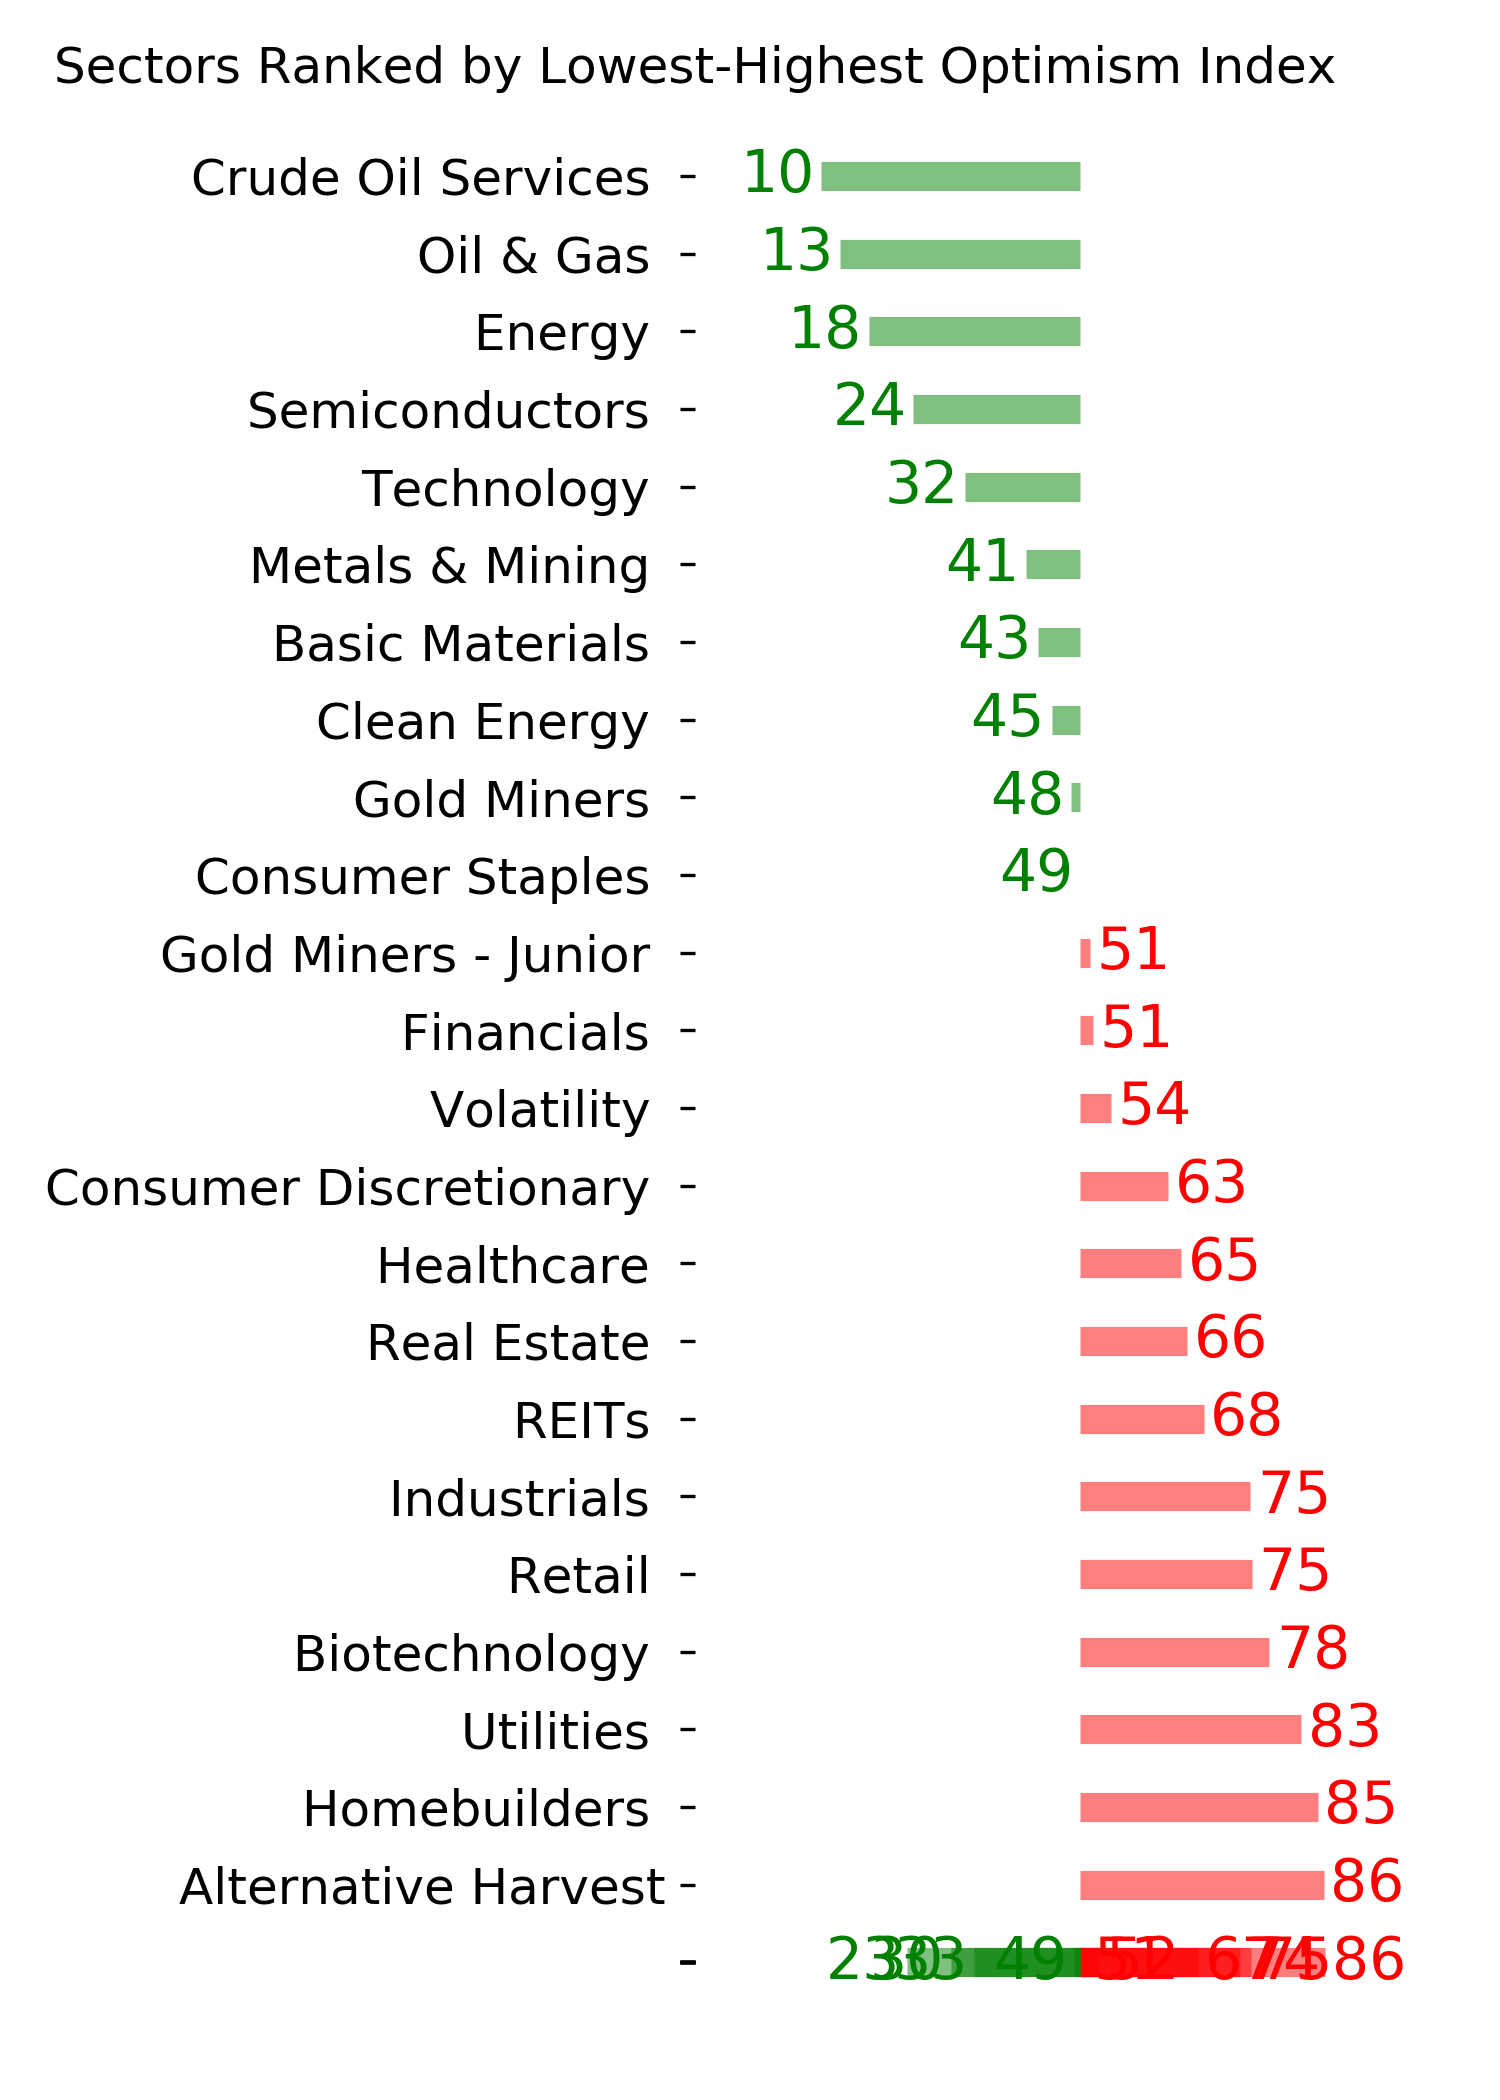
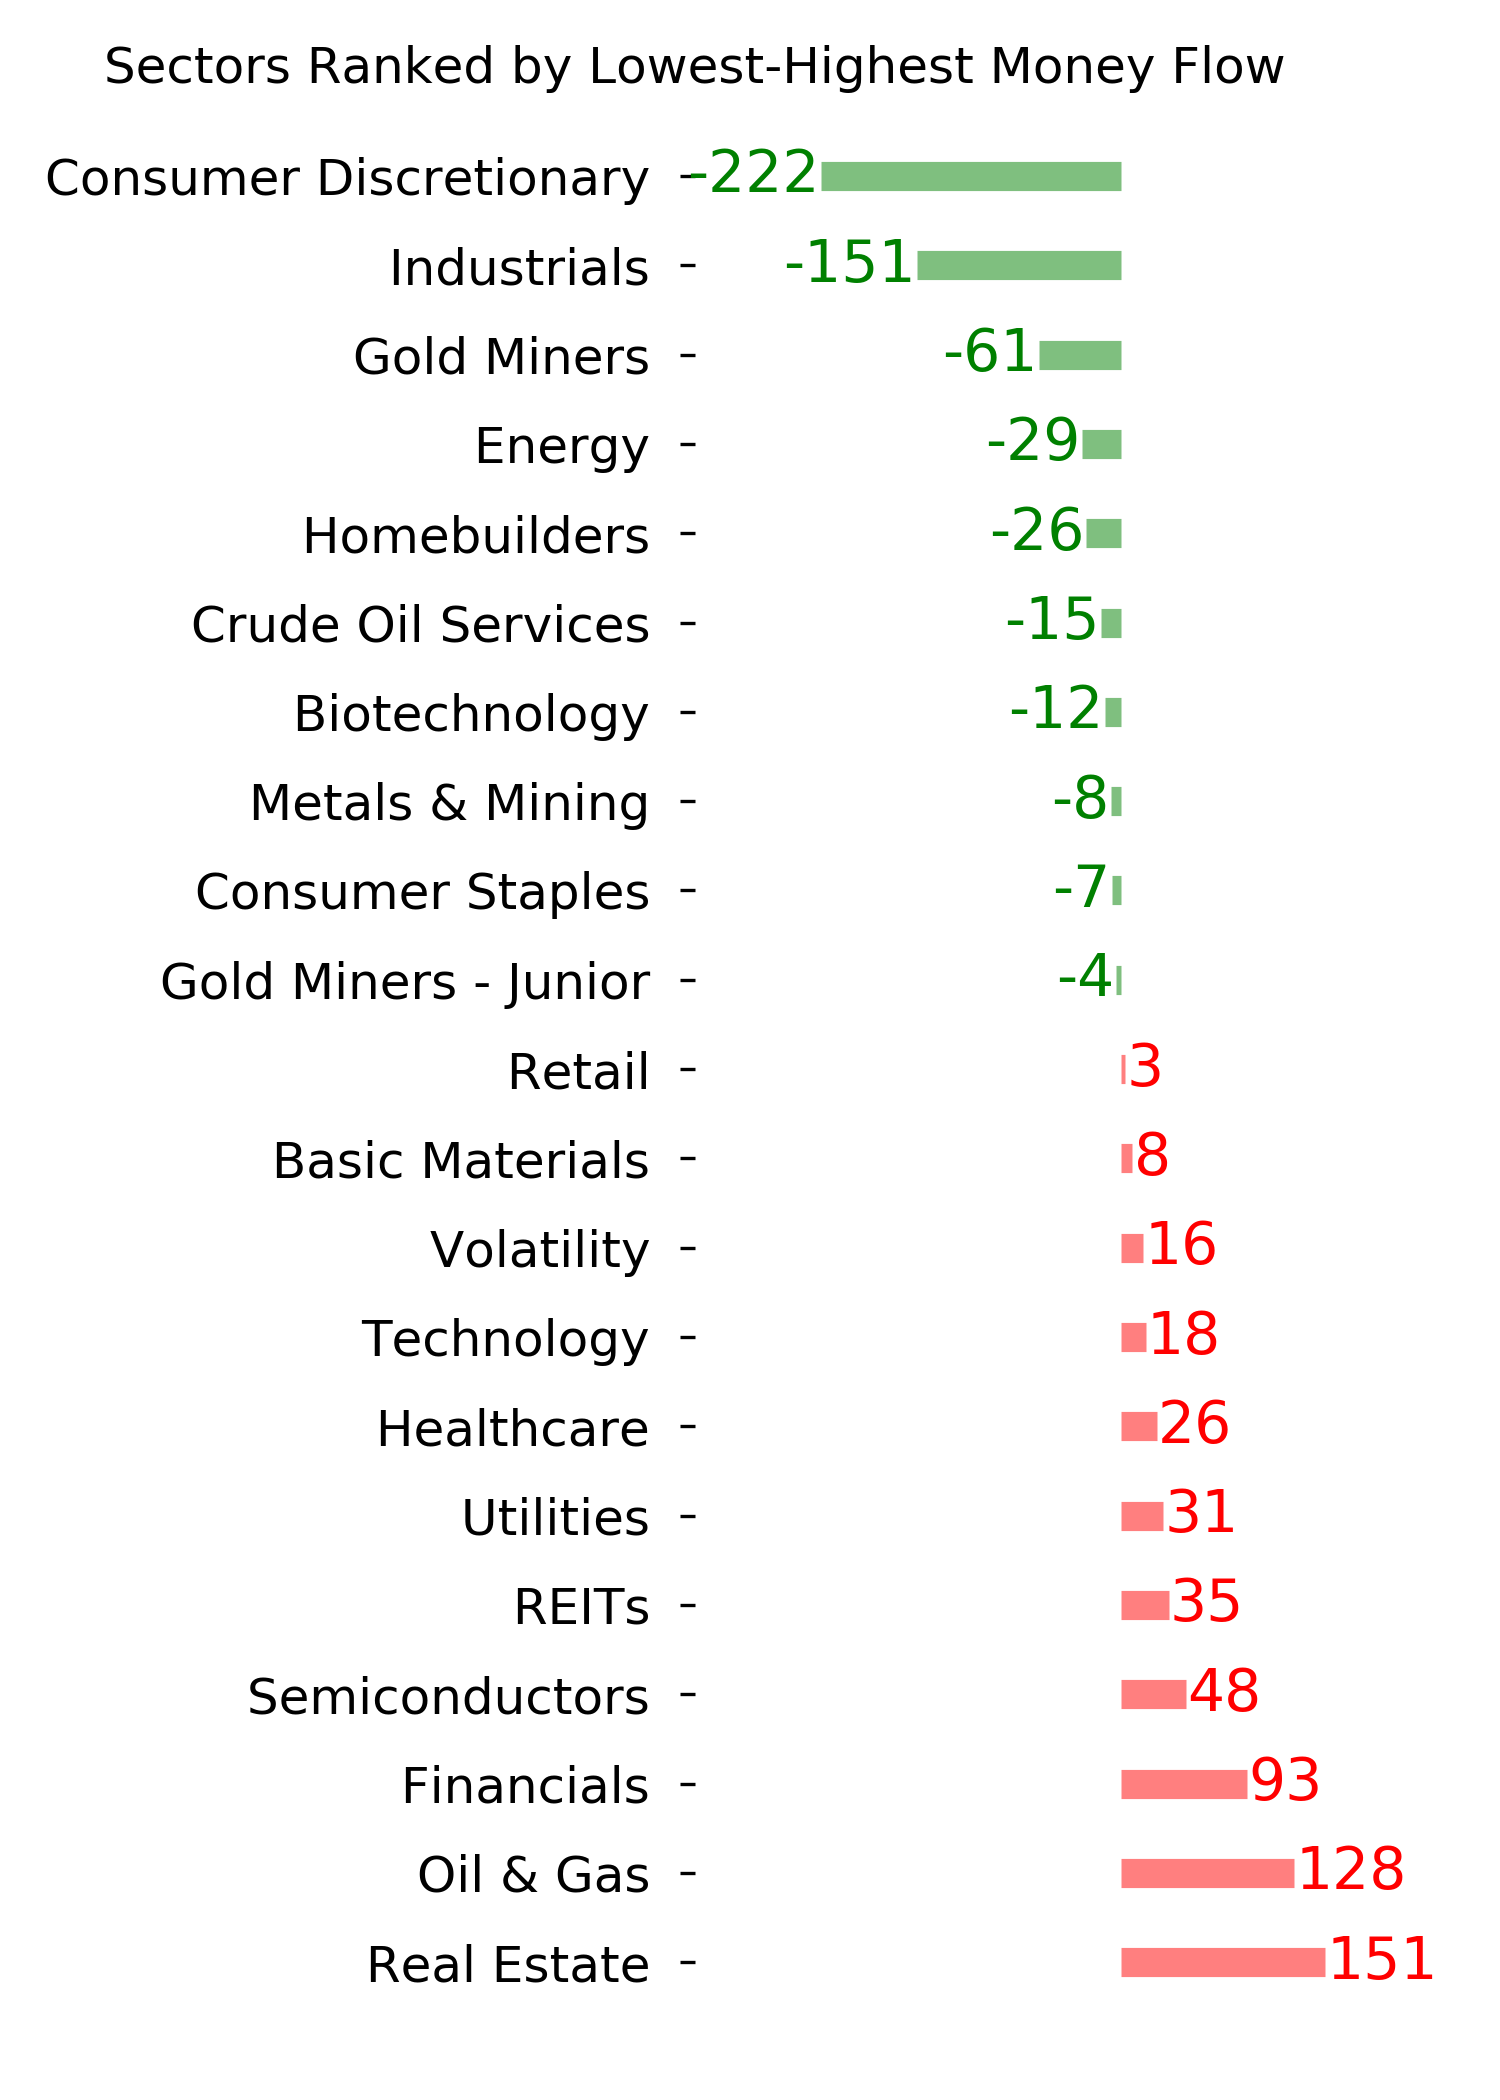
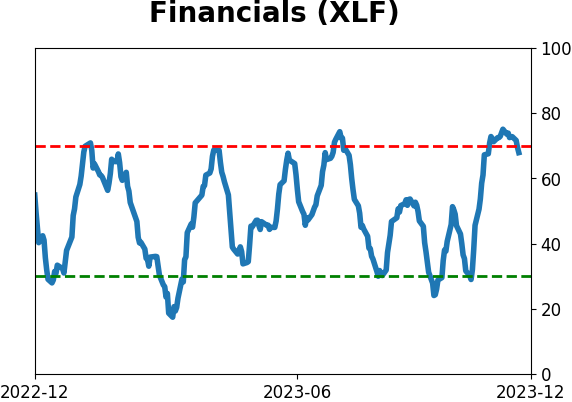
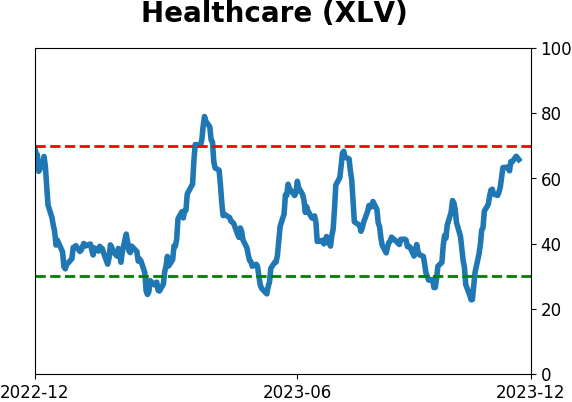
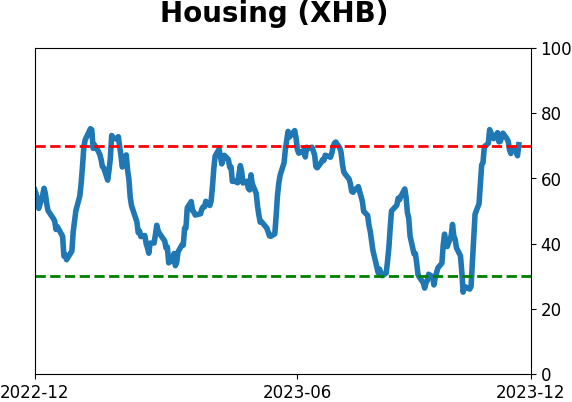
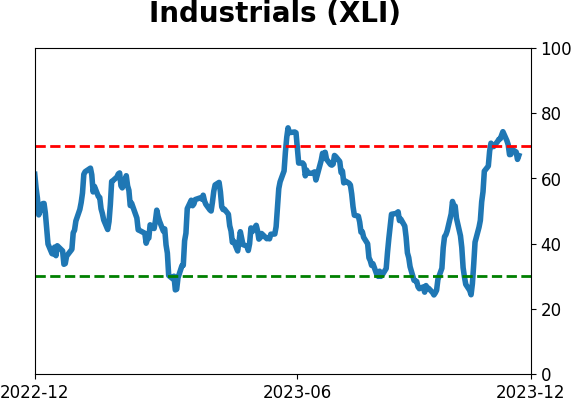
Sector ETF's - 10-Day Moving Average
|
|
|
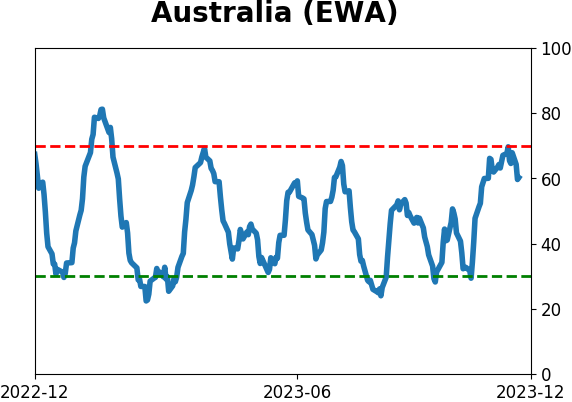
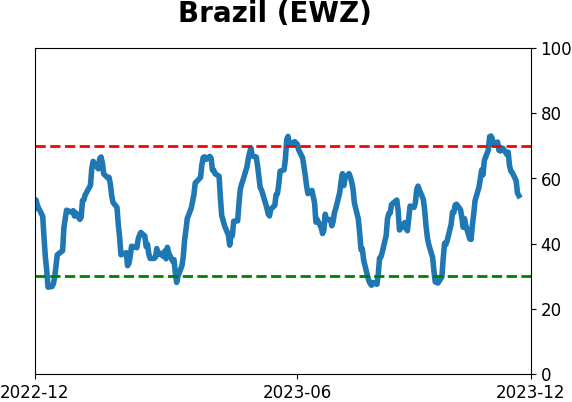
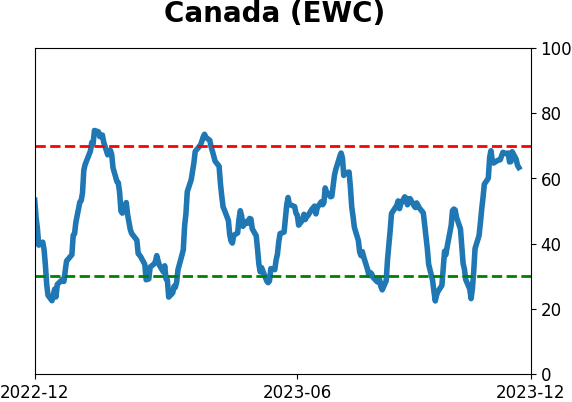
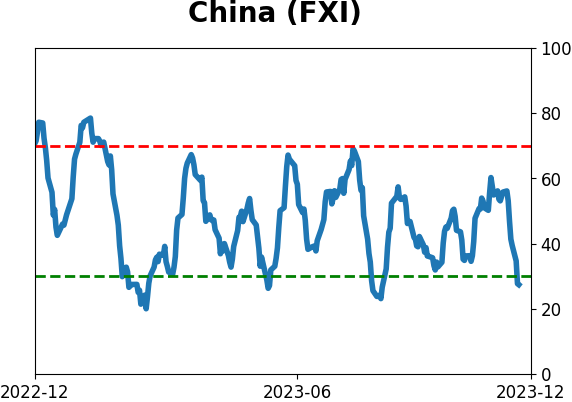
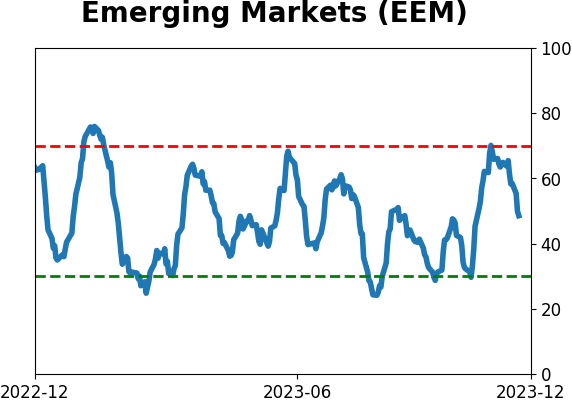
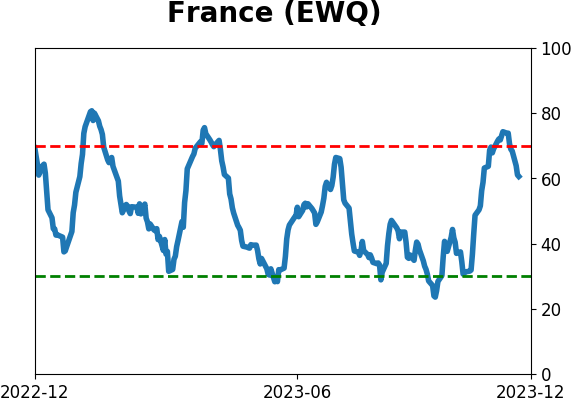
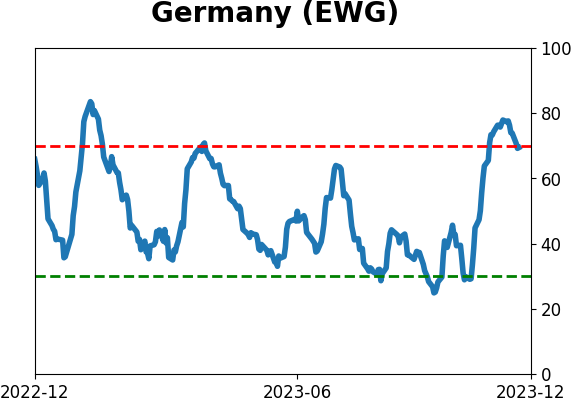
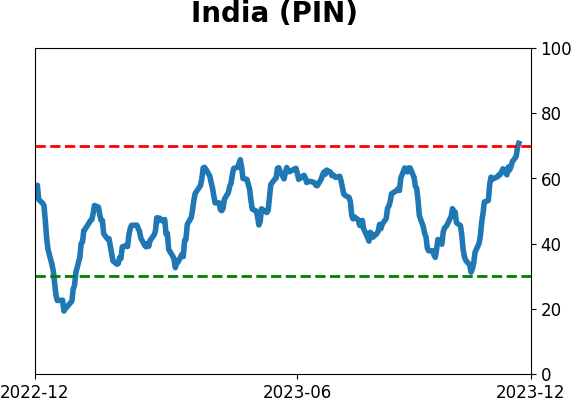
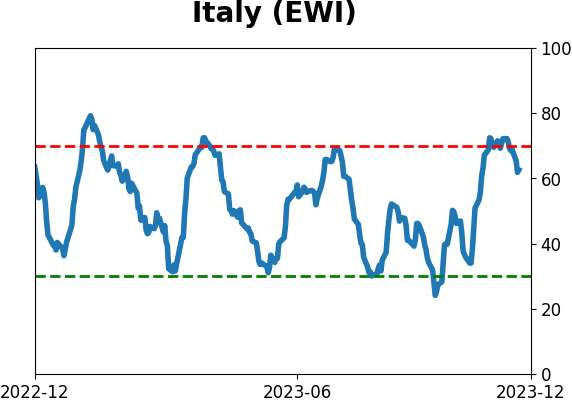
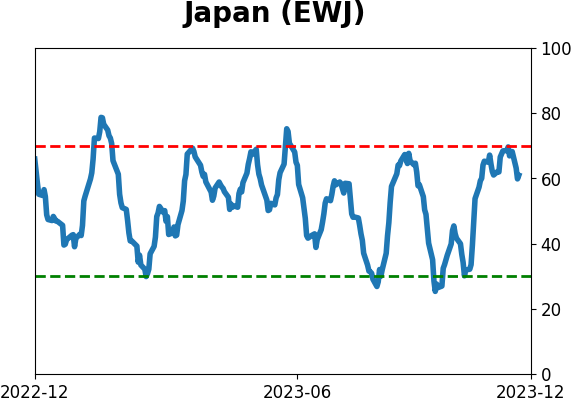
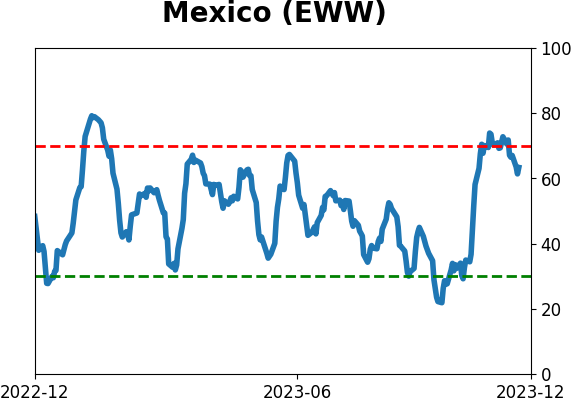
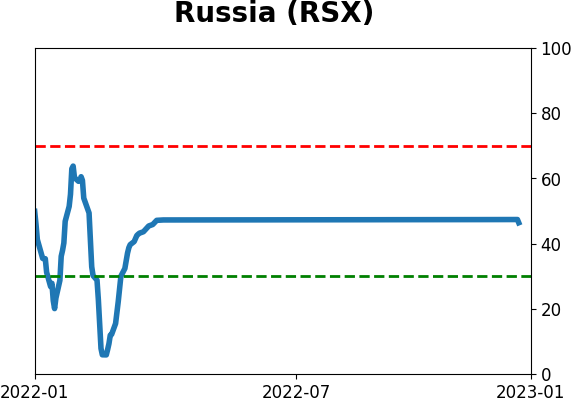
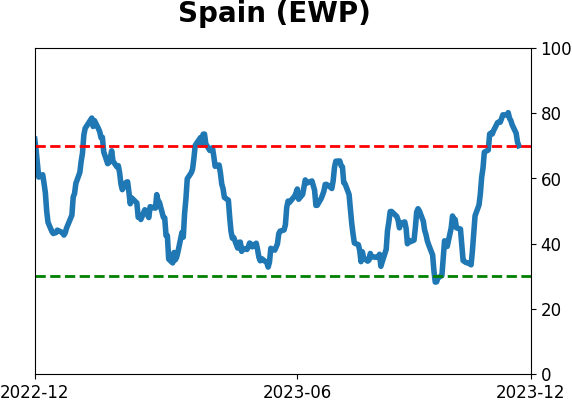
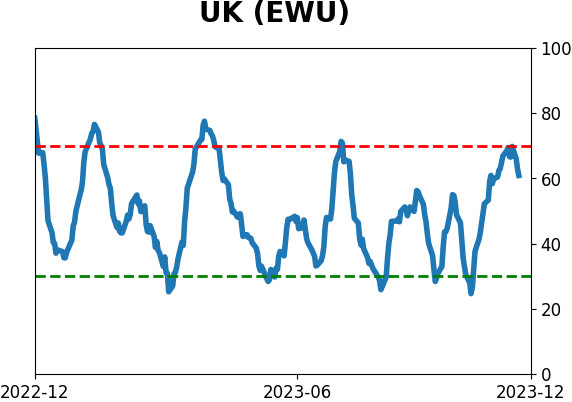
Country ETF's - 10-Day Moving Average
|
|
|
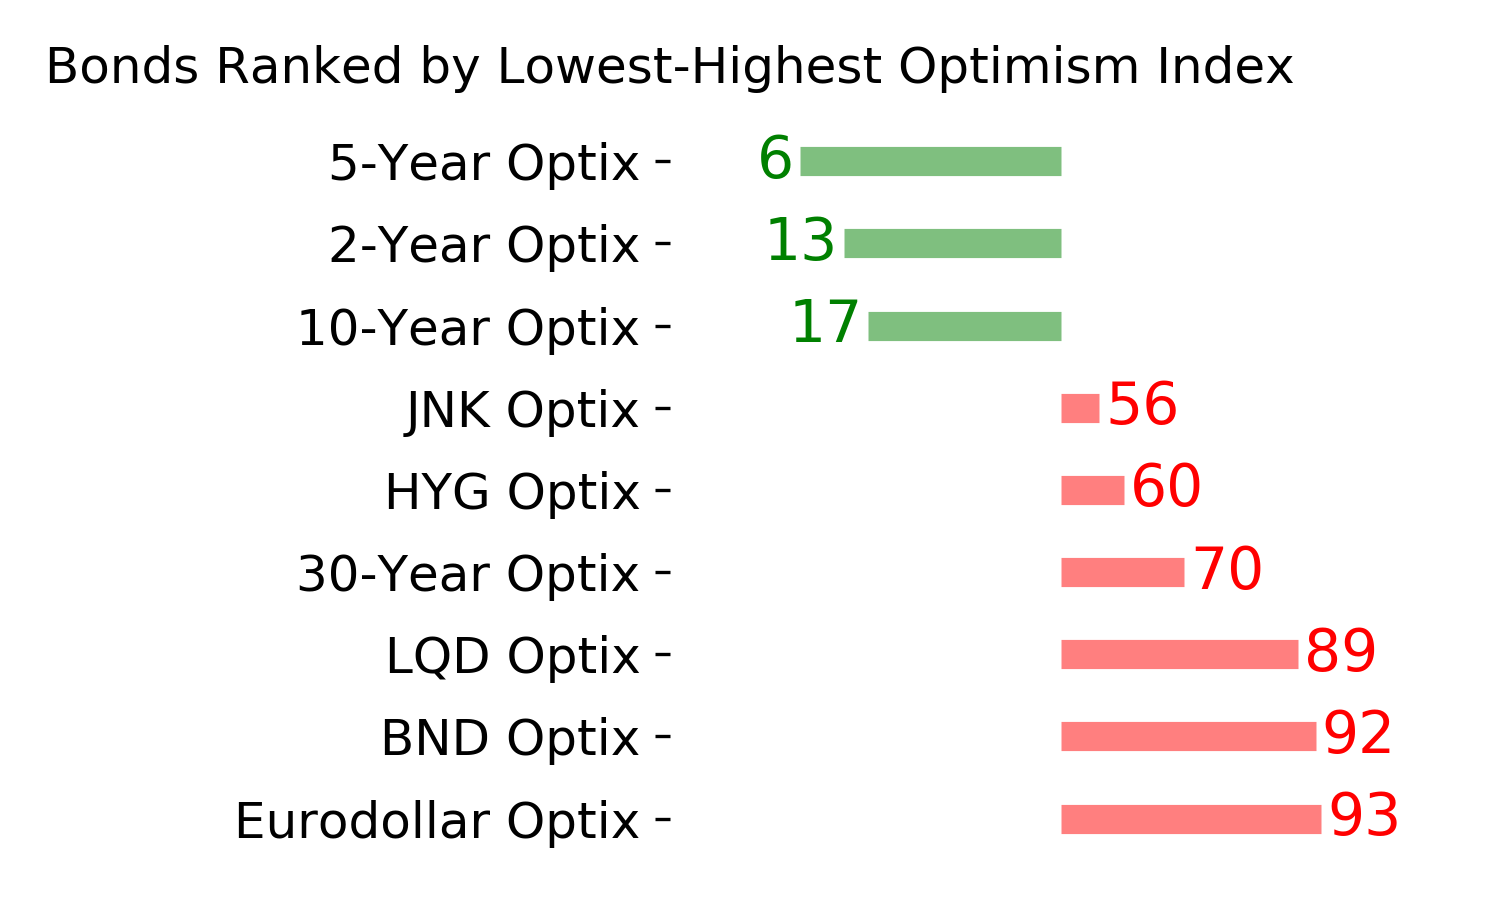
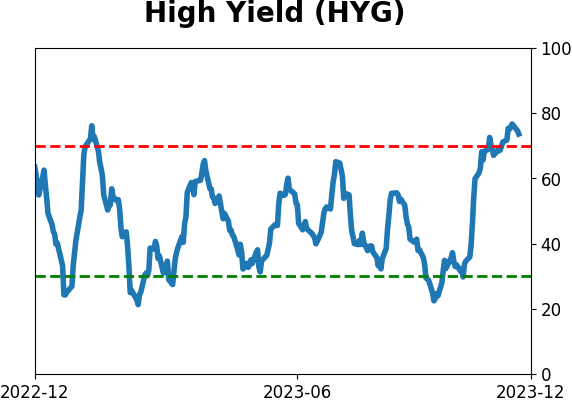
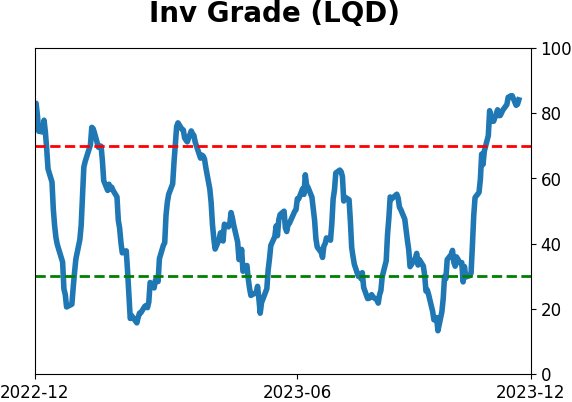
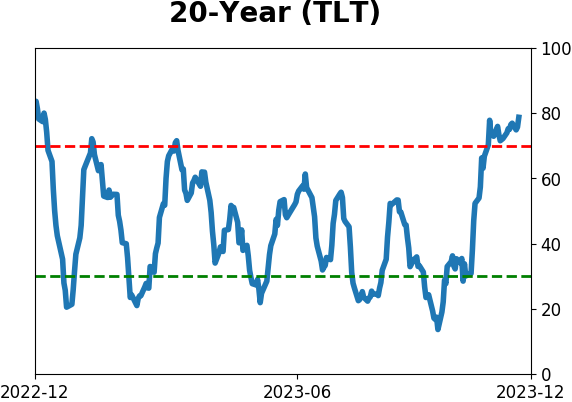
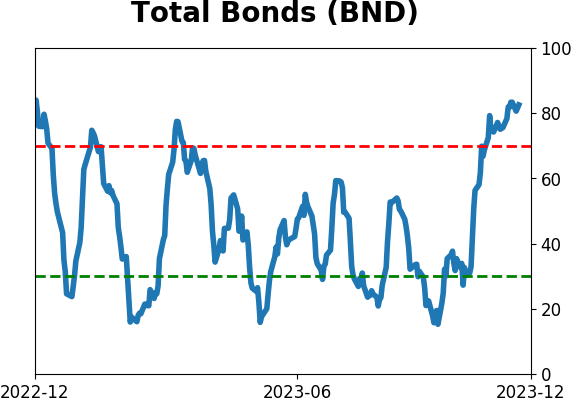
Bond ETF's - 10-Day Moving Average
|
|
|
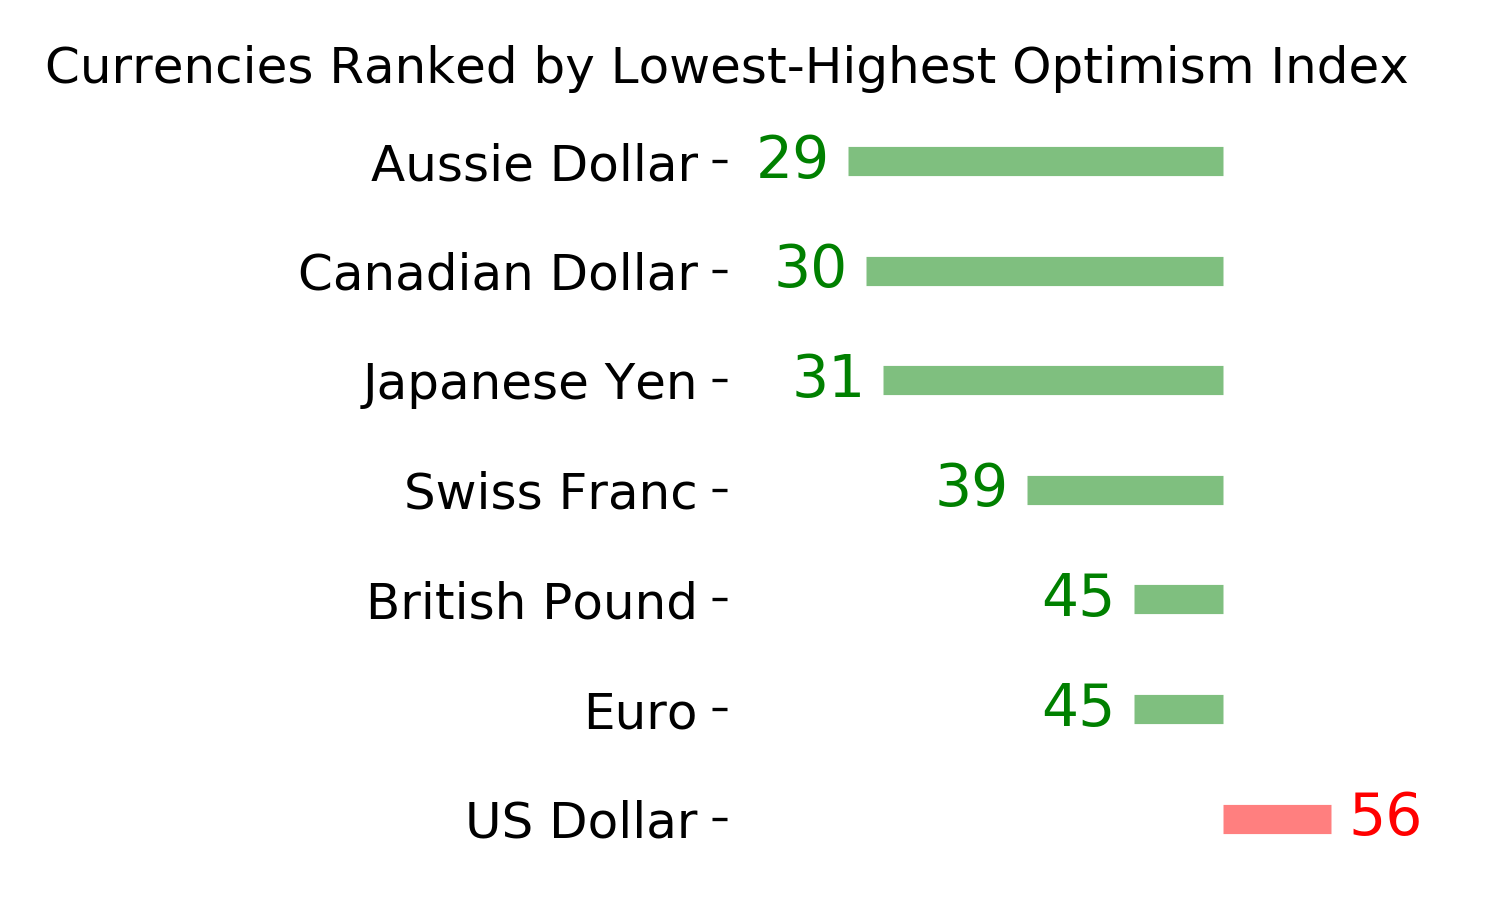
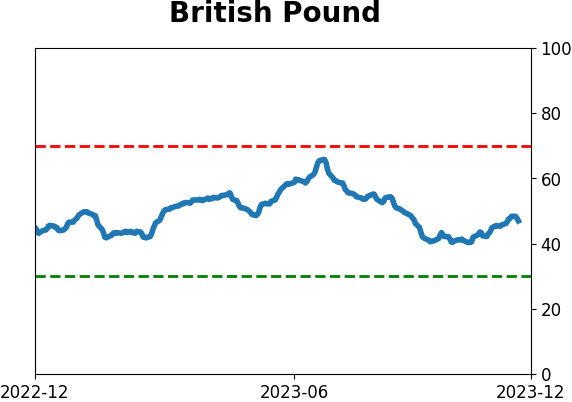
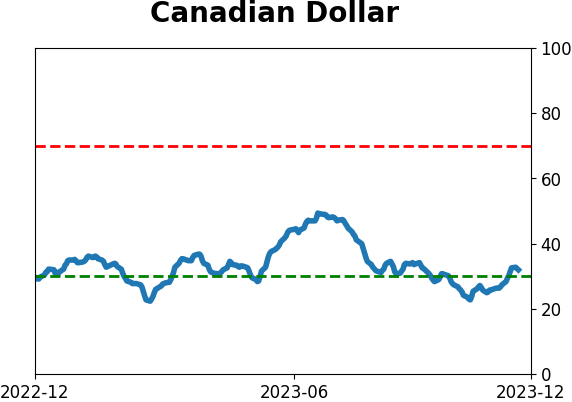
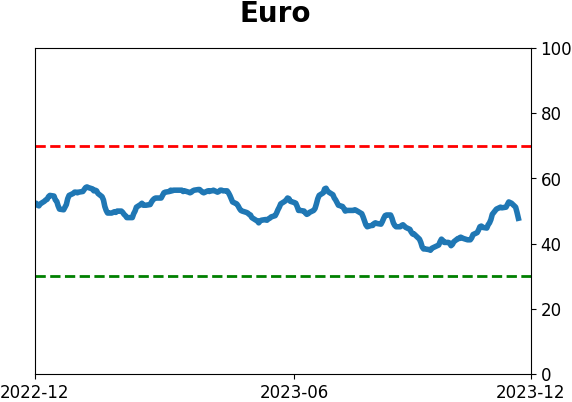
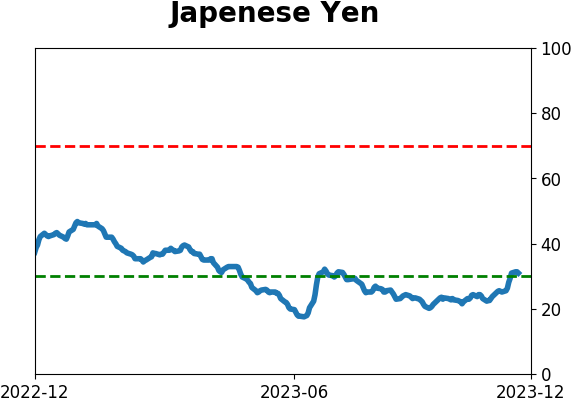
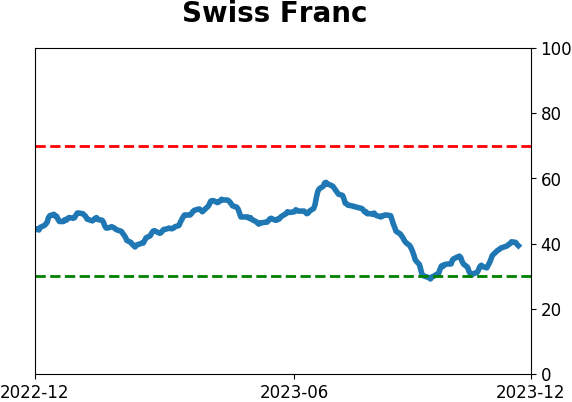
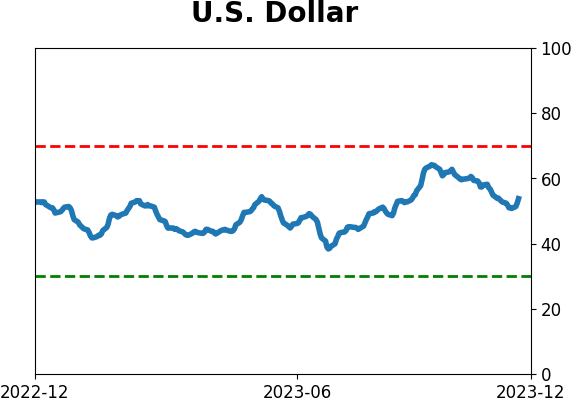
Currency ETF's - 5-Day Moving Average
|
|
|
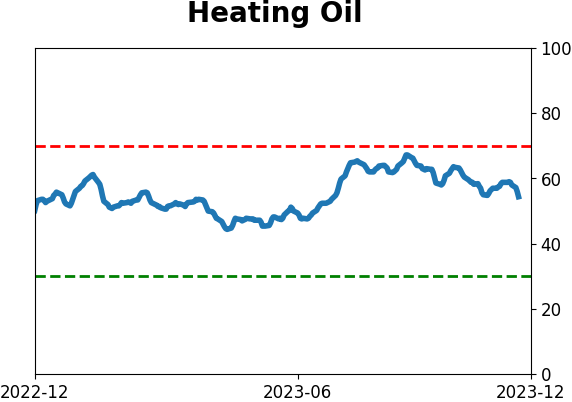
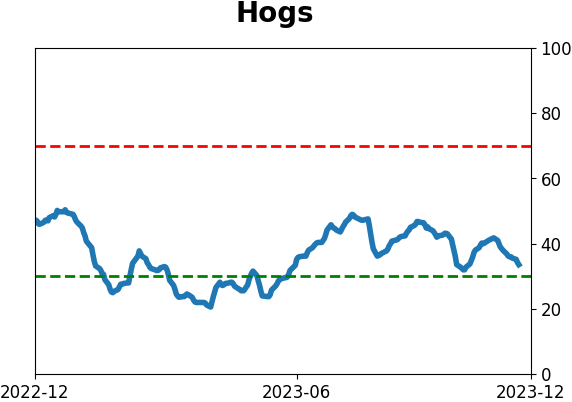
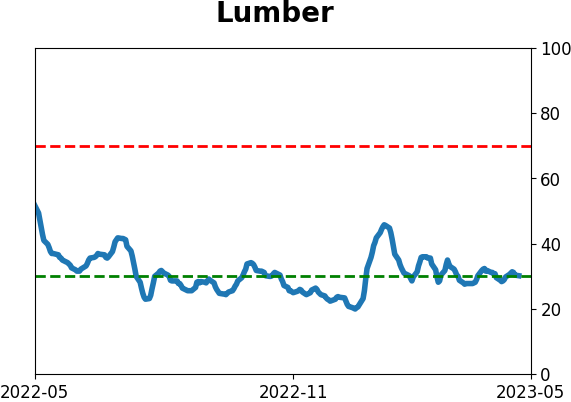
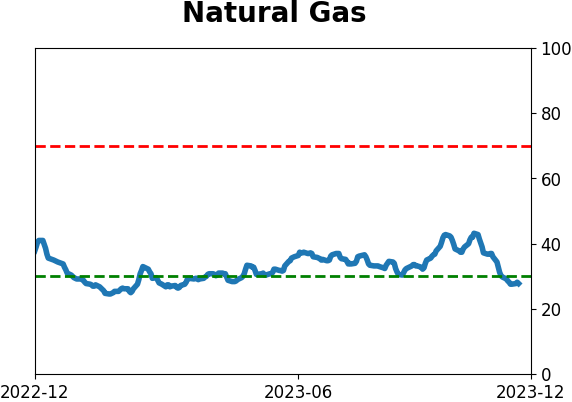
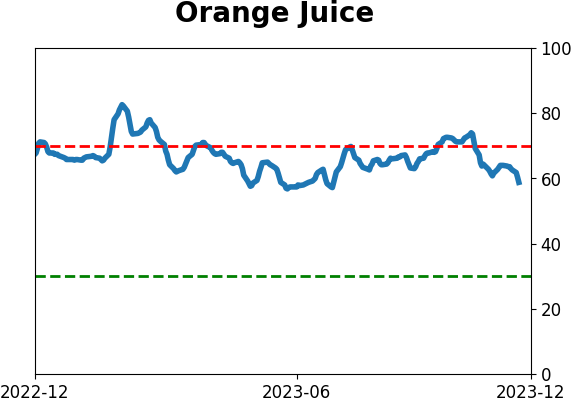
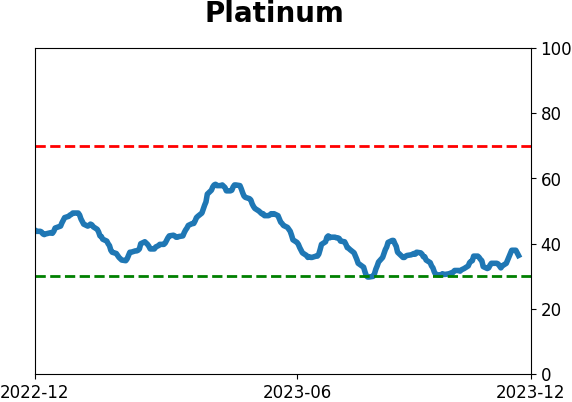
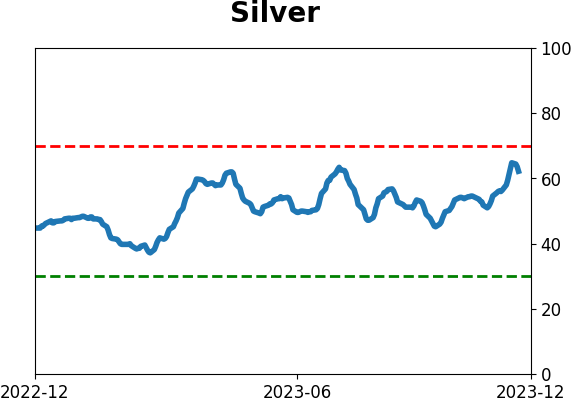
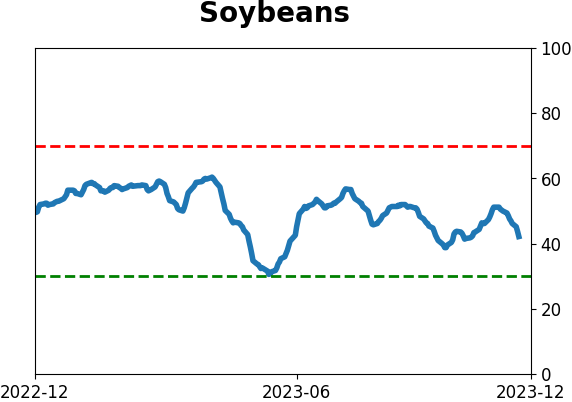
Commodity ETF's - 5-Day Moving Average
|
|