Headlines
|
|
A never-before-seen level of risk:
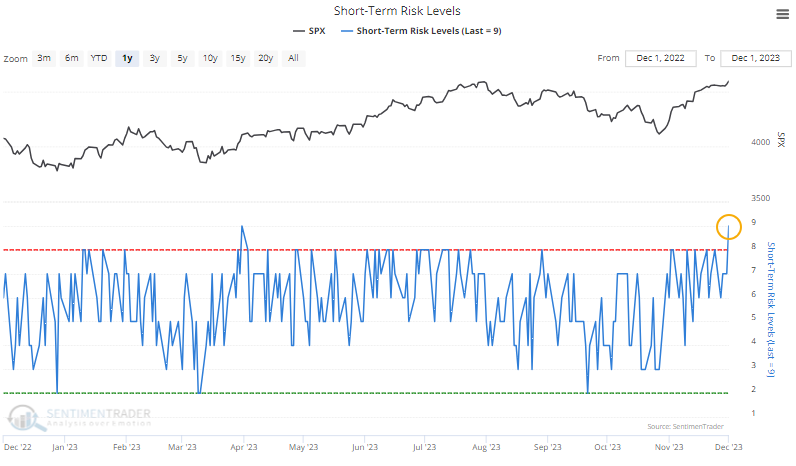
Our short- and medium-term Risk Levels look at sentiment readings within the context of bullish or bearish price action. They both reached maximum levels at the same time, which has never happened before. Very high combined Risk Levels tend to occur during the start of bull moves, but the next week will tell us more about that probability.
|
Smart / Dumb Money Confidence
|
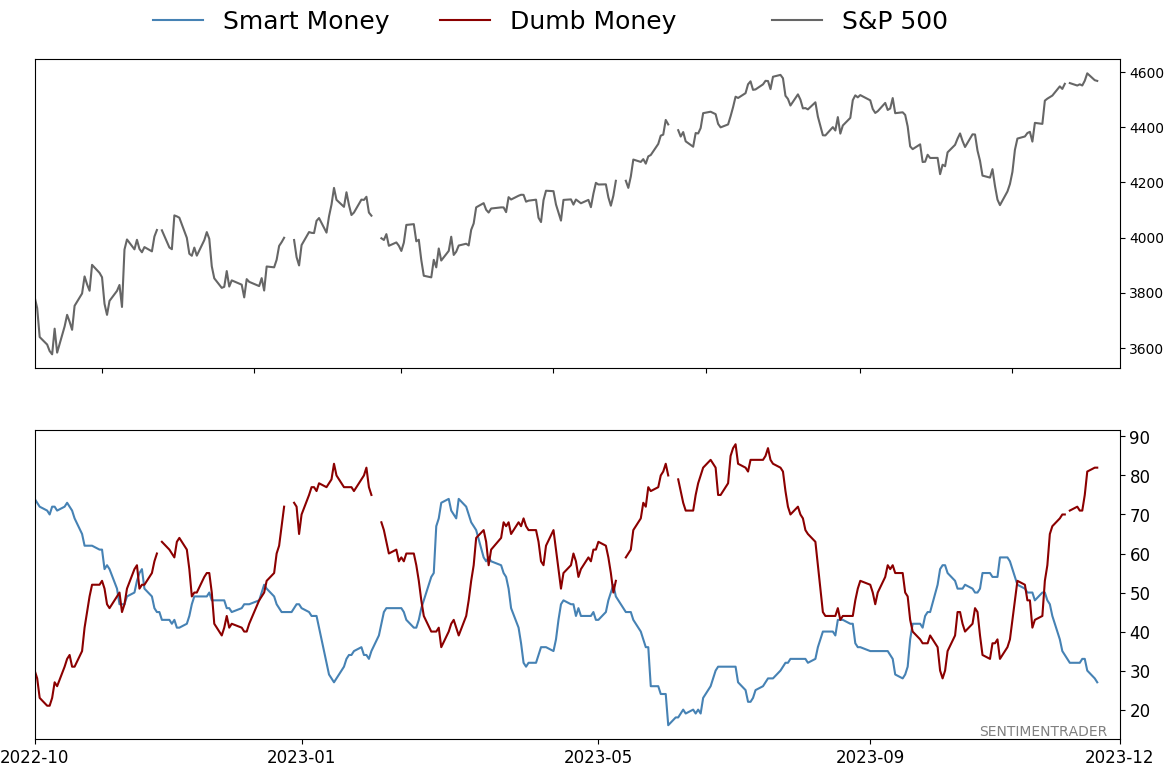
Smart Money Confidence: 27%
Dumb Money Confidence: 82%
|
|
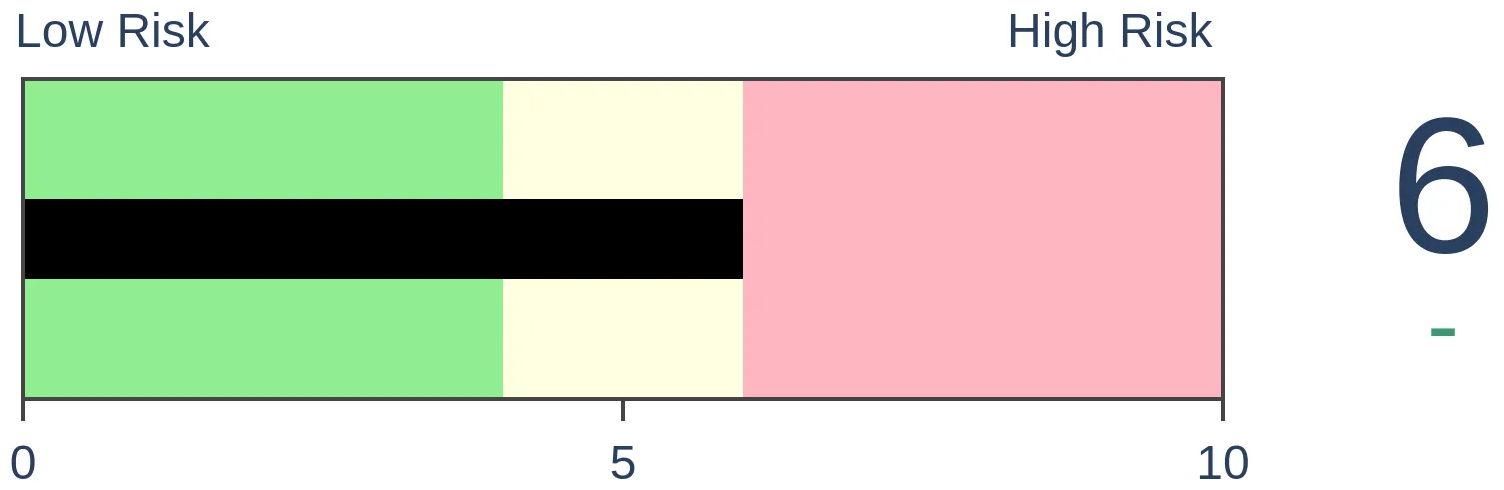
Risk Levels
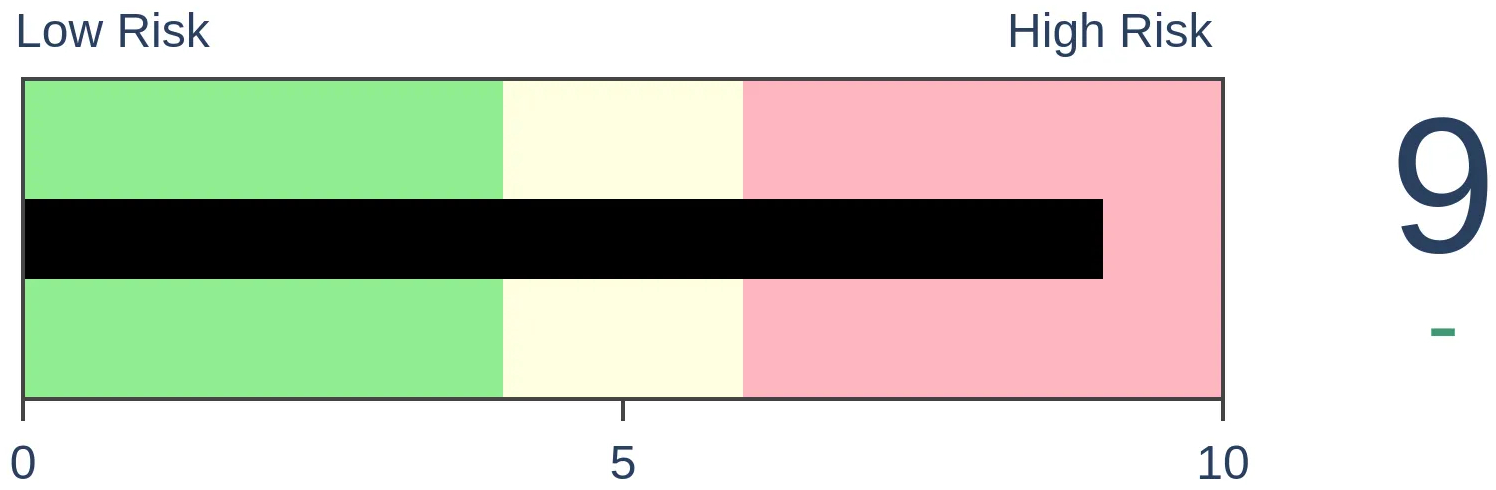
Stocks Short-Term
|
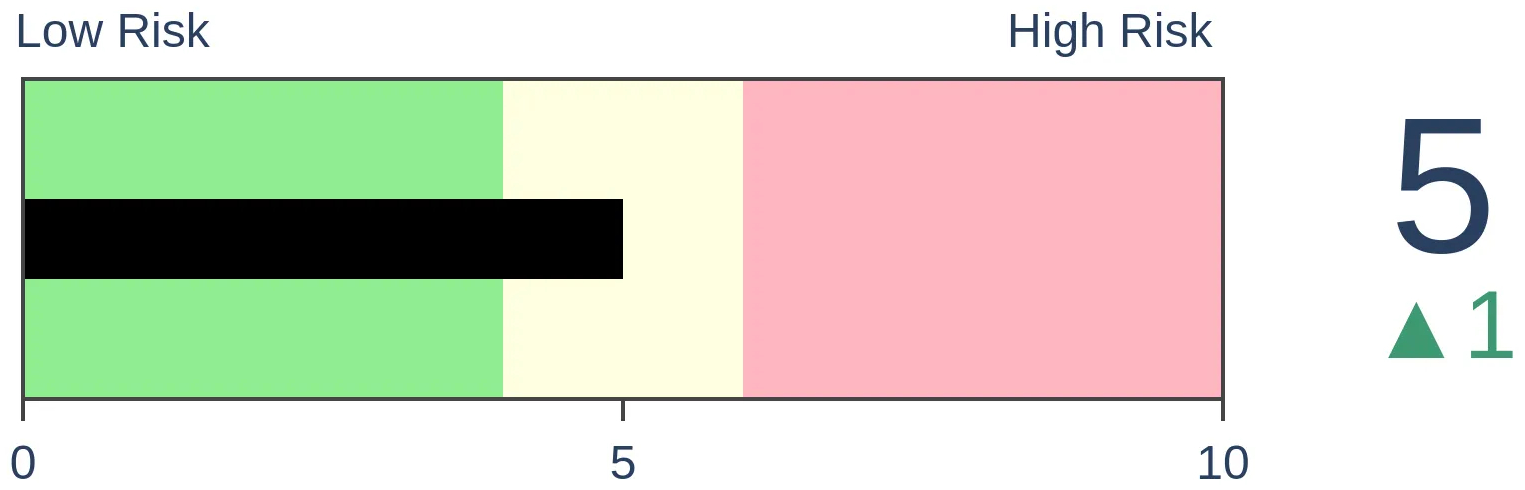
Stocks Medium-Term
|
|
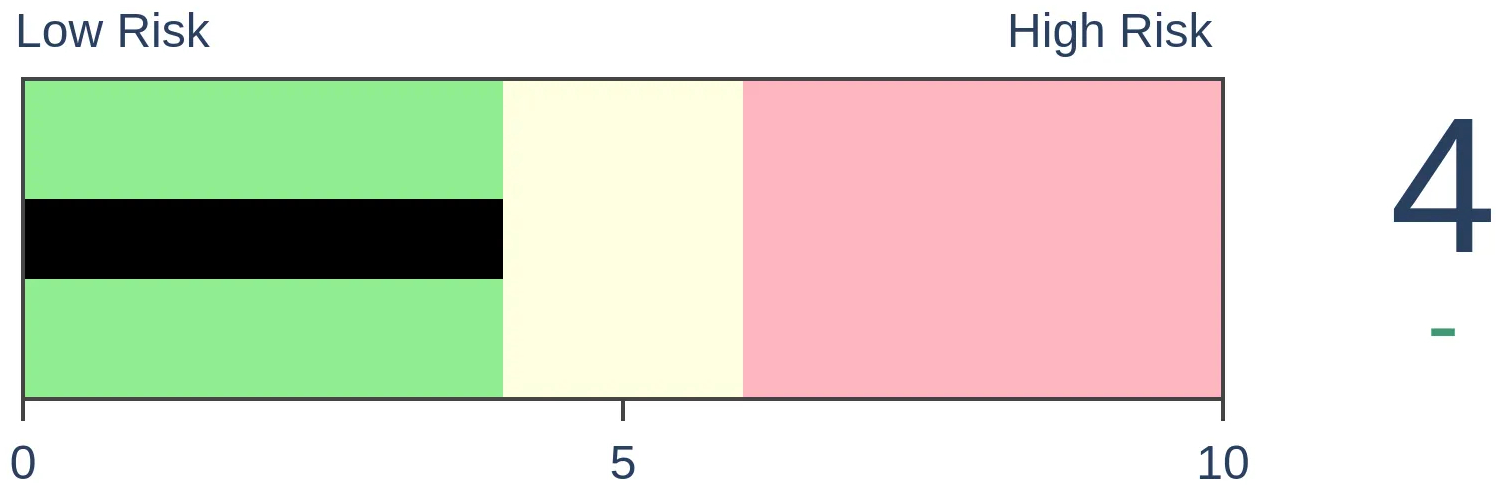
Bonds
|
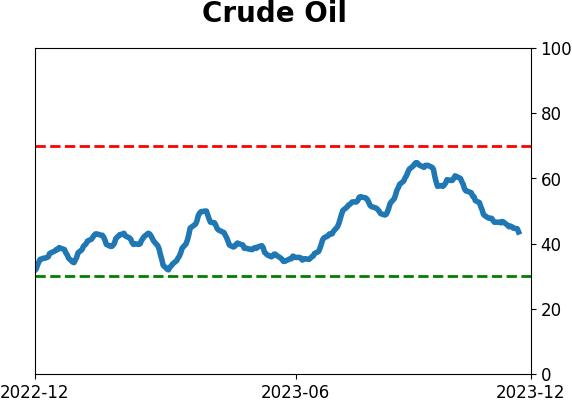
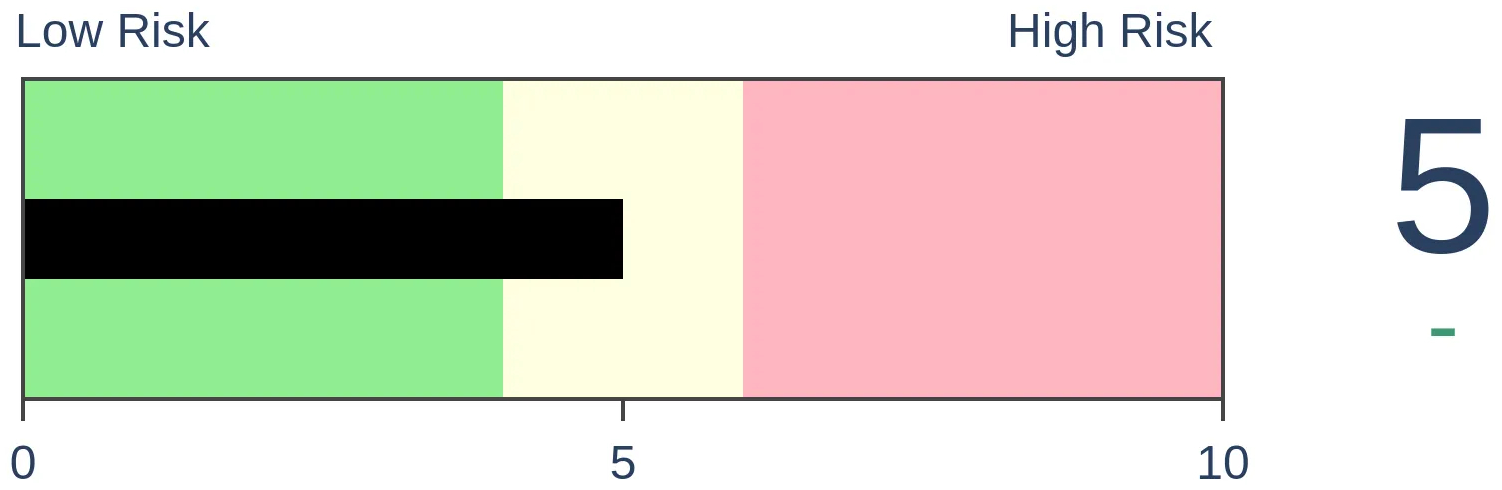
Crude Oil
|
|
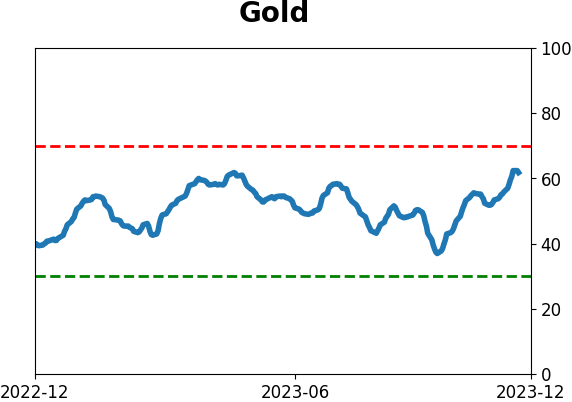
Gold

|
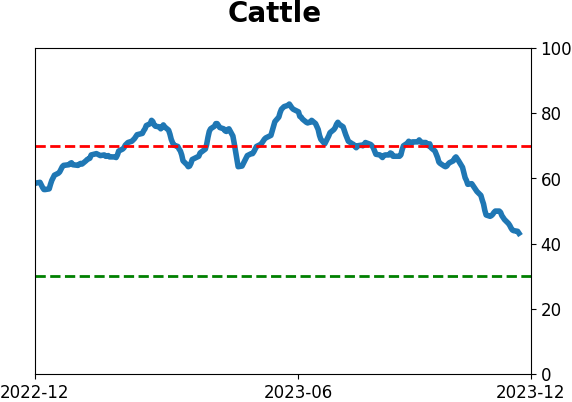
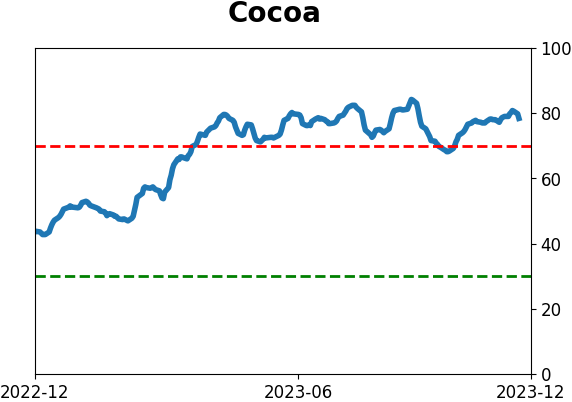
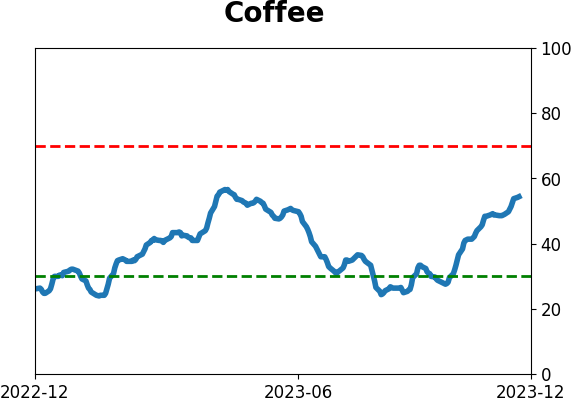
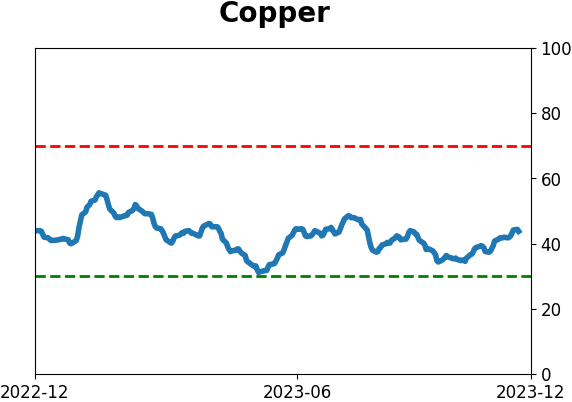
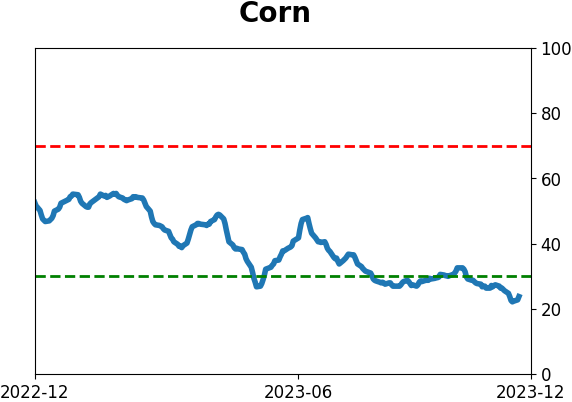
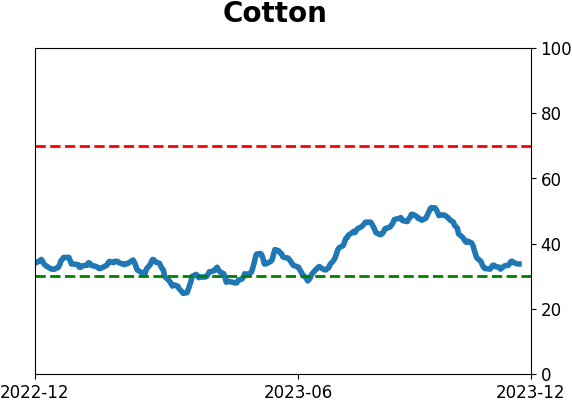
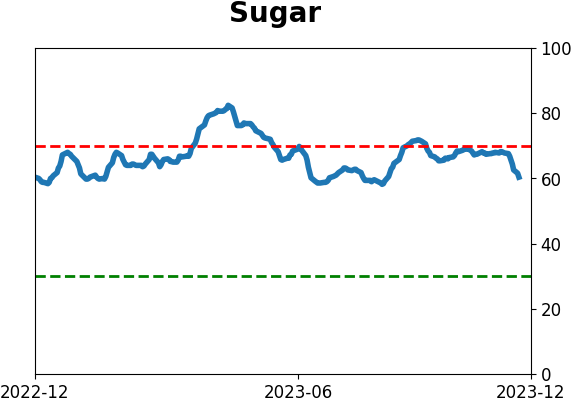
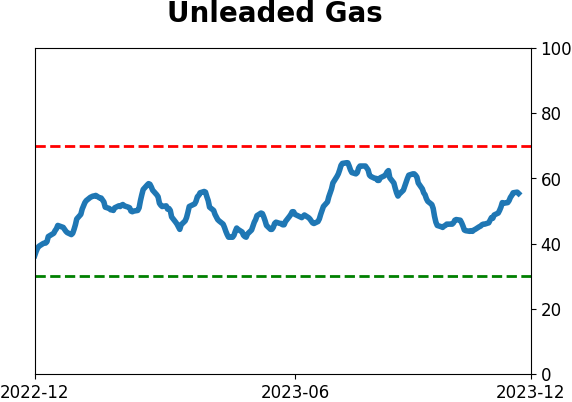
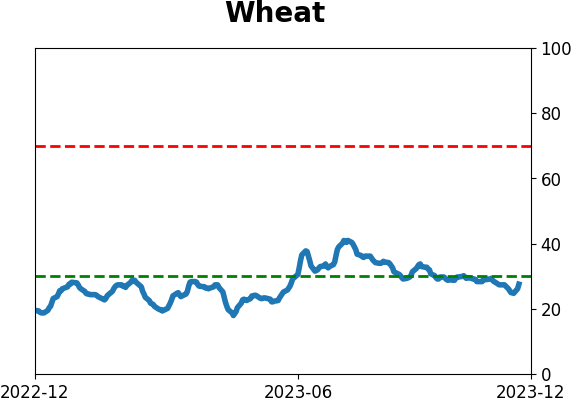
Agriculture
|
|
Research
By Jason Goepfert
BOTTOM LINE
Our short- and medium-term Risk Levels look at sentiment readings within the context of bullish or bearish price action. They both reached maximum levels at the same time, which has never happened before. Very high combined Risk Levels tend to occur during the start of bull moves, but the next week will tell us more about that probability.
FORECAST / TIMEFRAME
None
|
Key points:
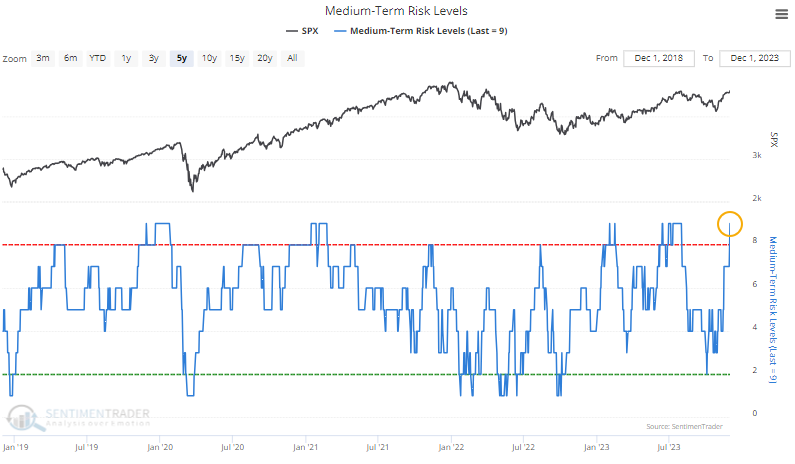
- Our Short-term Risk Level and Medium-term Risk Level are at maximum levels
- In 20 years of computing these measures, they've never been pinned at max levels at the same time
- Extreme bullish sentiment tends to occur during prolonged bull moves; the next week or so should tell us a lot
A record high amount of short- and medium-term risk
We've calculated some of our indicators and models for over two decades. Because investors have gone through nearly every type of market during that span, it's rare to witness a "never seen before" reading.
We have one of those now.
By Friday, the sharp and persistent rally in stocks pushed the Short-term Risk Level to 9, the maximum reading for all intents and purposes.
The same thing happened to the Medium-term Risk Level. This is the first time since we began these calculations in 2004 that both reached a practical maximum value on the same day.
The levels are calculated using short-term and medium-term sentiment indicators and the market environment. If we see high optimism in a bear market, the Risk Level will be high; pessimism in a bull market will press the Risk Level lower. It takes truly extreme optimism in bull markets to show a high Risk Level and excessive pessimism in bear markets to show low Risk Levels.
We've noted multiple times since October that the readings we saw were inconsistent with persistent bear markets. Most of the environments that witnessed similar sentiment and breadth readings were bull markets. Almost exclusively, actually.
High combined Risk Levels tend to occur near the beginning of bull moves
One of those factors we looked at is that we typically don't see extremely high optimism during ongoing bear markets. Sellers never allow buyers to get overly optimistic before overwhelming them with offers.
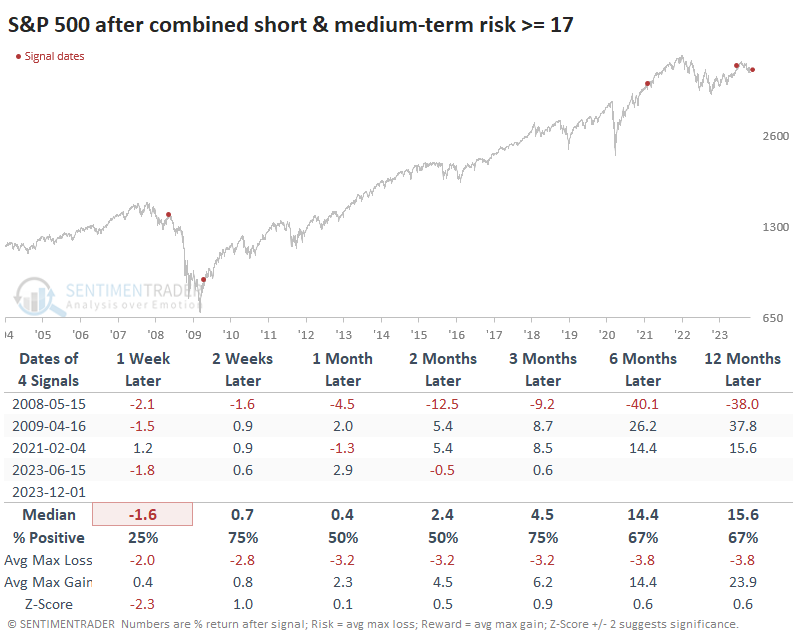
So, it's not a surprise that we rarely see a super high Risk Level in the short- and medium-term at the same time during bear markets. It happened once in 2008, which was about the worst time ever for buyers. The others occurred after the worst was over and investors were recovering from dramatic declines.
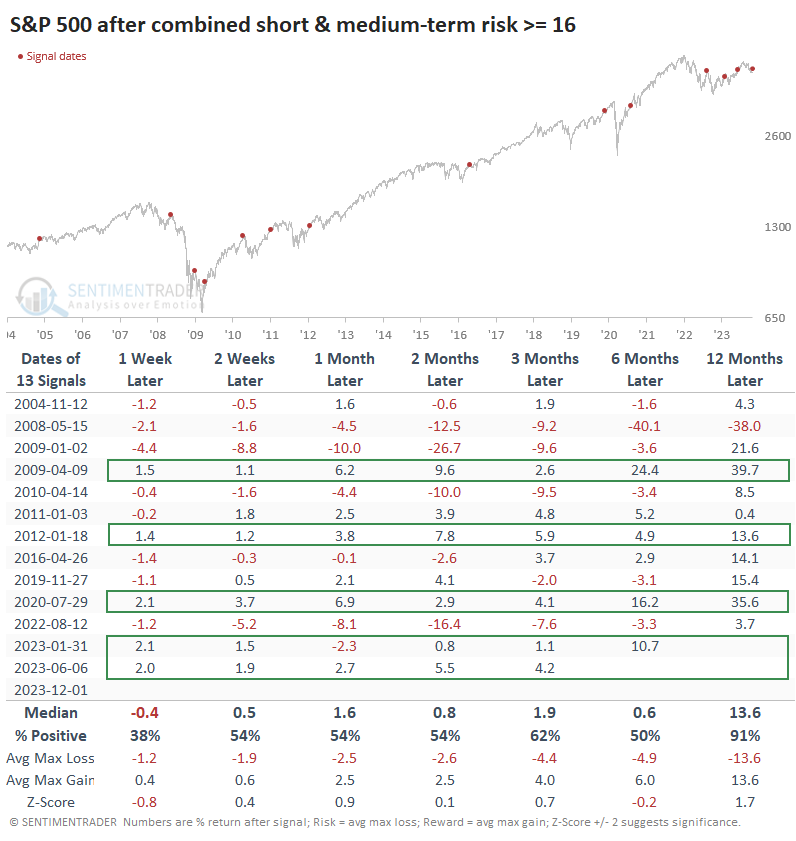
That's too small of a sample size to tell us much, so the table below looks at times when the combined Risk Levels totaled 16 points or more. In the very short term, the S&P struggled to show gains as momentum ebbed.
One thing to note is something we often point out - if investors shrugged off extreme sentiment and kept buying in the short-term, that same mentality showed a strong tendency to stick around long-term, too. Each time the S&P 500 rallied in the week after these extreme combined Risk Level readings, it showed even more gains in the months ahead. When sellers dominated, however, forward returns were a lot dicier.
What the research tells us...
Context is important. Knee-jerk contrarians like to assume that all bullishness is terrible for future returns and vice-versa, but it just doesn't work that way; high optimism can be good as long as it doesn't scare away buyers and embolden sellers.
When we see extreme readings in sentiment, like now, and buyers are still willing to step up to the plate, it tends to be a reliable sign that they will continue to do so for months. The following week or so will help us determine just how committed recent buyers are to this market.
Indicators at Extremes
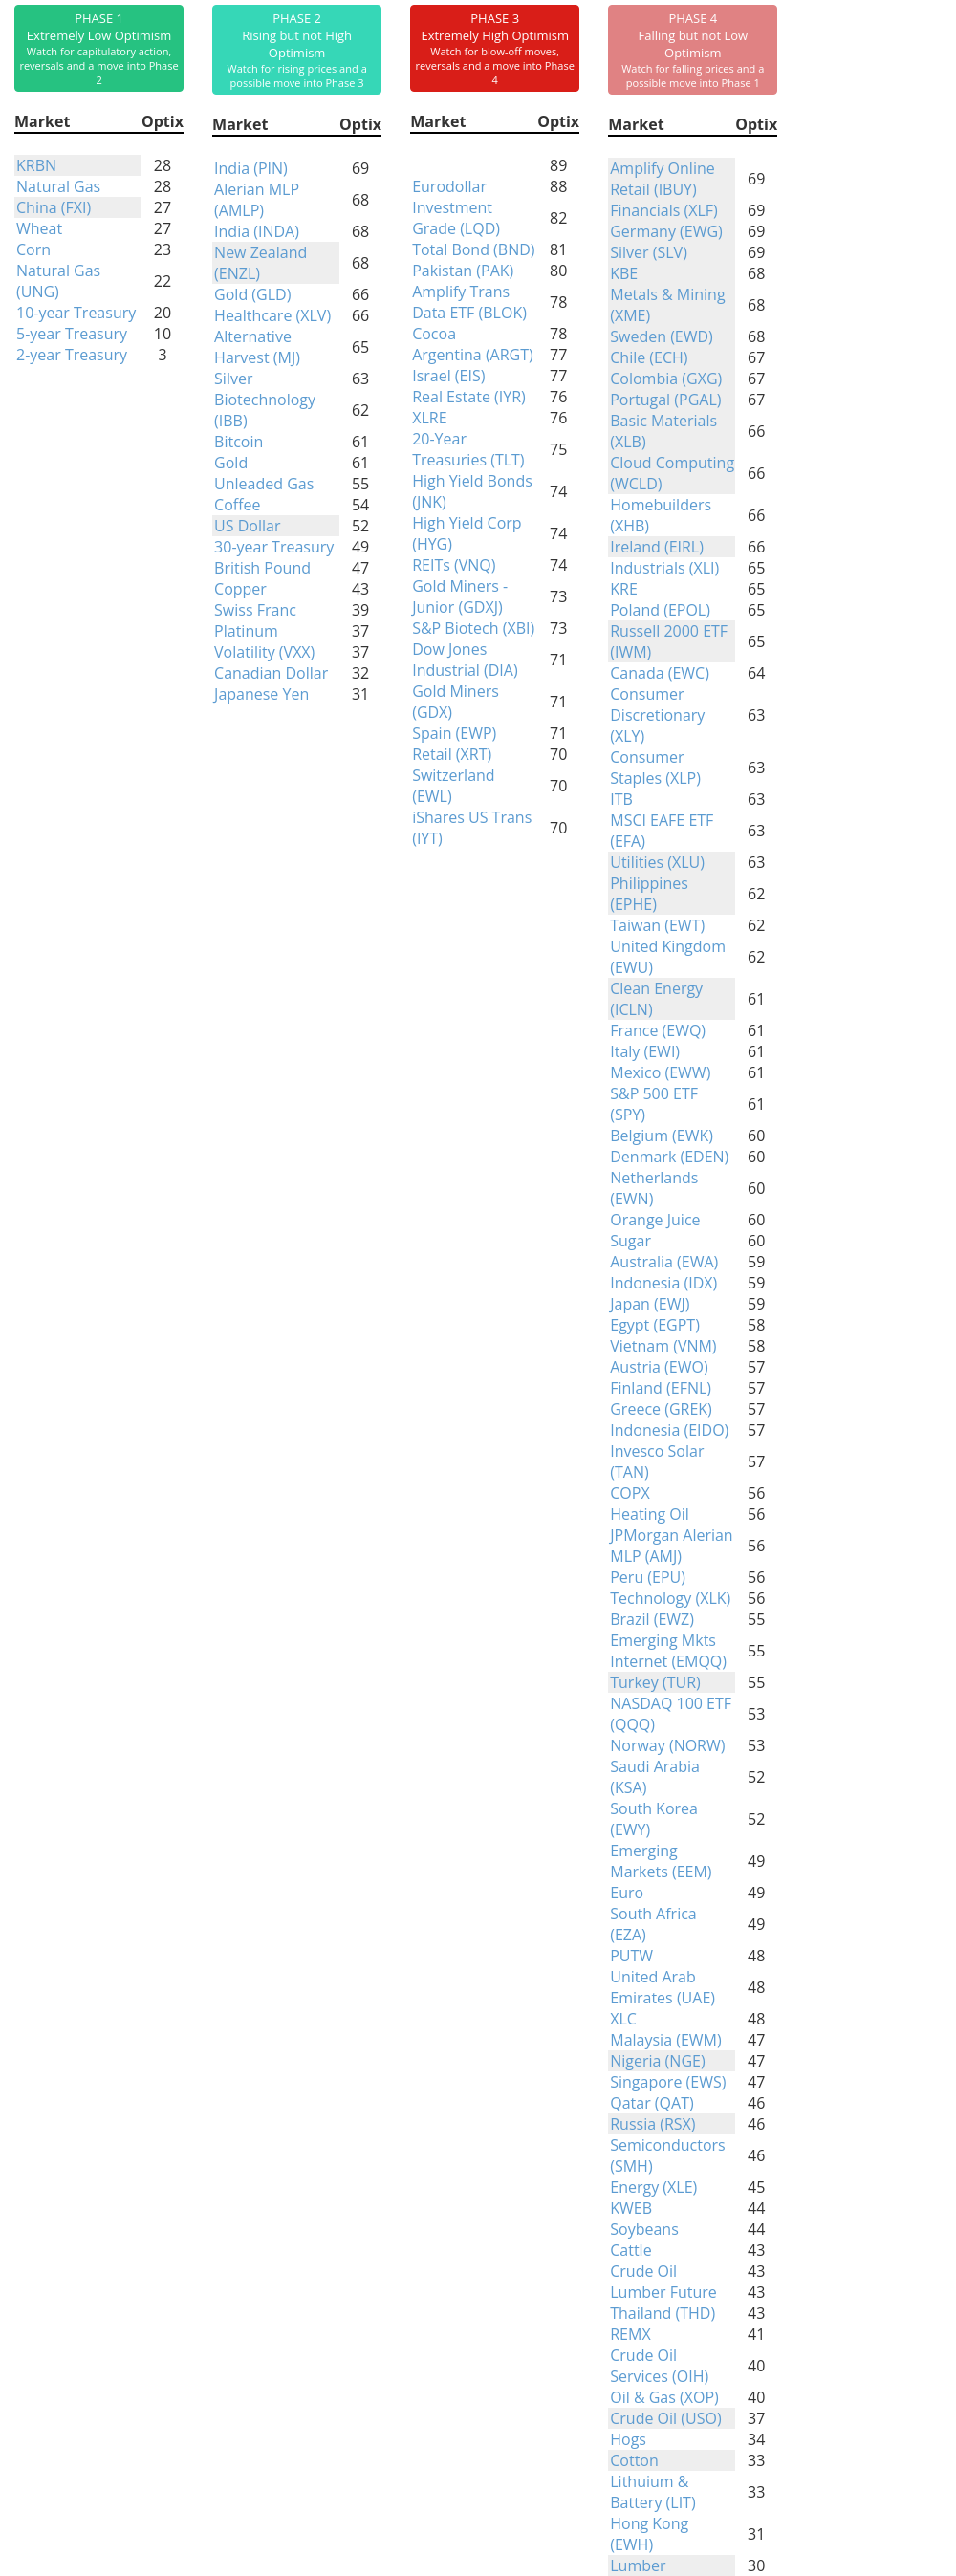
Phase Table
Ranks
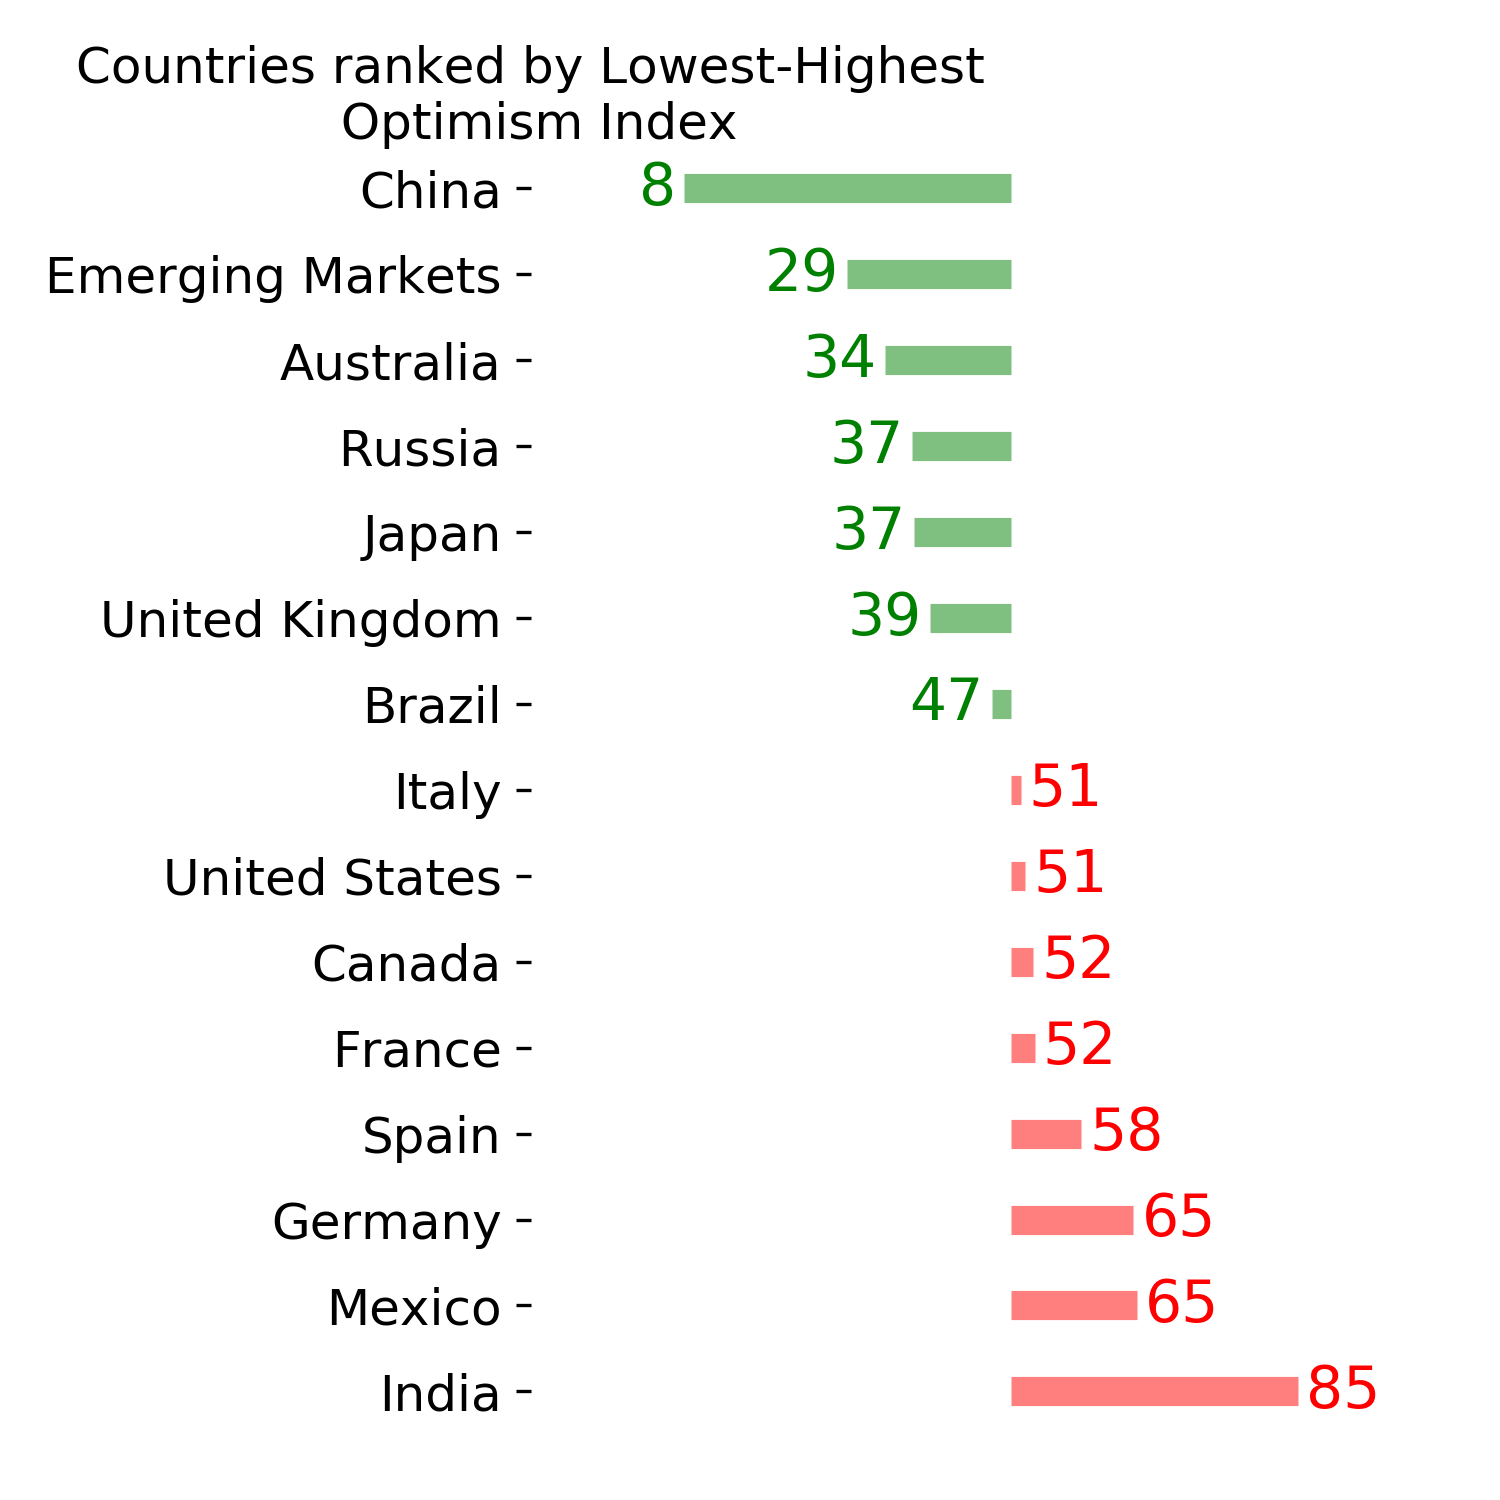
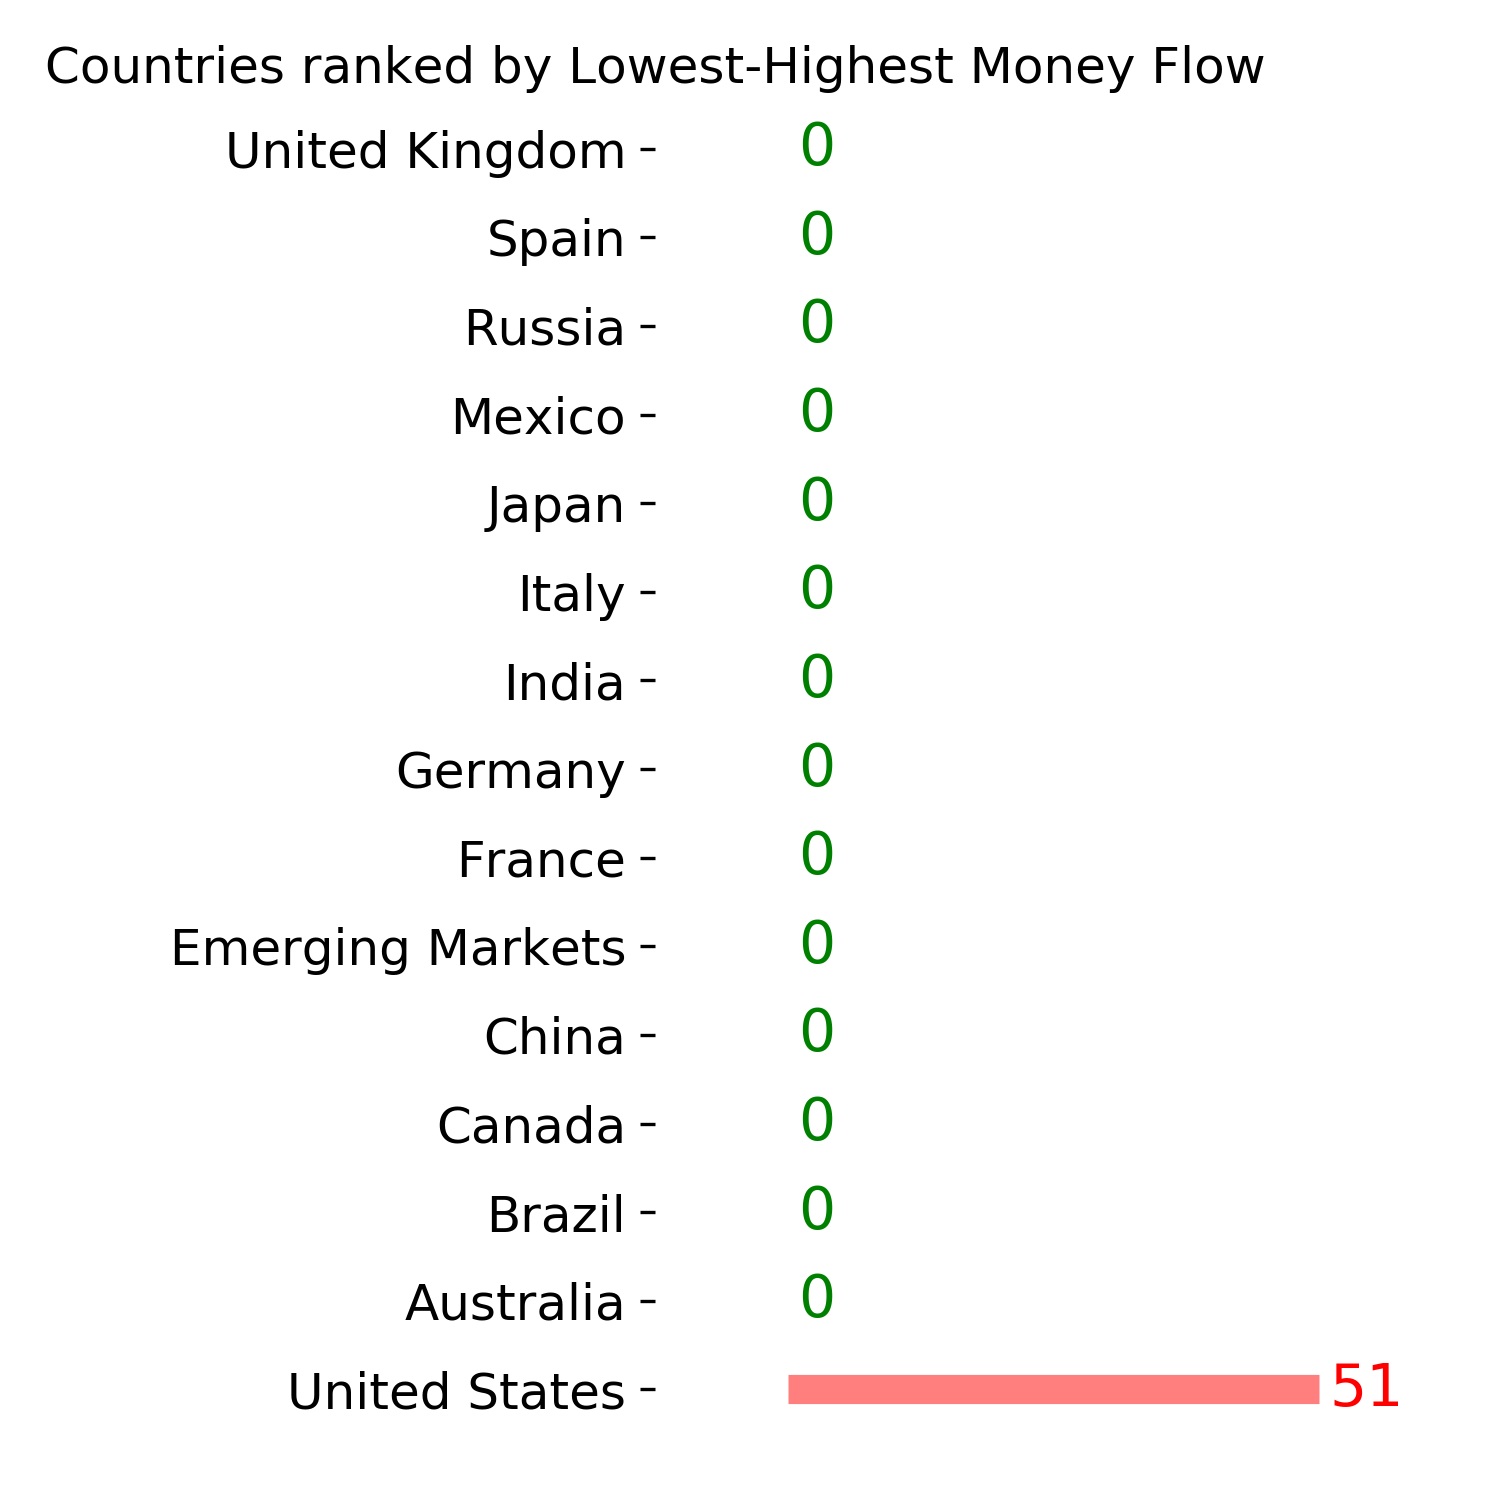
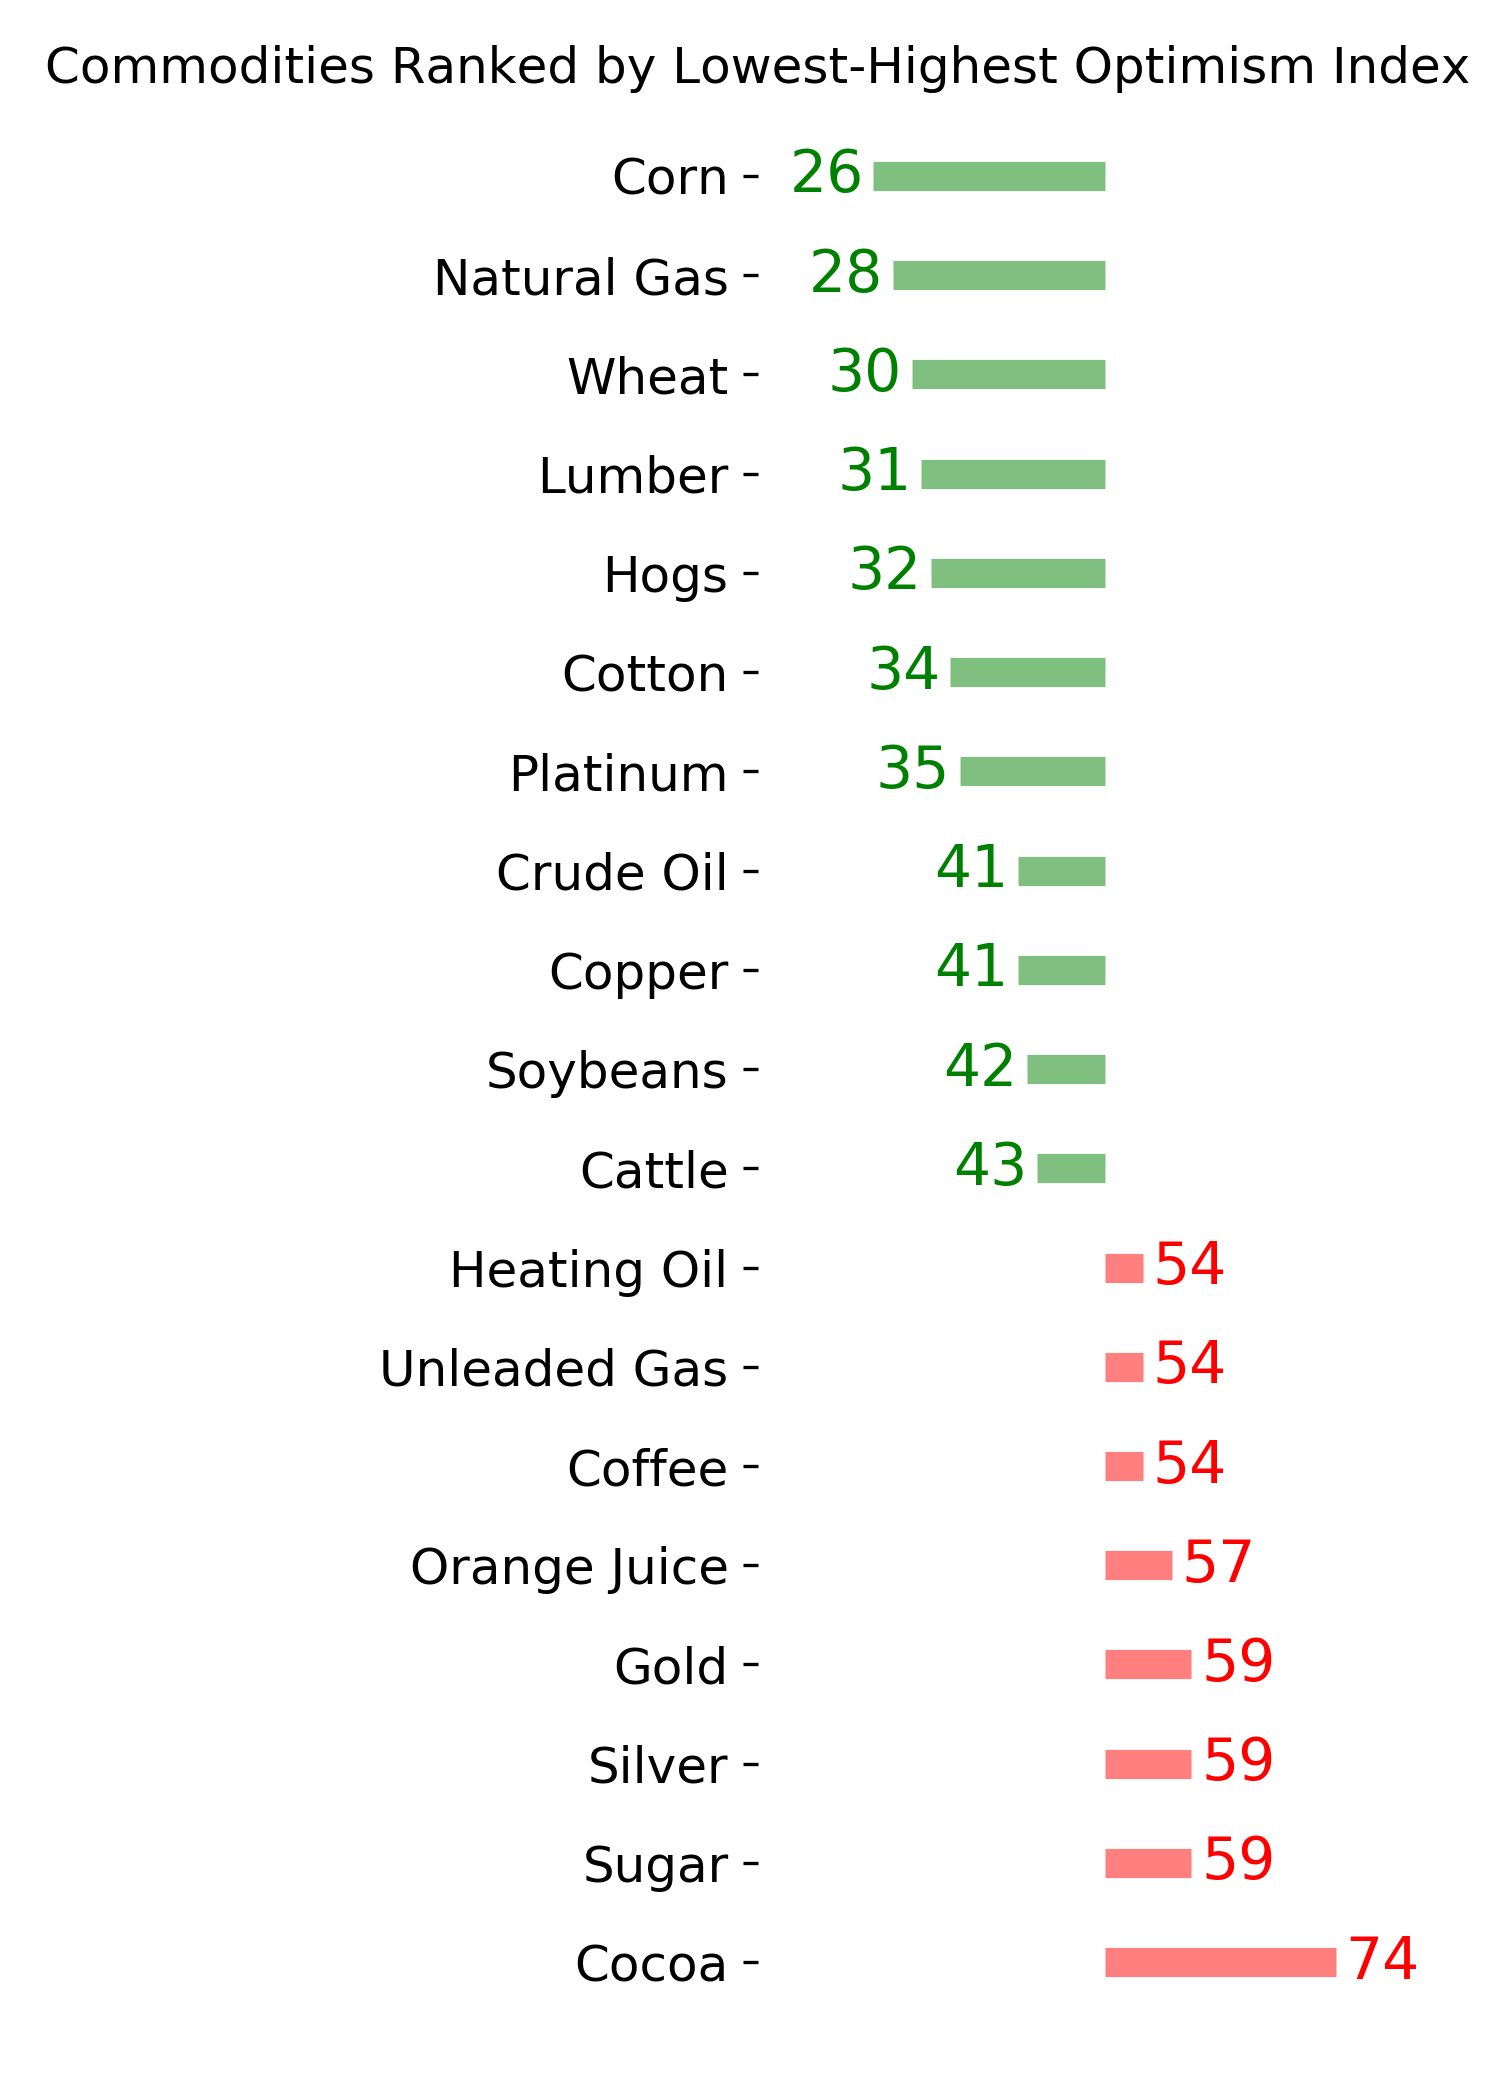
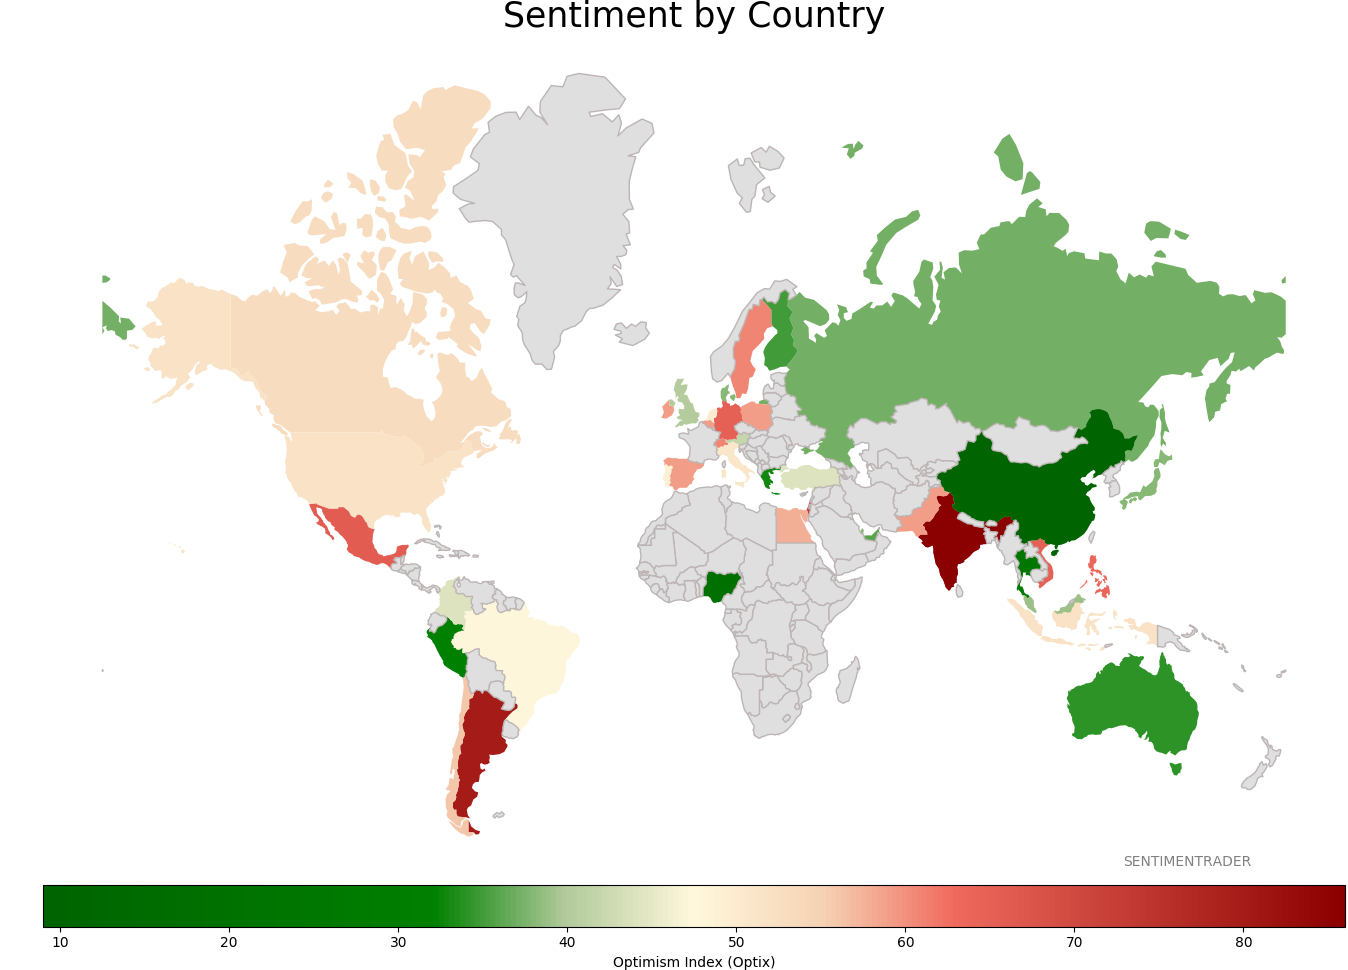
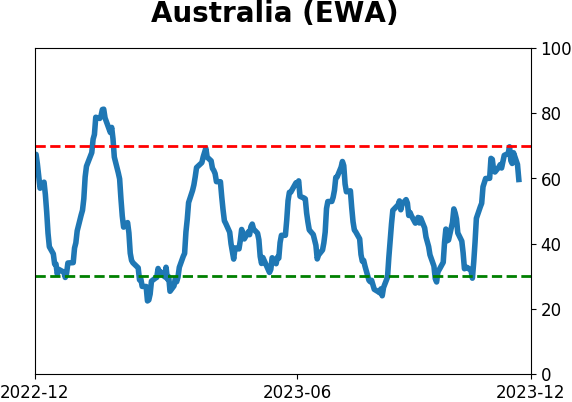
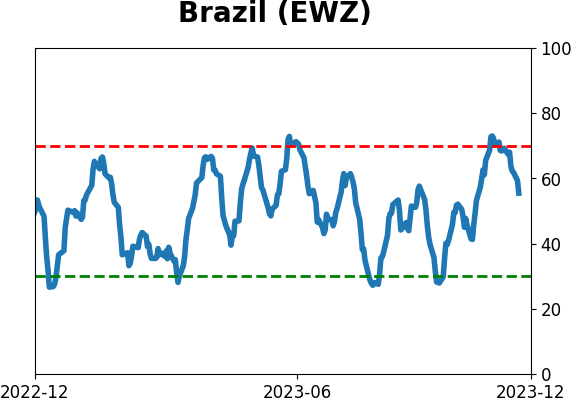
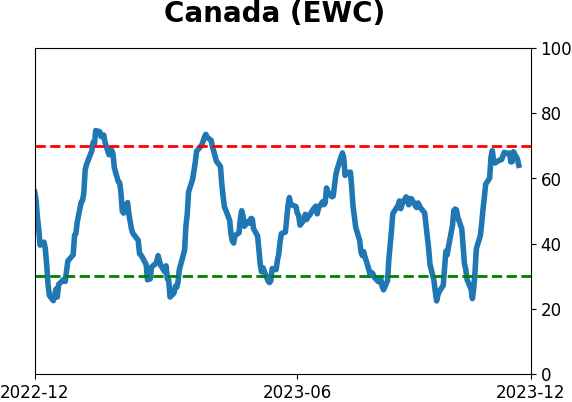
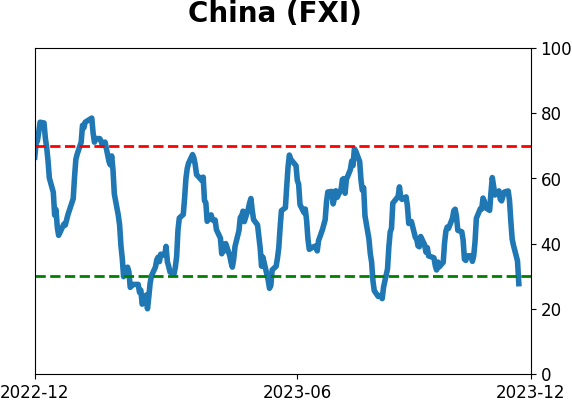
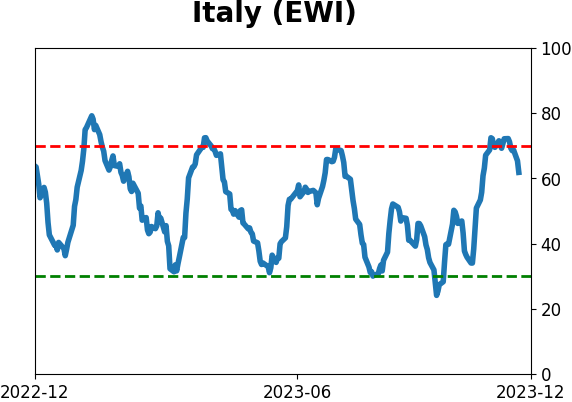
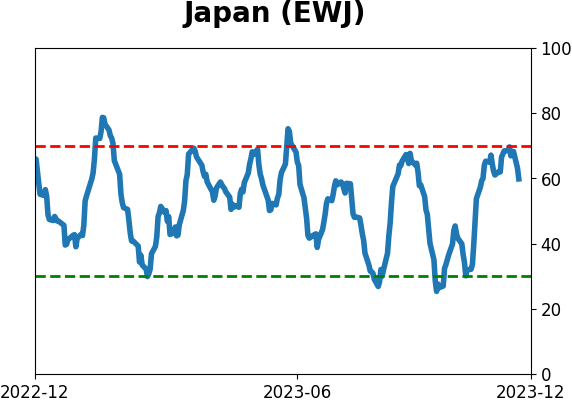
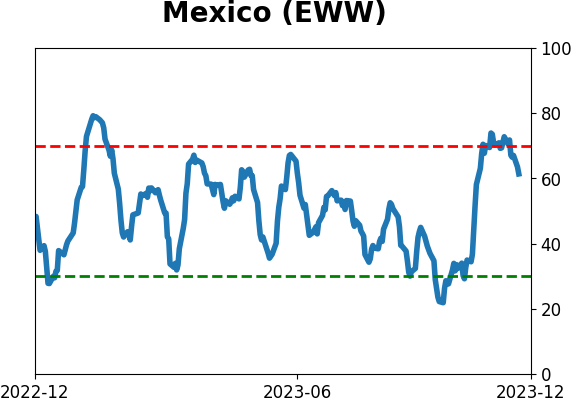
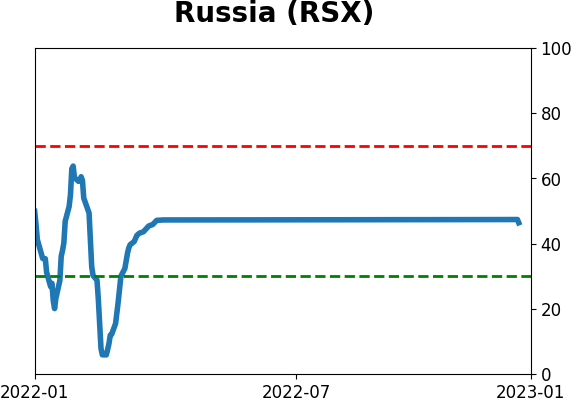
Sentiment Around The World
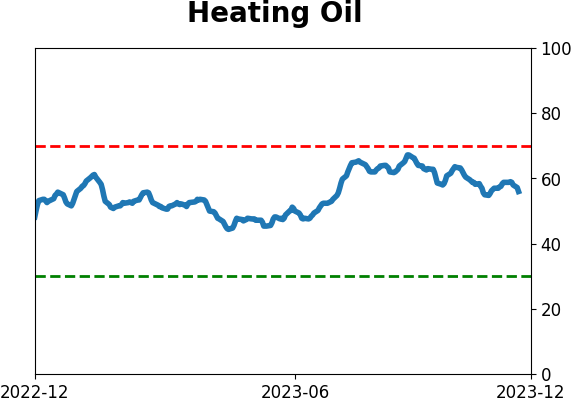
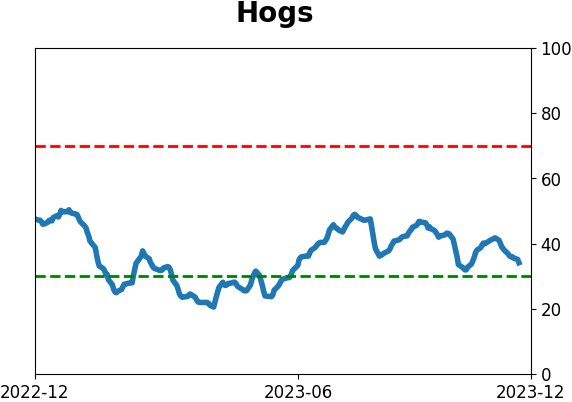
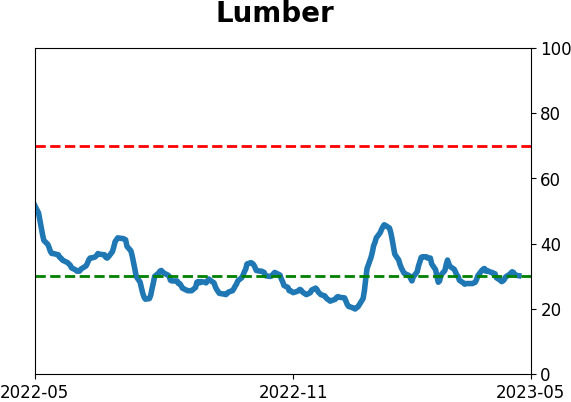
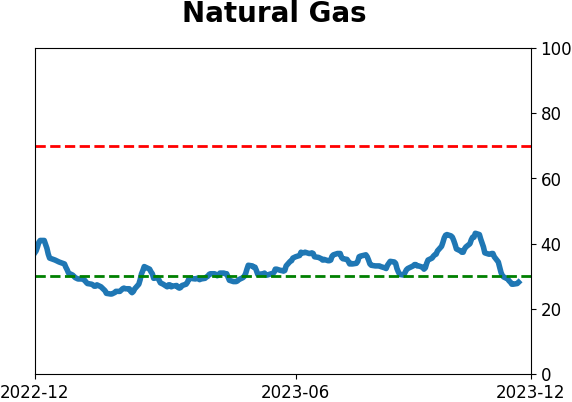
Optimism Index Thumbnails
|
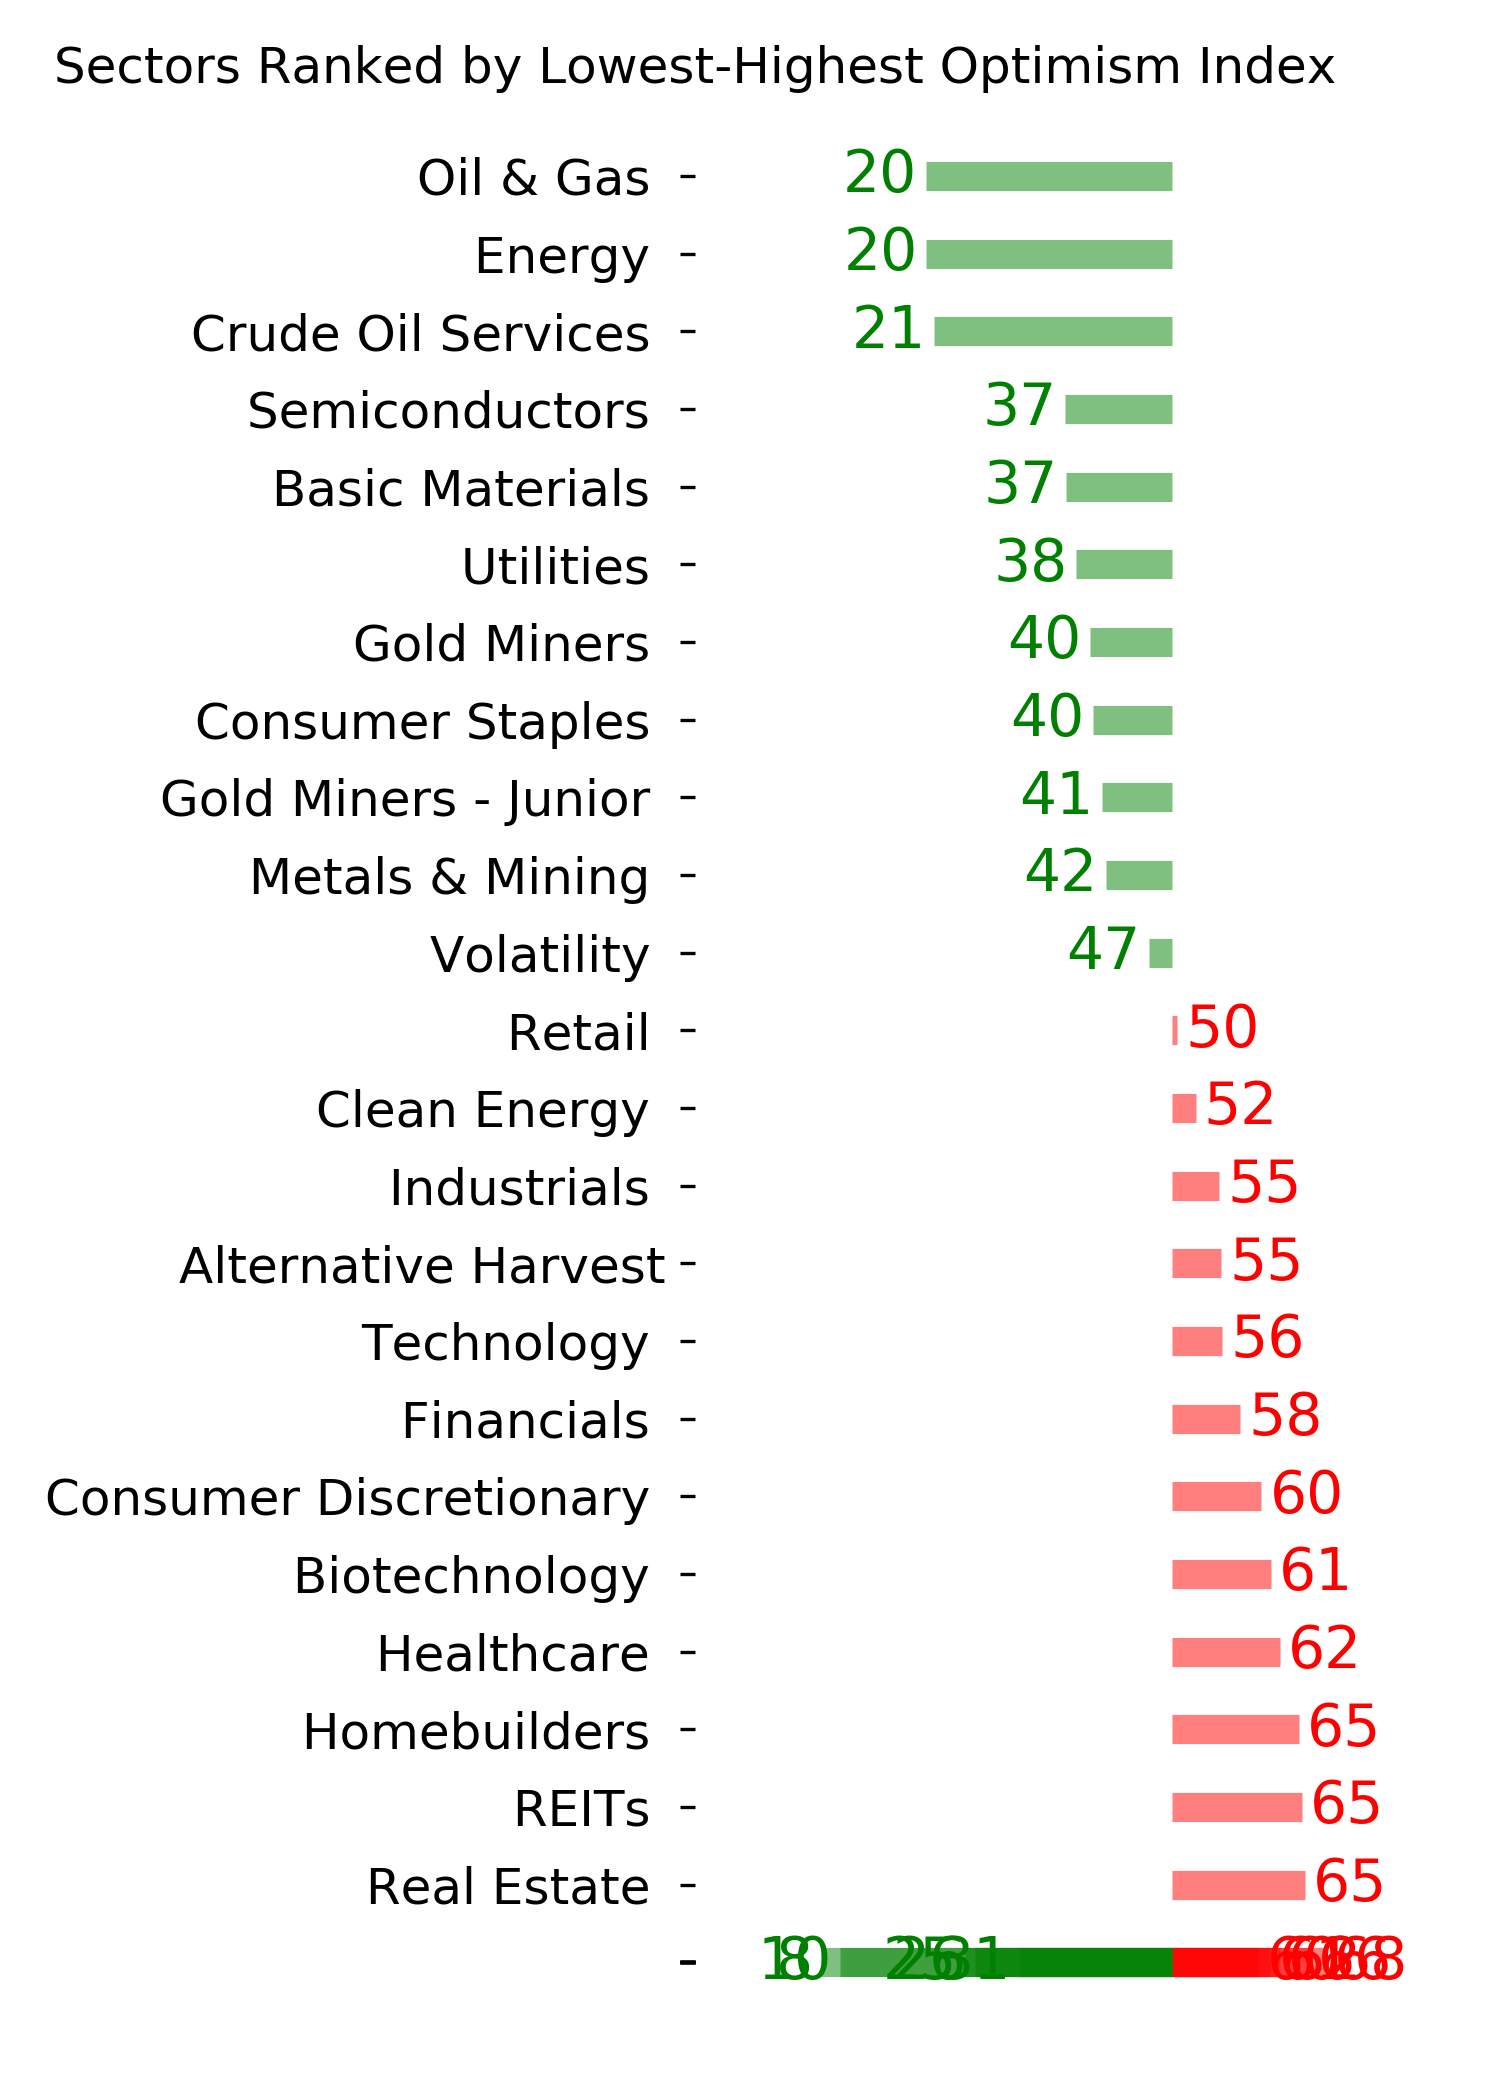
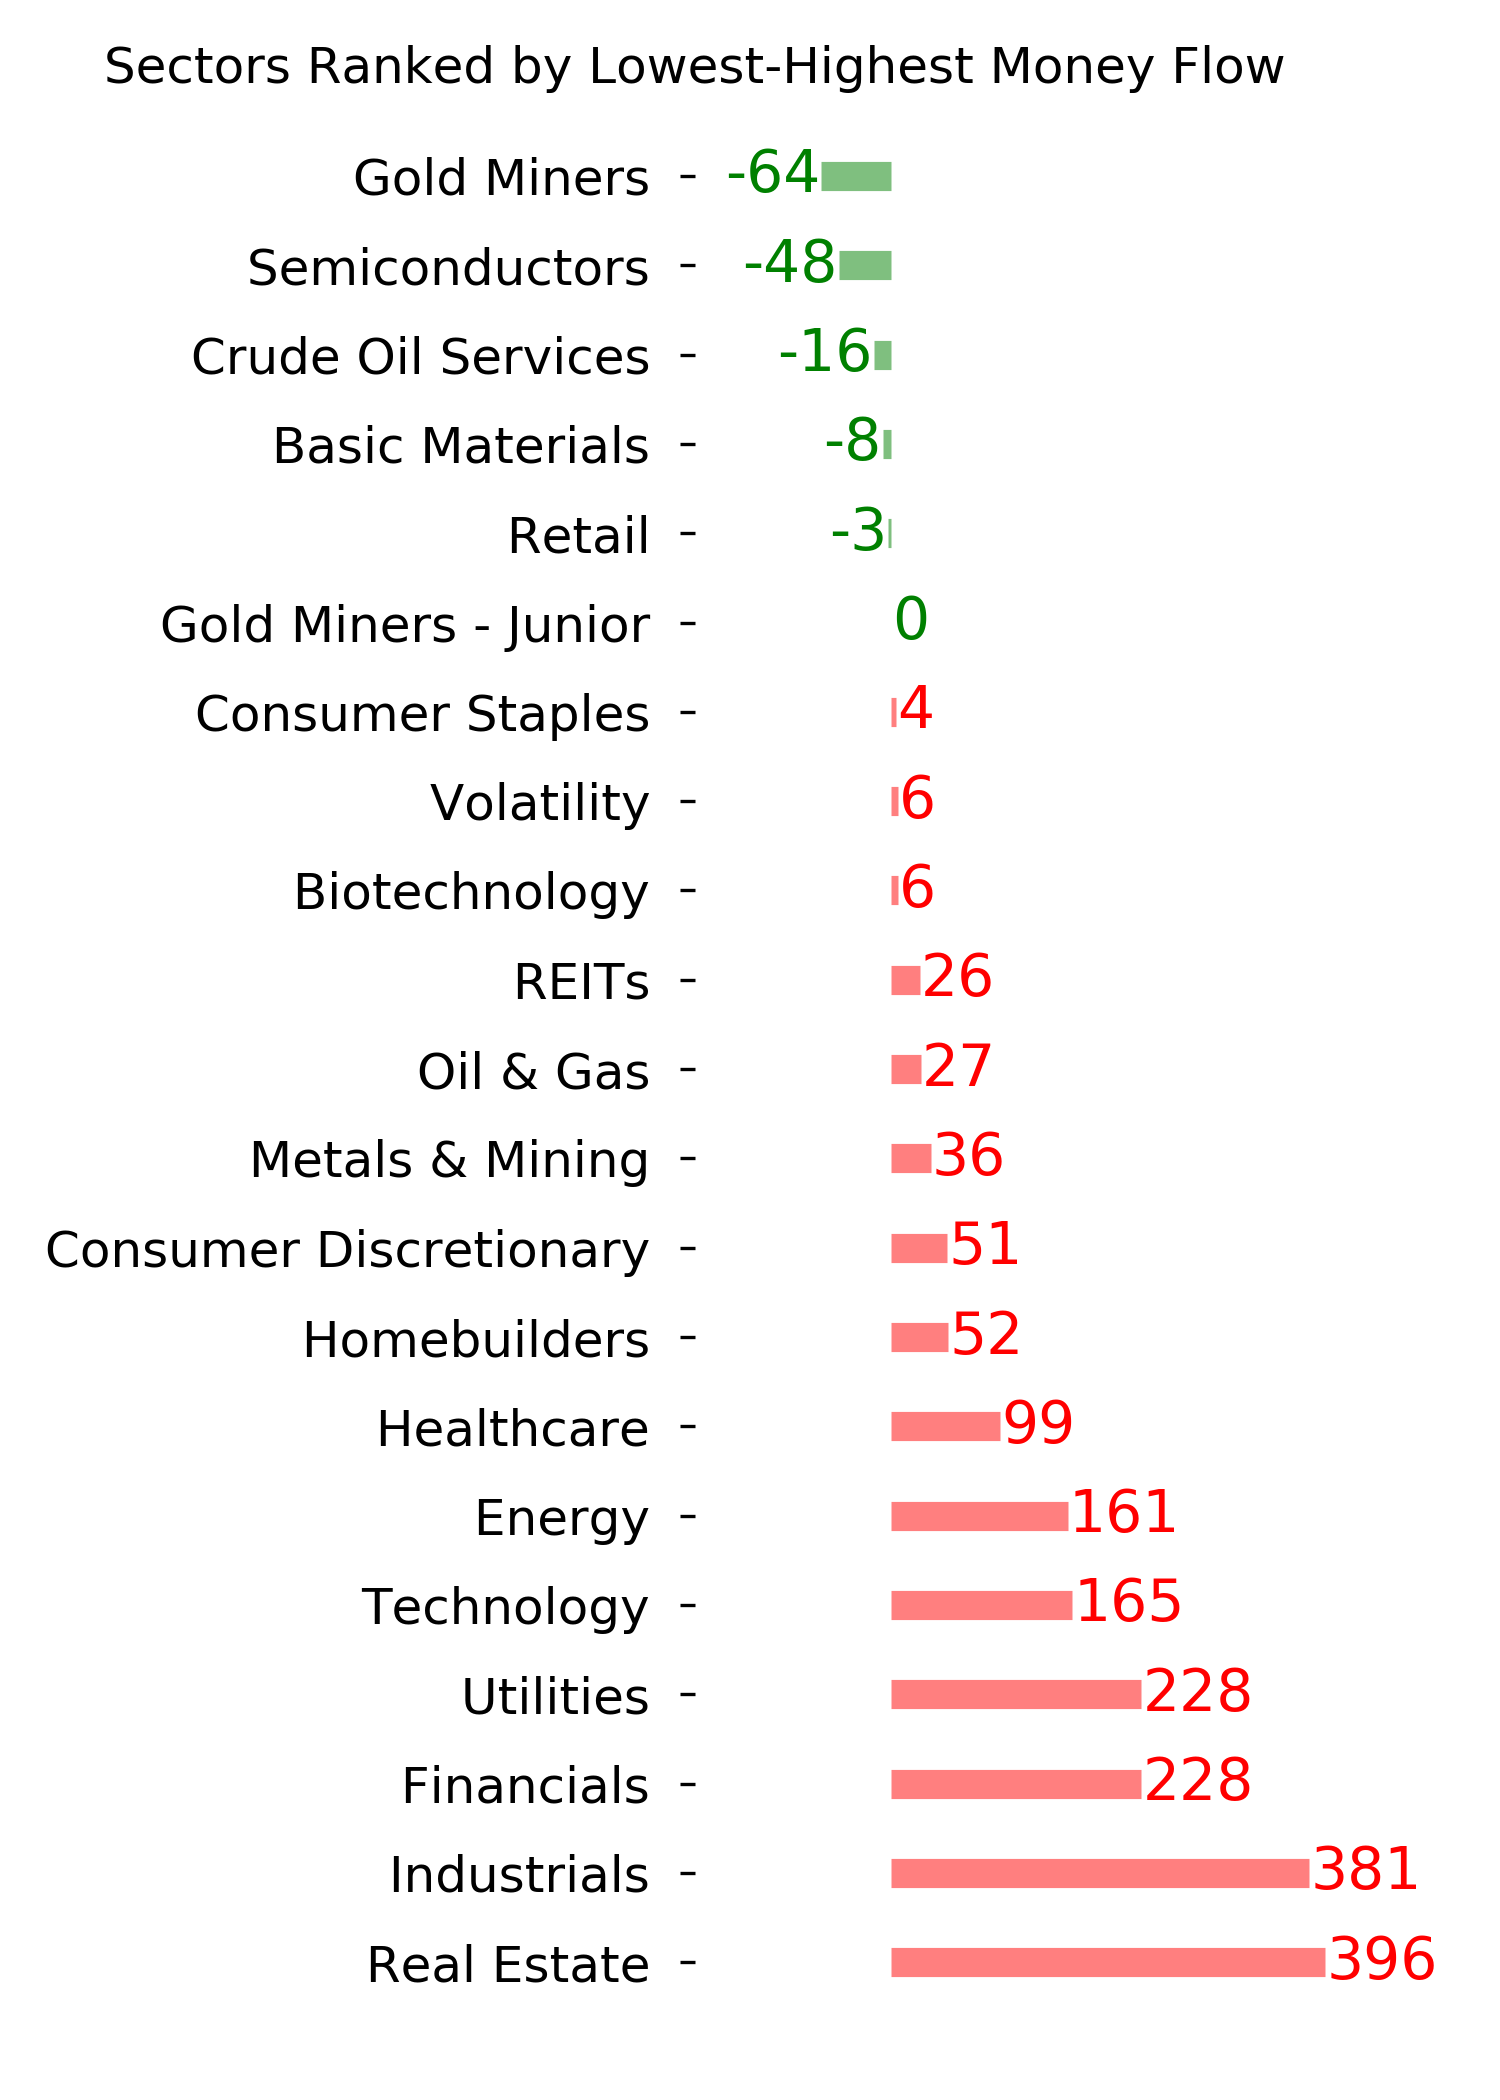
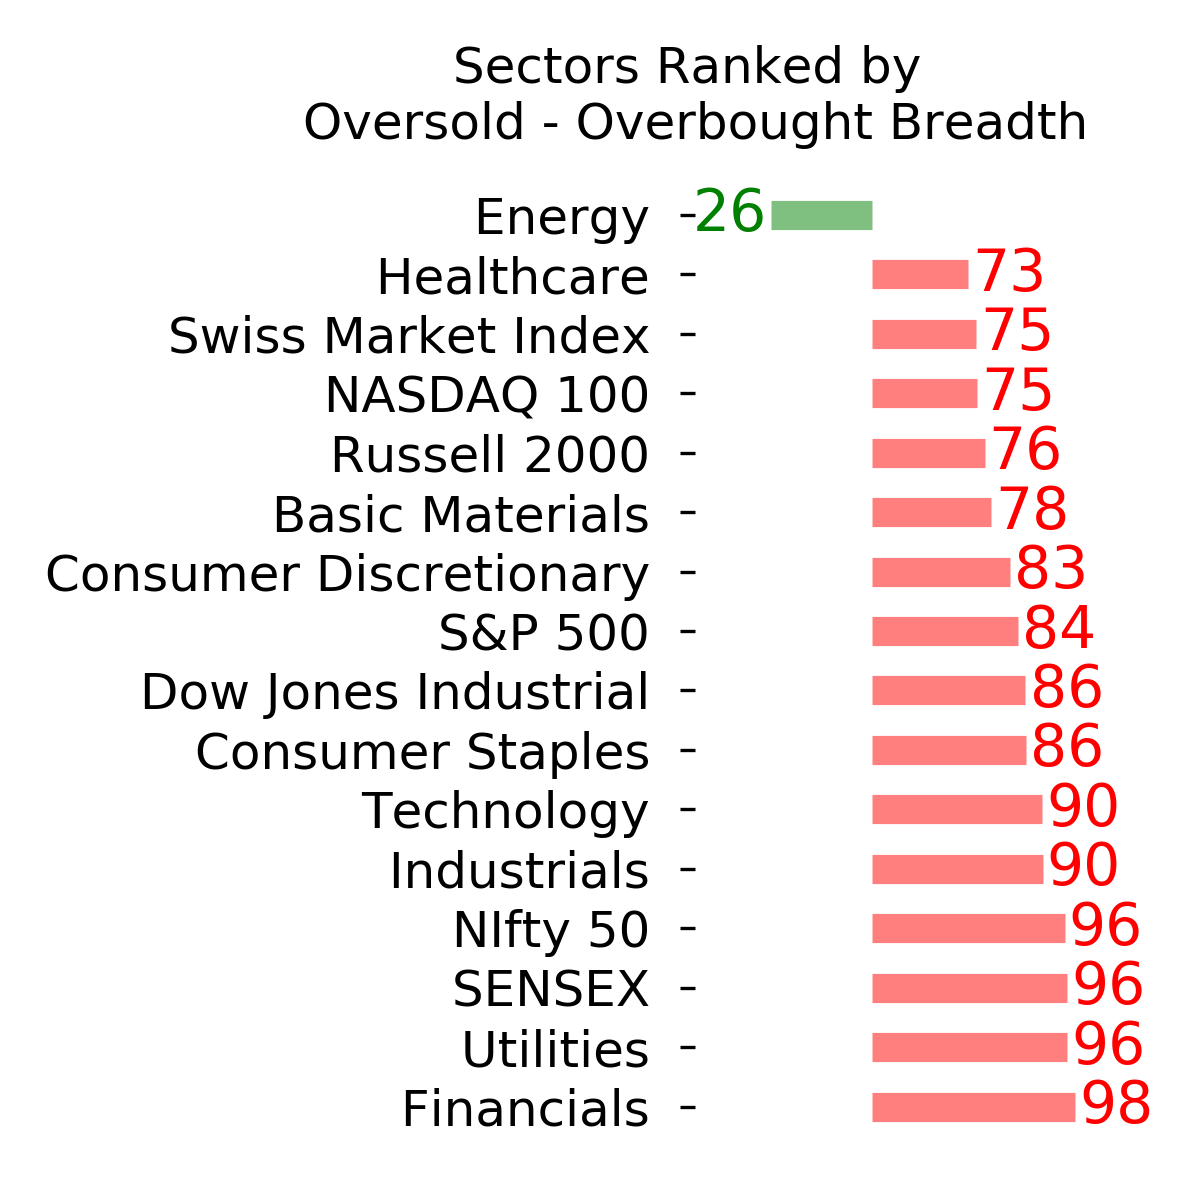
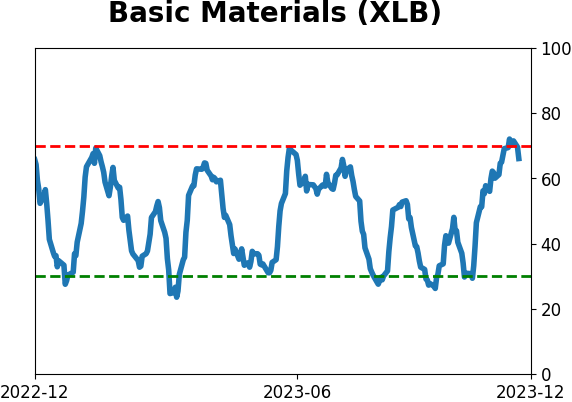
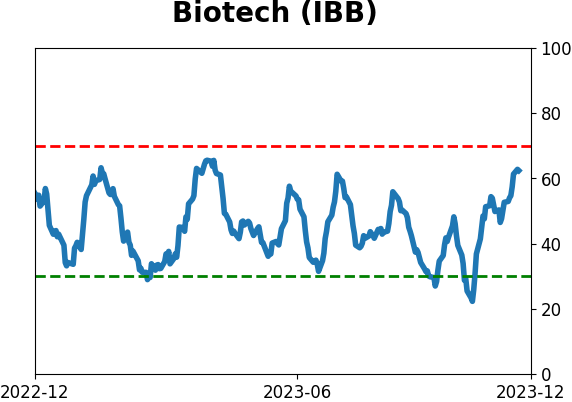
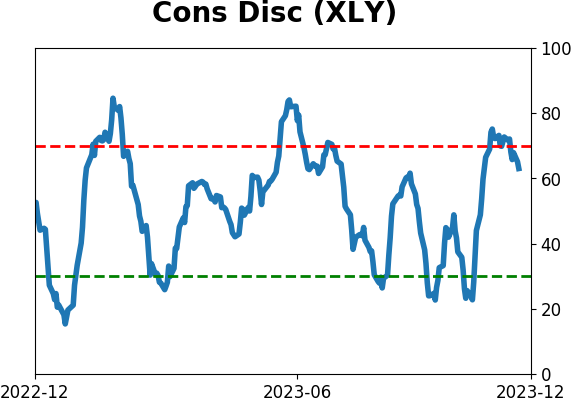
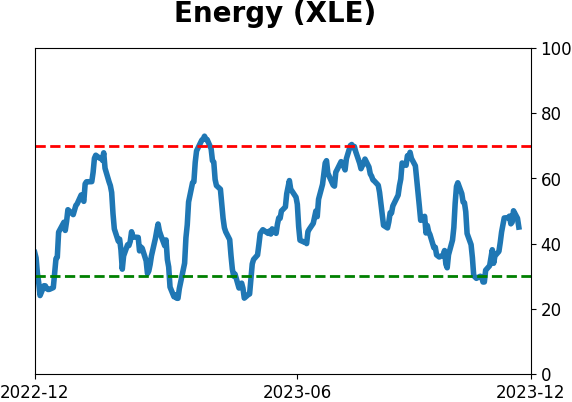
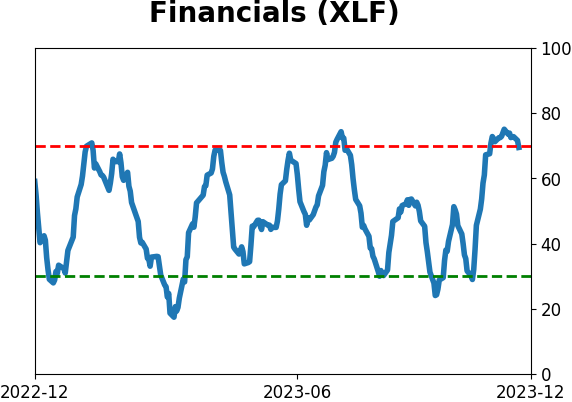
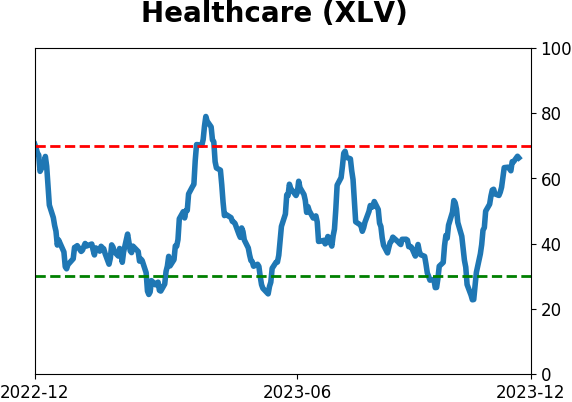
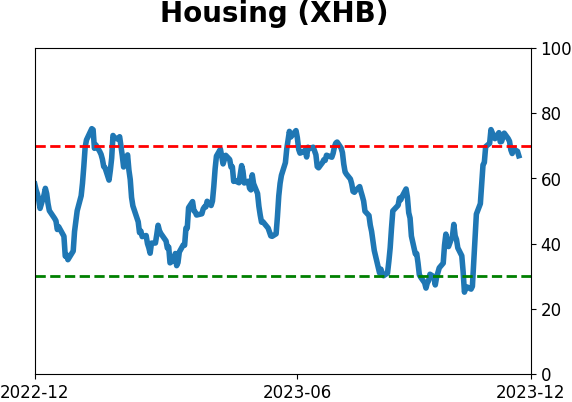
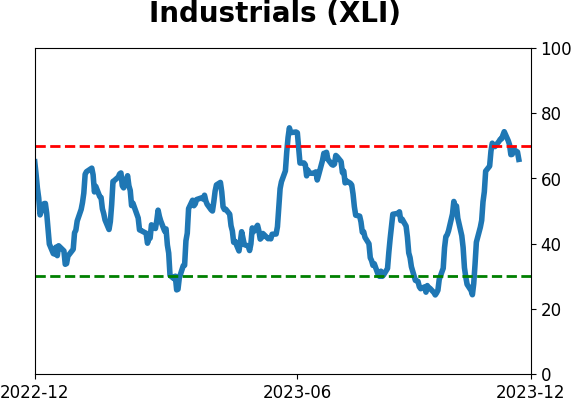
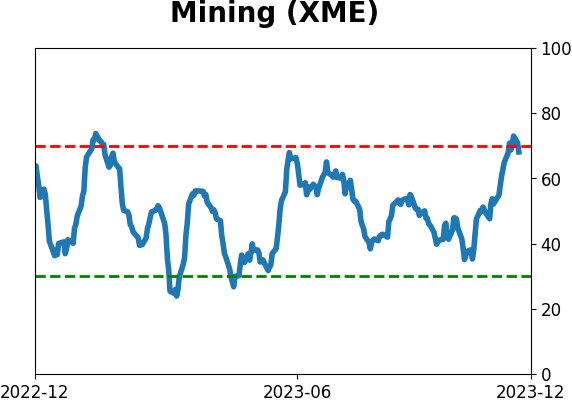
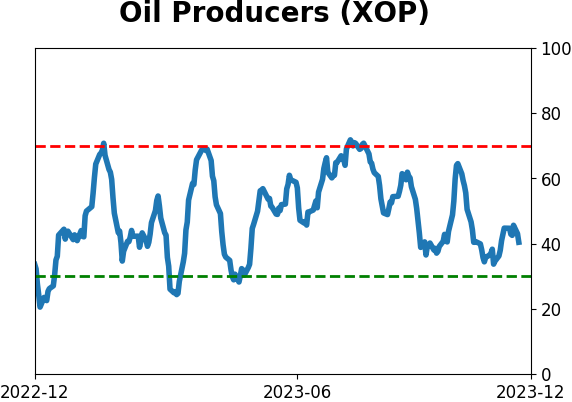
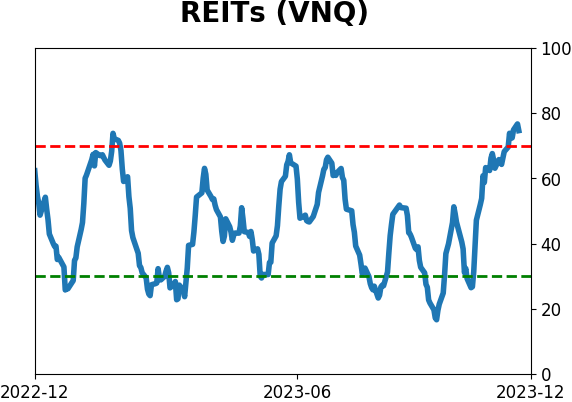
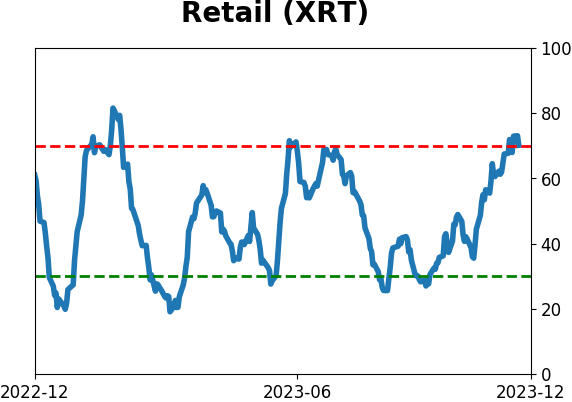
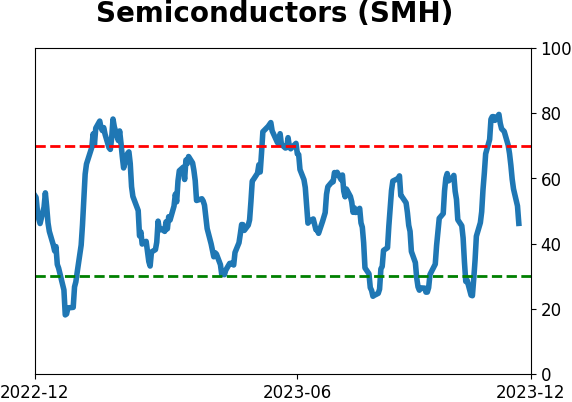
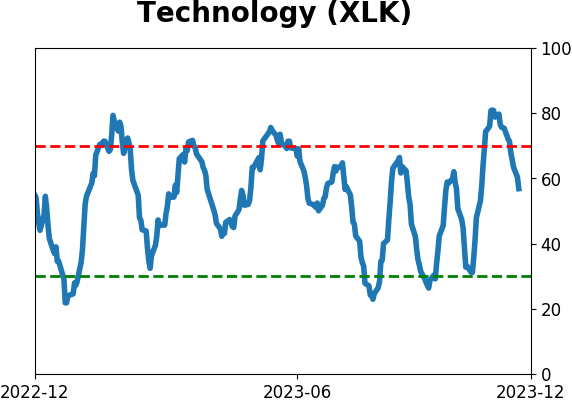
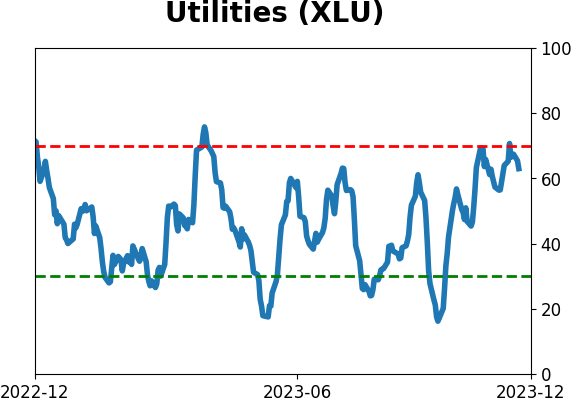
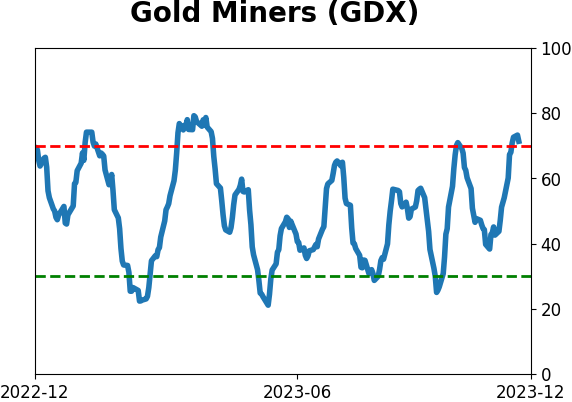
Sector ETF's - 10-Day Moving Average
|
|
|
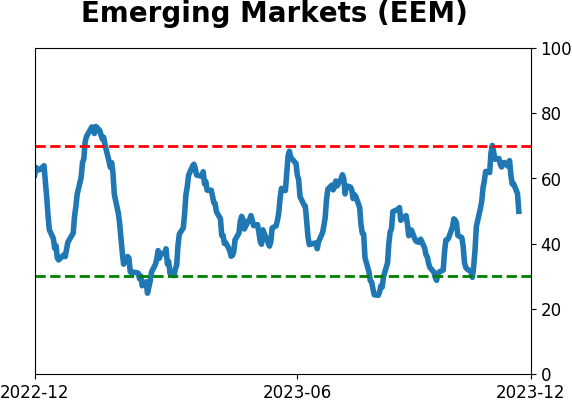
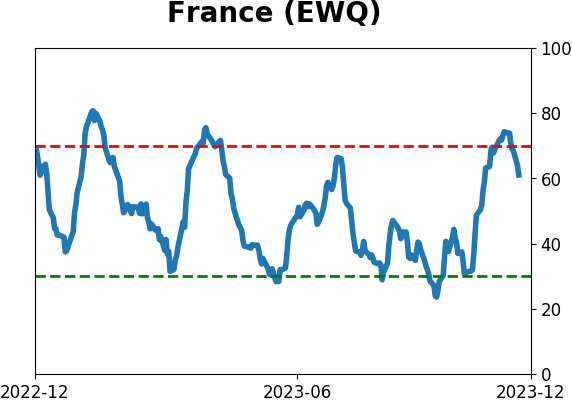
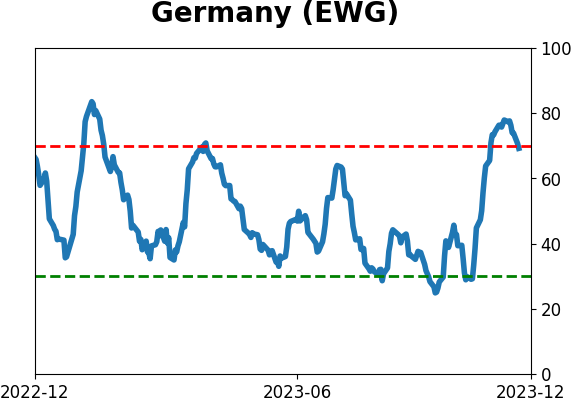
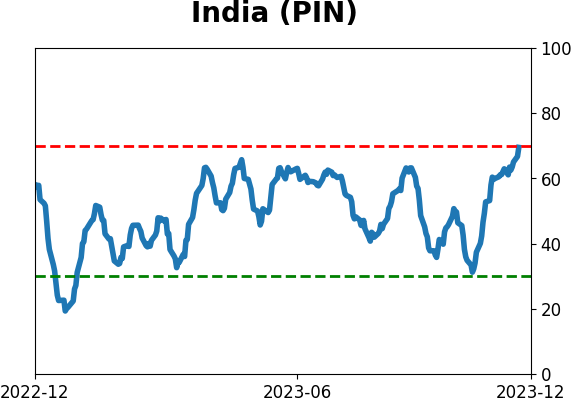
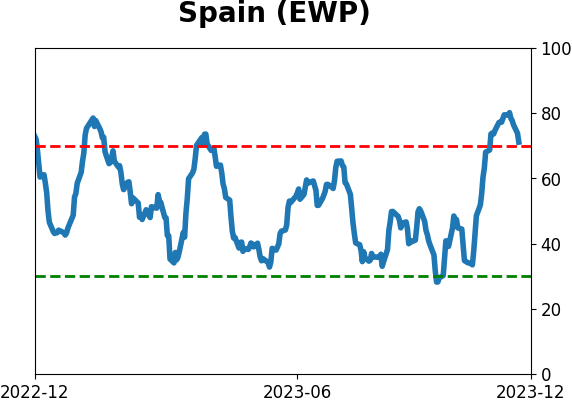
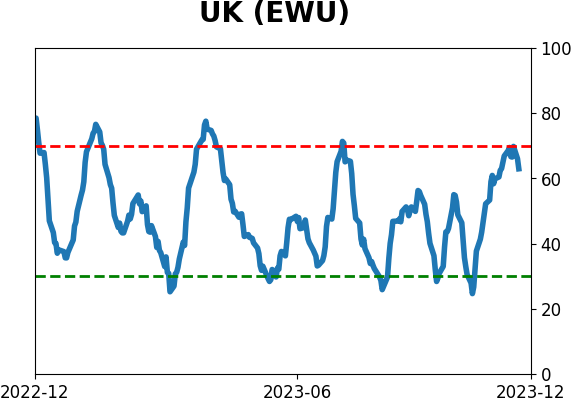
Country ETF's - 10-Day Moving Average
|
|
|
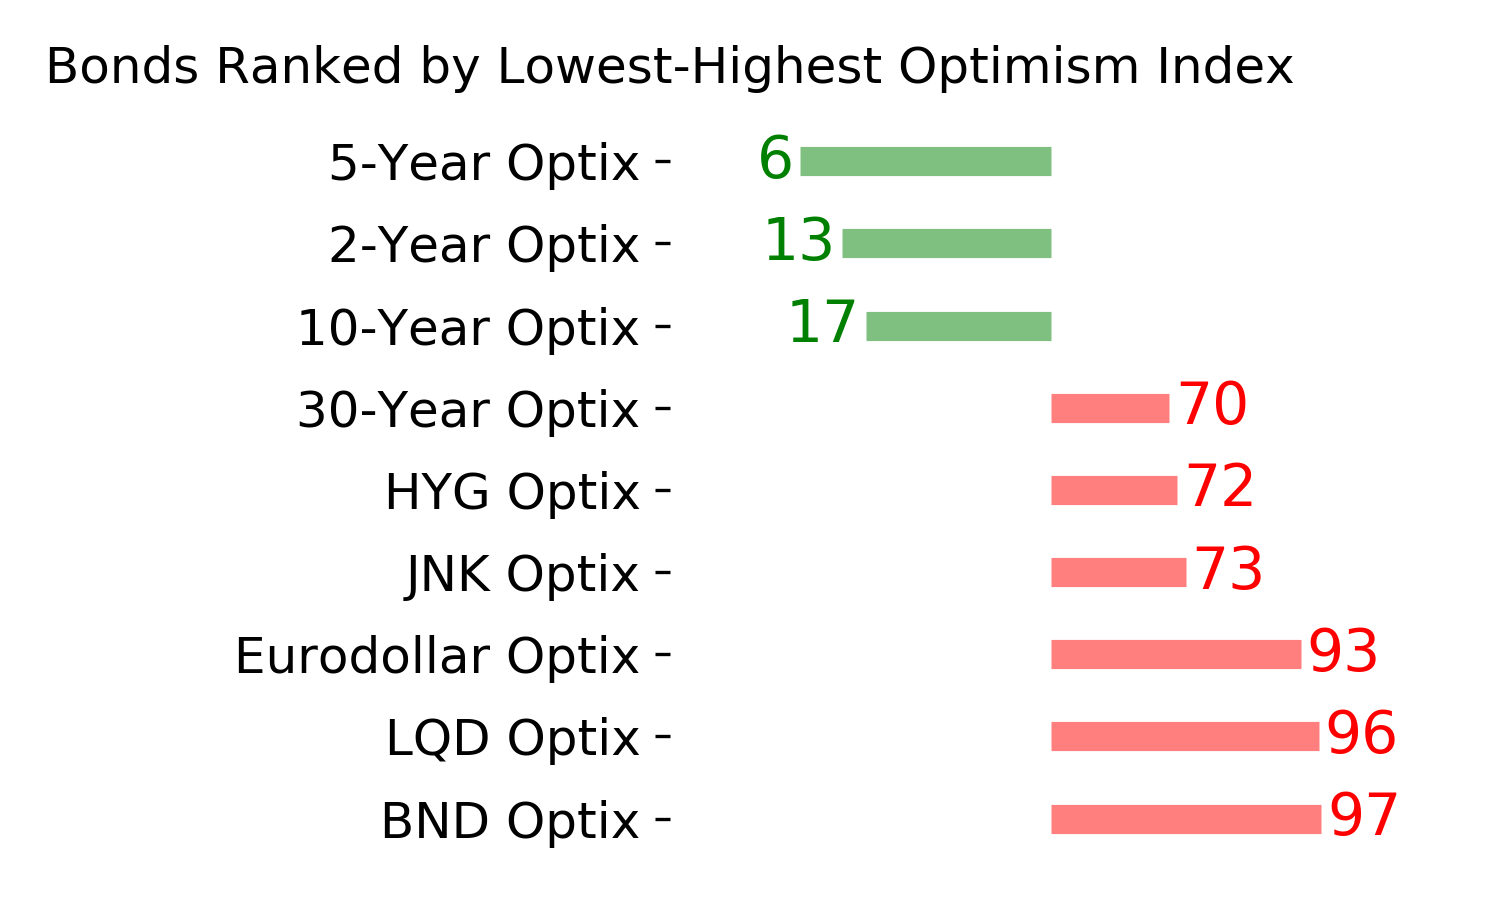
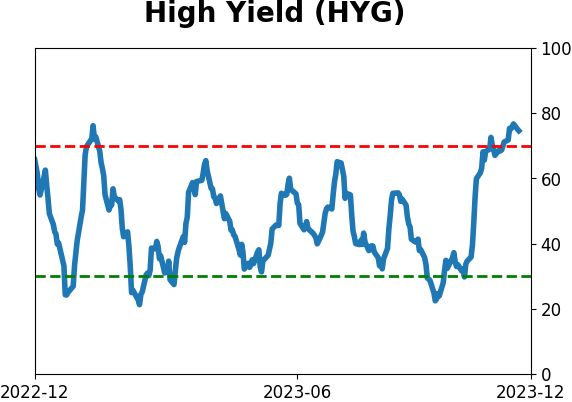
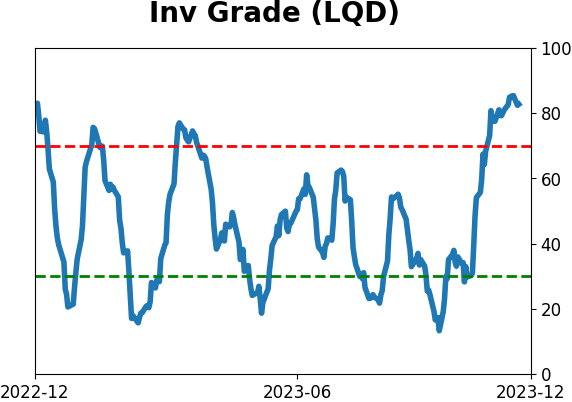
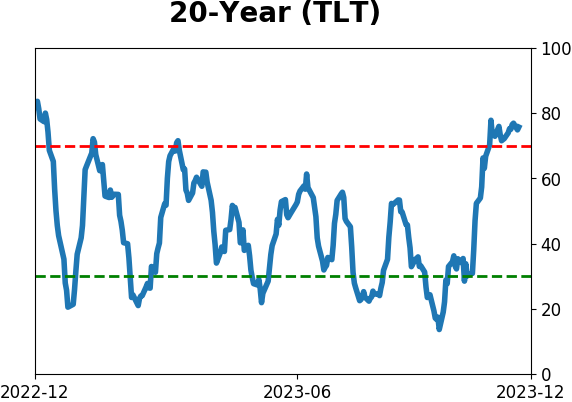
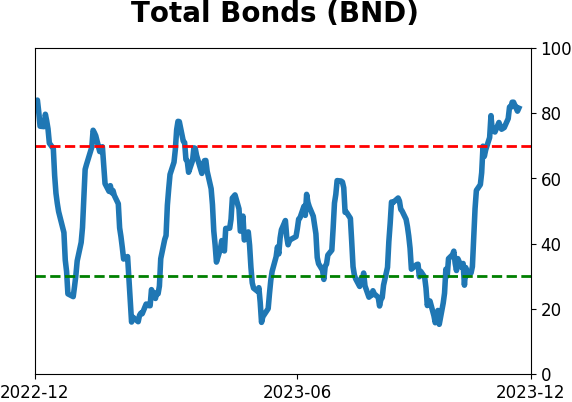
Bond ETF's - 10-Day Moving Average
|
|
|
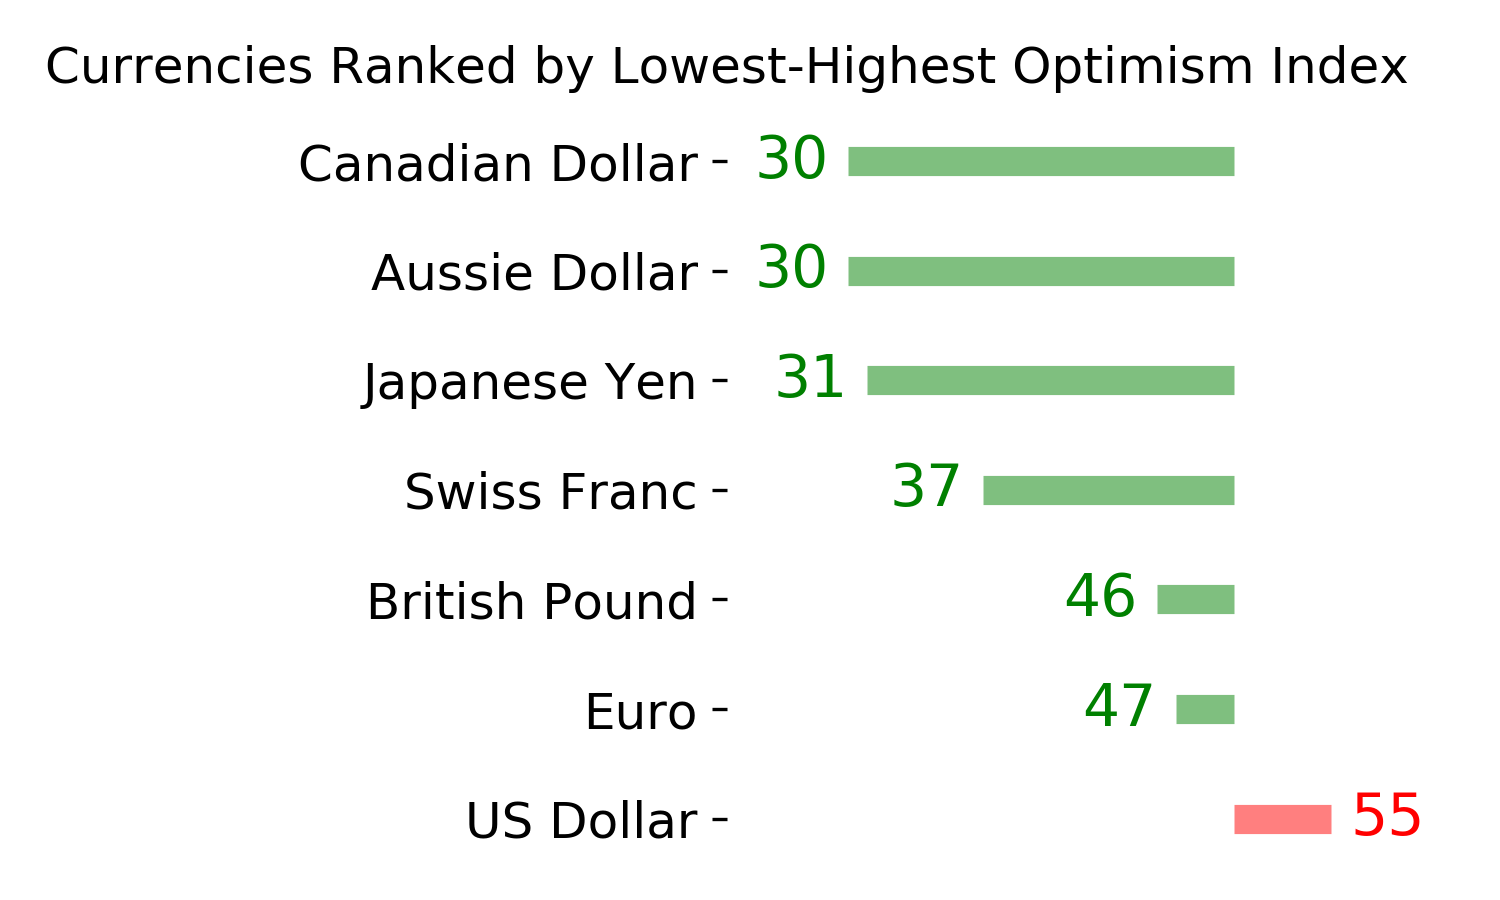
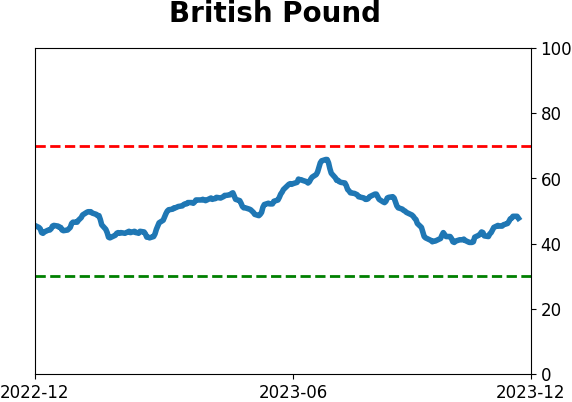
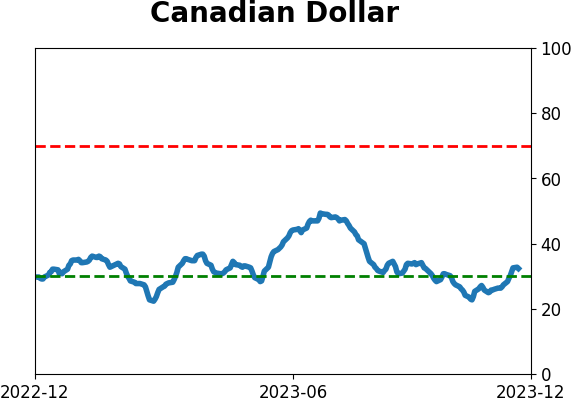
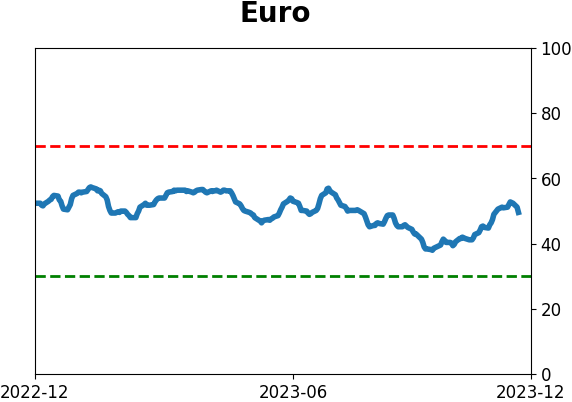
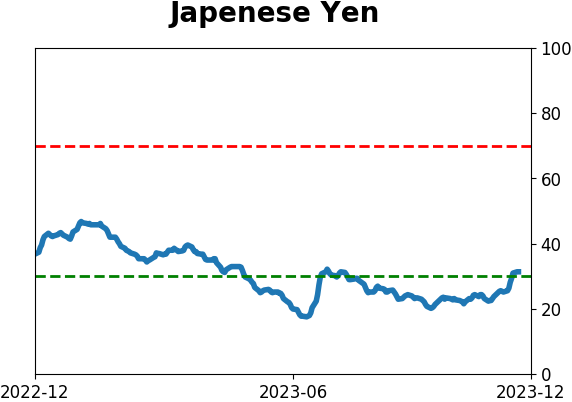
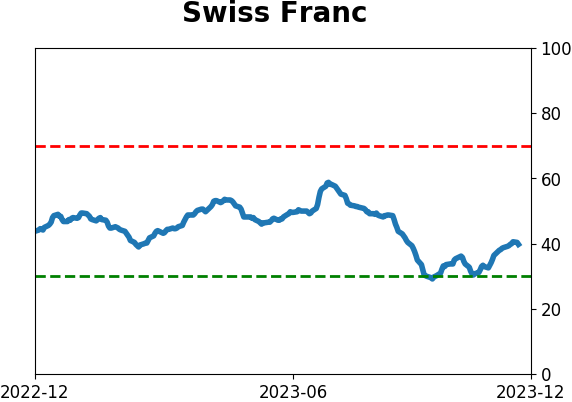
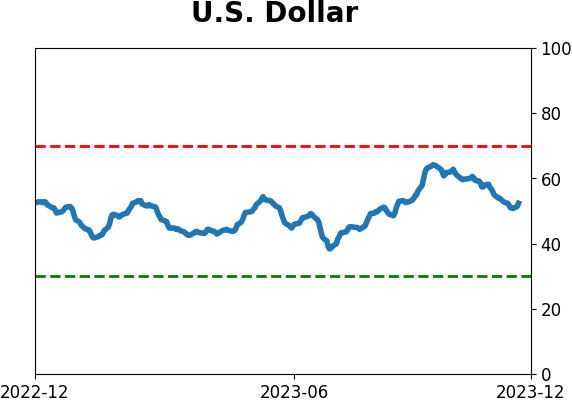
Currency ETF's - 5-Day Moving Average
|
|
|
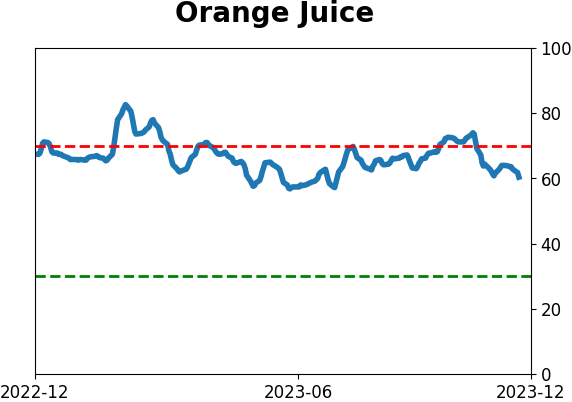
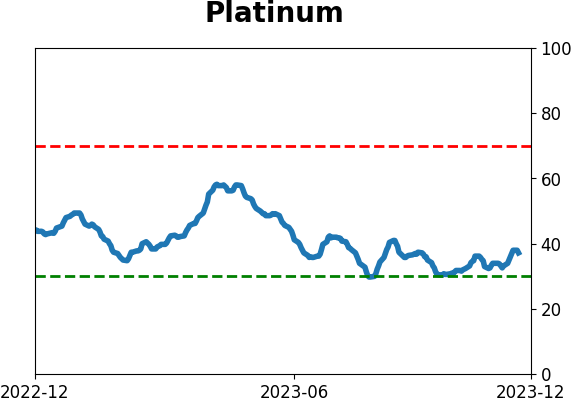
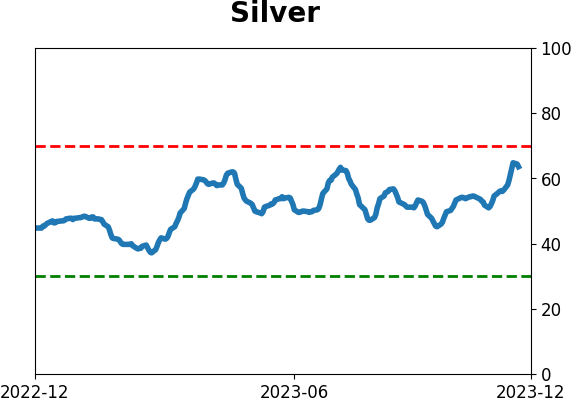
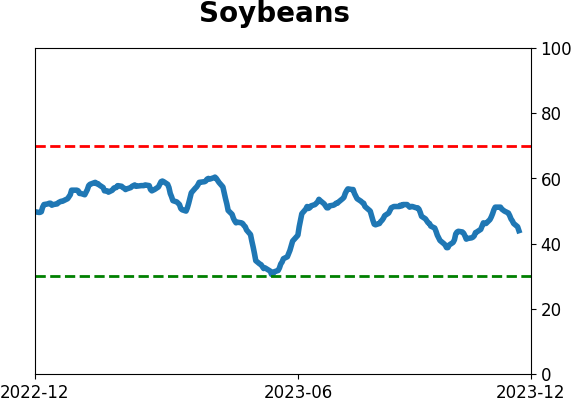
Commodity ETF's - 5-Day Moving Average
|
|