Headlines
|
|
Dumb Money recovery hasn't dented stocks' return:
Over the past year, high optimism among Dumb Money indicators has been a killer for stocks. The S&P 500 showed weak returns immediately following a recovery in sentiment. That didn't happen in the week following the latest recovery, which is a good sign for returns in the months ahead.
|
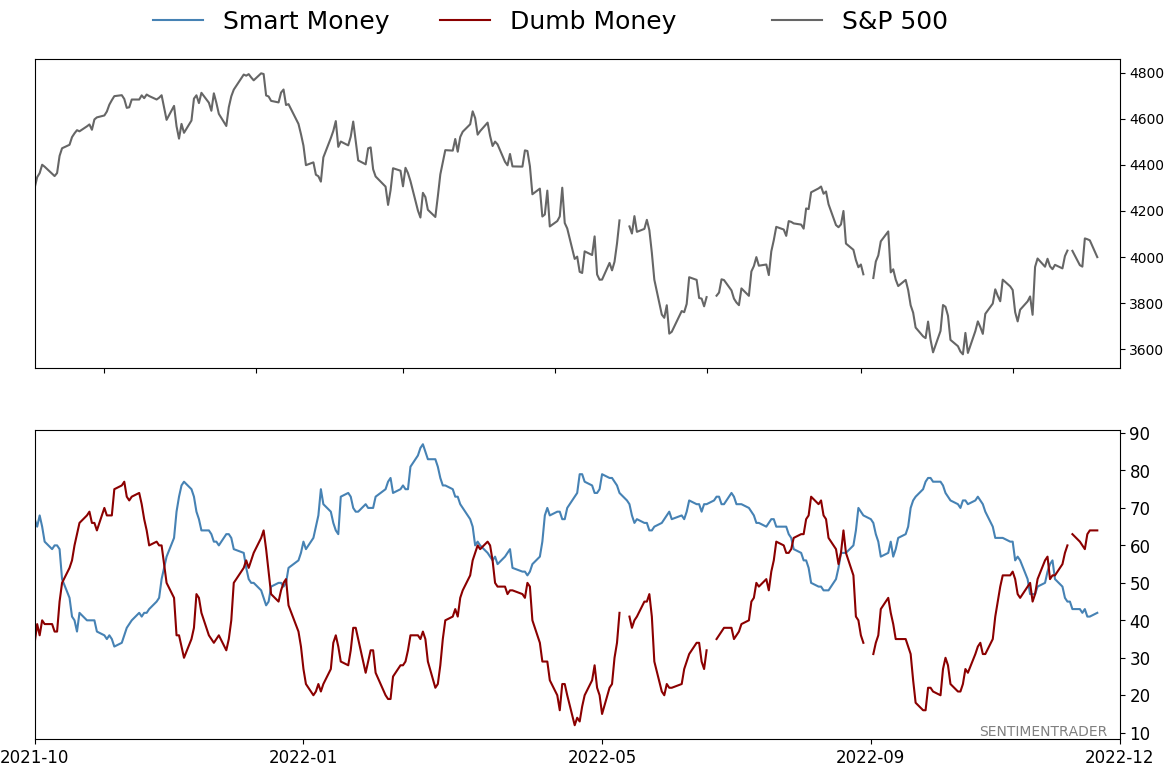
Smart / Dumb Money Confidence
|
Smart Money Confidence: 42%
Dumb Money Confidence: 64%
|
|
Risk Levels
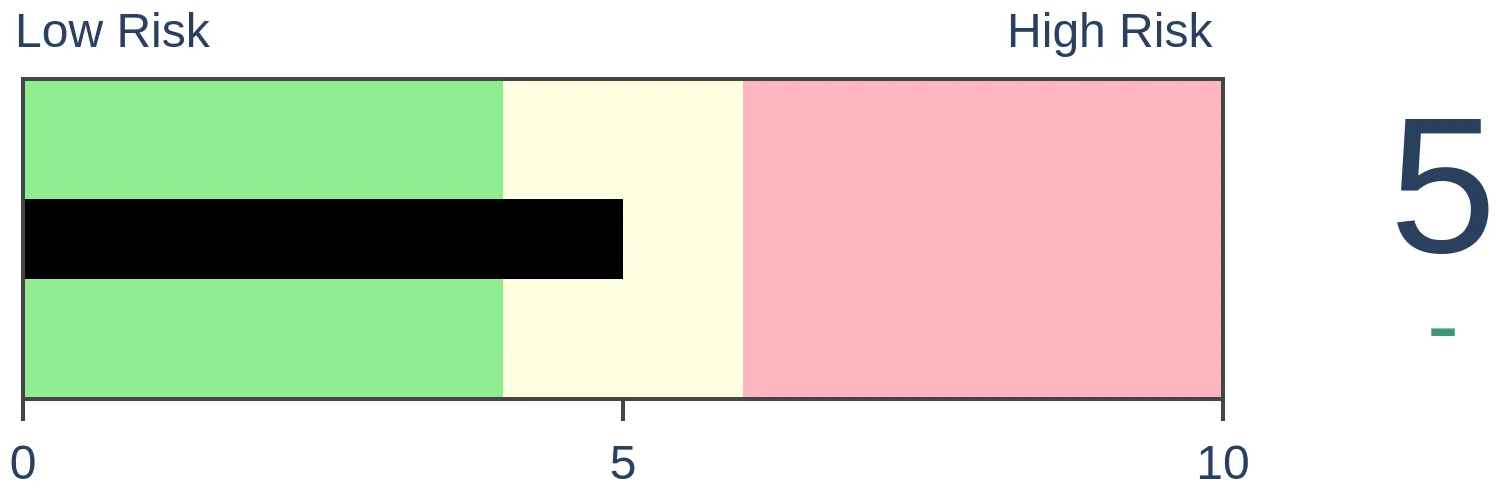
Stocks Short-Term
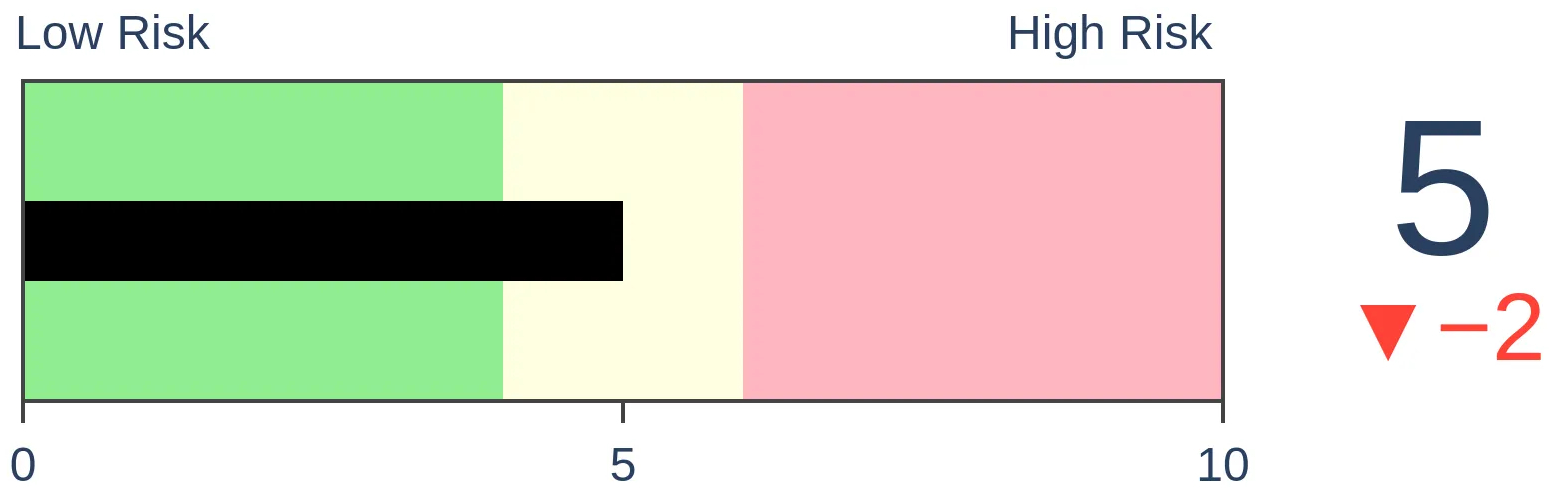
|
Stocks Medium-Term
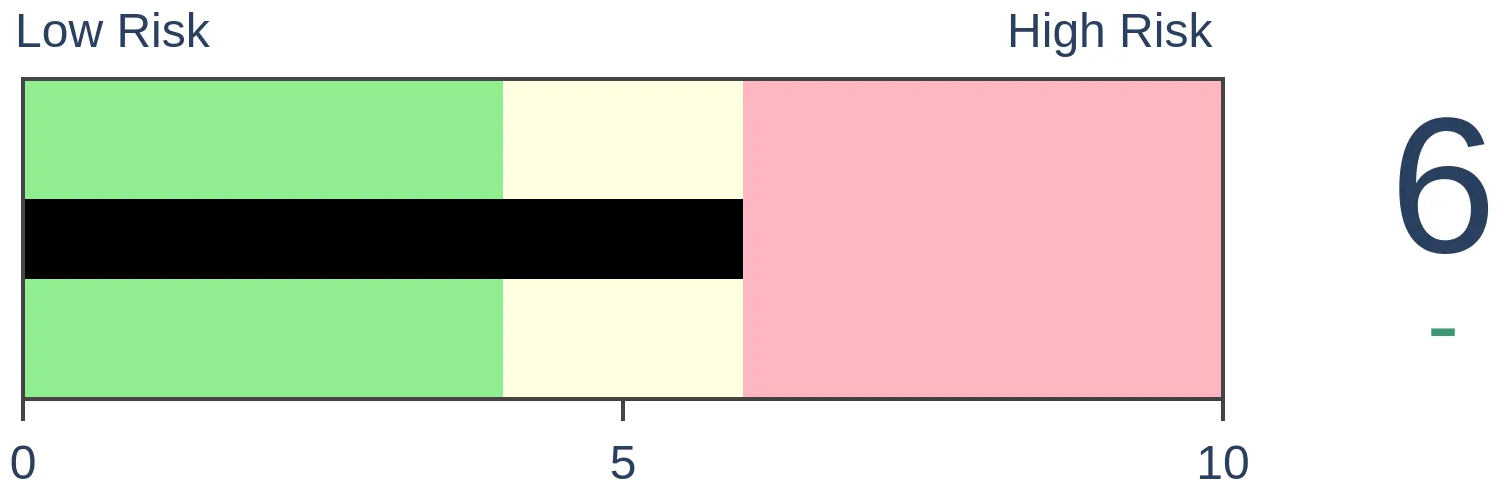
|
|
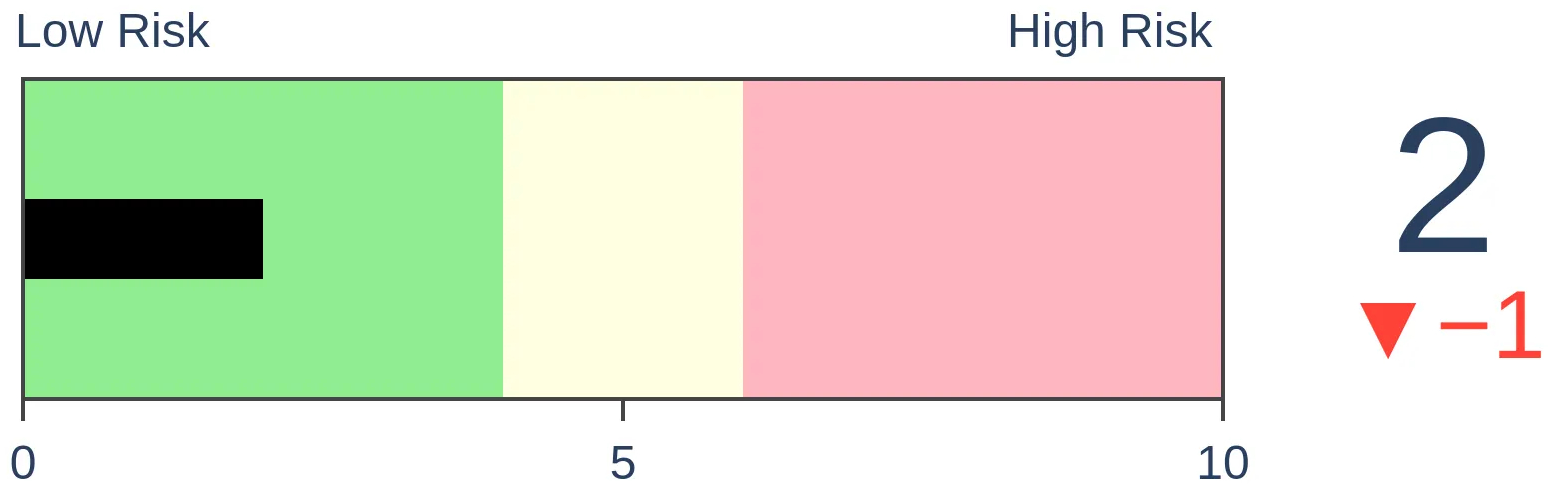
Bonds
|
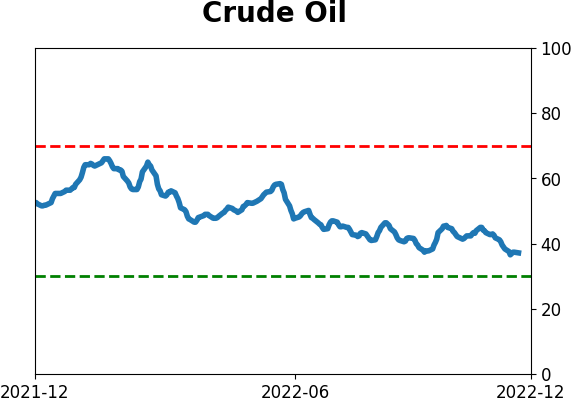
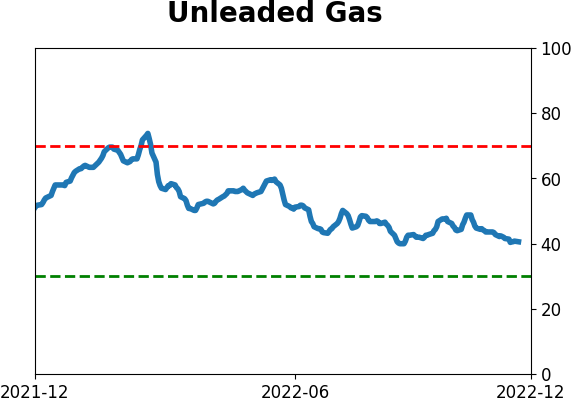
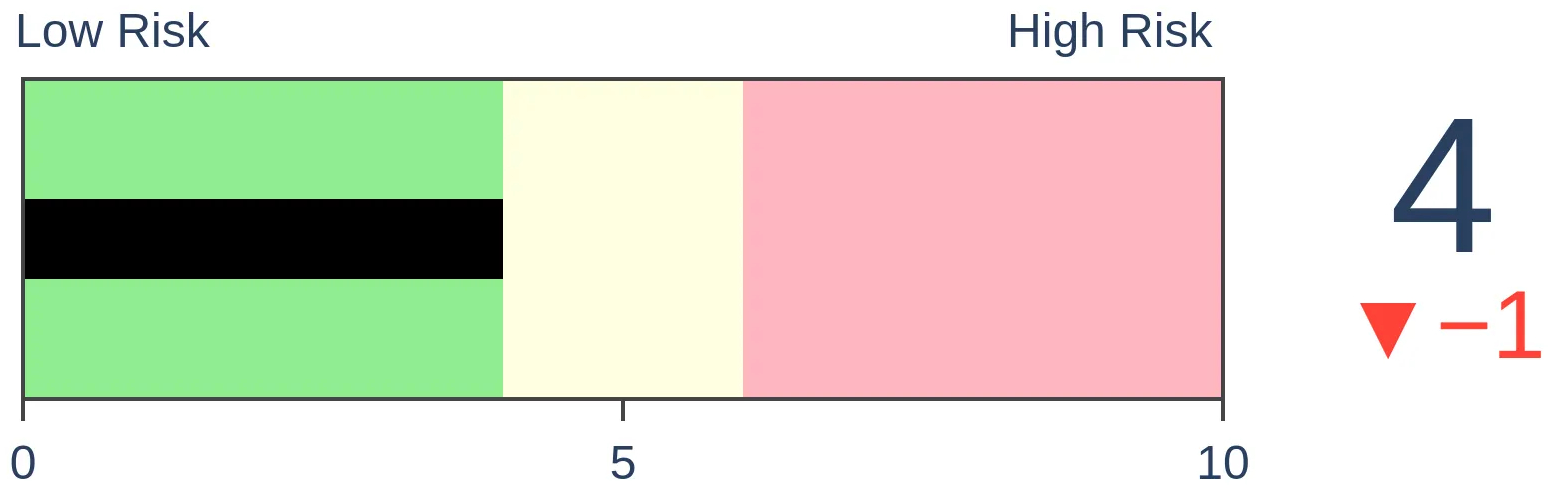
Crude Oil
|
|
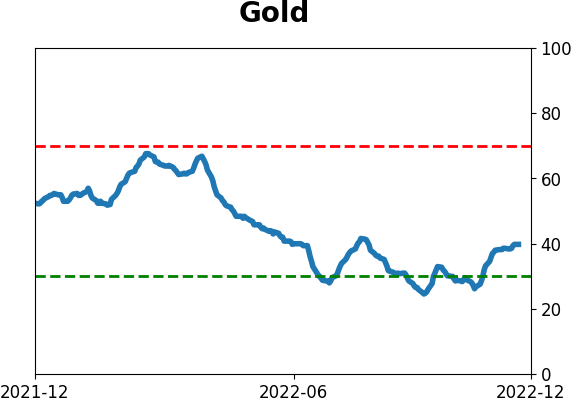
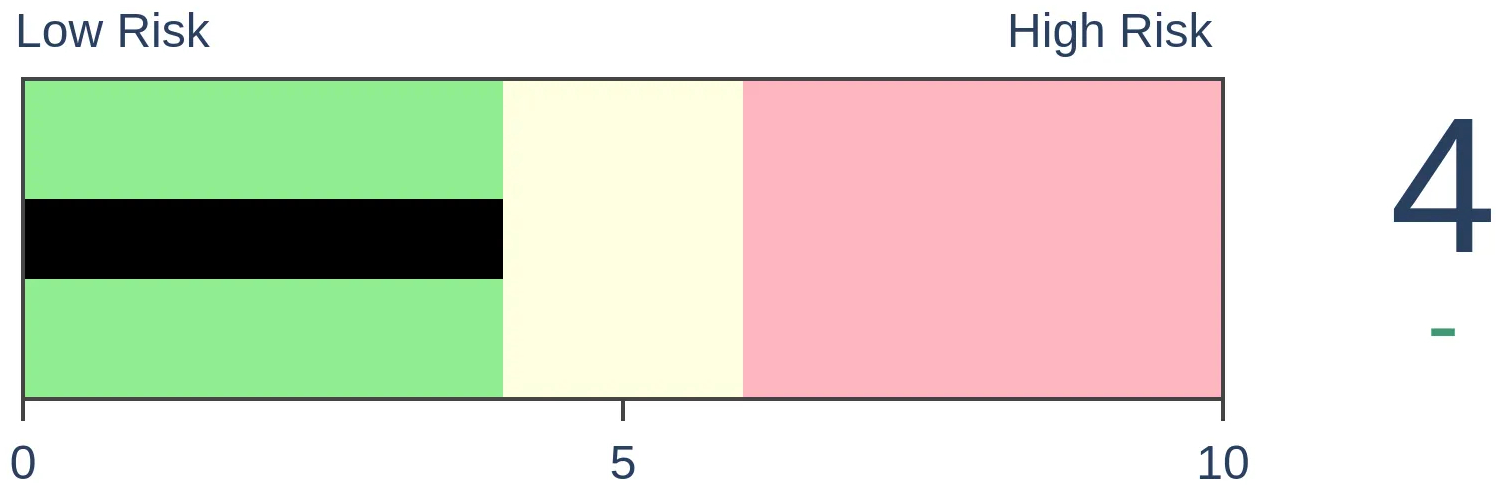
Gold
|
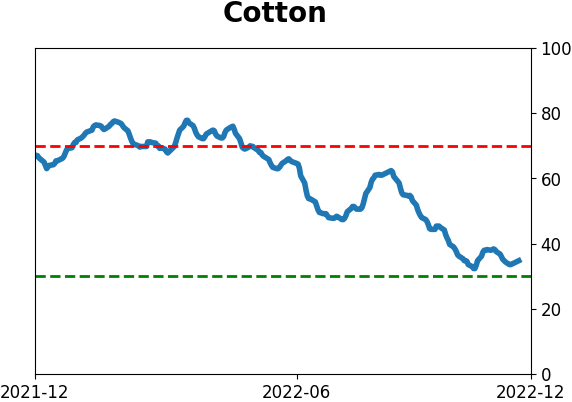
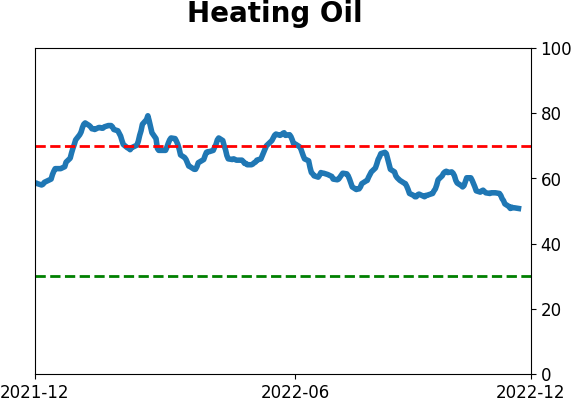
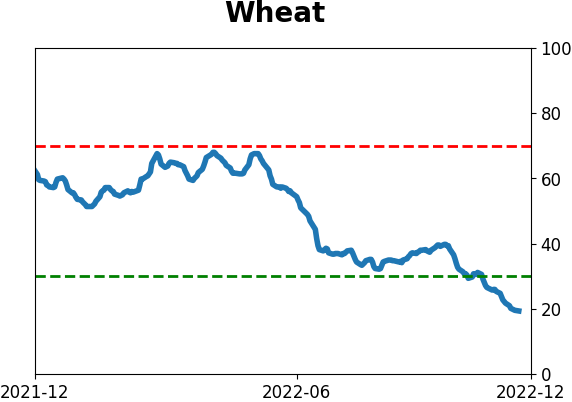
Agriculture
|
|
Research
By Jason Goepfert
BOTTOM LINE
Over the past year, high optimism among Dumb Money indicators has been a killer for stocks. The S&P 500 showed weak returns immediately following a recovery in sentiment. That didn't happen in the week following the latest recovery, which is a good sign for returns in the months ahead.
FORECAST / TIMEFRAME
None
|
Key points:
- Dumb Money Confidence recovered to a high level over a week ago
- Stocks continued to rally despite it, unlike other instances over the past year
- Historically, buying pressure in the face of recovering optimism has preceded further gains
Despite high optimism, buyers continue to show up
In mid-October, we saw that sentiment had reached one of its worst levels on record. Since then, sentiment has perked up thanks to a significant and broad-based advance, and Dumb Money Confidence in a further rally is high.
During protracted bear markets, investors typically don't get a chance to become too optimistic before reality slaps them in the face. That's already happened a few times during the current bear market. Pretty much as soon as Dumb Money Confidence reached 60%, the gains were about exhausted.
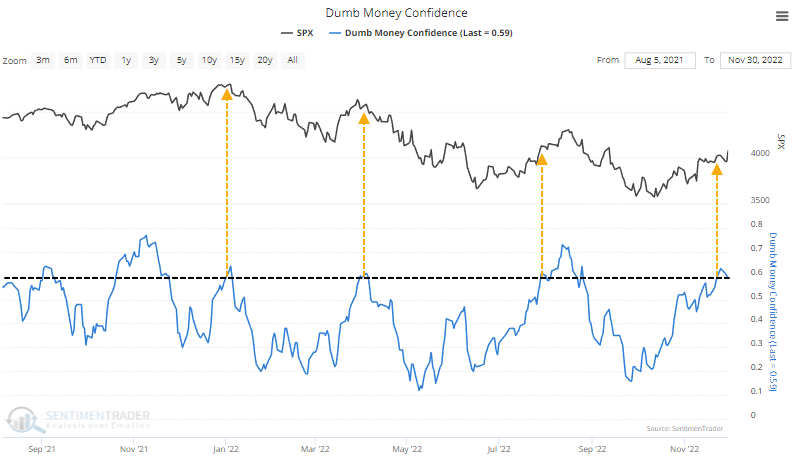
Not this time.
Dumb Money crossed 60% on November 23, and the S&P 500 rallied another 1.2% over the following week. In the week following similar behavior in April, the S&P lost 0.7%, and in August, it gained a modest 0.4%.
When buyers continued to show up despite high Confidence, it was good for stocks in the months ahead. All the signals showed a gain over the next 1-3 months, though in 2001, it petered out soon after.
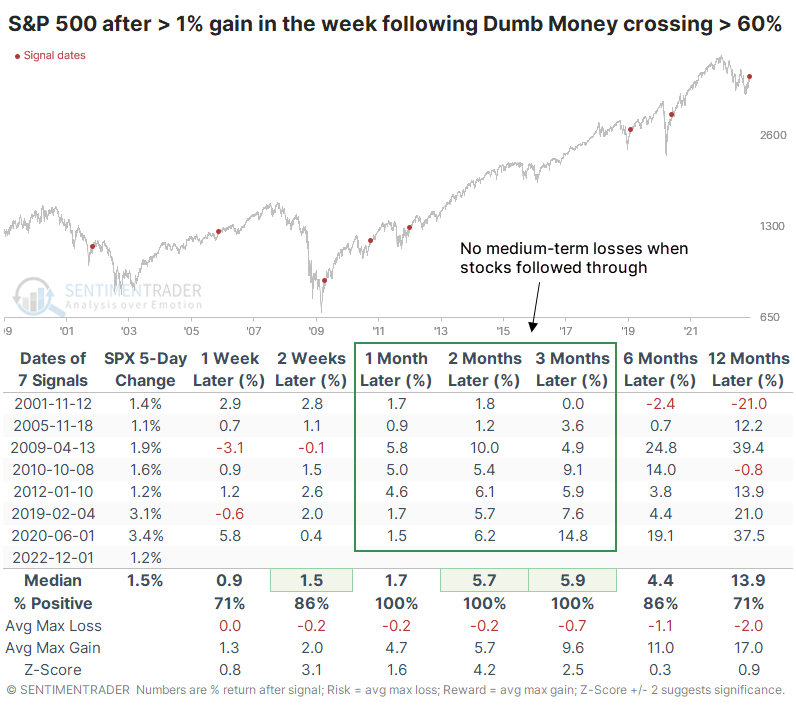
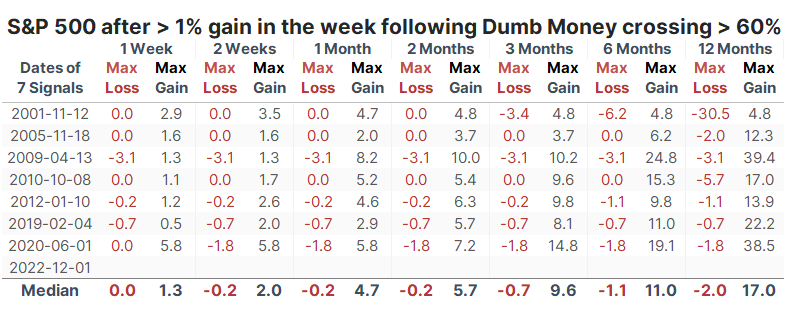
There were few drawdowns of note up to three months later, while gains tended to be robust. Over the next few months, the S&P never lost more than -3.4% while gaining at least +3.7% each time - and the average gain was much higher than that.
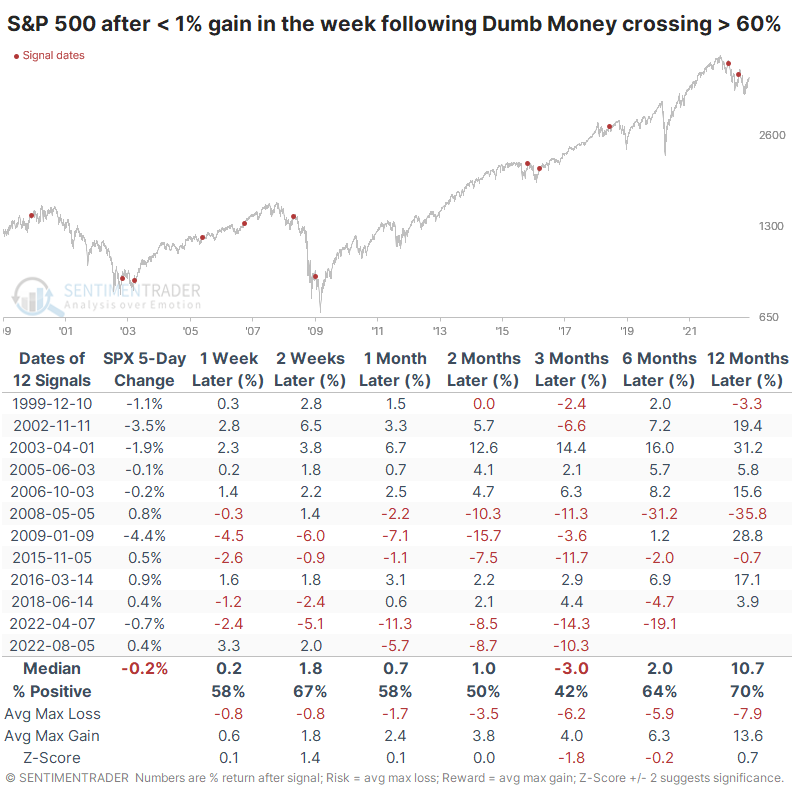
When buyers show less enthusiasm, stocks tend to suffer
Contrast this with times when buyers showed less enthusiasm. When the S&P gained less than 1% in the week following a Dumb Money cross above 60%, forward returns were suspect. Over the next three months, stocks tended to decline, including some major losses.
Granted, these instances of weak follow-through also happened at some significant lows, but generally, it was an indication of bear market behavior that tended to persist.
What the research tells us...
Over the past few weeks, we've noted repeatedly that participation in the latest rally has been robust and broad-based, more so than other rally attempts over the past year. That suggests that the current phase is different than the others that have burned bullish investors this year. The fact that buyers continued to push stocks higher in the wake of high optimism is another factor suggesting we've seen a change in behavior and one that tends to precede more of a recovery in the months ahead.
Indicators at Extremes
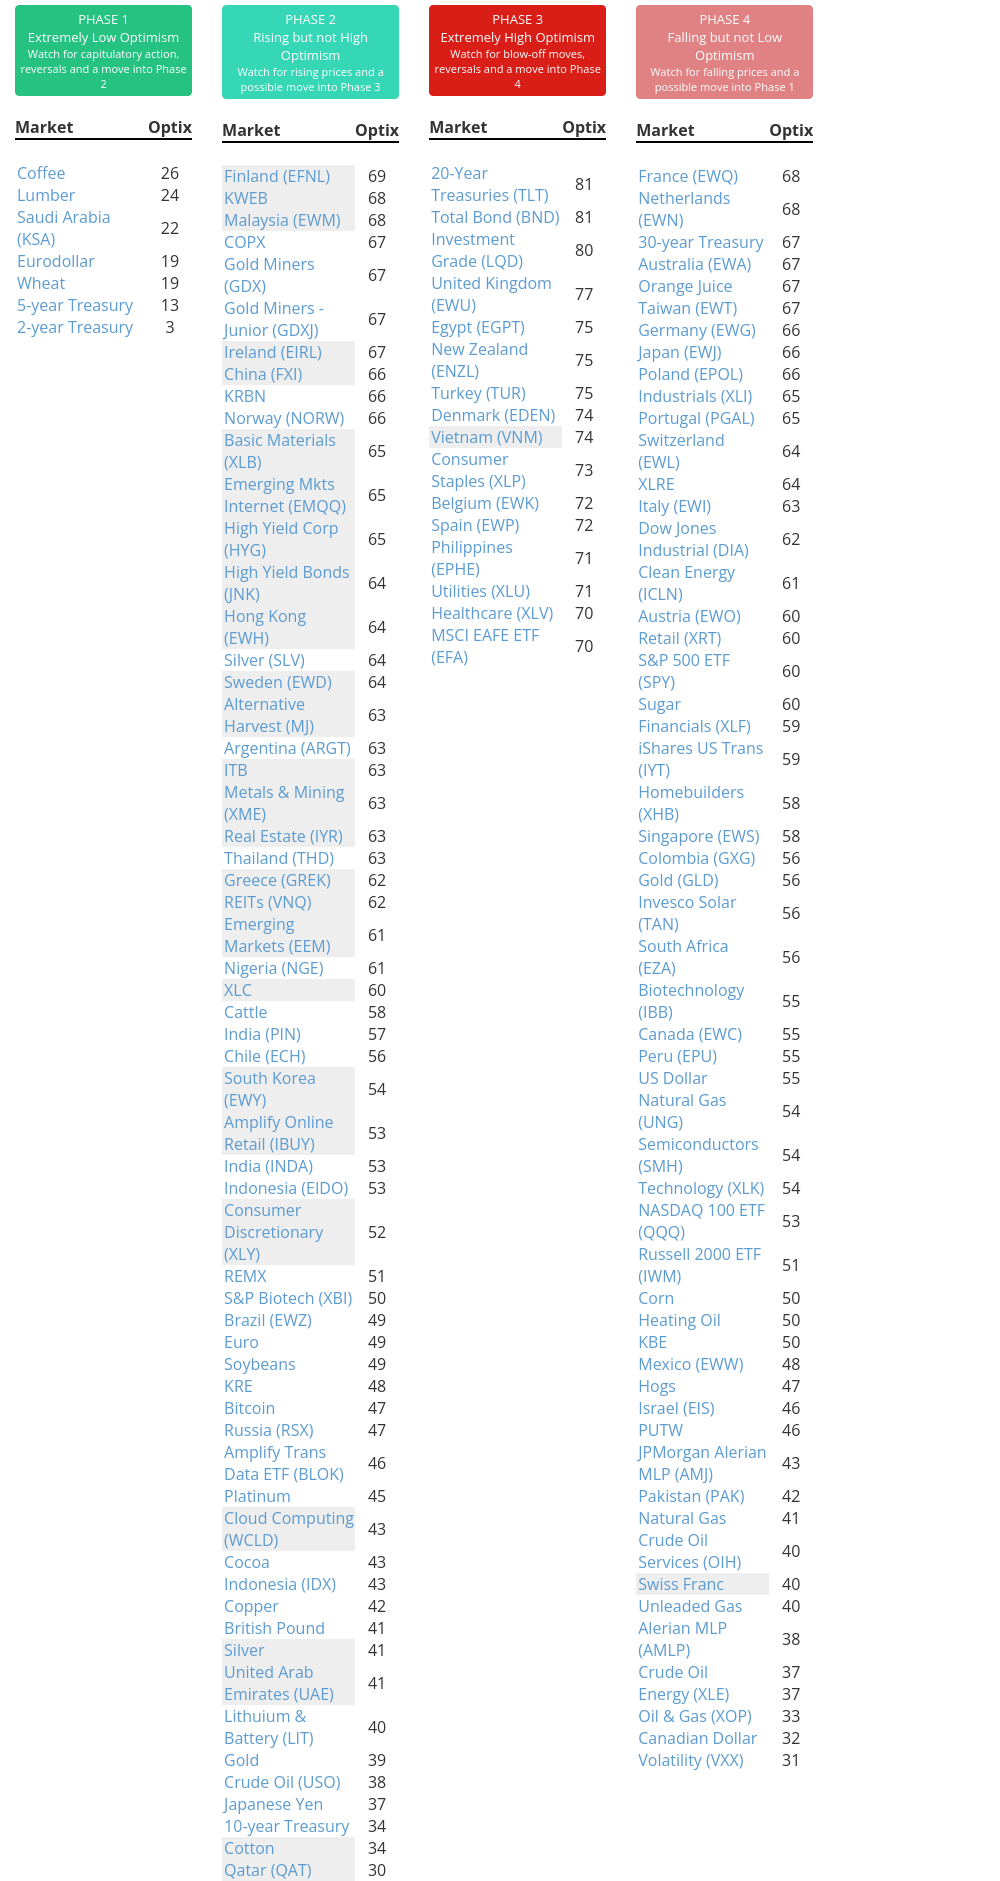
Phase Table
Ranks
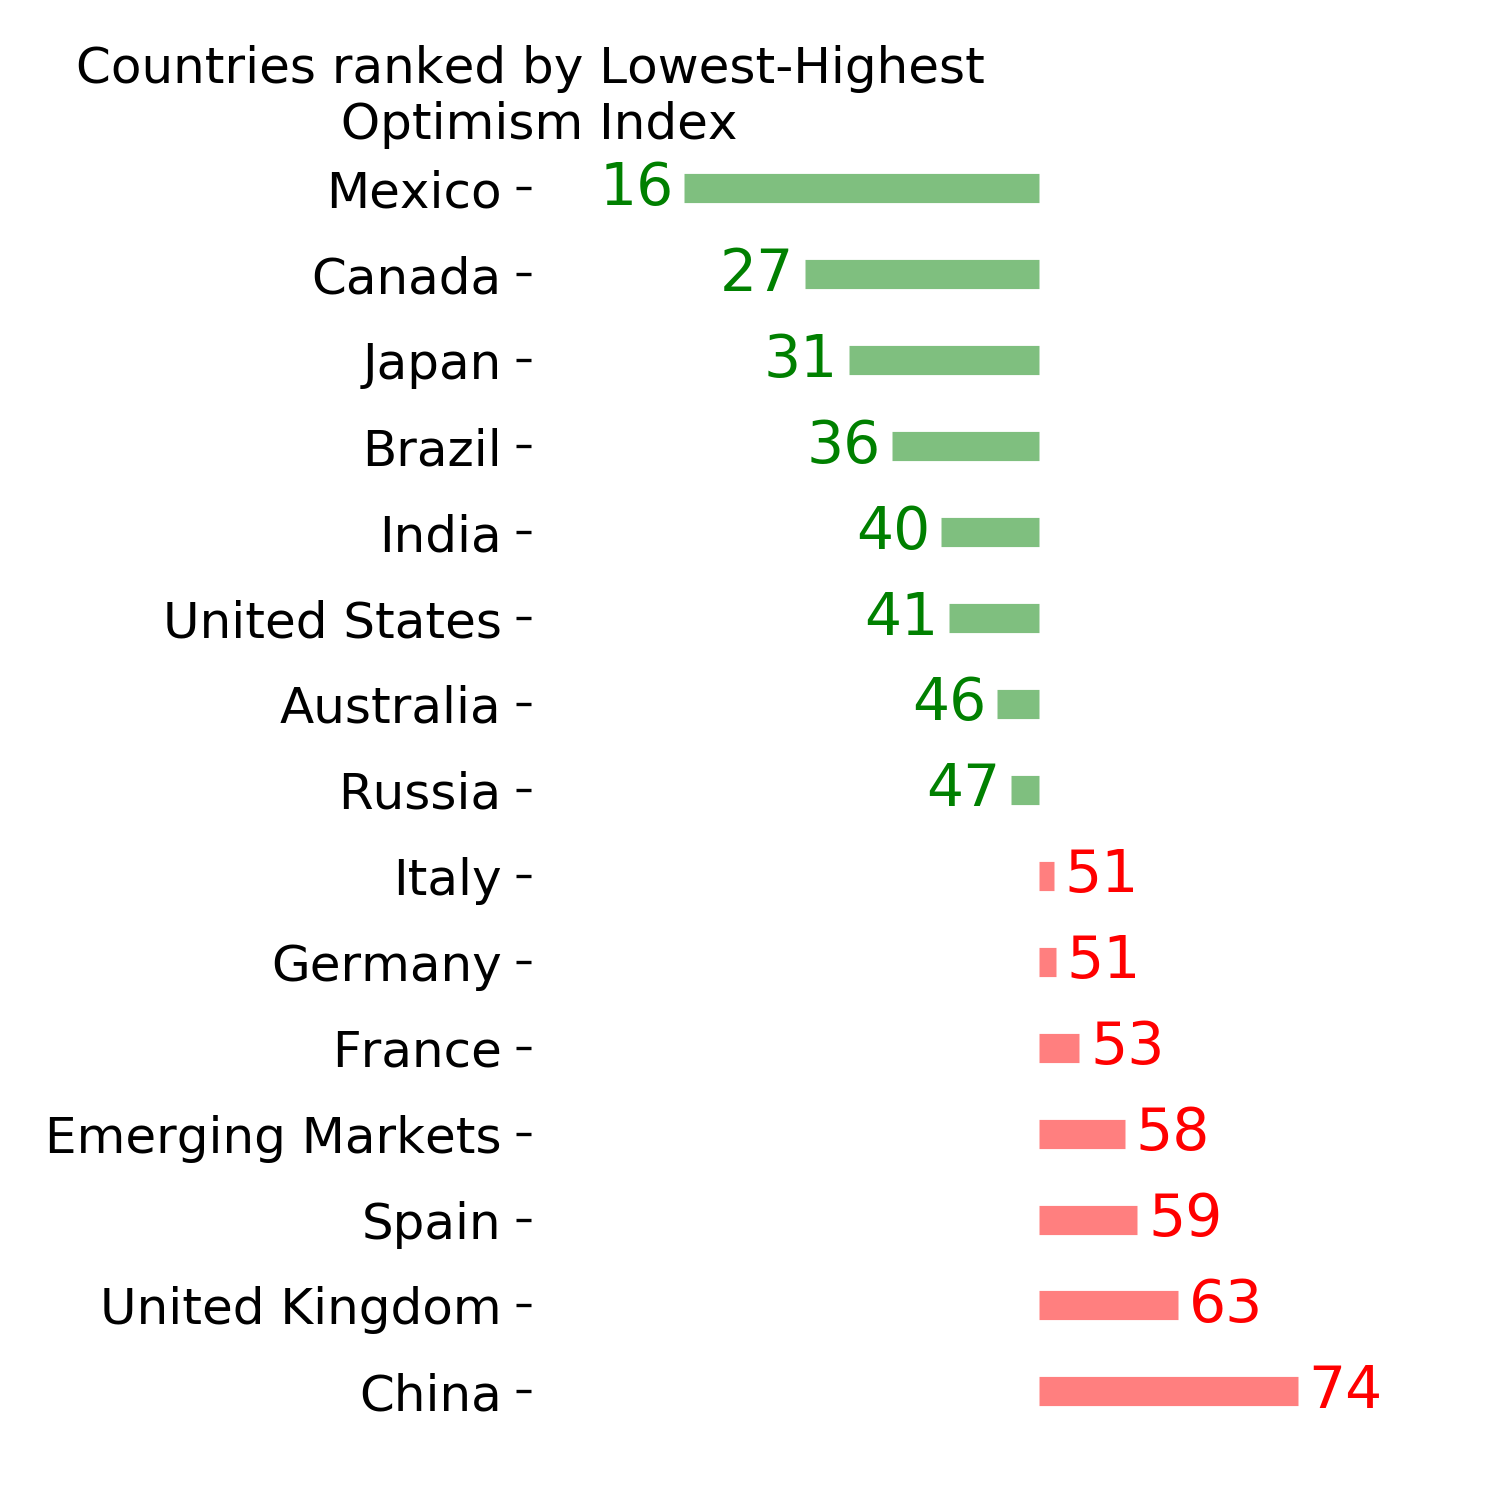
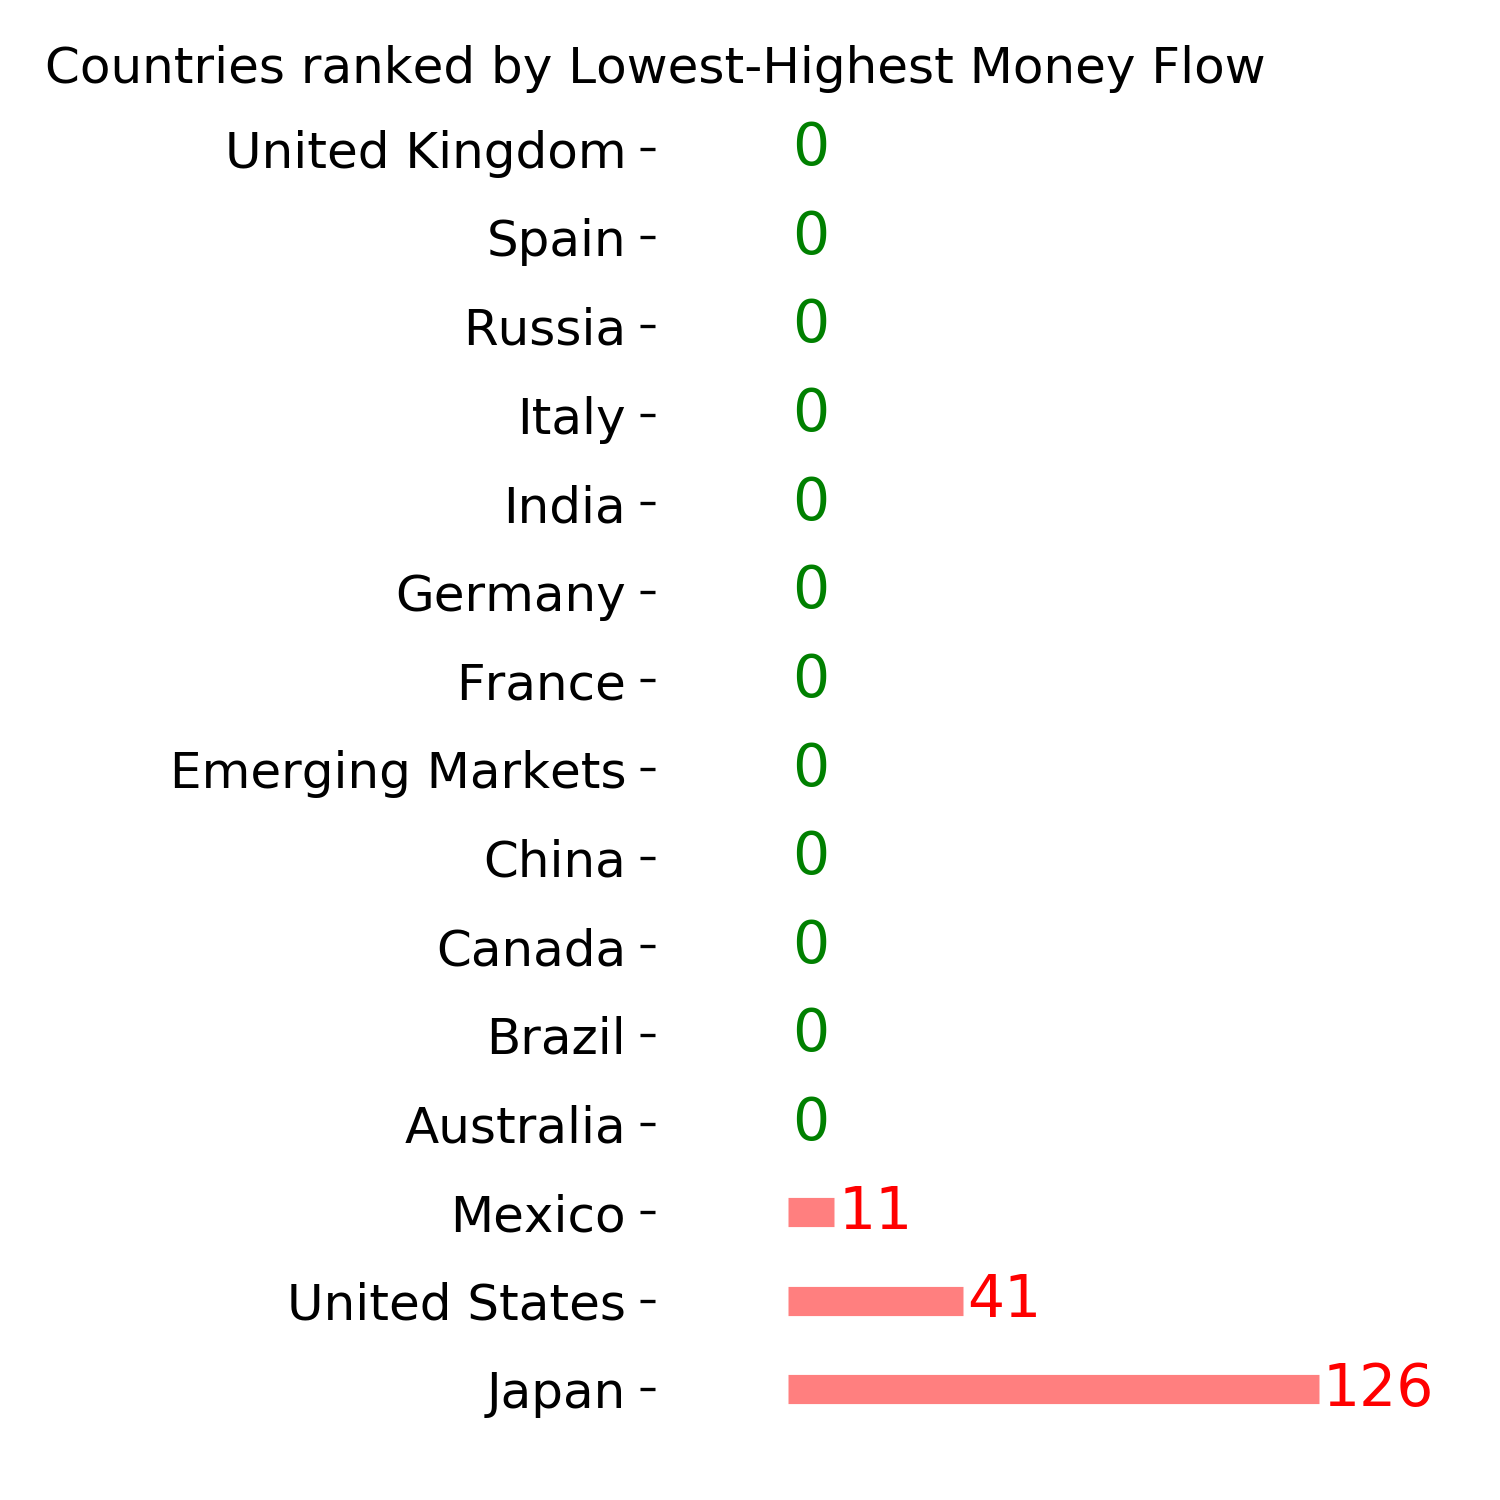
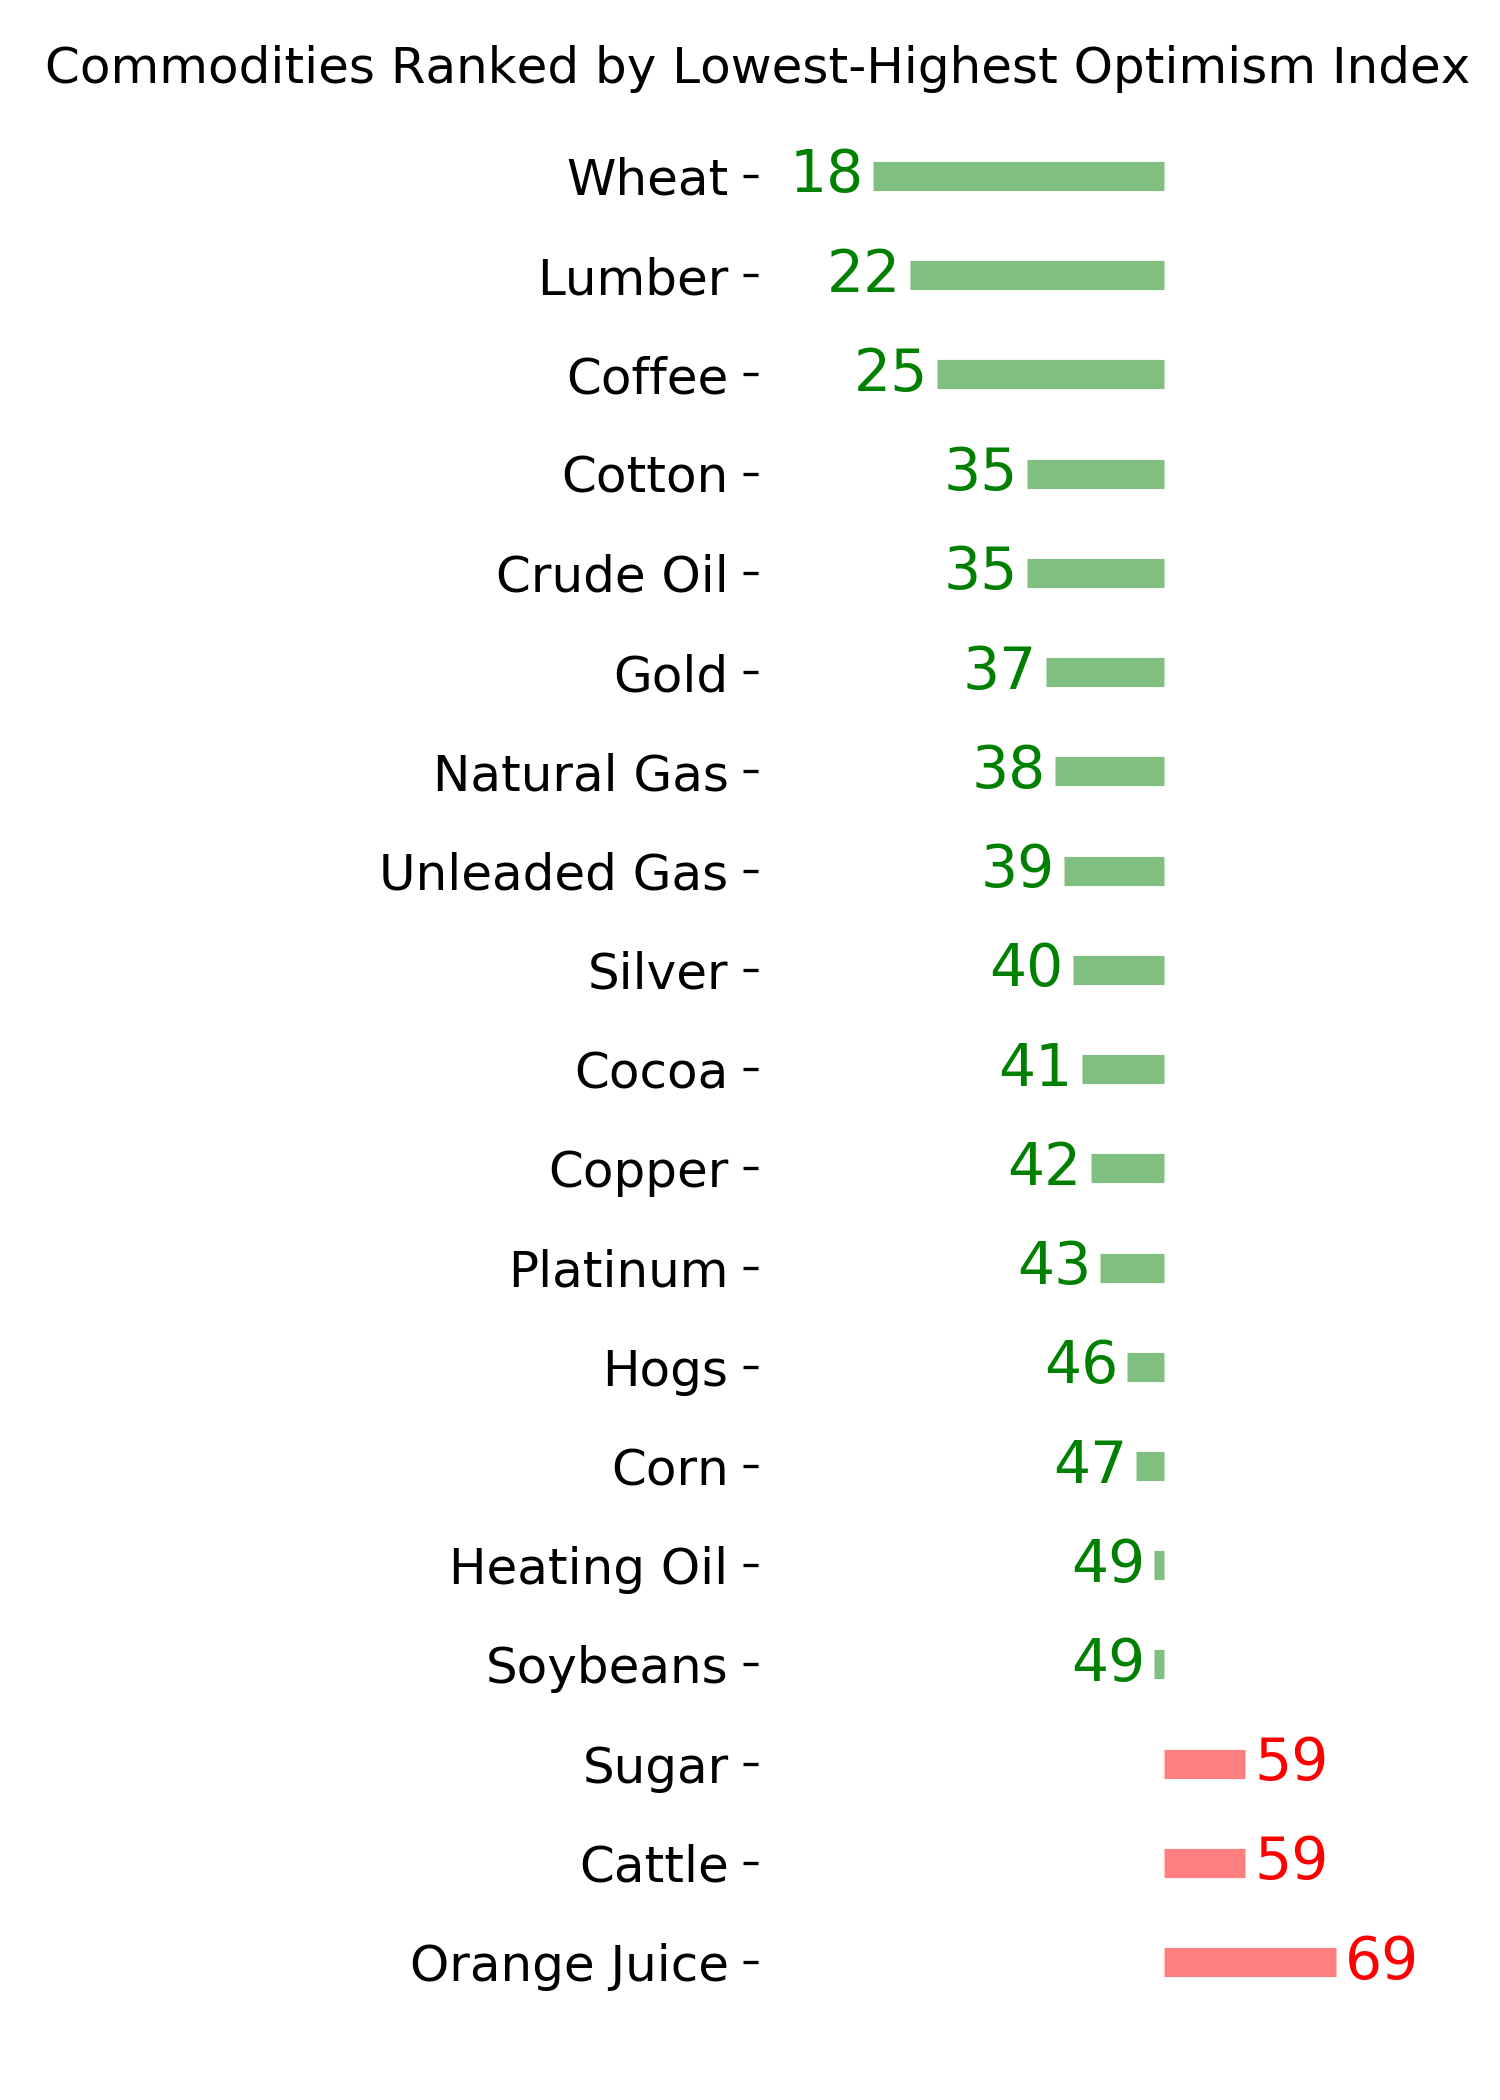
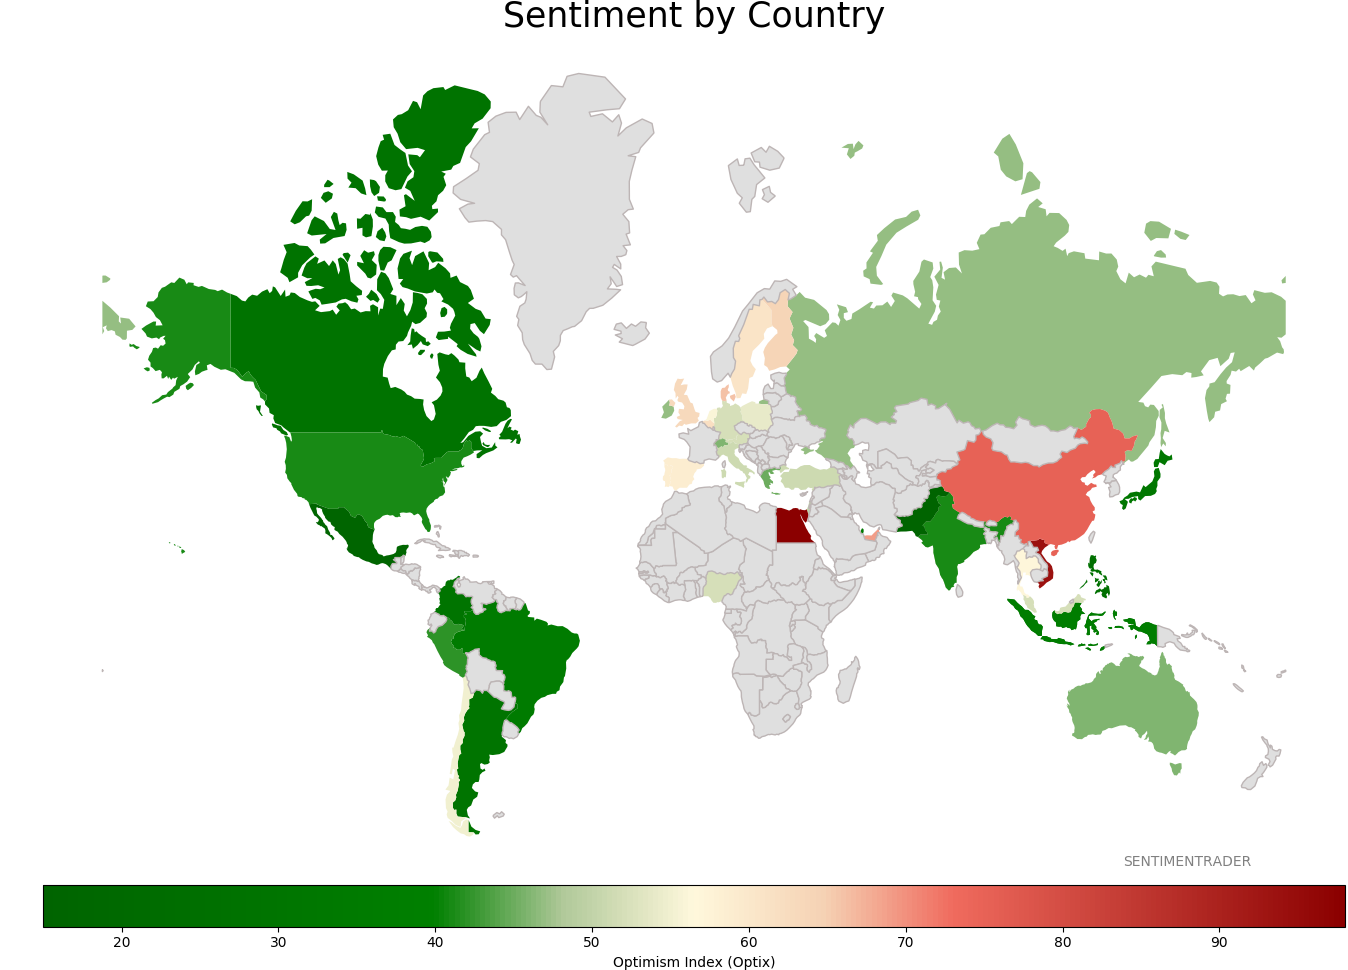
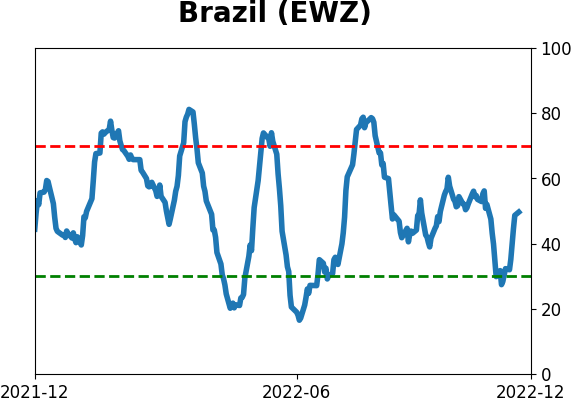
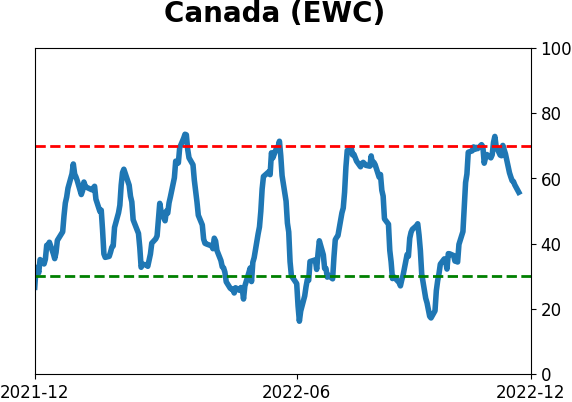
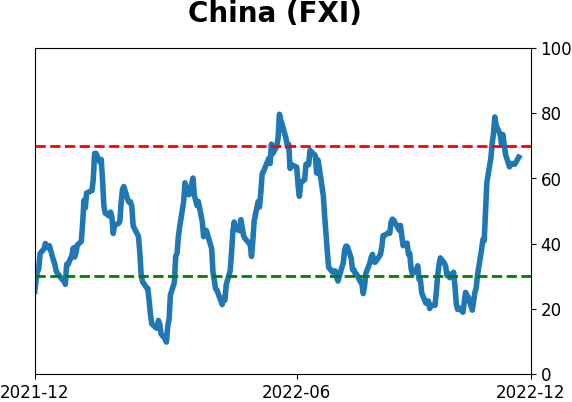
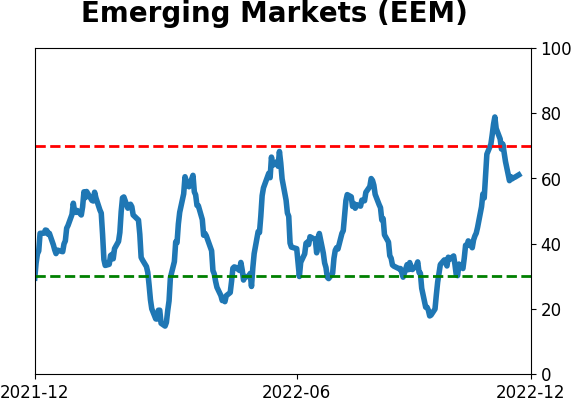
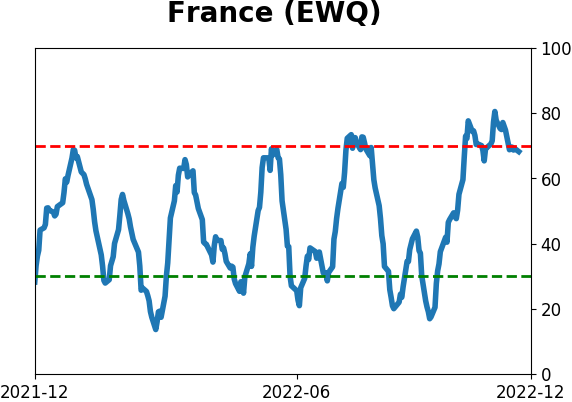
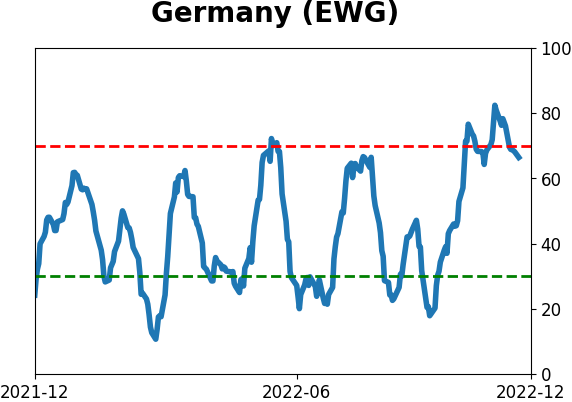
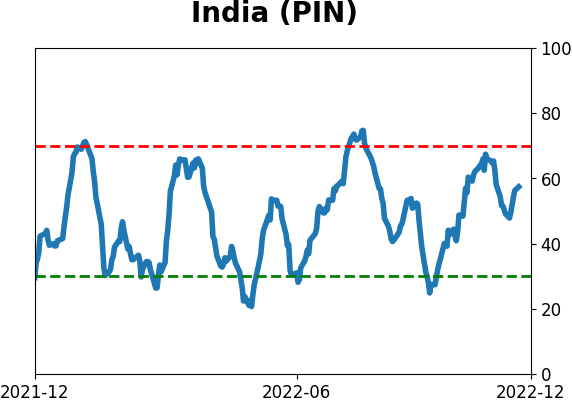
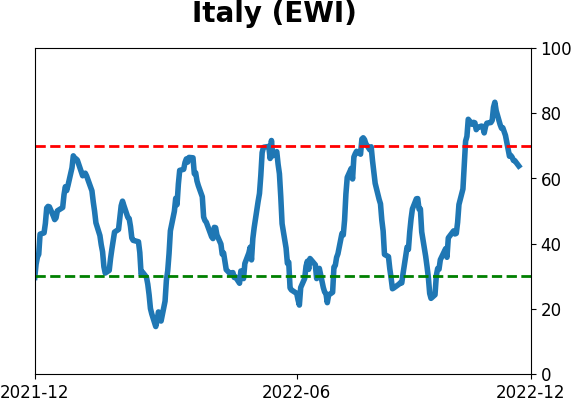
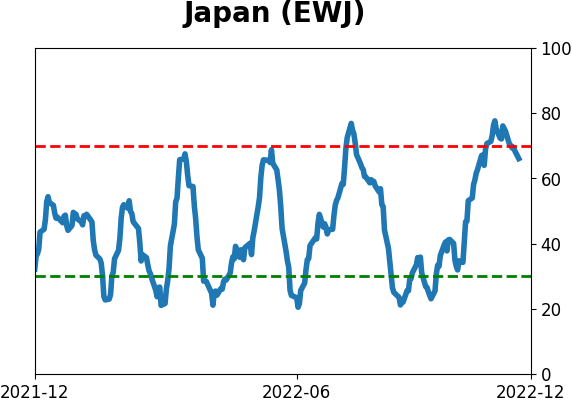
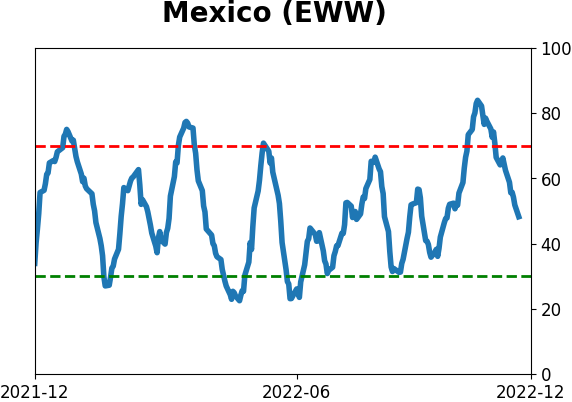
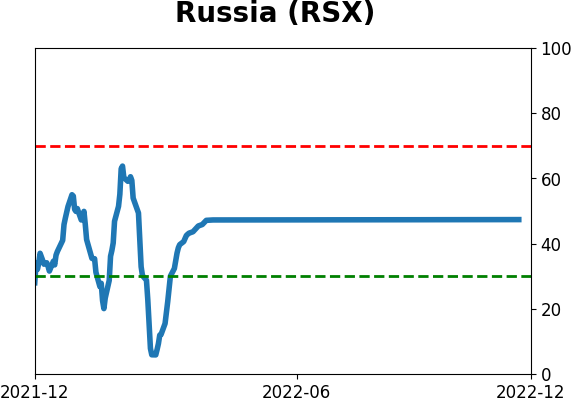
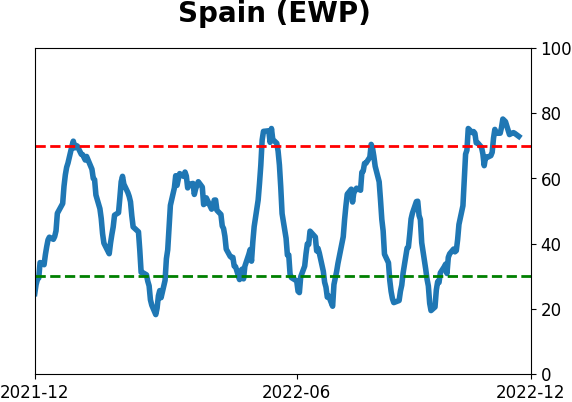
Sentiment Around The World
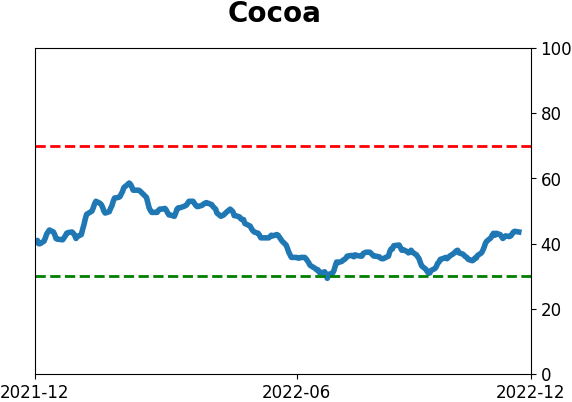
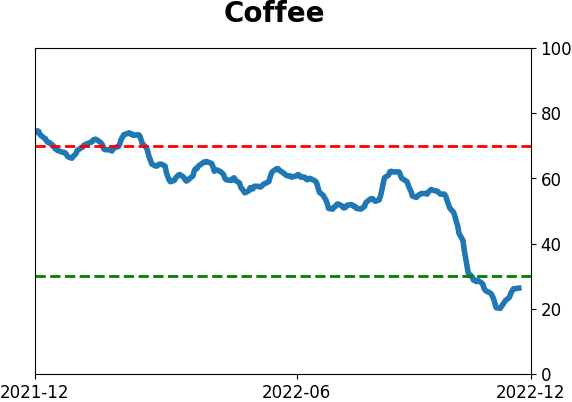
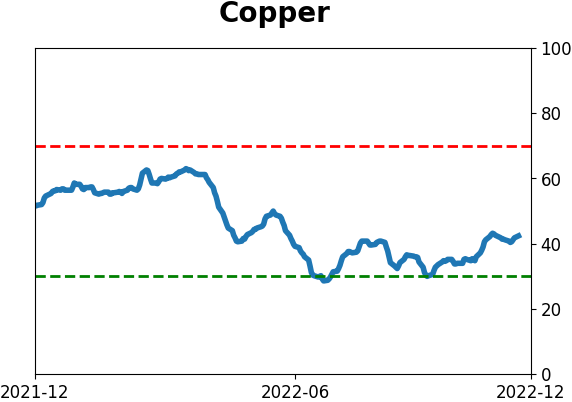
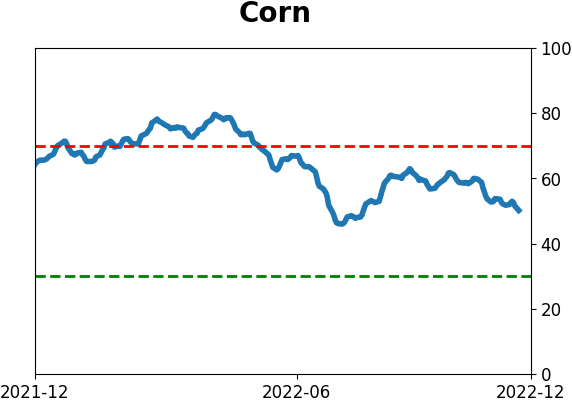
Optimism Index Thumbnails
|
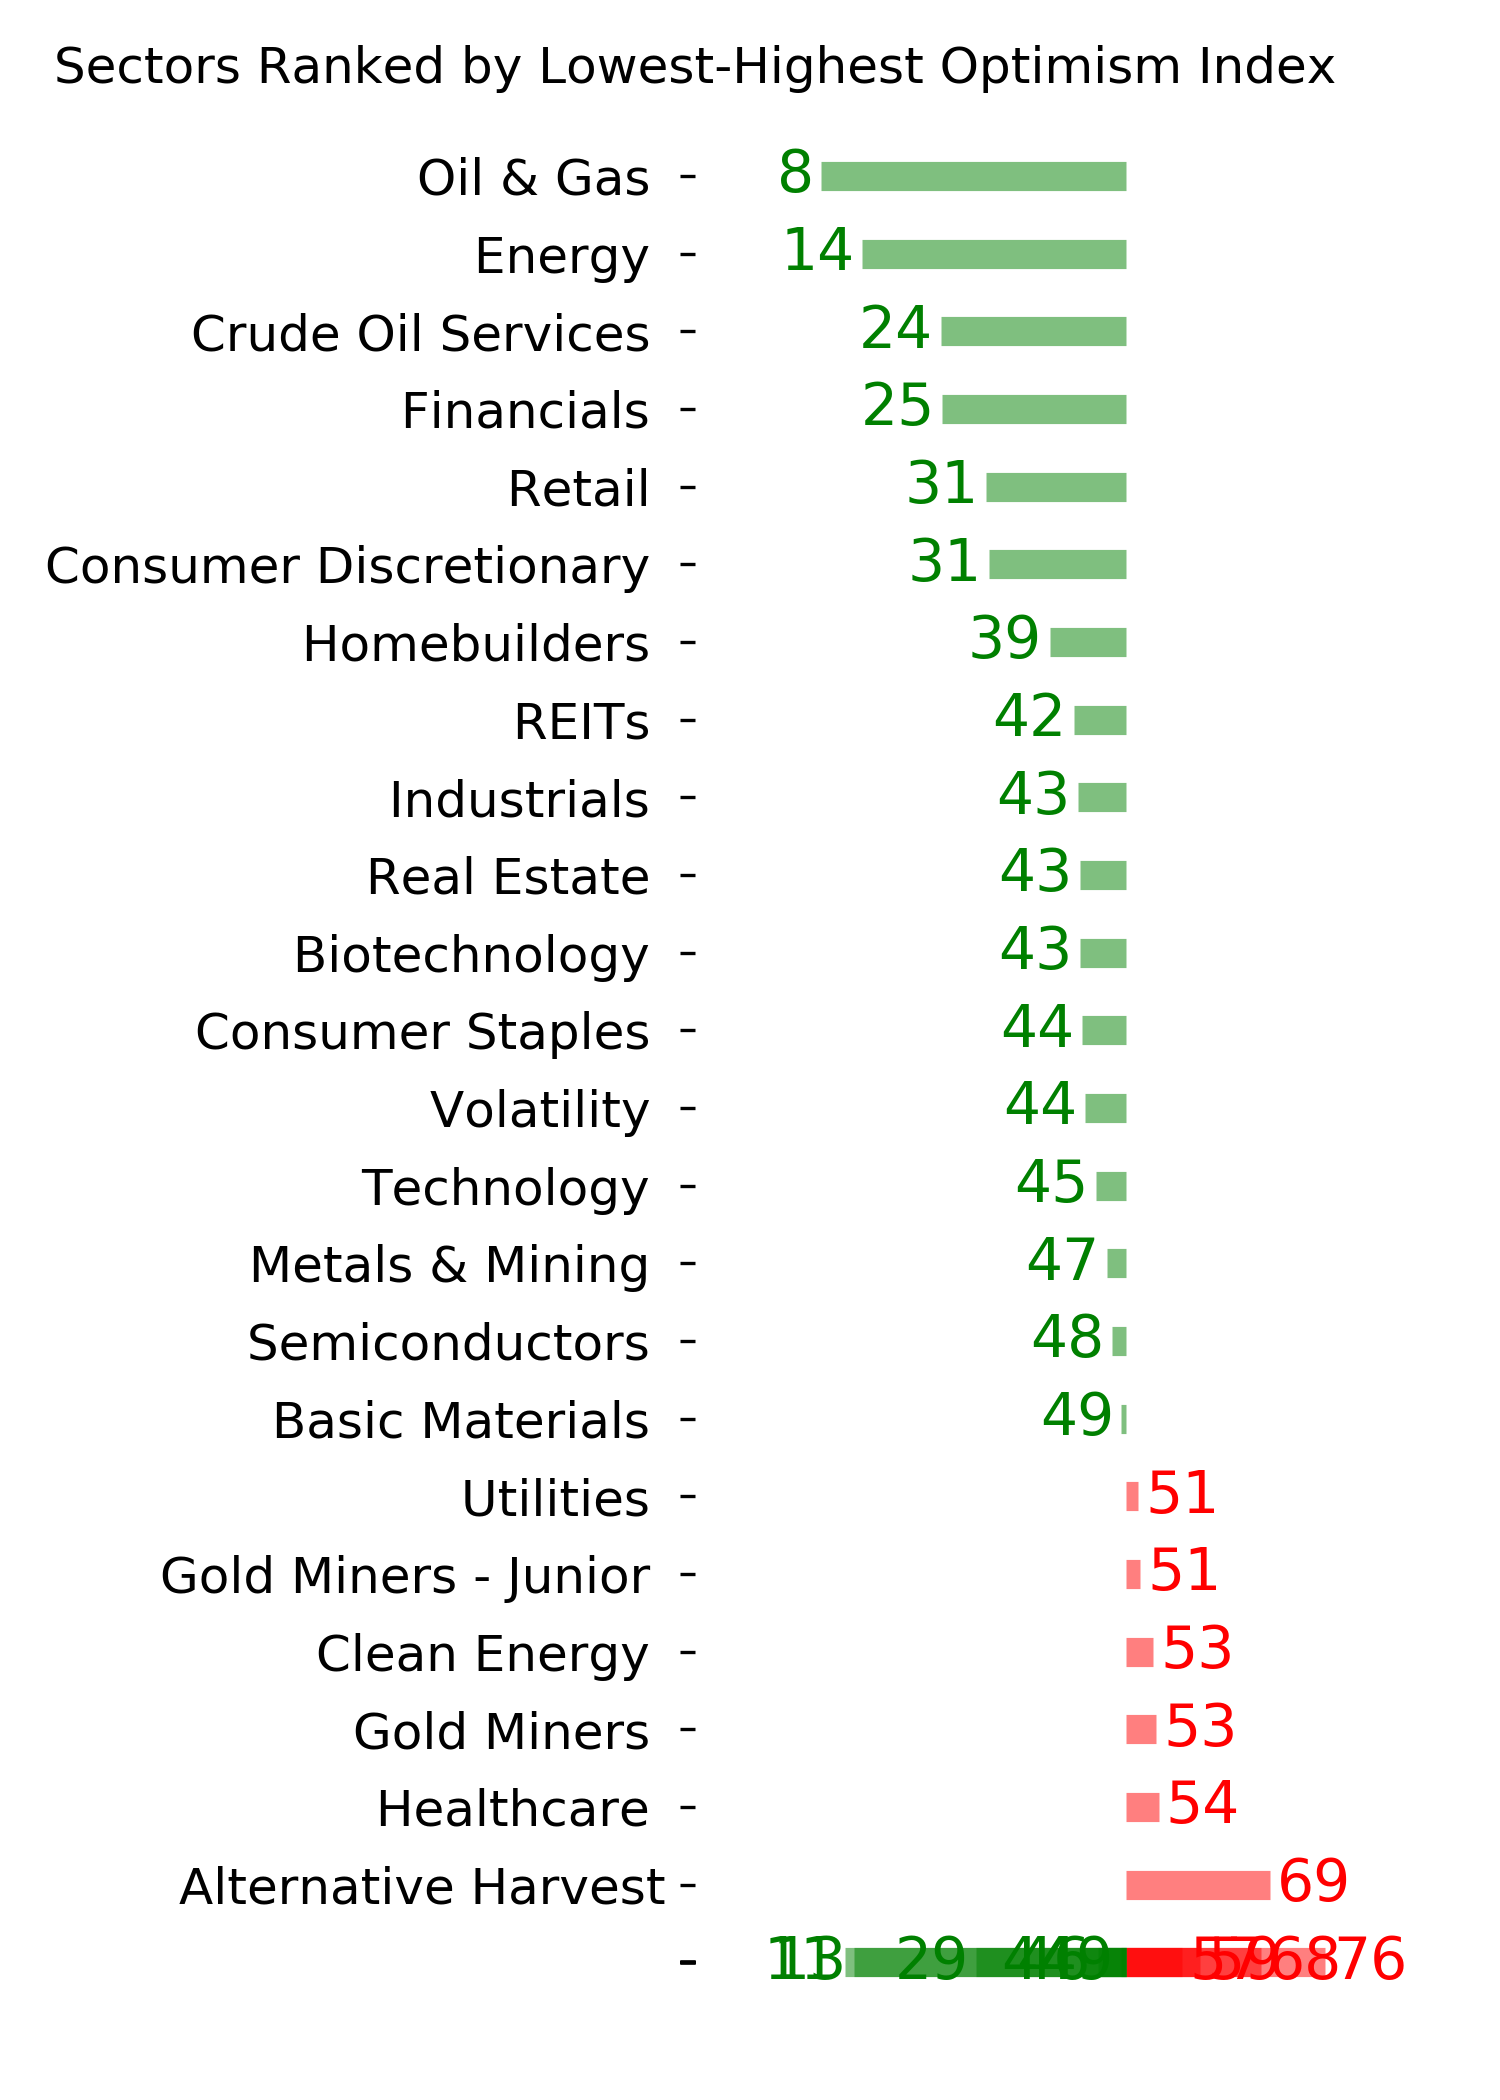
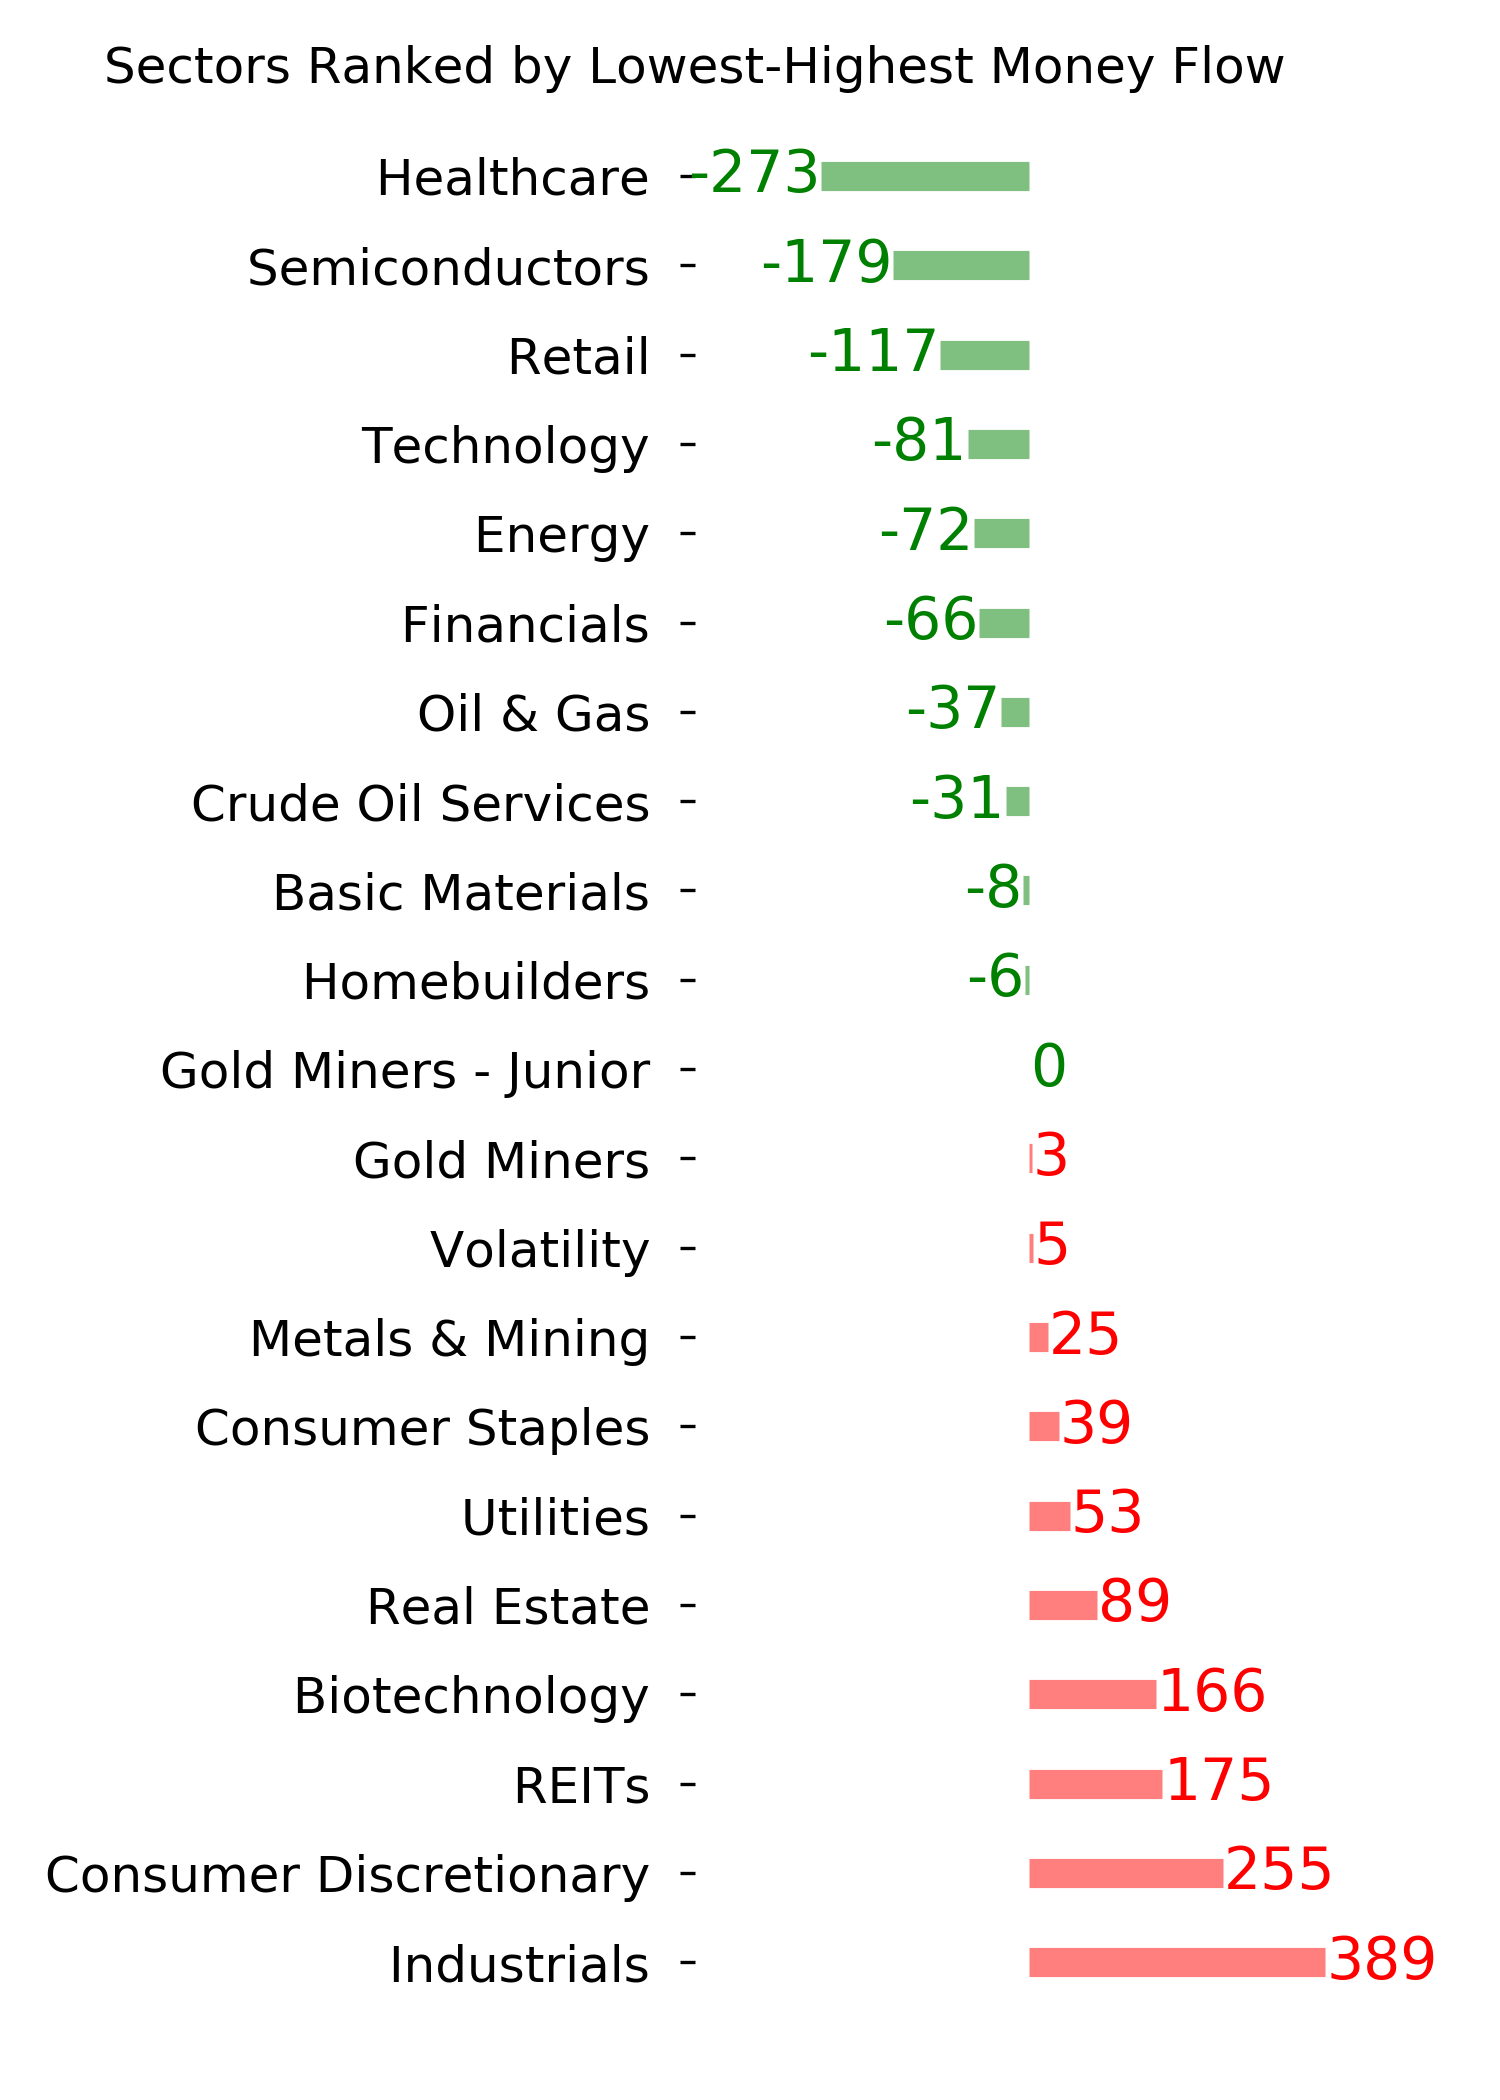
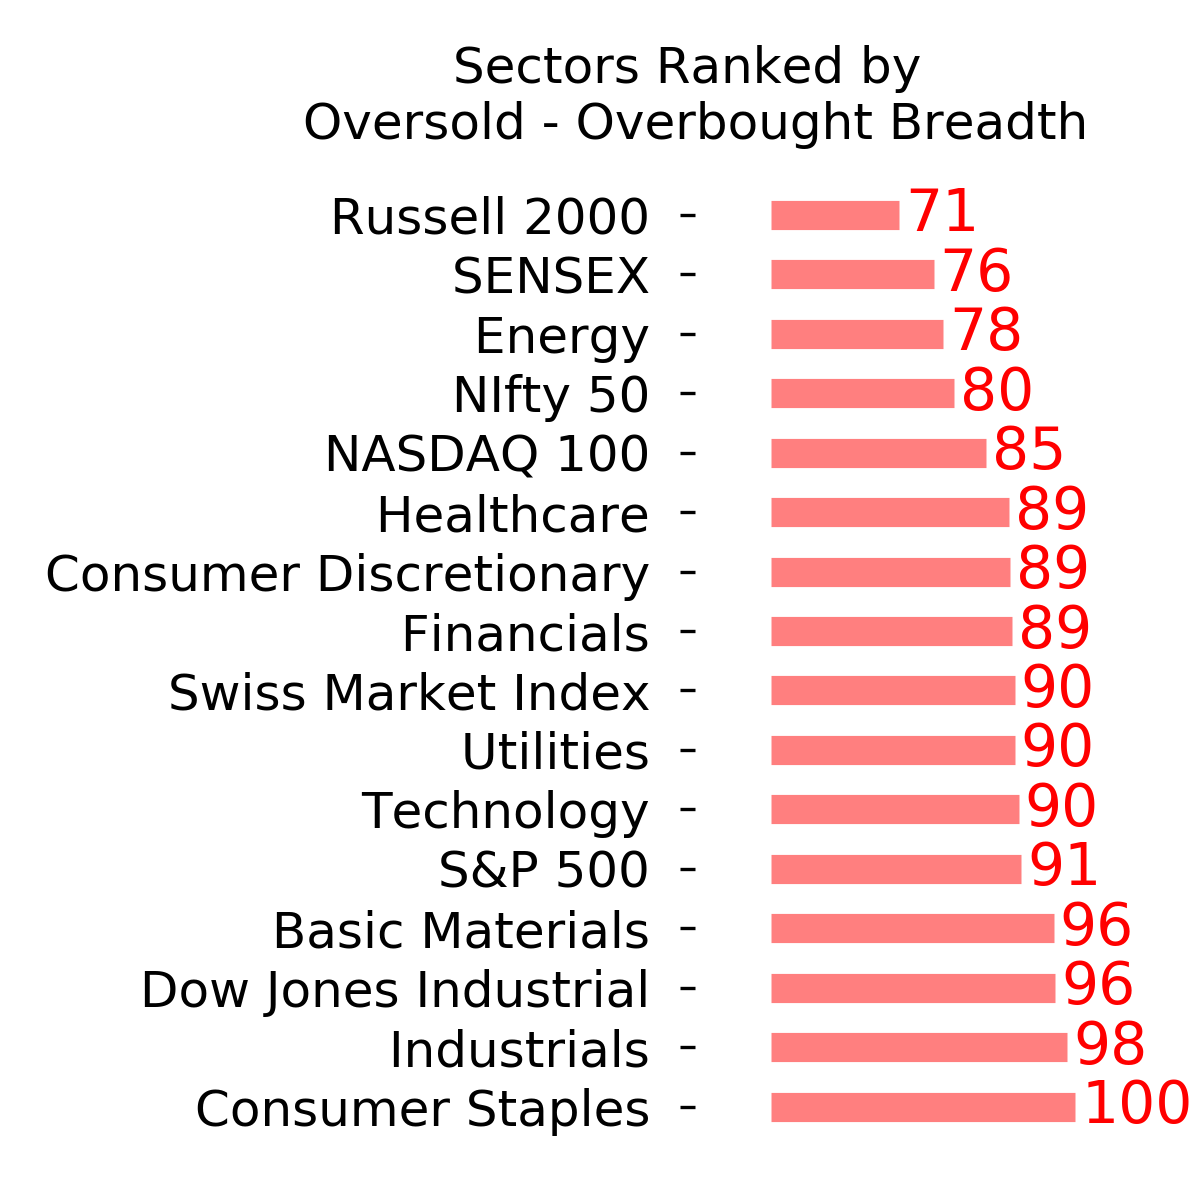
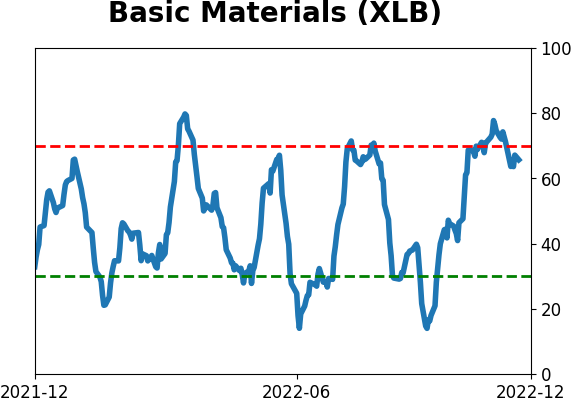
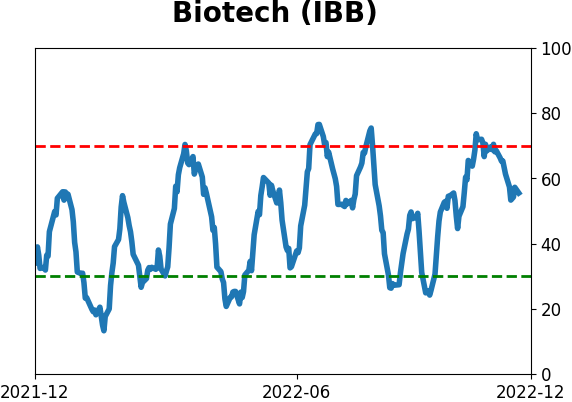
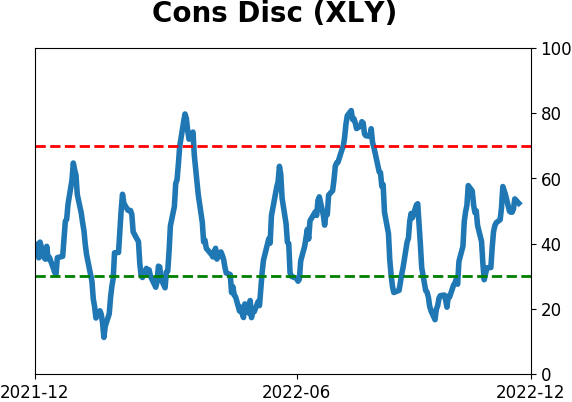
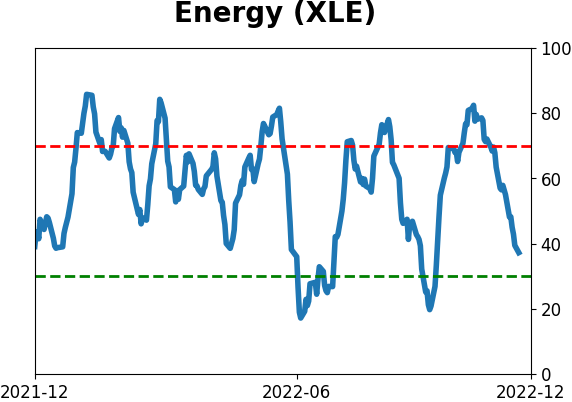
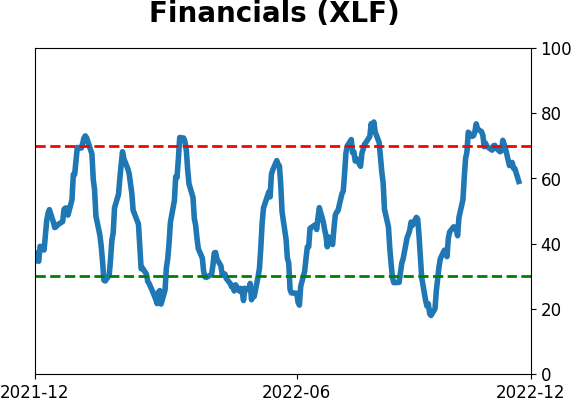
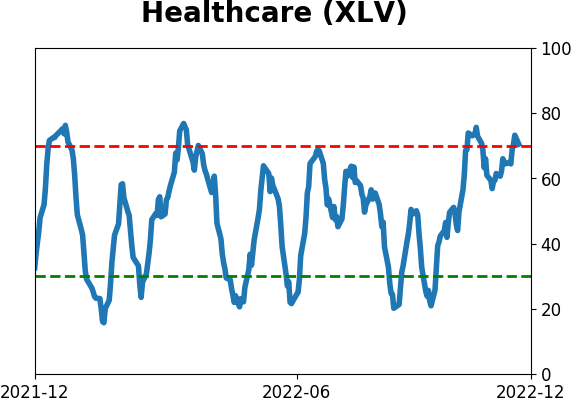
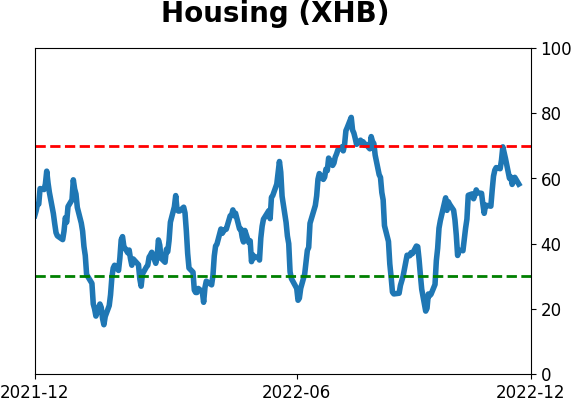
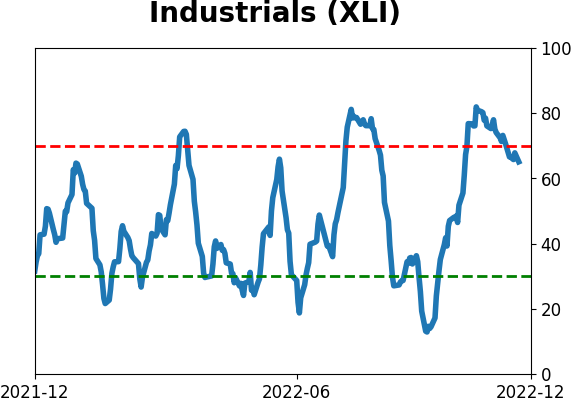
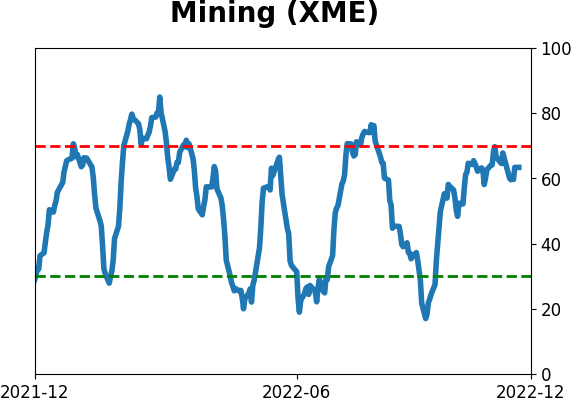
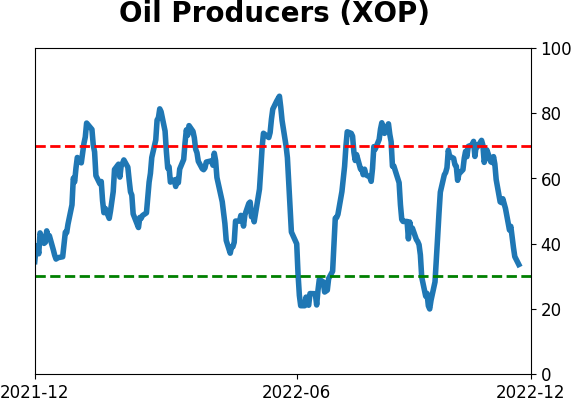
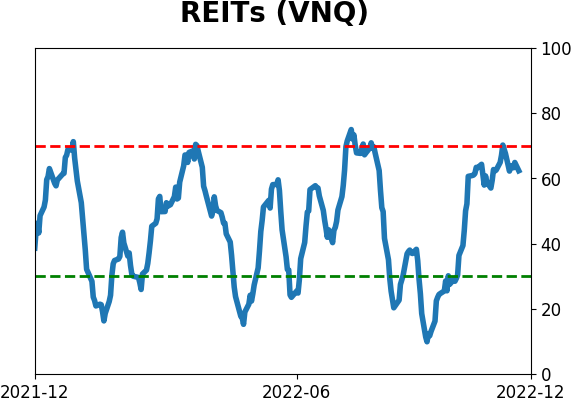
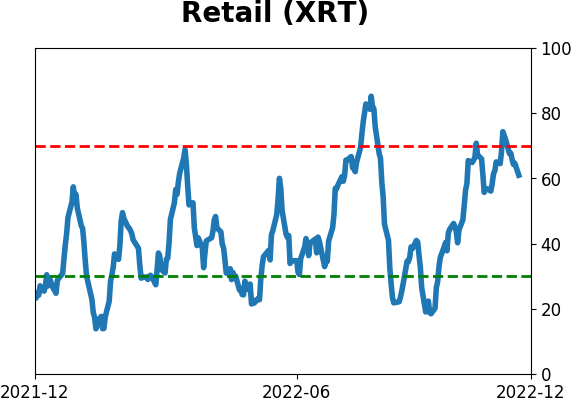
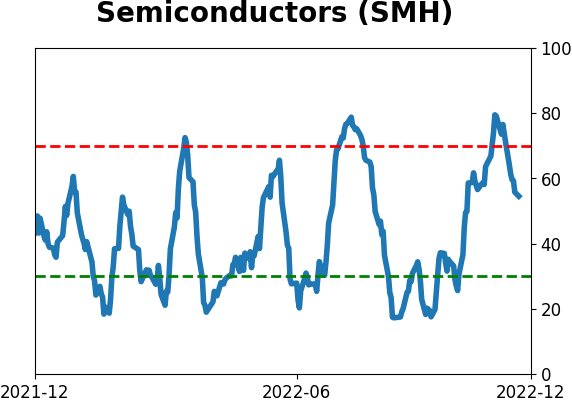
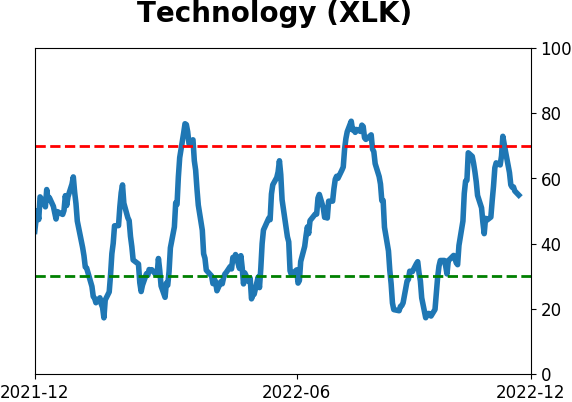
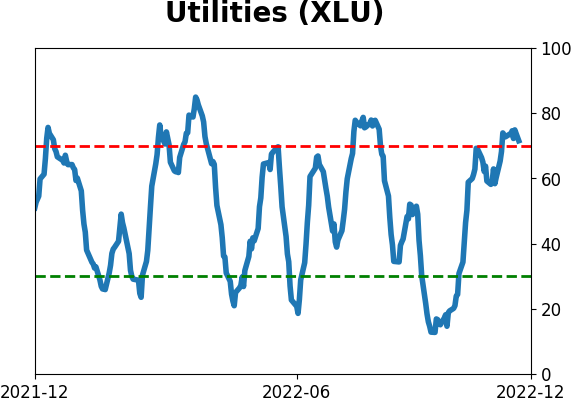
Sector ETF's - 10-Day Moving Average
|
|
|
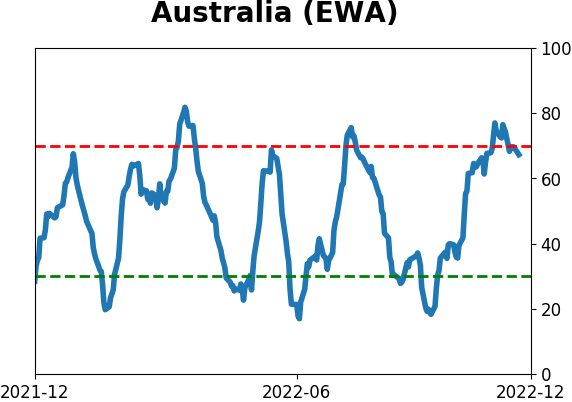
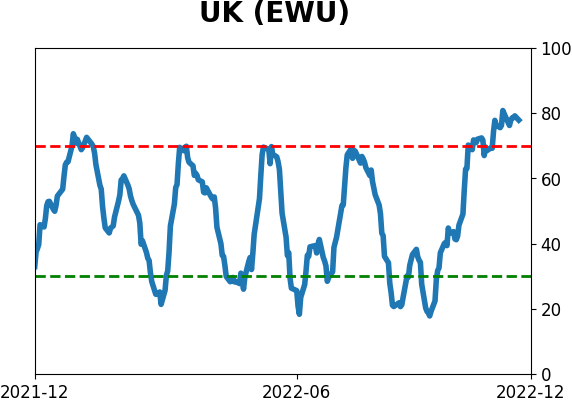
Country ETF's - 10-Day Moving Average
|
|
|
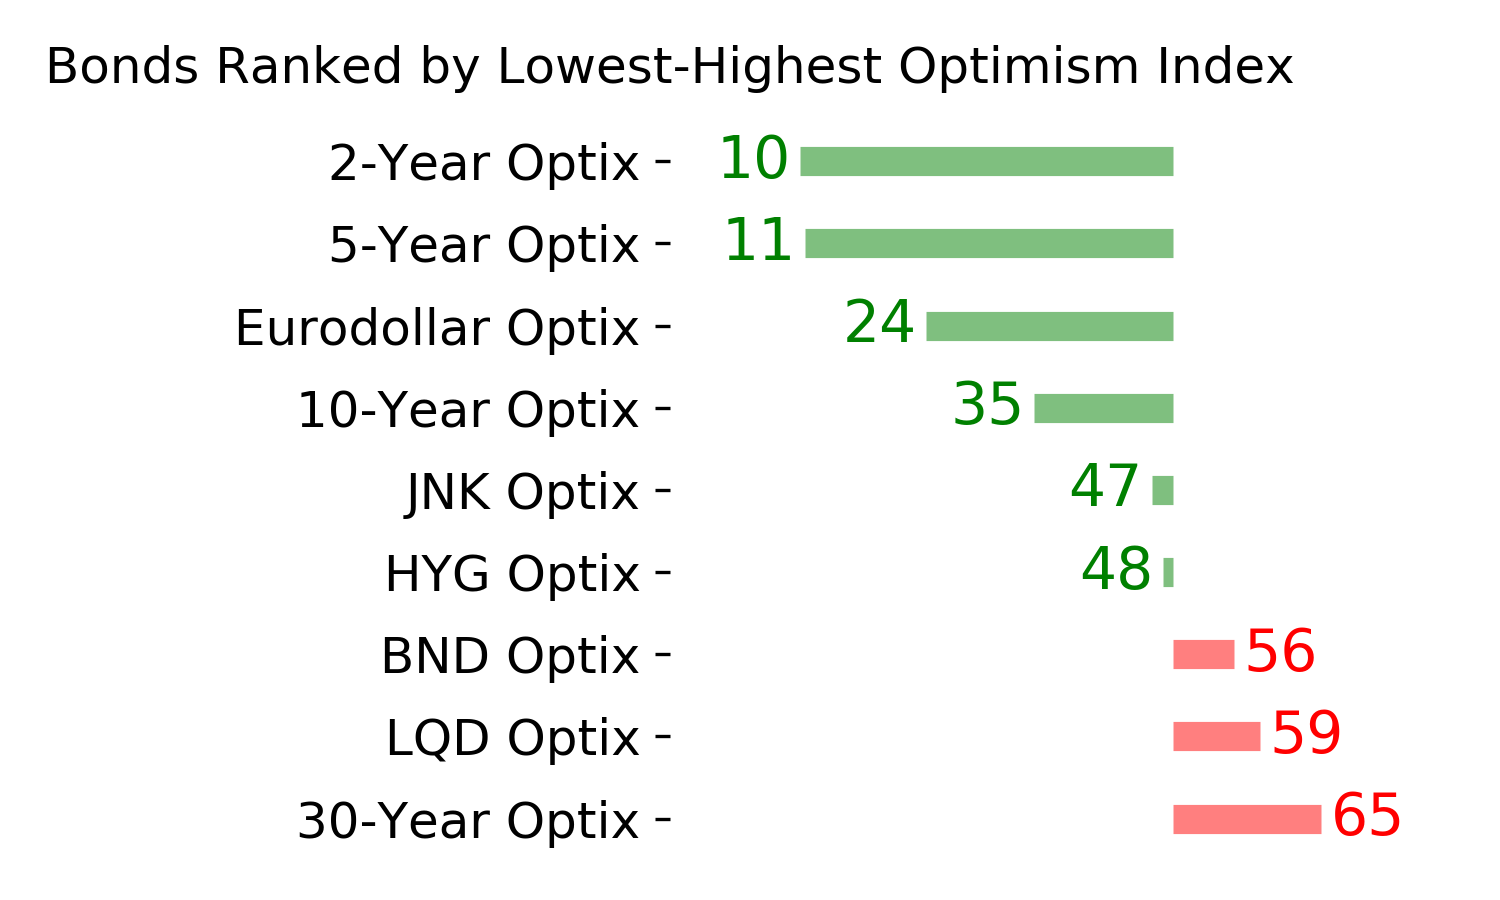
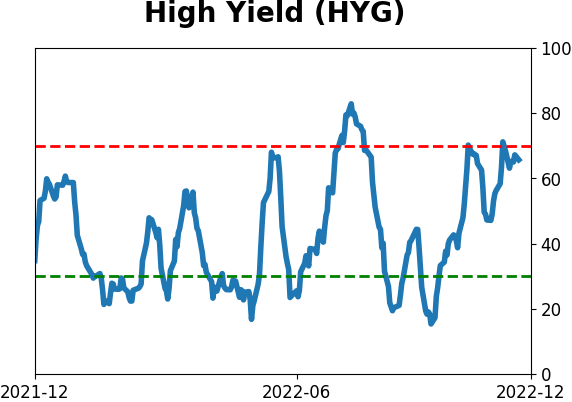
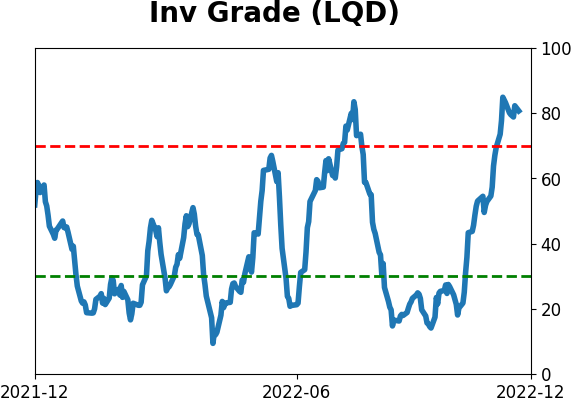
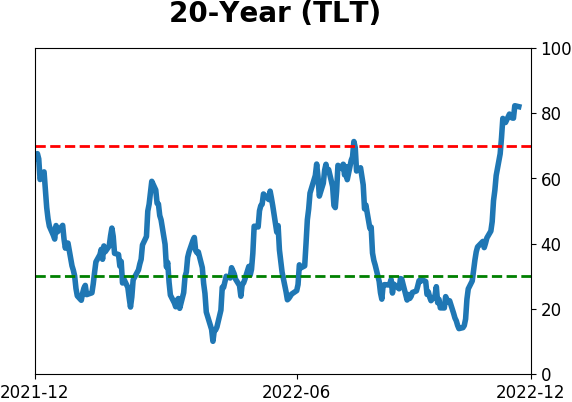
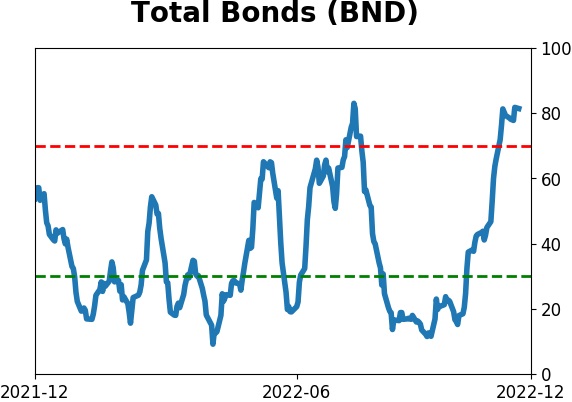
Bond ETF's - 10-Day Moving Average
|
|
|
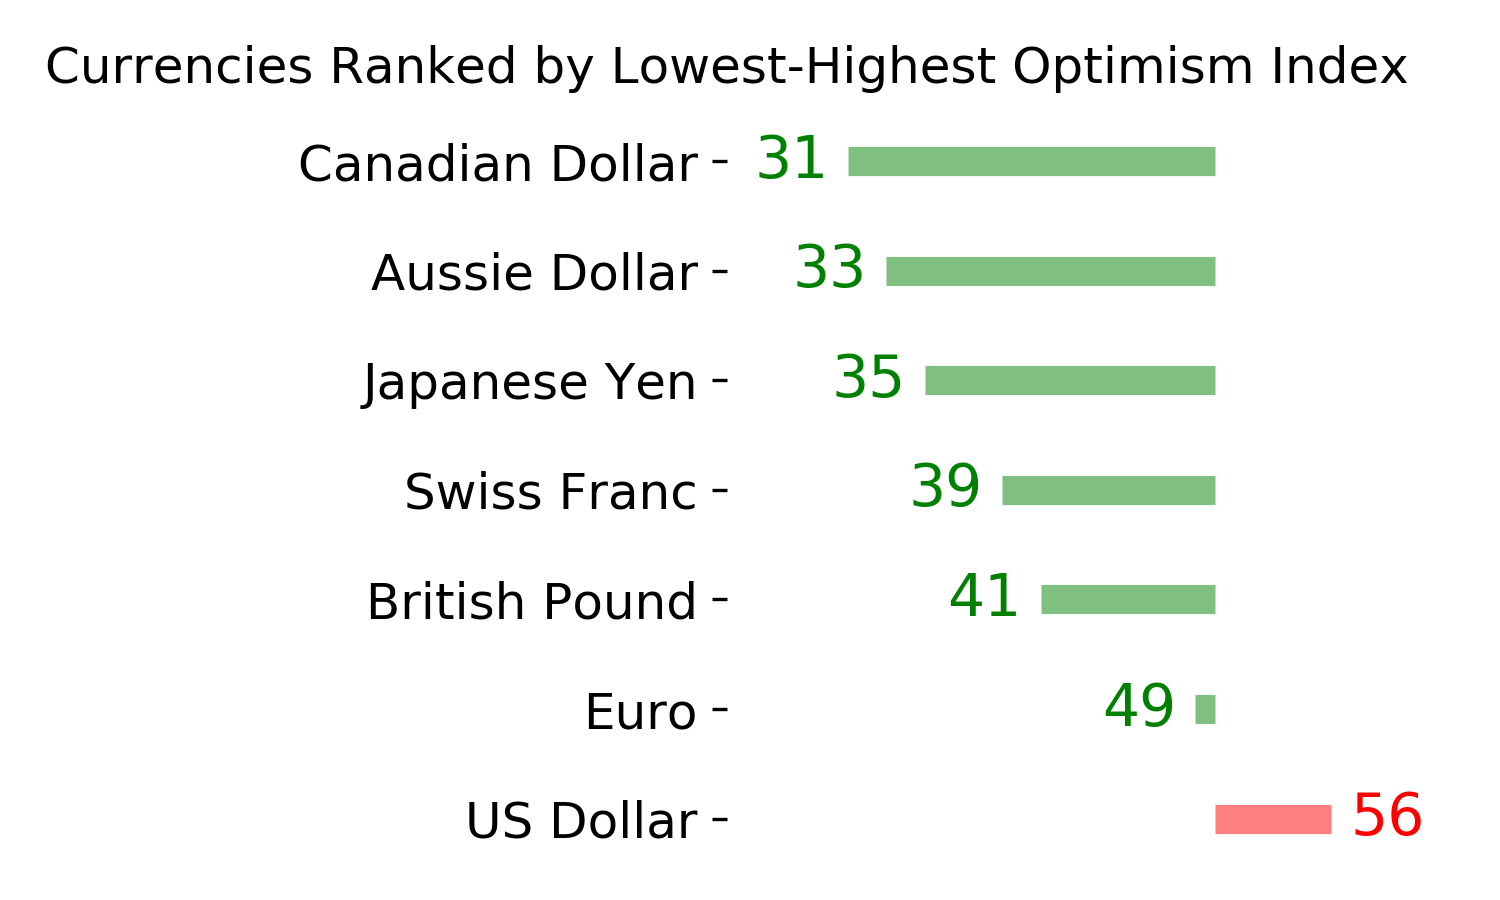
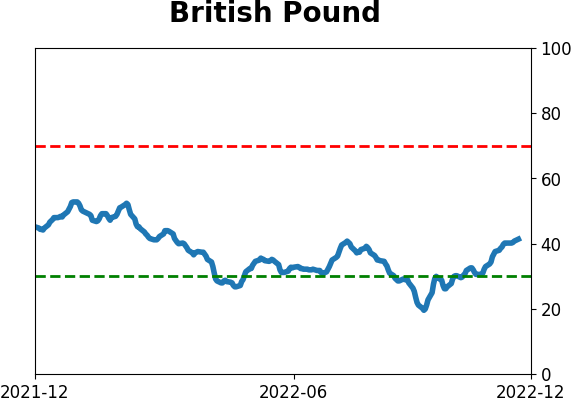
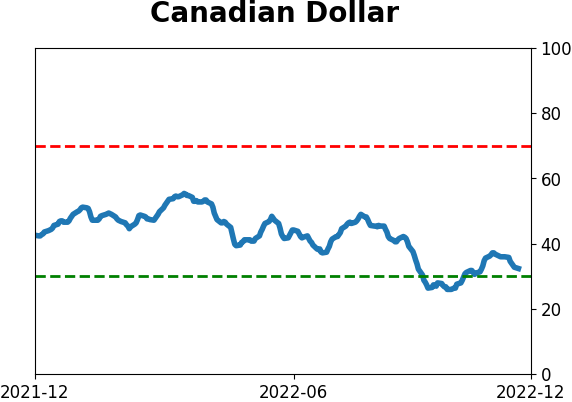
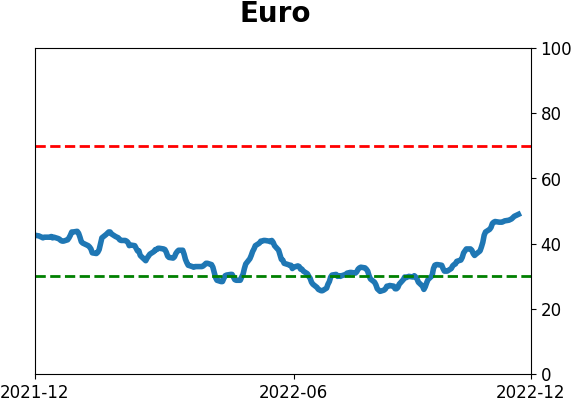
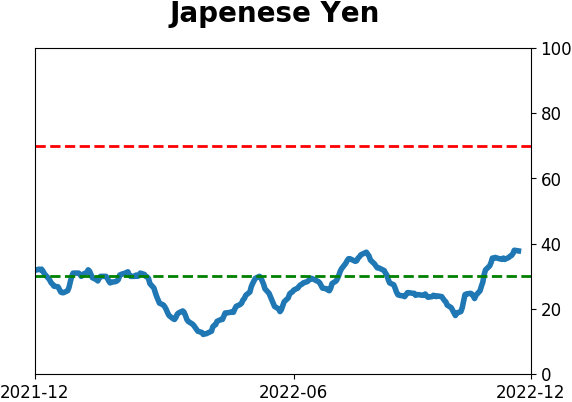
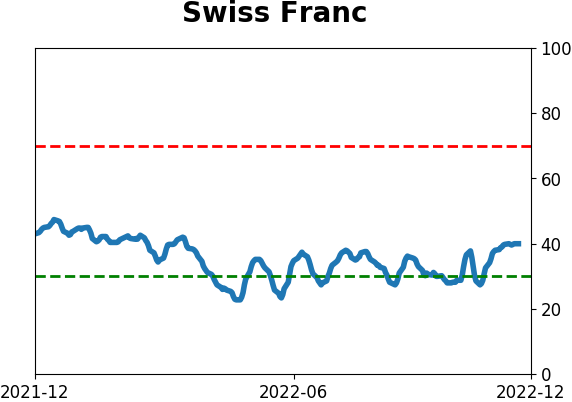
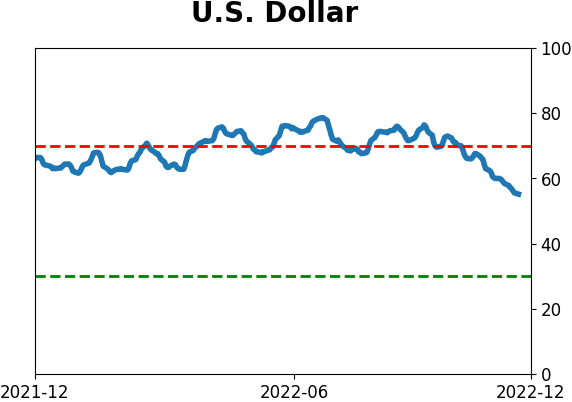
Currency ETF's - 5-Day Moving Average
|
|
|
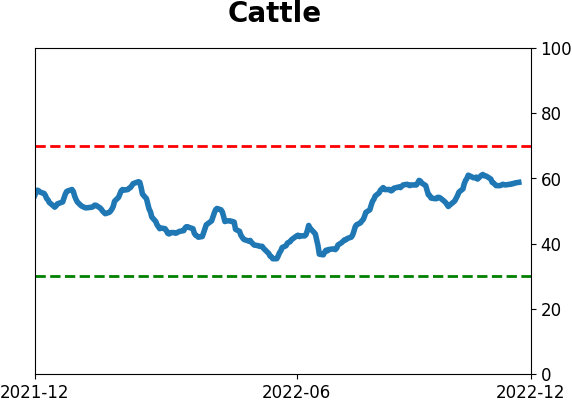
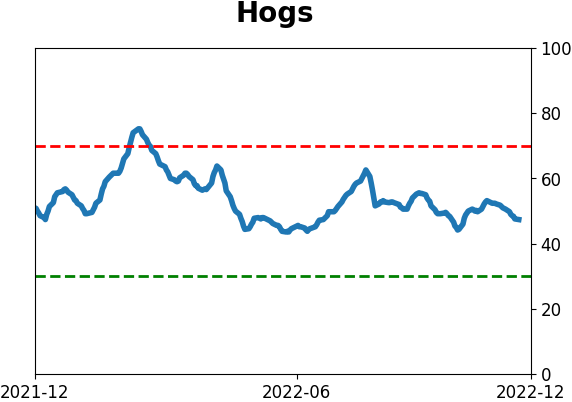
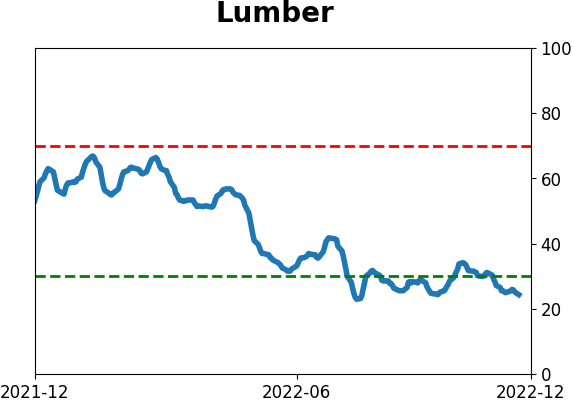
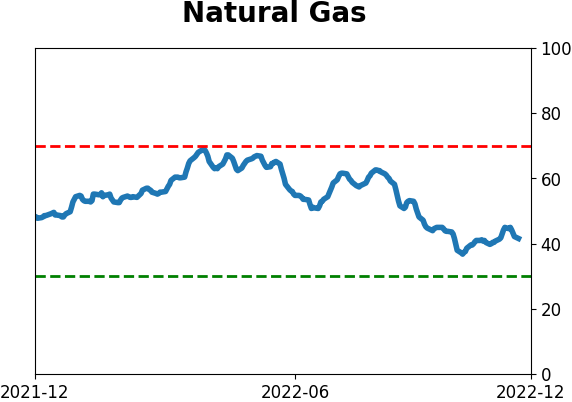
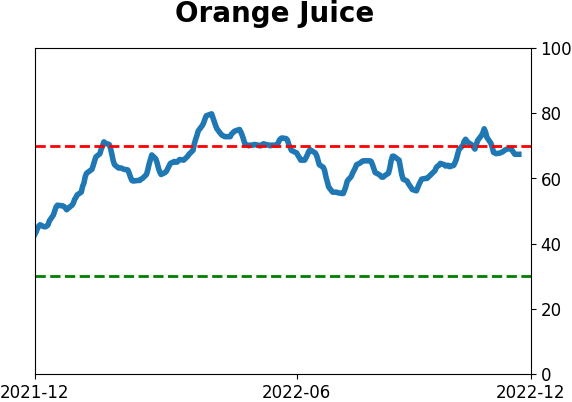
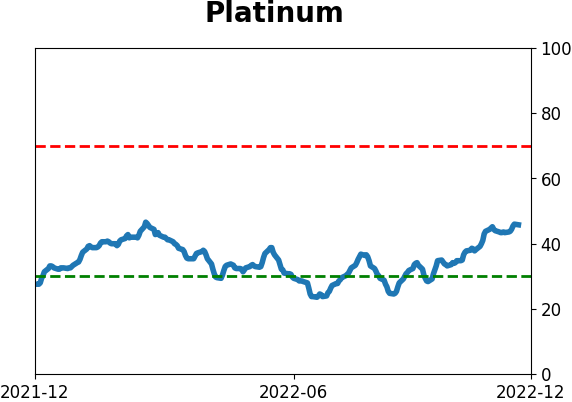
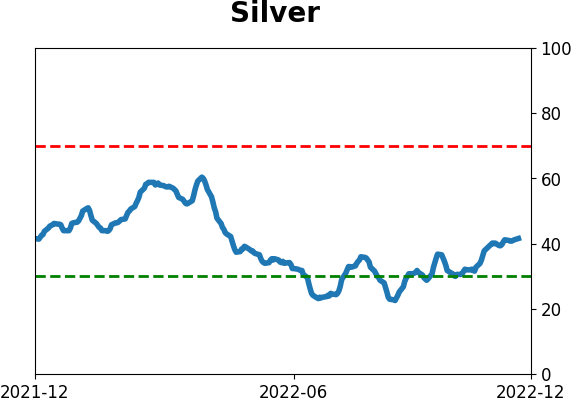
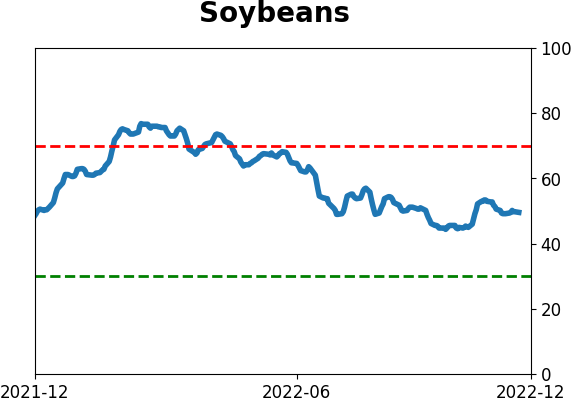
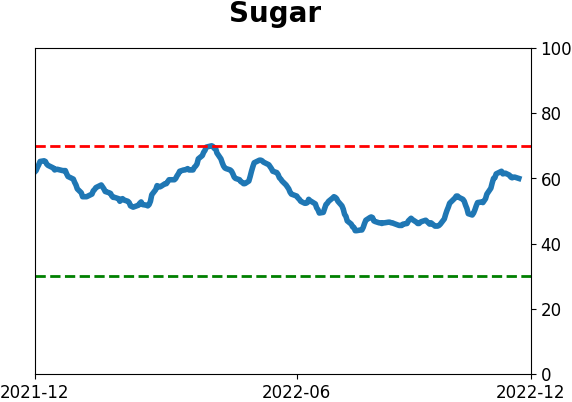
Commodity ETF's - 5-Day Moving Average
|
|