Headlines
|
|
A quick trip from modest fear to prolonged complacency:
Whenever contrarians see a bout of low volatility and barely-teenager readings in the VIX, they get a twitchy finger and want to buy puts. But betting on an imminent decline, especially at this point in the calendar, has been an iffy proposition just because volatility has declined so much.
|
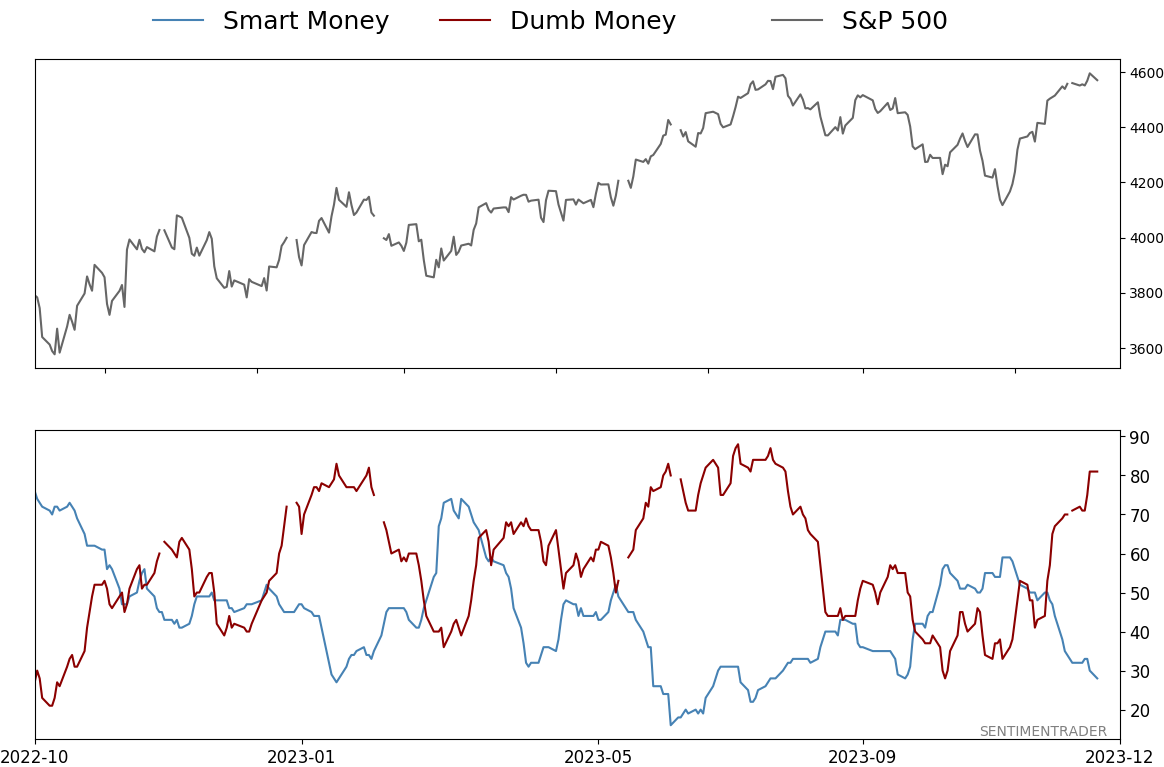
Smart / Dumb Money Confidence
|
Smart Money Confidence: 28%
Dumb Money Confidence: 81%
|
|
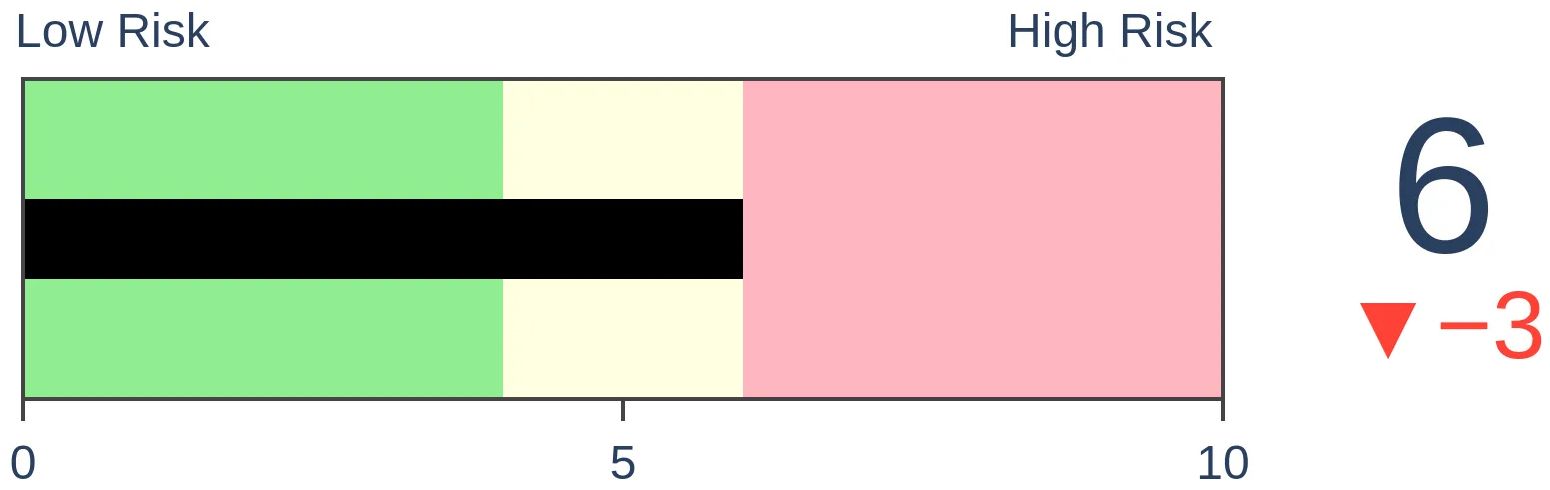
Risk Levels
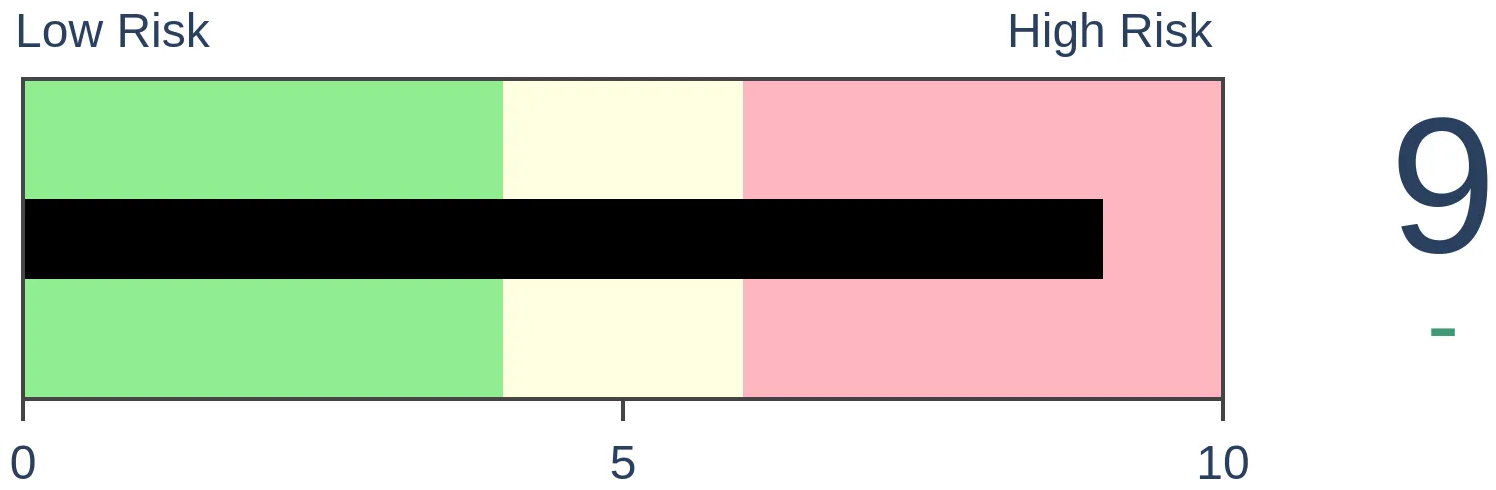
Stocks Short-Term
|
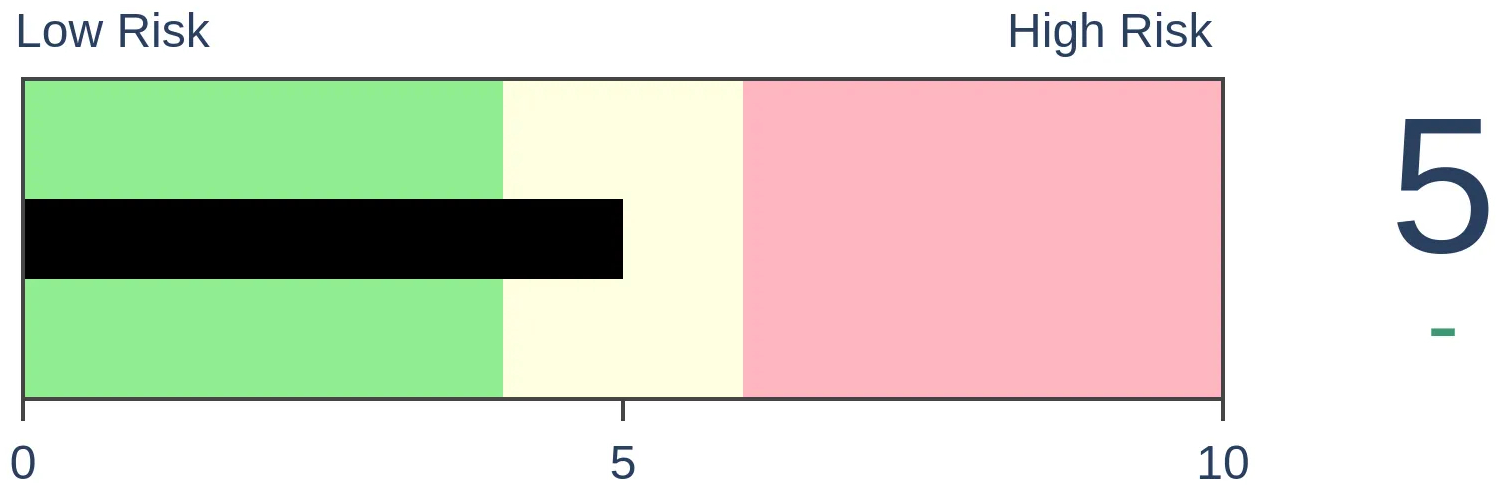
Stocks Medium-Term
|
|
Bonds

|
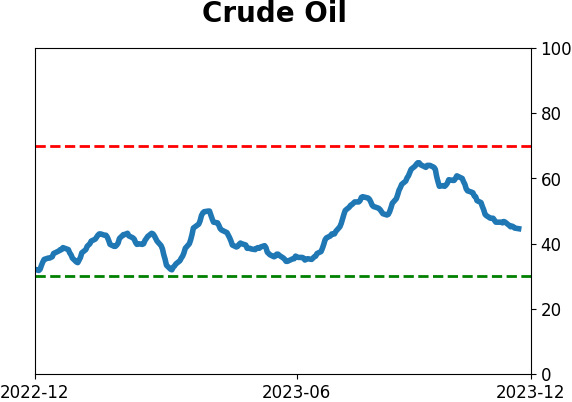
Crude Oil
|
|
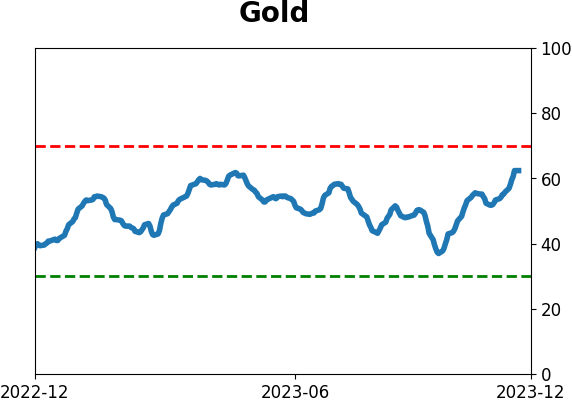
Gold
|
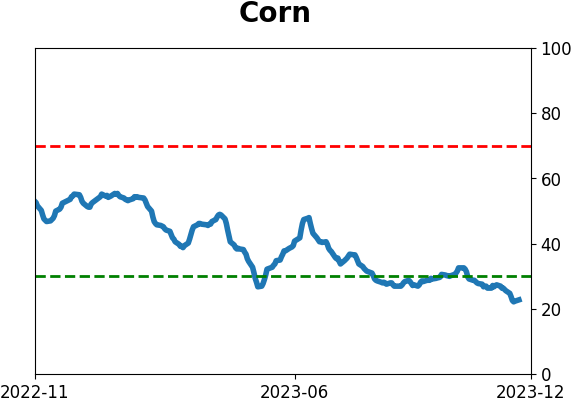
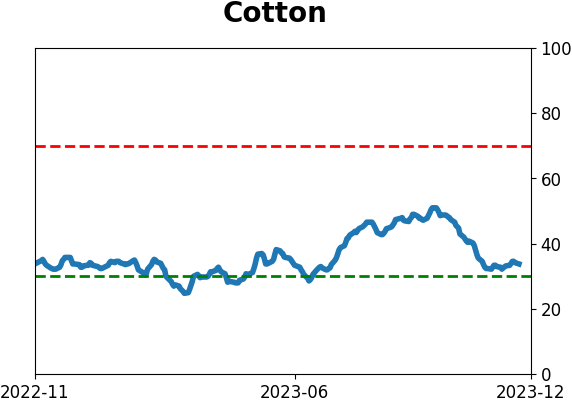
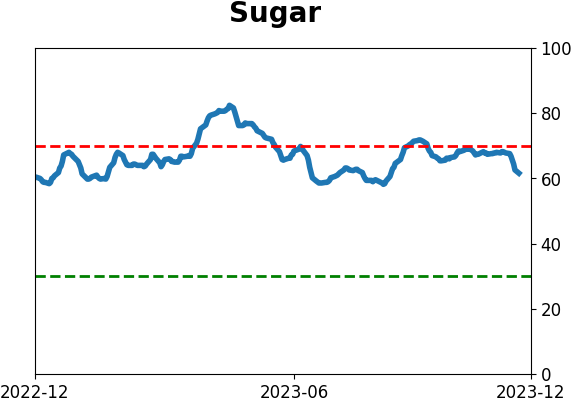
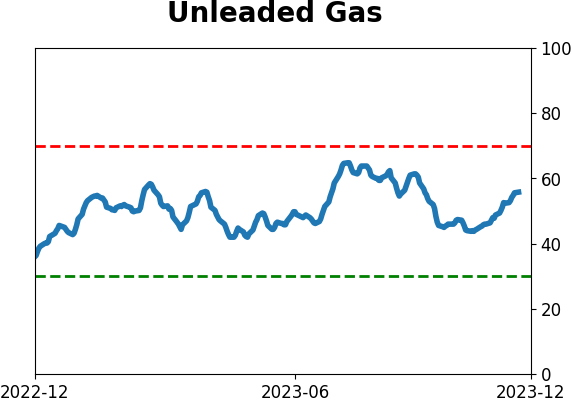
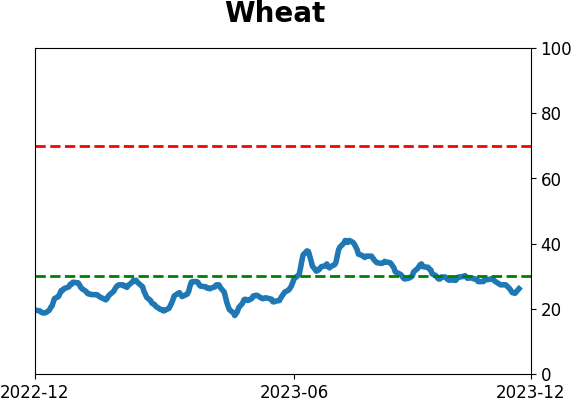
Agriculture

|
|
Research
By Jason Goepfert
BOTTOM LINE
Whenever contrarians see a bout of low volatility and barely-teenager readings in the VIX, they get a twitchy finger and want to buy puts. But betting on an imminent decline, especially at this point in the calendar, has been an iffy proposition just because volatility has declined so much.
FORECAST / TIMEFRAME
None
|
Key points:
- The VIX "fear gauge" had been above 20 several weeks ago and now has been held under 13 for nearly two weeks
- Relatively low volatility has not been a consistent reason to sell or expect an immediate jump in vol
- That's especially the case when we see low volatility in December
After some brief fear, complacency reigns
For the first time since December 2019, the VIX "fear gauge" has cycled from at least a few days in elevated territory to a relatively long streak in the complacent zone.
The VIX is perhaps the most widely-followed yet least-understood indicator that investors use, and it has caused many of them headaches over the years. And nearly everyone trying to trade it has suffered far worse than just a headache.
Knee-jerk contrarians love to suggest buying stocks when "fear" is high and selling them when it's low. In practice, however, it has most often benefited investors who do the opposite, at least for a while.
If we look at that December 2019 precedent, it was, indeed, good for bulls...for a while. Then the pandemic hit, and all hell broke loose.
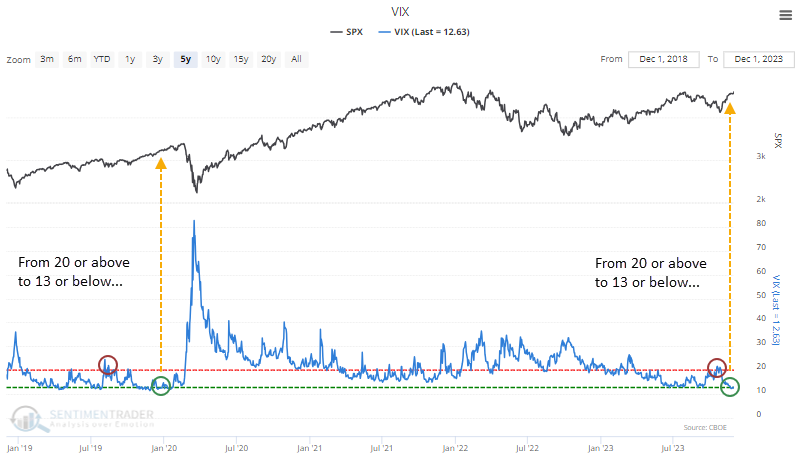
That's an extraordinary instance, however, and it would be silly to base an investment thesis upon it unless one expects a repeat, and in that case, heaven help you.
Historically, it has proven to be better to be a bull when relative fear turns to relative complacency. Over the next couple of months, the S&P sported a negative return only once (the 2020 doozy). Even that one ended up showing a substantial gain a year later.
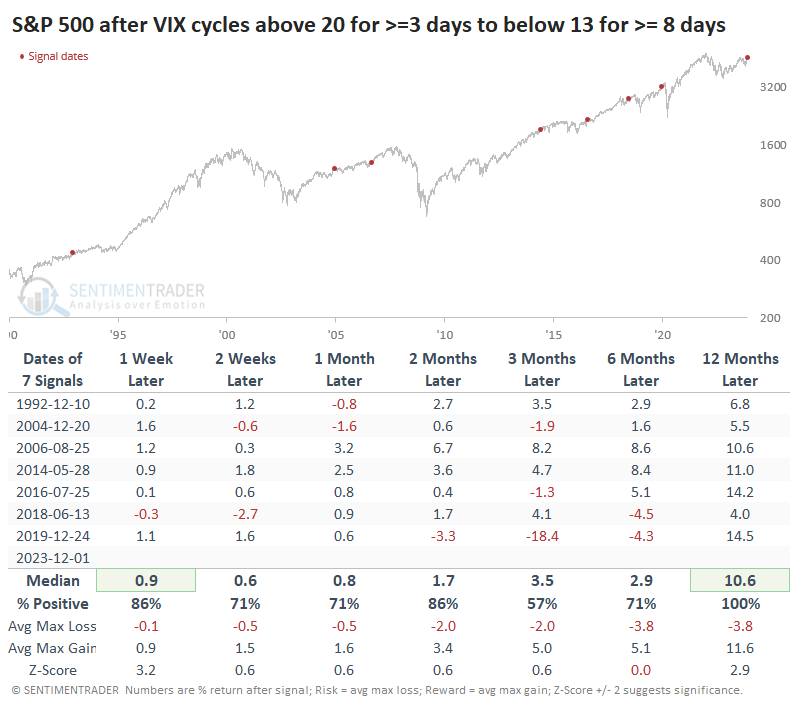
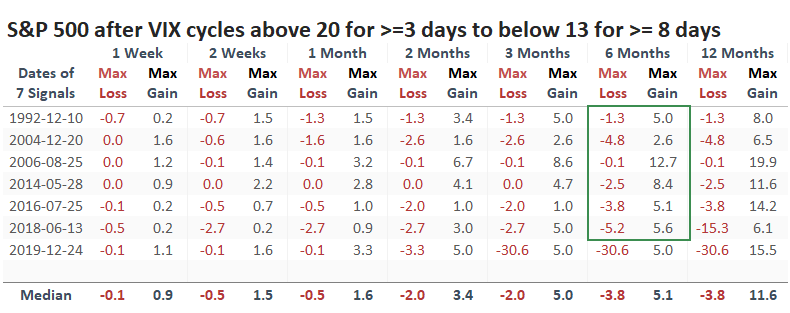
Up to six months later, it was rare to see much in terms of risk, again with the pandemic exception. The other signals saw no drawdown larger than -5.2% at any point within the next six months.
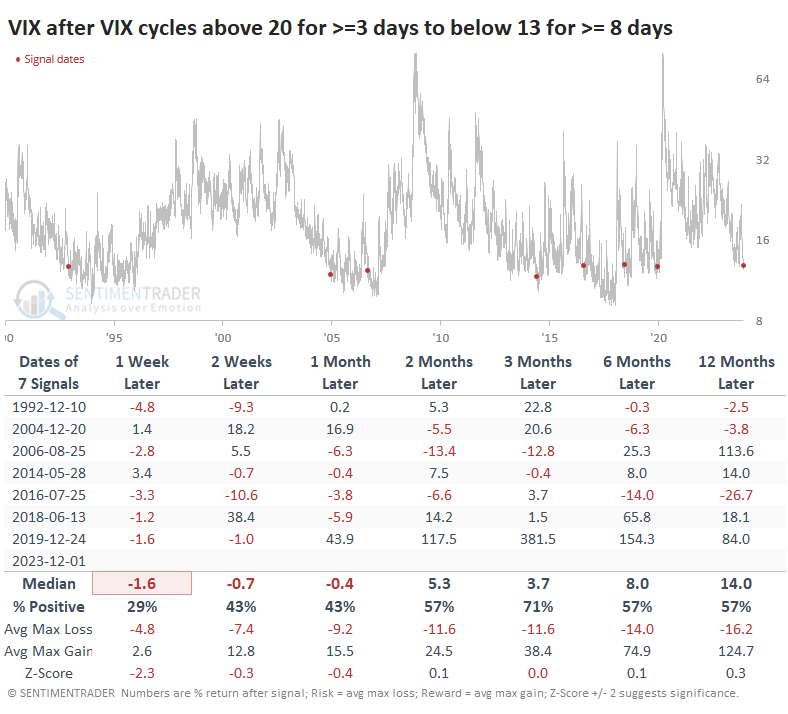
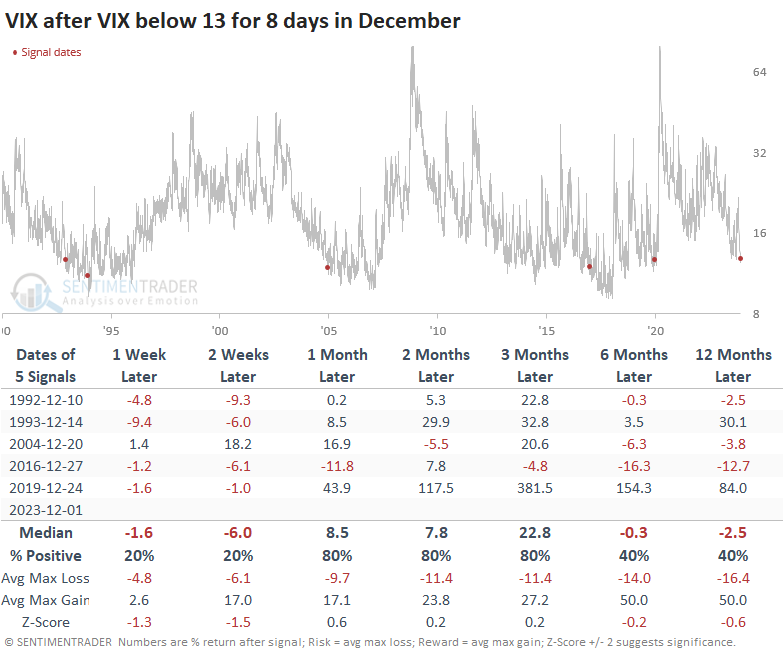
For the VIX itself, it typically continued to decline in the short-term. But it rose most of the time two months and beyond, even though stocks also tended to rise. There is not a precise inverse correlation between stocks and implied volatility.
Low volatility ahead of the holidays
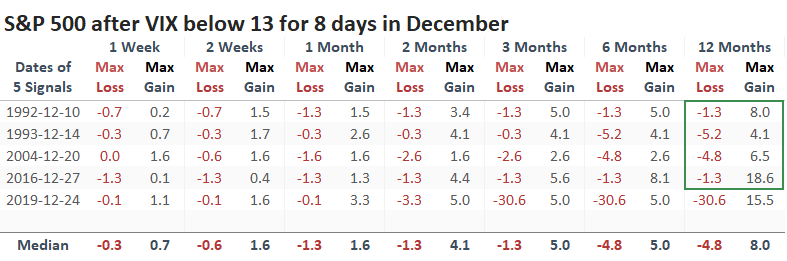
If we combine the indicator and the calendar, the table below shows us each time the VIX held below 13 for at least 8 trading days while we were in December. Again, the arrival of the pandemic early in 2020 threw a wrench into that signal, while the others showed gains or minimal losses at worst across all time frames. The usual warning about tiny sample sizes applies.
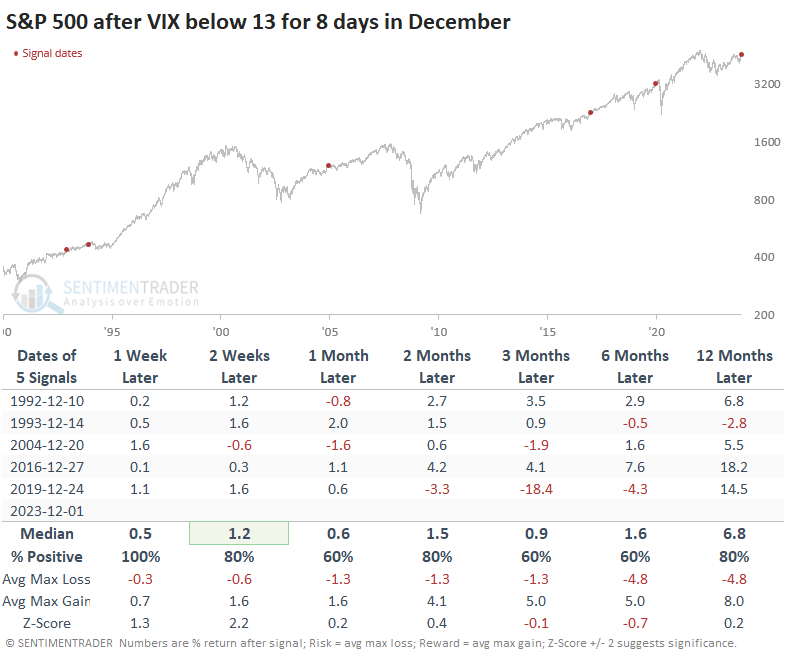
Even up to a year later, there was minimal drawdown...again, except for the pandemic signal.
While drawing too much meaning from such a small sample is challenging, the VIX lost ground in December through early January, then spiked sometime between mid-January and March.
What the research tells us...
It's tempting to read about complacency and automatically think it means we should buy "cheap" puts and wait for volatility to hit. It probably will at some point. But it won't necessarily be because the VIX has been relatively low for a relatively long time. Volatility is more likely to be subdued because of that, at least for a while. The few times it has been this low for this long, at this time of the year, investors have been willing to let it ride for weeks longer. All else being equal - and no, it's never equal - there is a better empirical case to be built for expecting a volatility bump after the calendar's turn.
Indicators at Extremes
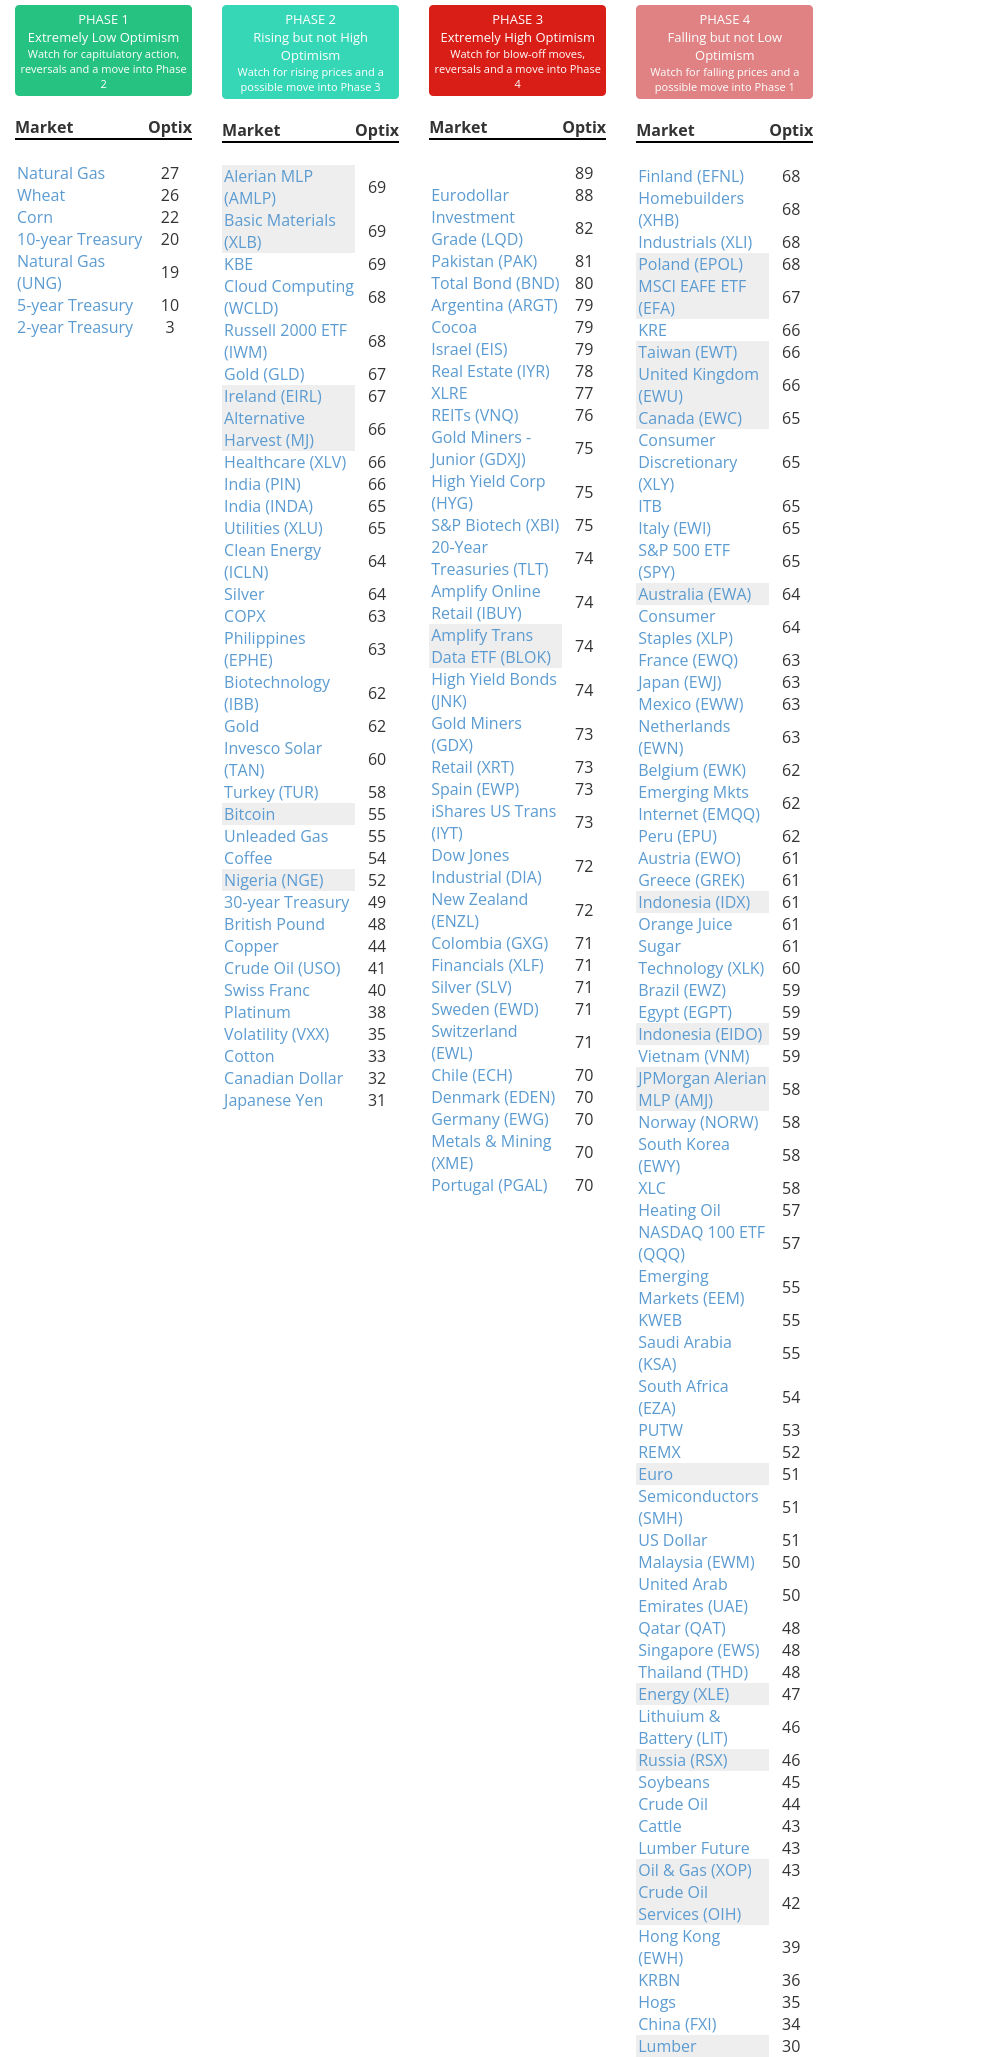
Phase Table
Ranks
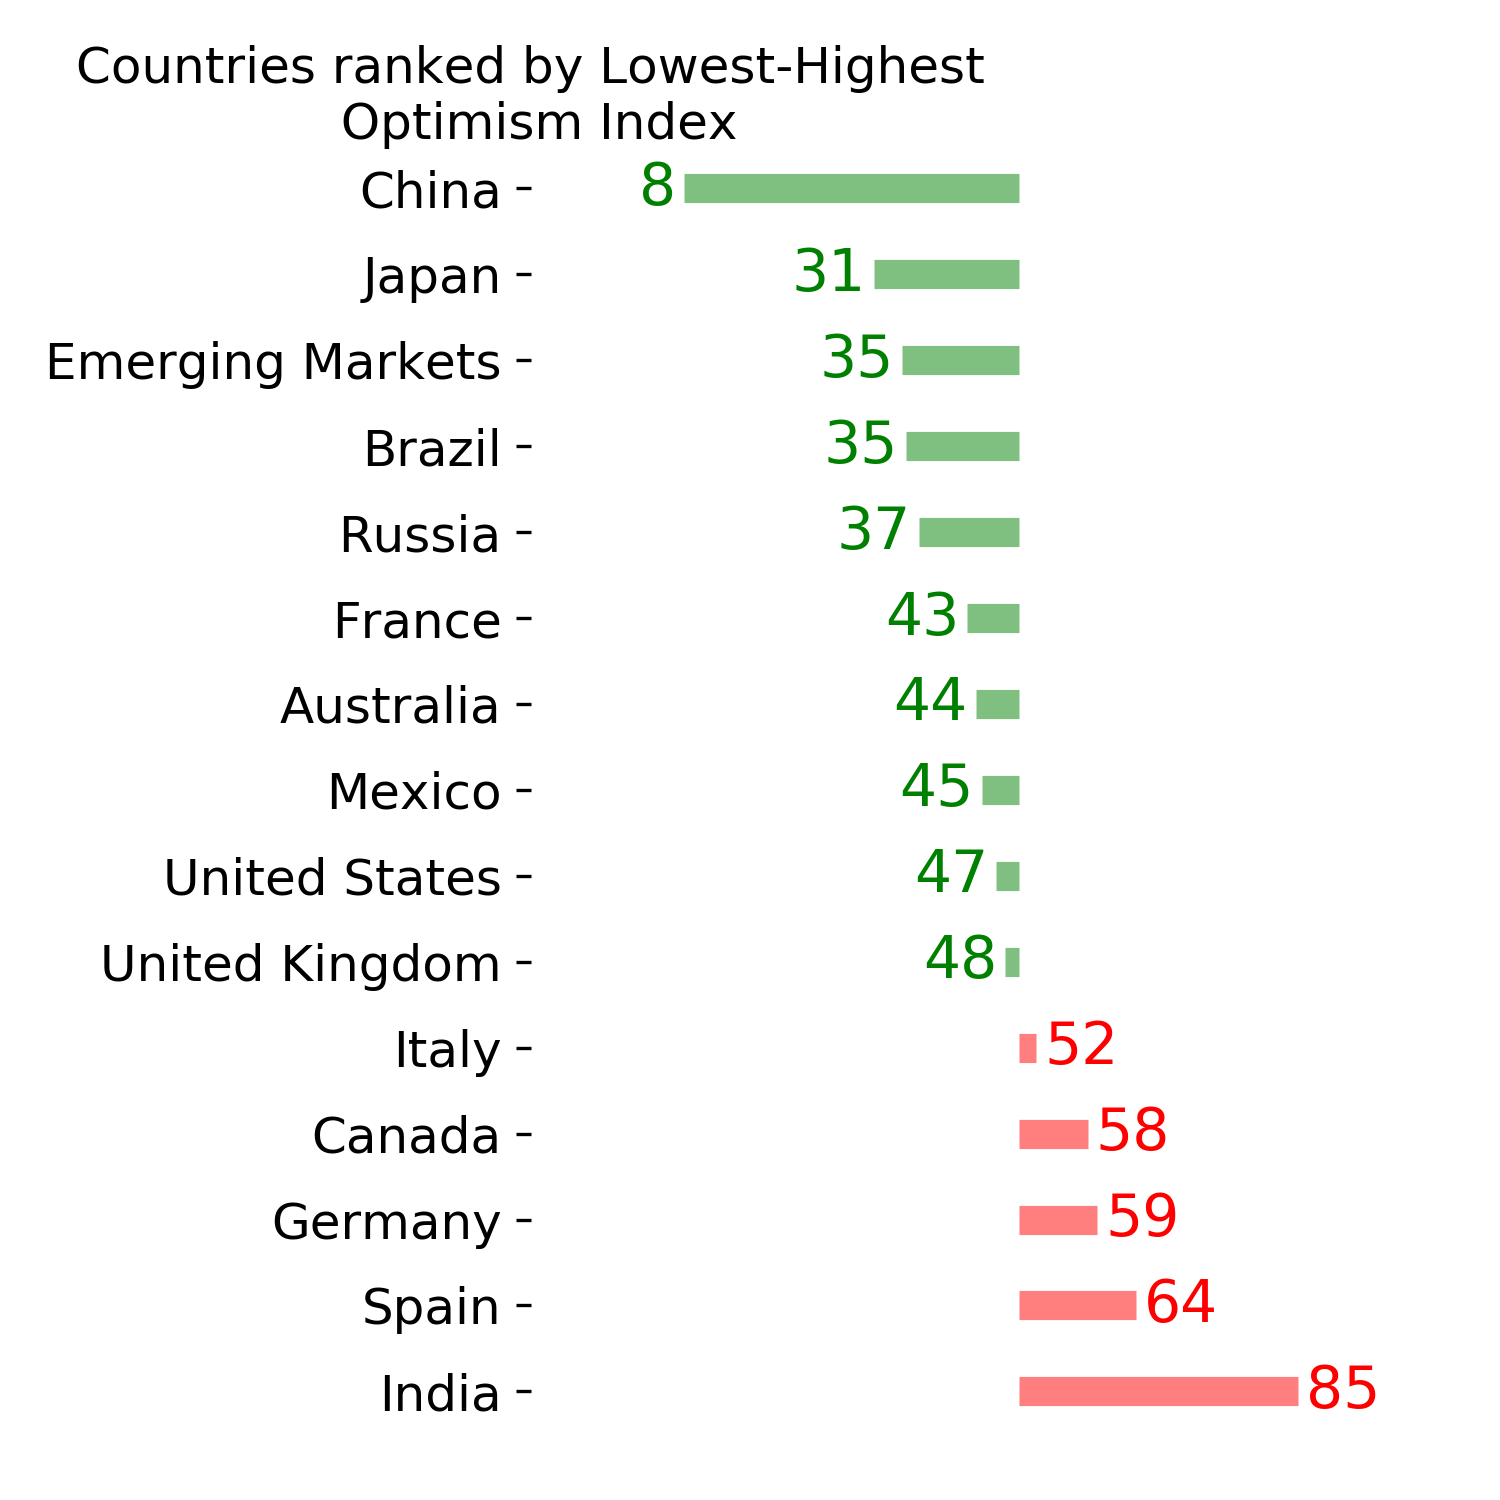
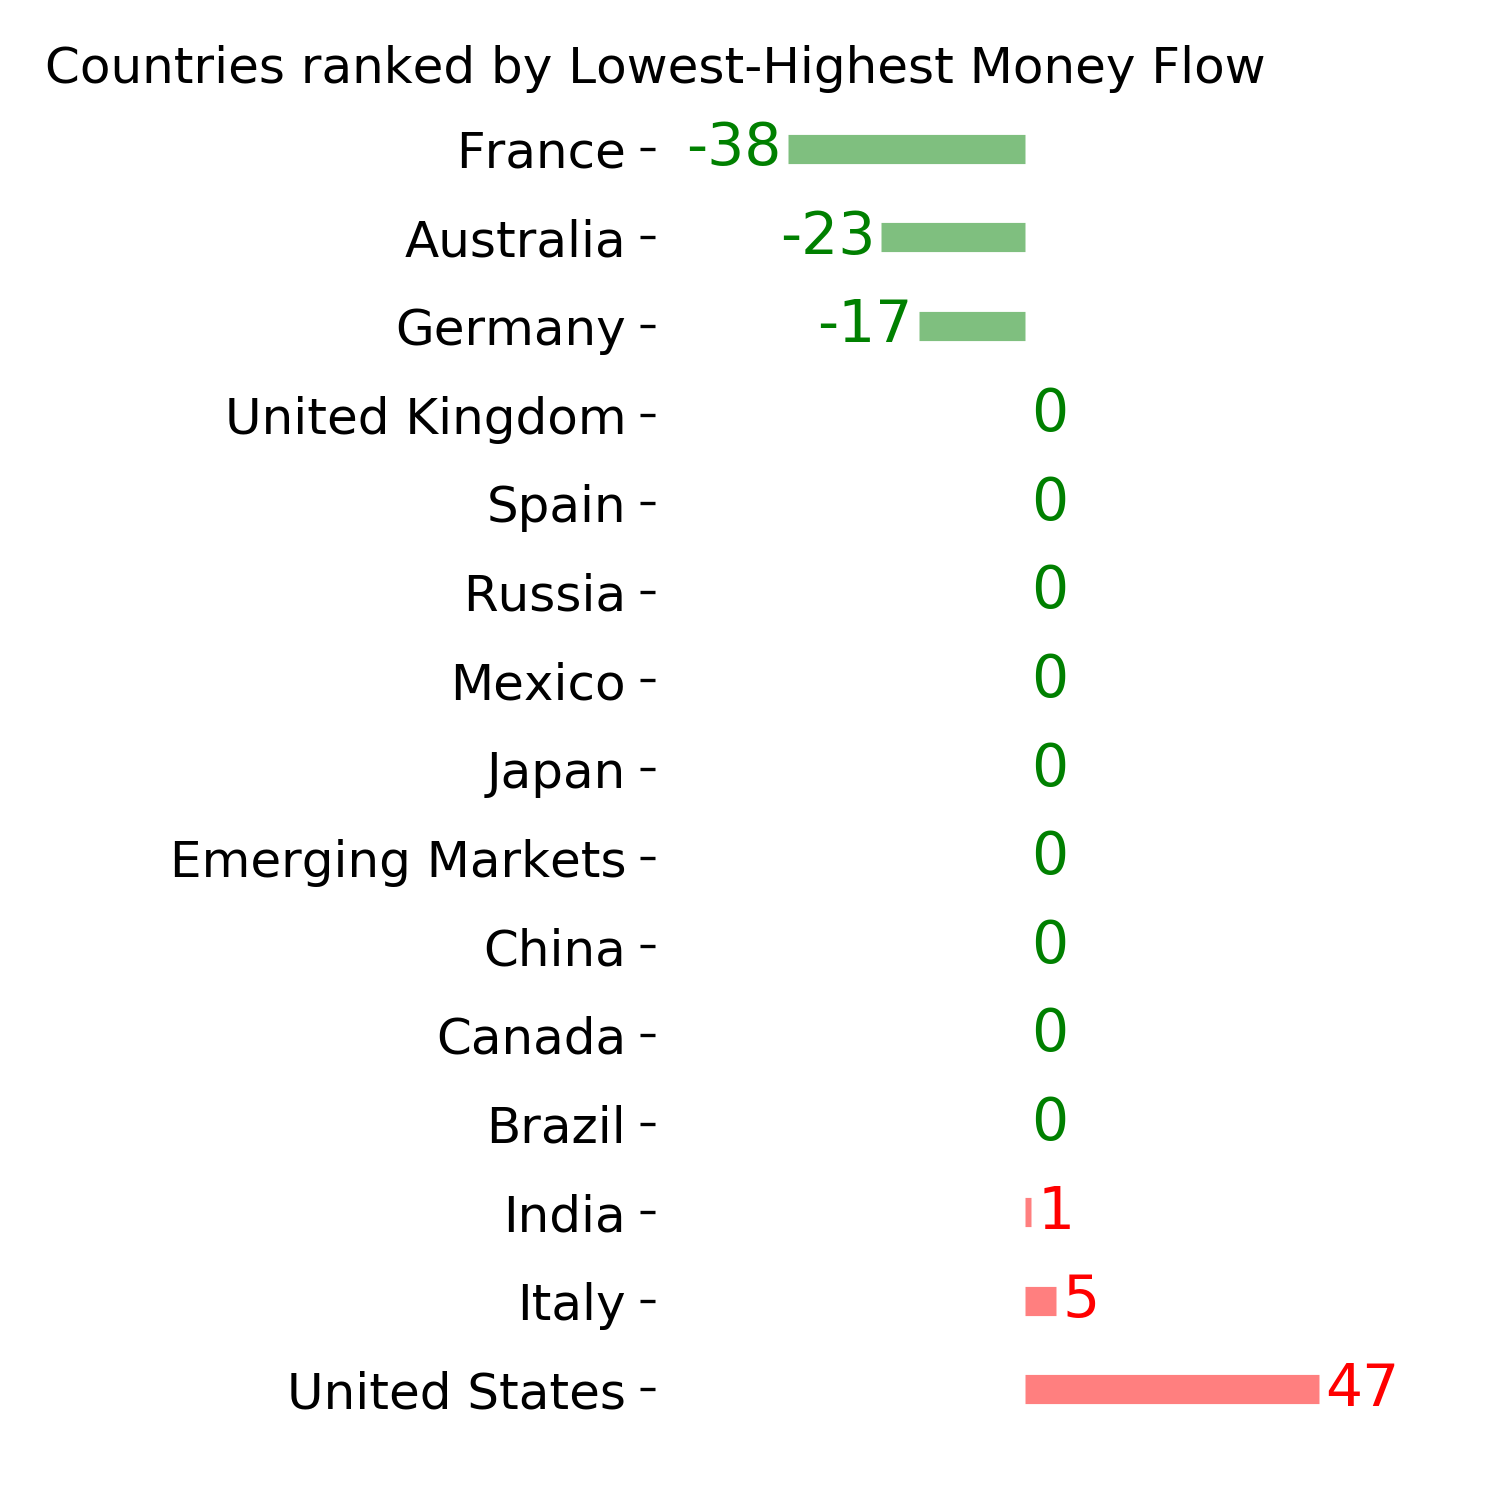
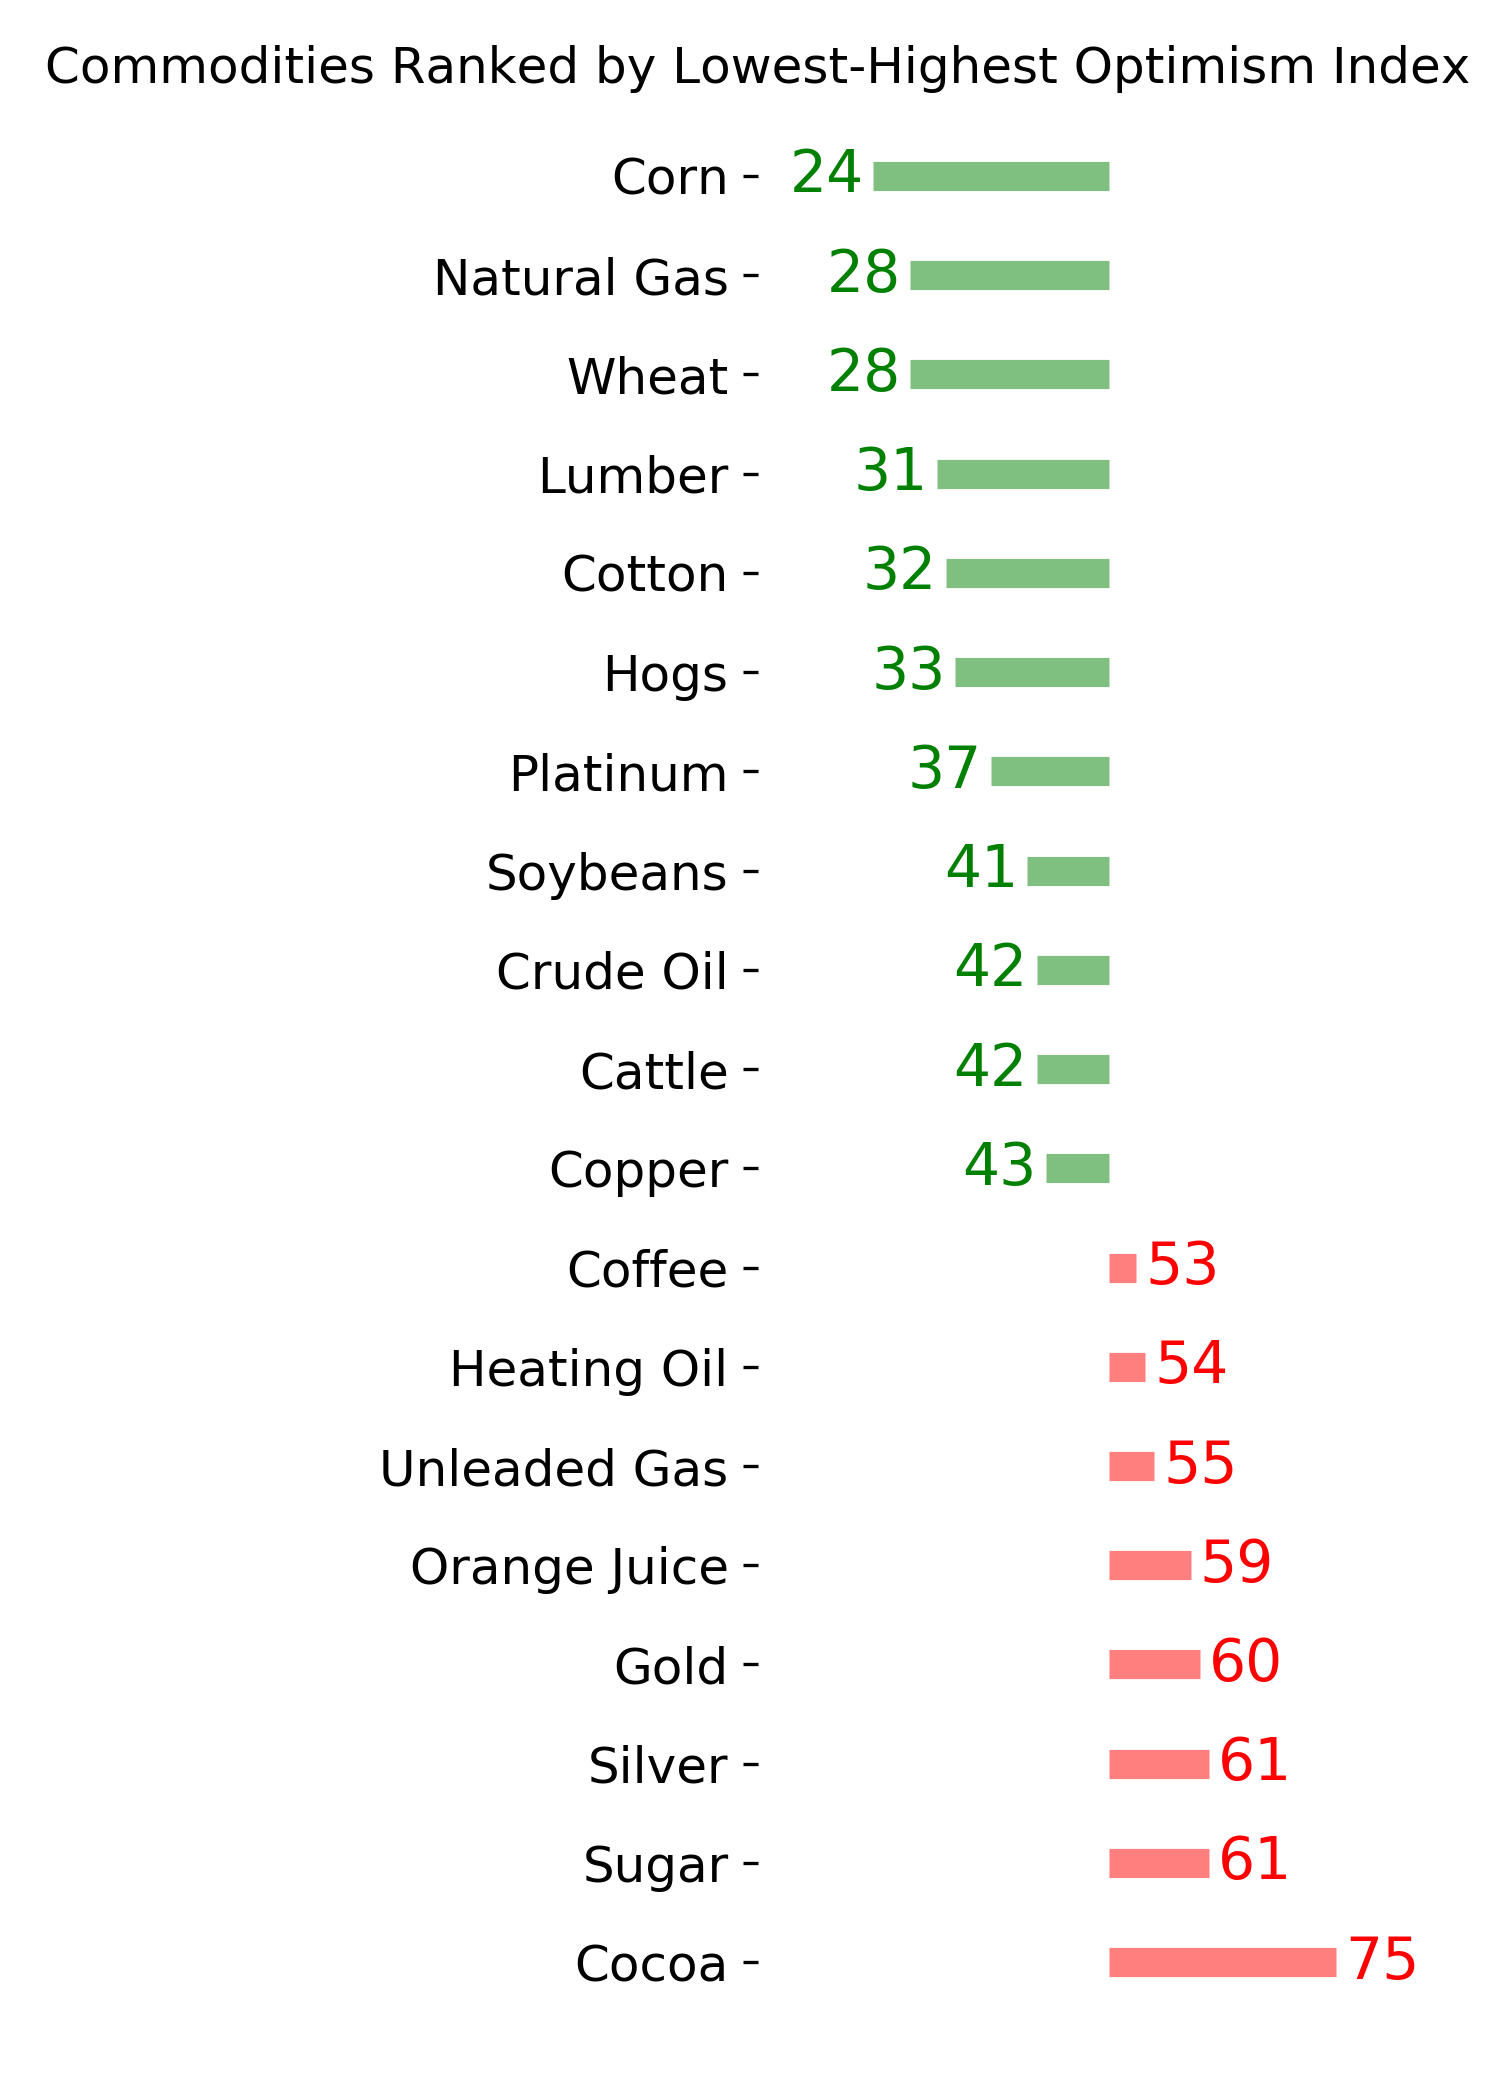
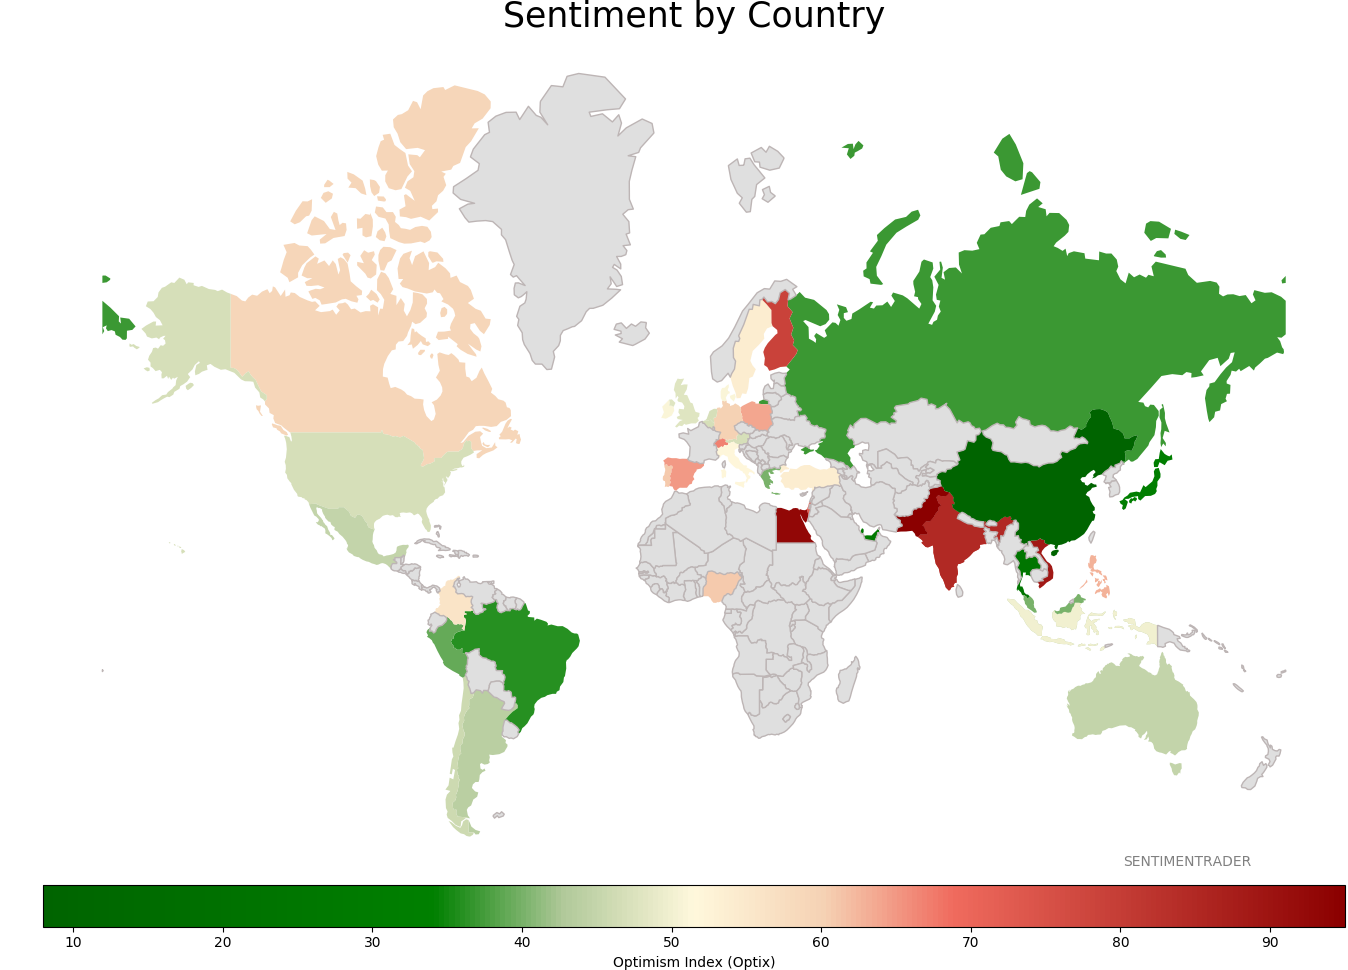
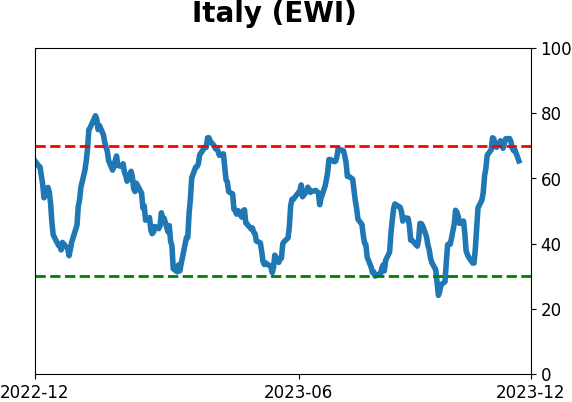
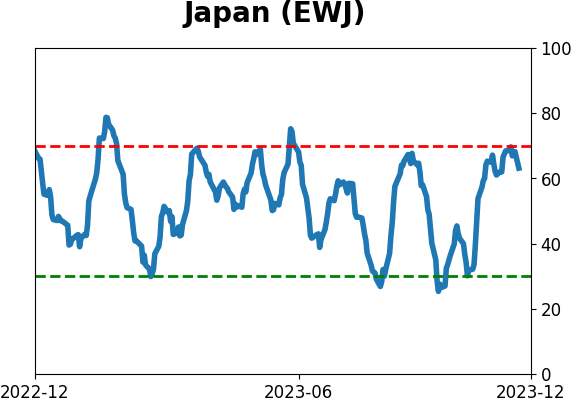
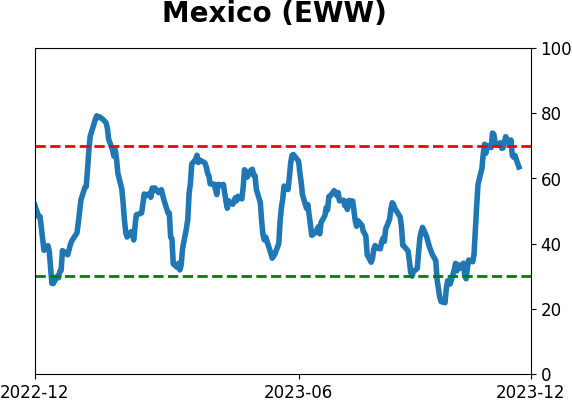
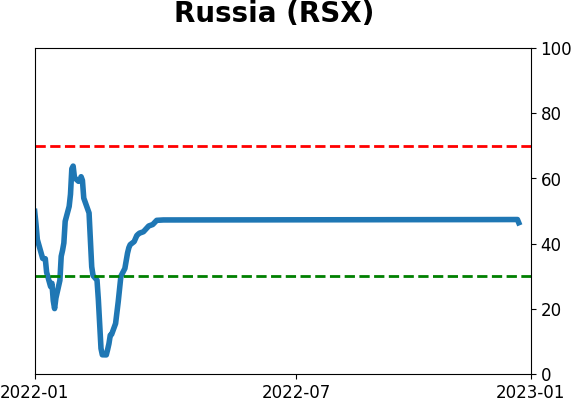
Sentiment Around The World
Optimism Index Thumbnails
|
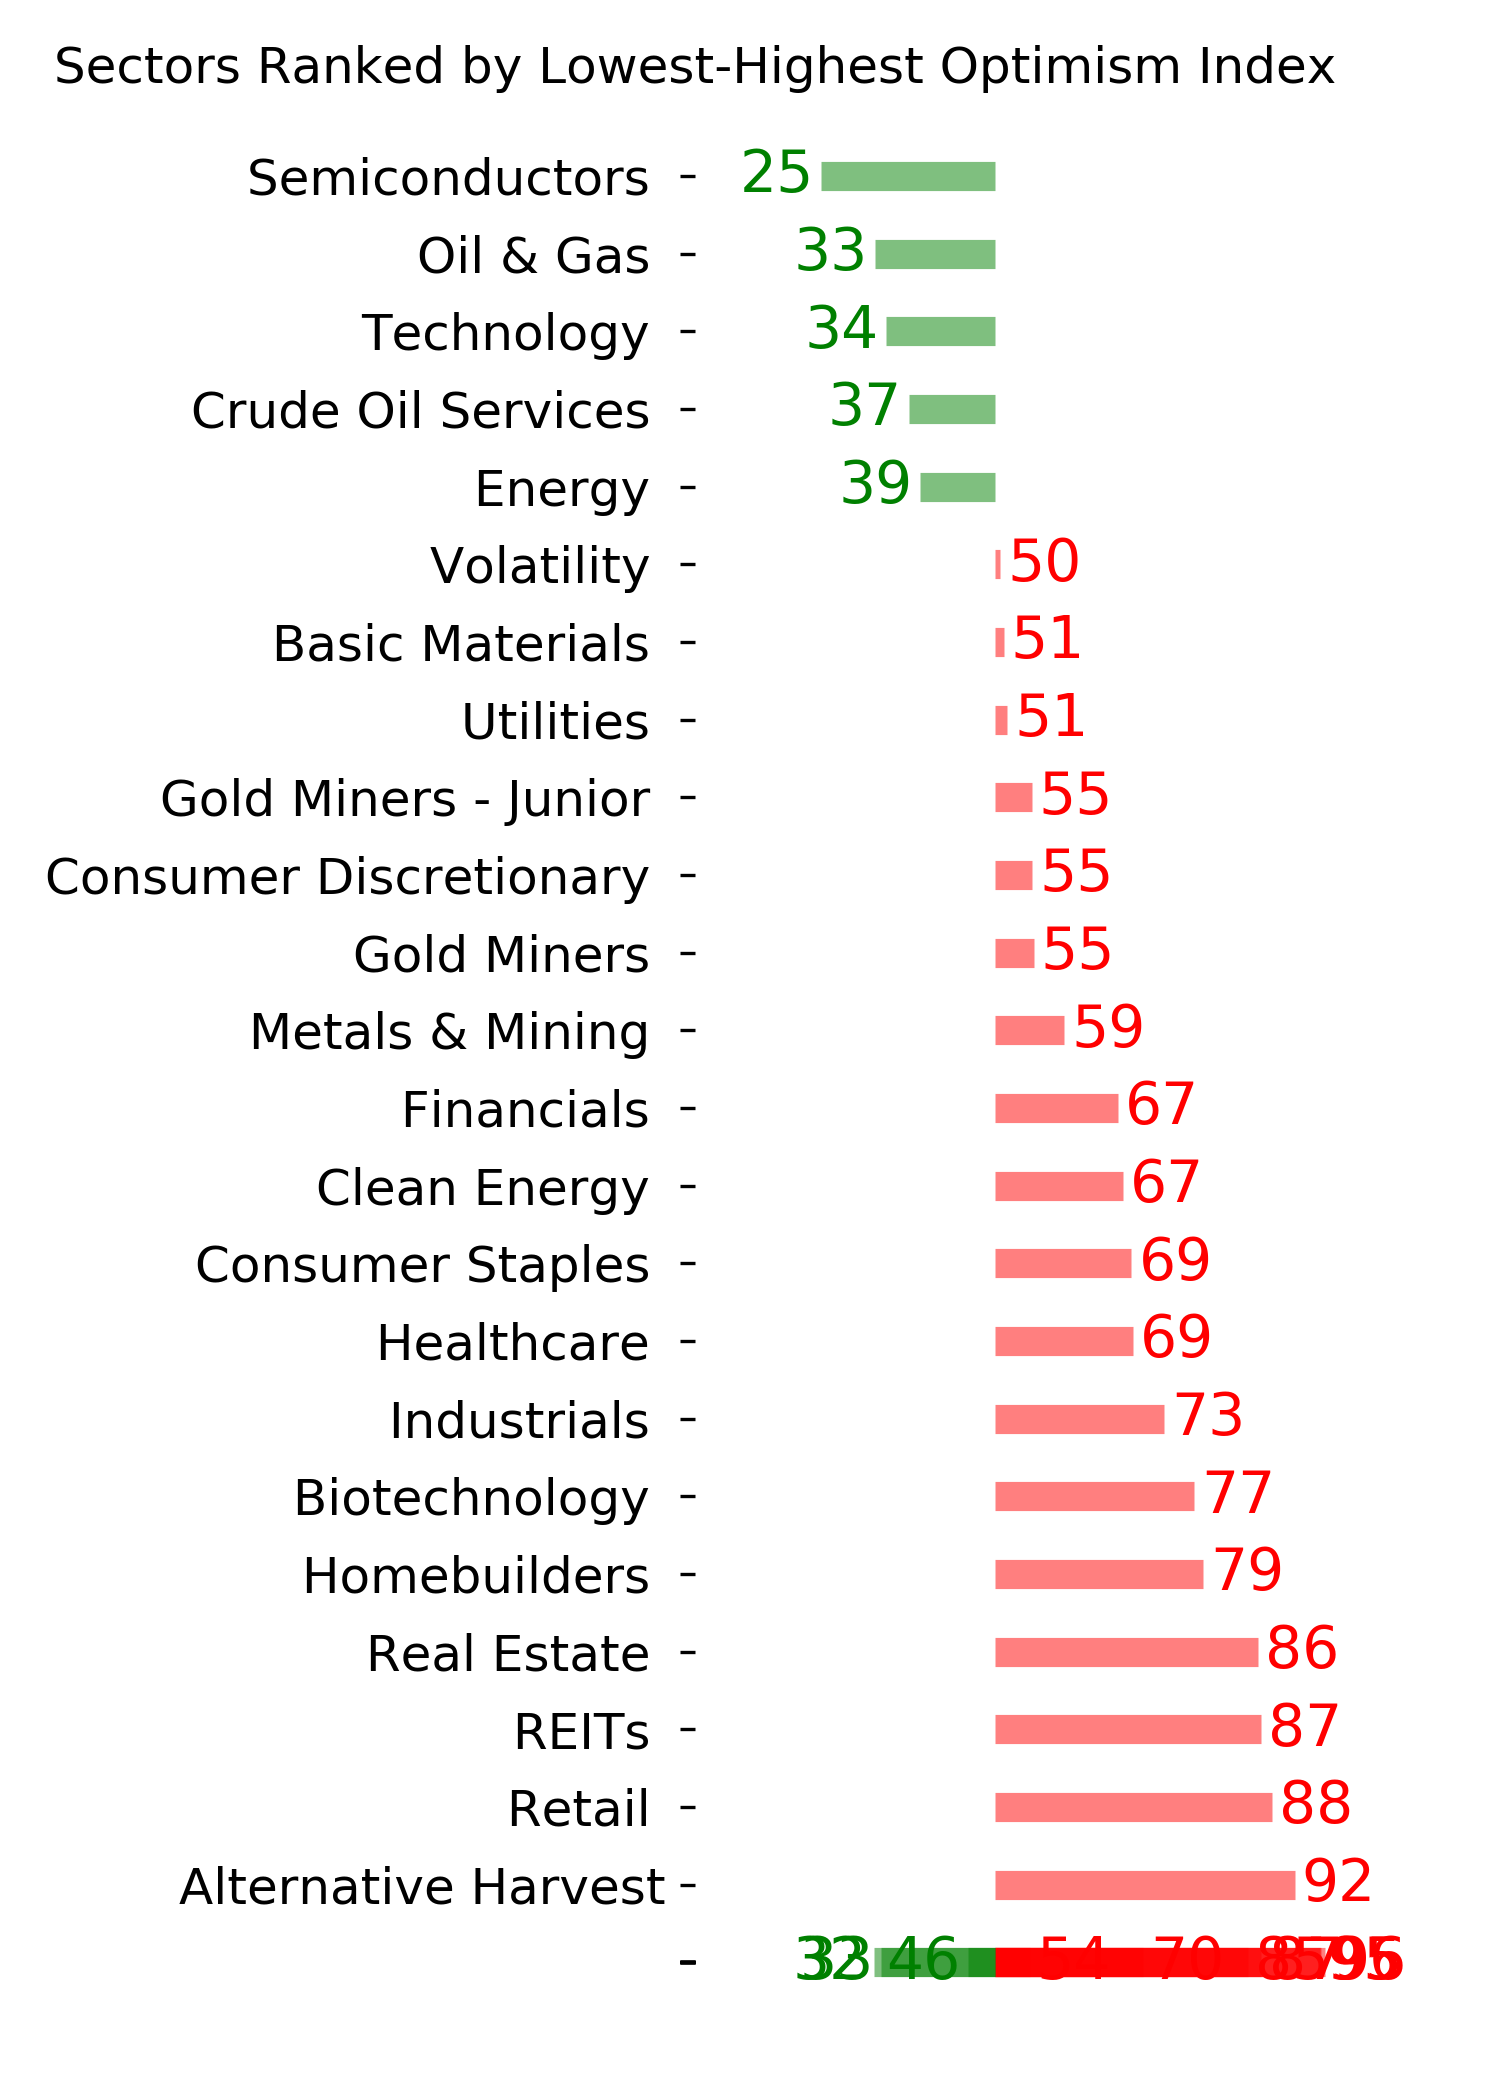
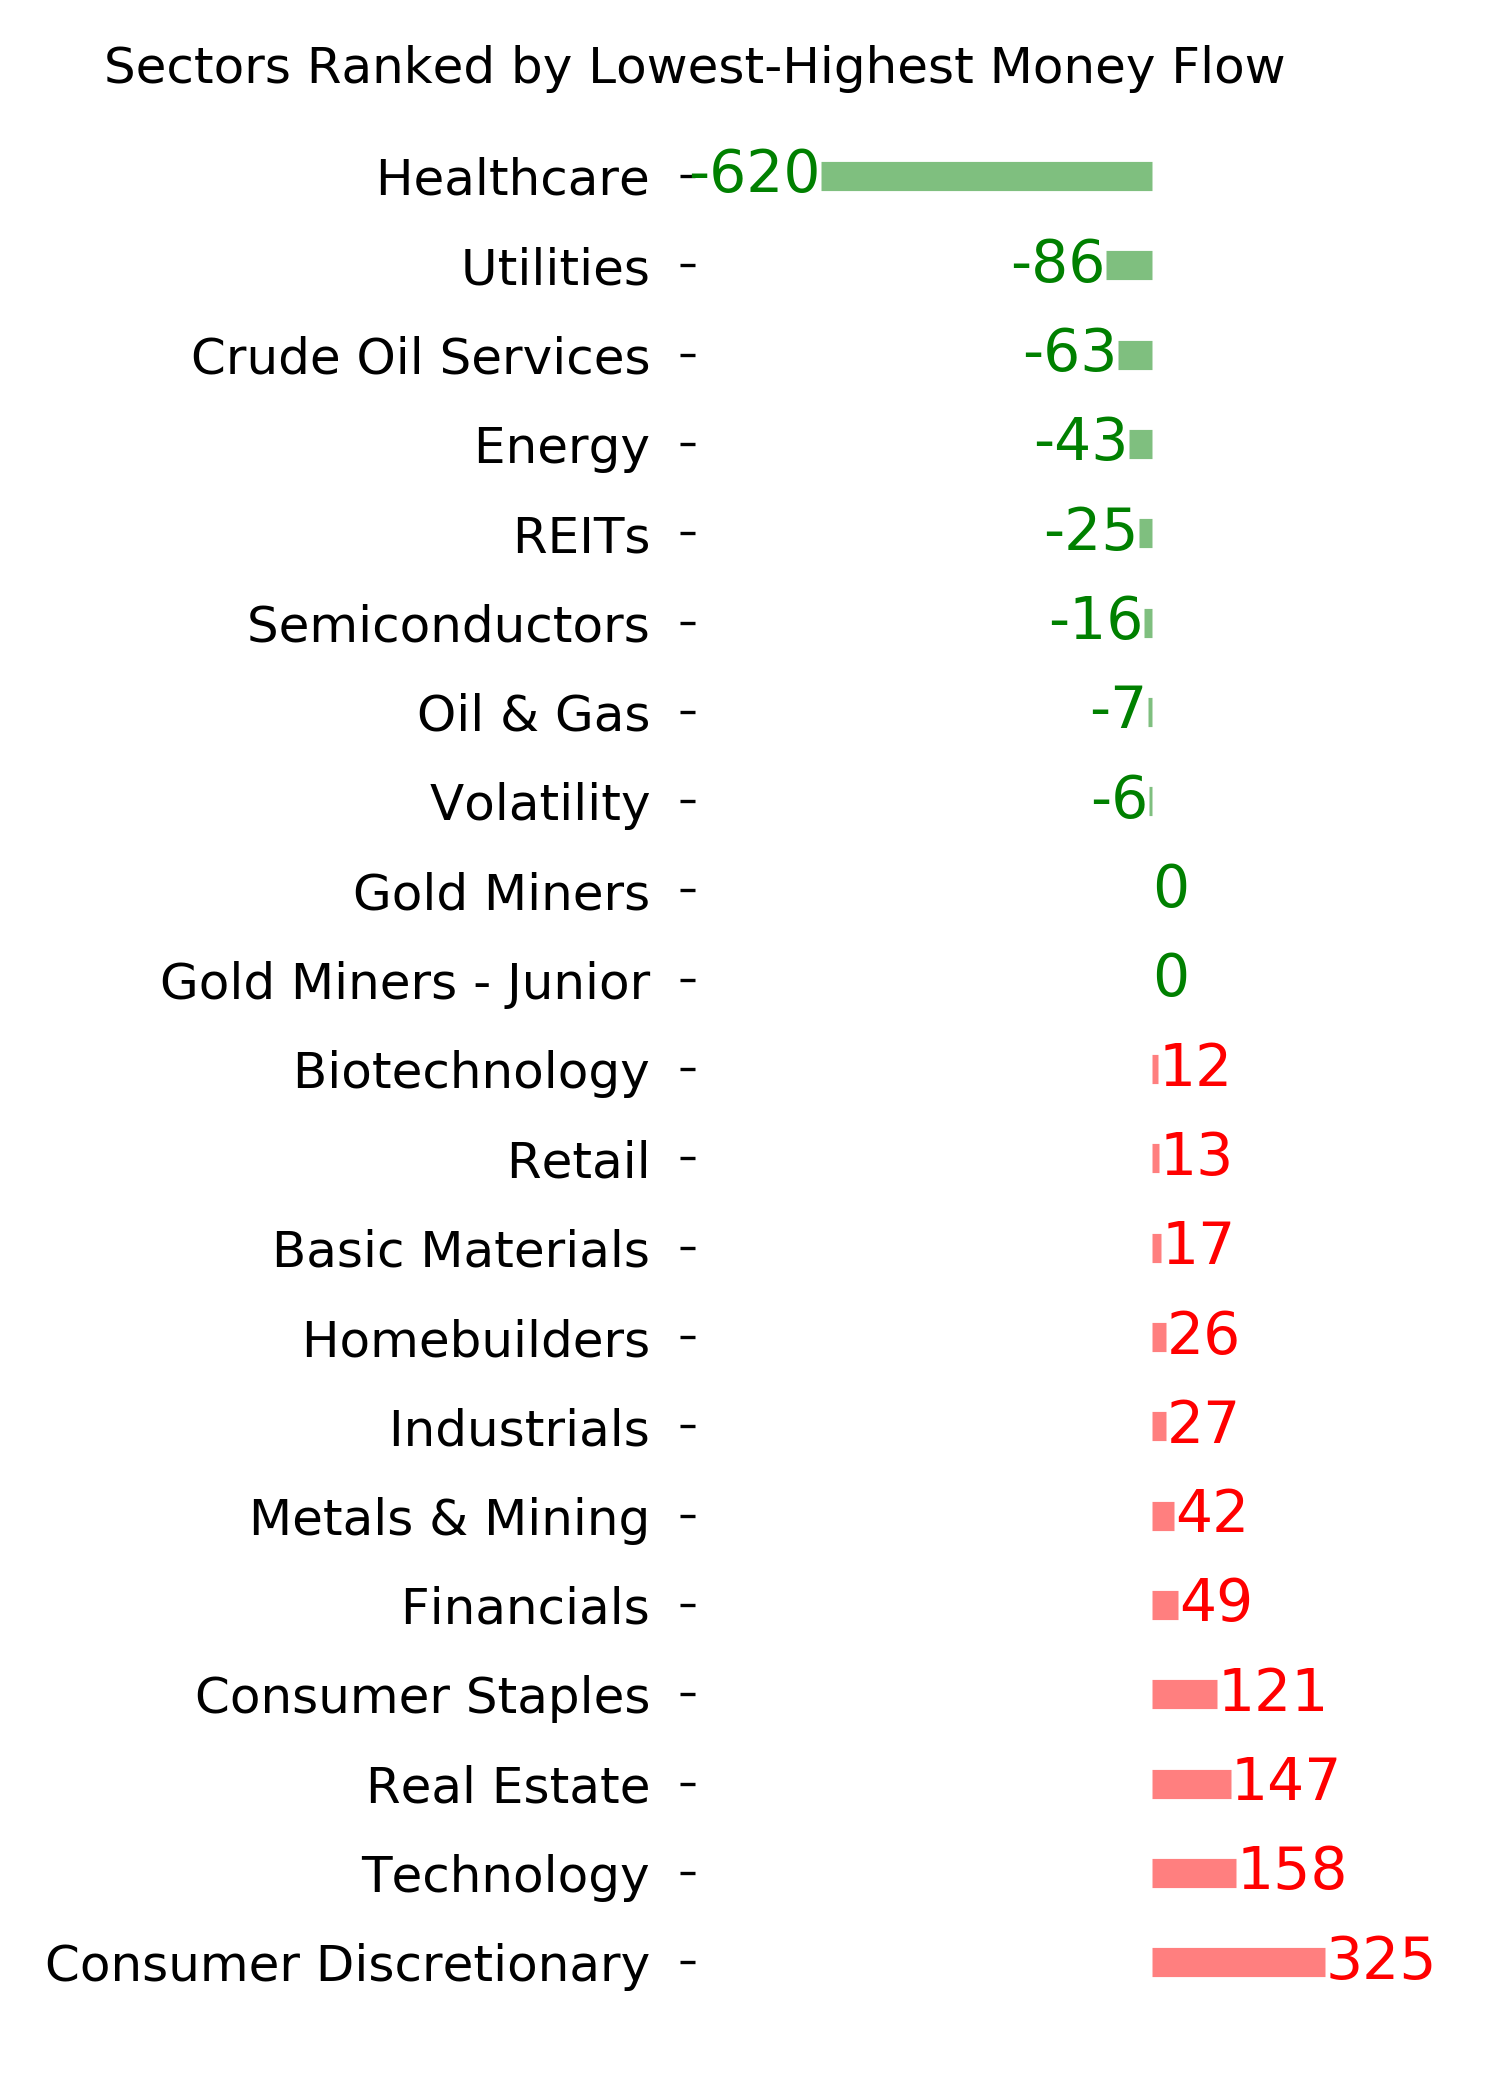
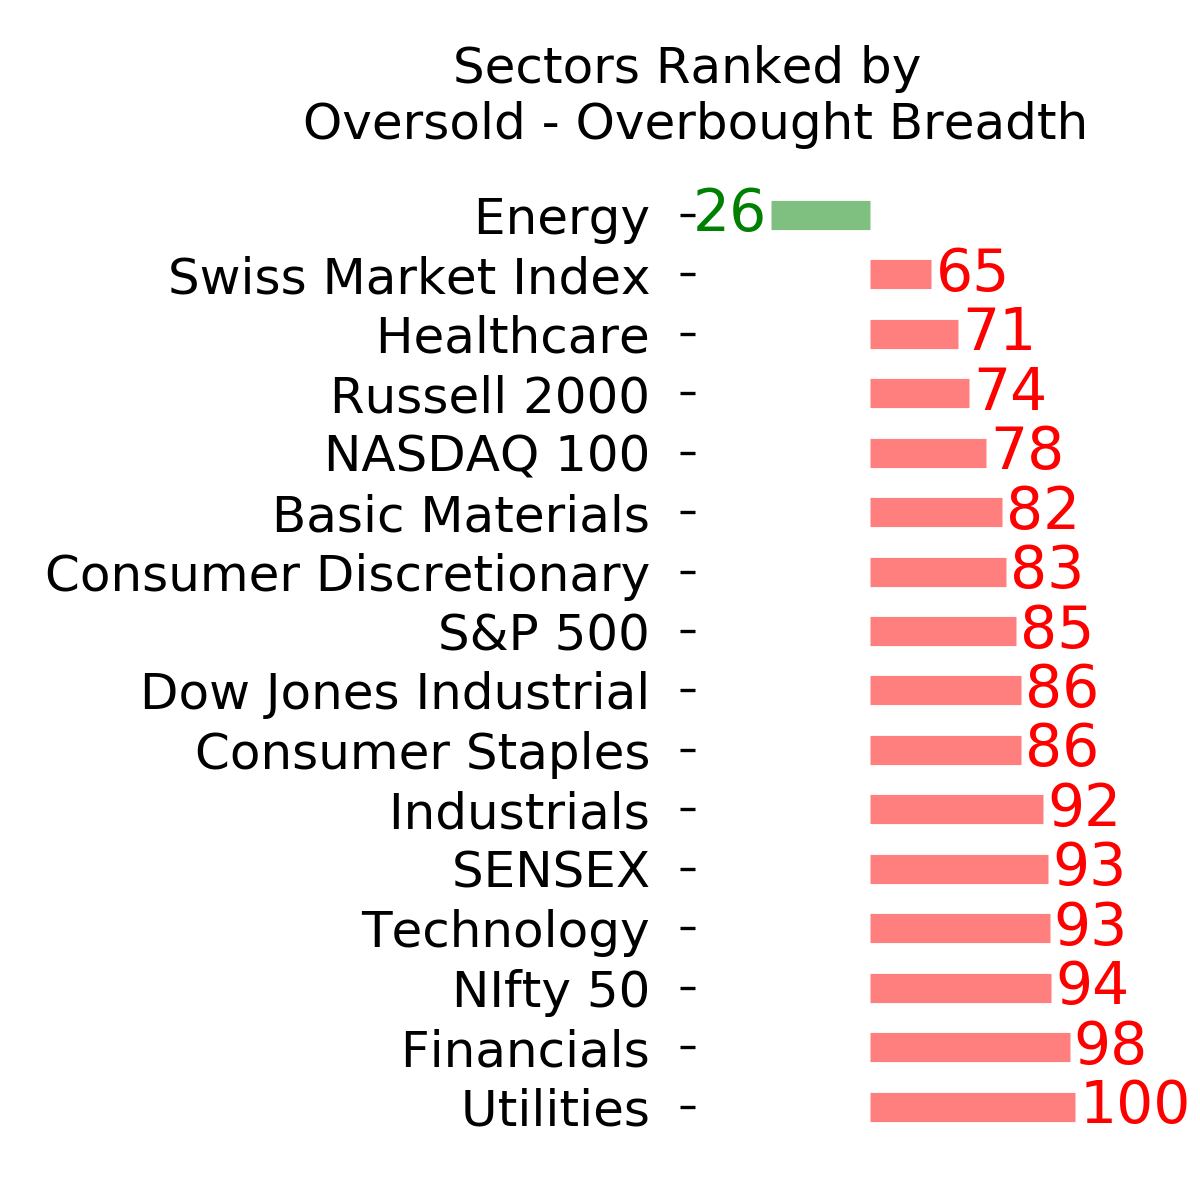
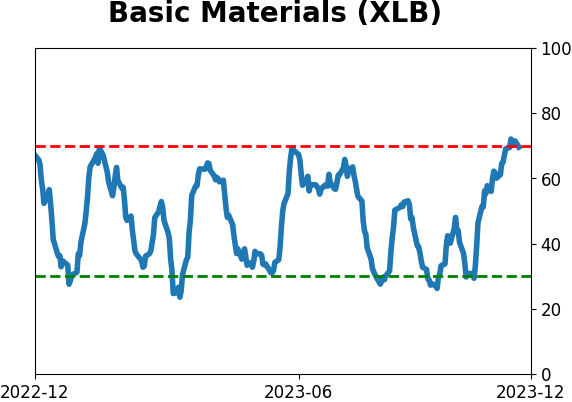
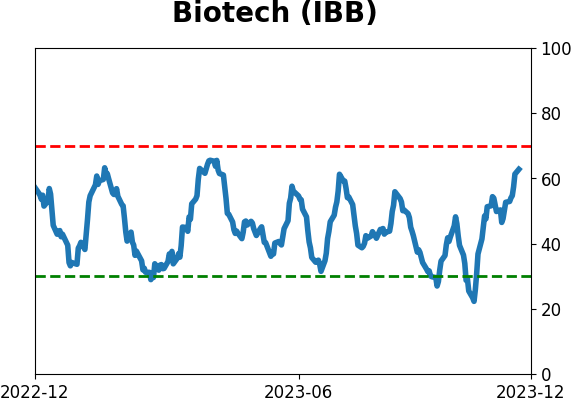
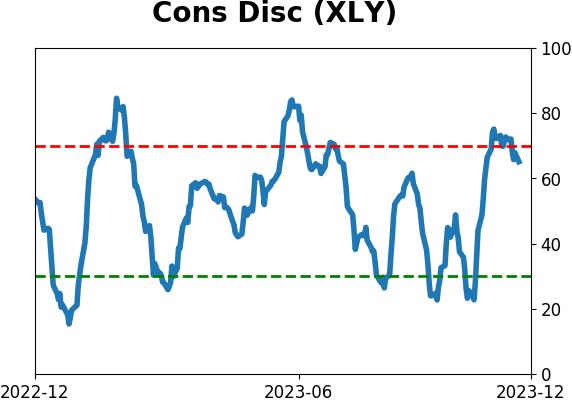
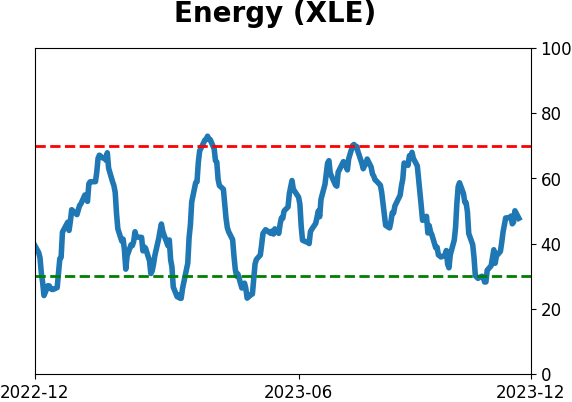
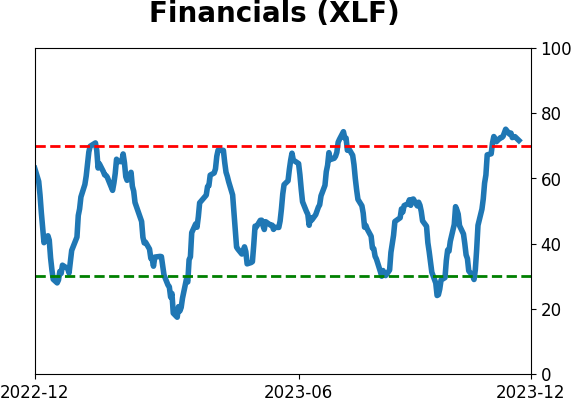
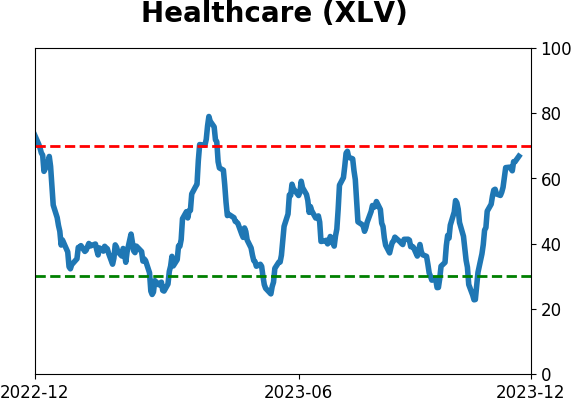
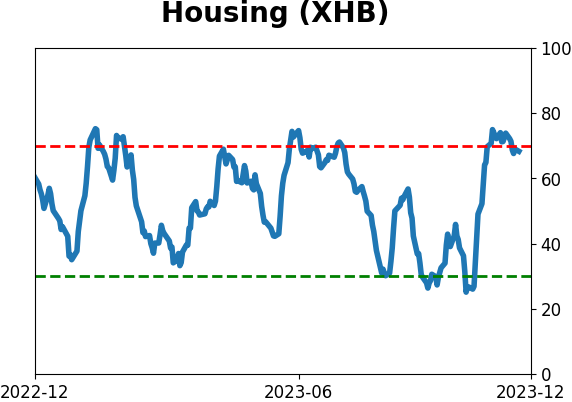
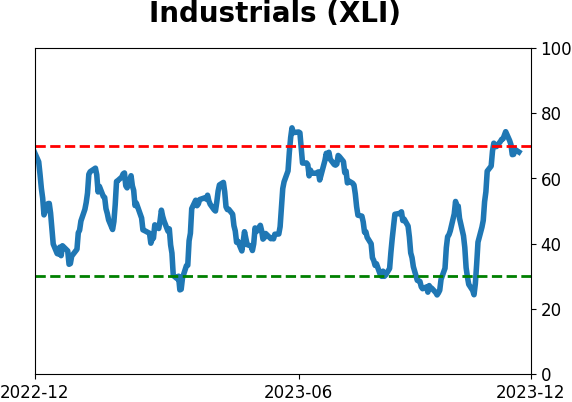
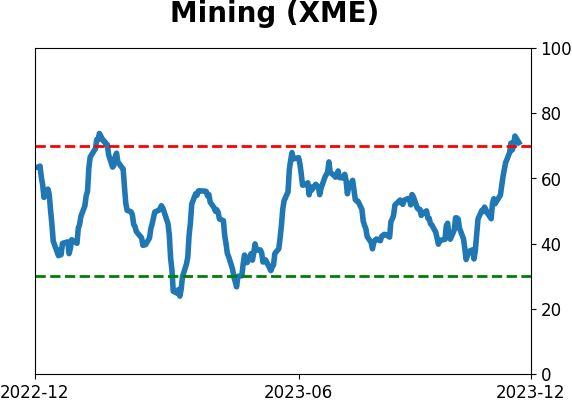
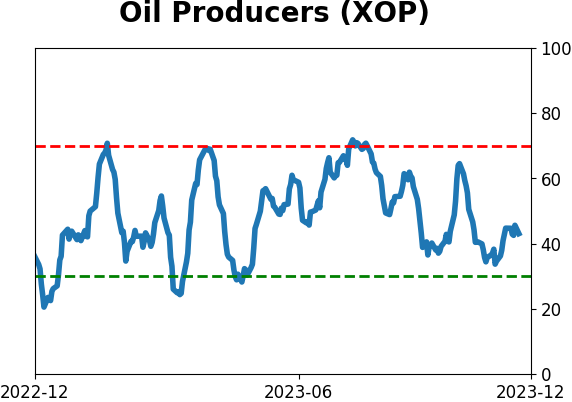
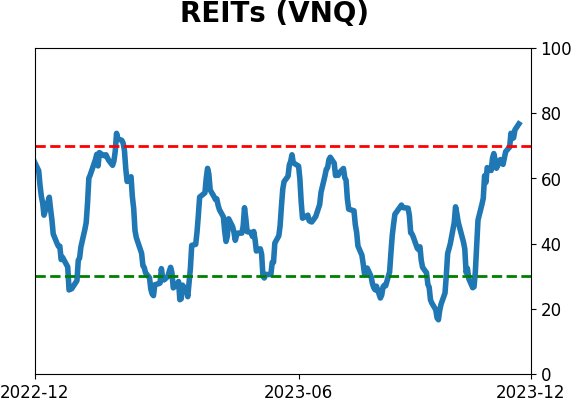
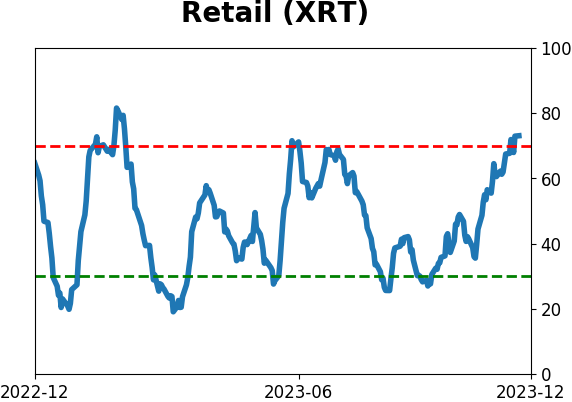
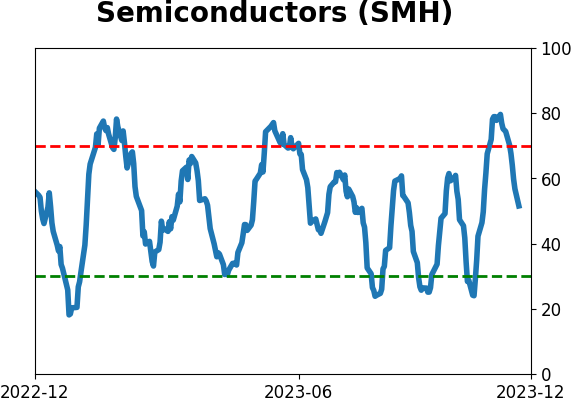
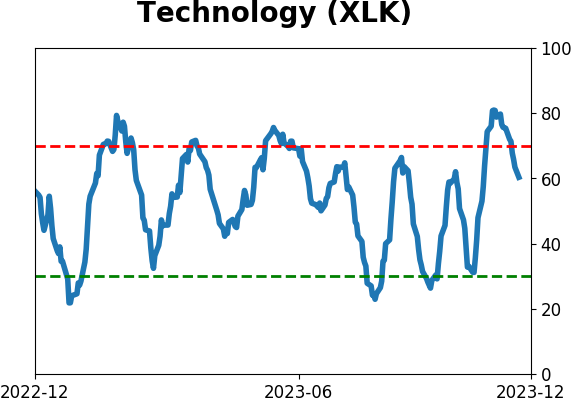
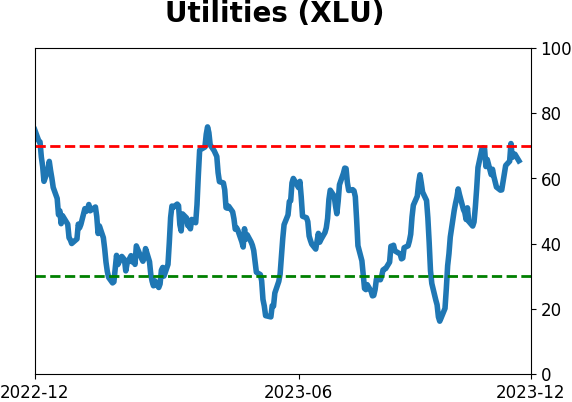
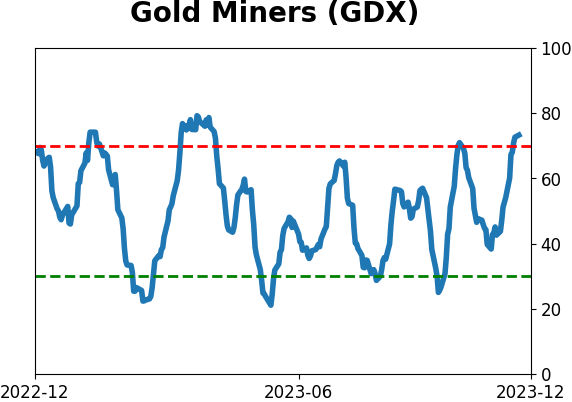
Sector ETF's - 10-Day Moving Average
|
|
|
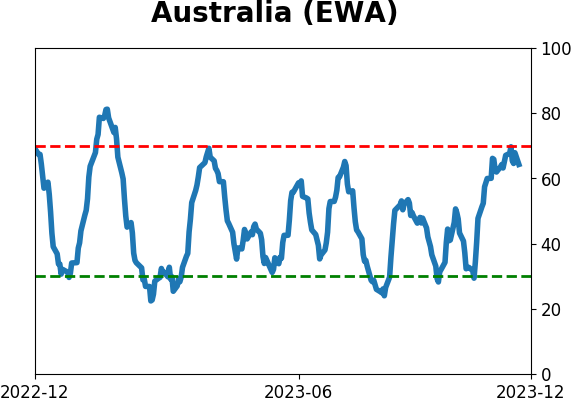
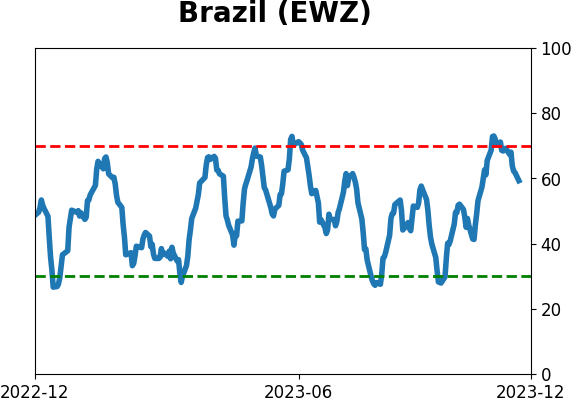
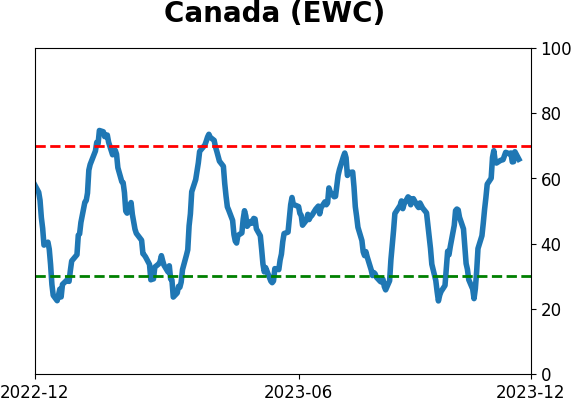
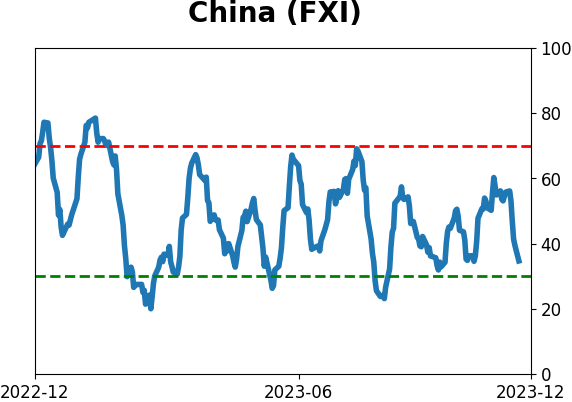
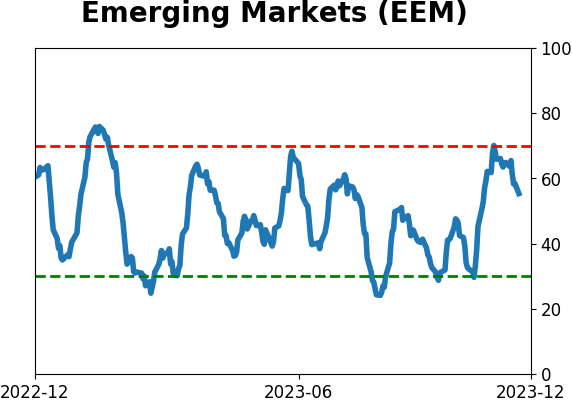
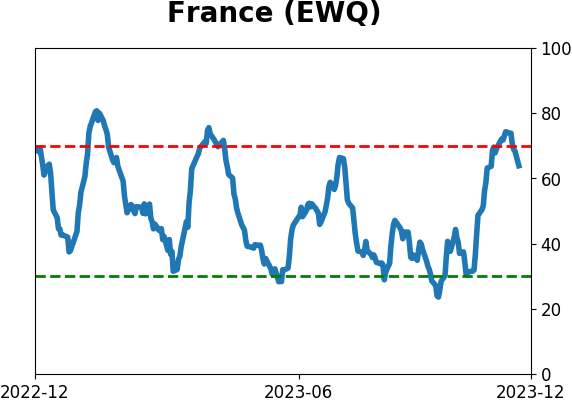
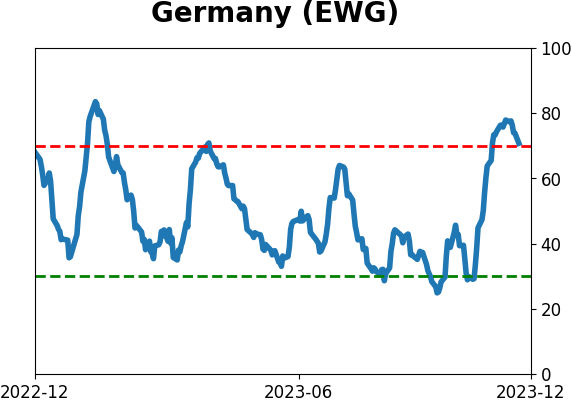
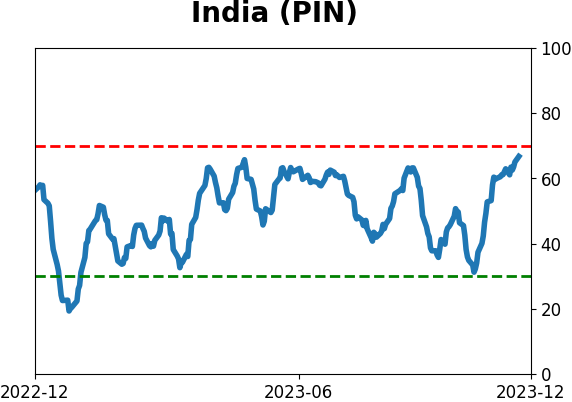
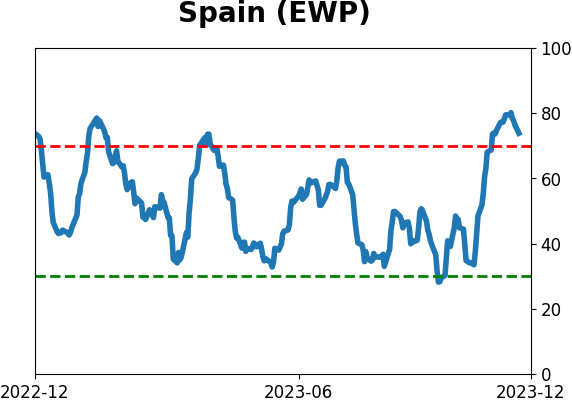
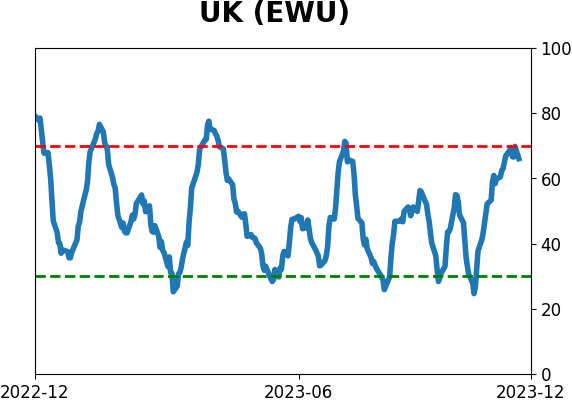
Country ETF's - 10-Day Moving Average
|
|
|
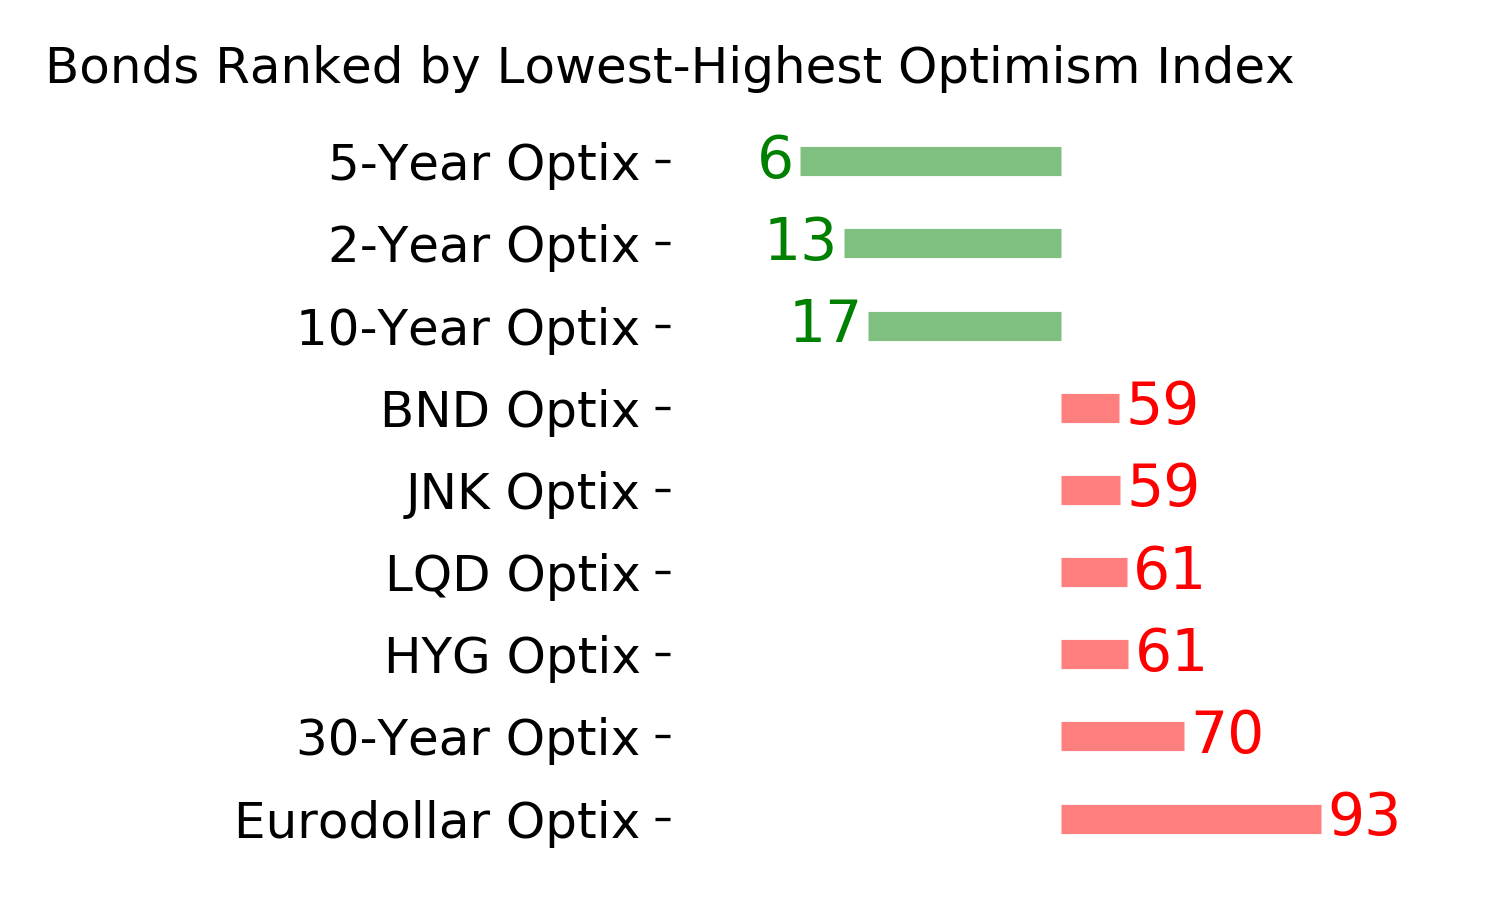
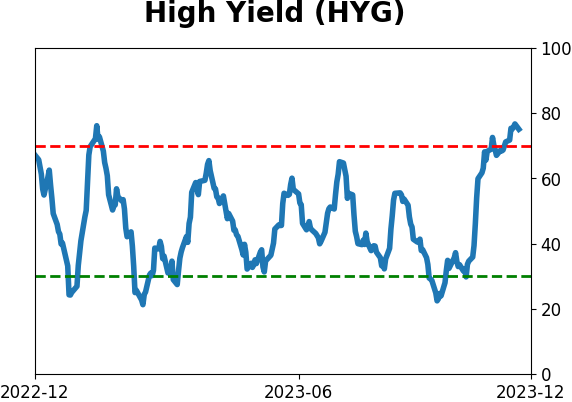
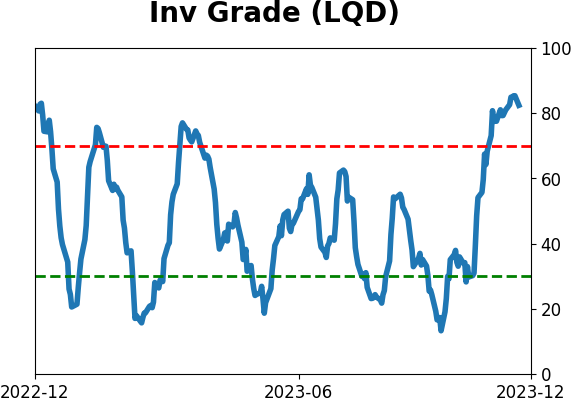
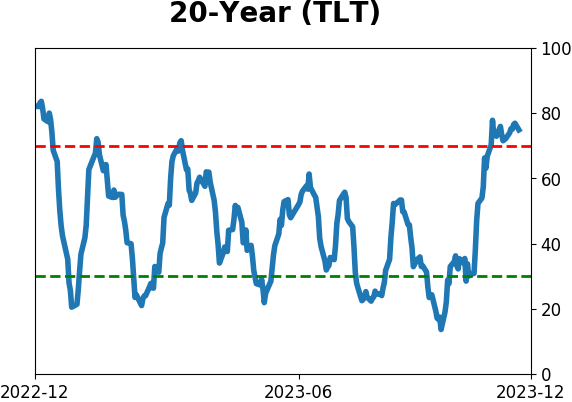
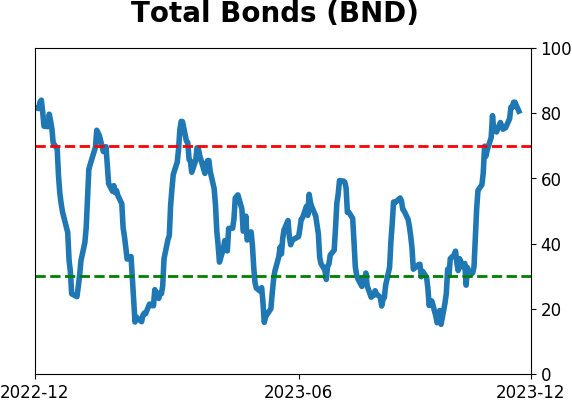
Bond ETF's - 10-Day Moving Average
|
|
|
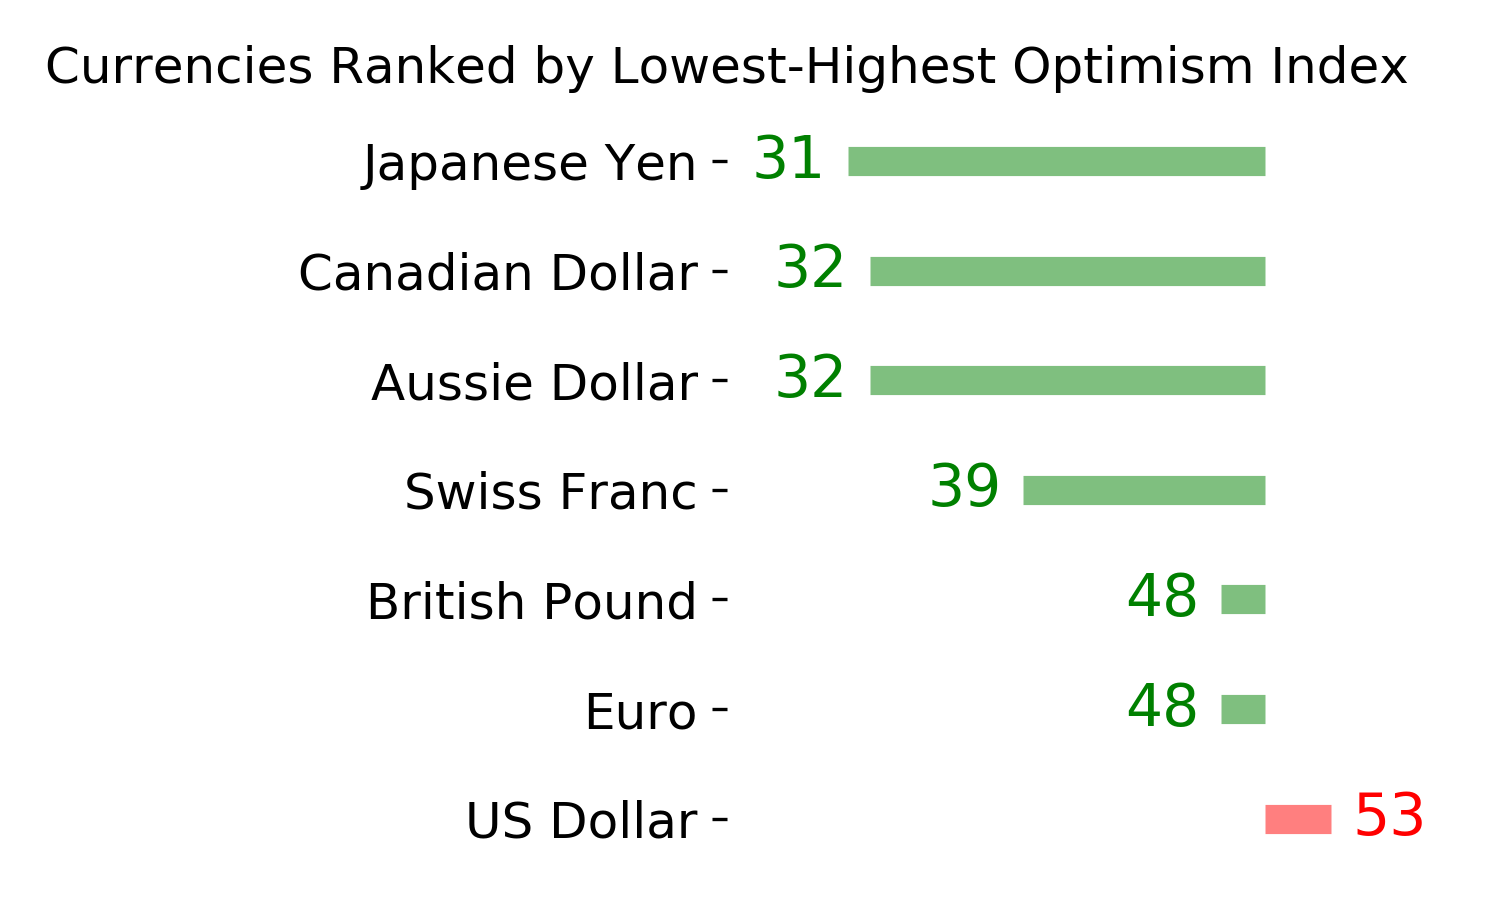
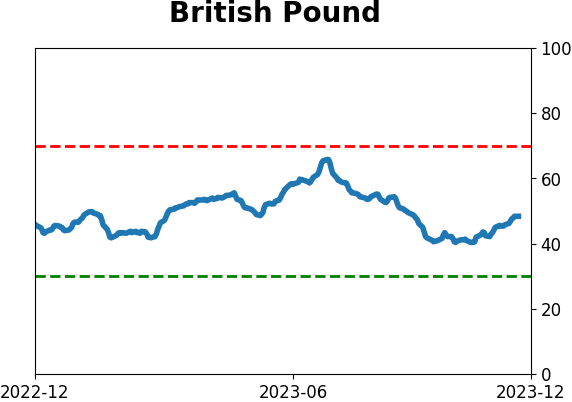
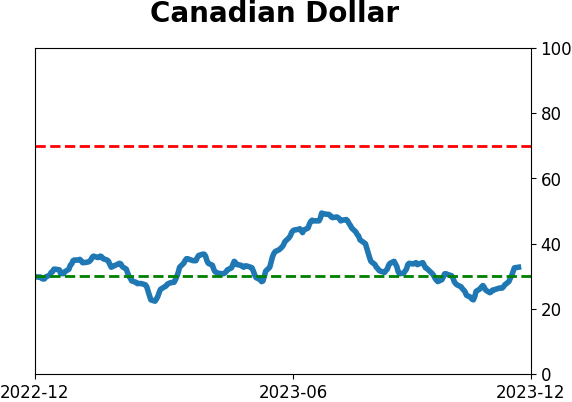
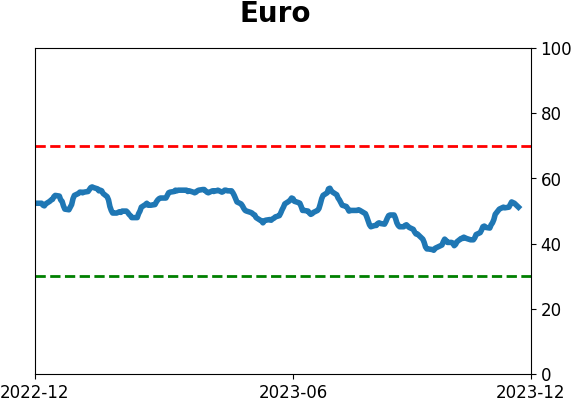
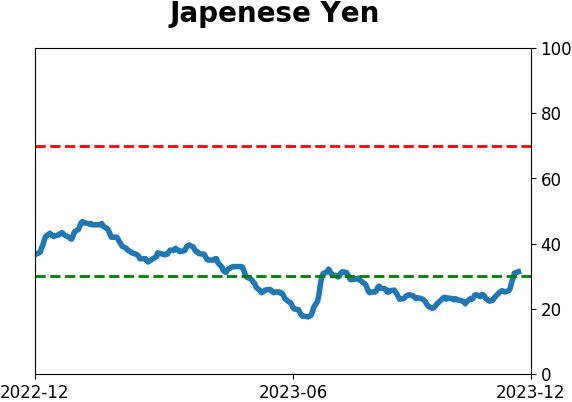
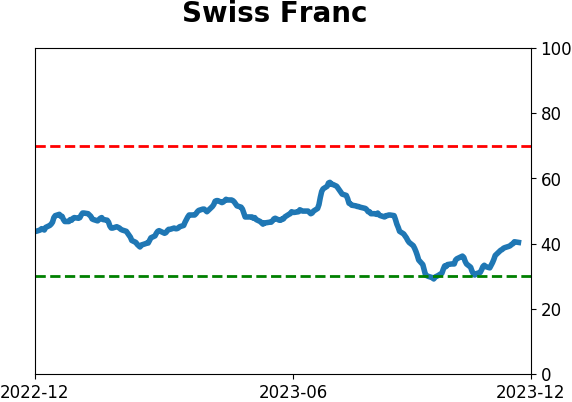
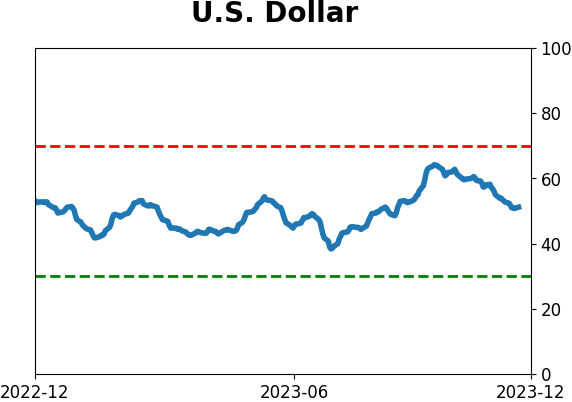
Currency ETF's - 5-Day Moving Average
|
|
|
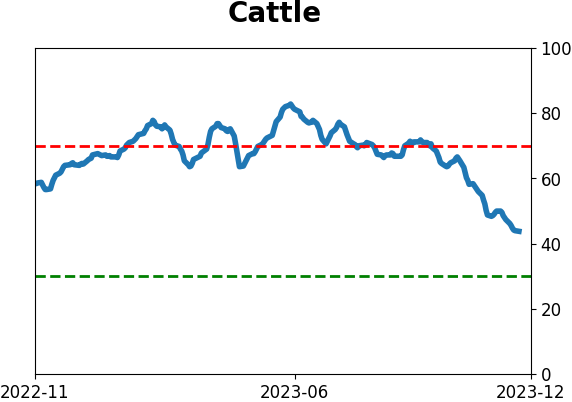
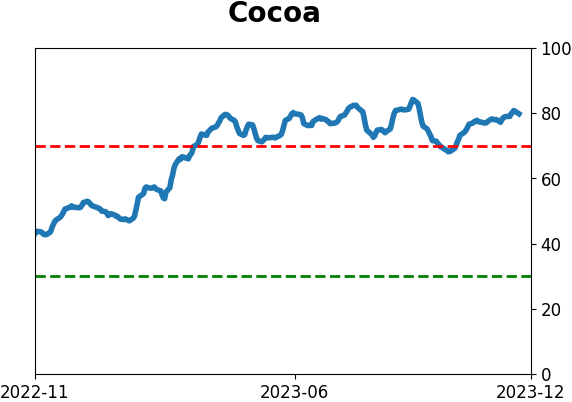
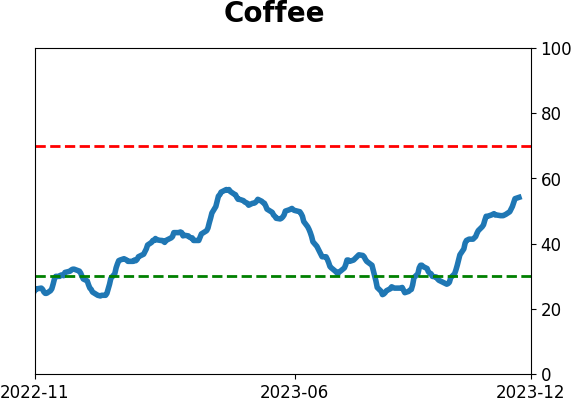
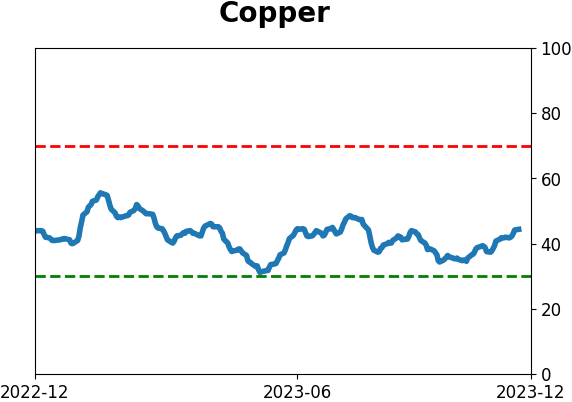
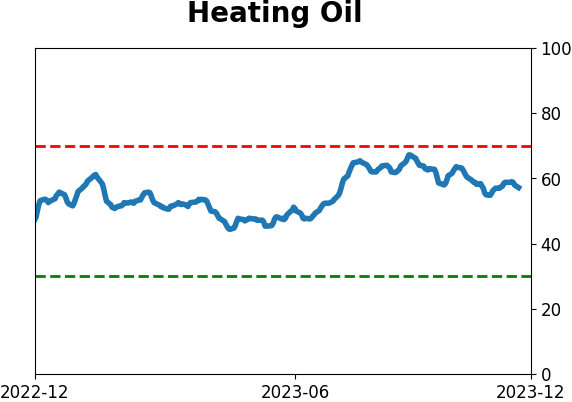
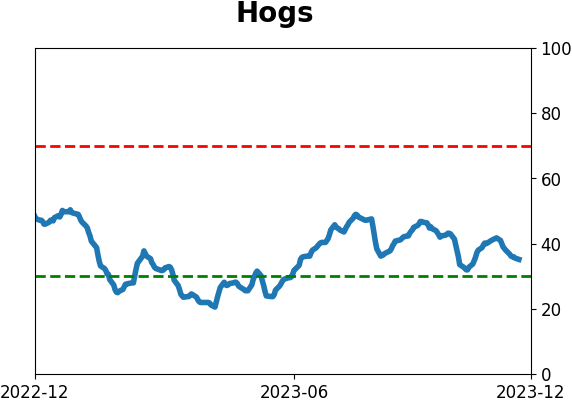
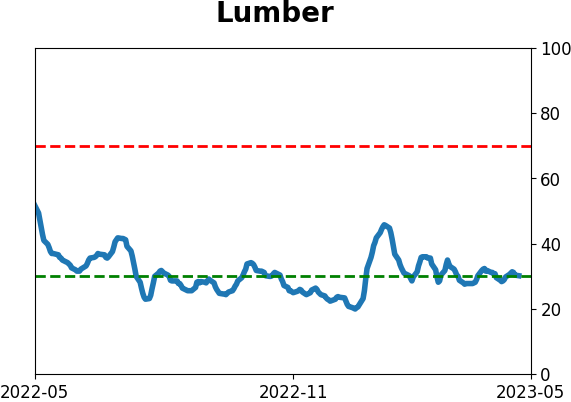
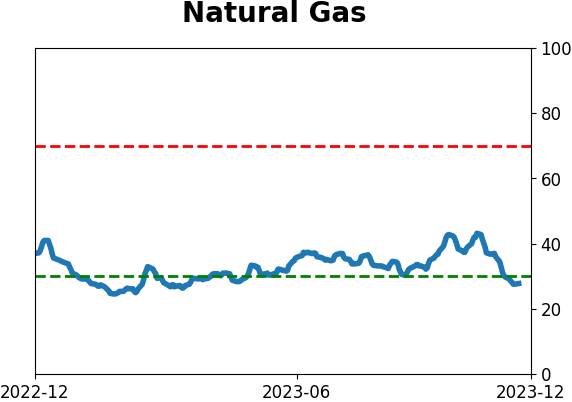
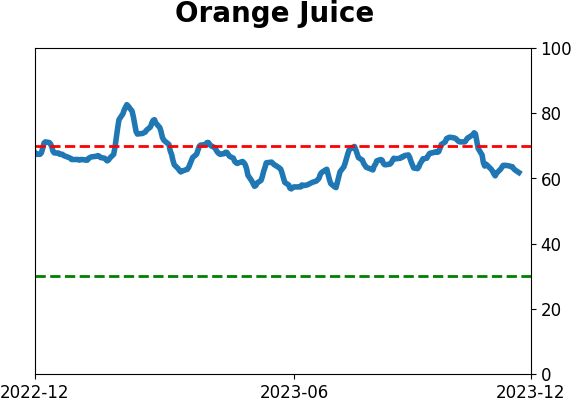
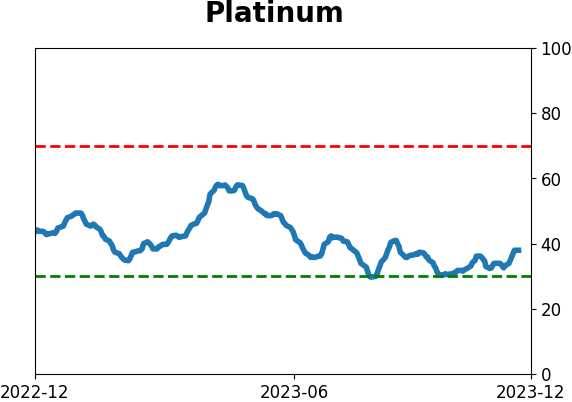
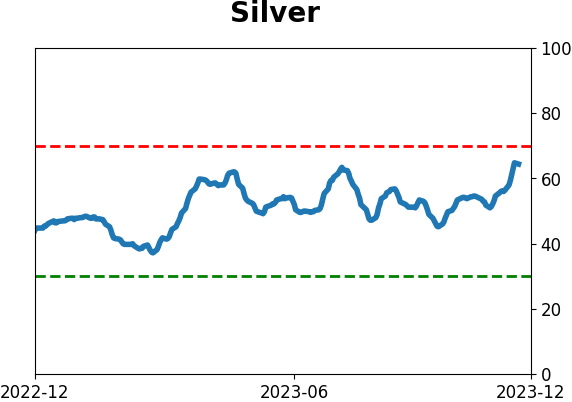
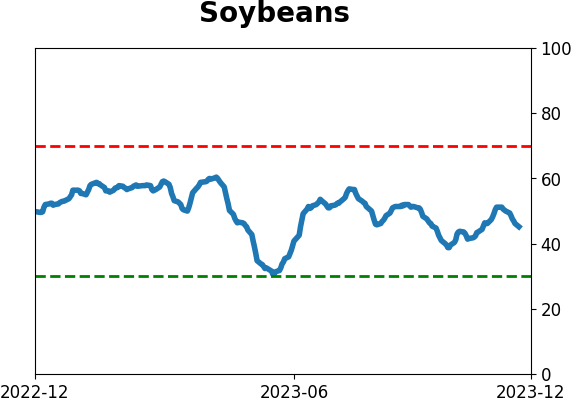
Commodity ETF's - 5-Day Moving Average
|
|