Headlines
|
|
Long-term trends are recovering across the globe:
More than three-quarters of major global equity indexes are trading above their 200-day moving averages. This comes soon after all of them were below their averages. Similar cycles tended to precede gains, or at least small losses, even up to a year later.
|
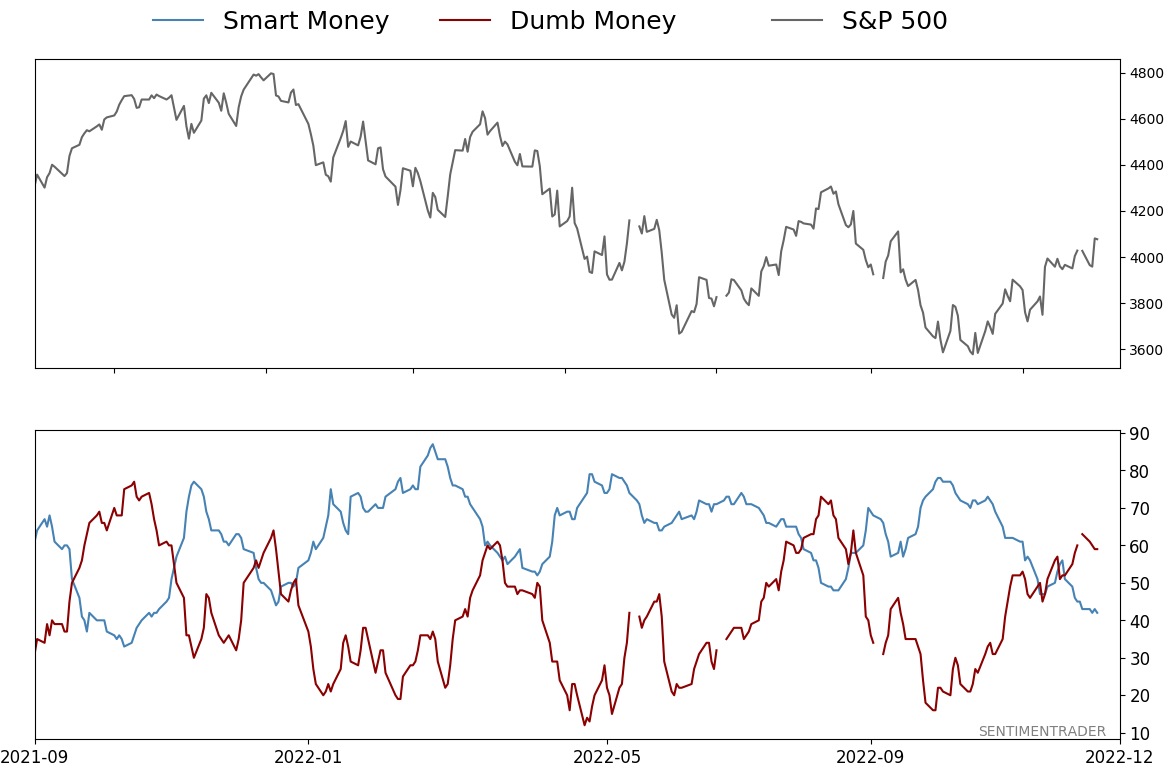
Smart / Dumb Money Confidence
|
Smart Money Confidence: 42%
Dumb Money Confidence: 59%
|
|
Risk Levels
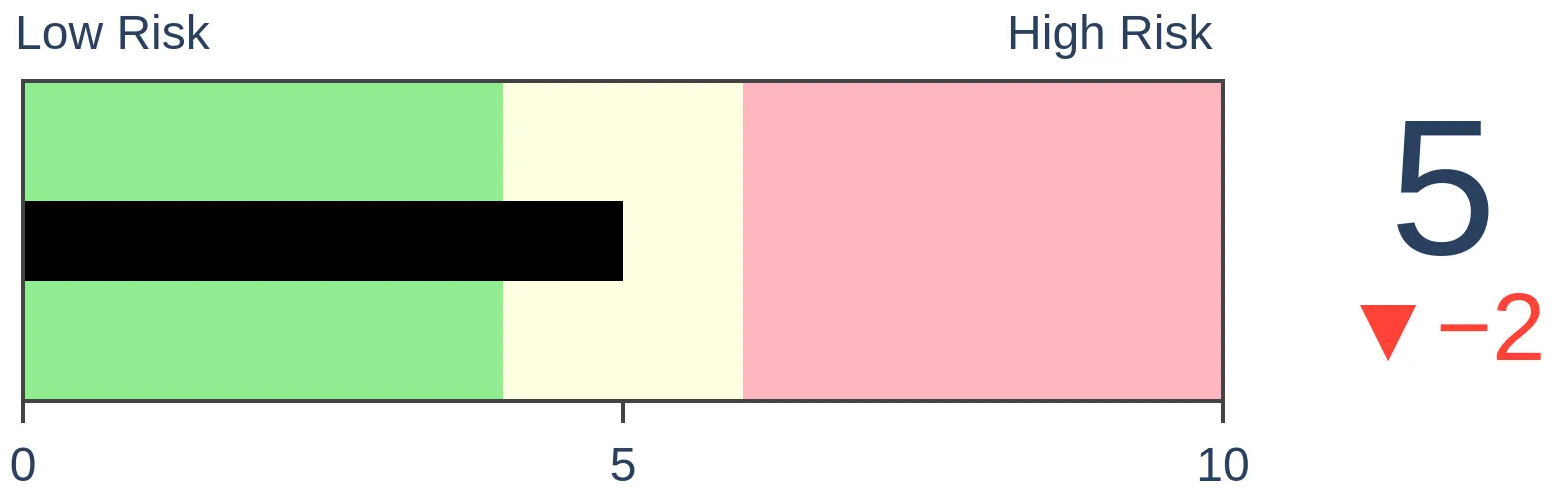
Stocks Short-Term
|
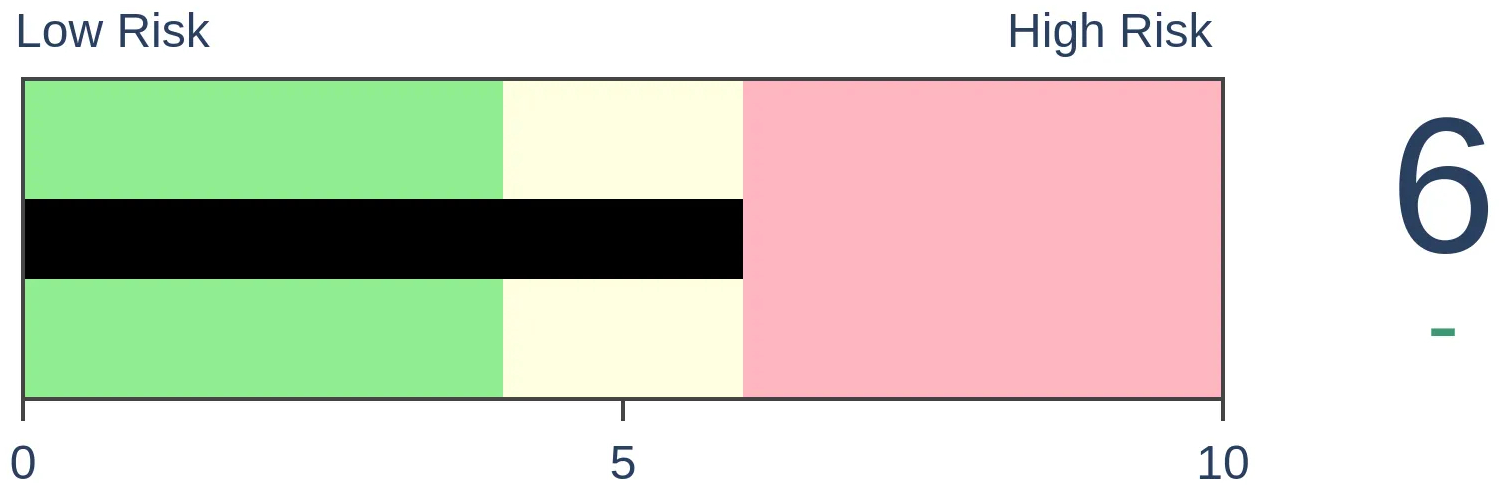
Stocks Medium-Term
|
|
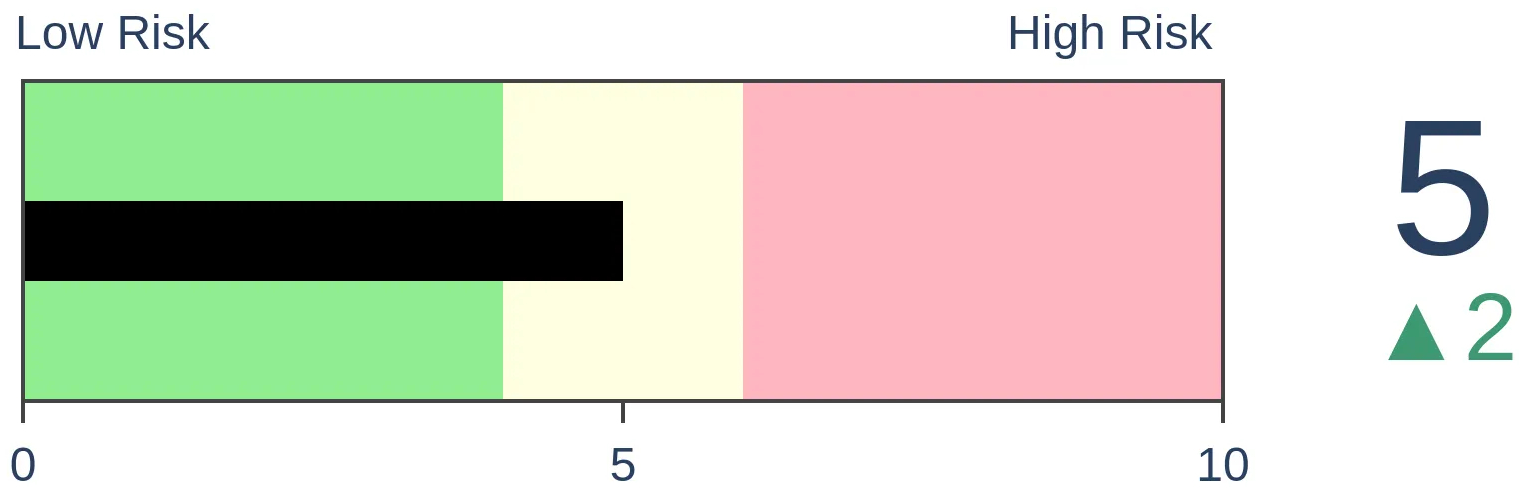
Bonds
|
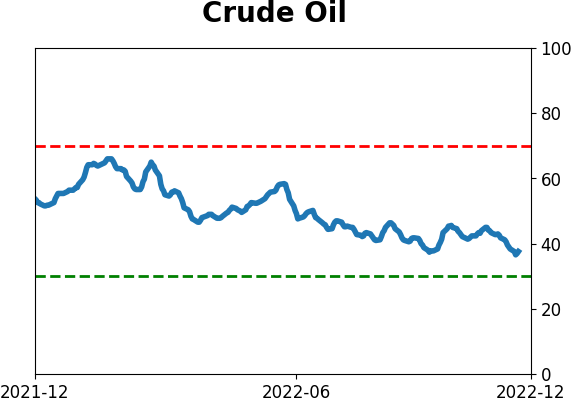
Crude Oil
|
|
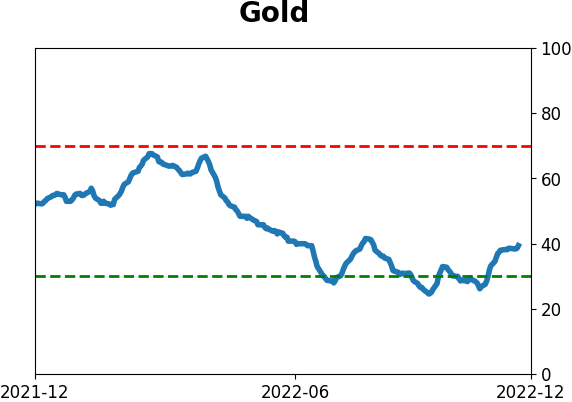
Gold
|
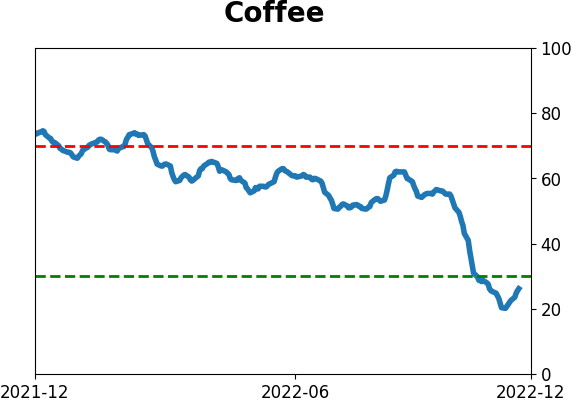
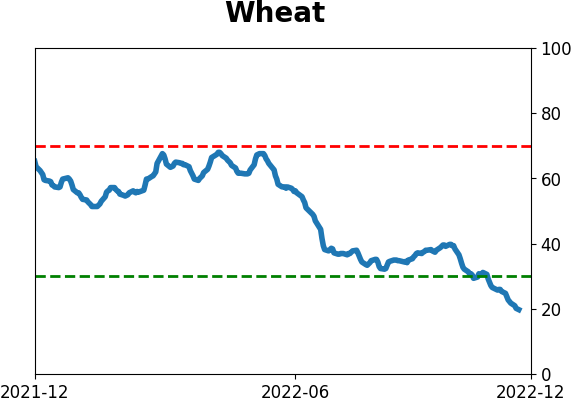
Agriculture
|
|
Research
By Jason Goepfert
BOTTOM LINE
More than three-quarters of major global equity indexes are trading above their 200-day moving averages. This comes soon after all of them were below their averages. Similar cycles tended to precede gains, or at least small losses, even up to a year later.
FORECAST / TIMEFRAME
None
|
Key points:
- At the start of November, every major global equity index was below its 200-day moving average
- The recovery in recent weeks pushed more than 75% of those indexes above their average
- Similar behavior over the past 50 years mostly preceded gains or at least limited downside
Every major country was in a downtrend...and my how things have changed
We've looked at some sectors and indexes that have had impressive recoveries in medium- and long-term trends lately. It's not restricted to specific sectors, though - entire countries have enjoyed rebounding markets.
In record time, the percentage of major country indexes trading above their 200-day moving averages has cycled from zero to above 75%. As recently as November 3, every global index out of more than twenty was in a downtrend. The rebound over the past few weeks pushed three out of every four back into an uptrend.
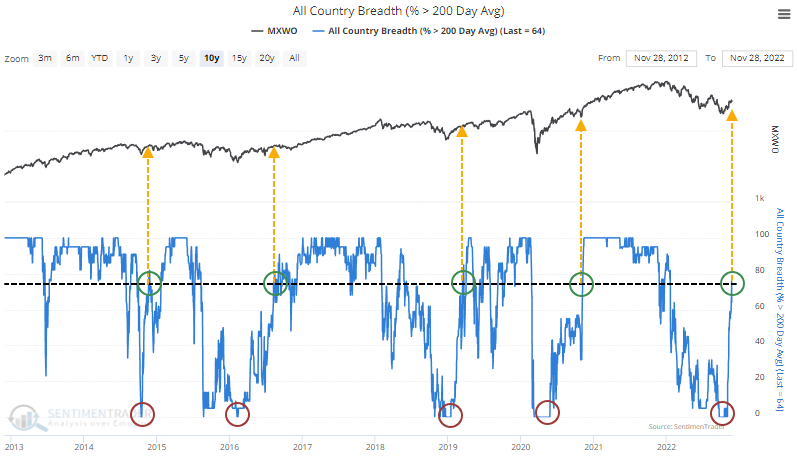
It took only 15 trading days for this recovery to trigger, the quickest cycle in 50 years. The previous record was 18 days in 1977, which wasn't the best time to jump on board, but it also wasn't a disaster by any means.
After similar recoveries, the MSCI World Index tended to suffer short-term profit-taking, but they were good signs of long-term momentum. While the average return and win rates weren't exceptional, risk was low.
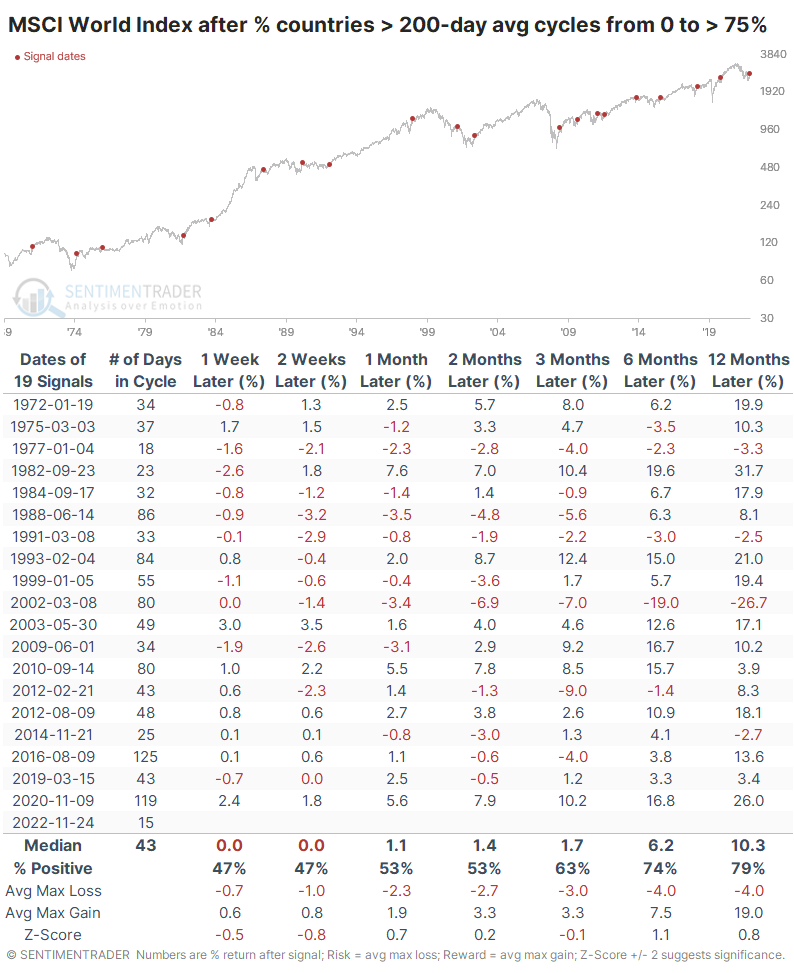
Out of the 19 precedents, there were only 3 with more than a 10% drawdown at any point within the following year. Two of those corrections just barely exceeded -10%.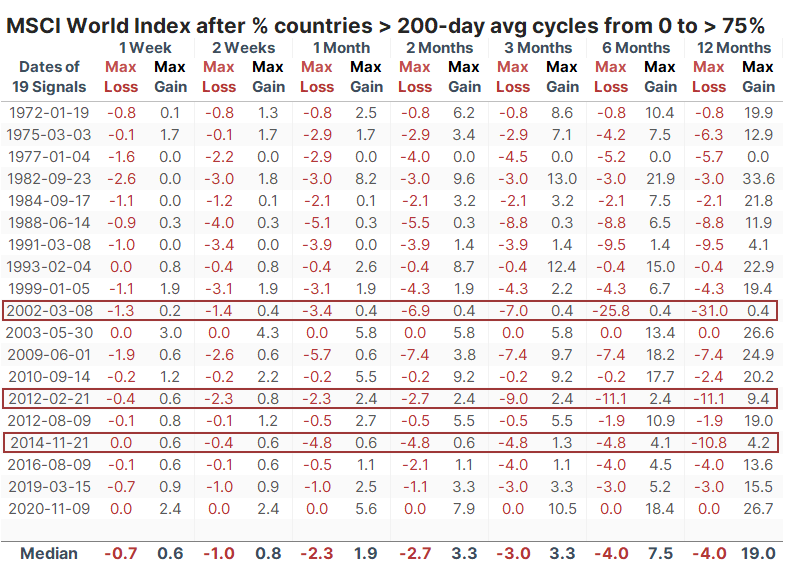
What the research tells us...
When sectors, indexes, countries, and the world at large cycles from an absence of long-term uptrends to a plethora of them, the momentum tends to continue. It's not perfect, of course, but in general, investors tend to be buyers that suffer from FOMO. That's particularly the case after a period like the past year that registers among the worst of all time for financial assets. Everyone wants to make up losses, and nobody wants to be left behind. The broad recovery bodes well for their chances.
Indicators at Extremes
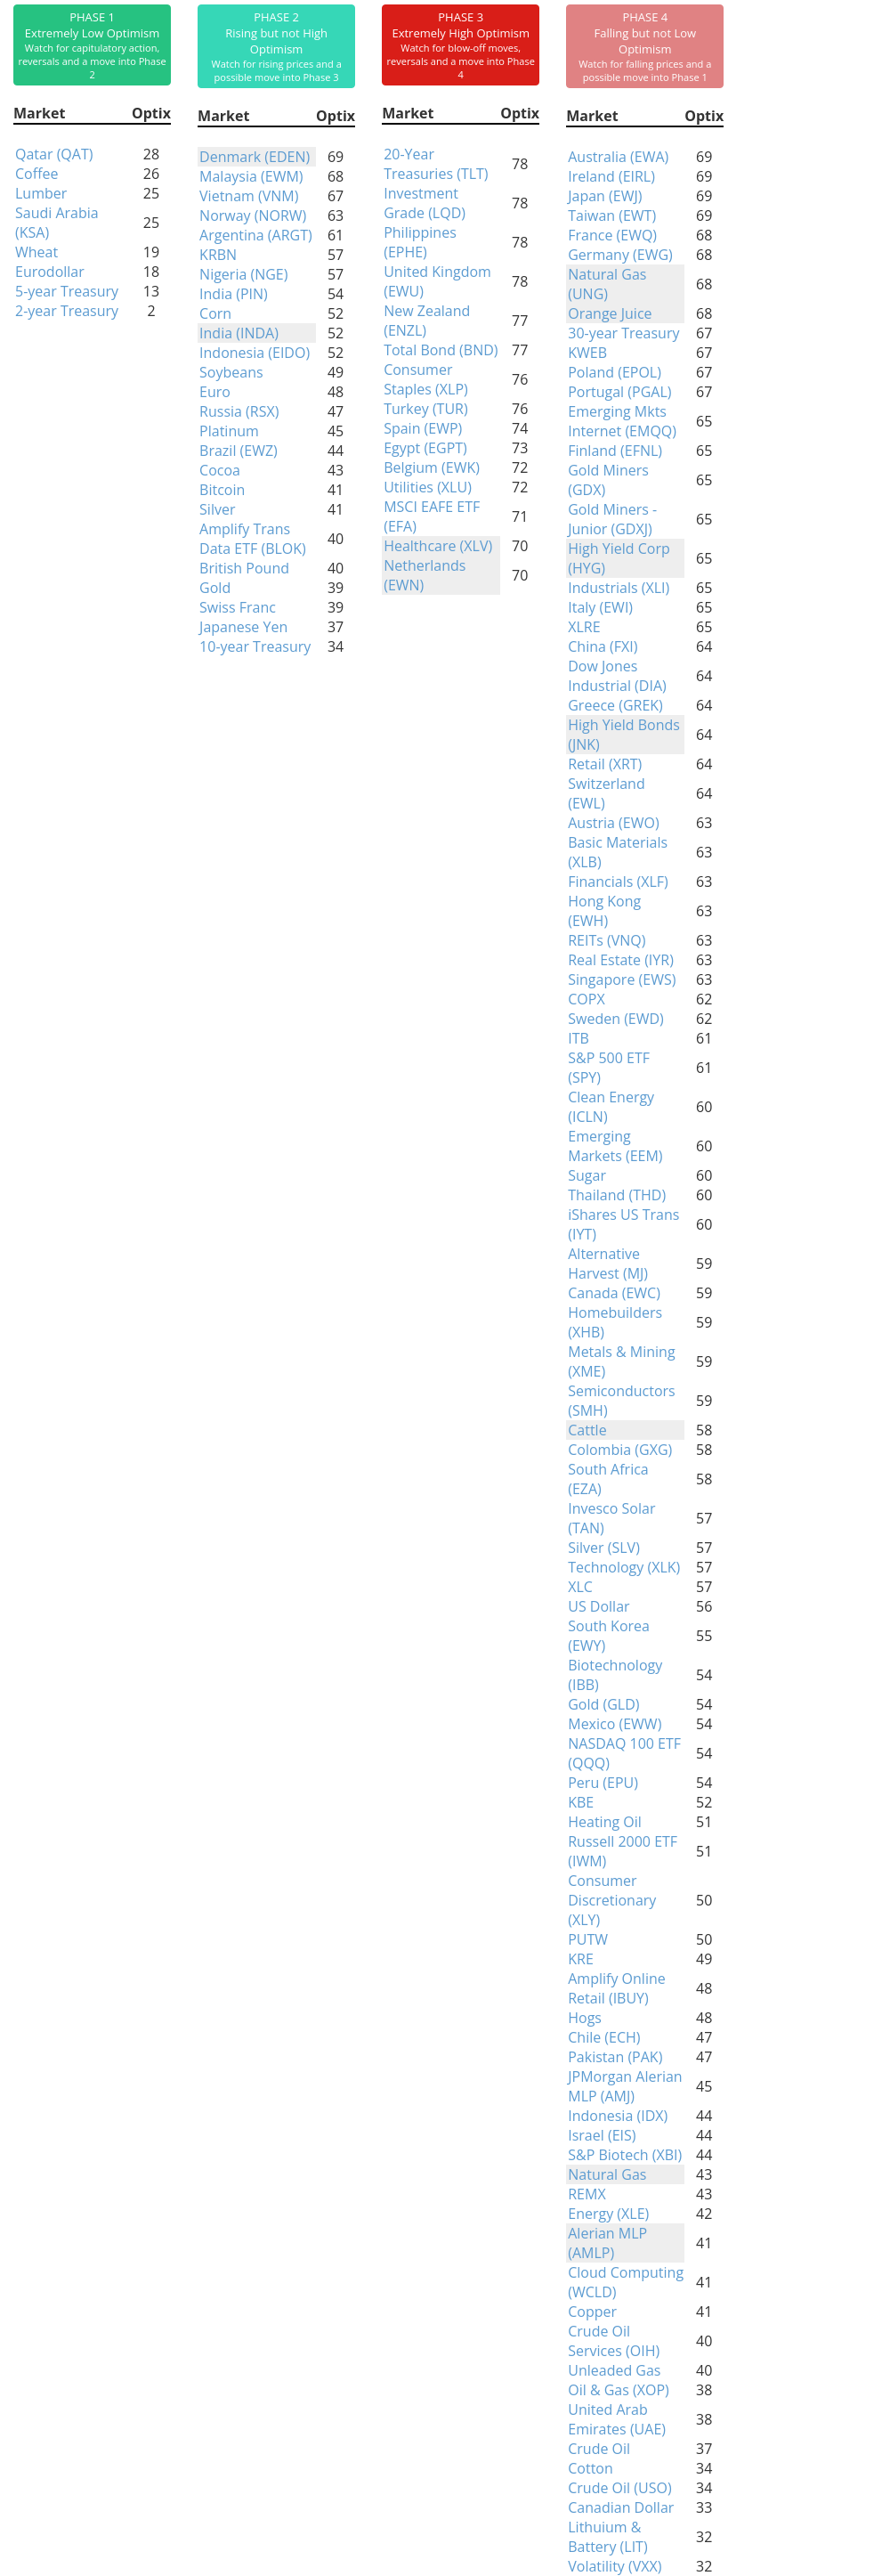
Phase Table
Ranks
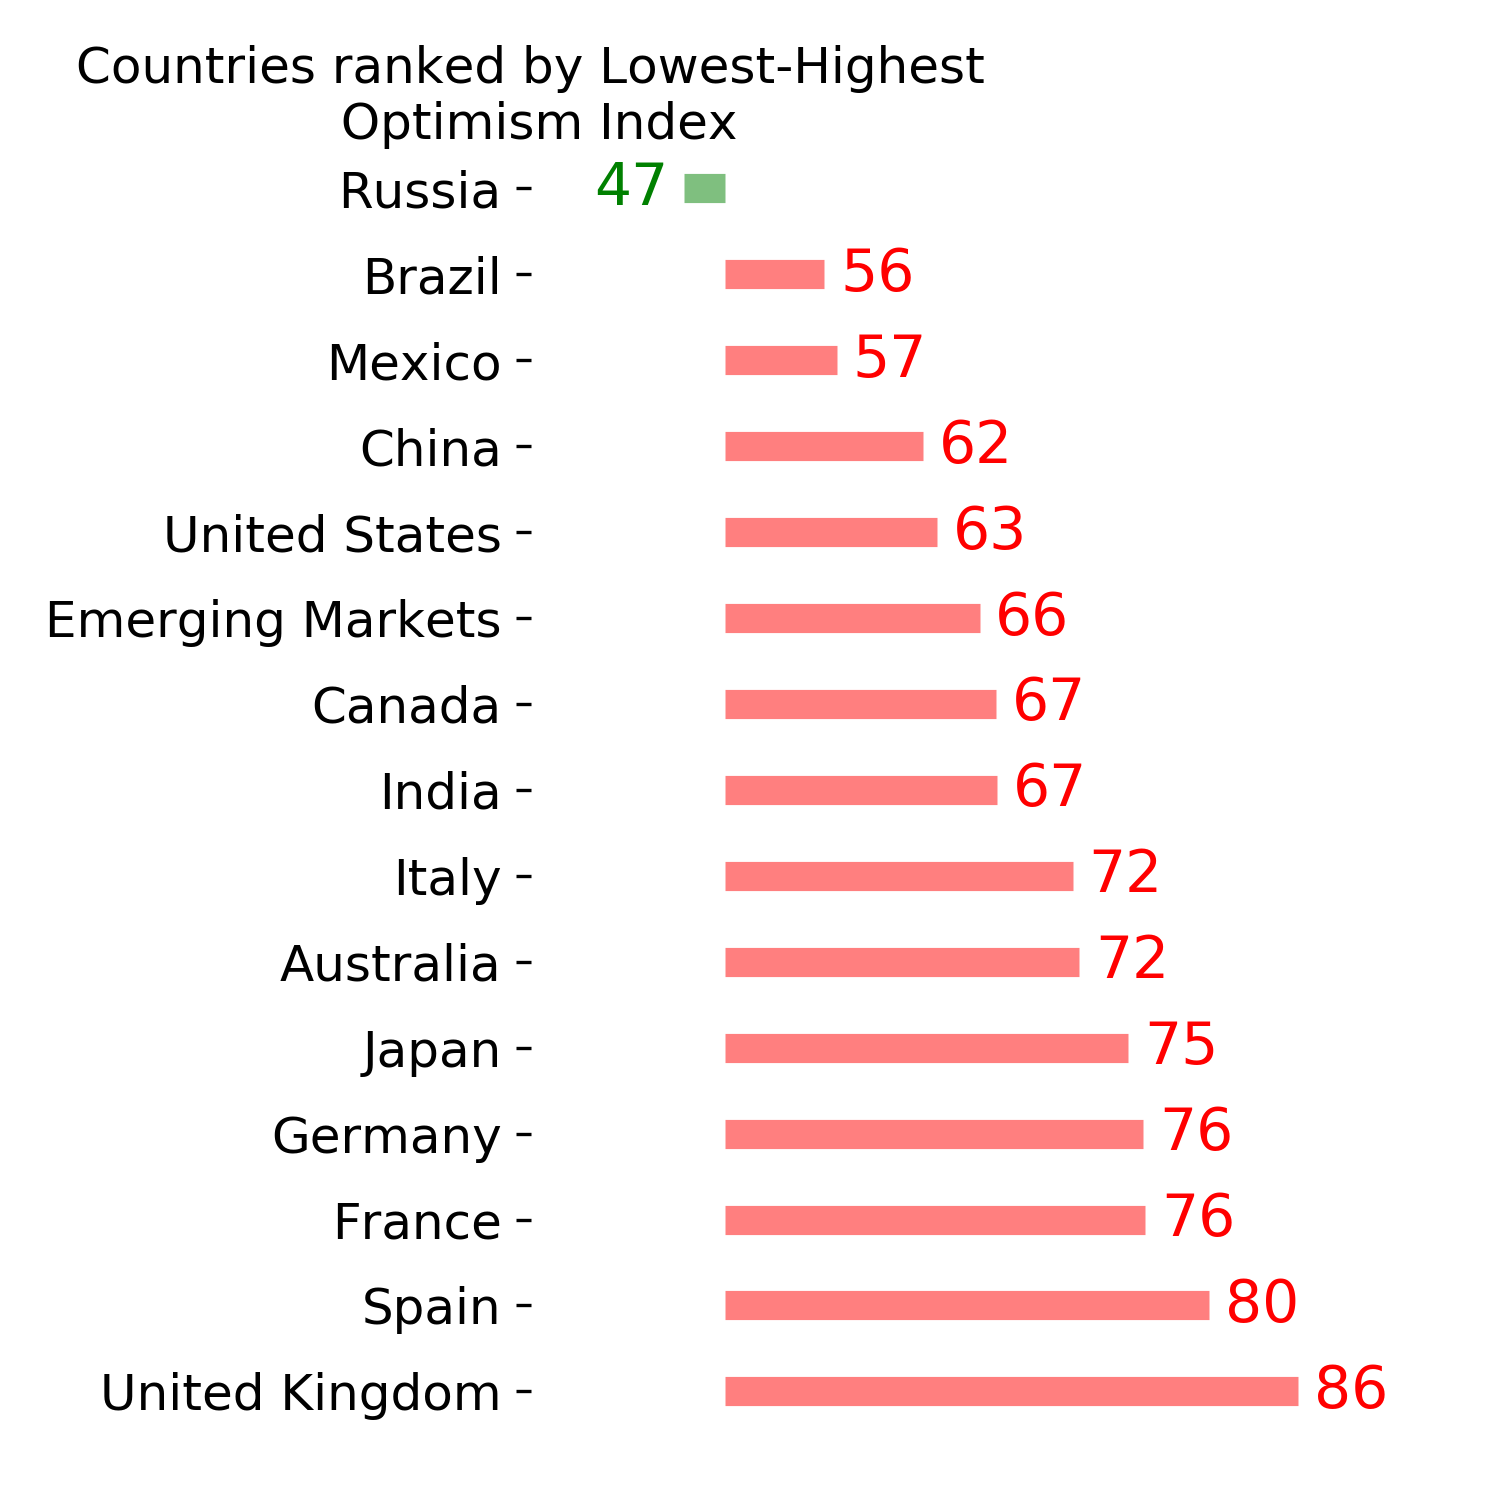
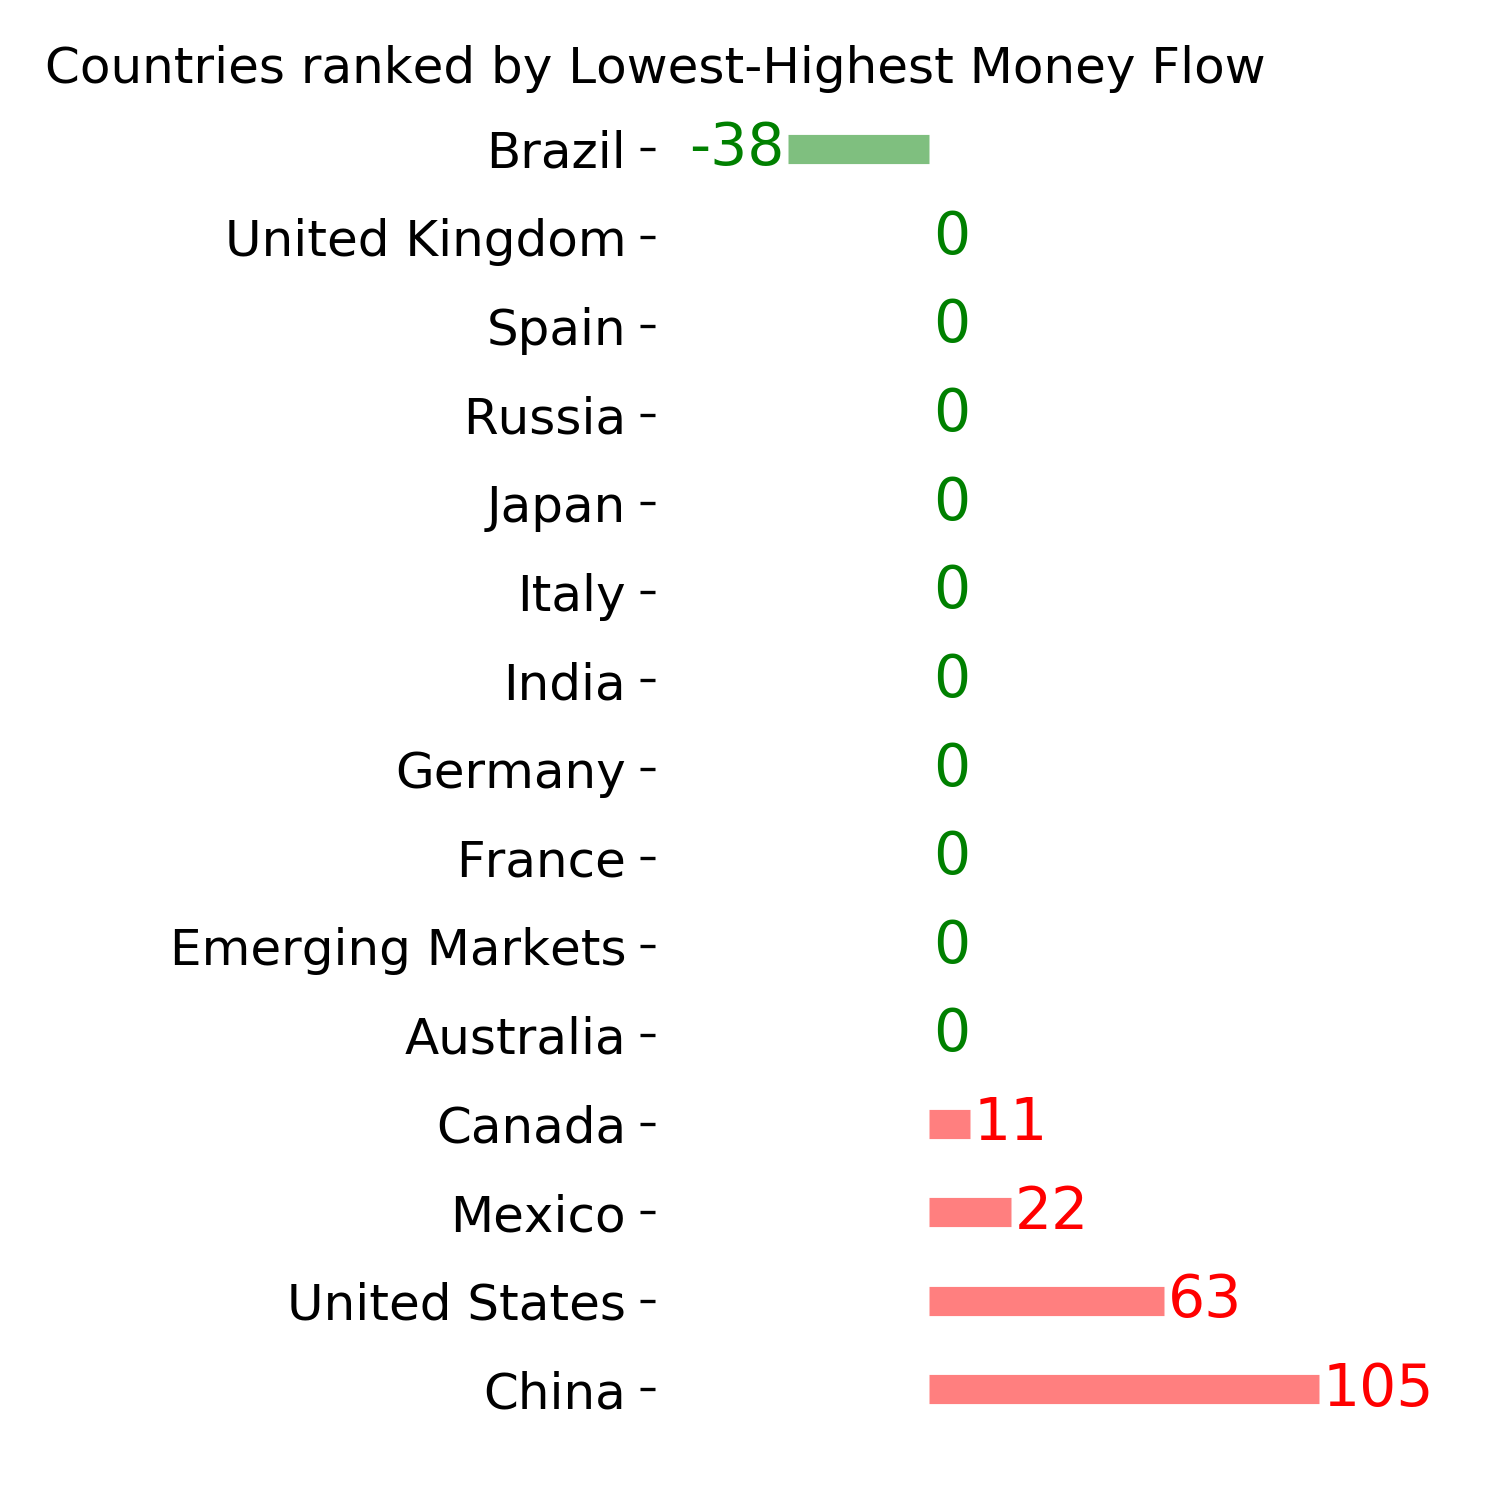
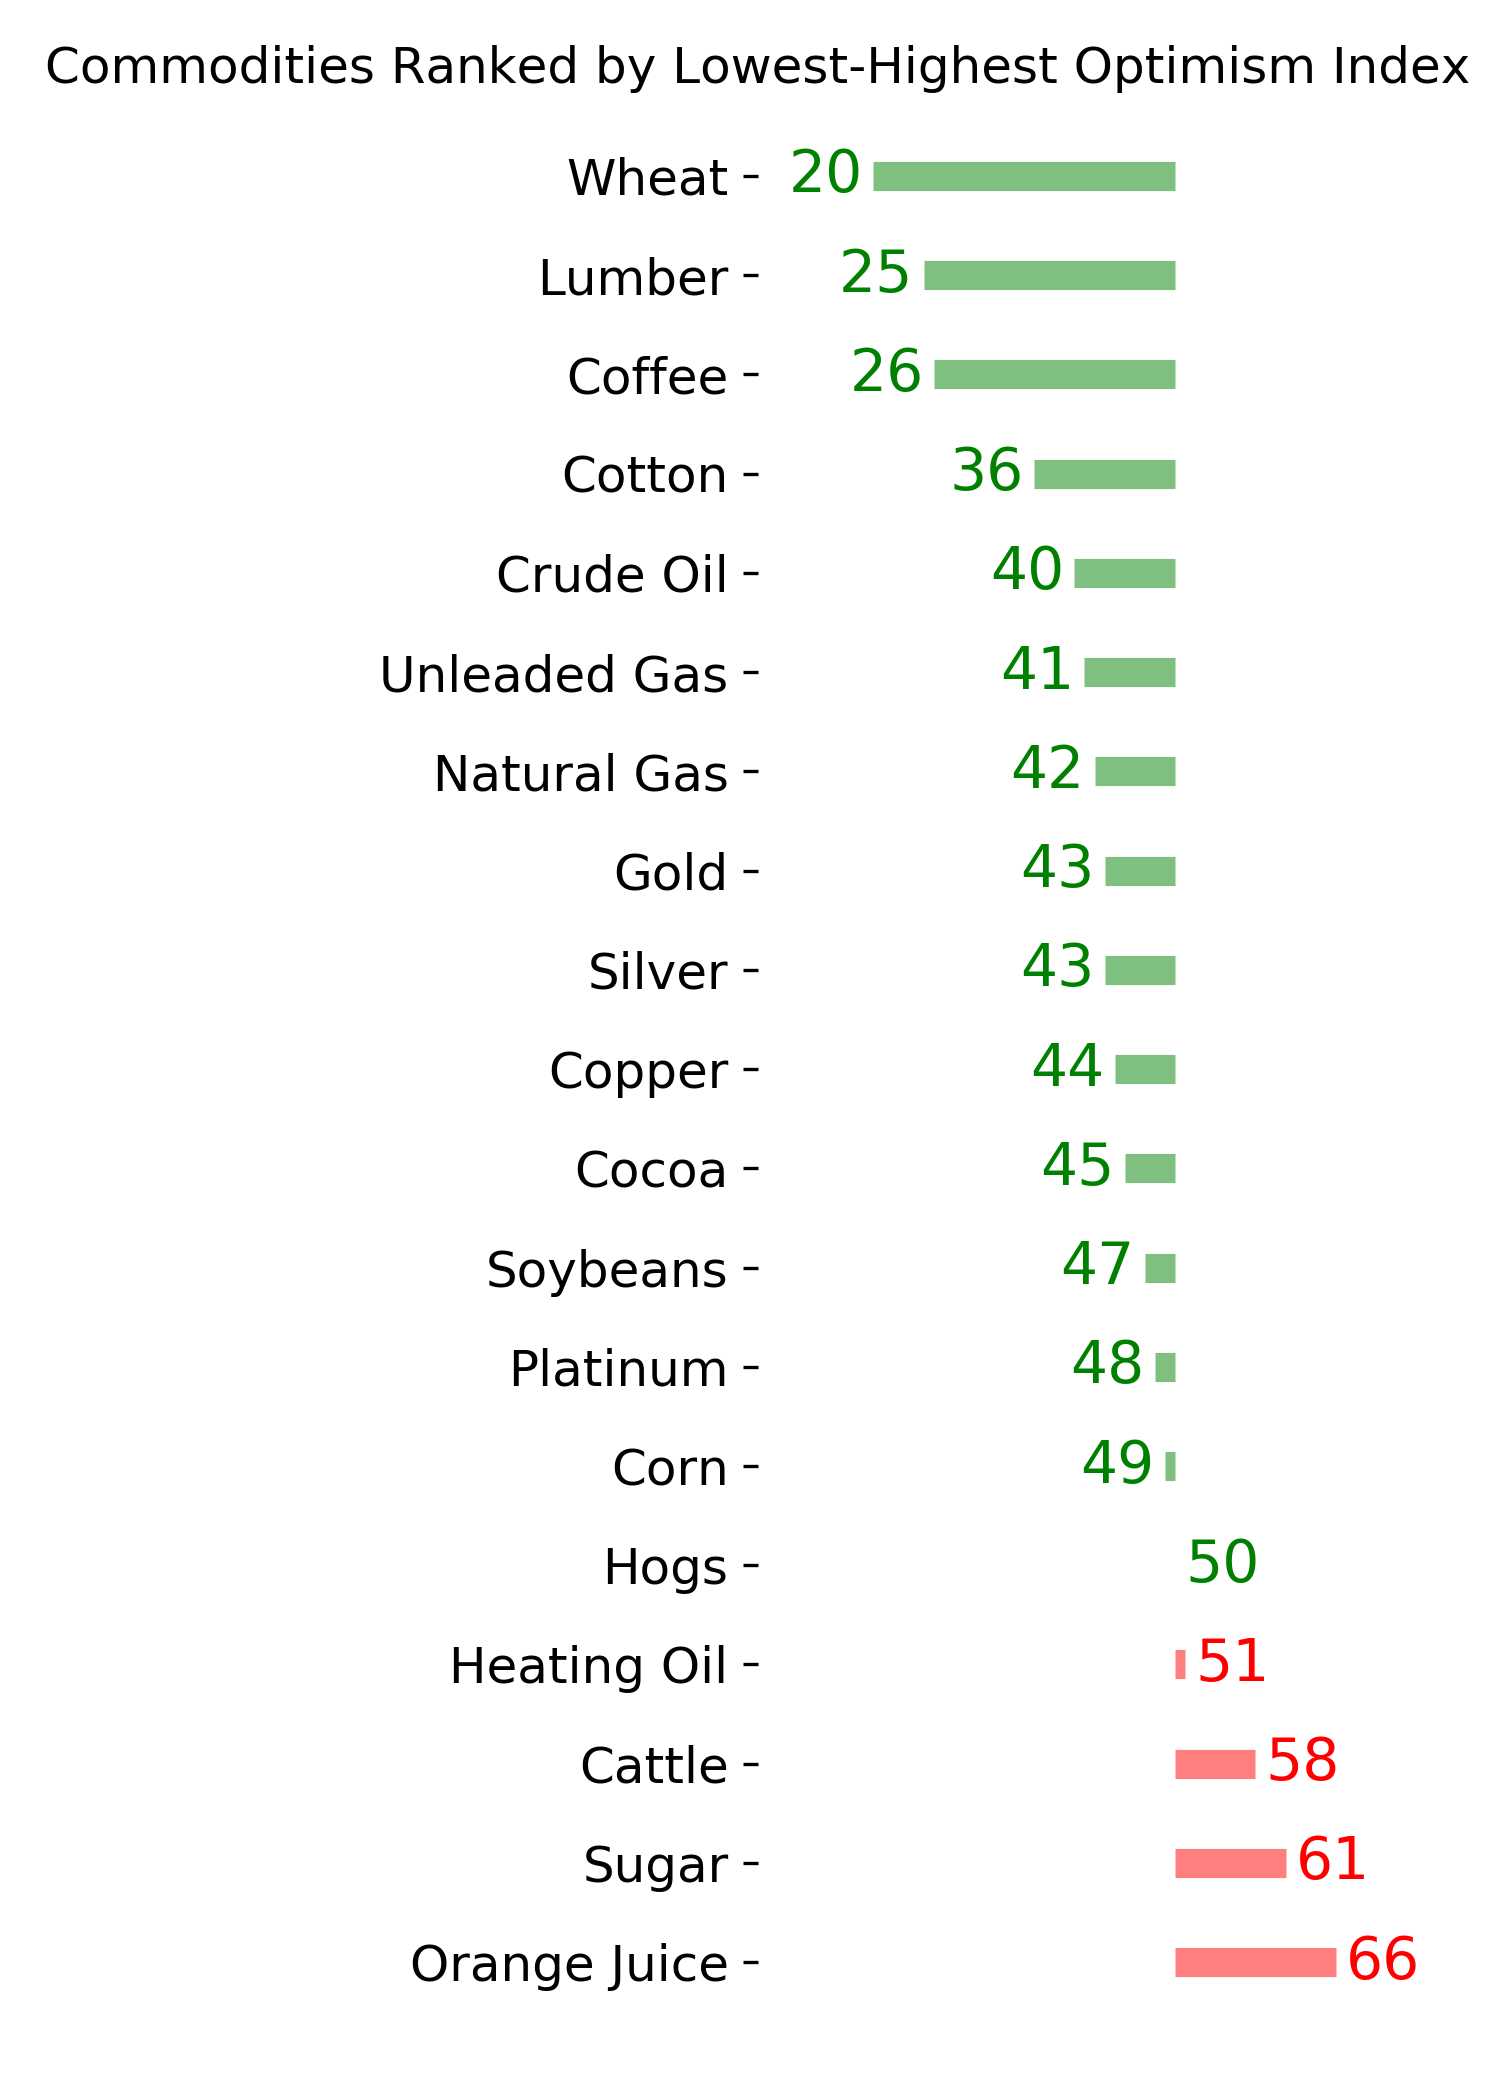
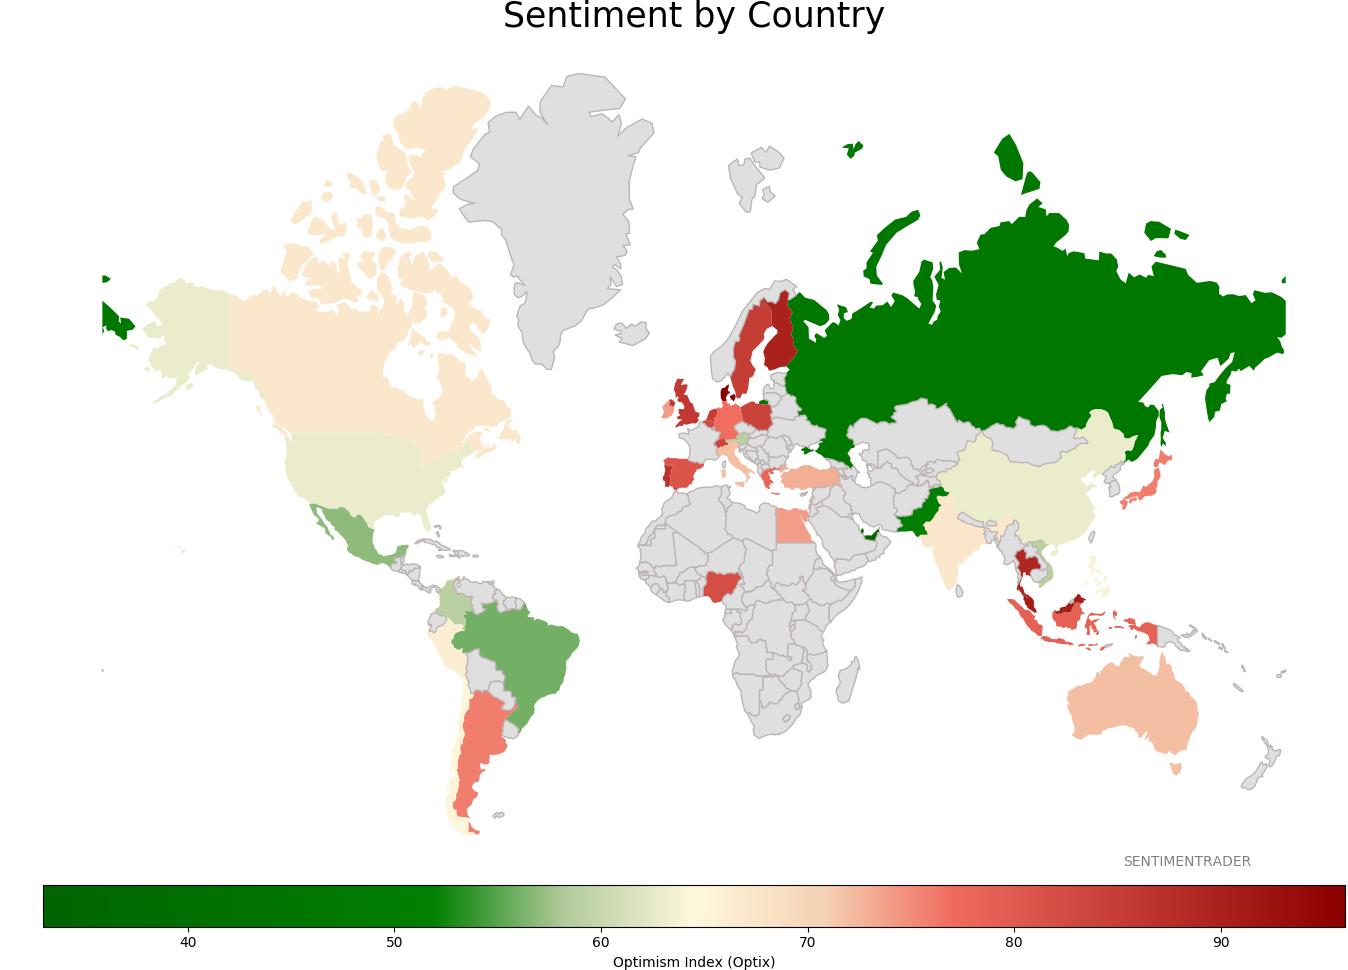
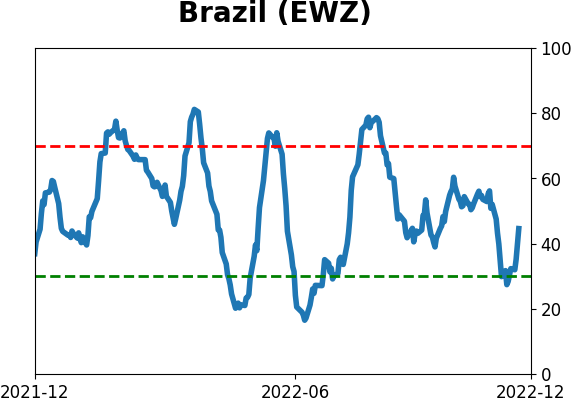
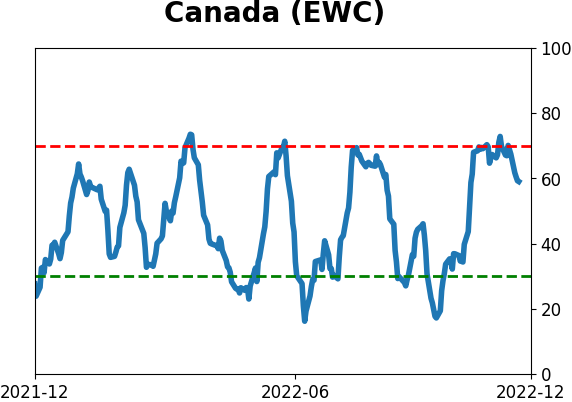
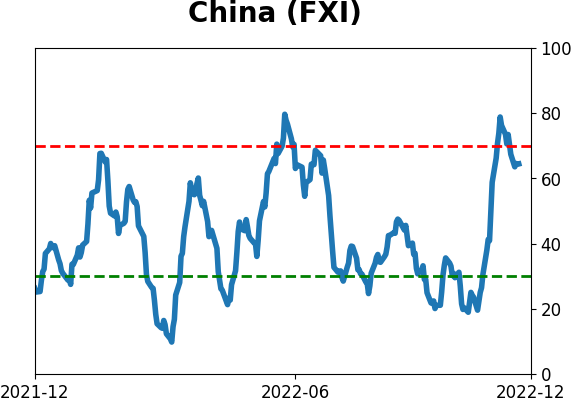
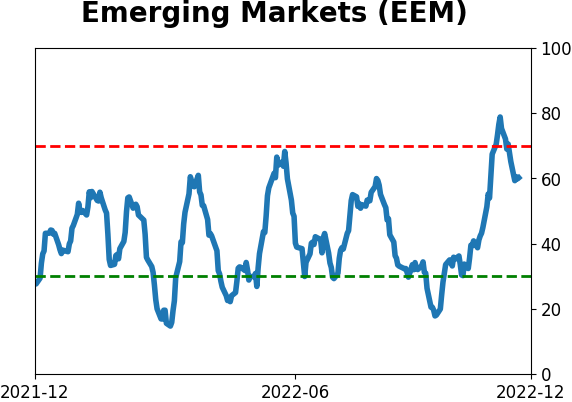
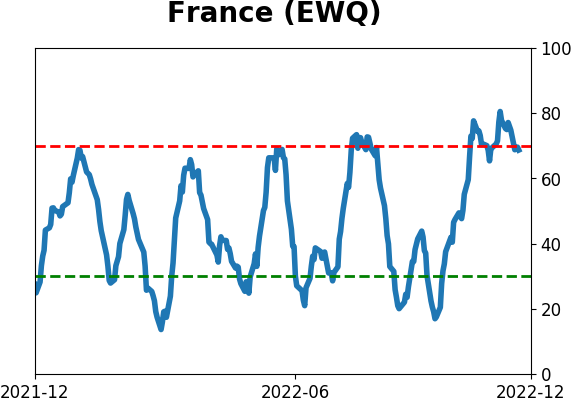
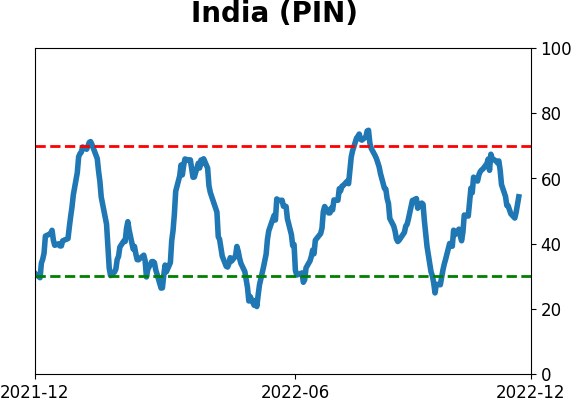
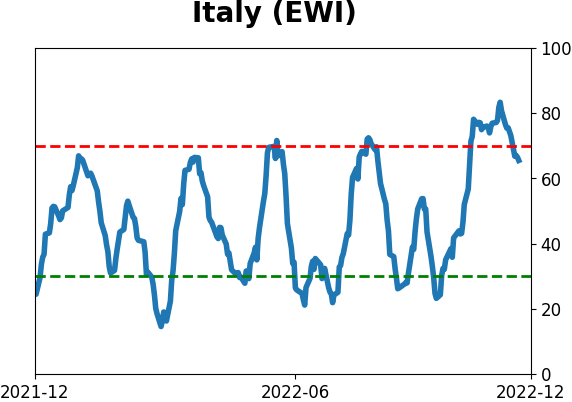
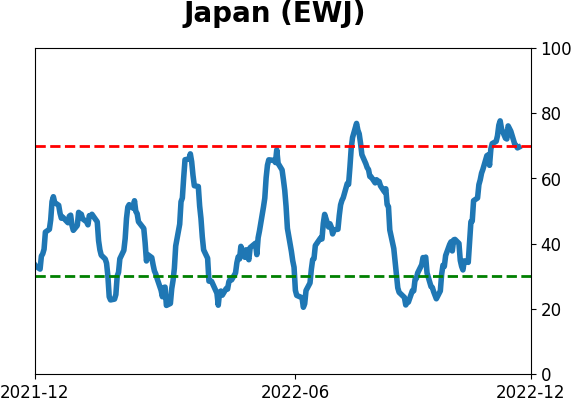
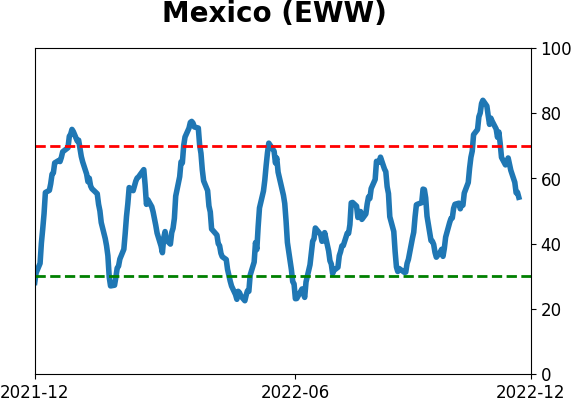
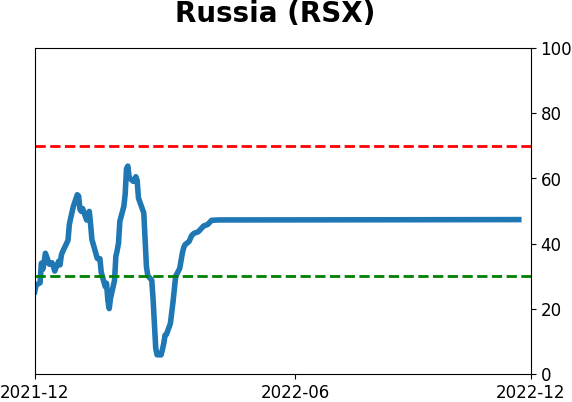
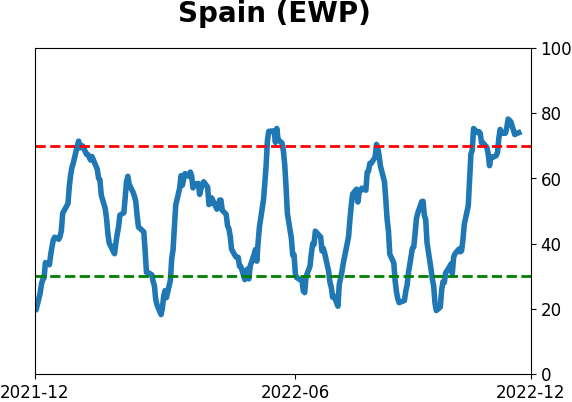
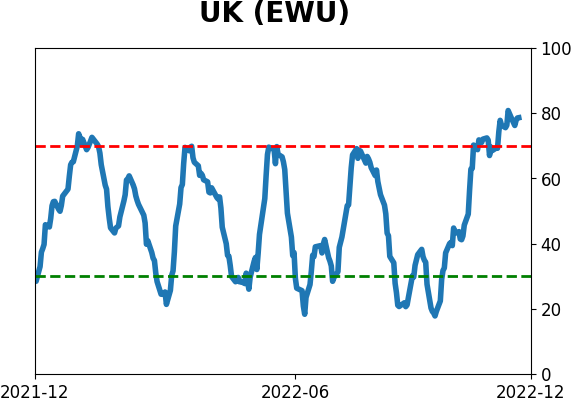
Sentiment Around The World
Optimism Index Thumbnails
|
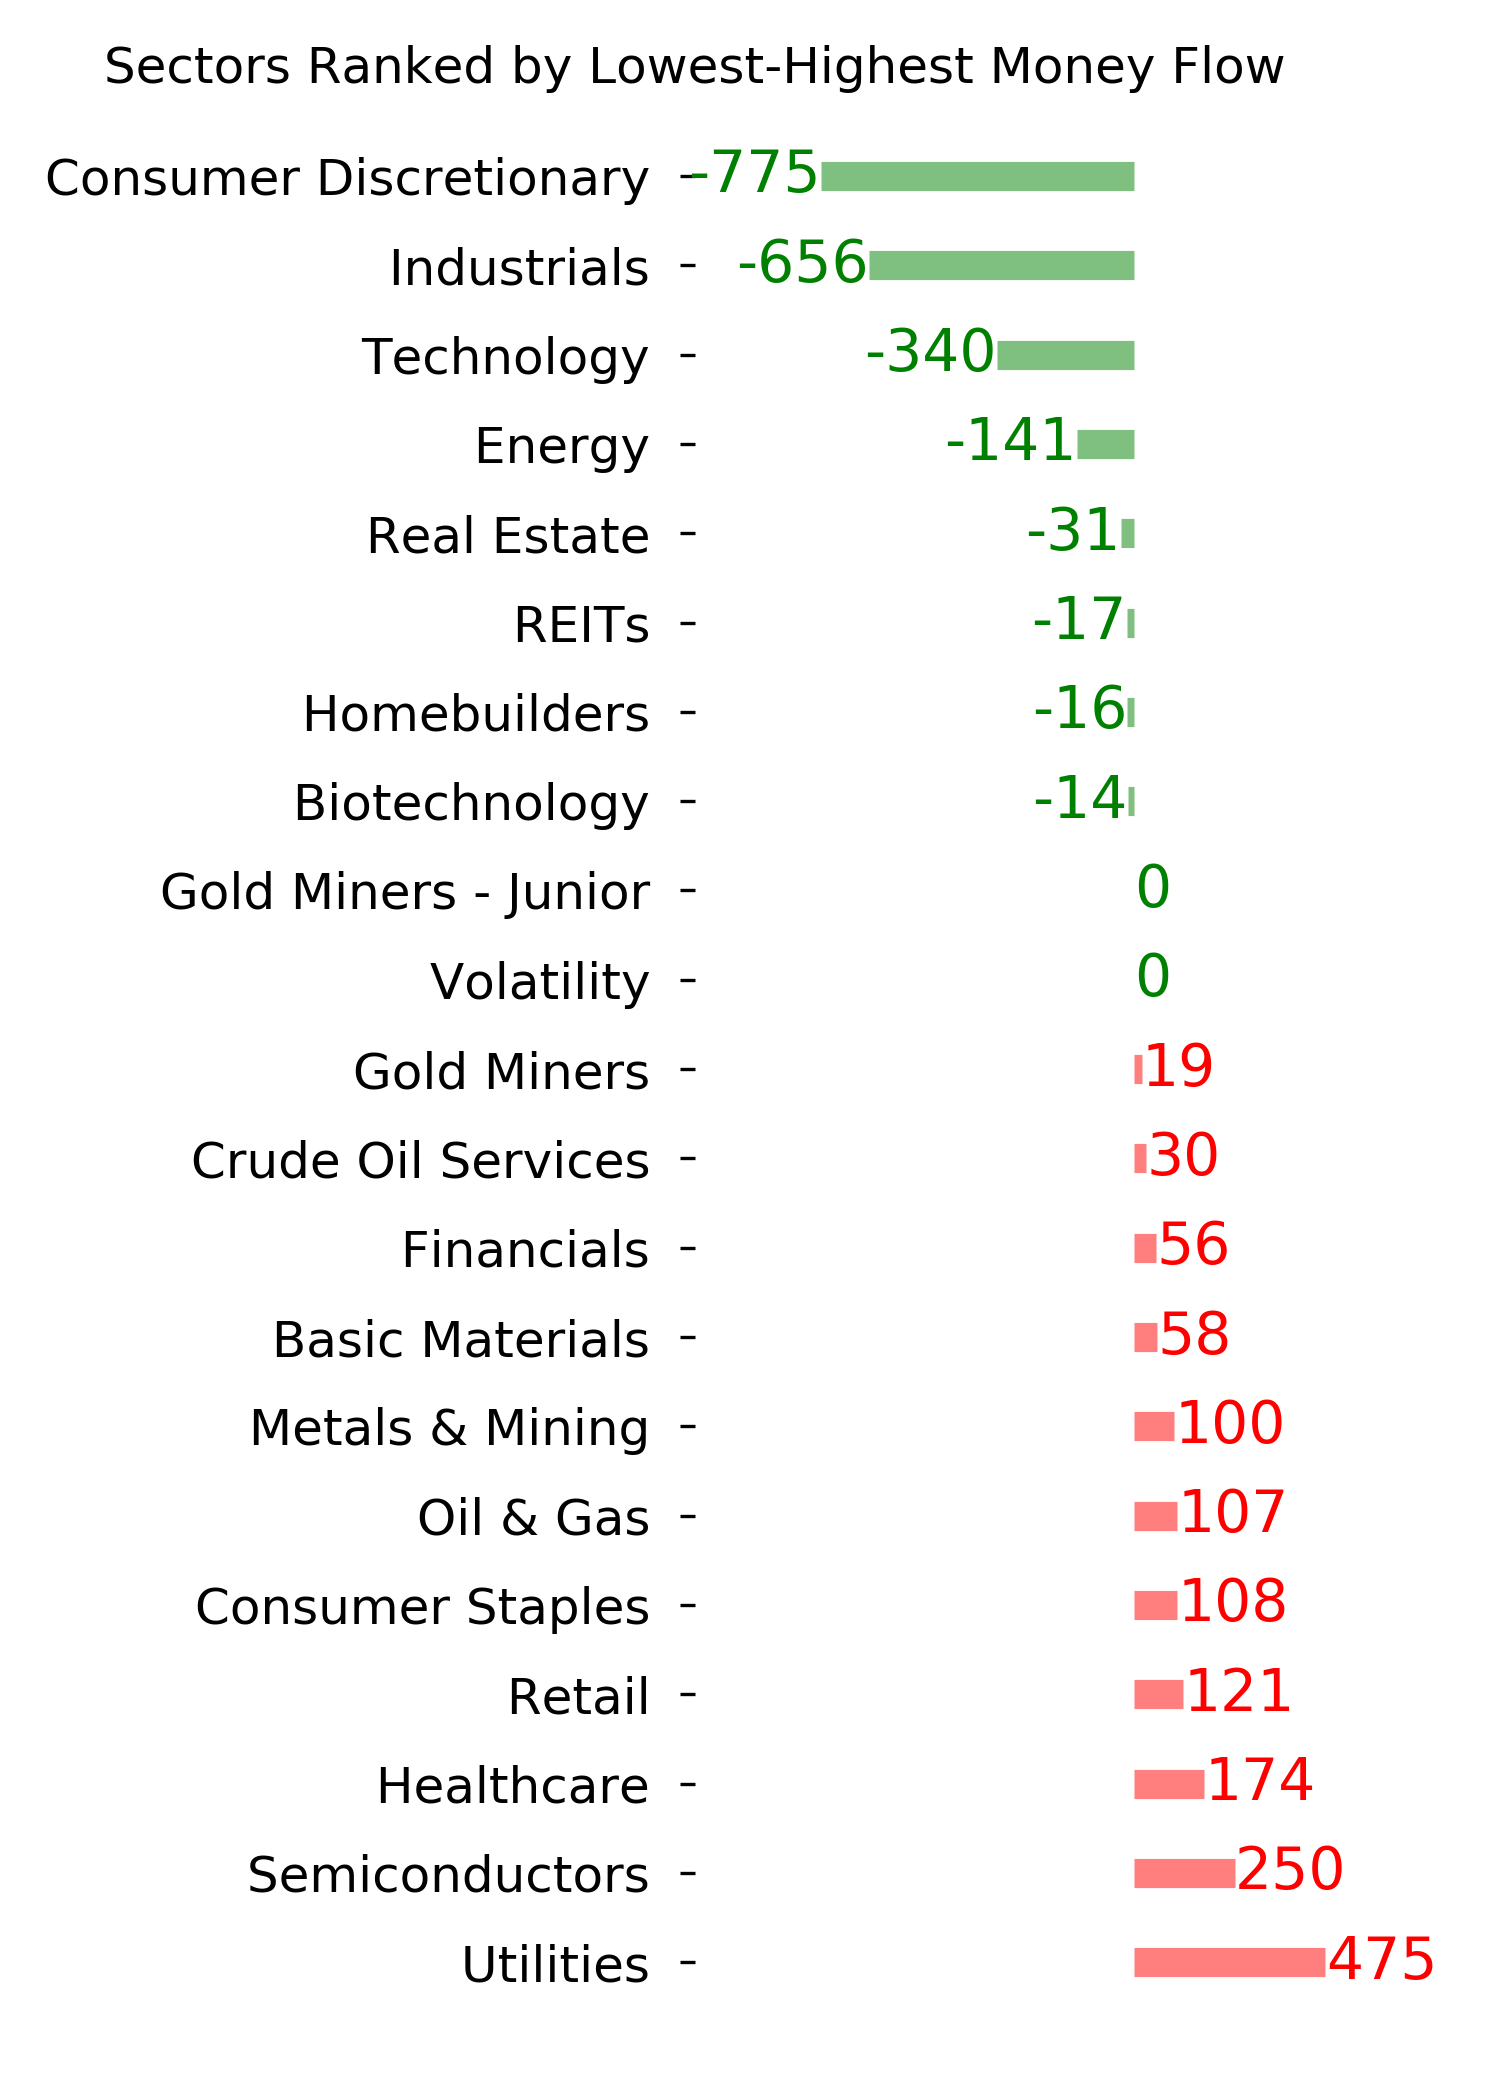
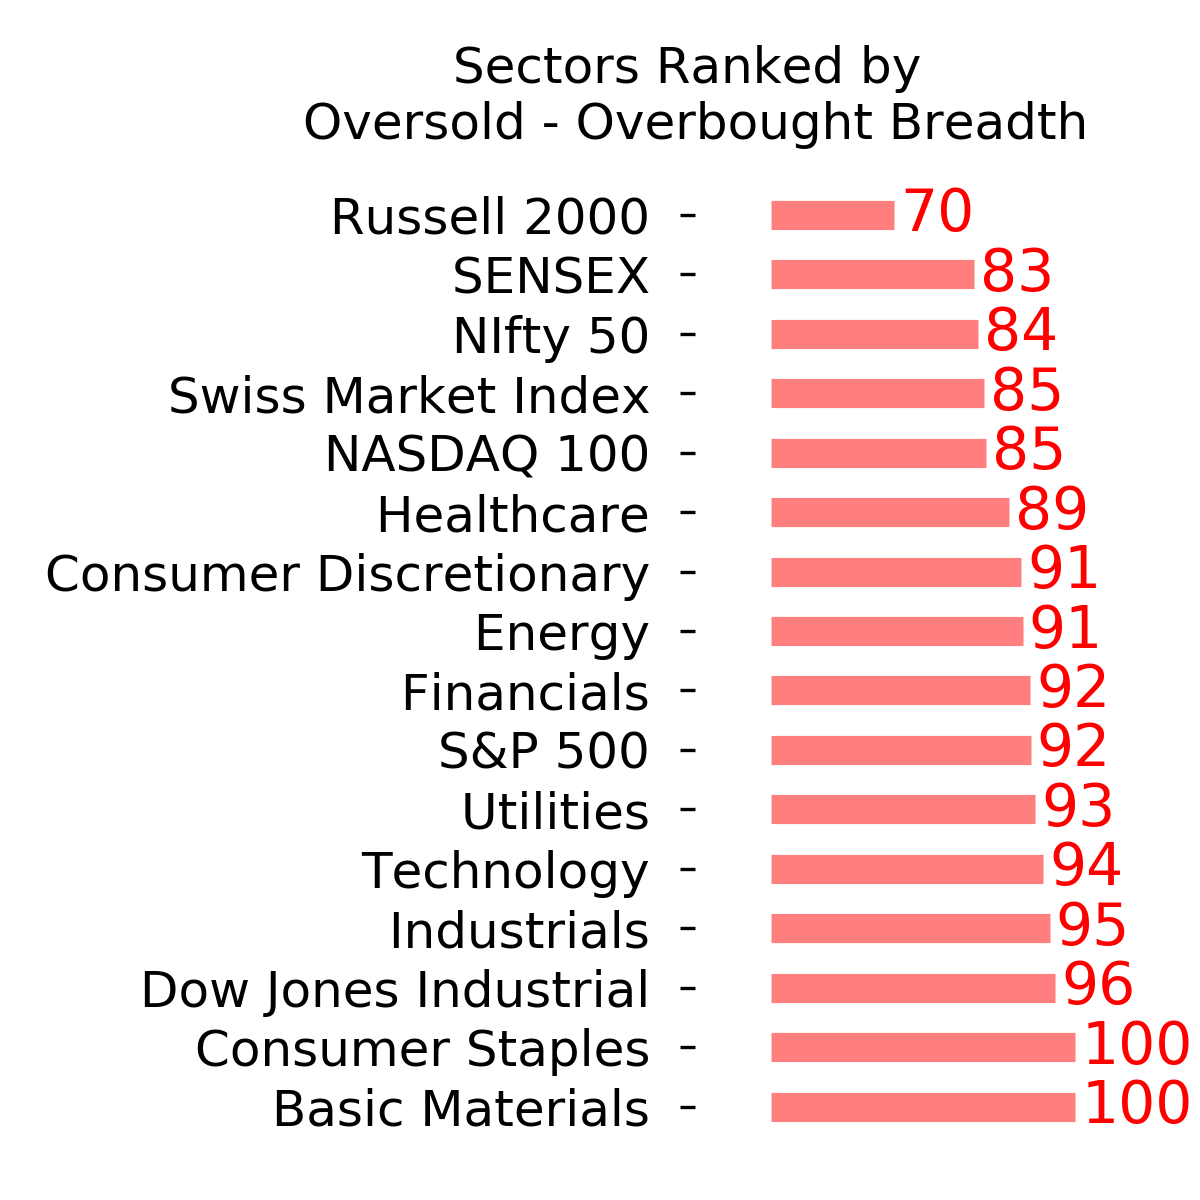
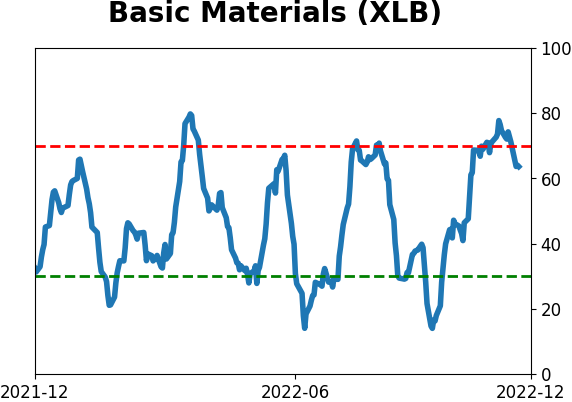
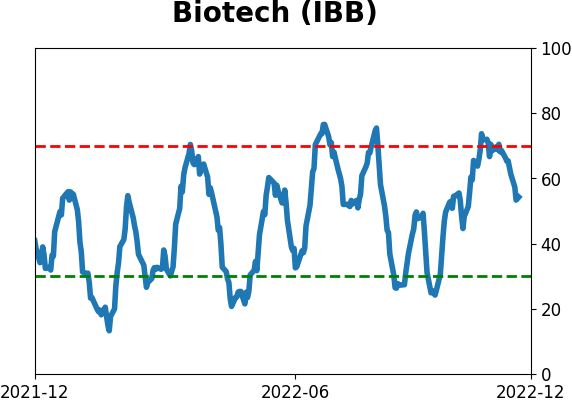
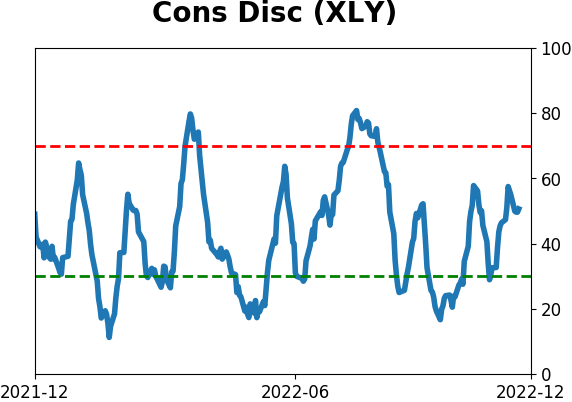
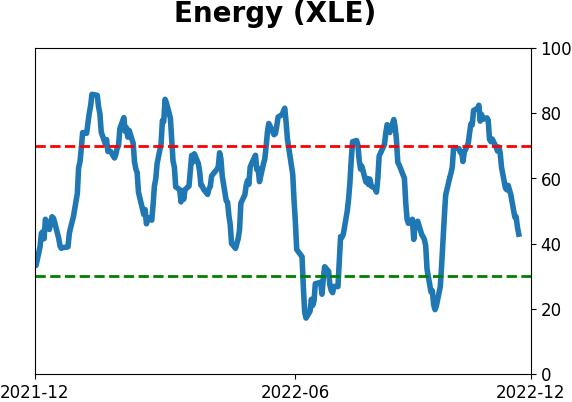
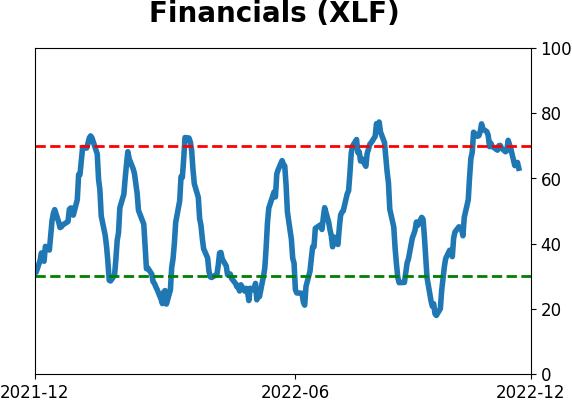
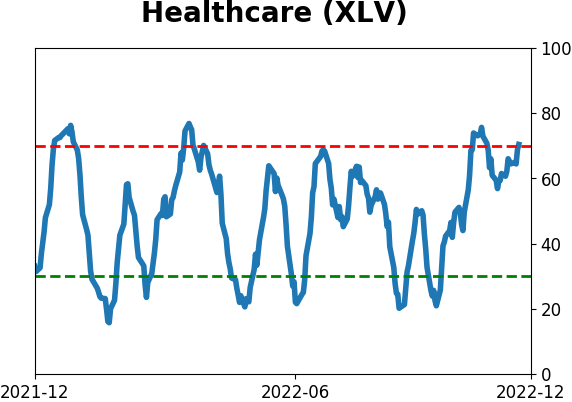
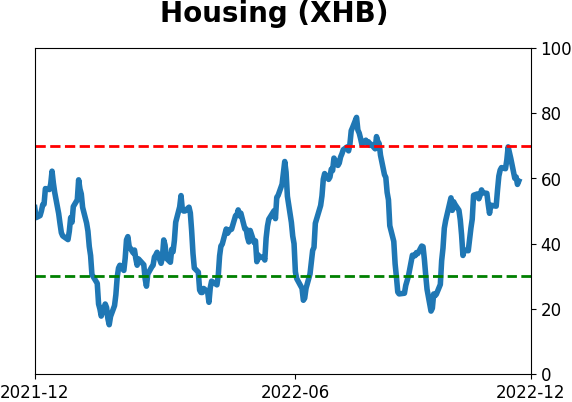
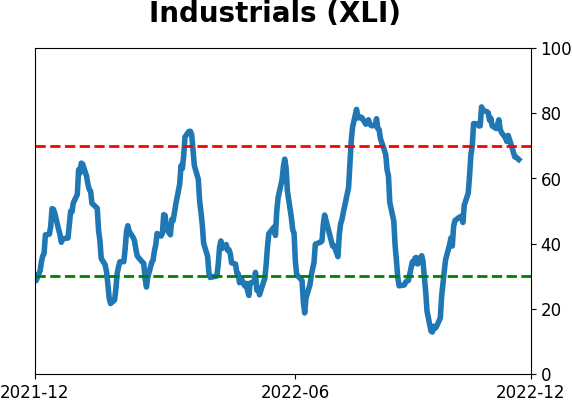
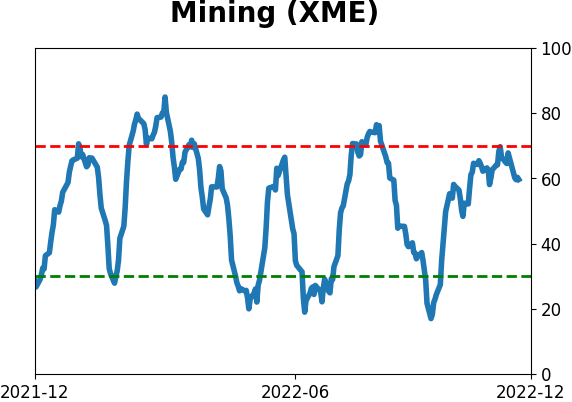
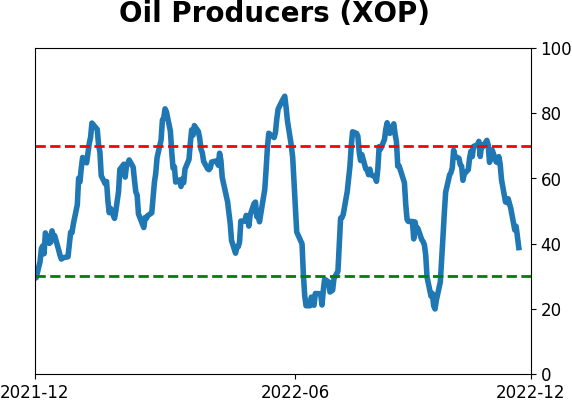
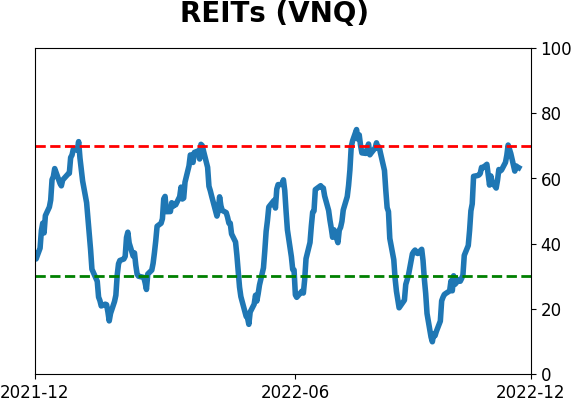
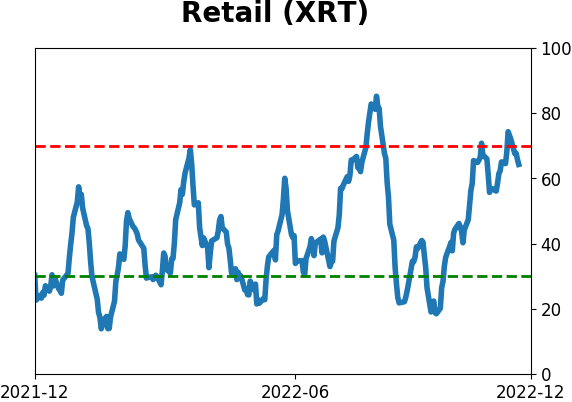
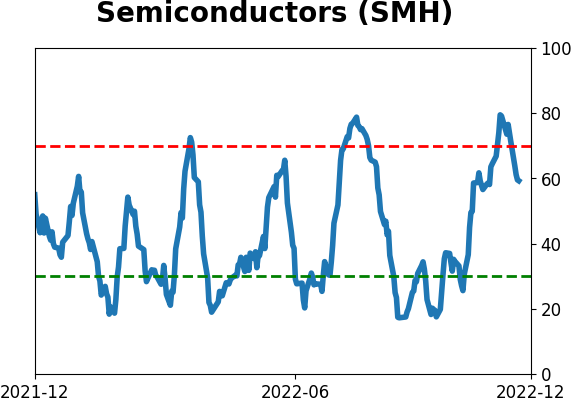
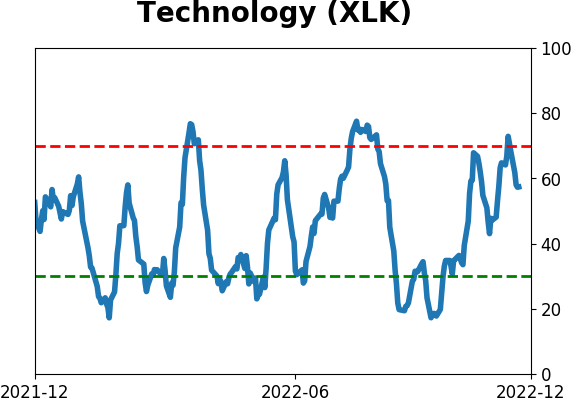
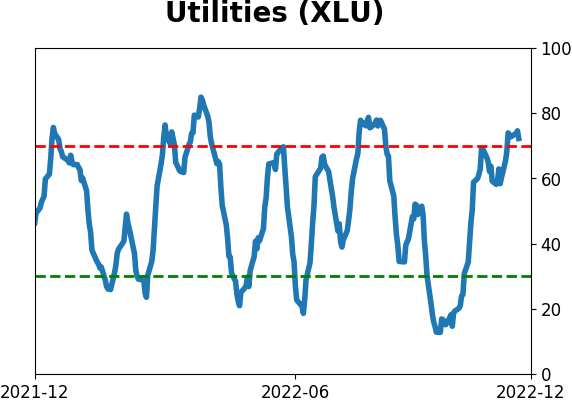
Sector ETF's - 10-Day Moving Average
|
|
|
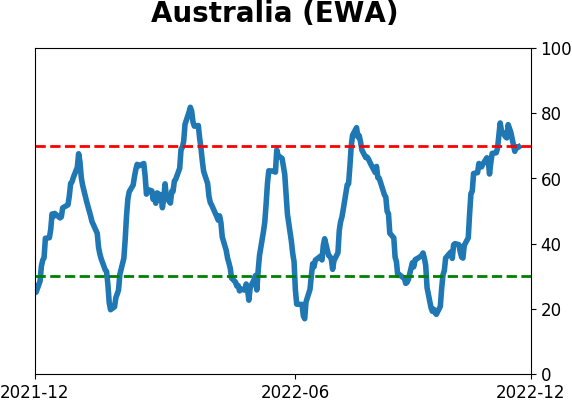
Country ETF's - 10-Day Moving Average
|
|
|
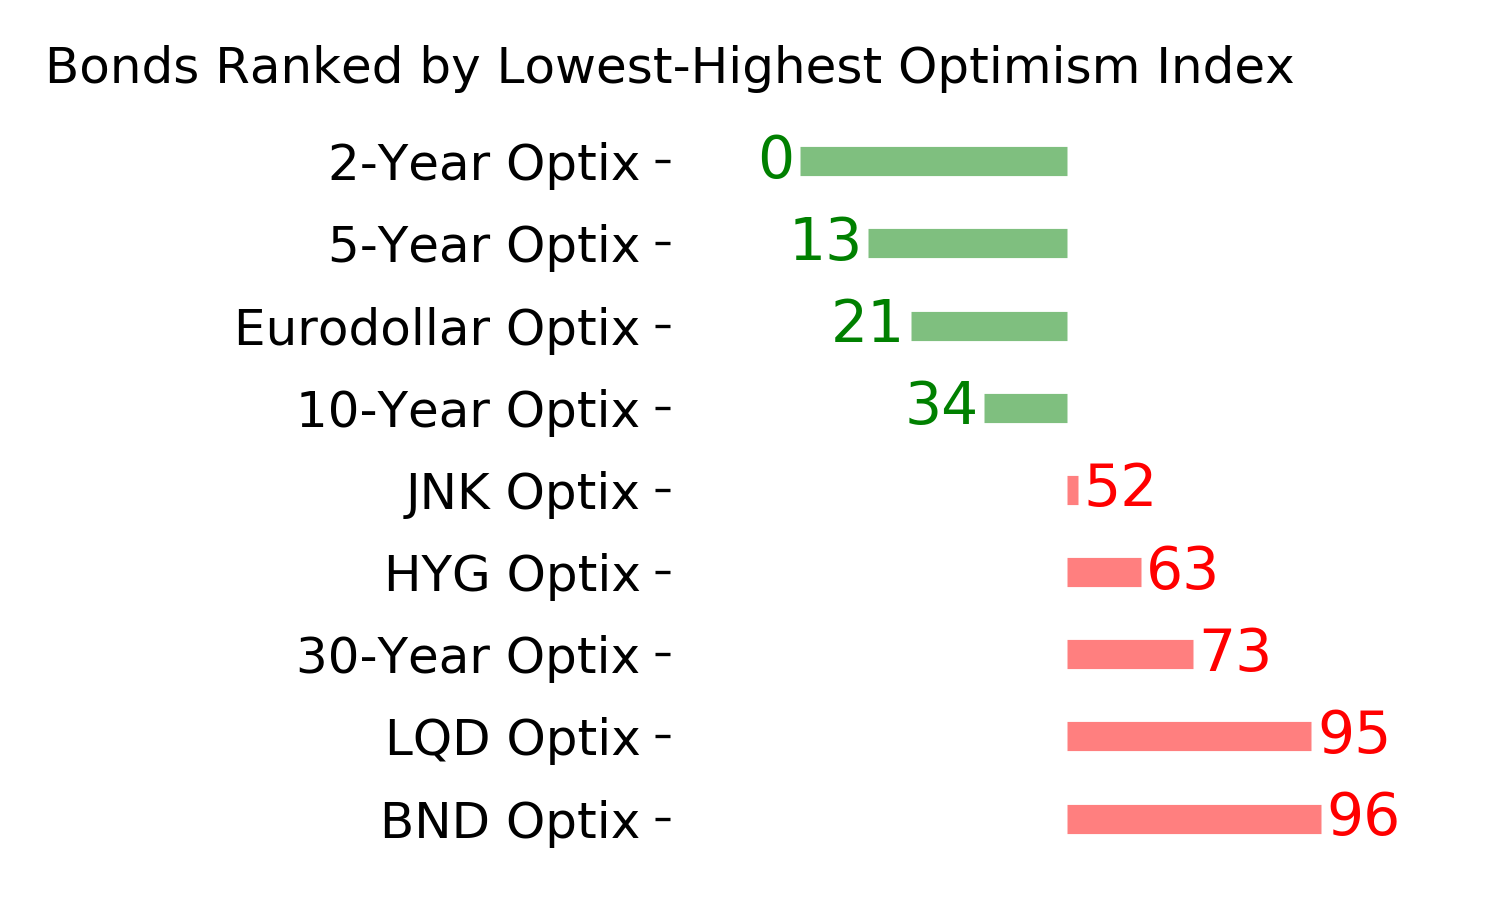
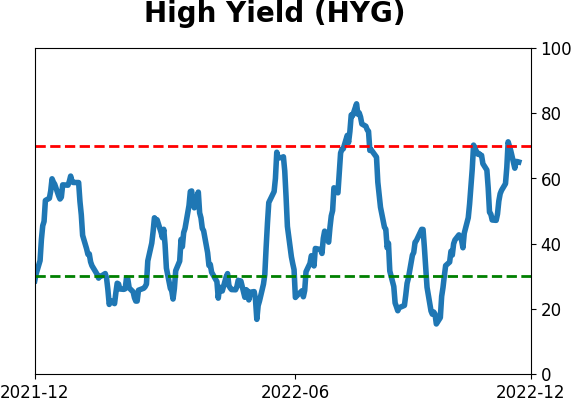
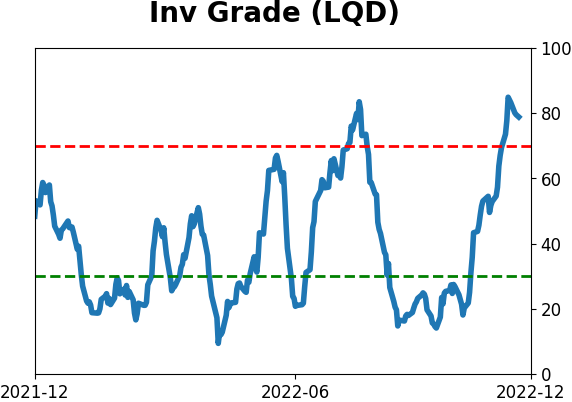
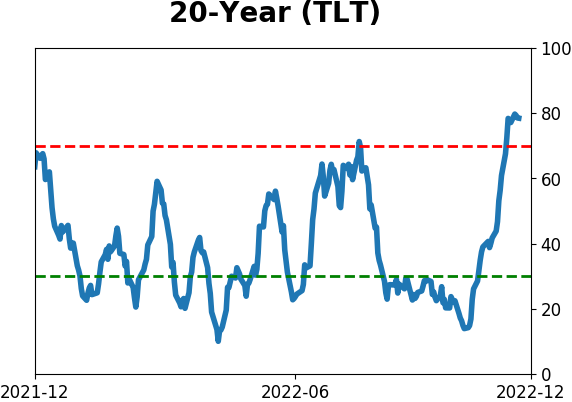
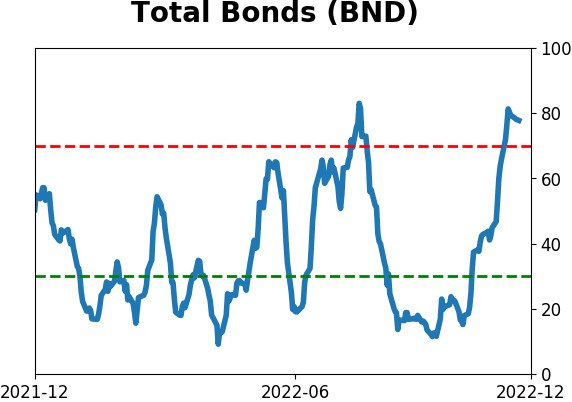
Bond ETF's - 10-Day Moving Average
|
|
|
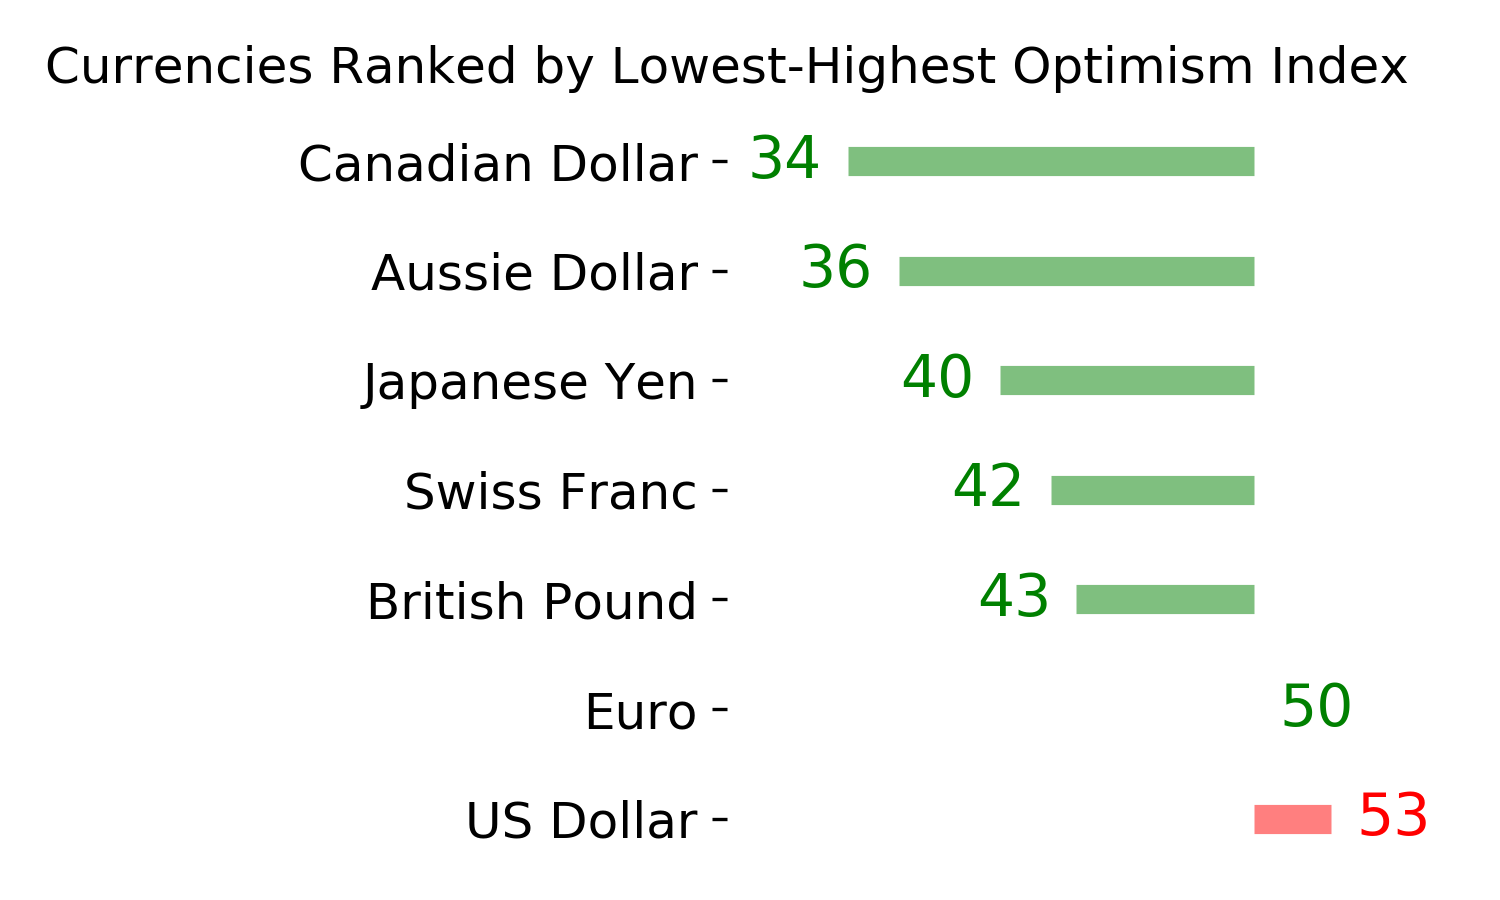
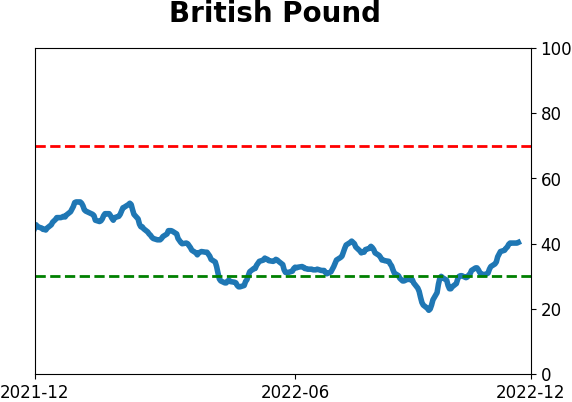
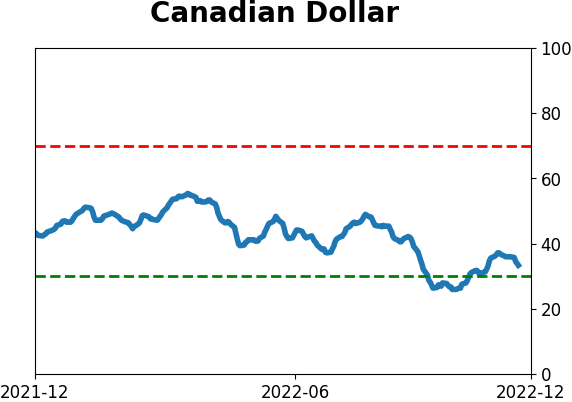
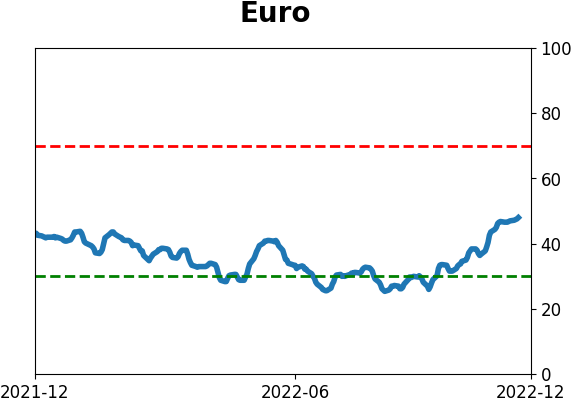
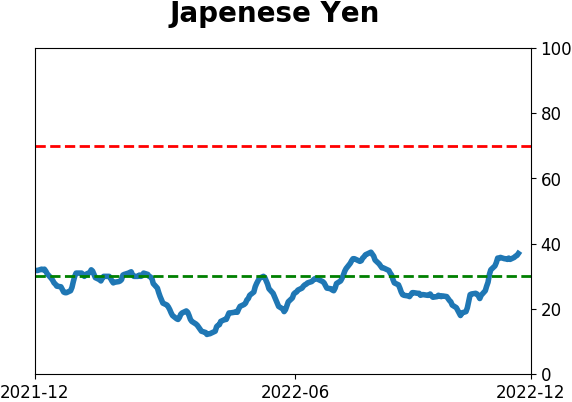
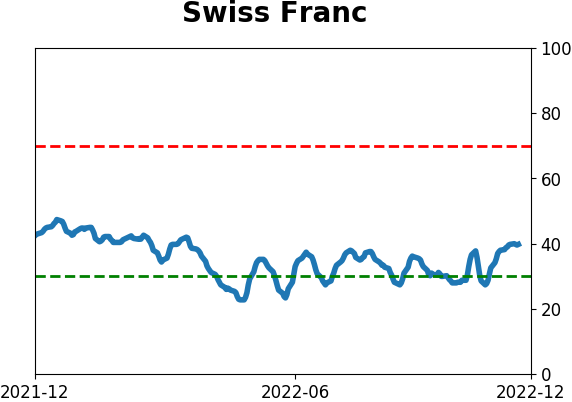
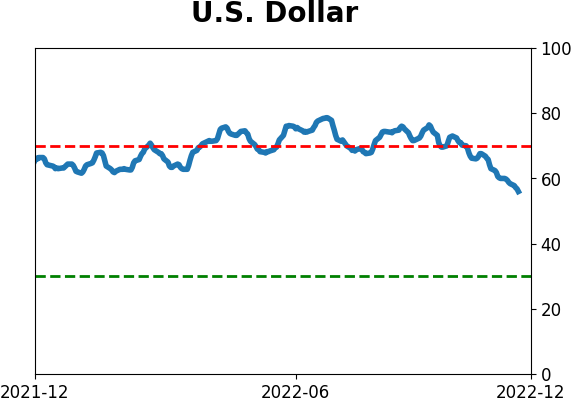
Currency ETF's - 5-Day Moving Average
|
|
|
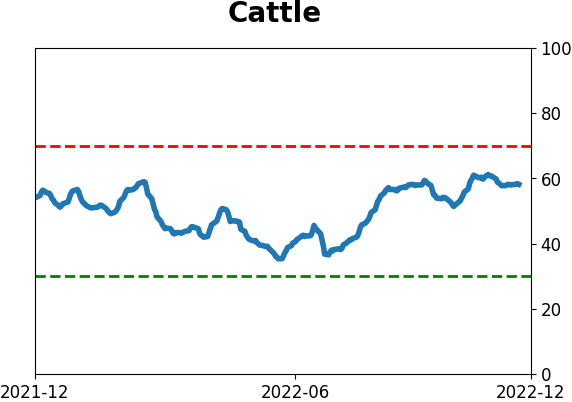
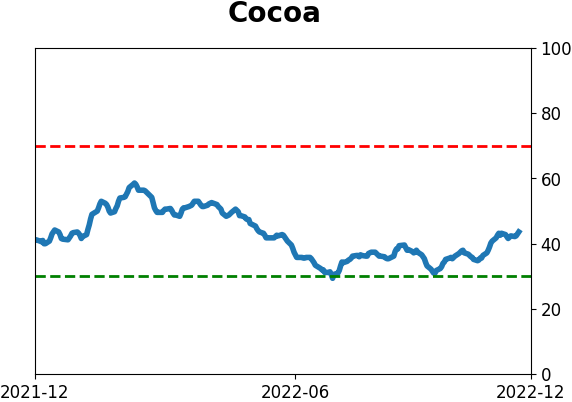
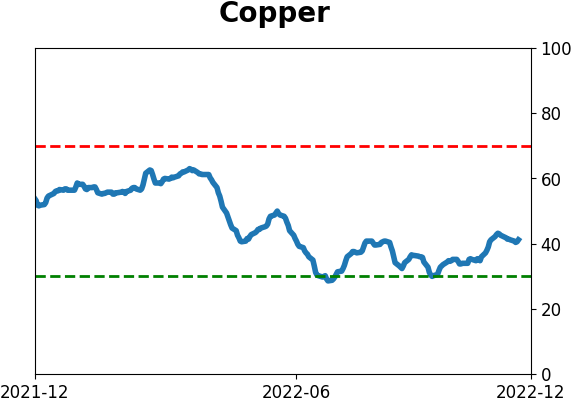
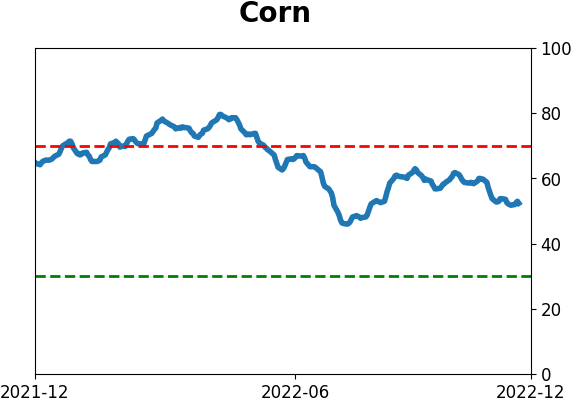
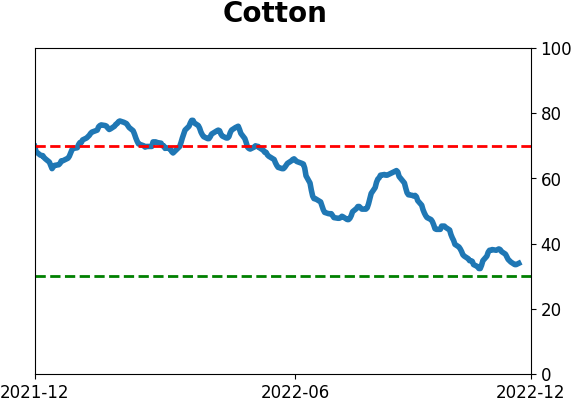
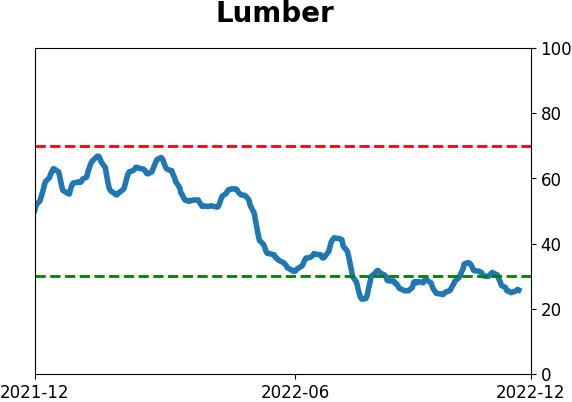
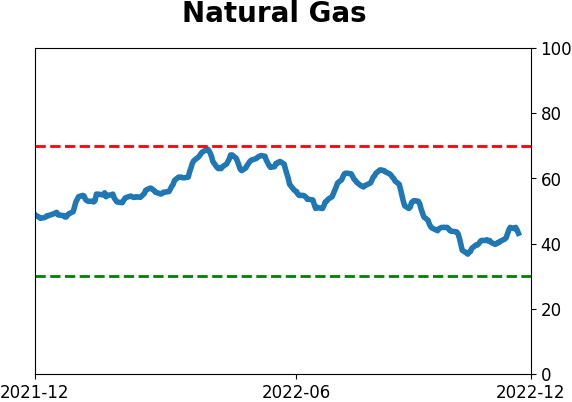
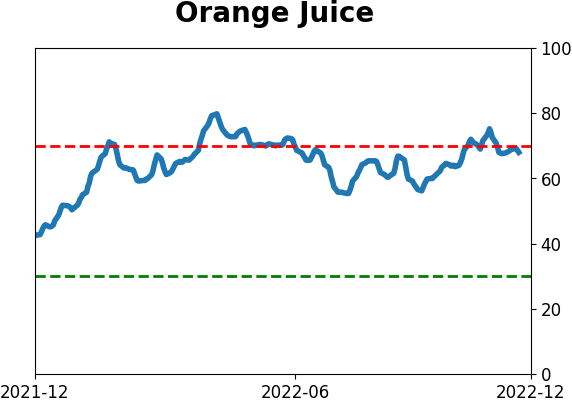
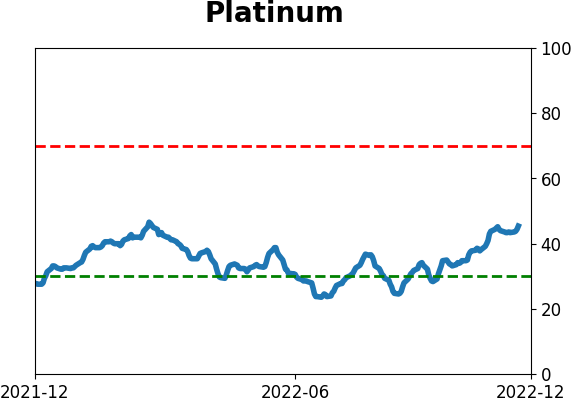
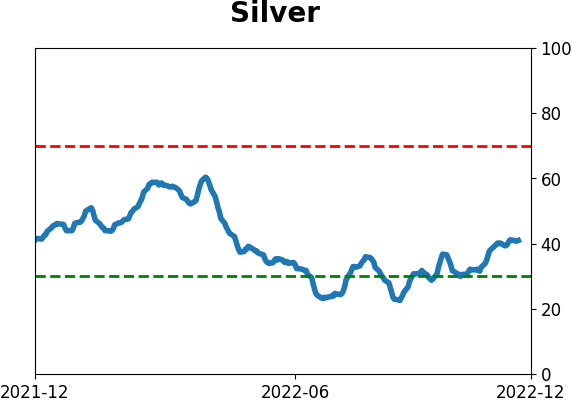
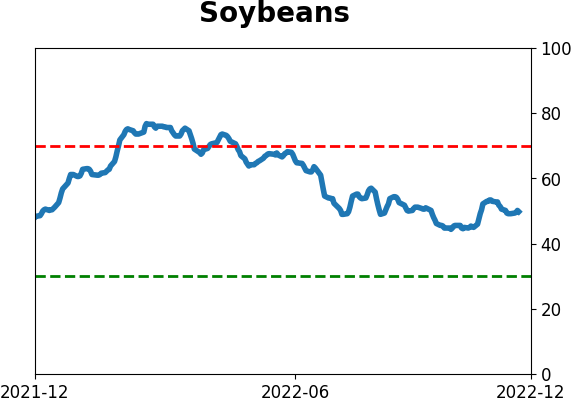
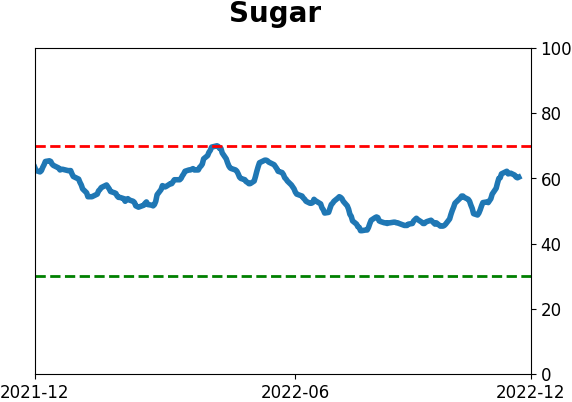
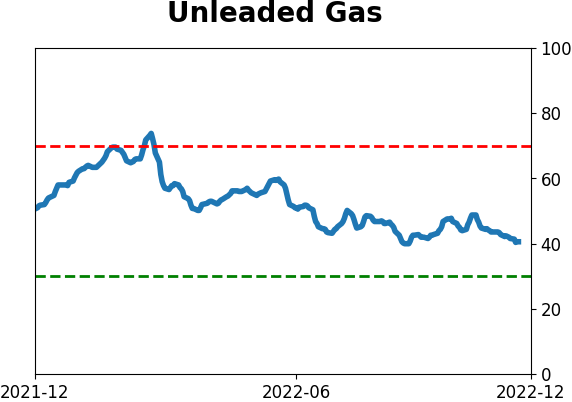
Commodity ETF's - 5-Day Moving Average
|
|