Headlines
|
|
The S&P 500 diverges with some of its stocks:
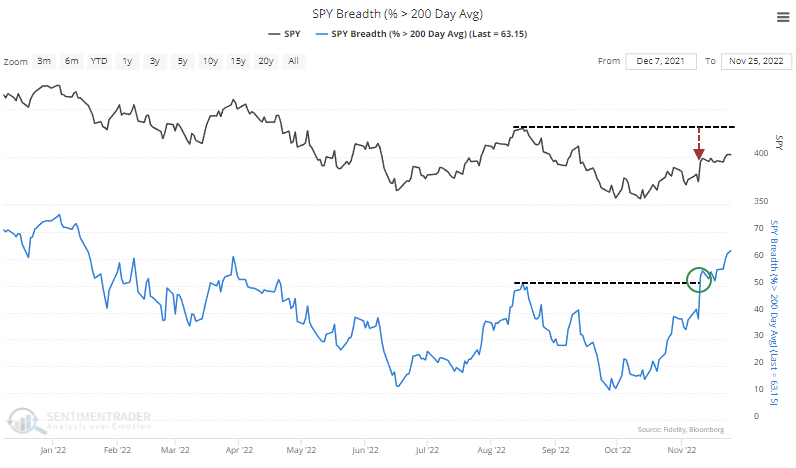
In recent weeks, there has been a breakout to a six-month high in the percentage of S&P 500 member stocks trading above their 200-day moving averages. At the same time, the S&P index itself remained well below its own six-month high. Historically, the members' trends were a better indicator than the index.
|
Smart / Dumb Money Confidence
|
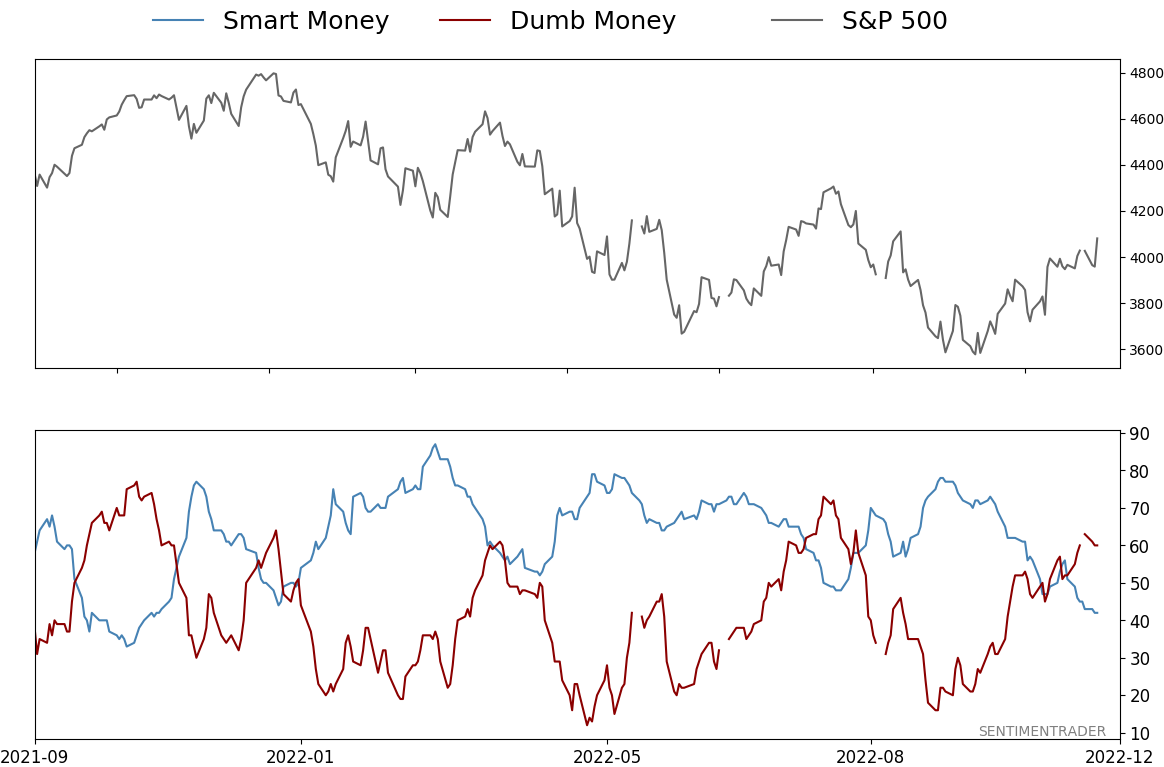
Smart Money Confidence: 42%
Dumb Money Confidence: 60%
|
|
Risk Levels
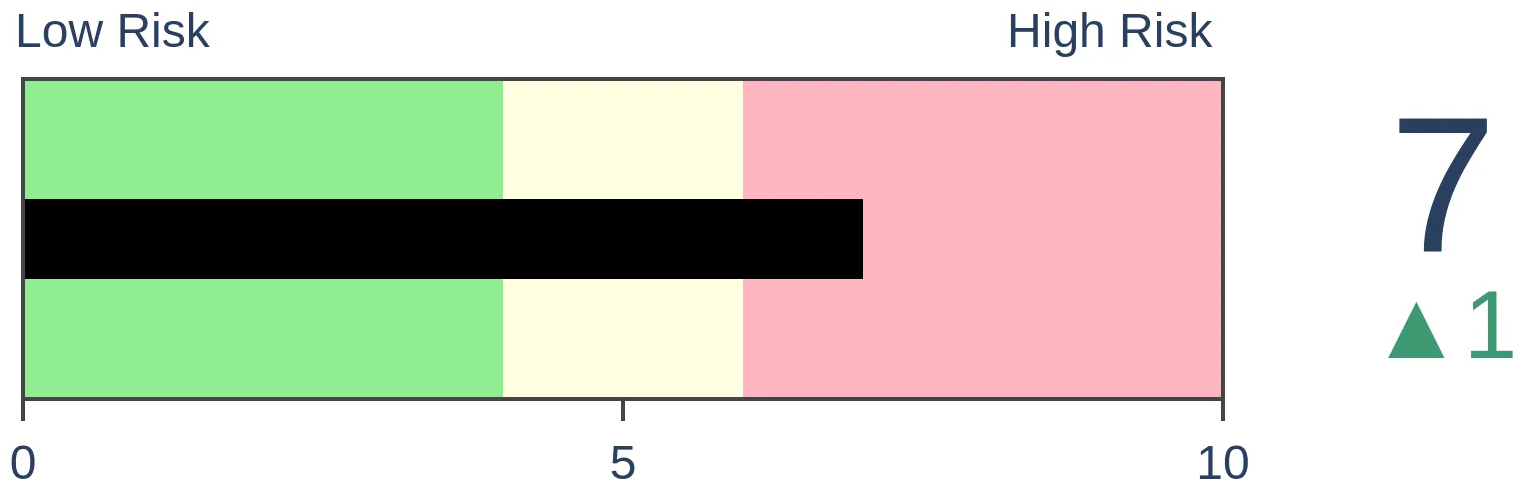
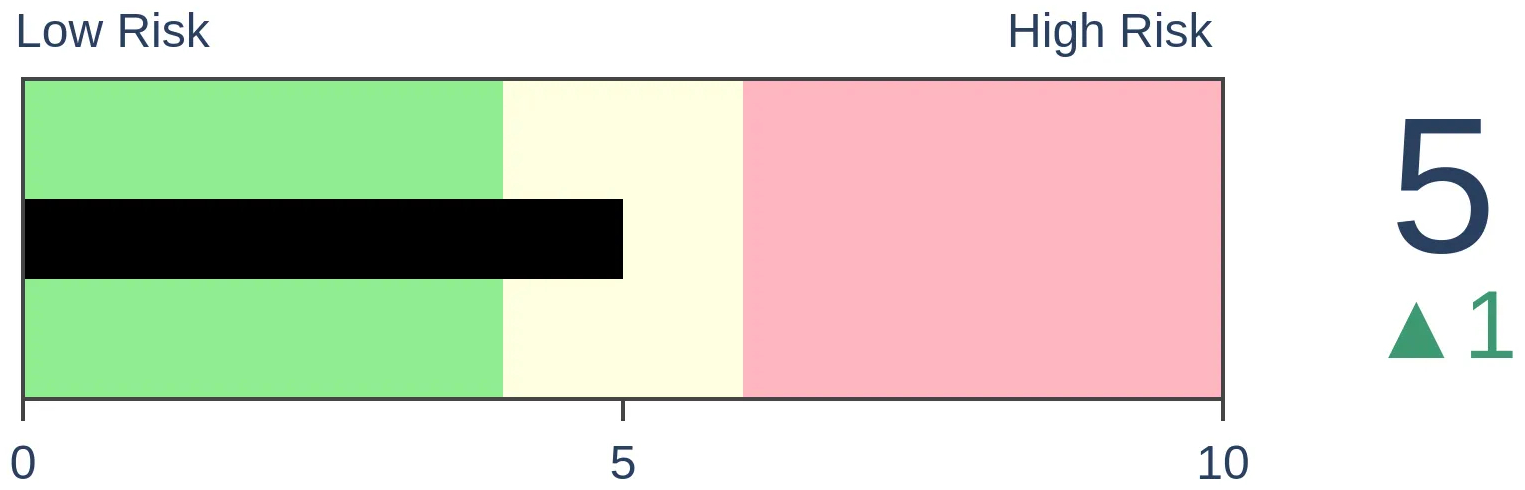
Stocks Short-Term
|
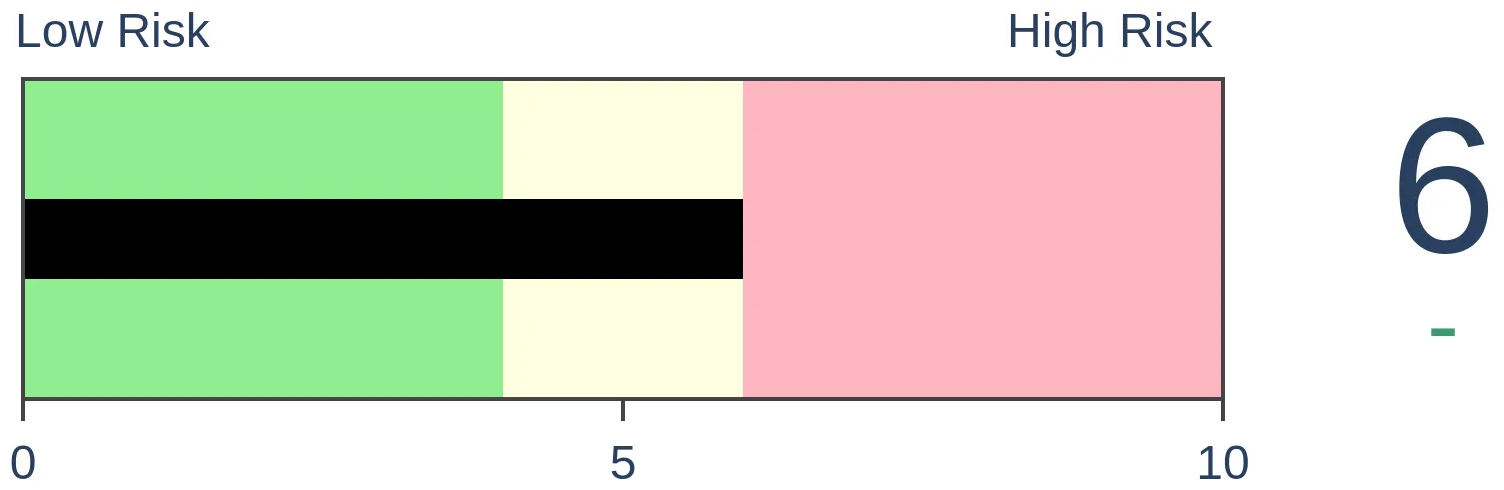
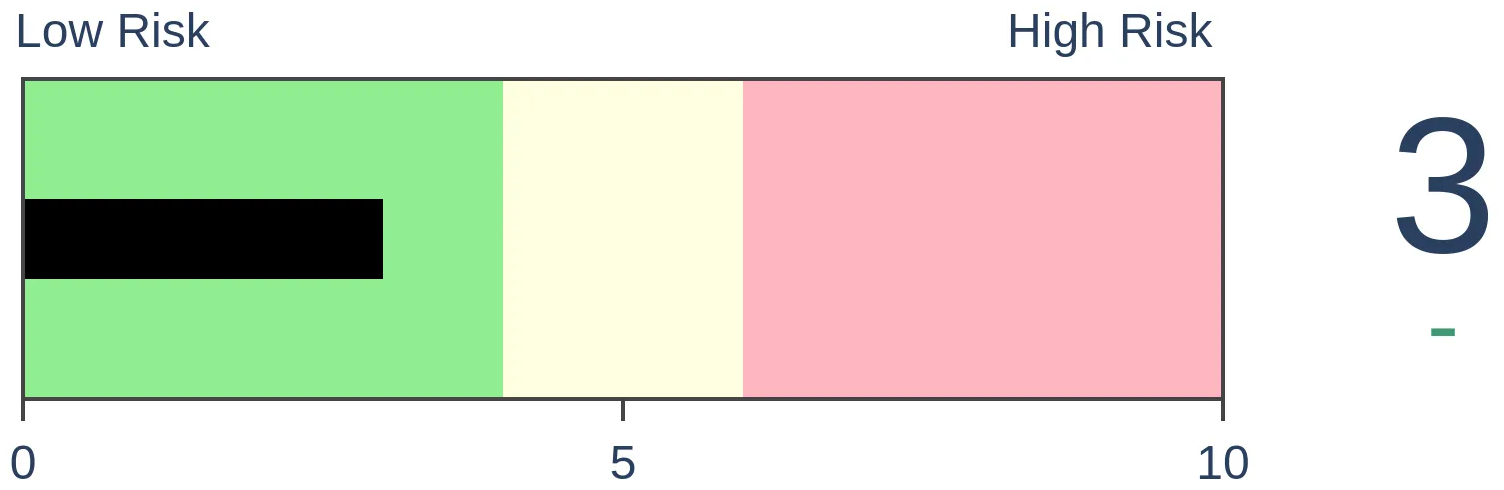
Stocks Medium-Term
|
|
Bonds
|
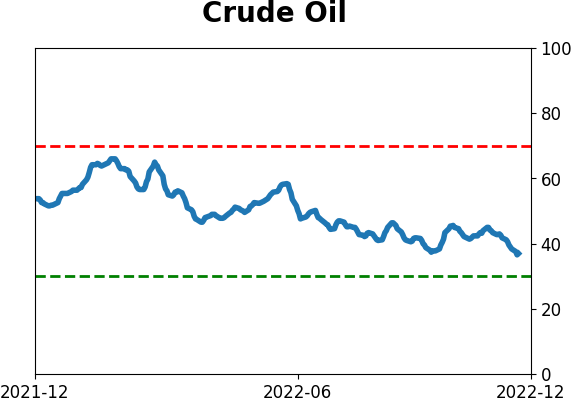
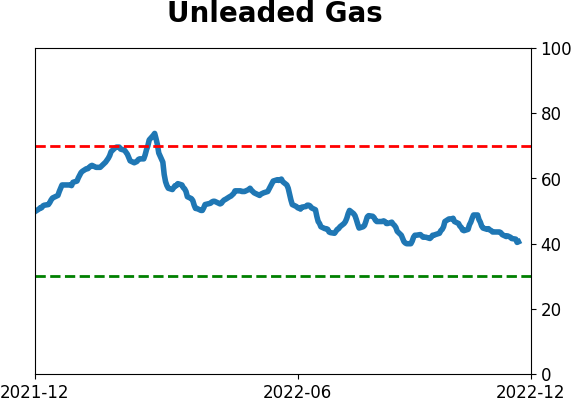
Crude Oil
|
|
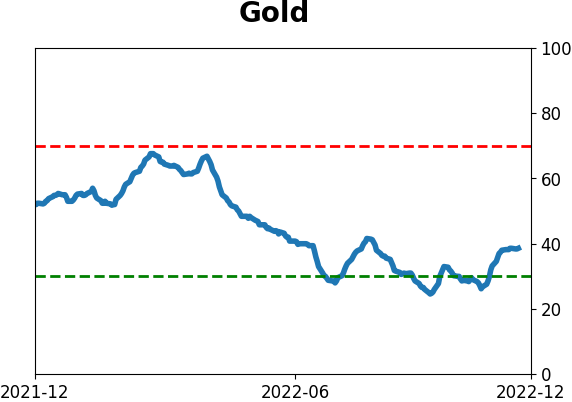
Gold

|
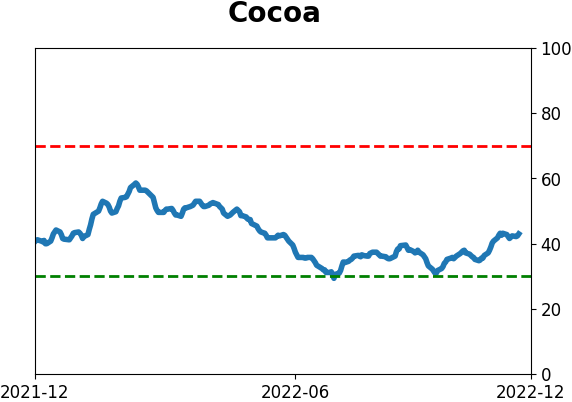
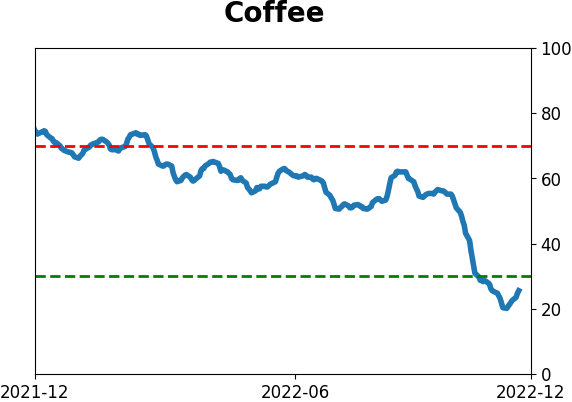
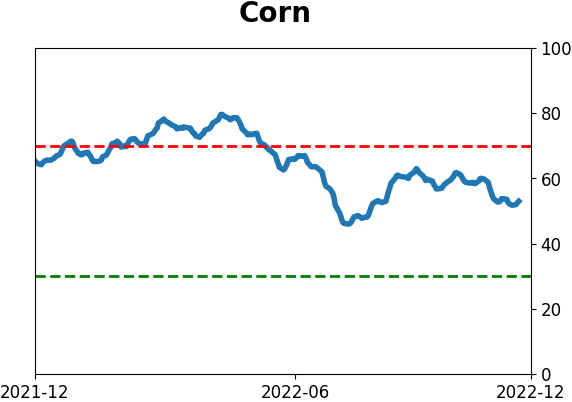
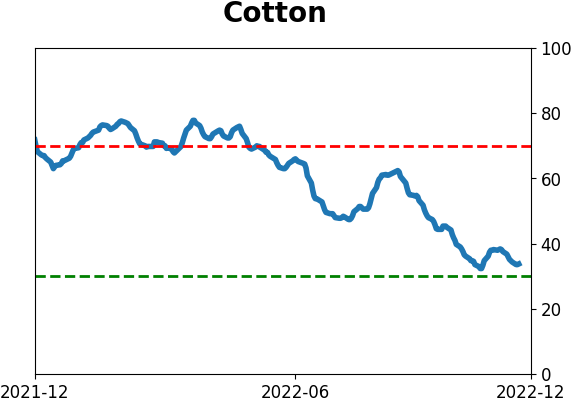
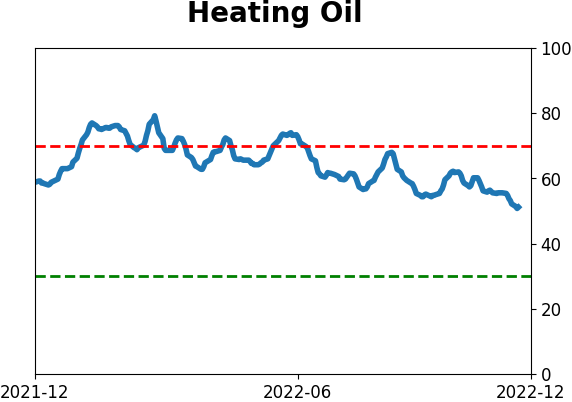
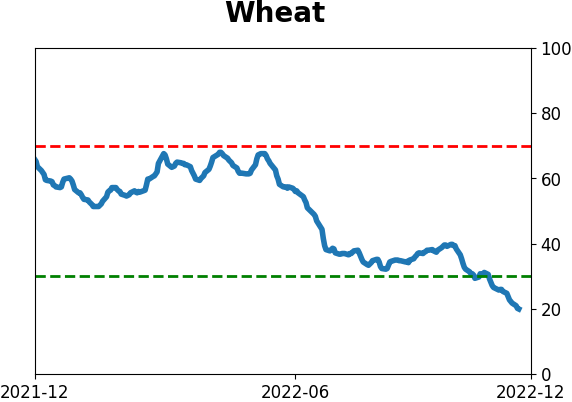
Agriculture
|
|
Research
By Jason Goepfert
BOTTOM LINE
In recent weeks, there has been a breakout to a six-month high in the percentage of S&P 500 member stocks trading above their 200-day moving averages. At the same time, the S&P index itself remained well below its own six-month high. Historically, the members' trends were a better indicator than the index.
FORECAST / TIMEFRAME
None
|
Key points:
- The percentage of S&P 500 stocks trading above their 200-day moving average broke out to a six-month high
- The S&P index itself, however, has remained well below its own high
- Historically, the trend in member stock participation tended to be a better indicator than that of the index
Stocks are heartily leading the index
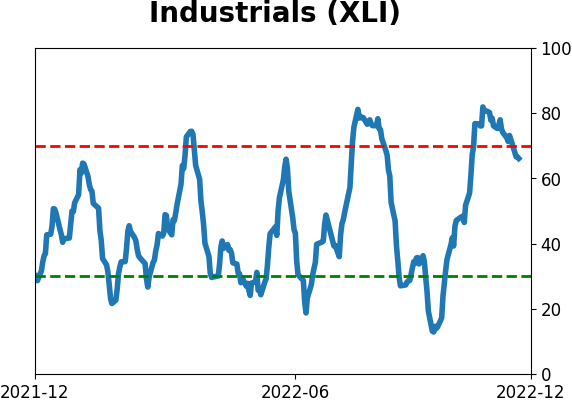
The Industrial sector has been surging, with nearly every stock recovering above its 50-day moving average. Even longer-term uptrends have been improving, with more than 75% of the stocks above their 200-day averages.
As we saw on Tuesday, moves like this in the Industrial sector have tended to be good omens for the broader S&P 500. And indeed, there has been a marked divergence between the most benchmarked index in the world and the trends of its underlying stocks.
Earlier this month, the S&P was trading more than 8% below its high of the past six months, while the percentage of its member stocks trading above their 200-day averages reached a new six-month high.
It should be noted right off the bat that this also happened in 2000 and that...did not work out well.
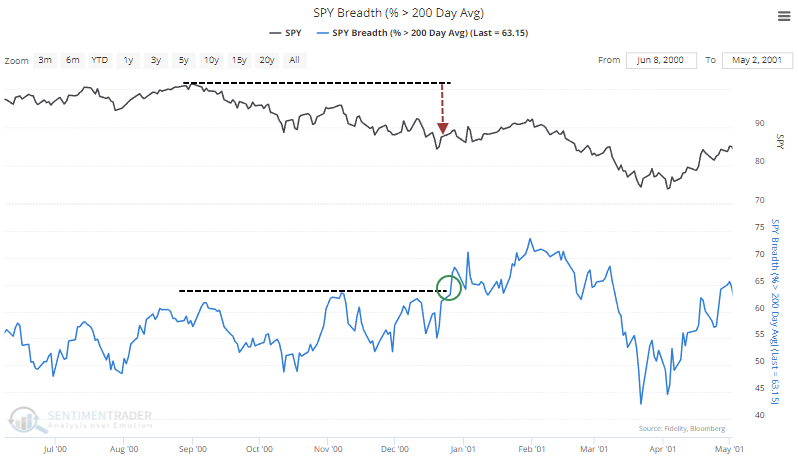
Instead of a cherry-picked call for doom, let's look objectively at all the history we can muster. There isn't much because this is an unusual development, despite 70 years of historical data.
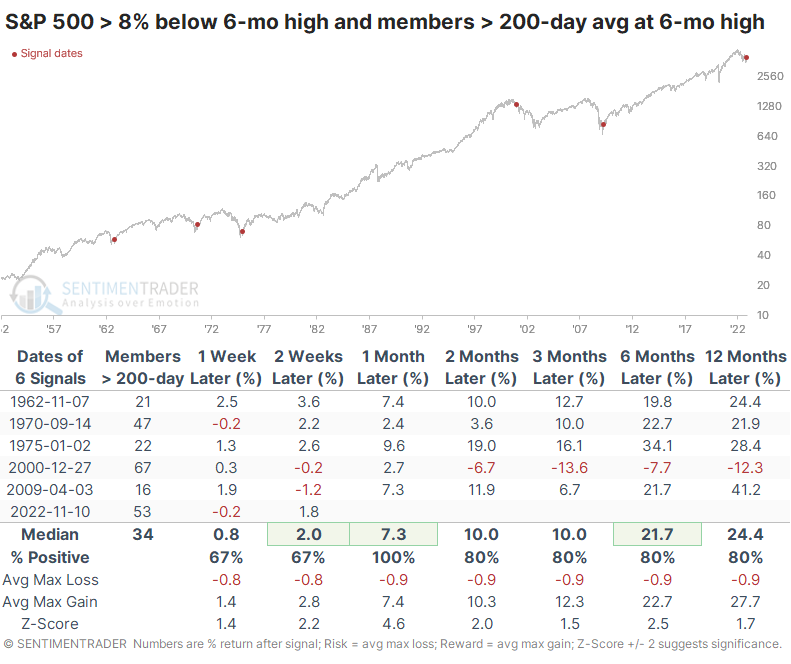
The table below shows every time when the S&P was at least 8% below its six-month high, but the percentage of its members trading above their 200-day average hit a six-month high. Forward returns were good, but that signal in 2000 was a woeful exception.
If we relax the parameters, we can generate a larger sample size. Of course, the unfortunate signal in 2000 remains, and a couple of others popped up, like in 2008 and 1973. But, generally, divergences like this tend to resolve in favor of the members and not the index. In other words, internal participation tended to be a better indicator than the index's price action.
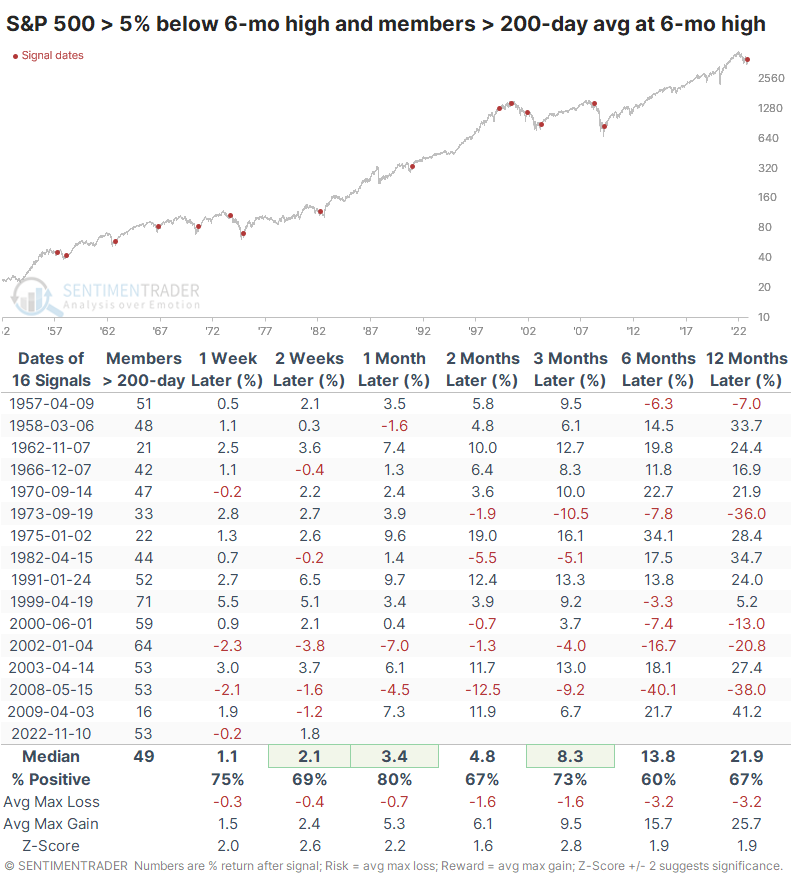
Again, there were a few terrible losses after these signals. But on average, the S&P's maximum drawdown over the next year was only -3.2%, versus an average maximum gain of more than +25%.
It's a modest positive that when this divergence first triggered a couple of weeks ago, stocks didn't fall apart. The S&P has added to its gains, which is not something that occurred in either 2002 or 2008, so it's a small indication that perhaps this time is different than a couple of the worst outcomes.
Another impressive medium-term cycle
Another difference with the midst of the last two protracted bear markets is that there has been a tremendous surge in the percentage of stocks trading above their medium-term 50-day moving averages.
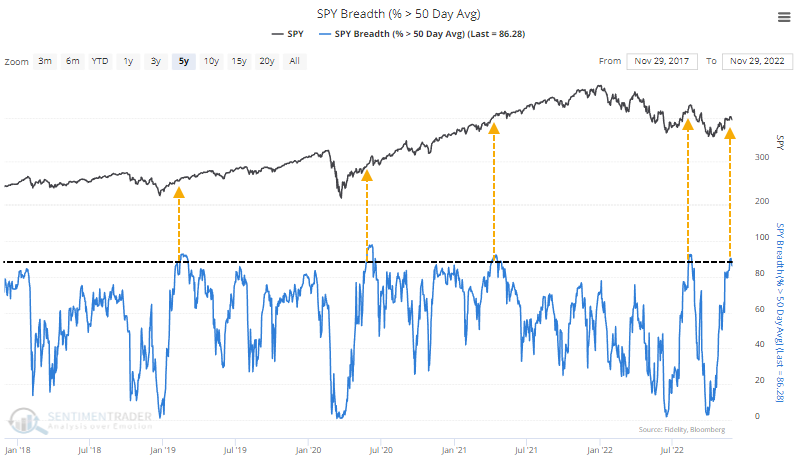
During modern markets, there have been 13 other times when the percentage of S&P 500 members above their averages cycled from fewer than 3% to more than 90%. All of them showed gains 6-12 months later.
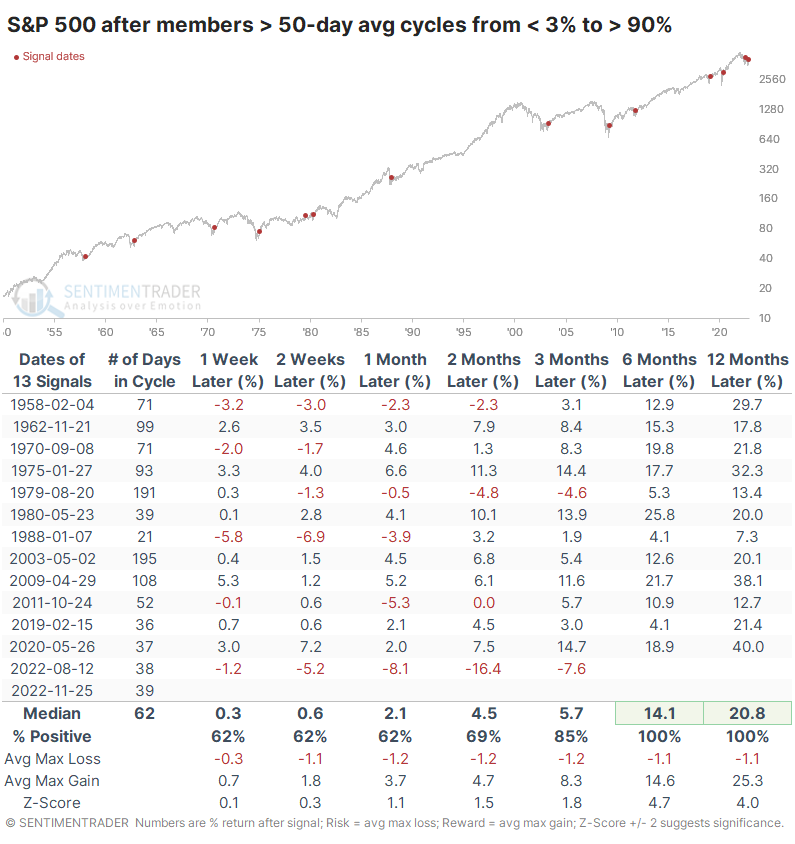
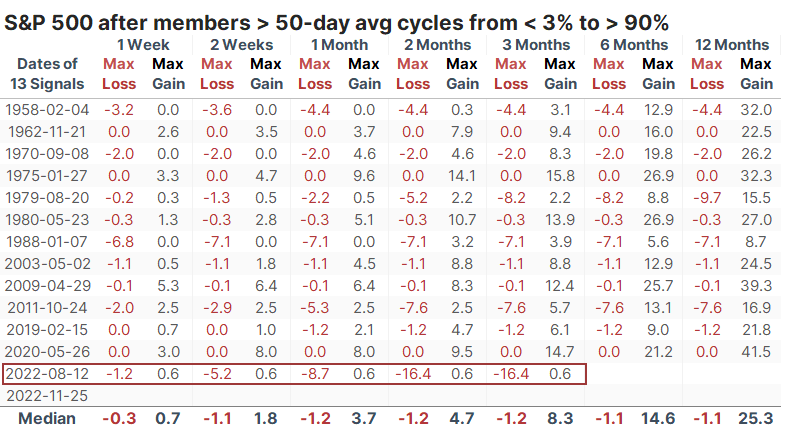
The biggest caveat here is that the last signal was a miserable failure, the worst one in 70 years. It's the only time the S&P lost more than 10% at any point within a year.
What the research tells us...
There are signs that stocks have become overbought, and there has been a bit of a pullback in response. That has triggered some concern among investors because it's exactly what we saw in August as stocks peaked. Some differences include a much more friendly seasonal calendar and significantly better participation among member stocks.
Indicators at Extremes
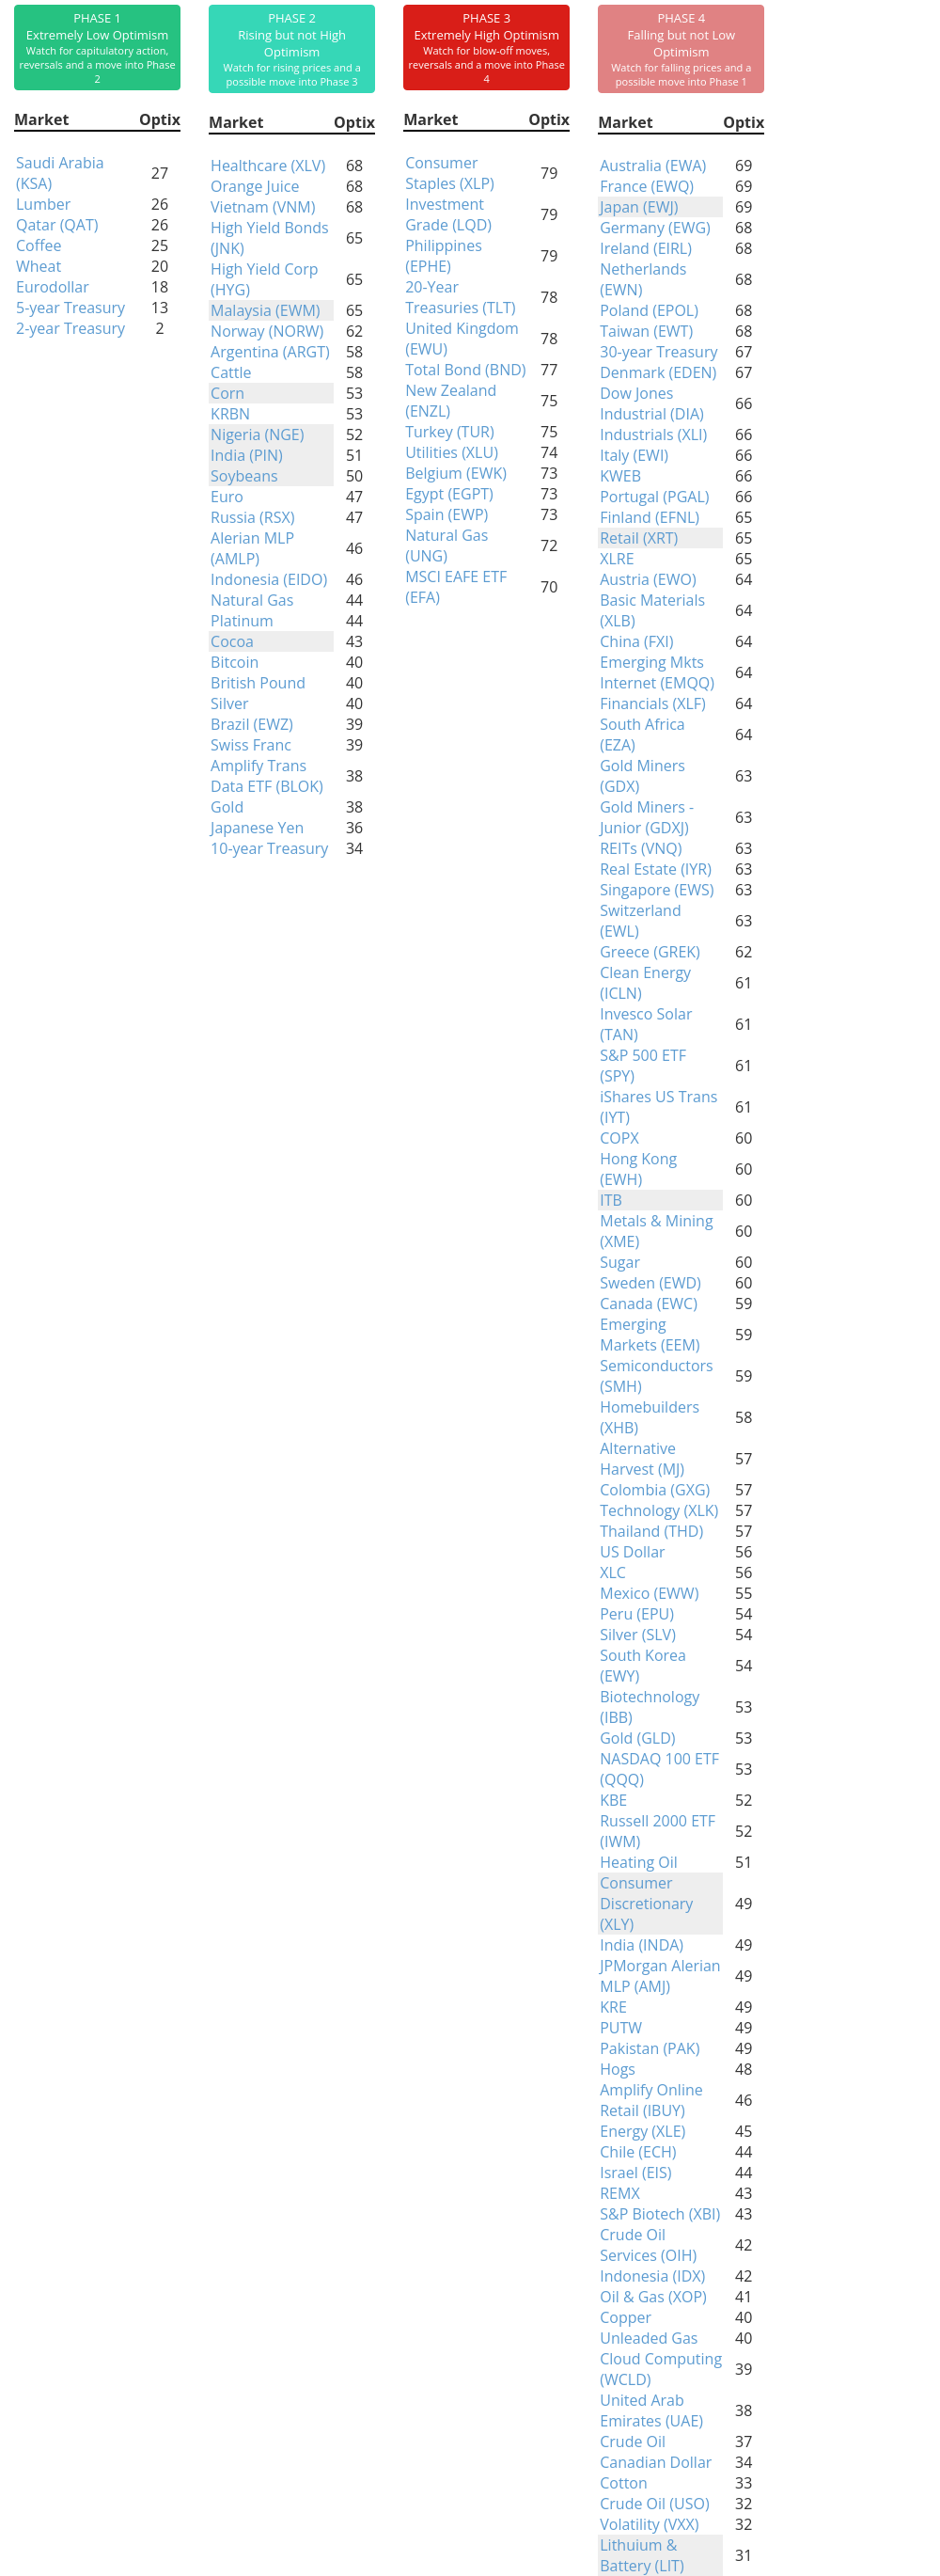
Phase Table
Ranks
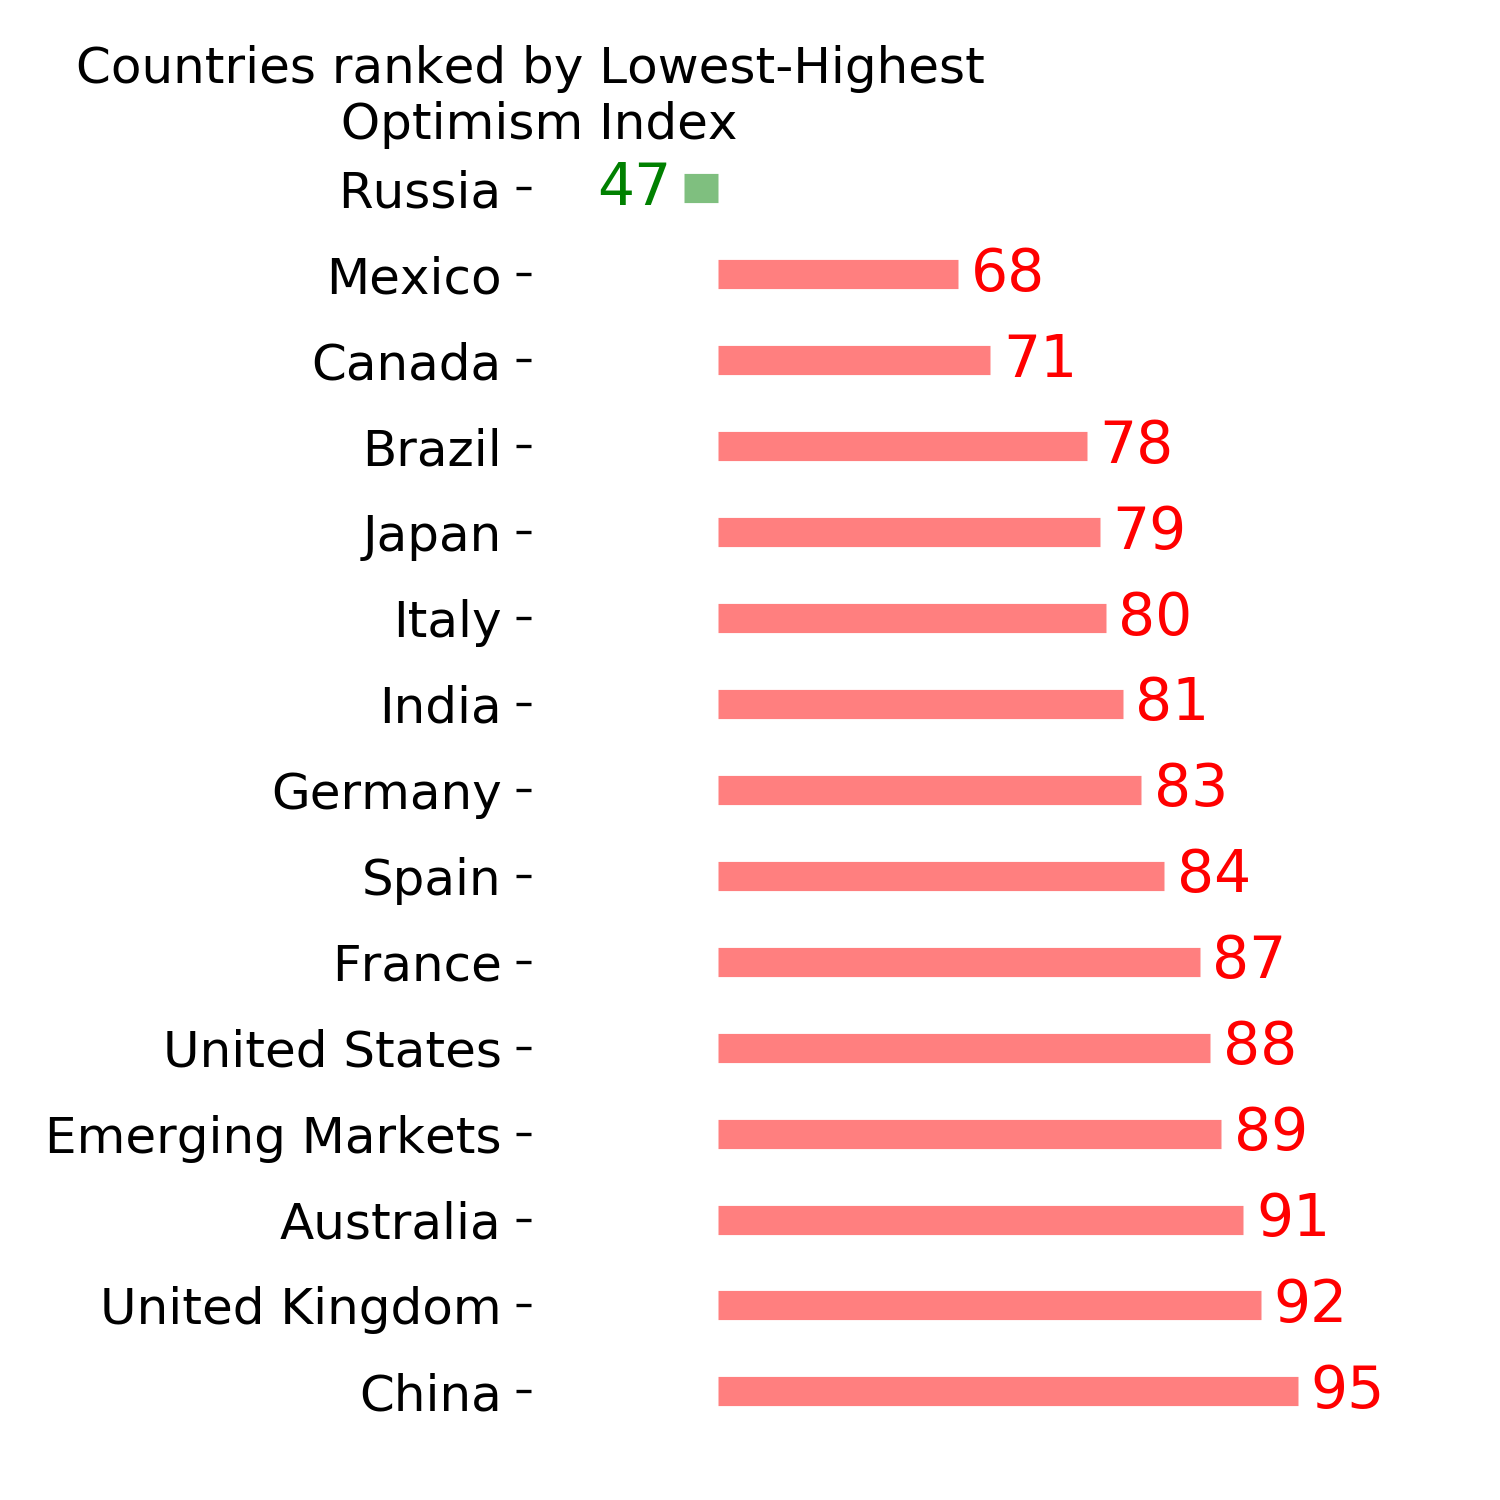
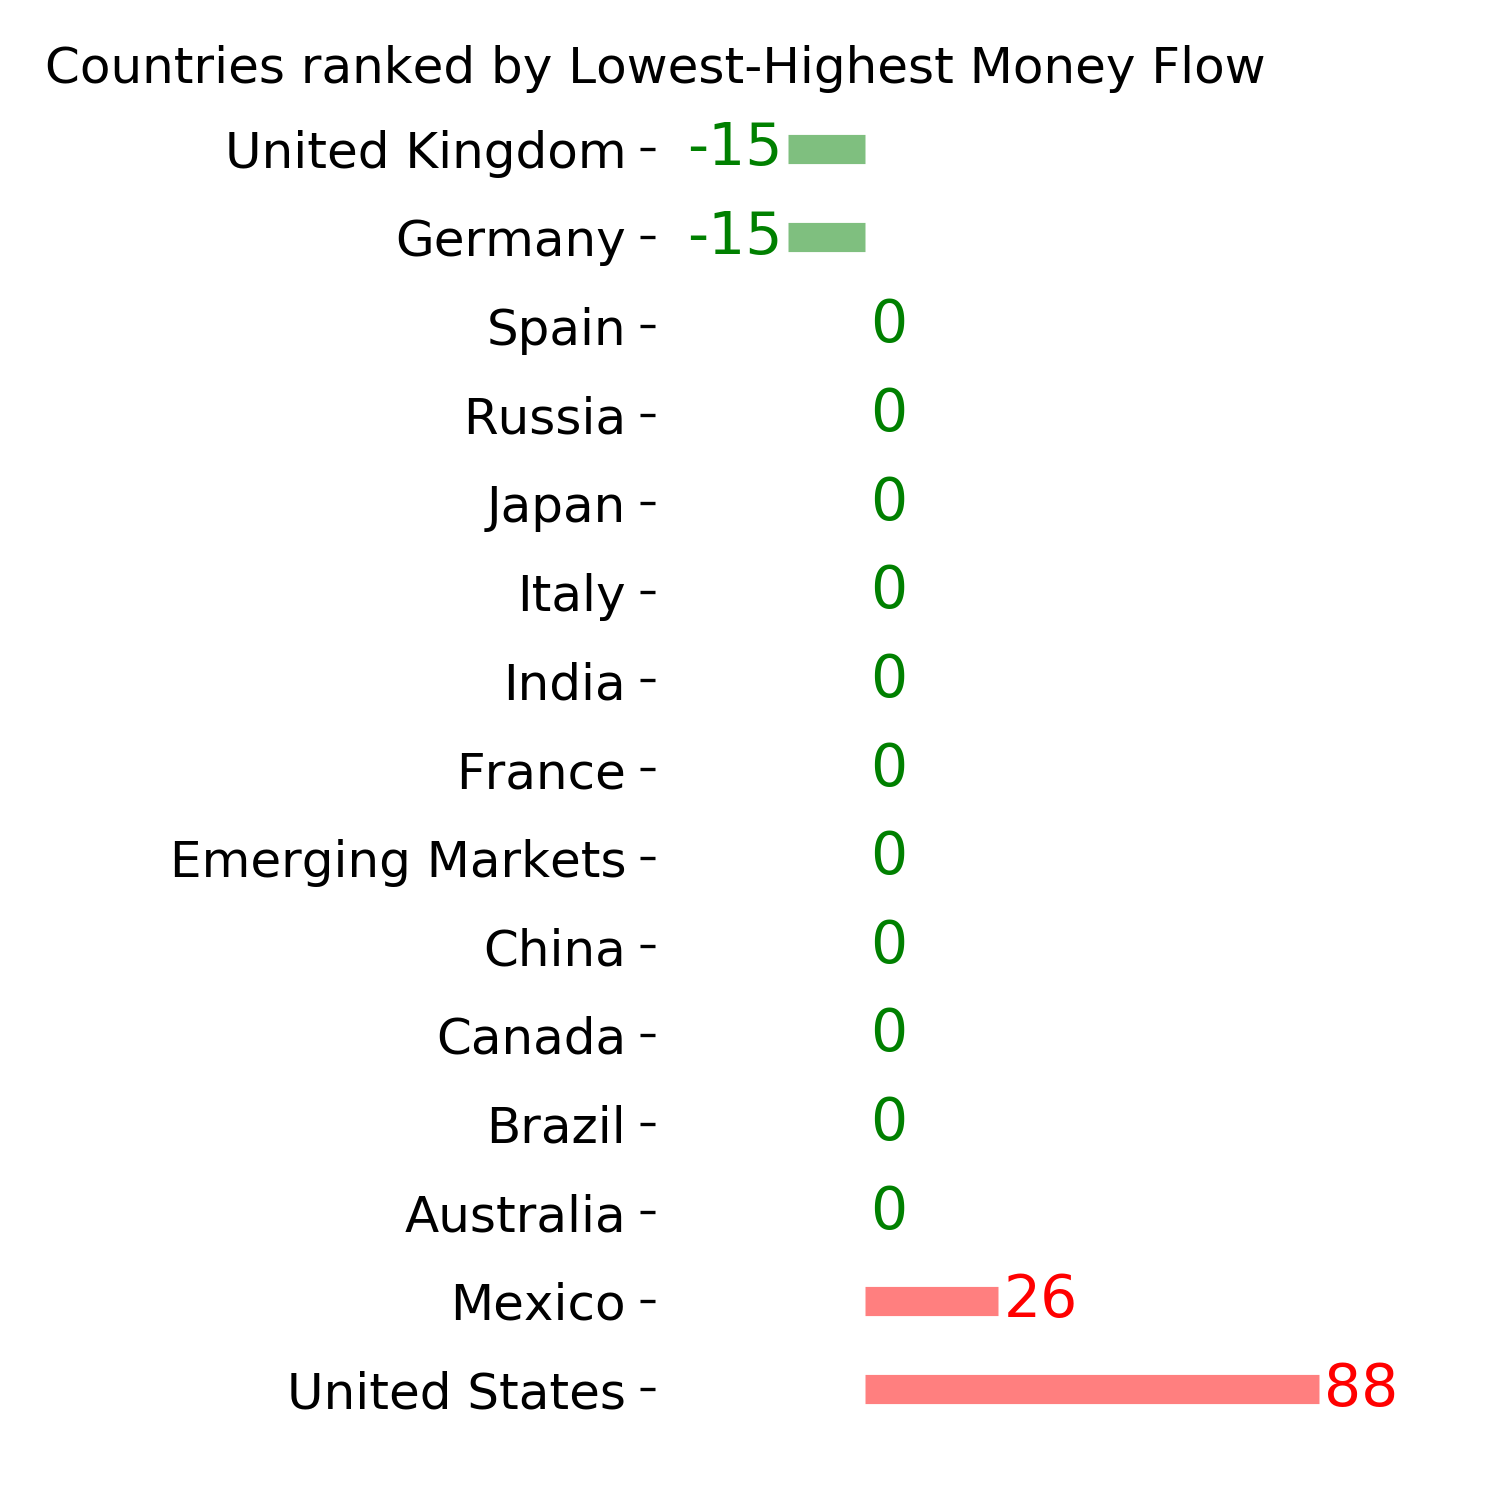
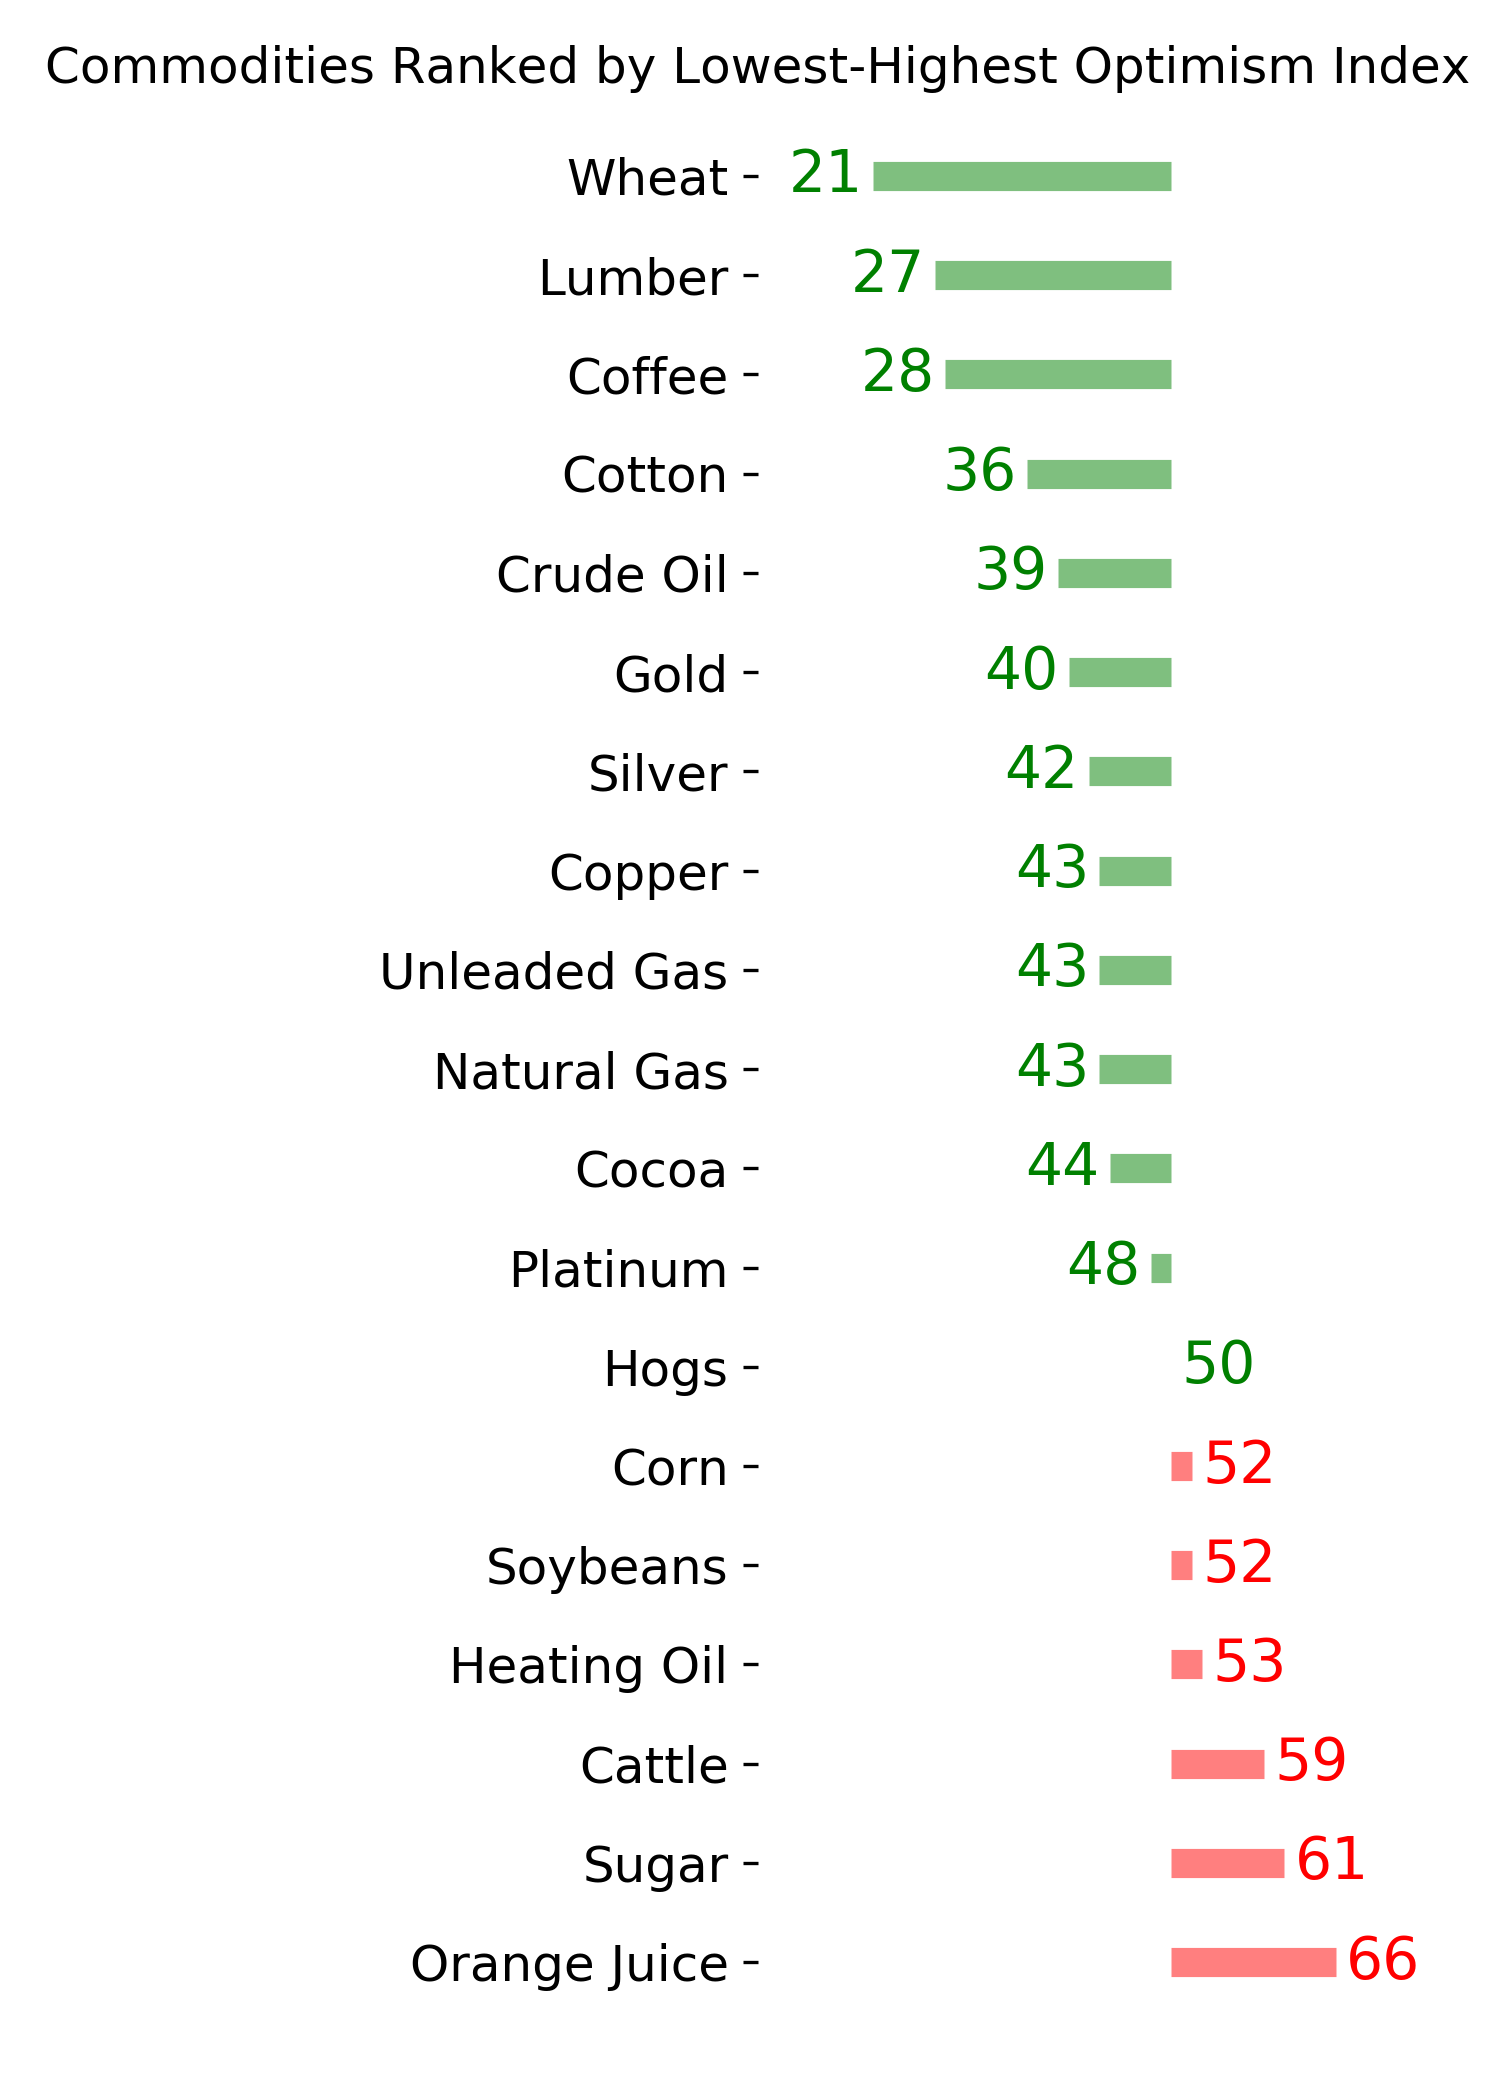
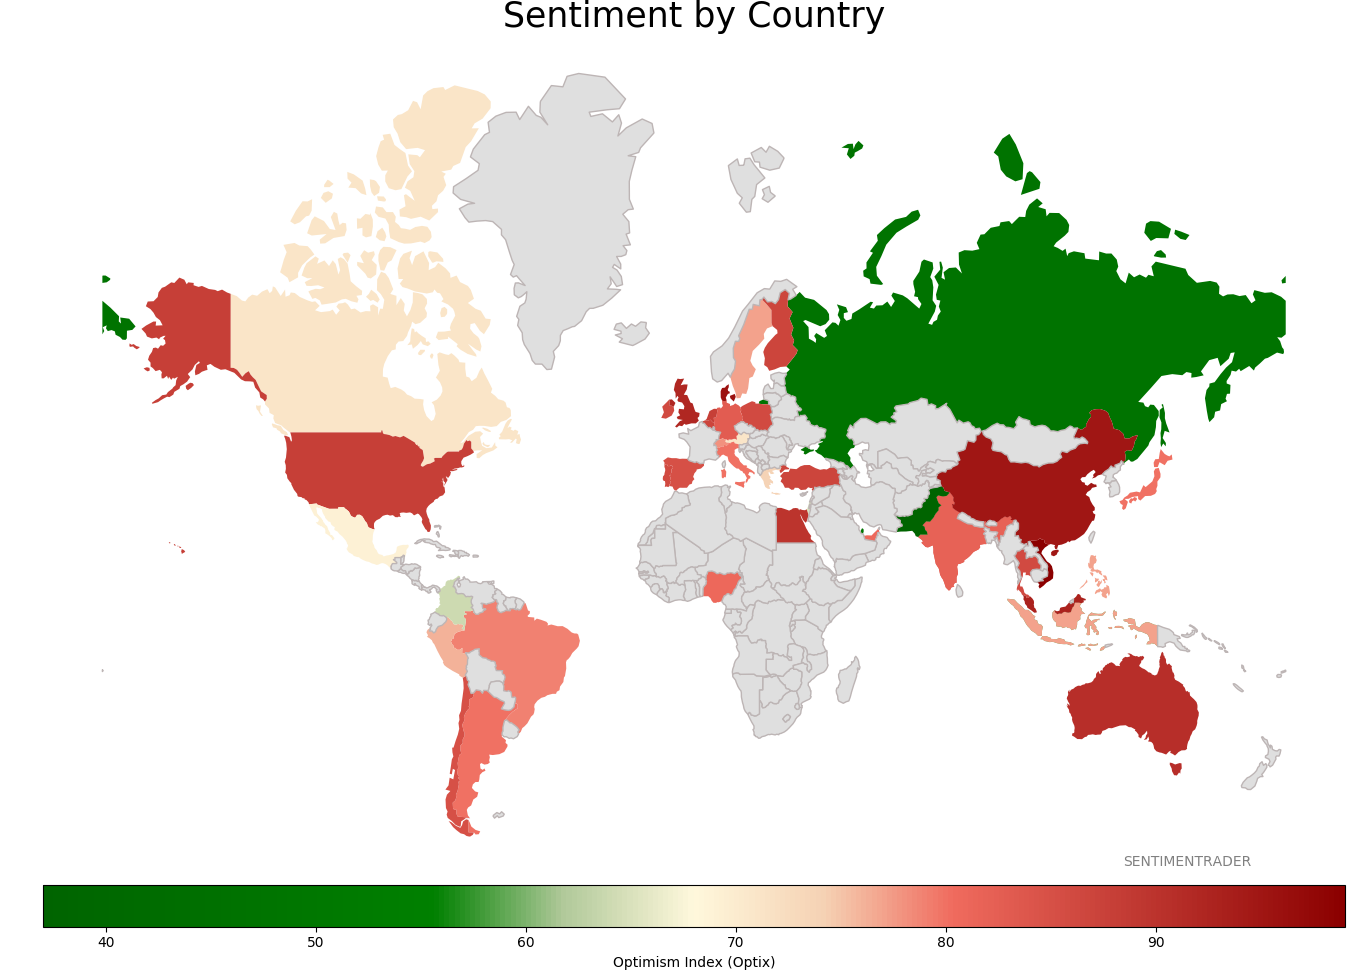
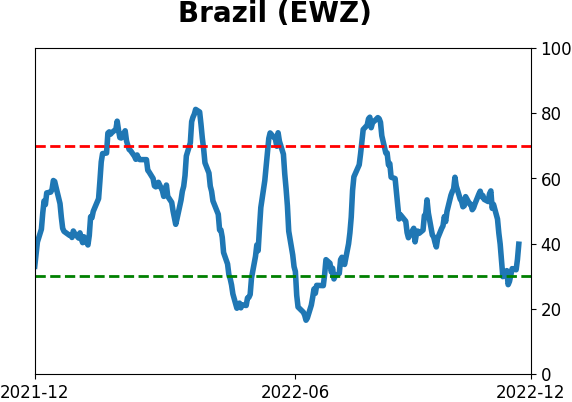
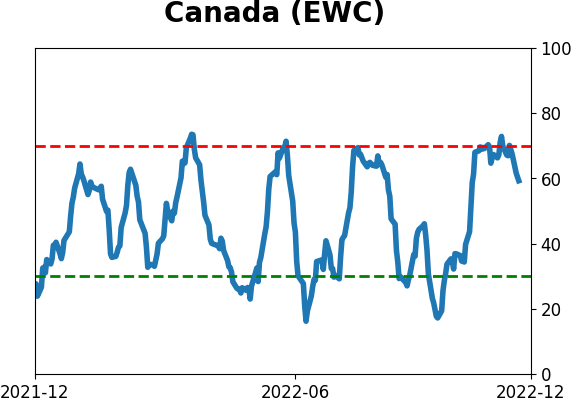
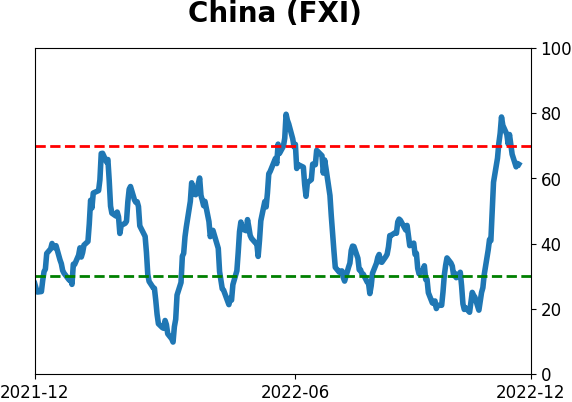
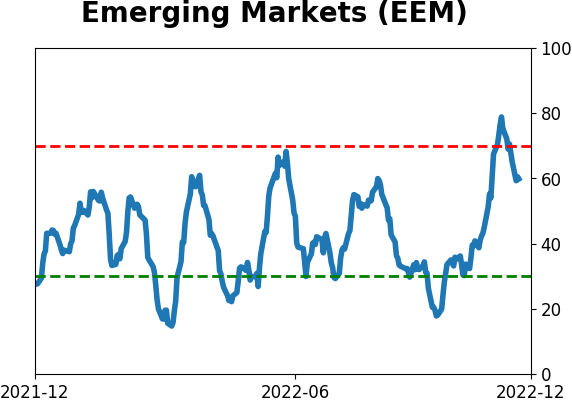
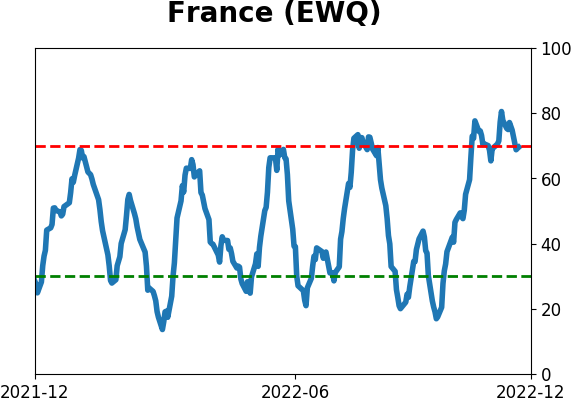
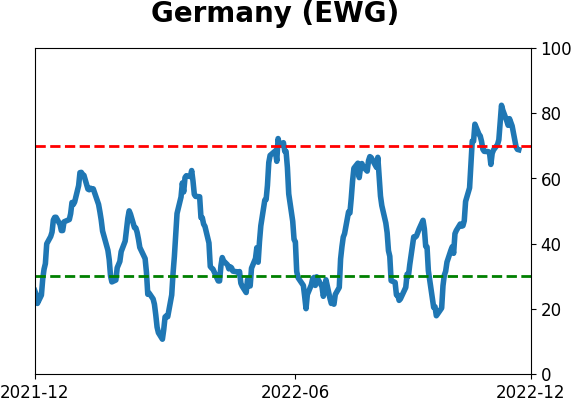
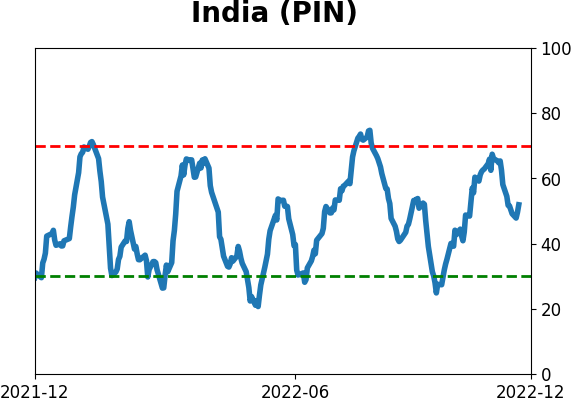
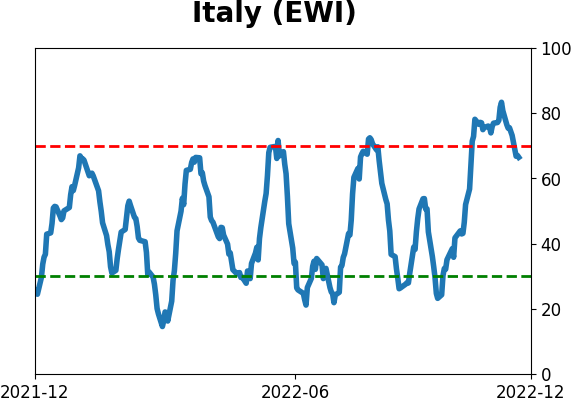
Sentiment Around The World
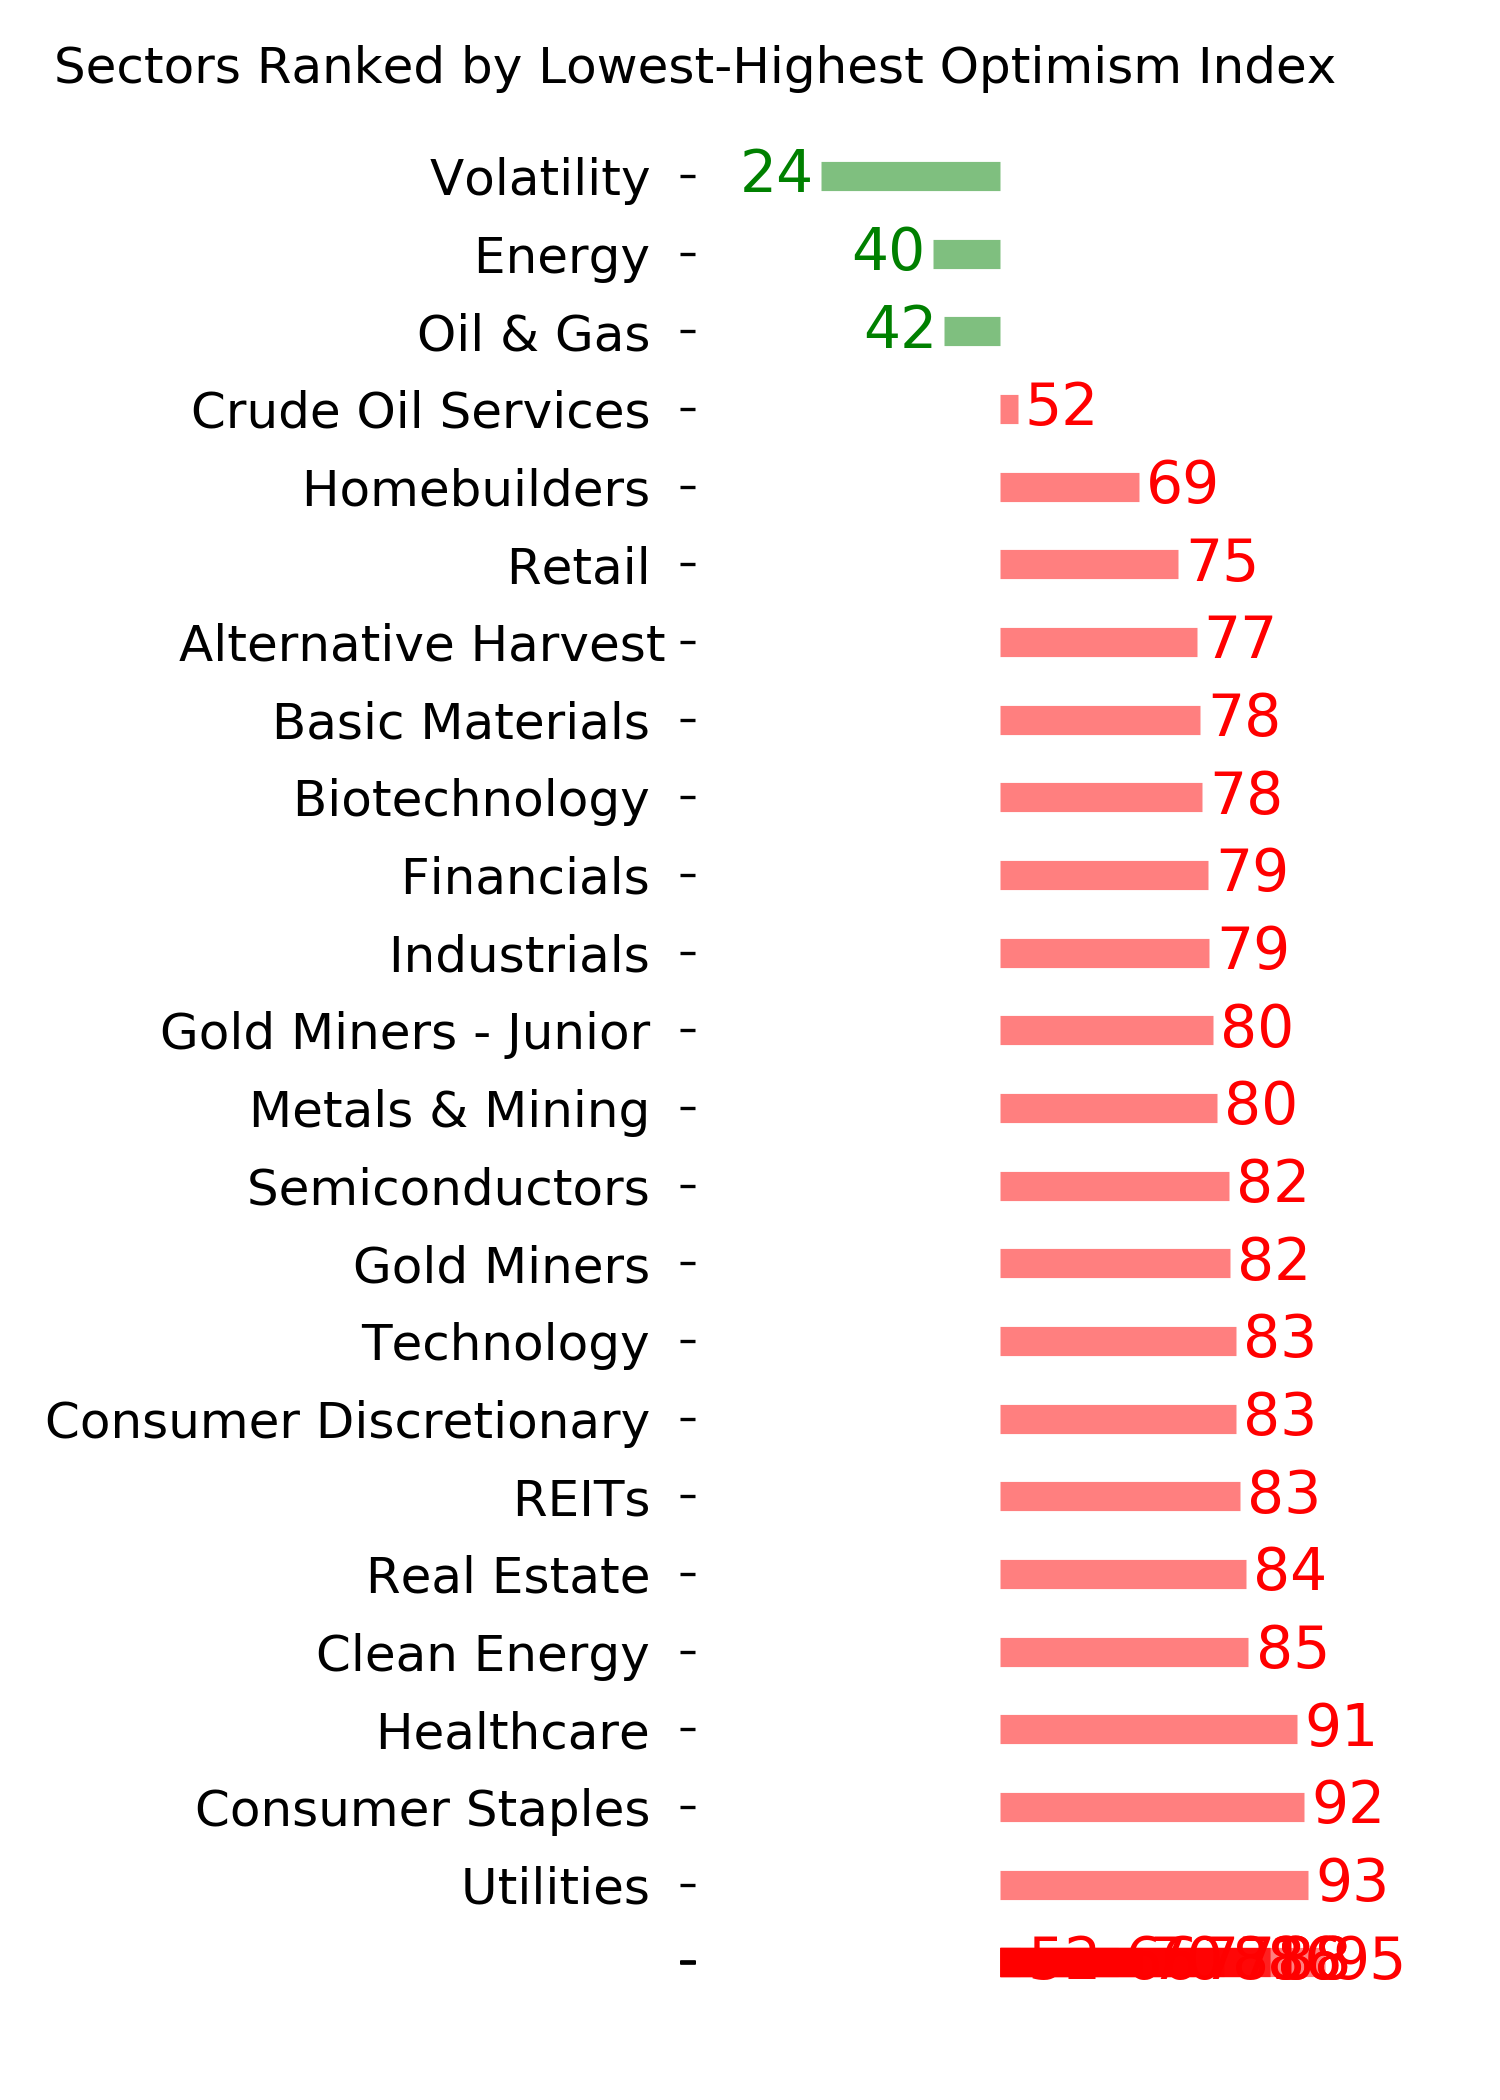
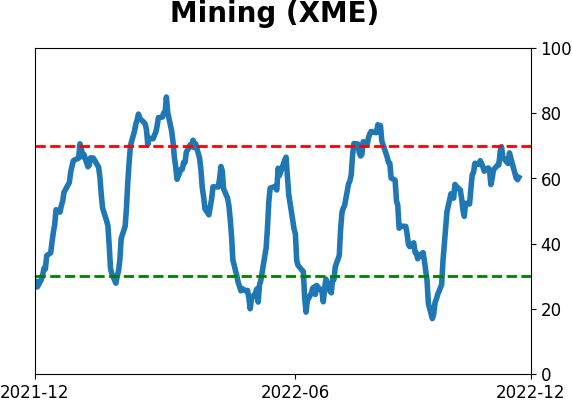
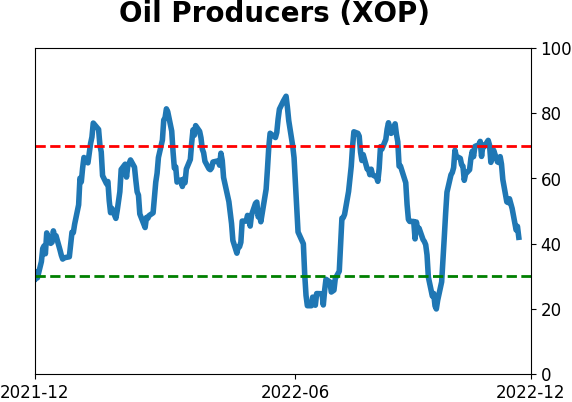
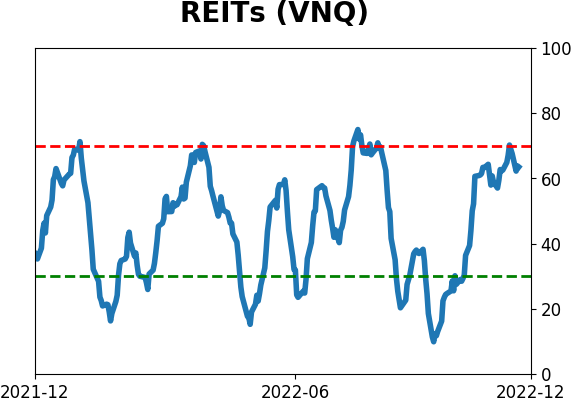
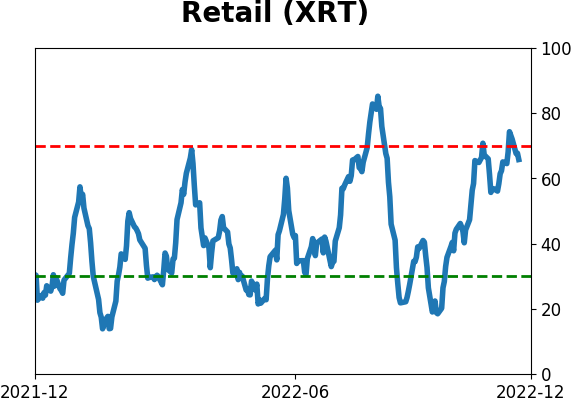
Optimism Index Thumbnails
|
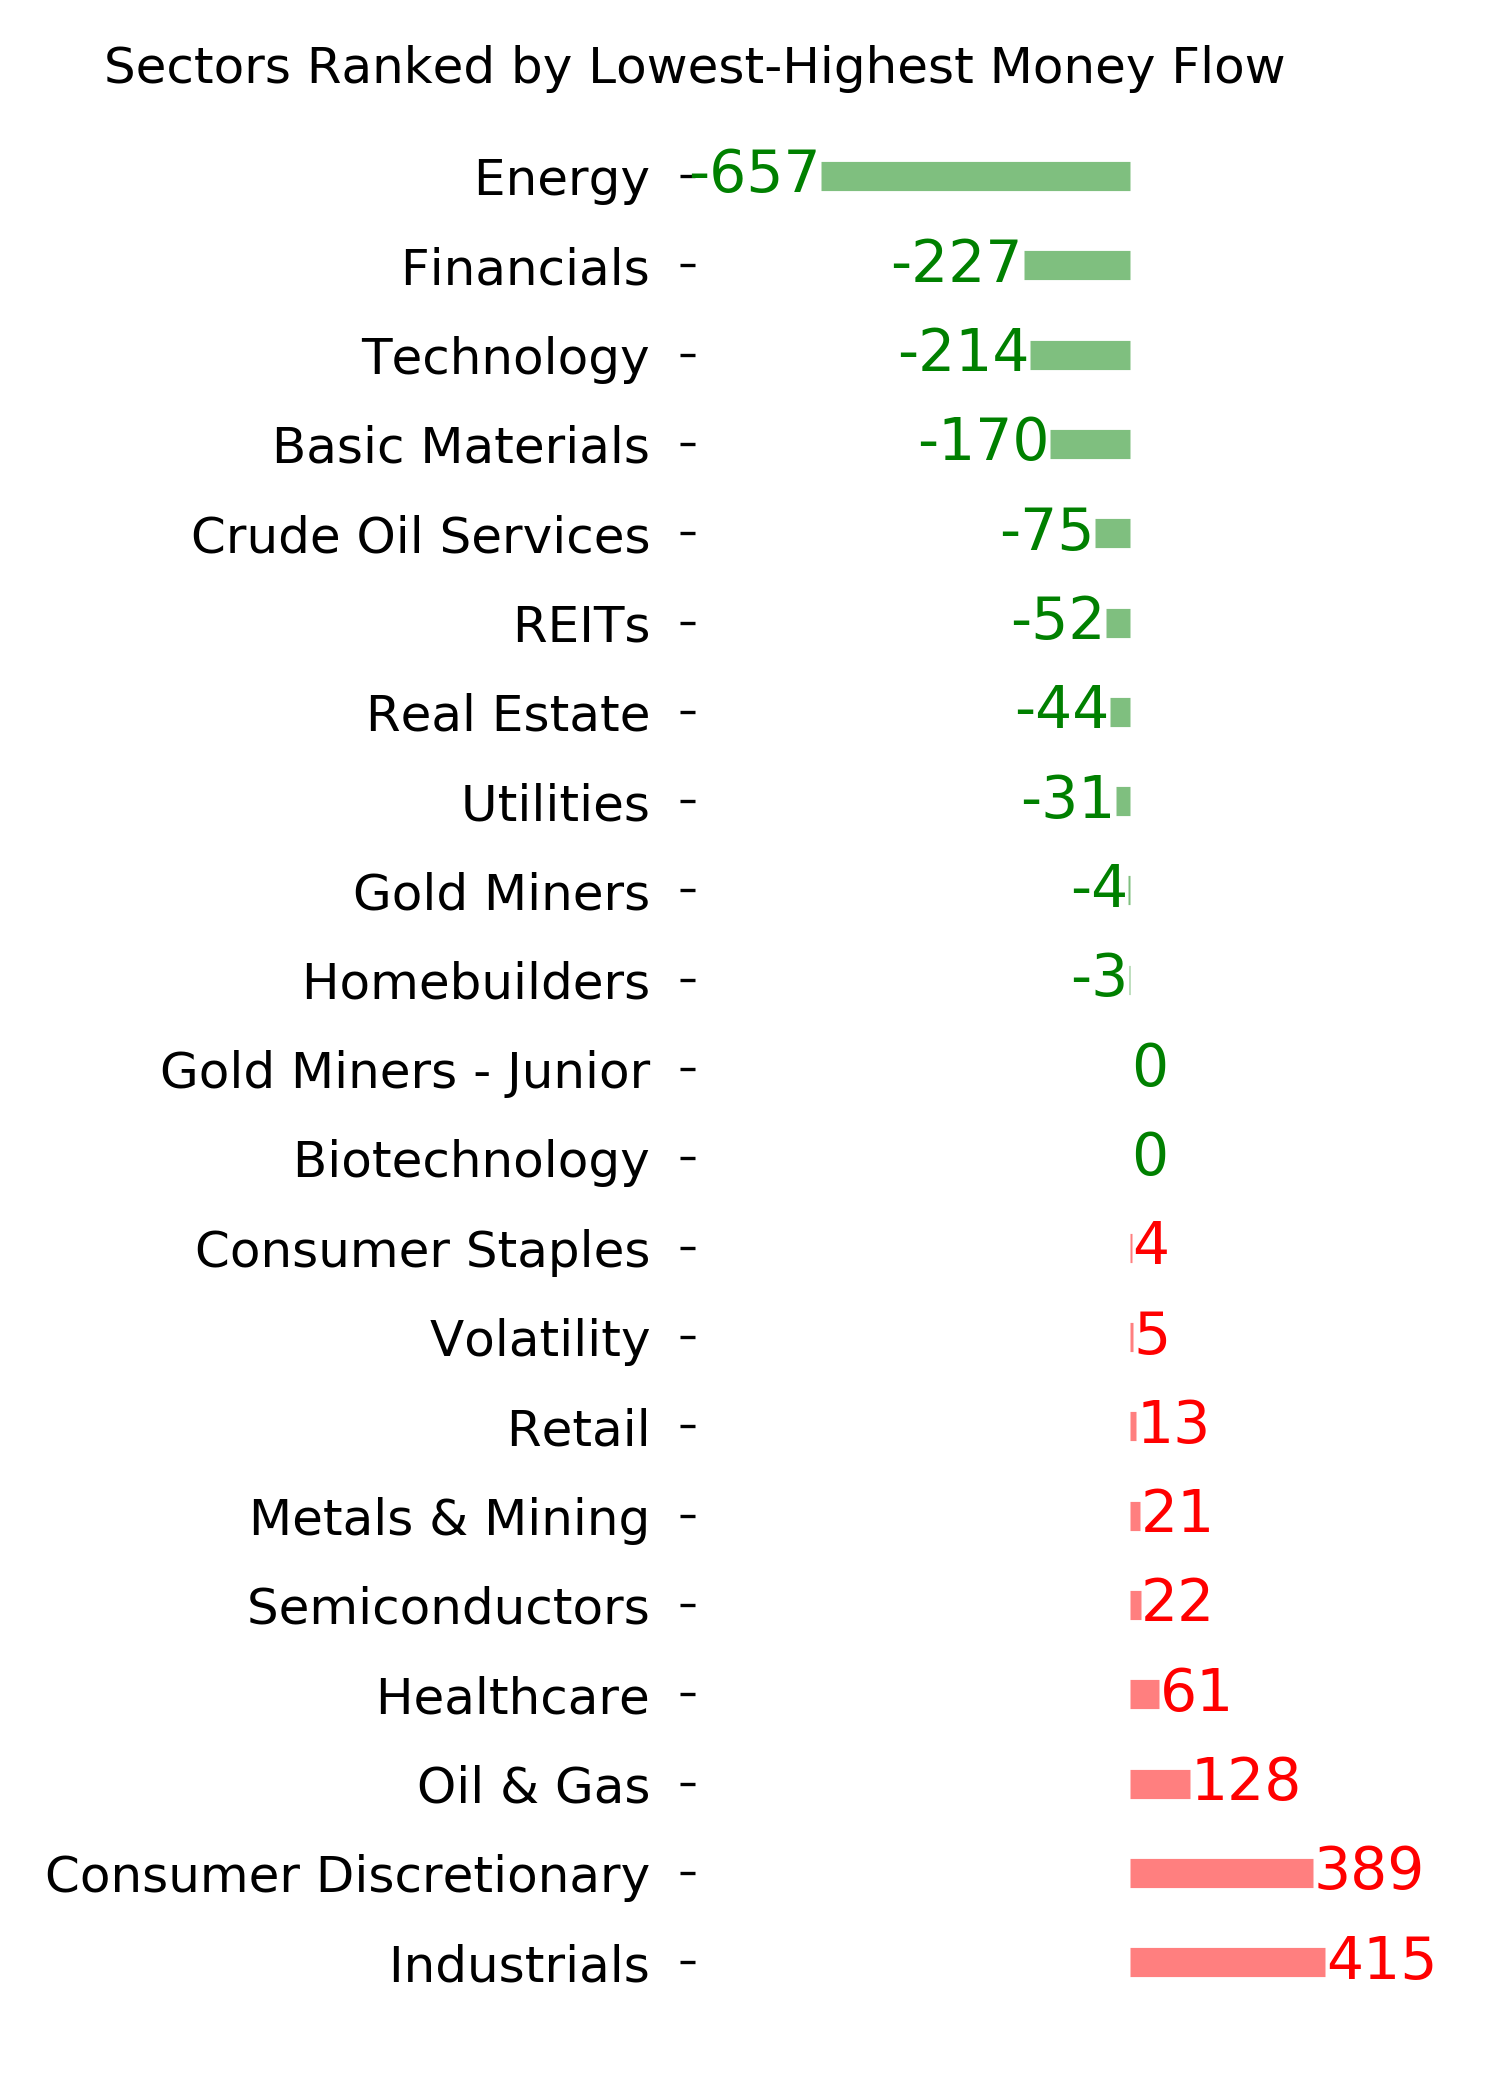
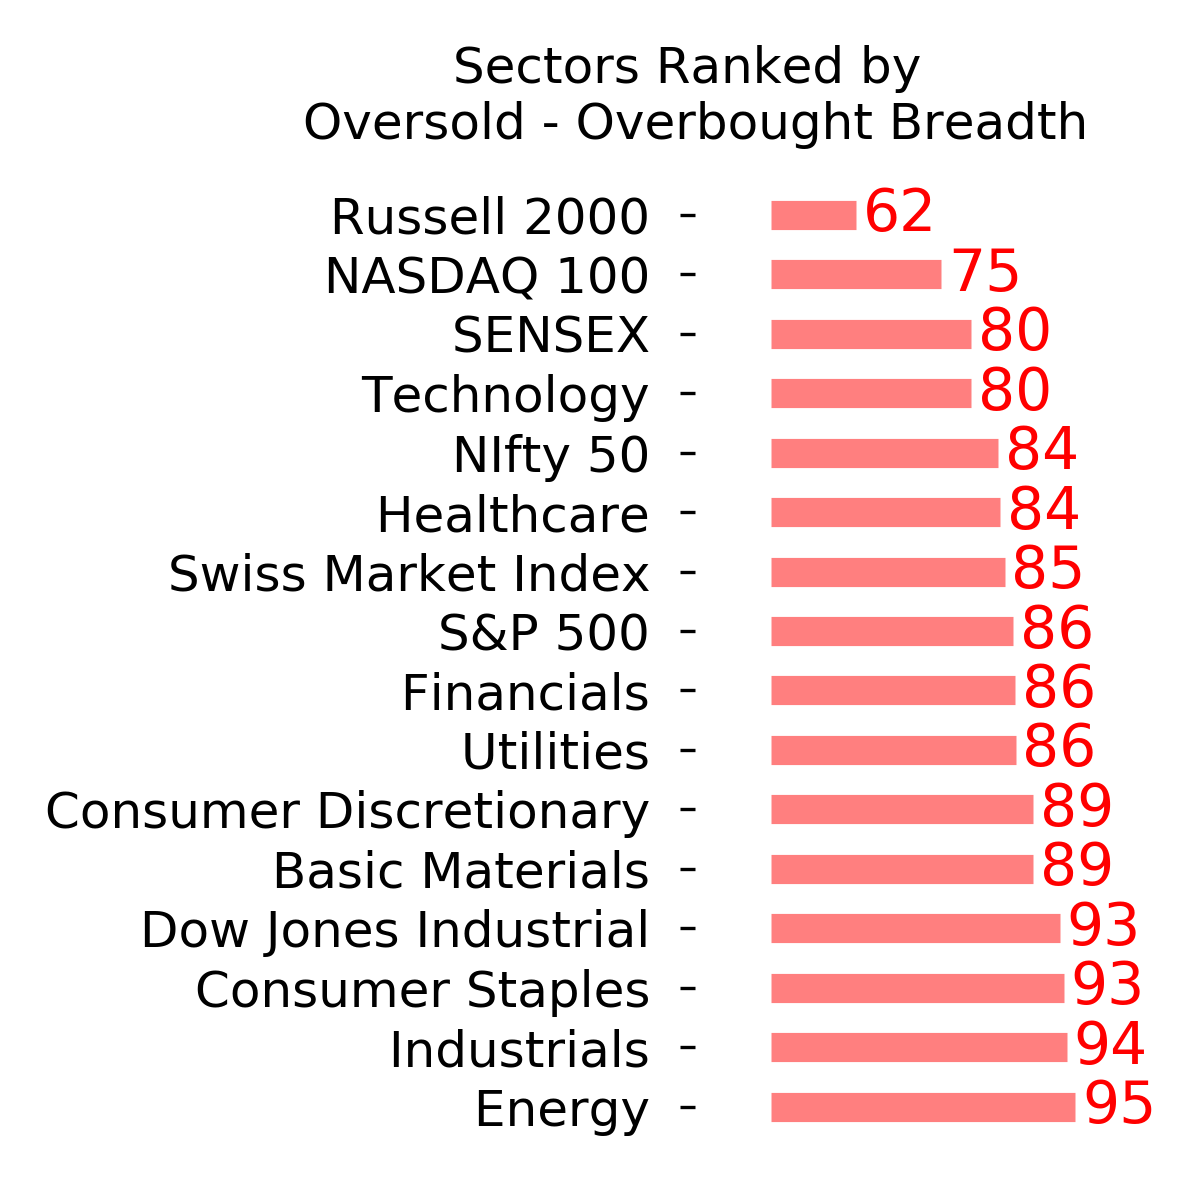
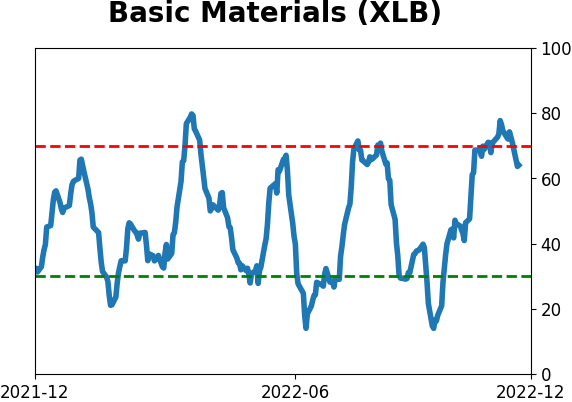
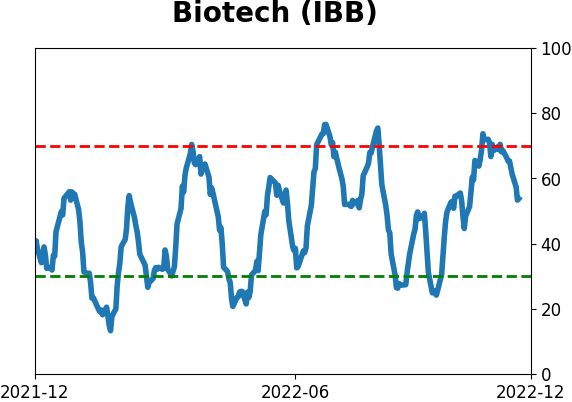
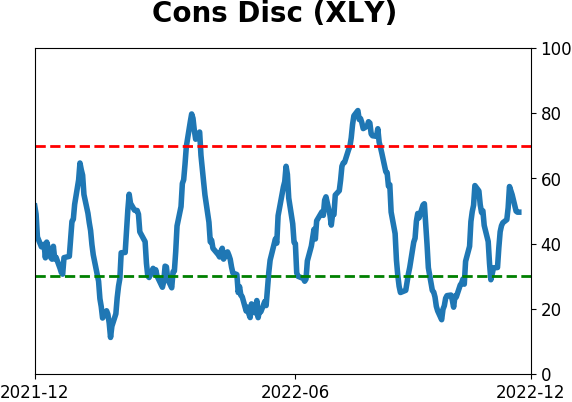
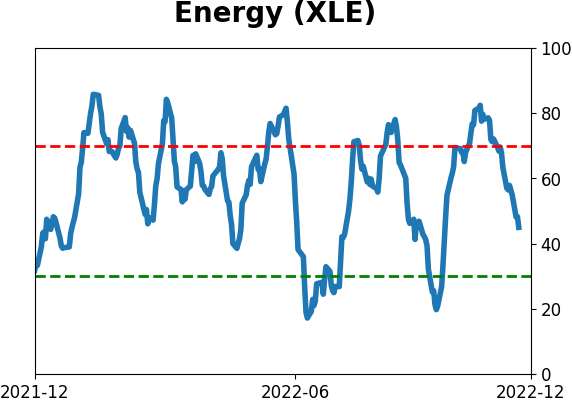
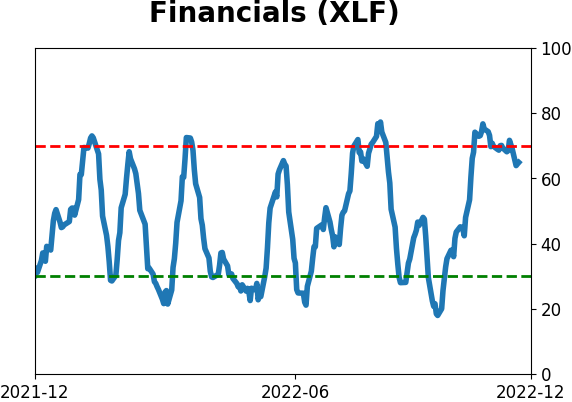
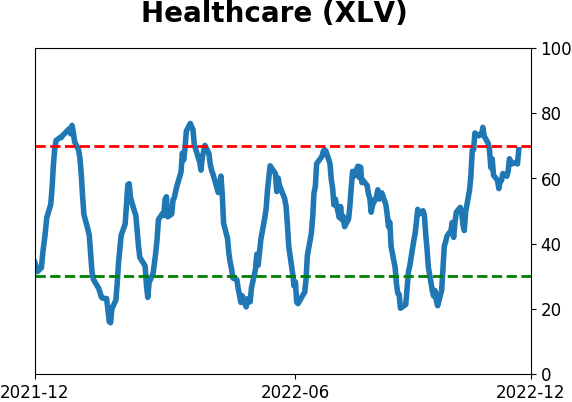
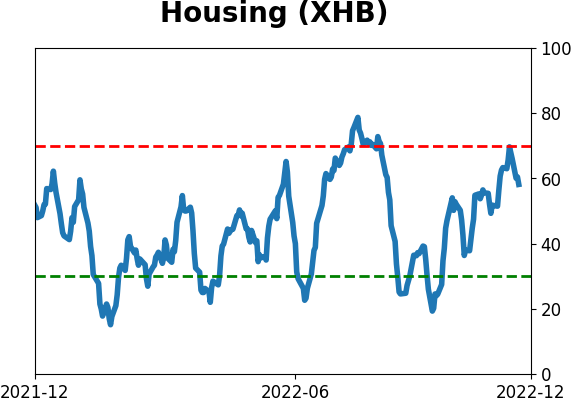
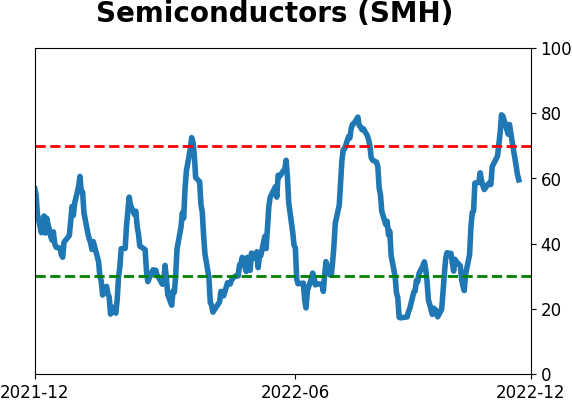
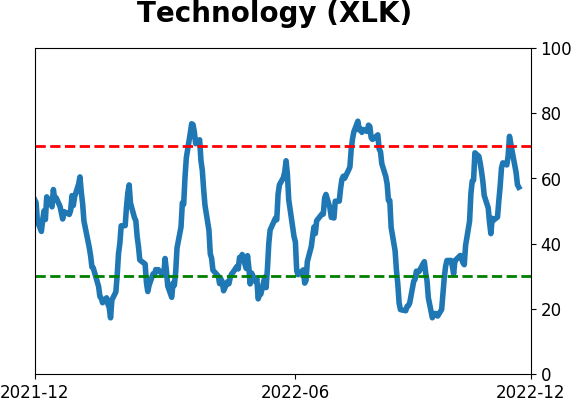
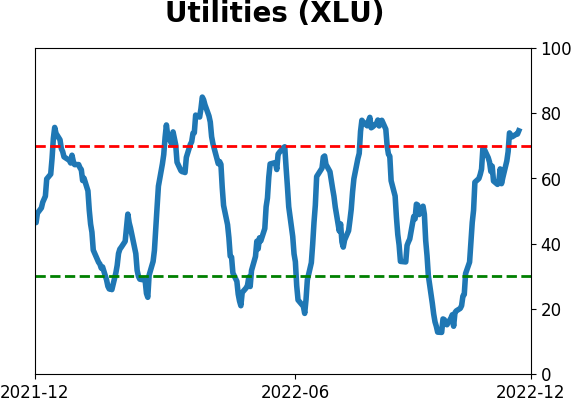
Sector ETF's - 10-Day Moving Average
|
|
|
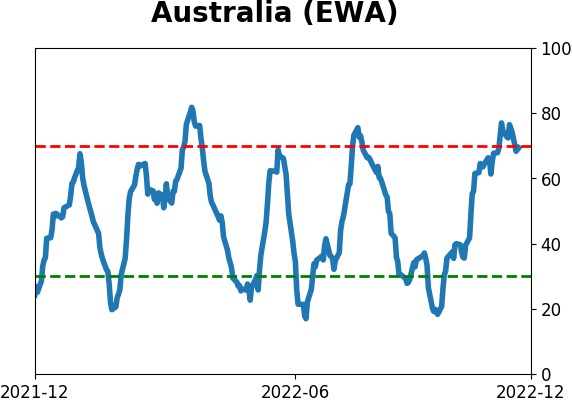
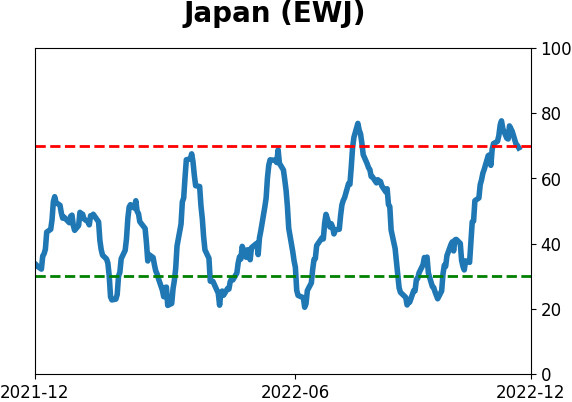
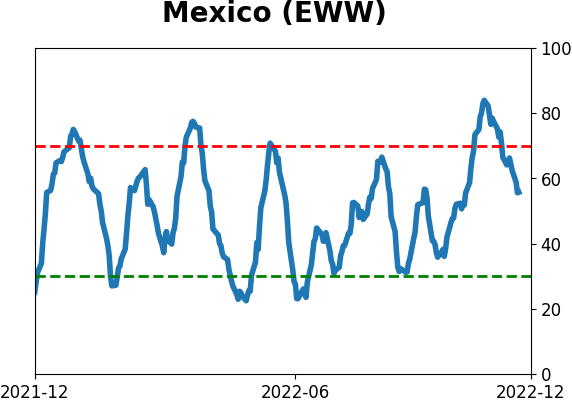
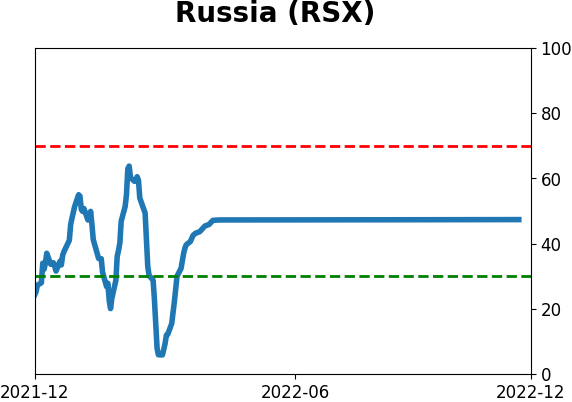
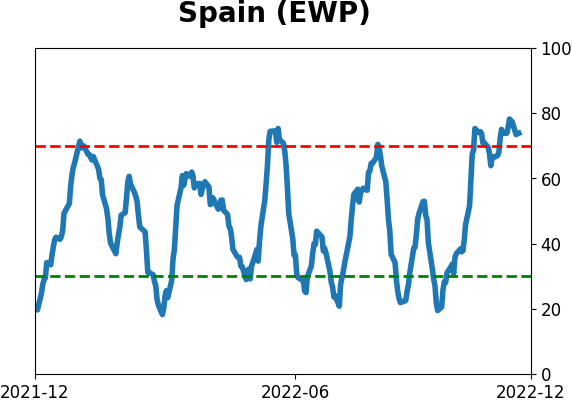
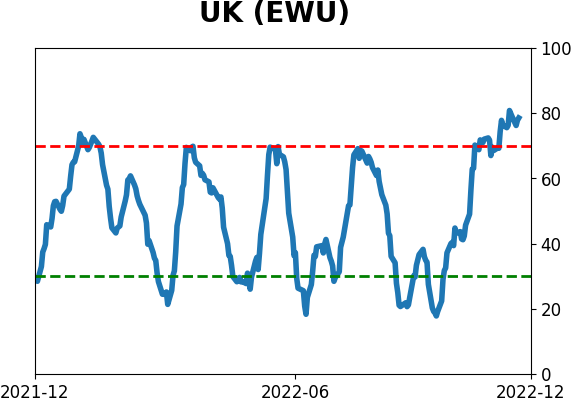
Country ETF's - 10-Day Moving Average
|
|
|
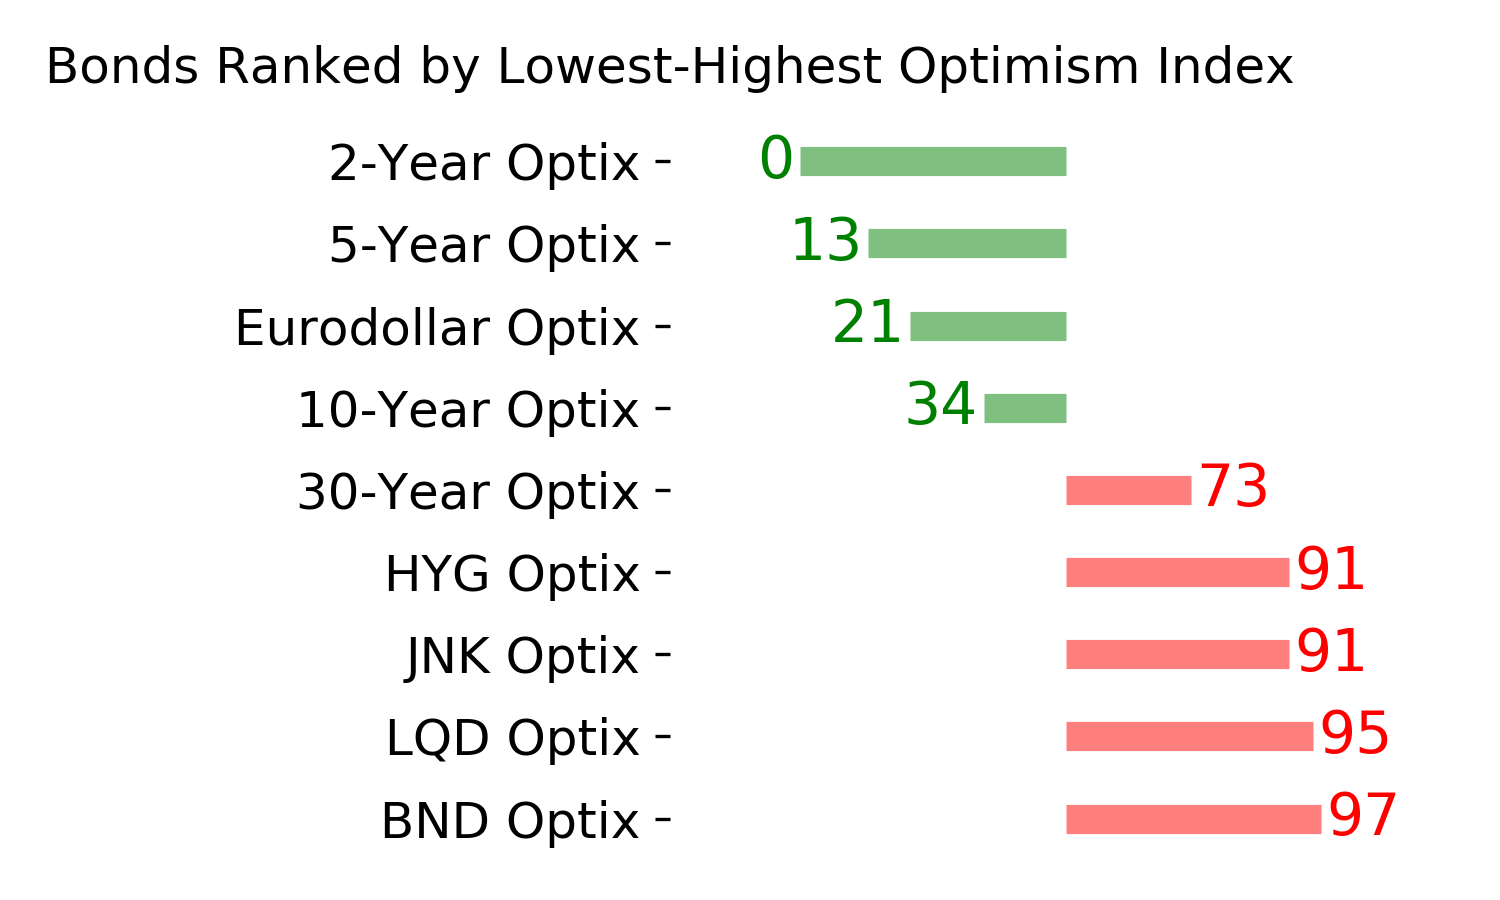
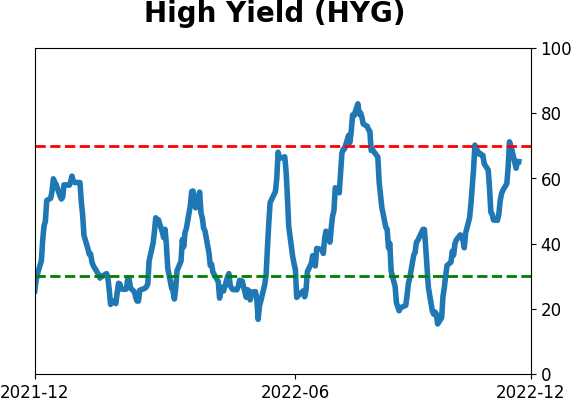
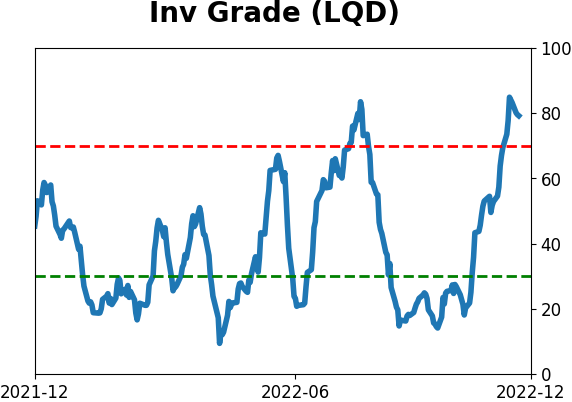
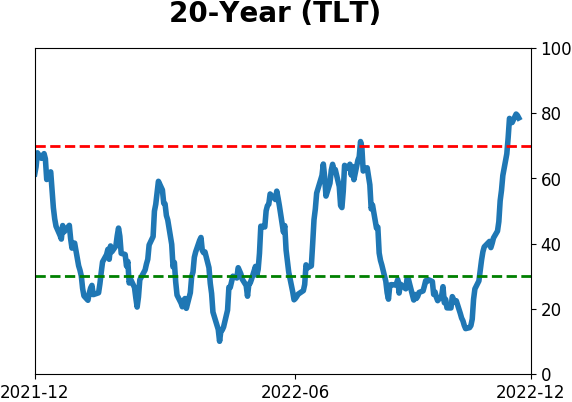
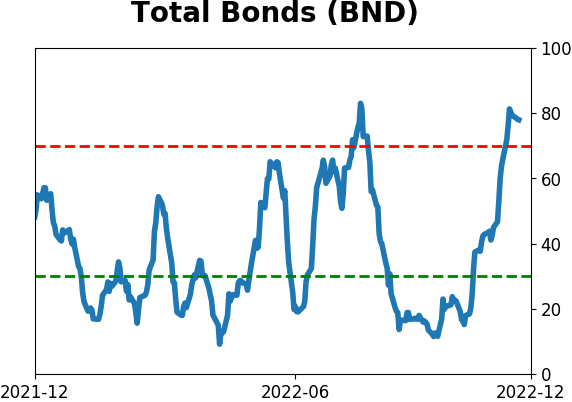
Bond ETF's - 10-Day Moving Average
|
|
|
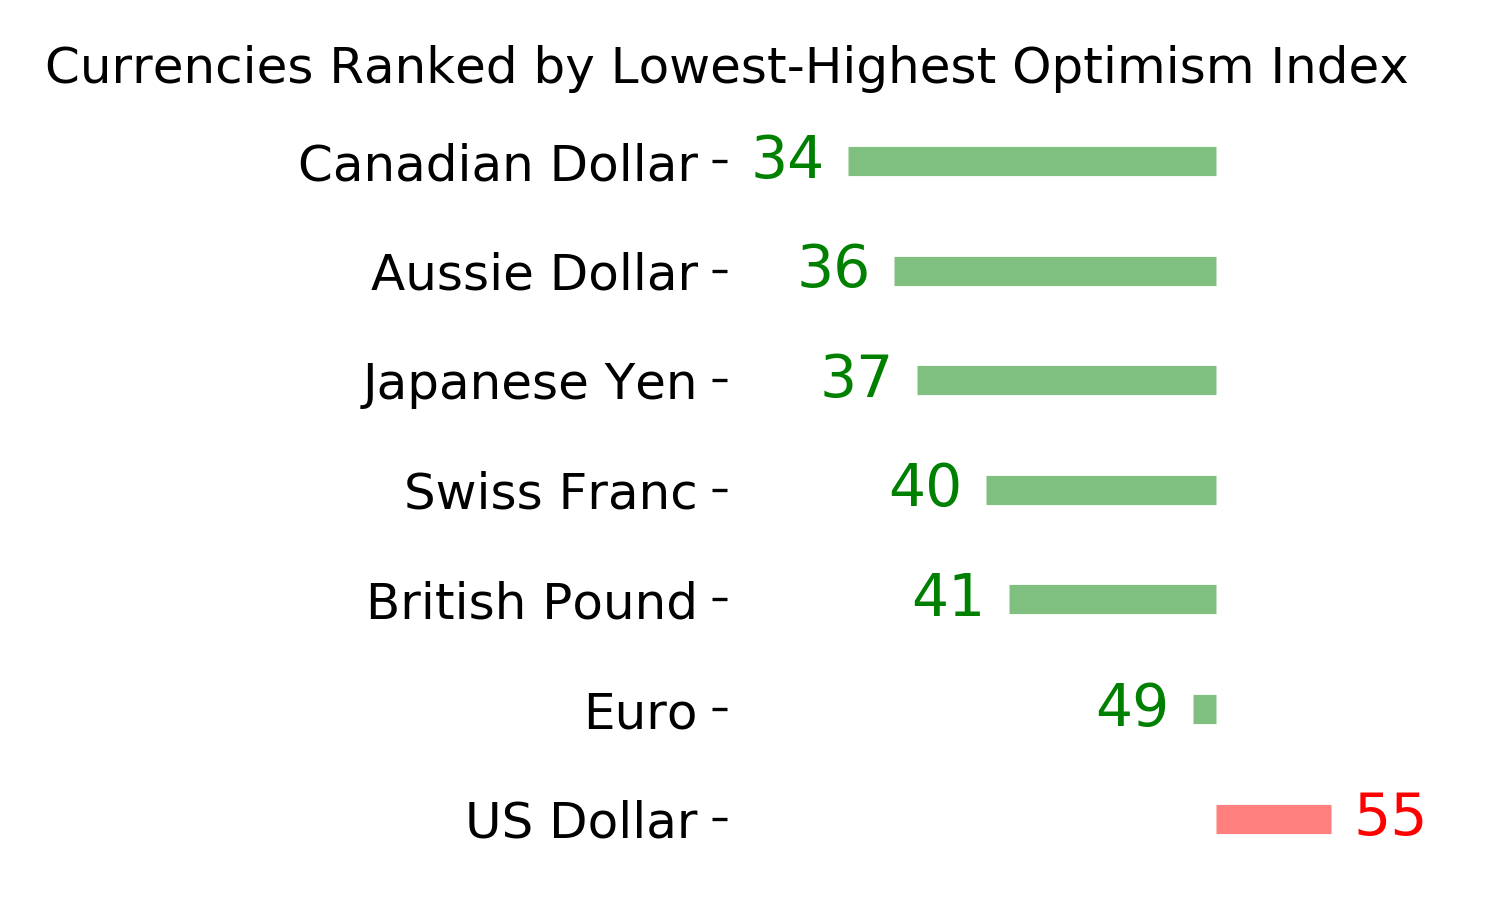
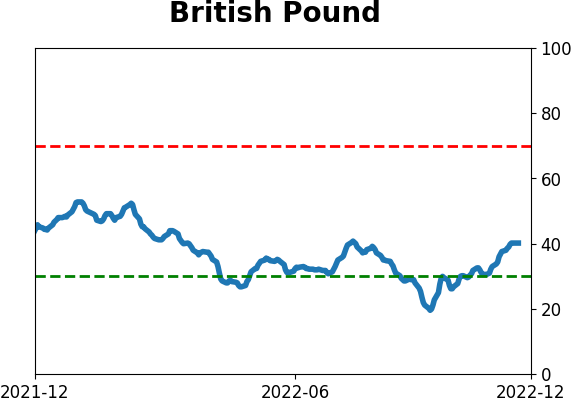
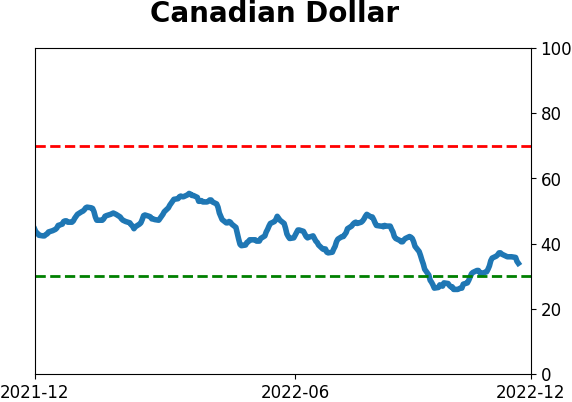
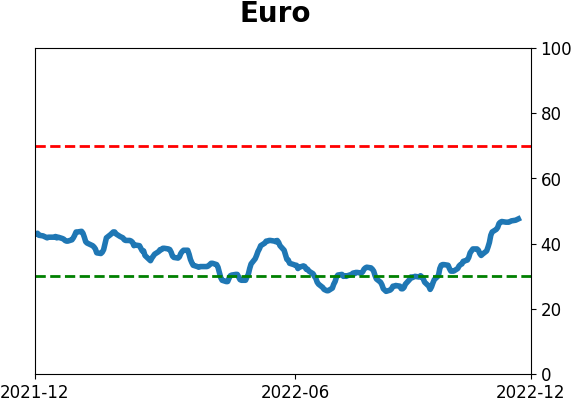
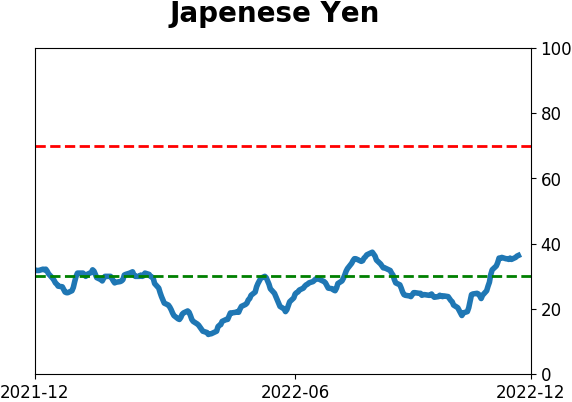
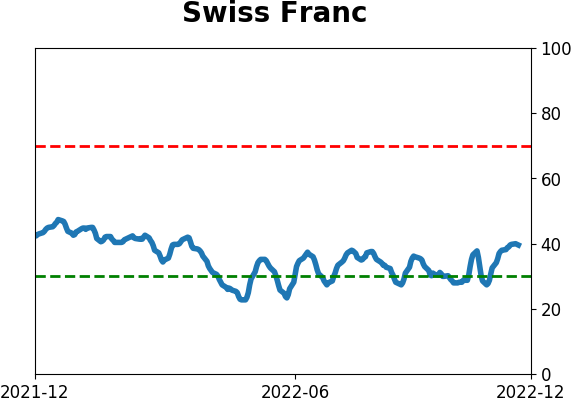
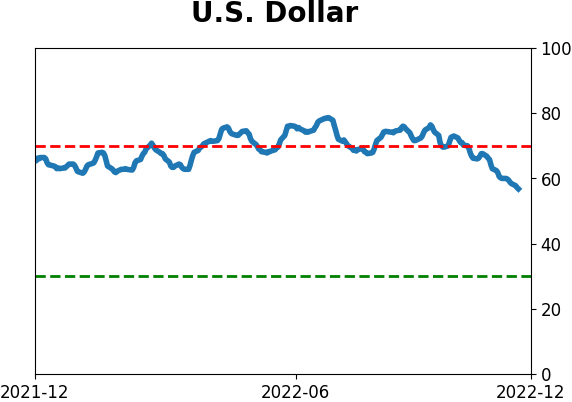
Currency ETF's - 5-Day Moving Average
|
|
|
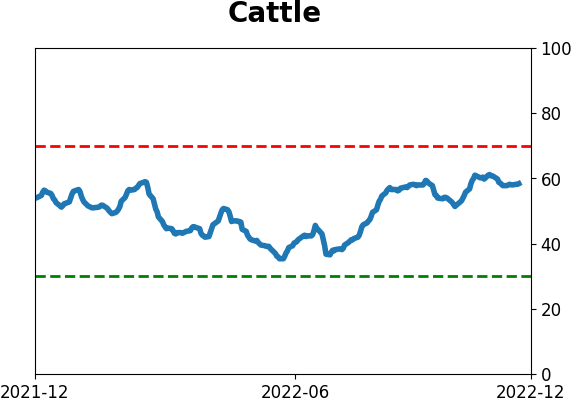
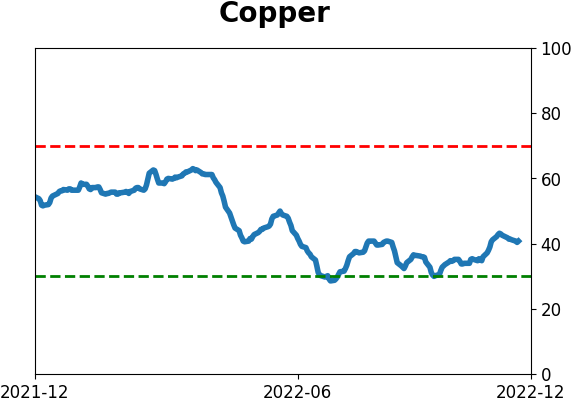
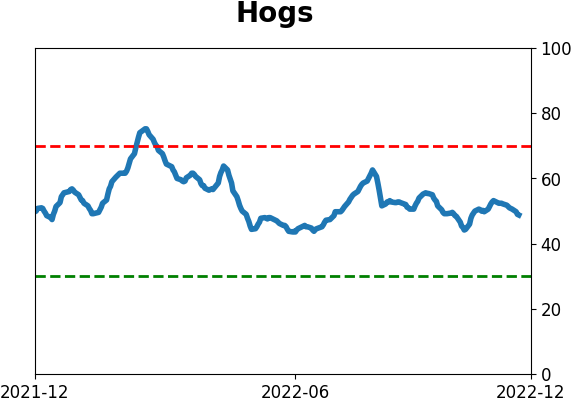
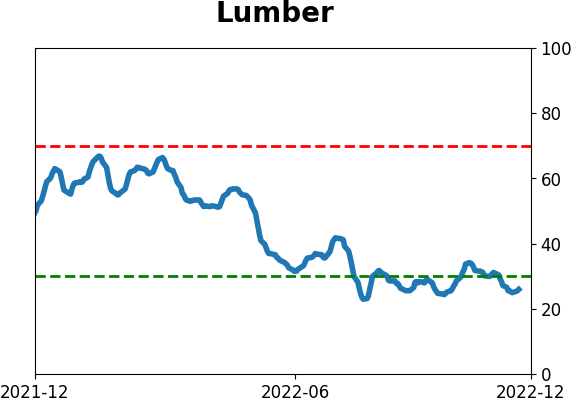
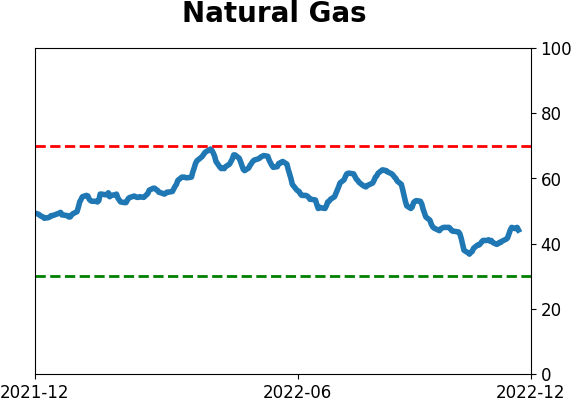
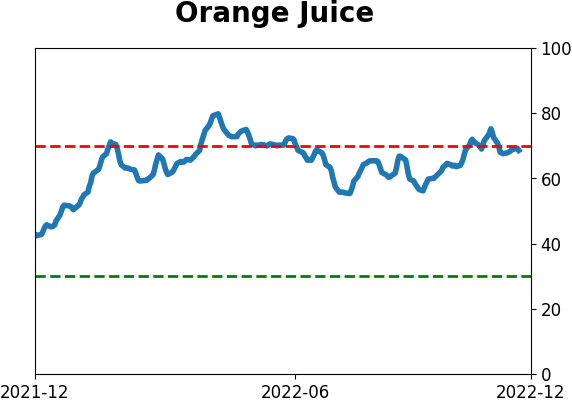
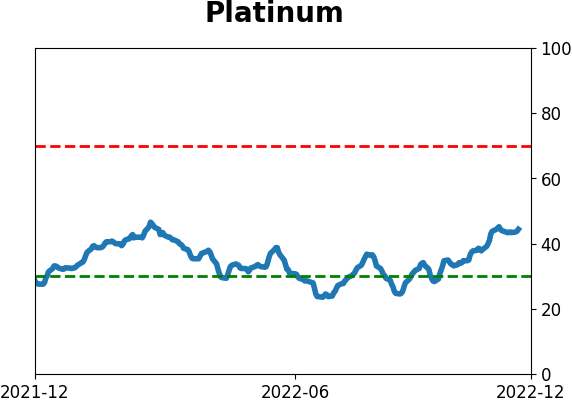
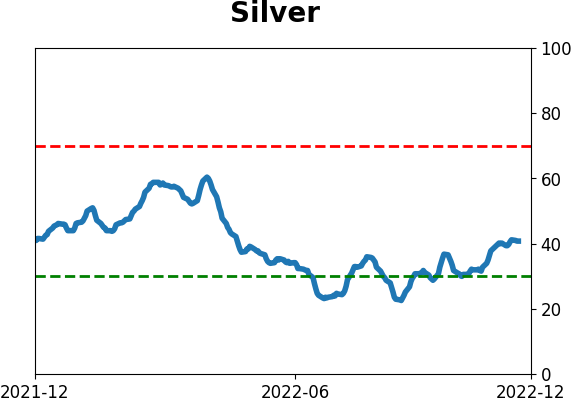
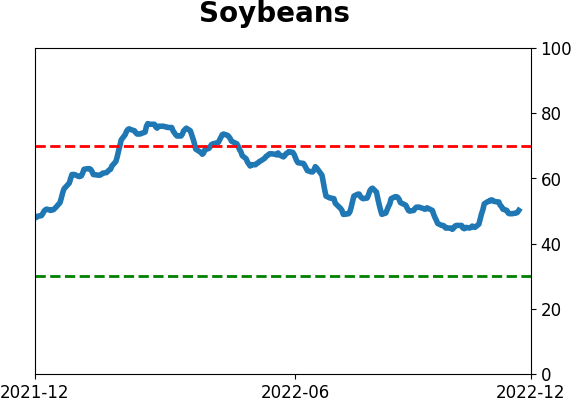
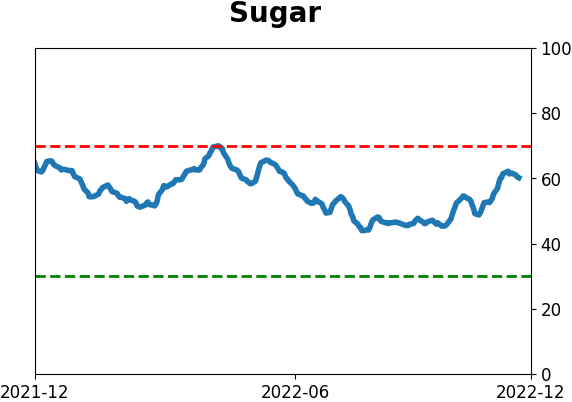
Commodity ETF's - 5-Day Moving Average
|
|