Headlines
|
|
The post-Thanksgiving year-end portfolio:
The stock market has shown a historical tendency to perform well late in the year. Three particular sectors, when traded in combination, have outperformed the S&P 500 Index handily over time.
Bottom Line:
STOCKS: Hold By early October, sentiment had reset. Several important momentum streaks ended, which has brought in buyers in the past, and seasonality turned positive. We're now seeing signs that sentiment has quickly shifted, especially among options traders. It's gotten to an extreme that has preceded weaker-than-average returns.
BONDS: Hold In late October, sentiment on bonds - from Treasuries to corporates - entered pessimistic territory. It's now starting to recover, with some quick moves in corporate bonds. We'll see if those bonds, in particular, can hold recent gains.
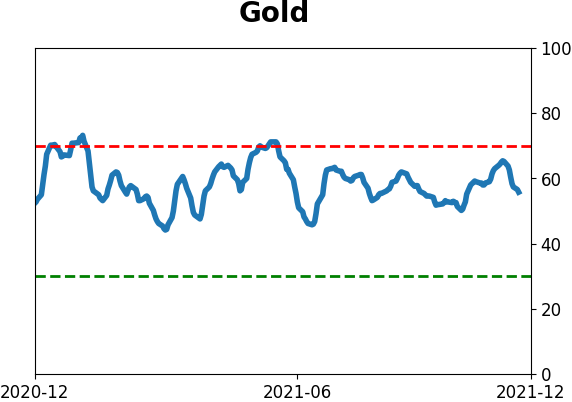
GOLD: Hold
Gold and miners were rejected after trying to recover above their 200-day averages in May. Some oversold extremes in breadth measures among miners triggered in late September, and they've recovered a bit since then. The group still has some proving to do.
|
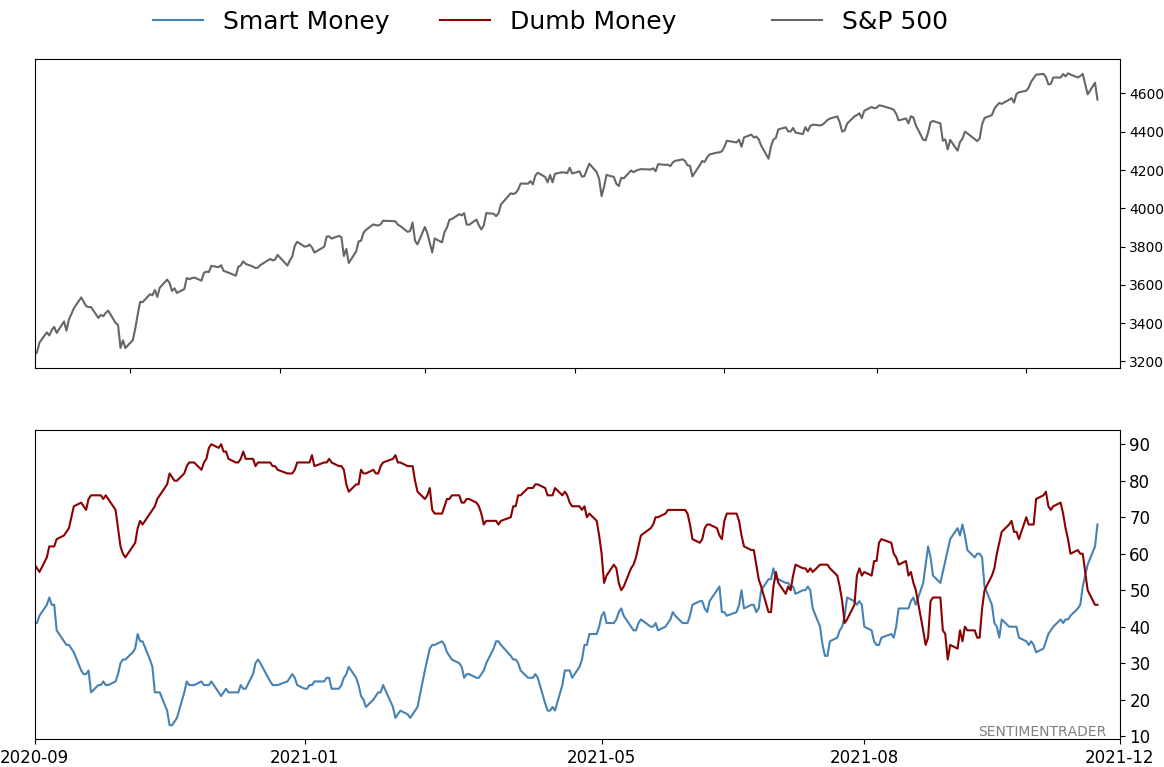
Smart / Dumb Money Confidence
|
Smart Money Confidence: 68%
Dumb Money Confidence: 46%
|
|
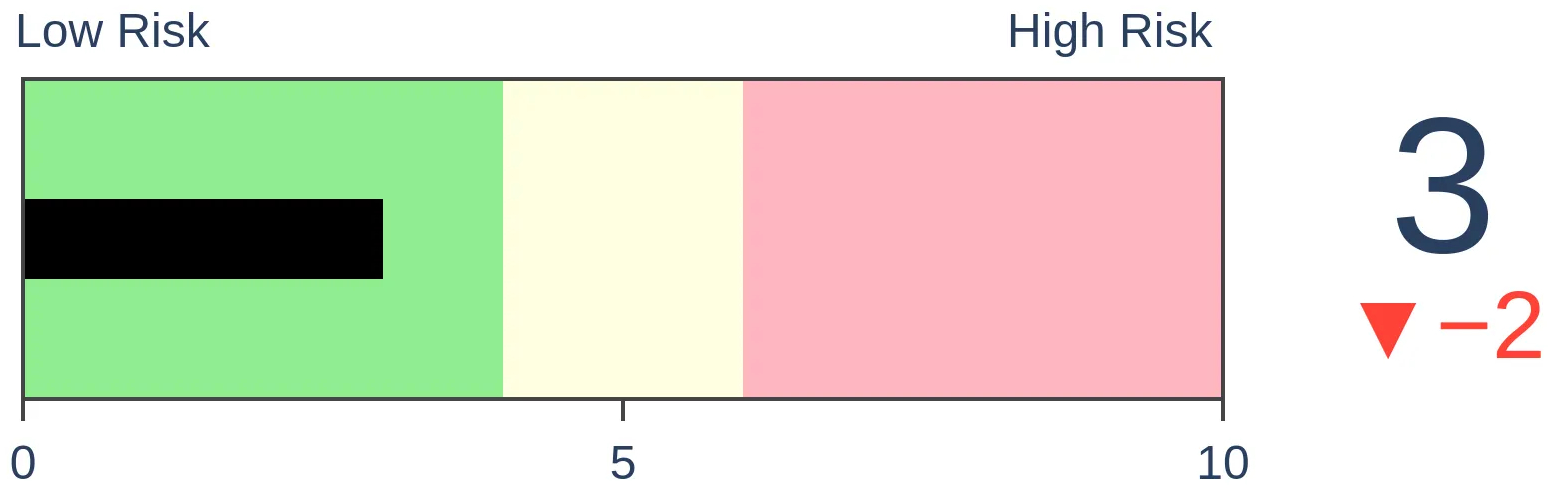
Risk Levels
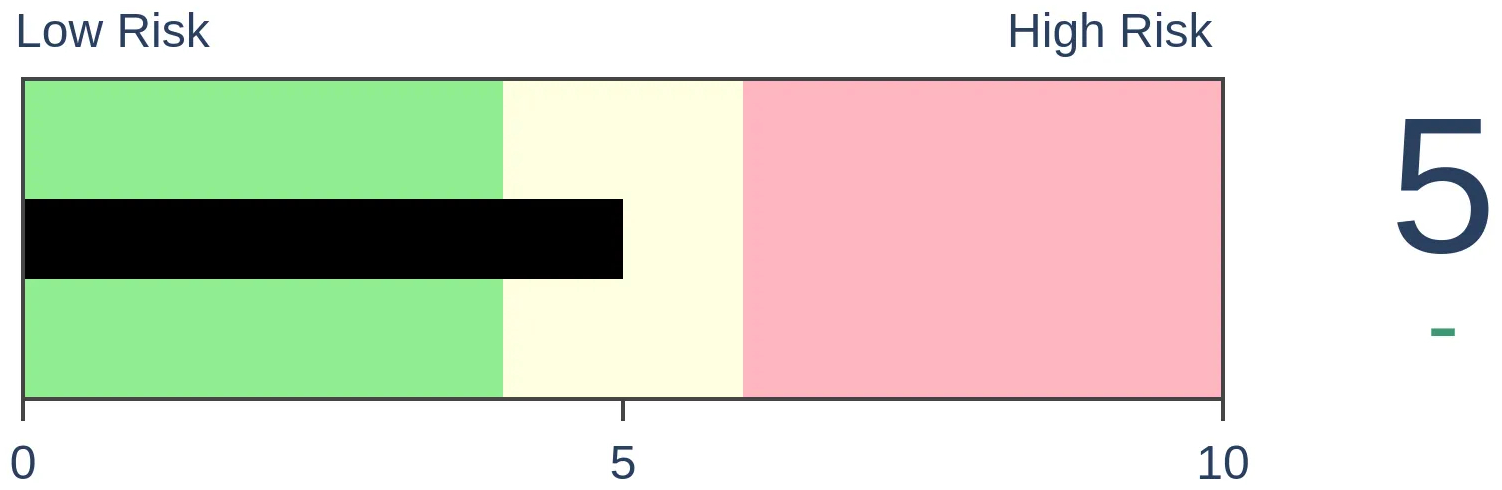
Stocks Short-Term
|
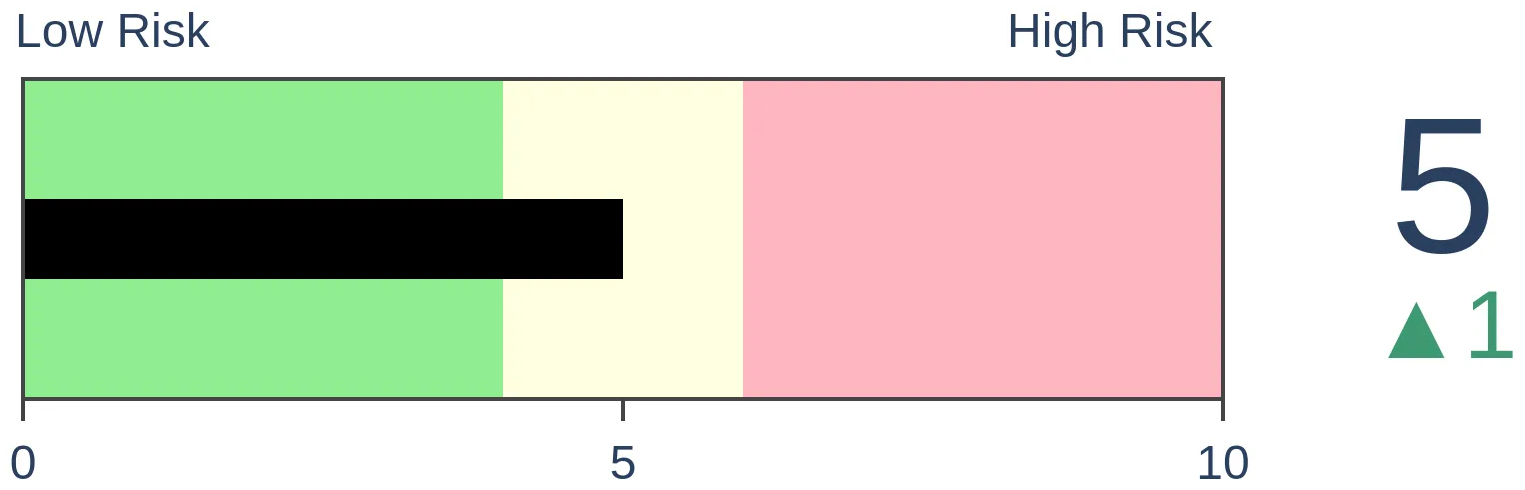
Stocks Medium-Term
|
|
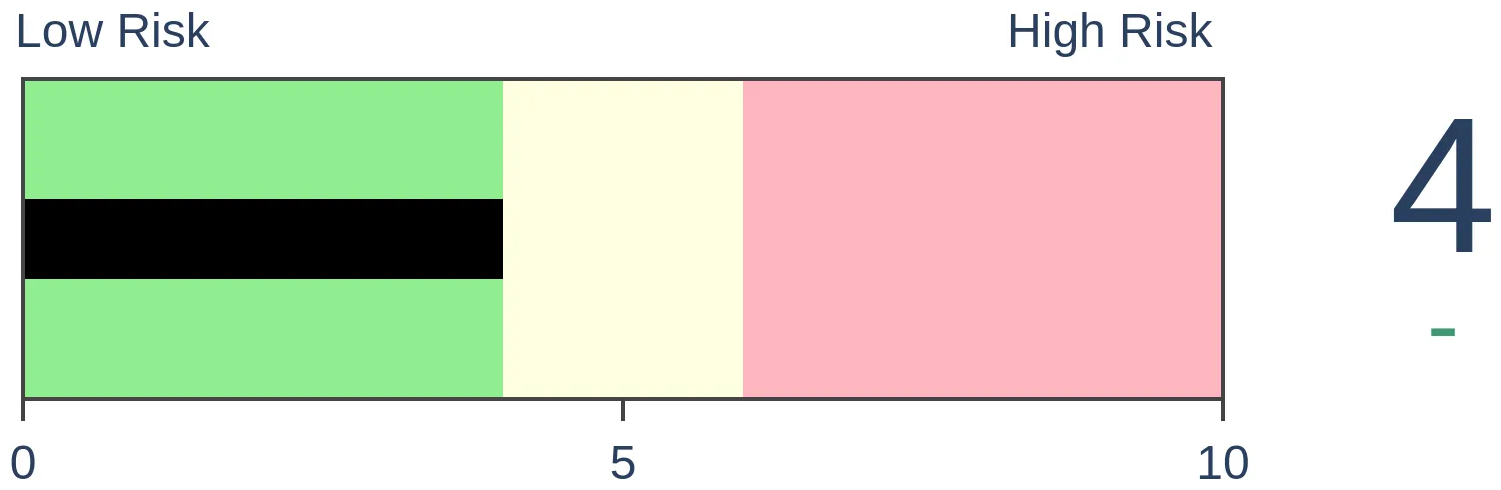
Bonds
|
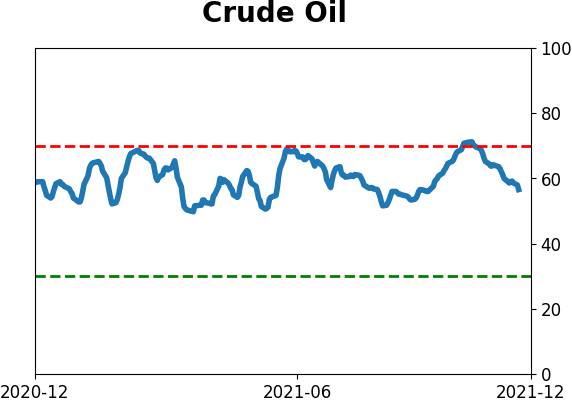
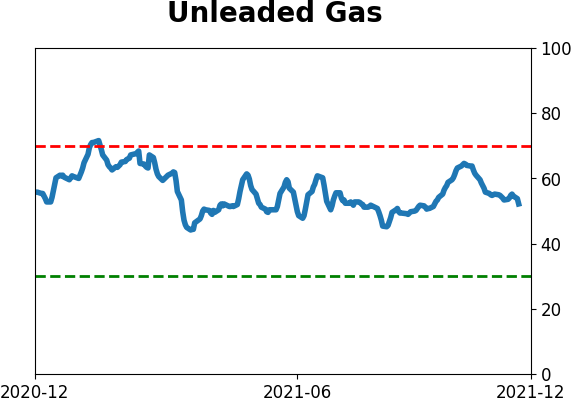
Crude Oil

|
|
Gold

|
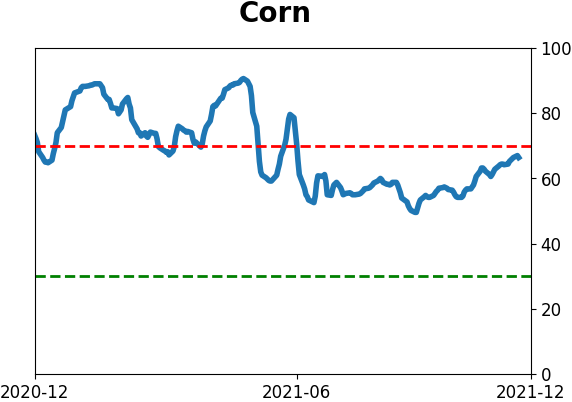
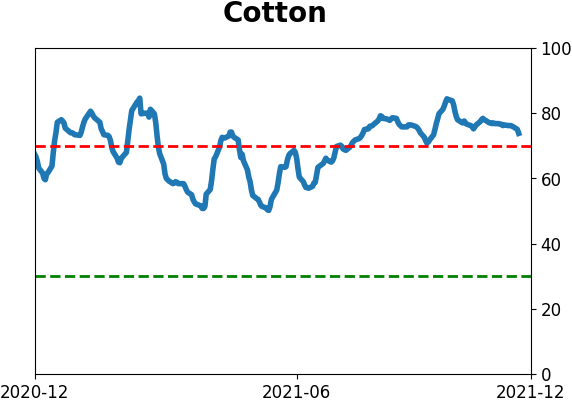
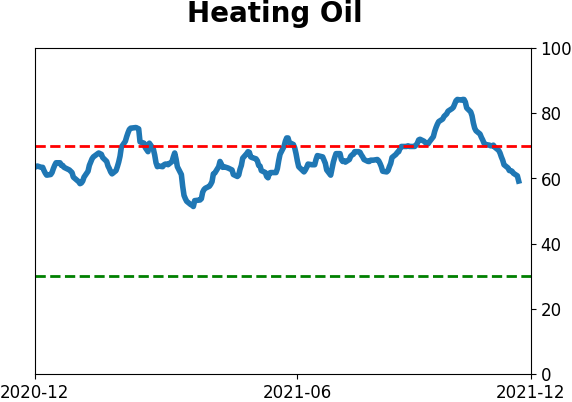
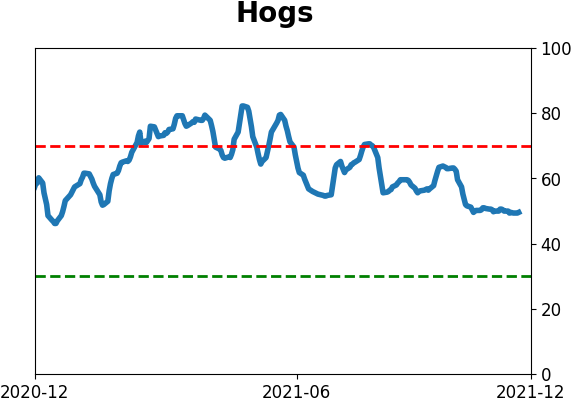
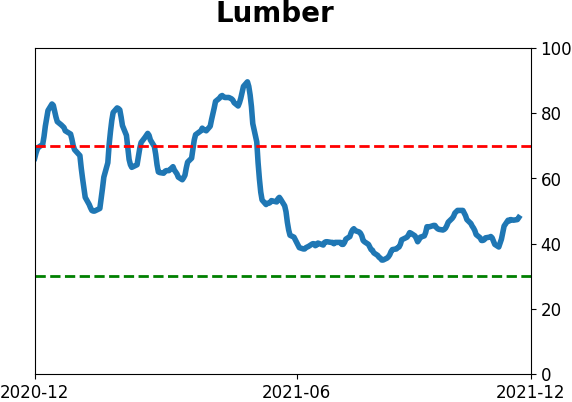
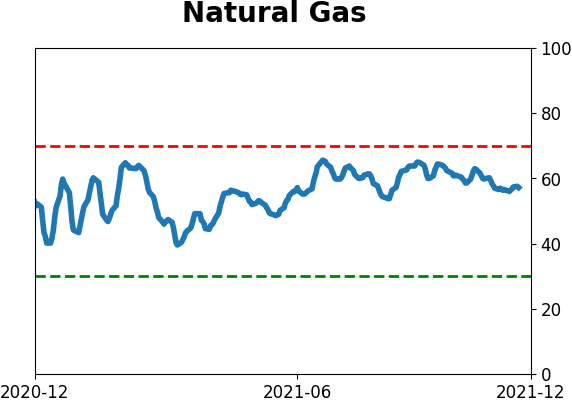
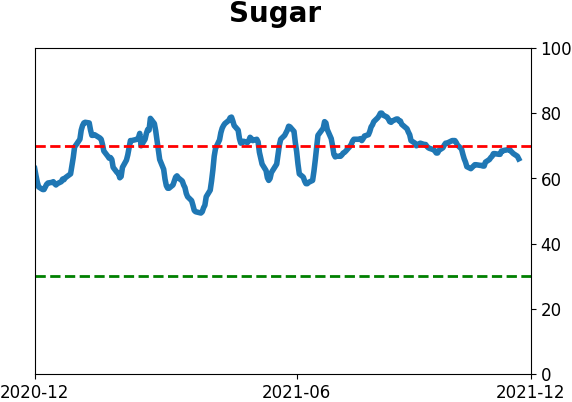
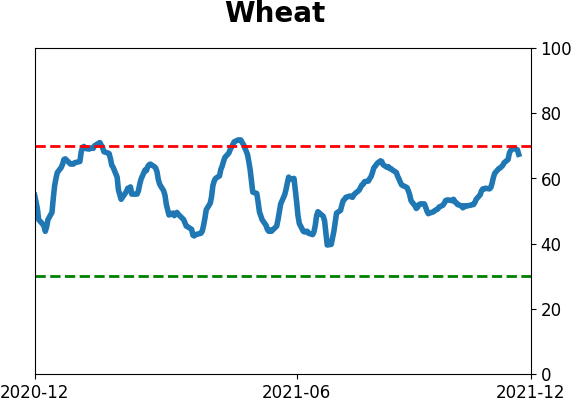
Agriculture
|
|
Research
By Jay Kaeppel
BOTTOM LINE
The stock market has shown a historical tendency to perform well late in the year. Three particular sectors, when traded in combination, have outperformed the S&P 500 Index handily over time.
FORECAST / TIMEFRAME
None
|
Key Points
- The stock market has shown a strong tendency to advance between the end of Thanksgiving week year-end
- Real estate, financials, and health care have outperformed the S&P 500 Index during this period
- Short-term traders may be able to take advantage using ETFs
Acknowledging sector seasonality
Certain sectors tend to perform well late in the calendar year. The charts below display the annual seasonal trends for IYR (Real Estate), XLF (Financials), and XLV (Health Care).
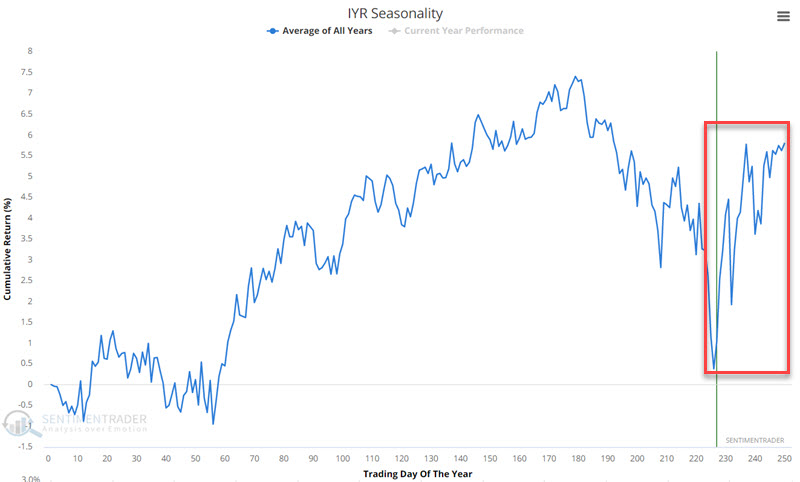
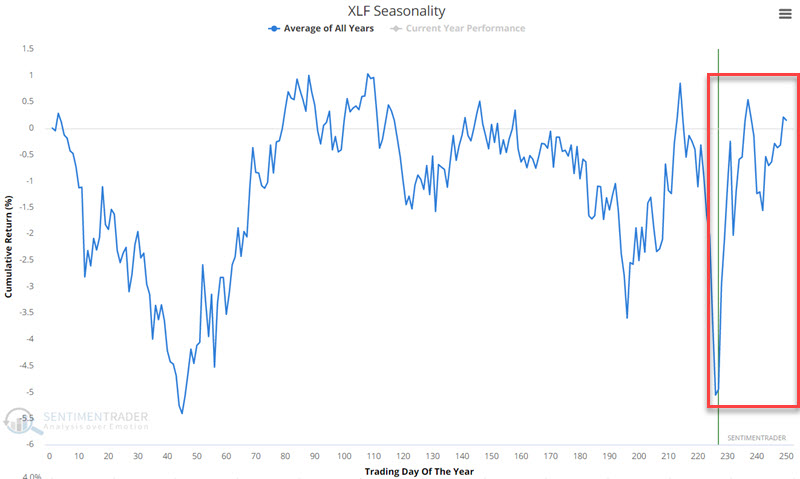
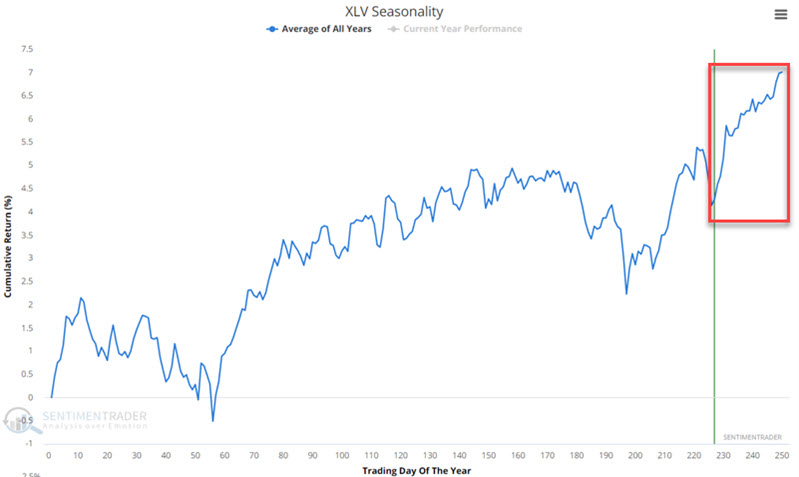
All three tend to show strength late in the calendar year. As always, these are tendencies over time, and not certainties.
Post-Thanksgiving week through year-end
For our test, we will focus on the period beginning at the close on Friday the day after Thanksgiving through the end of the calendar year. We will compare the performance of the Real Estate, Financial, and Health Care sectors to that of the S&P 500 index from 1942 through 2020.
The chart below shows the hypothetical growth of $1 invested in those 3 sectors during this stretch of time.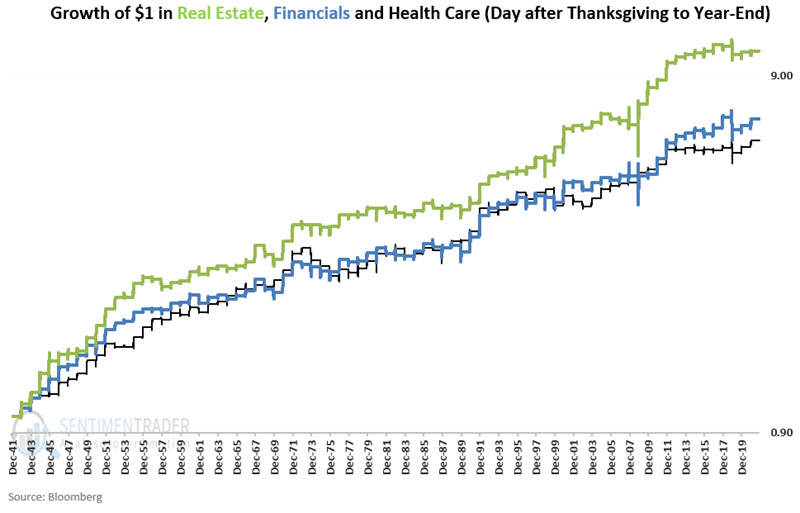
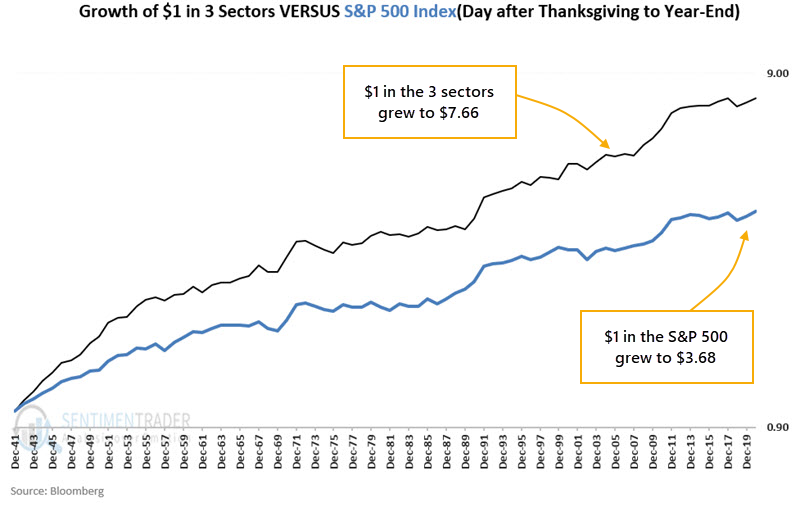
The chart below displays the growth of $1 split evenly each year among the three sectors, versus the growth of $1 invested in the S&P 500 Index each year only during the Post-Thanksgiving through Year-end period. In the 3 sectors, $1 grew to $7.66 versus only $3.68 in the S&P.
A history of consistent and wide outperformance
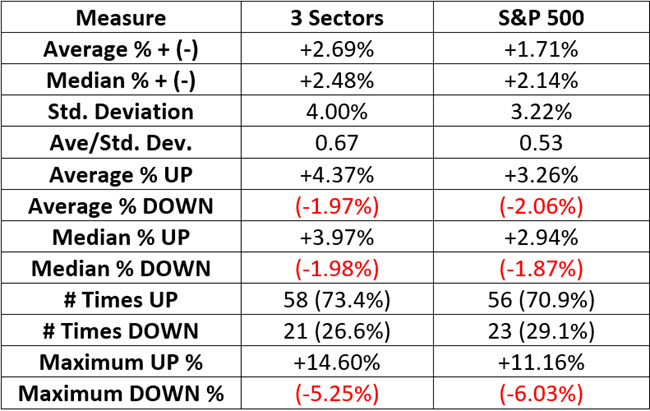
The table below displays the comparative figures. Over time the three-sector portfolio has outperformed the S&P 500 Index in all categories.
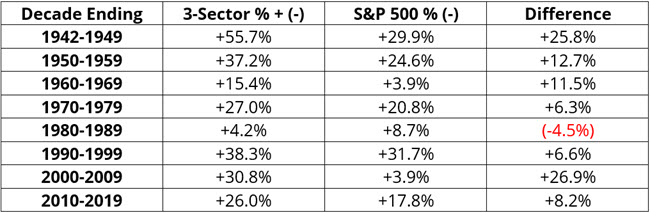
The three-sector portfolio has outperformed the S&P 500 Index in all but one calendar decade since 1942.
The chart below displays rolling 10-year returns for the three-sector portfolio minus 10-year rolling returns for the S&P 500 Index. A reading above 0 means the three-sector portfolio outperformed the S&P 500 Index over the prior 10 years.
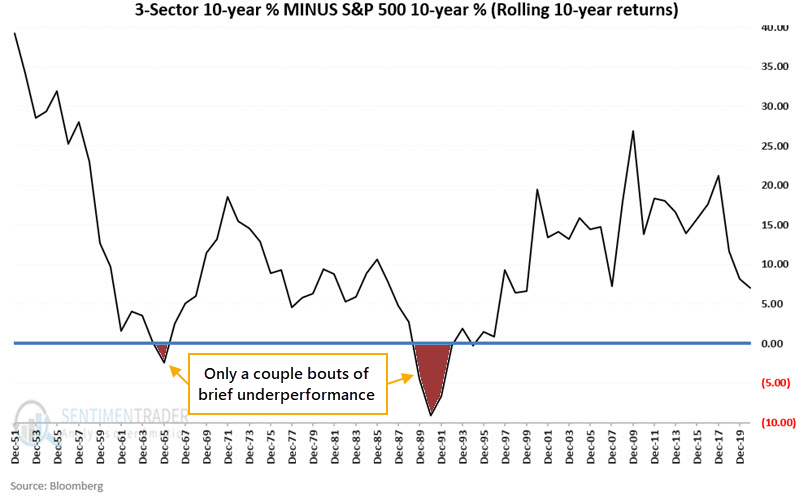
The three-sector portfolio has shown a gain during 70 out of 70 rolling 10-year periods (100%), while the S&P 500 Index has shown a gain during 67 out of 70 rolling 10-year periods (95.7%). The three-sector portfolio has outperformed the S&P 500 Index 64 out of 70 rolling 10-year periods (91.4%).
Traders can attempt to emulate this strategy using these popular ETFs:
- IYR (iShares U.S. Real Estate ETF)
- XLF (Financial Select Sector SPDR Fund)
- XLV (Health Care Select Sector SPDR Fund)
What the research tells us…
The Real Estate, Financial, and Health Care sectors have tended to outperform the S&P 500 Index during the post-Thanksgiving part of the year. There is no way to predict if the three-sector portfolio will show a post-Thanksgiving gain, let alone outperform the S&P 500, but as a group that have shown a consistent tendency to do so.
Active Studies
| Time Frame | Bullish | Bearish | | Short-Term | 2 | 1 | | Medium-Term | 11 | 0 | | Long-Term | 13 | 7 |
|
Indicators at Extremes
Portfolio
| Position | Description | Weight % | Added / Reduced | Date | | Stocks | RSP | 10.7 | Added 6.4% | 2021-10-01 | | Bonds | 32.7% BND, 7.1% SCHP | 39.8 | Added 8.3% | 2021-10-26 | | Commodities | GCC | 2.4 | Reduced 2.1%
| 2020-09-04 | | Precious Metals | GDX | 4.6 | Reduced 4.2% | 2021-05-19 | | Special Situations | 9.8% KWEB, 4.7% XLE, 2.9% PSCE | 17.3 | Added 9.78% | 2021-10-01 | | Cash | | 24.1 | | |
|
Updates (Changes made today are underlined)
Much of our momentum and trend work has remained positive for several months, with some scattered exceptions. Almost all sentiment-related work has shown a poor risk/reward ratio for stocks, especially as speculation drove to record highs in exuberance in February. Much of that has worn off, and most of our models are back toward neutral levels. There isn't much to be excited about here. The same goes for bonds and even gold. Gold has been performing well lately and is back above long-term trend lines. The issue is that it has a poor record of holding onto gains when attempting a long-term trend change like this, so we'll take a wait-and-see approach. Momentum has ebbed quickly in recent weeks, and nearing oversold levels in some indicators. This can be a dangerous area, with a lot of short-term volatility, but we'd be more inclined to add medium- to long-term exposure rather than sell on much more of a decline, thanks to already rock-bottom exposure. Other areas look more attractive, including some overseas markets. RETURN YTD: 8.8% 2020: 8.1%, 2019: 12.6%, 2018: 0.6%, 2017: 3.8%, 2016: 17.1%, 2015: 9.2%, 2014: 14.5%, 2013: 2.2%, 2012: 10.8%, 2011: 16.5%, 2010: 15.3%, 2009: 23.9%, 2008: 16.2%, 2007: 7.8%
|
|
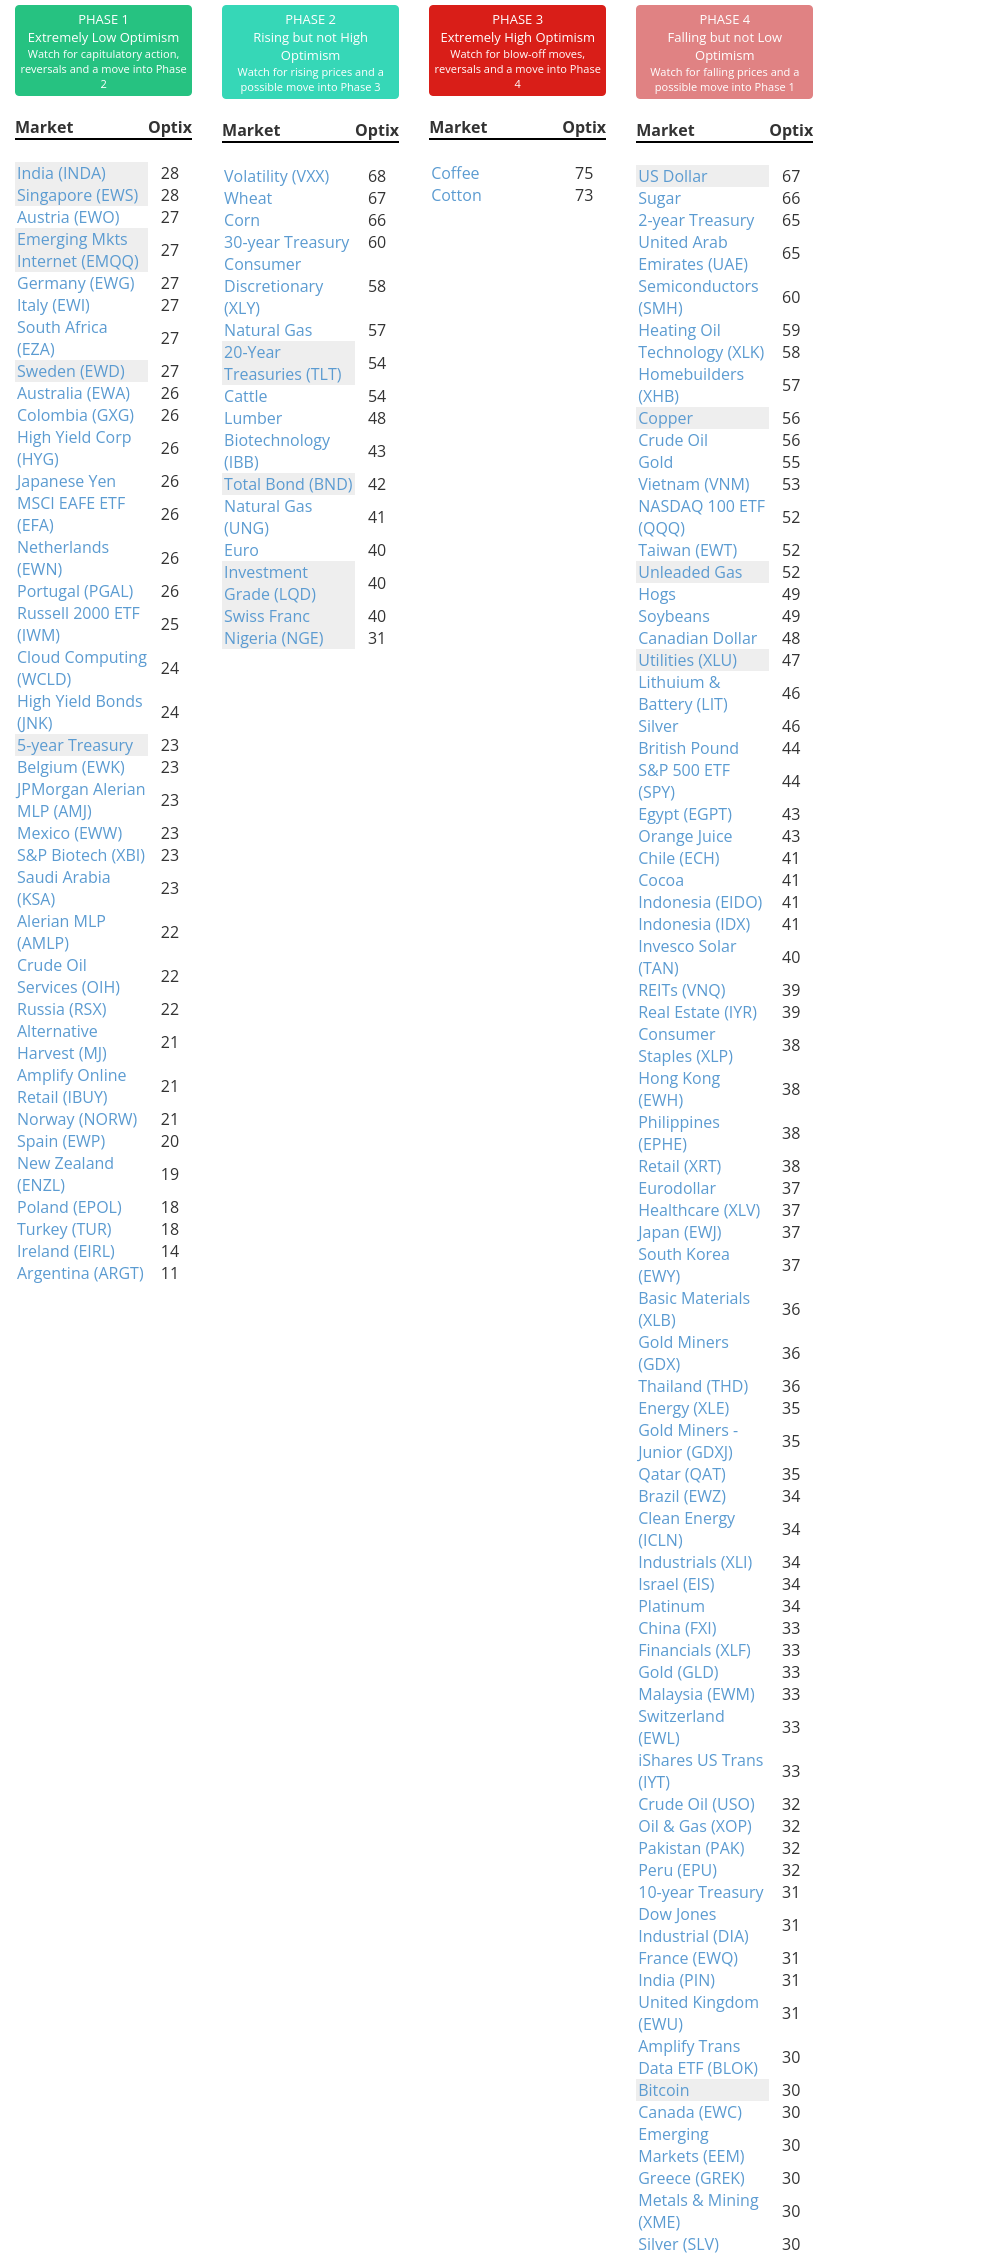
Phase Table
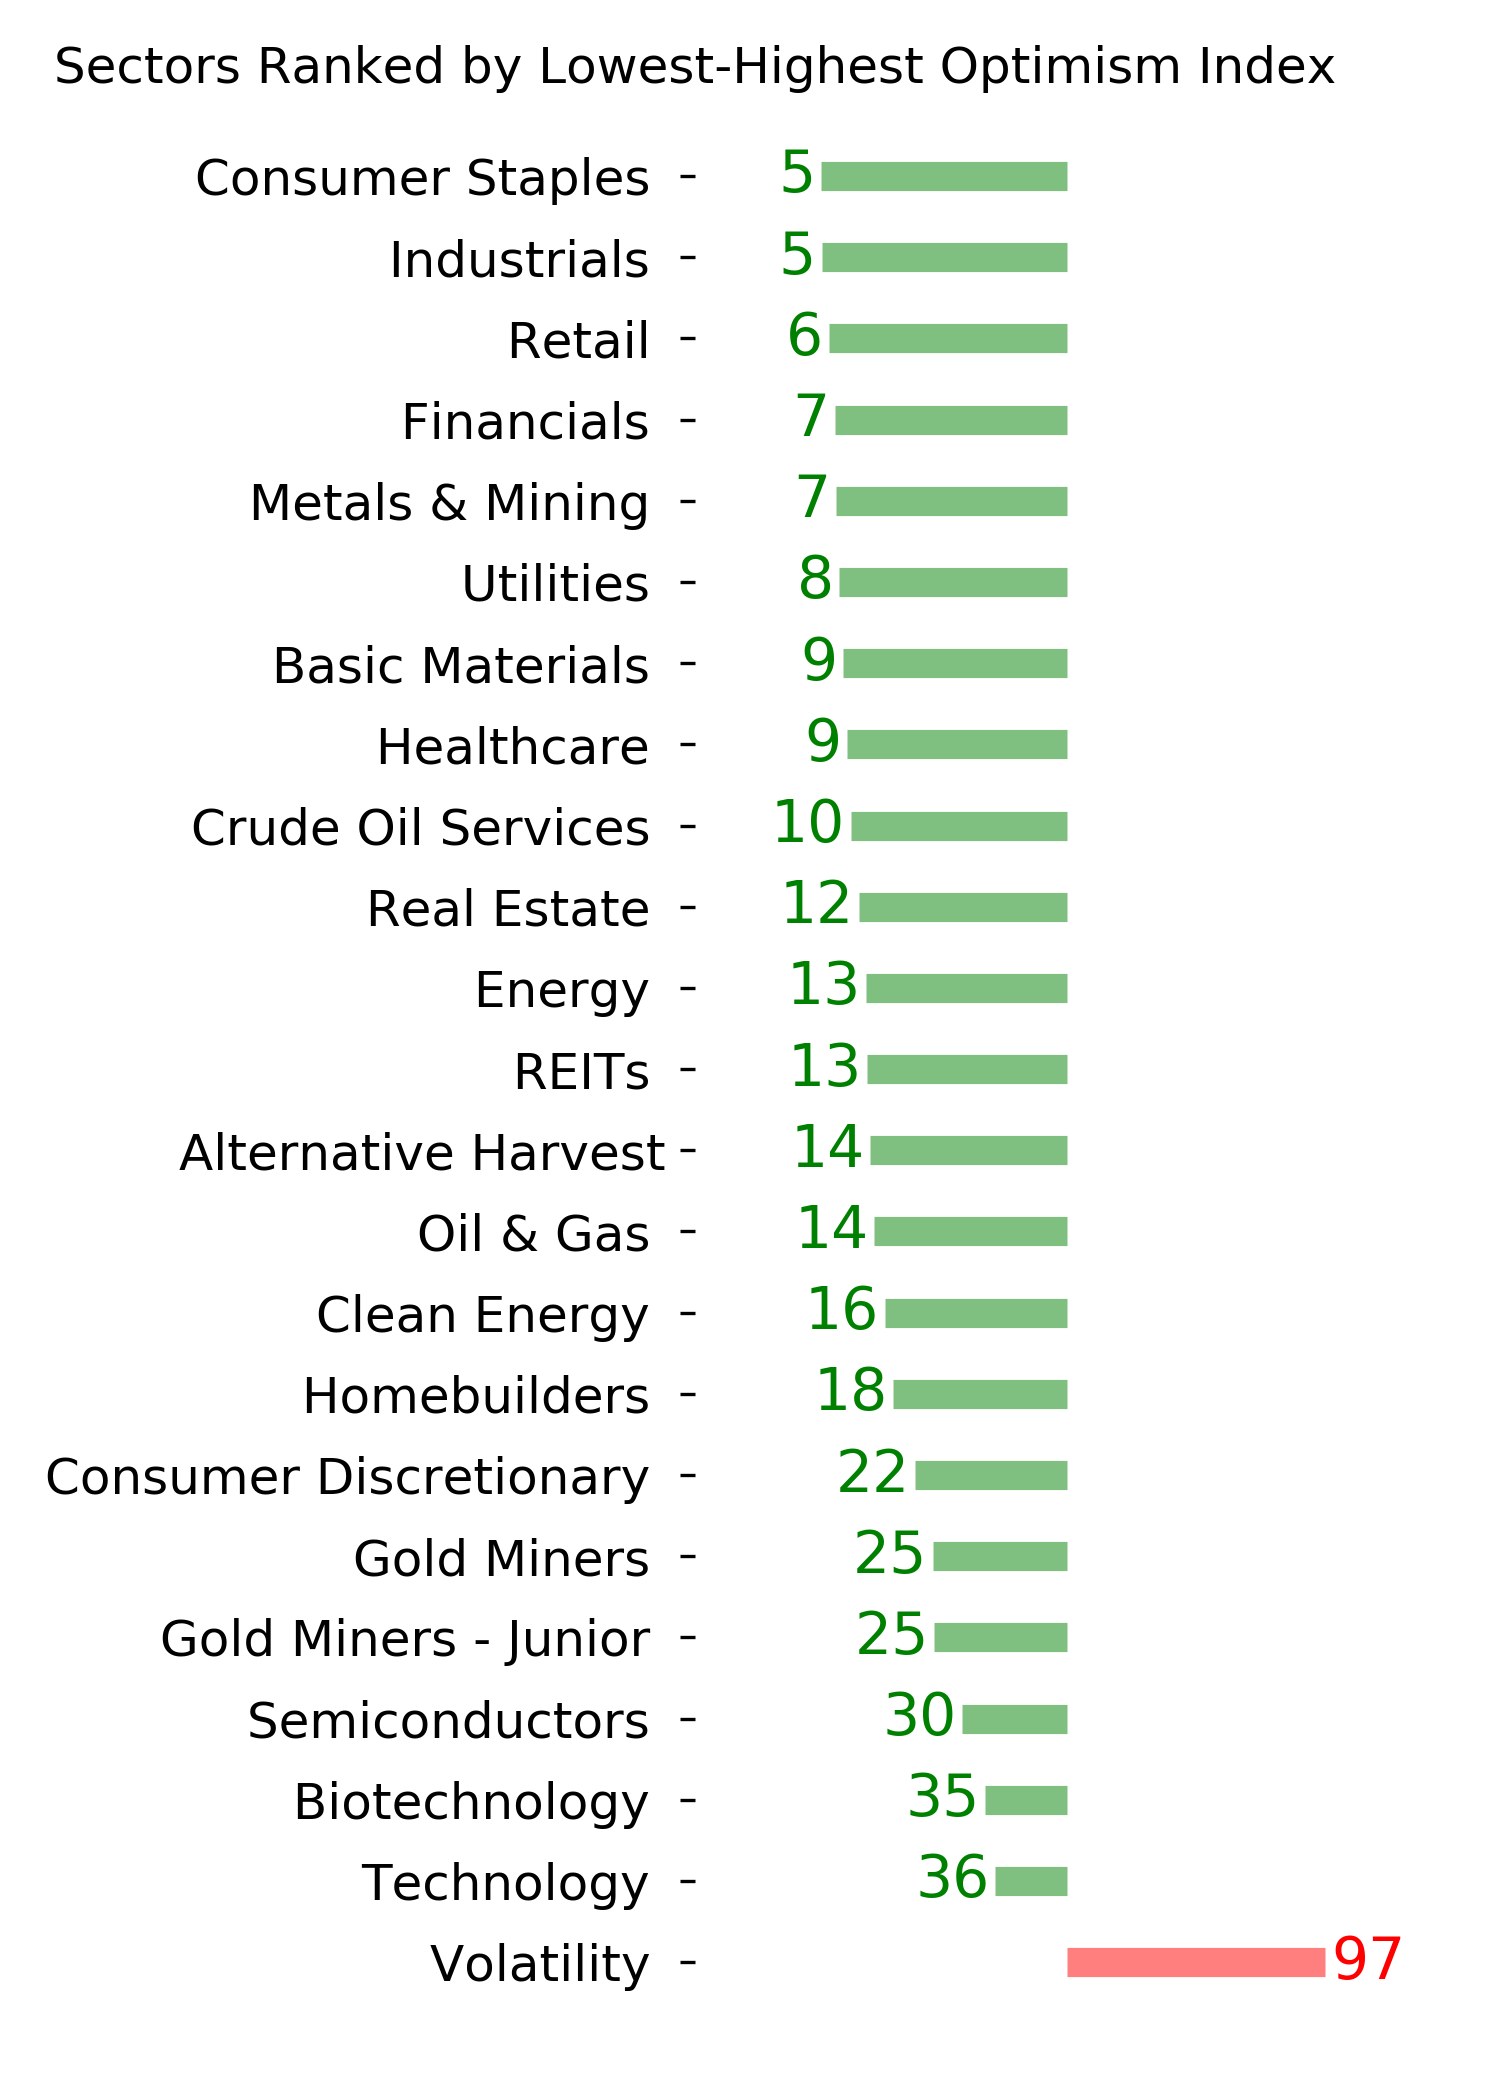
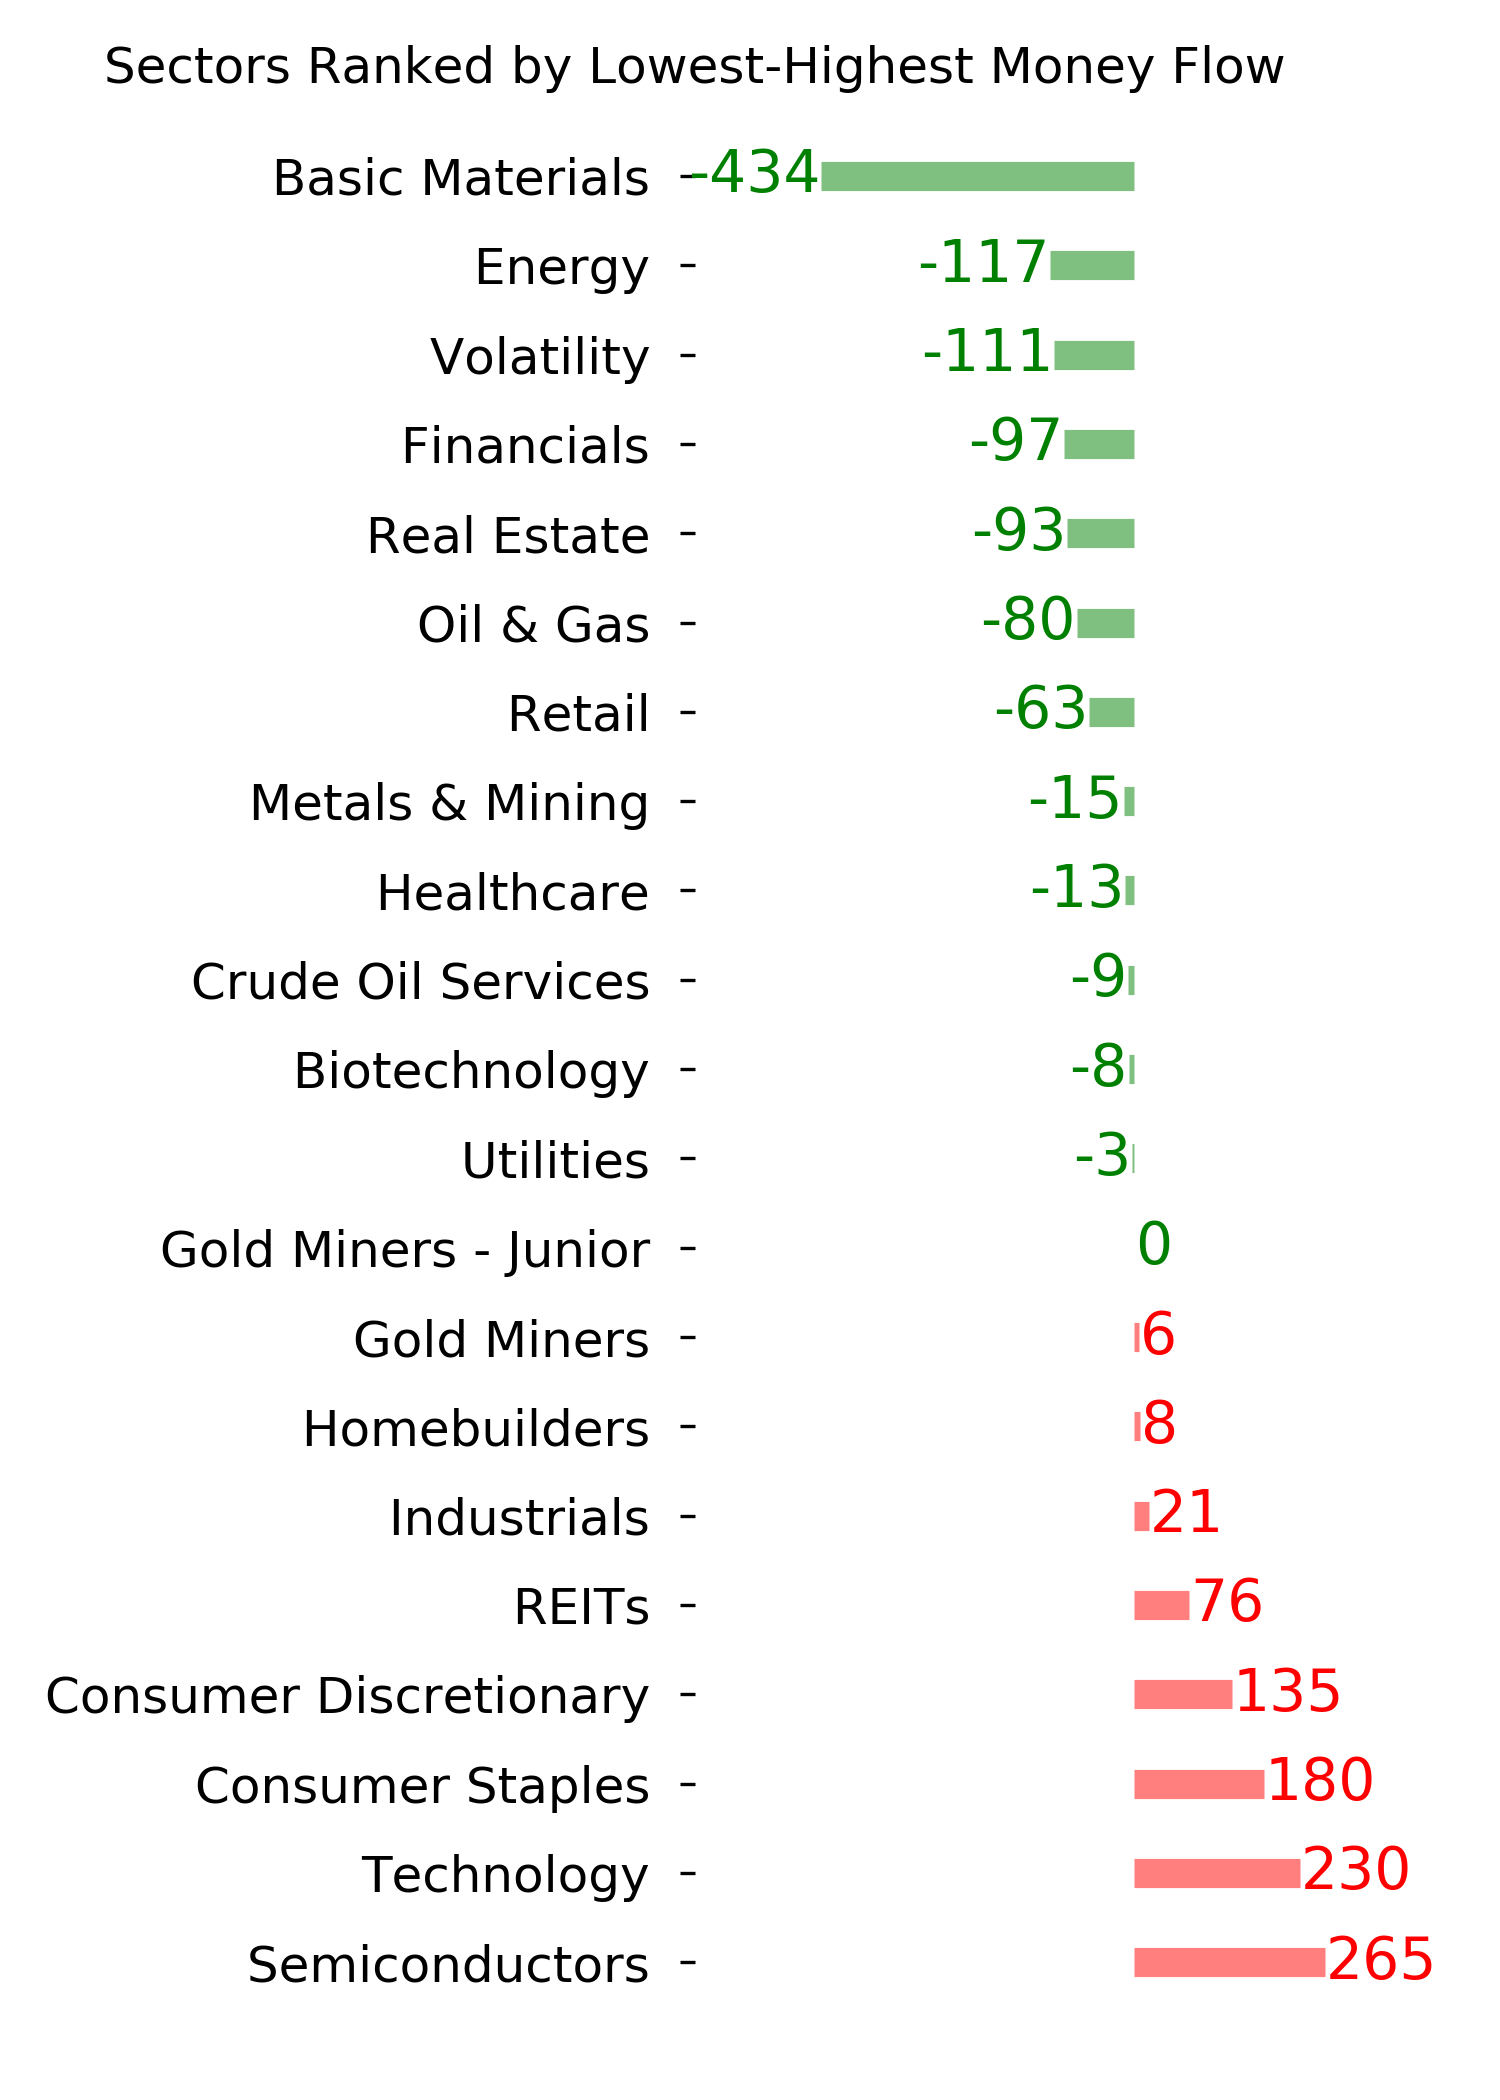
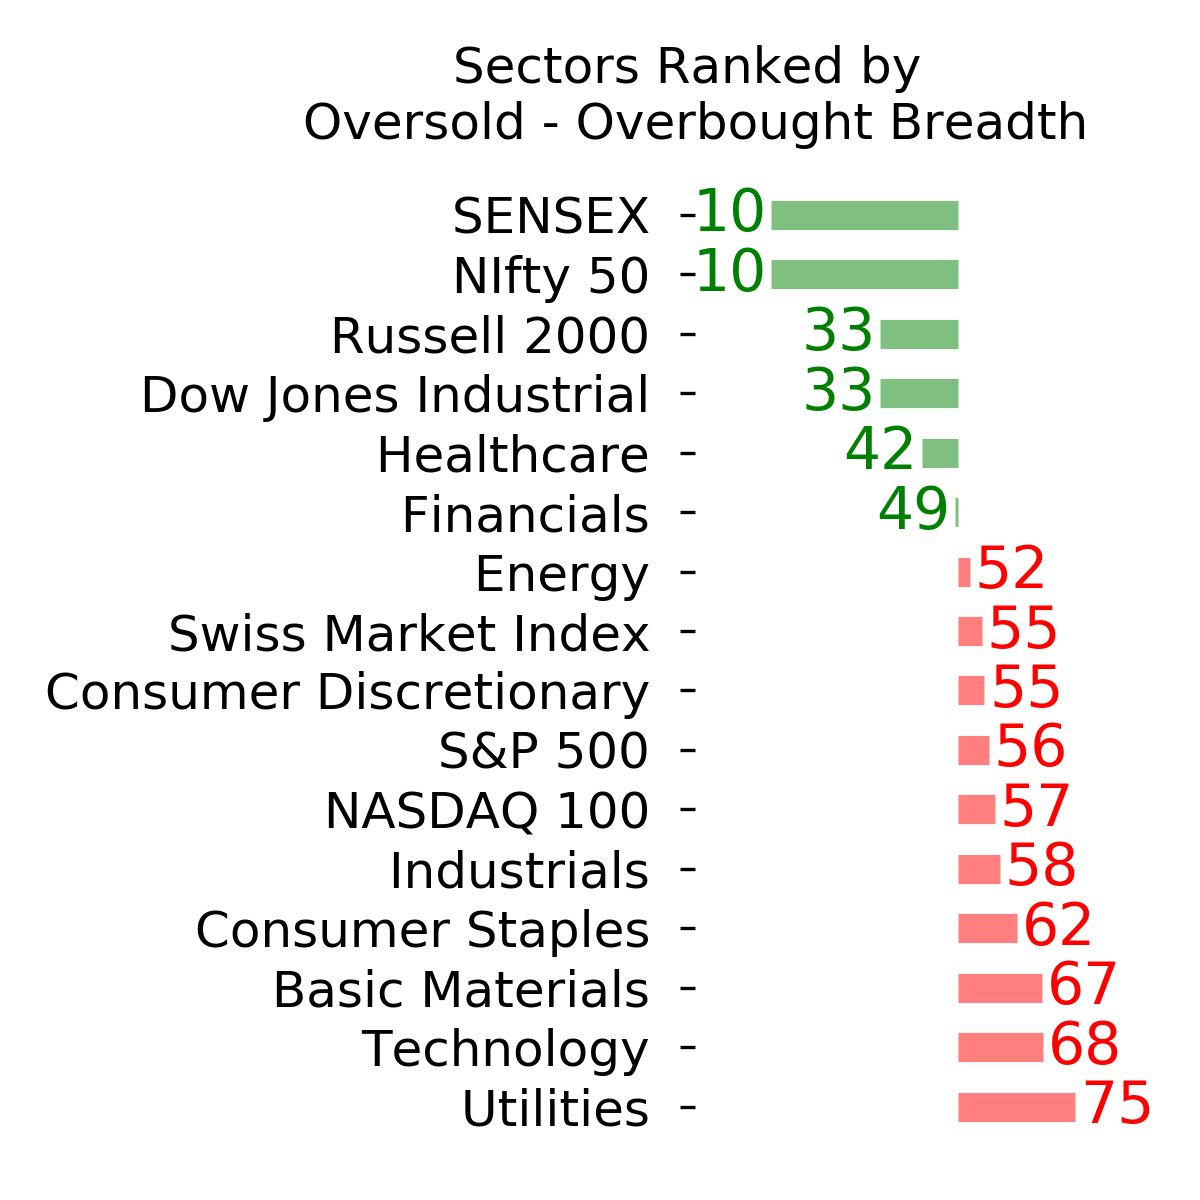
Ranks
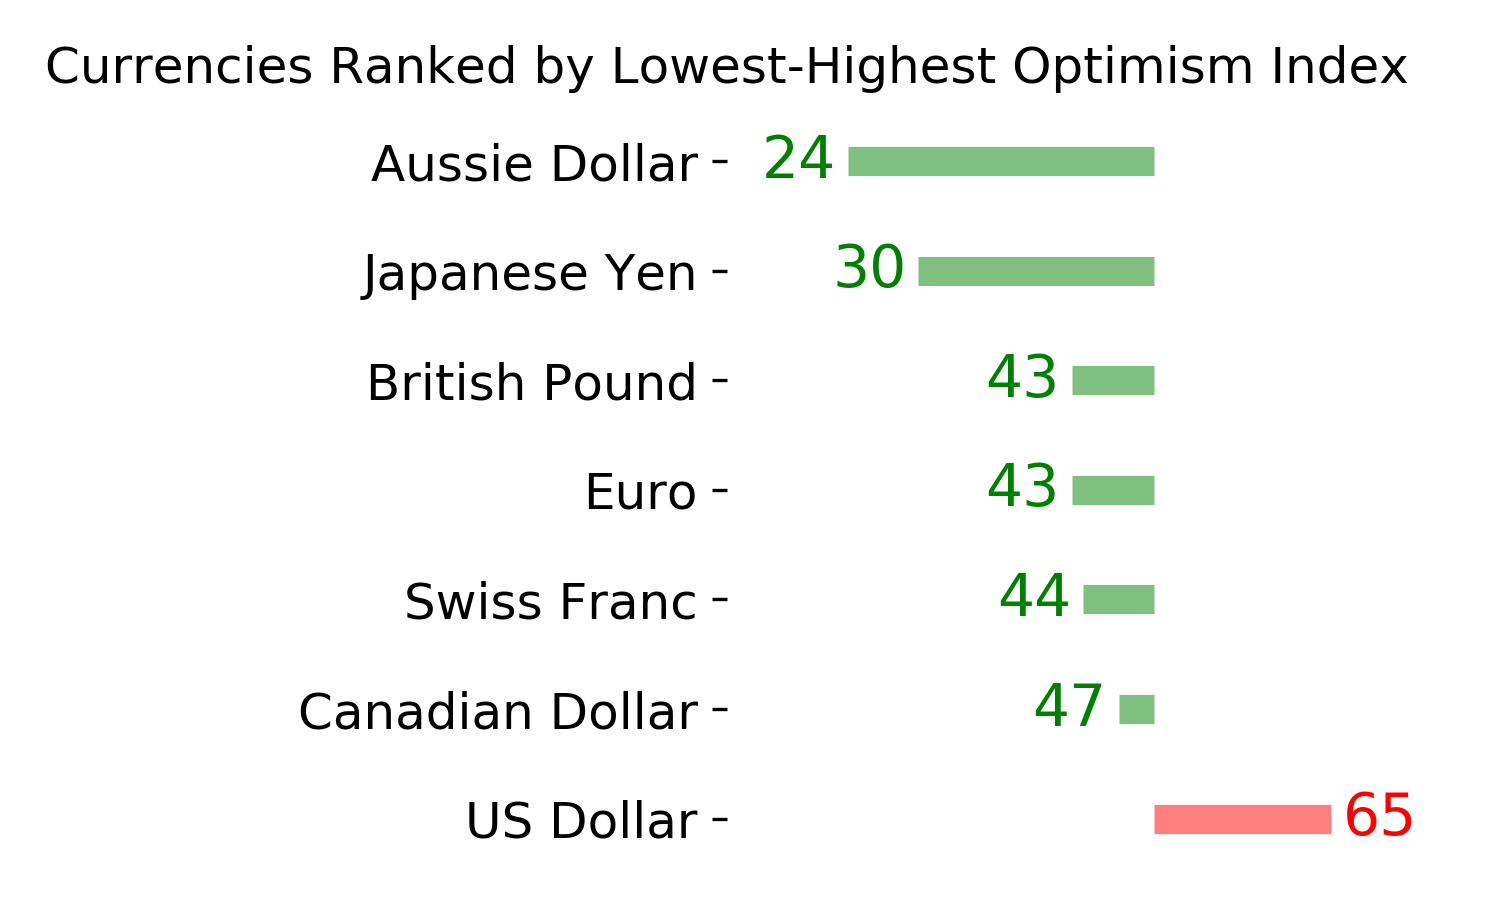
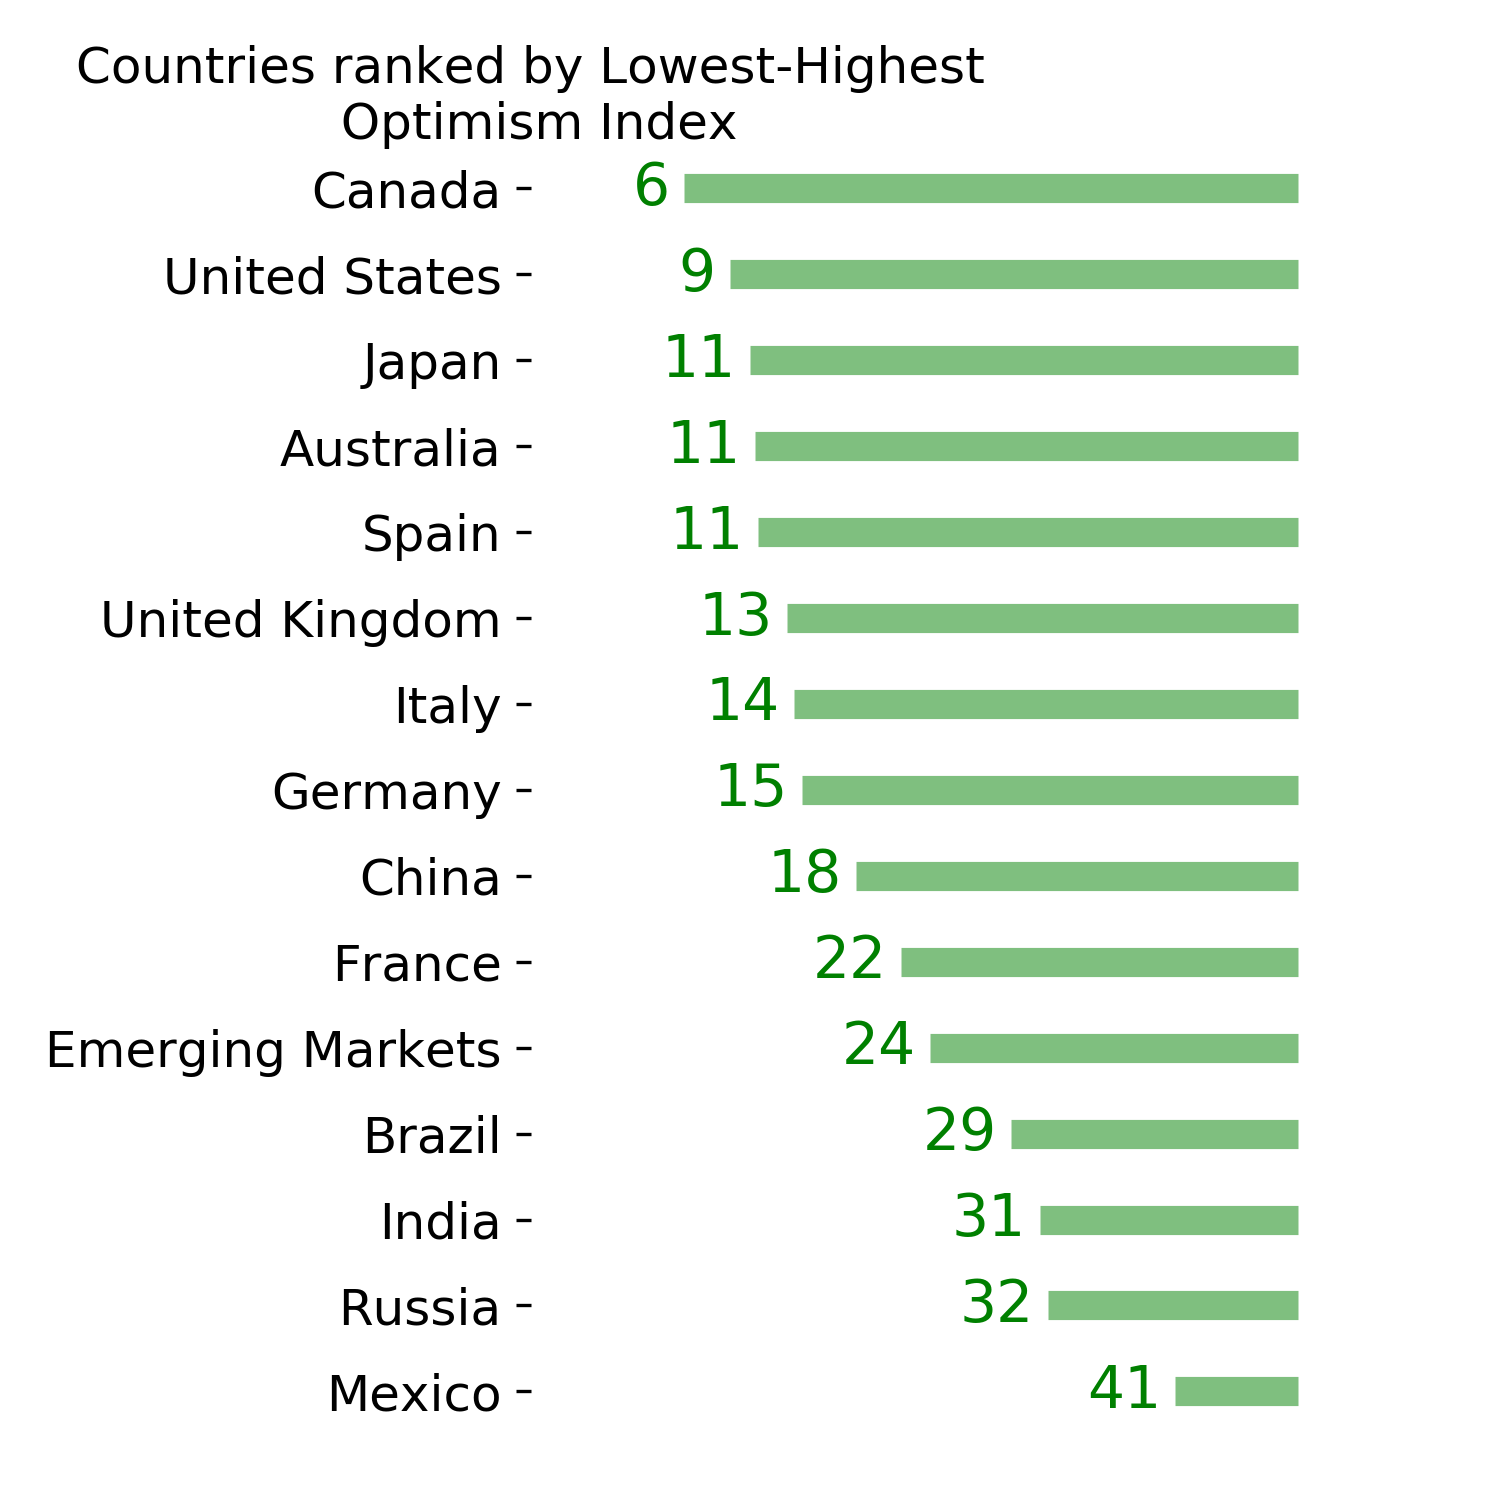
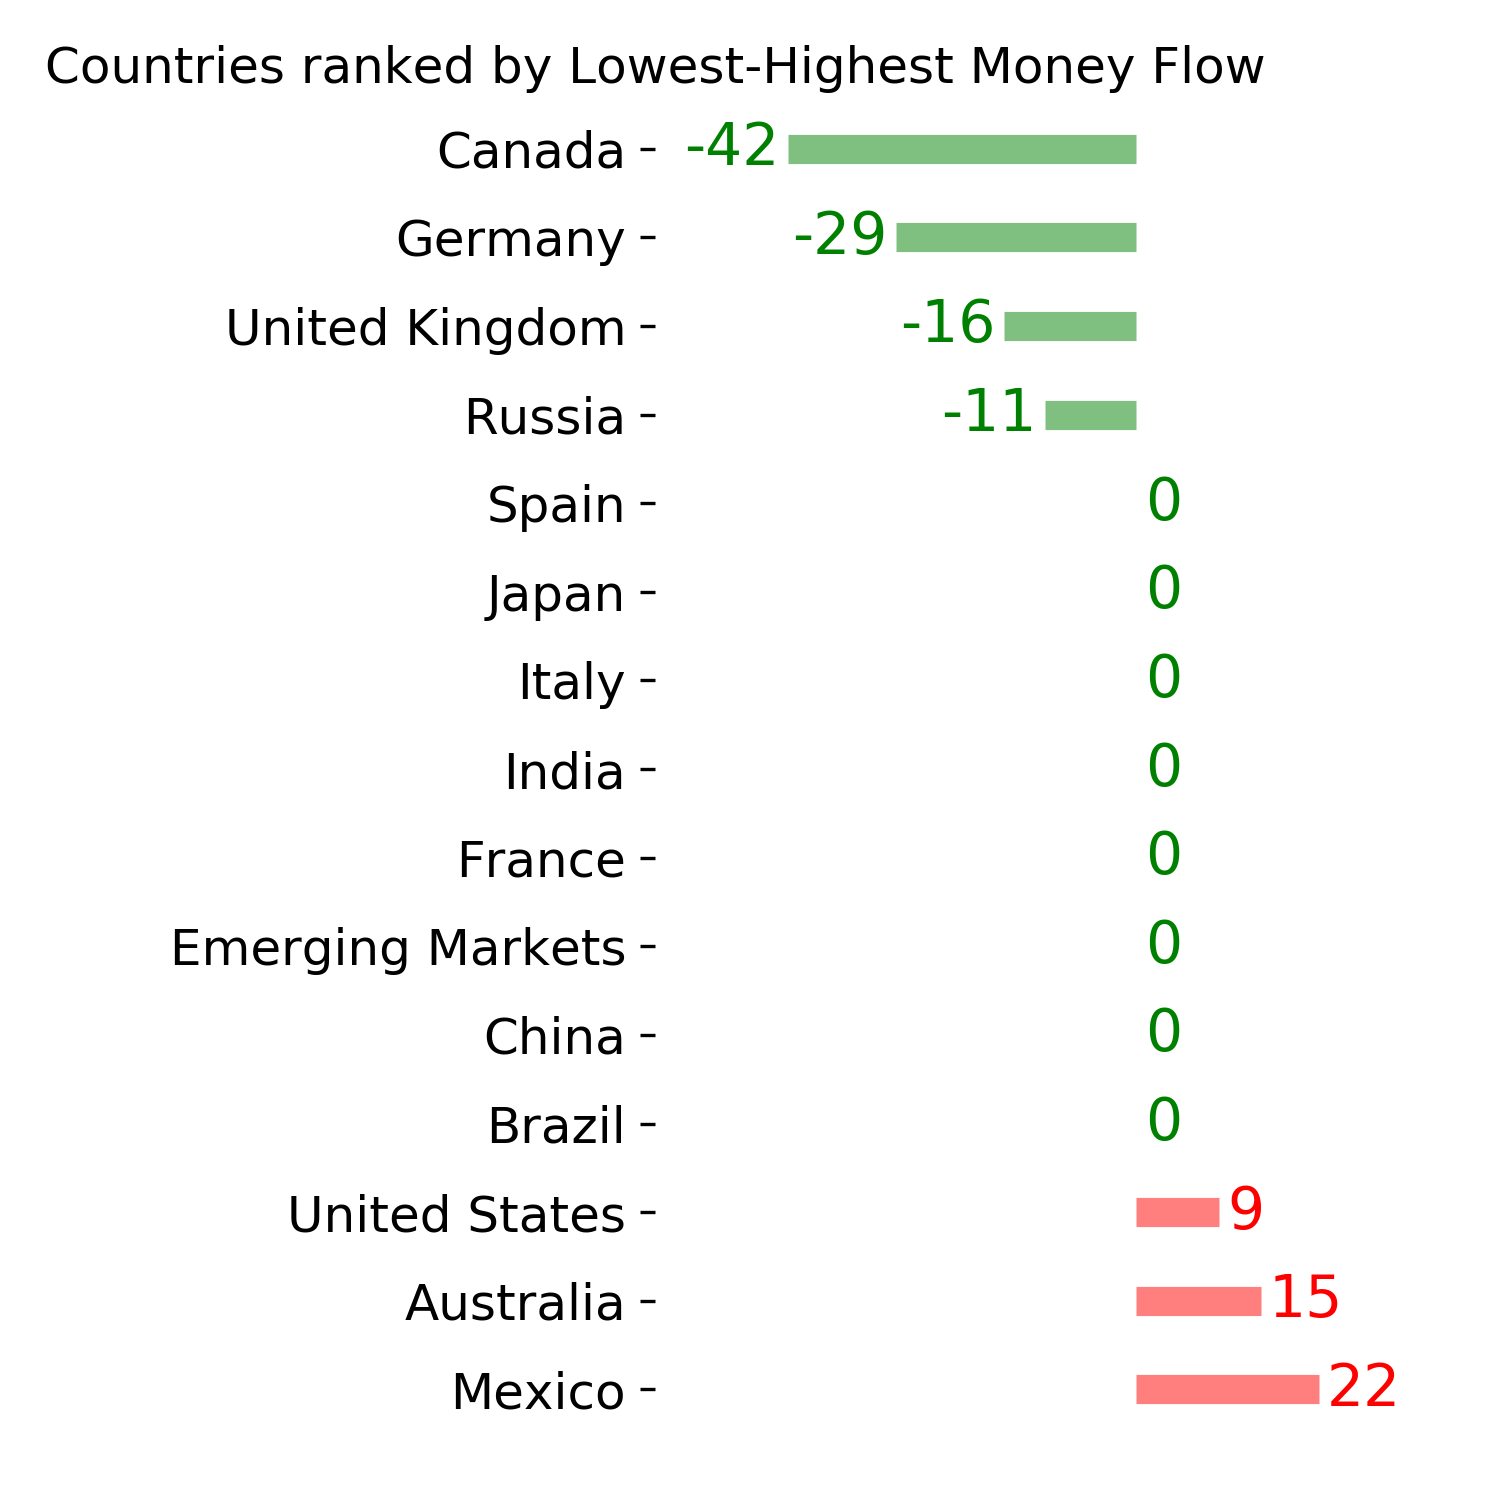
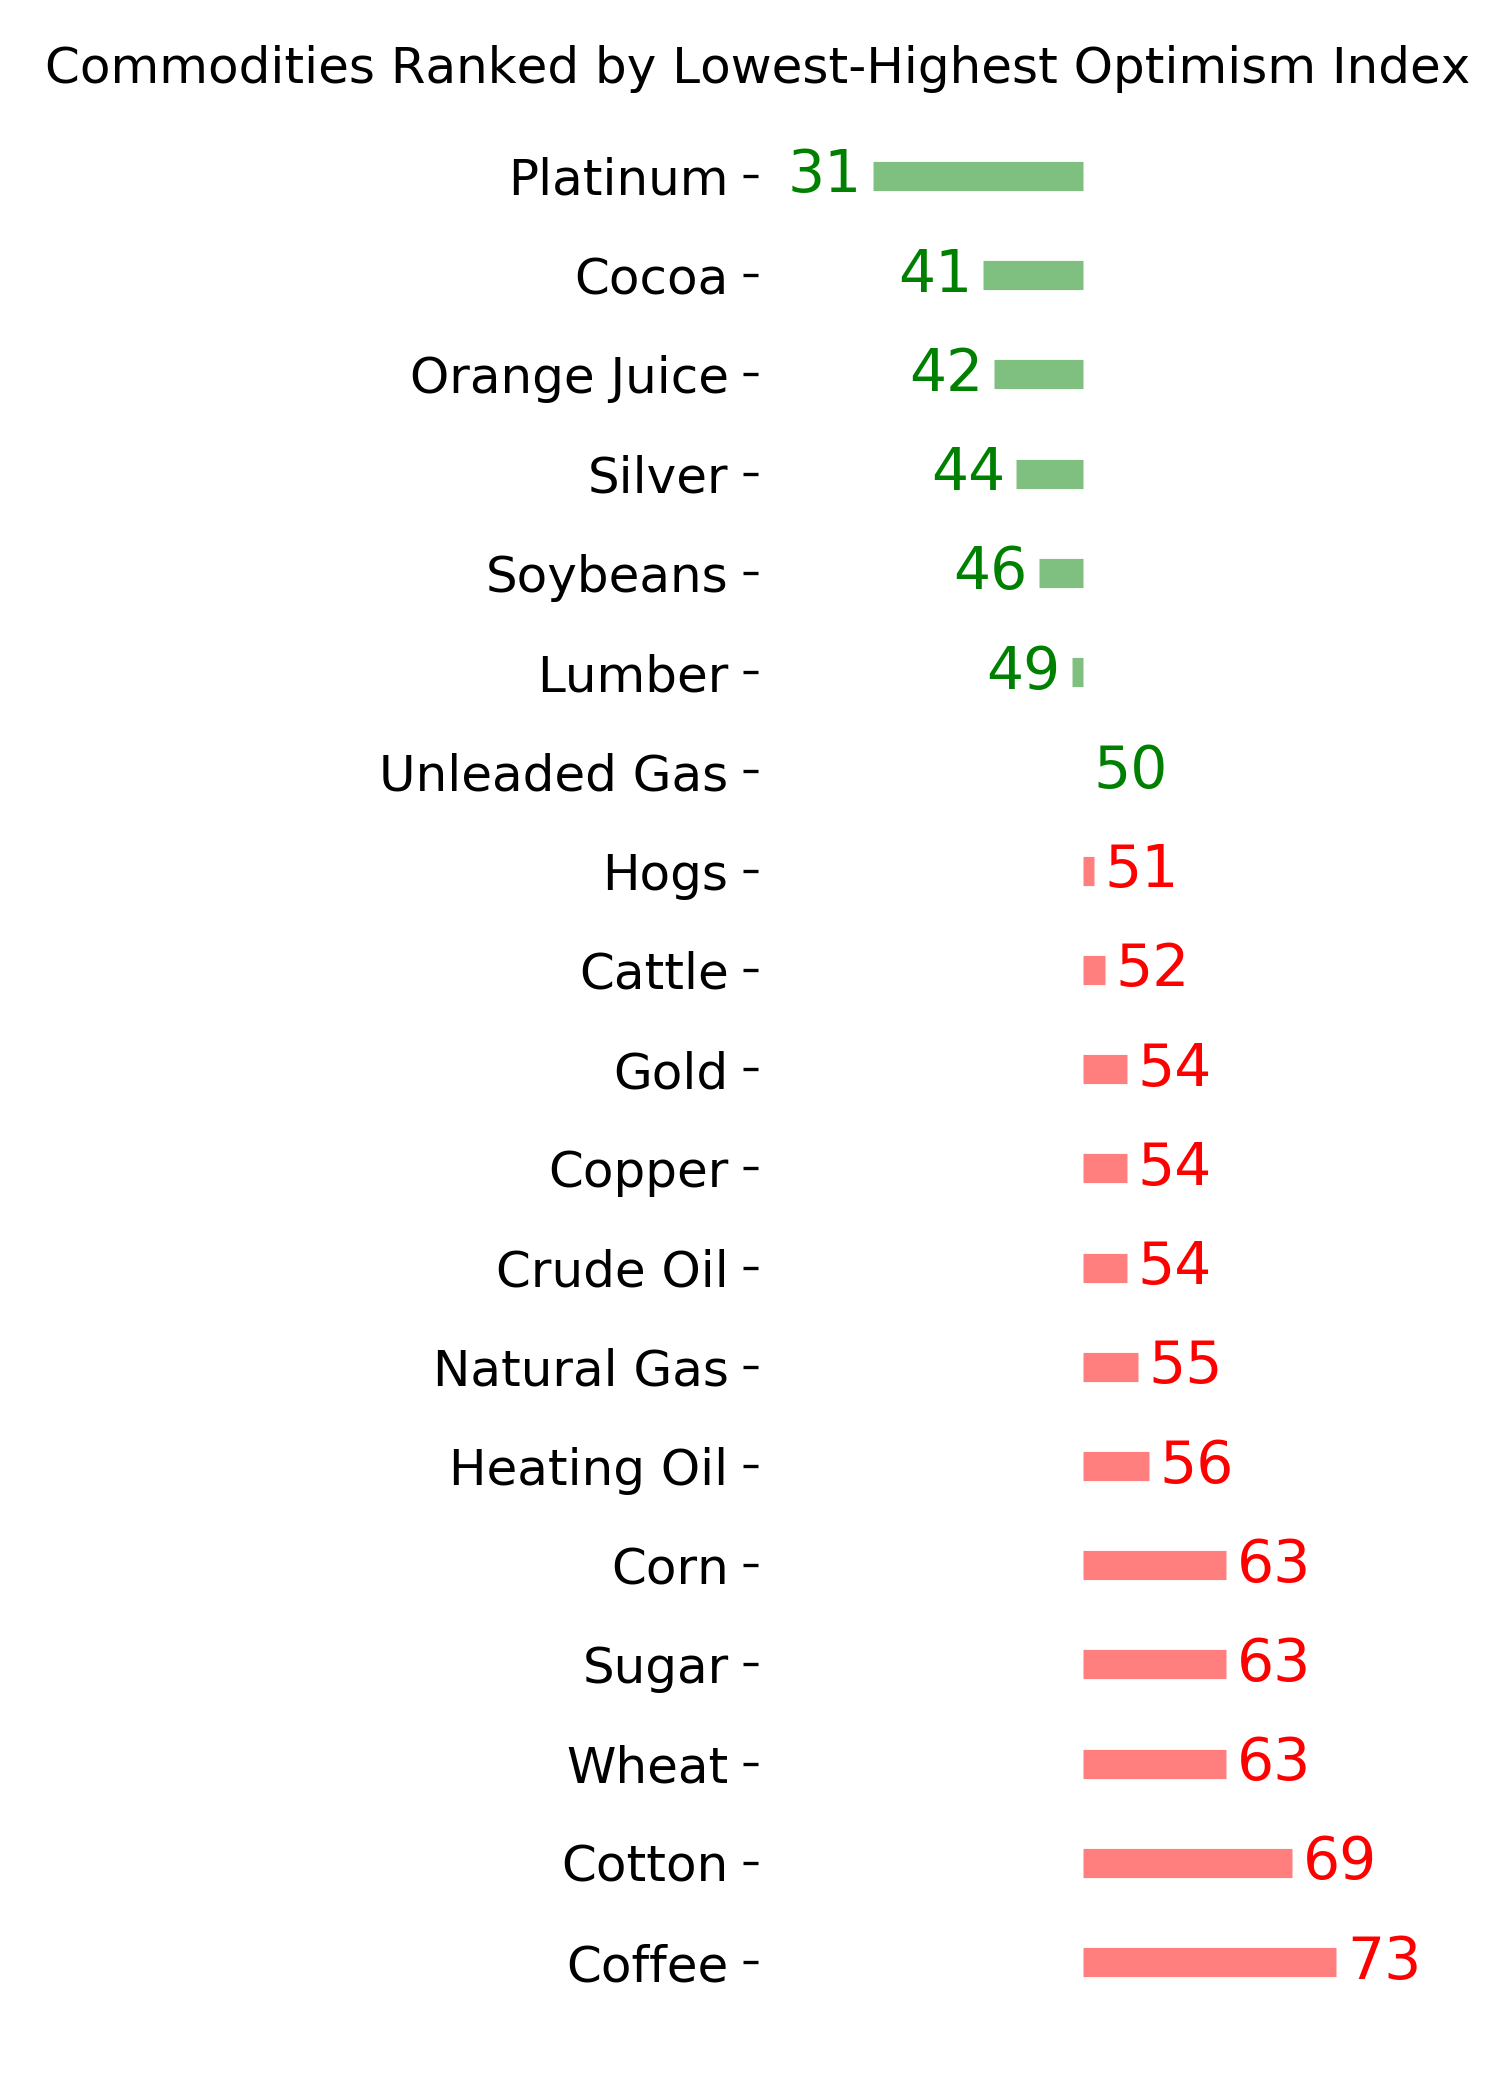
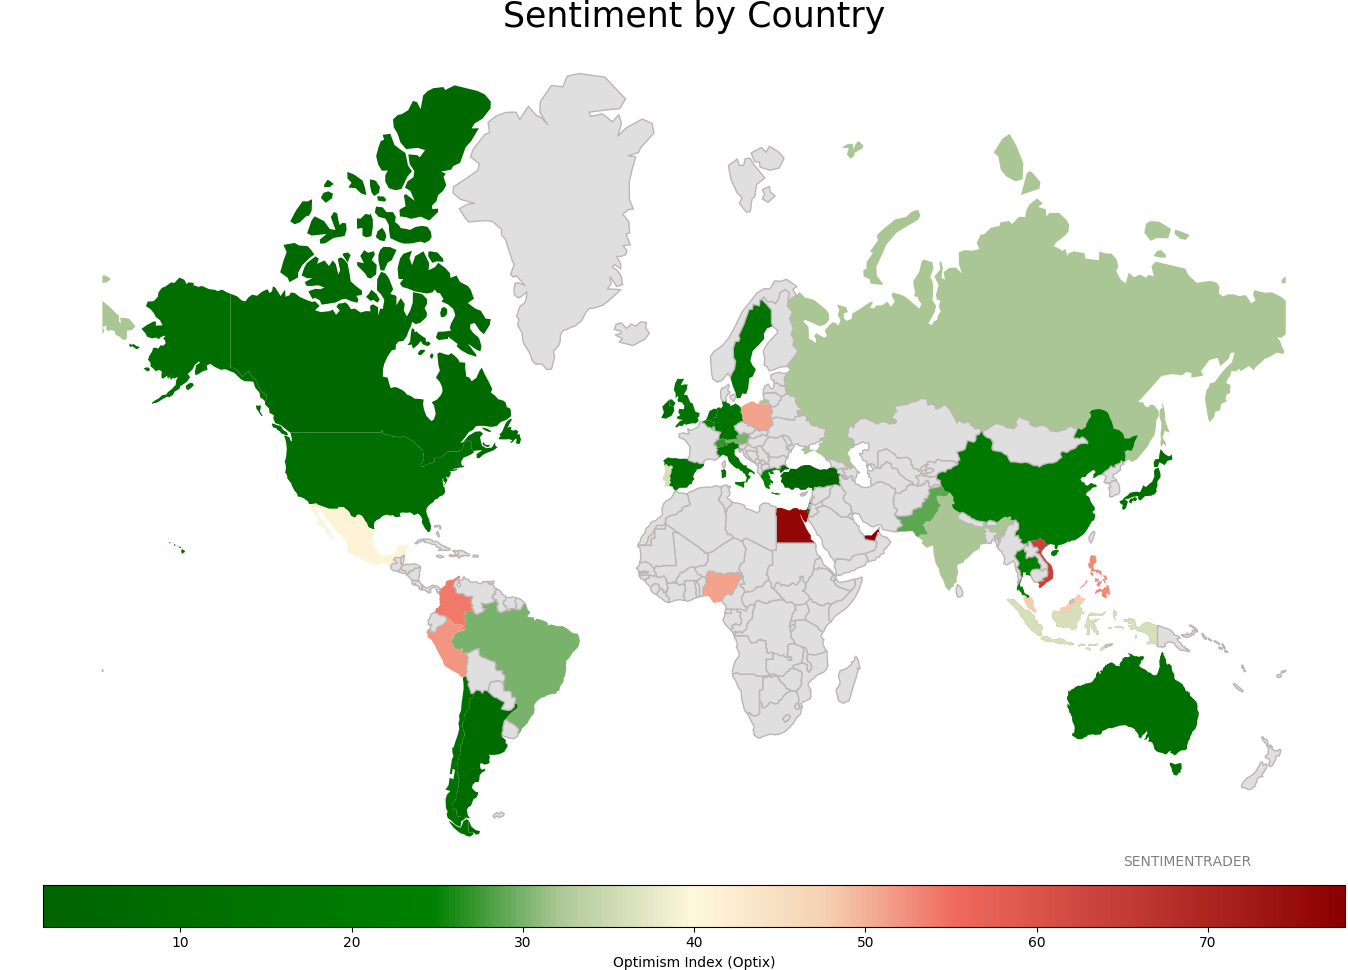
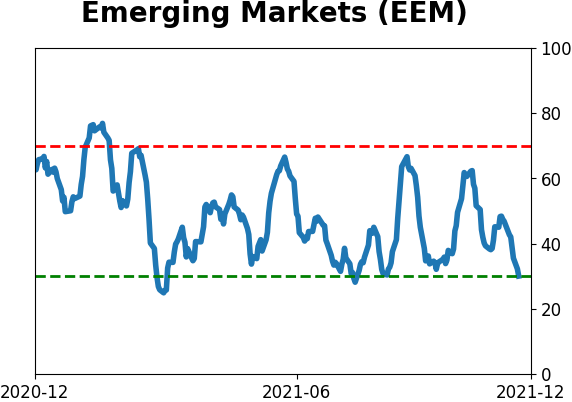
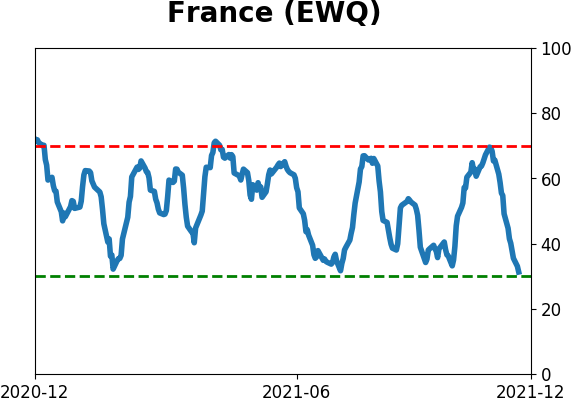
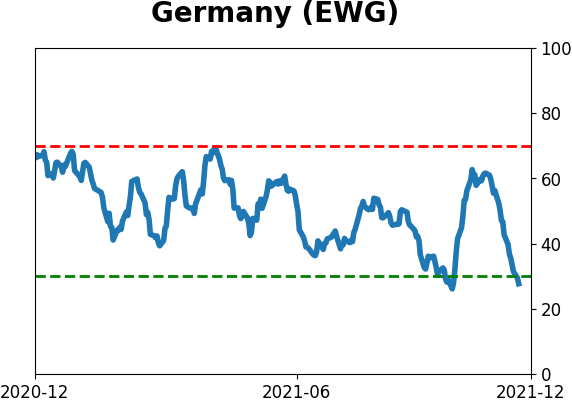
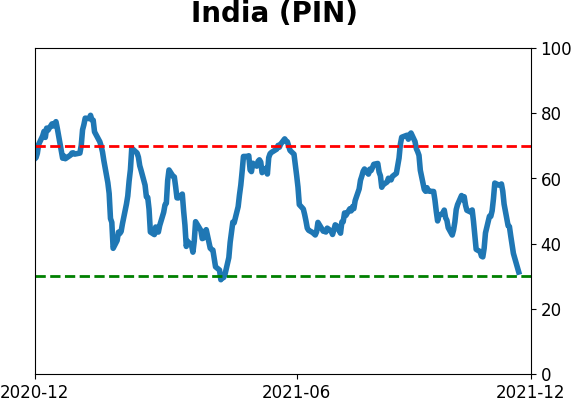
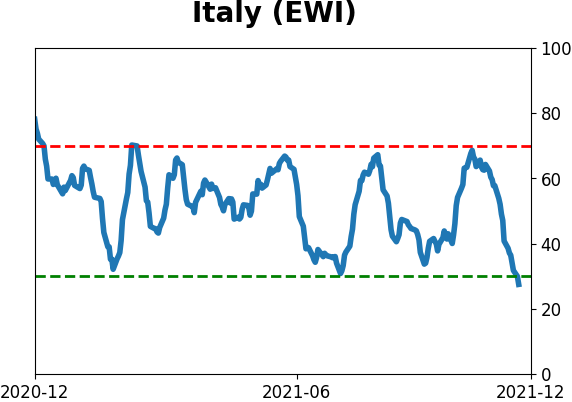
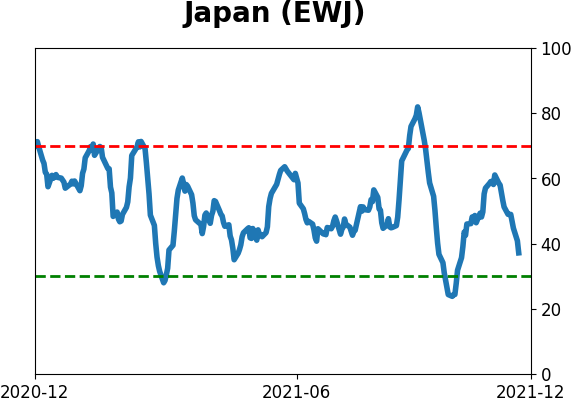
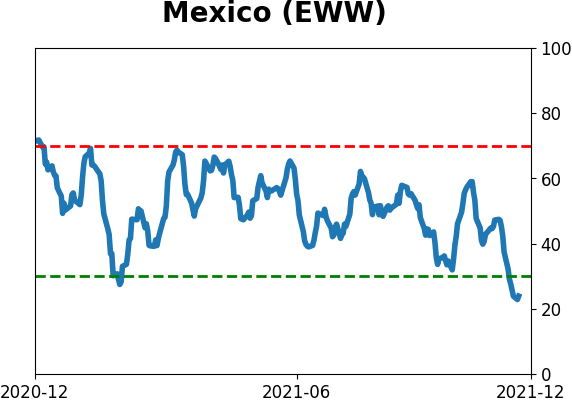
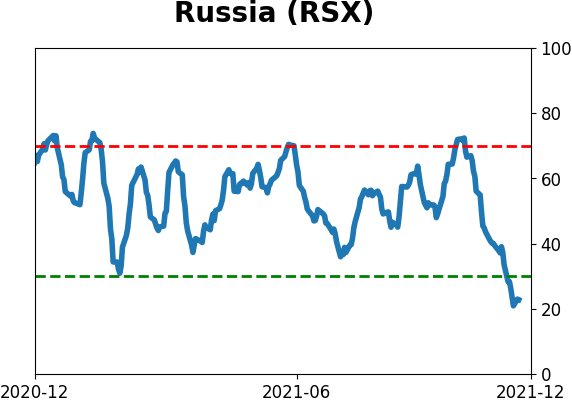
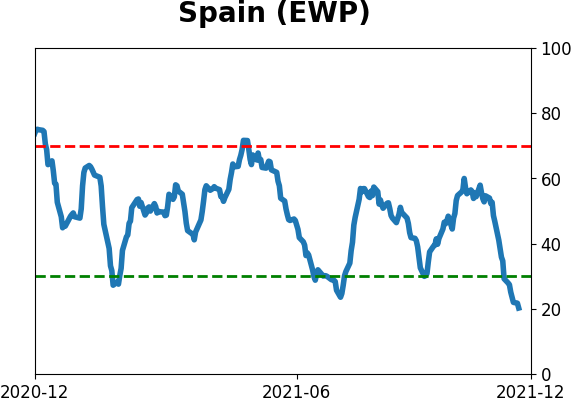
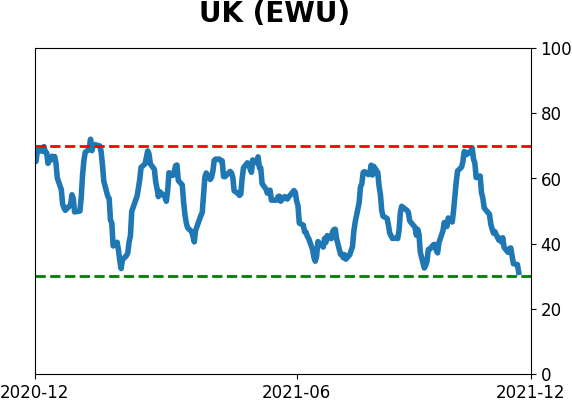
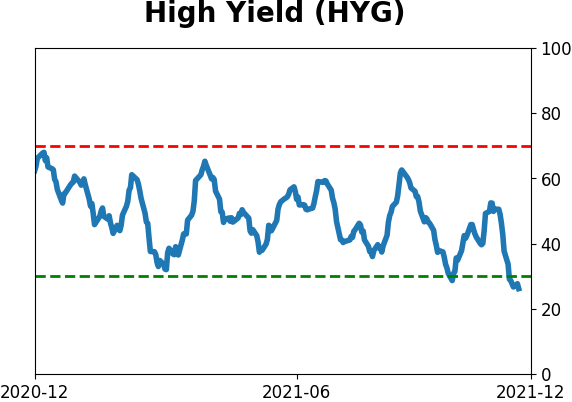
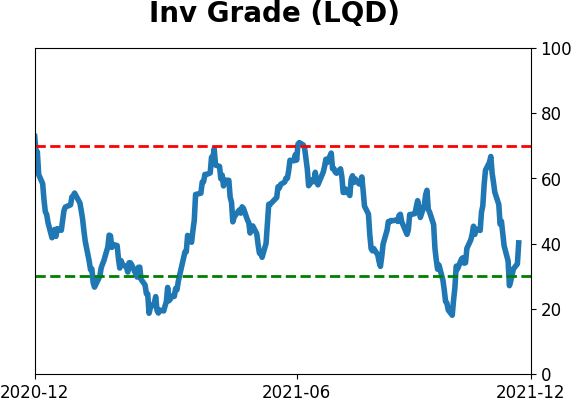
Sentiment Around The World
Optimism Index Thumbnails
|
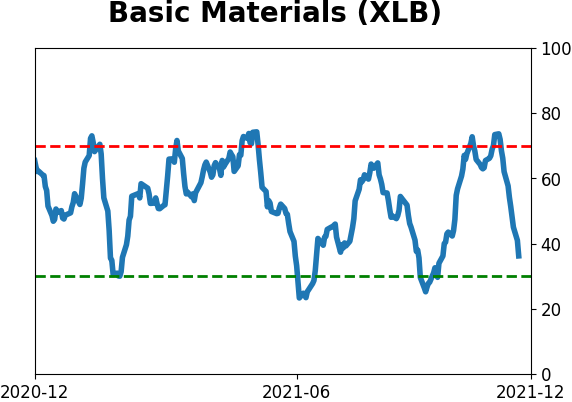
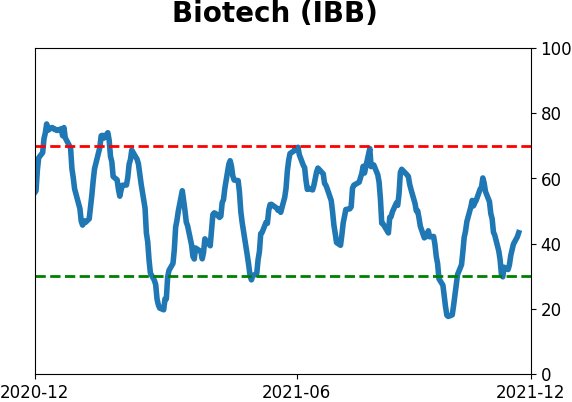
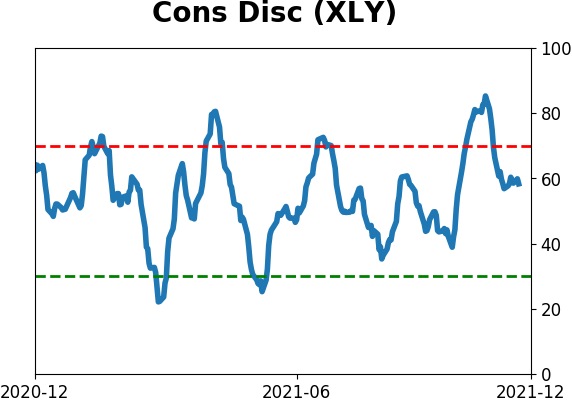
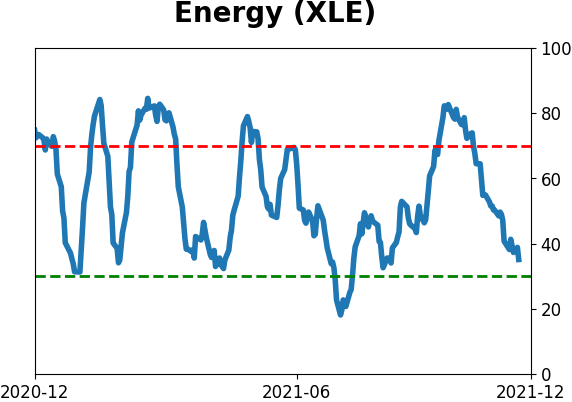
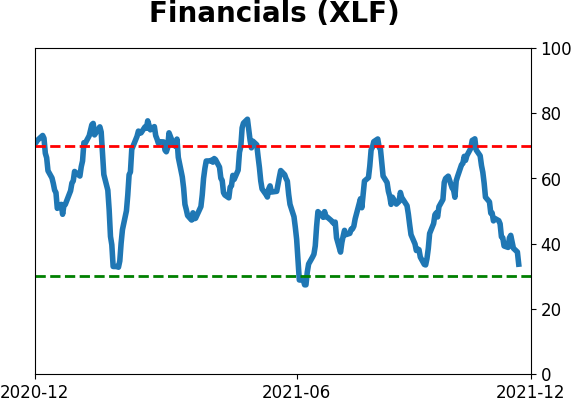
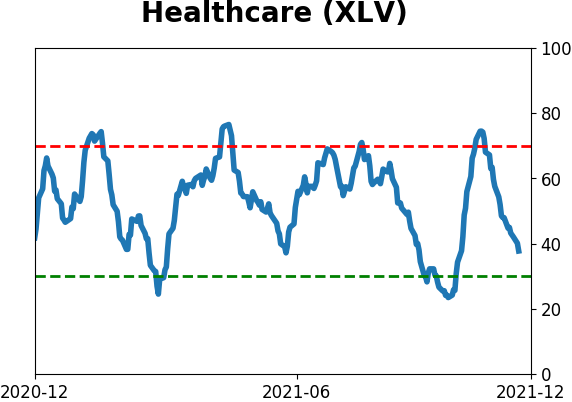
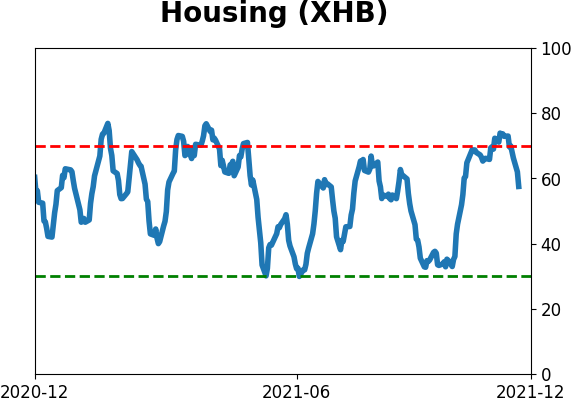
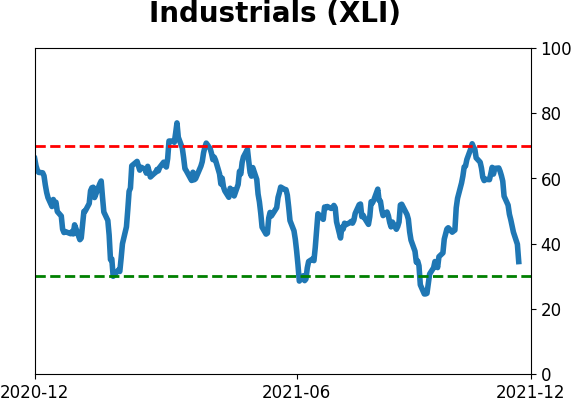
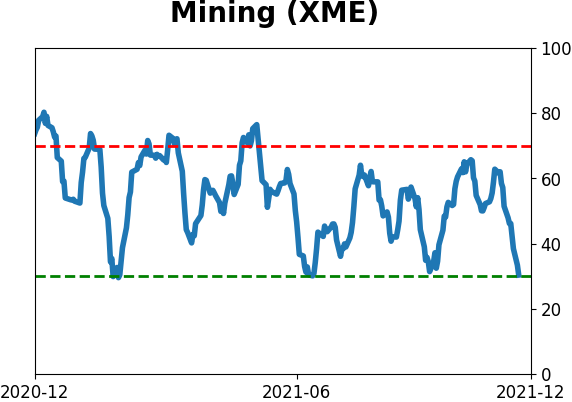
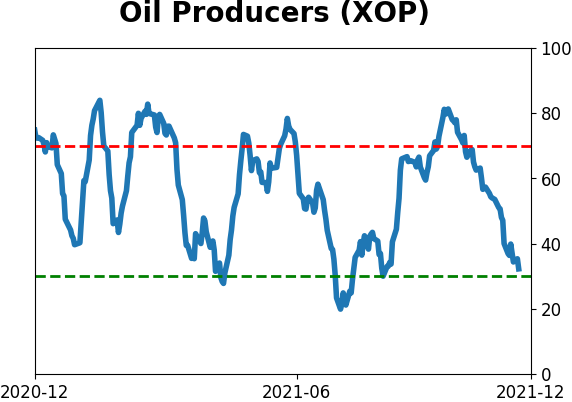
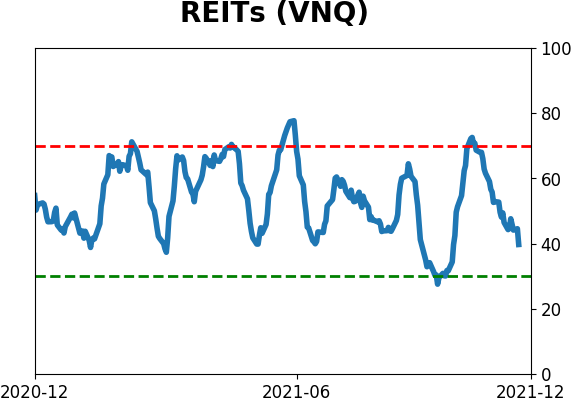
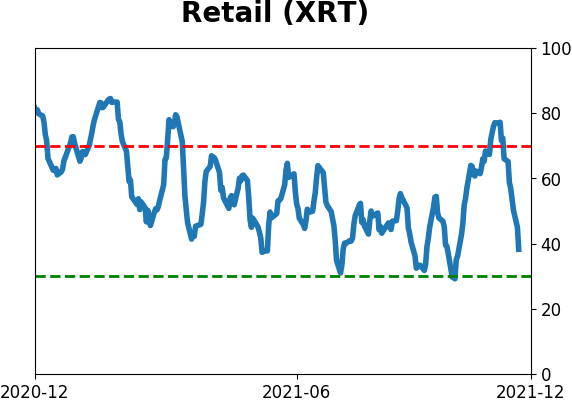
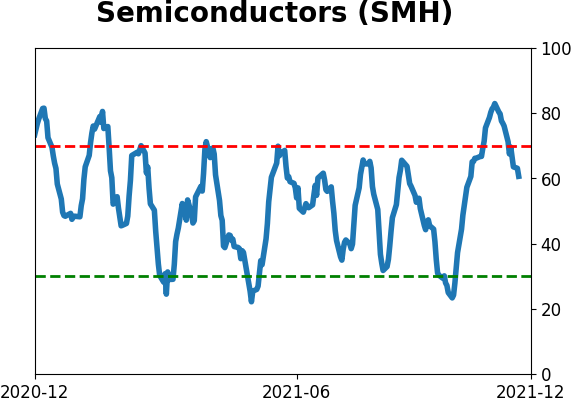
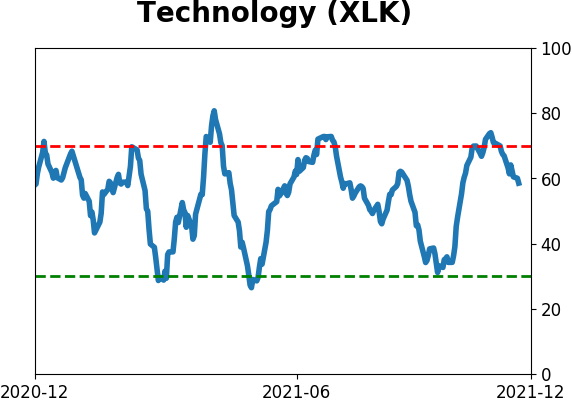
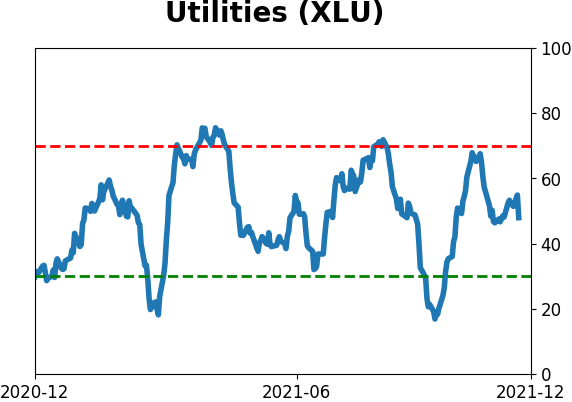
Sector ETF's - 10-Day Moving Average
|
|
|
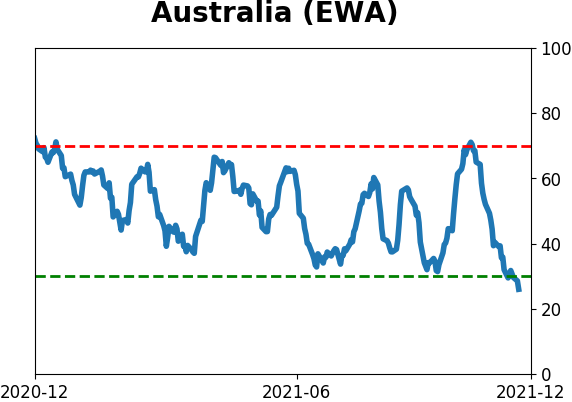
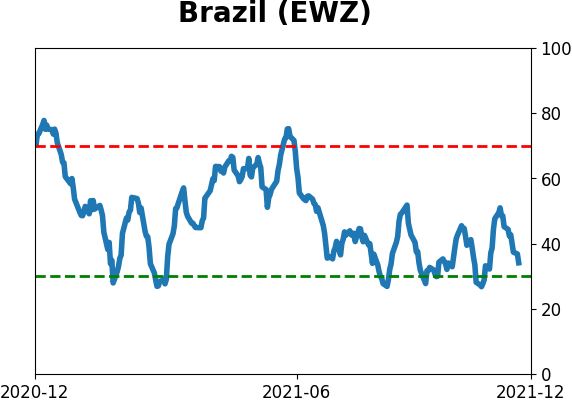
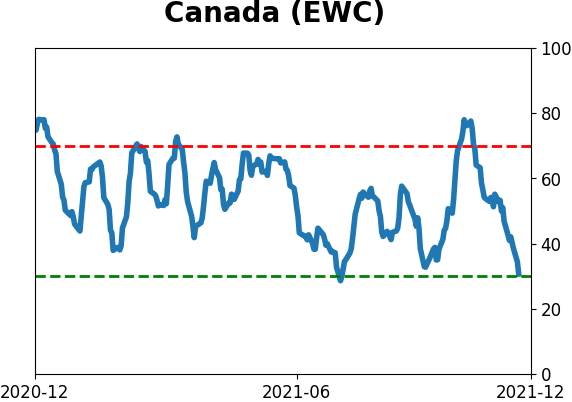
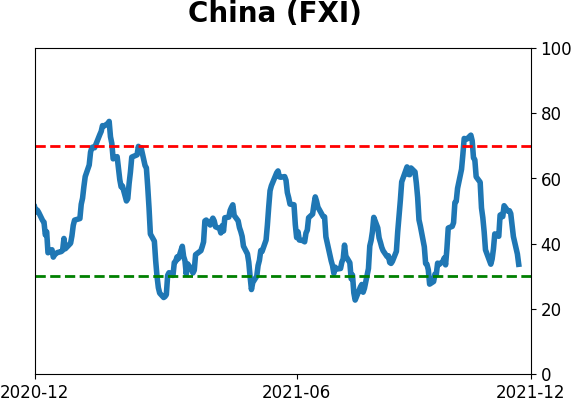
Country ETF's - 10-Day Moving Average
|
|
|
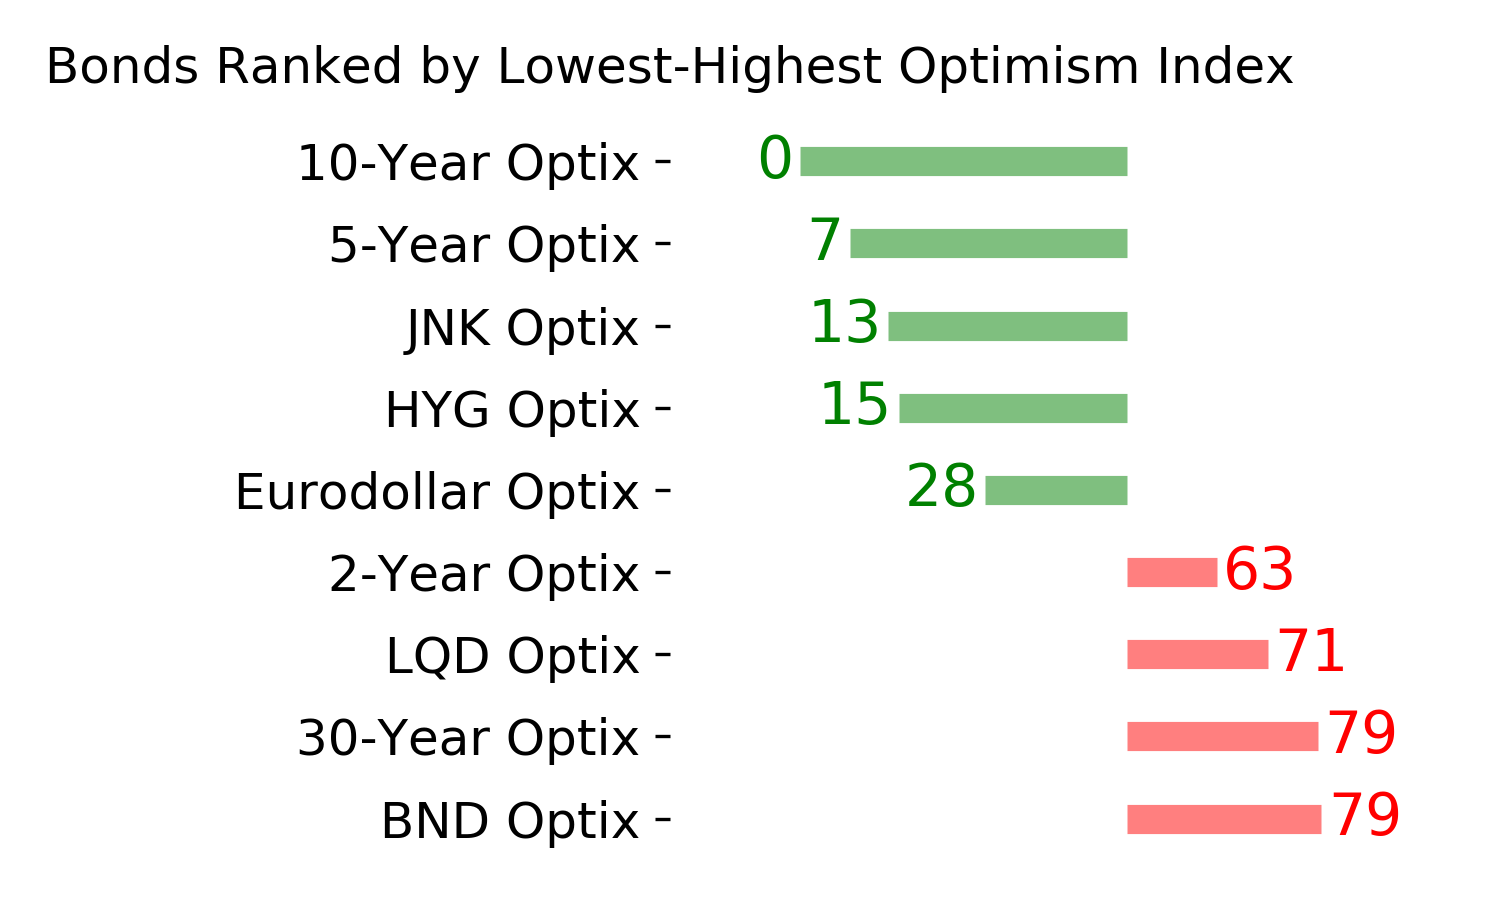
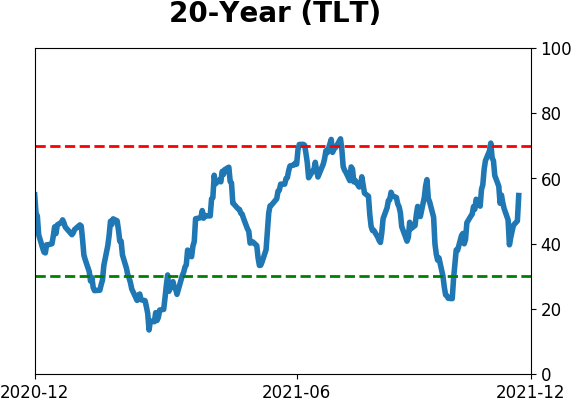
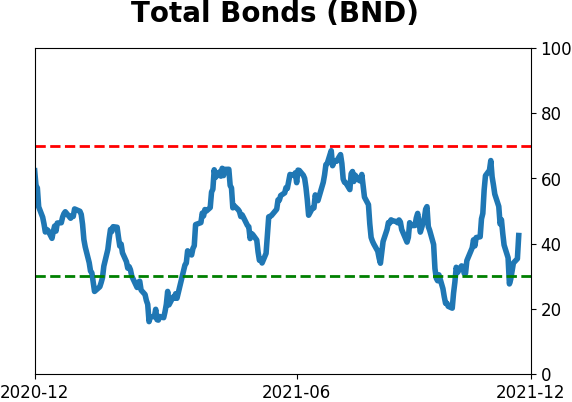
Bond ETF's - 10-Day Moving Average
|
|
|
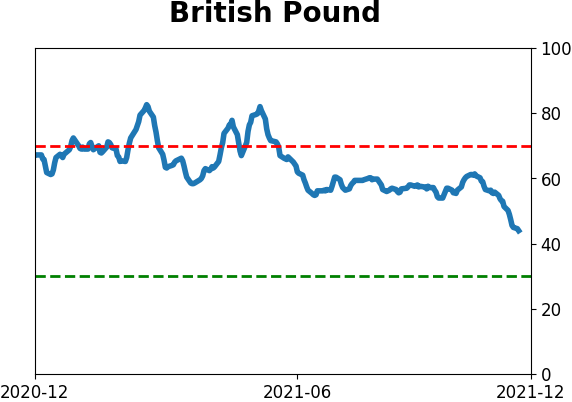
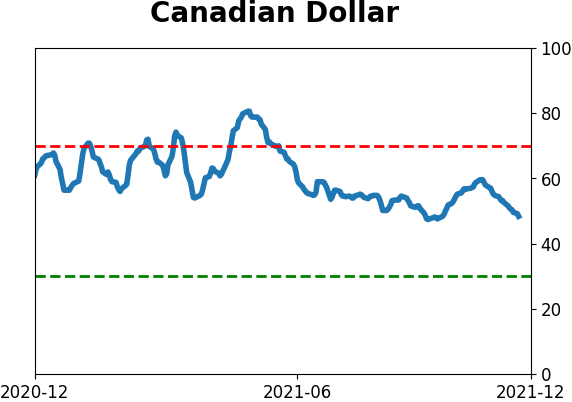
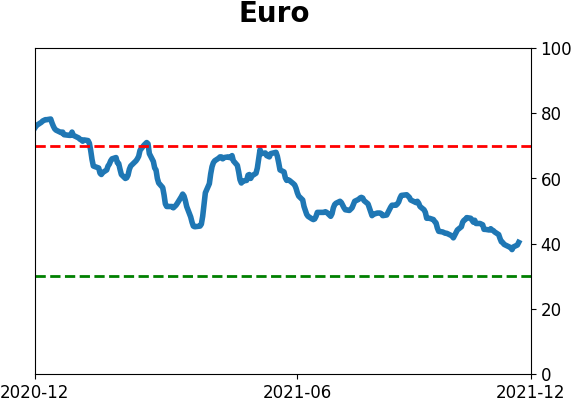
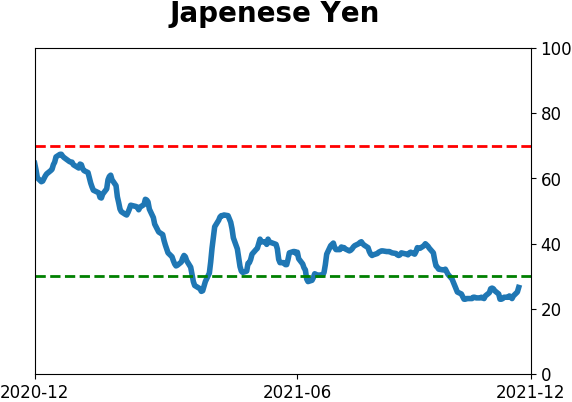
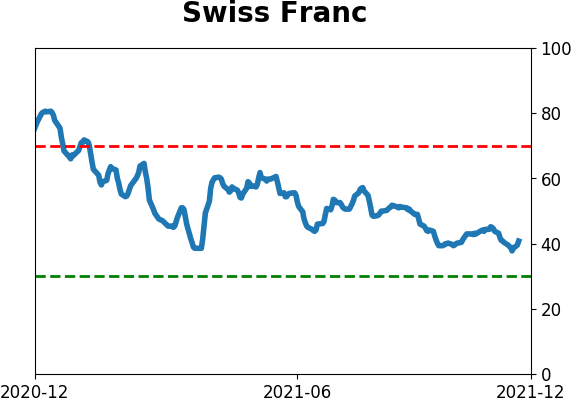
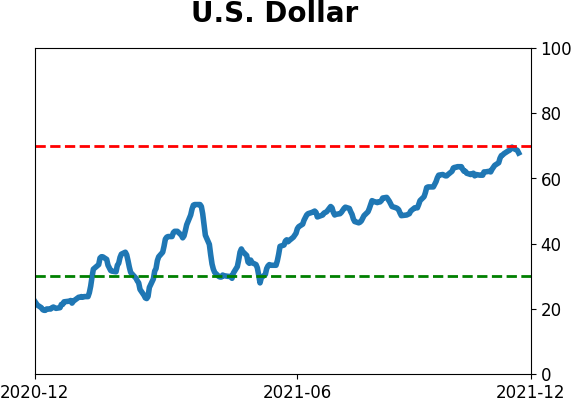
Currency ETF's - 5-Day Moving Average
|
|
|
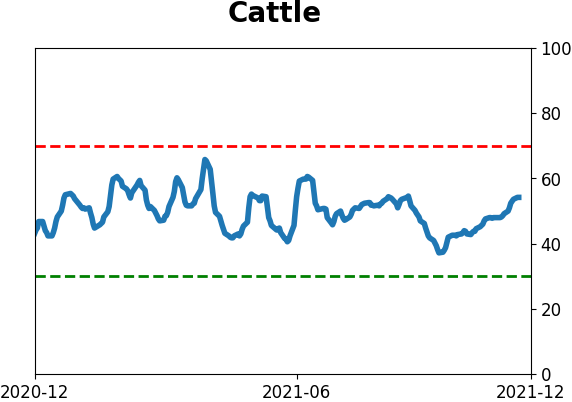
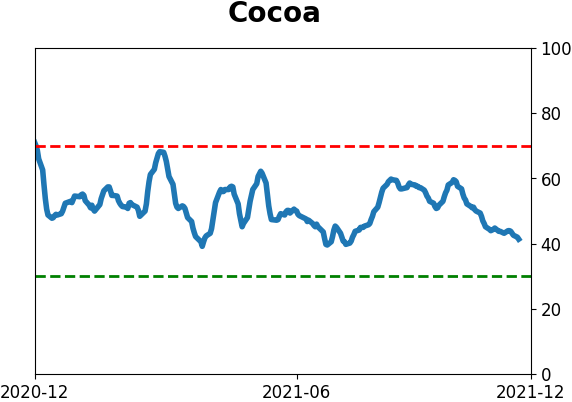
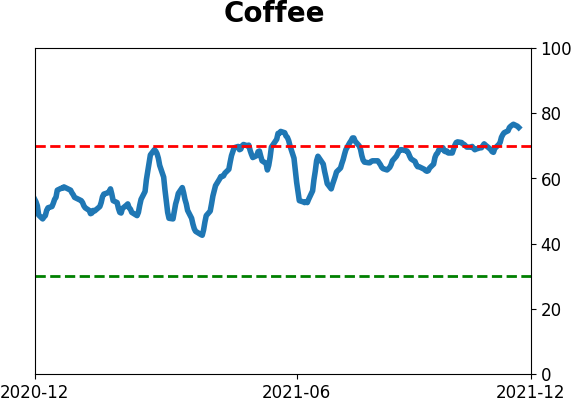
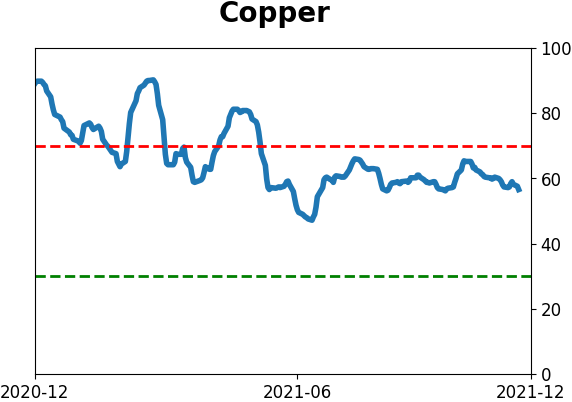
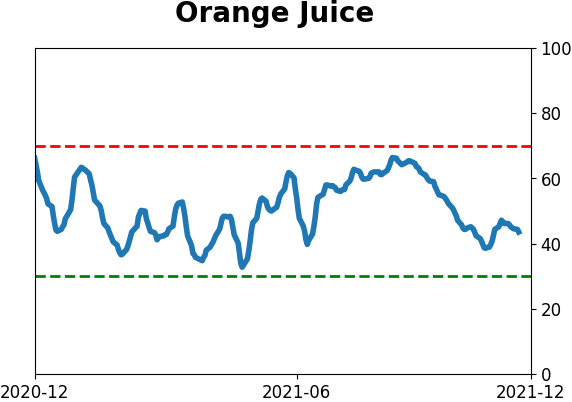
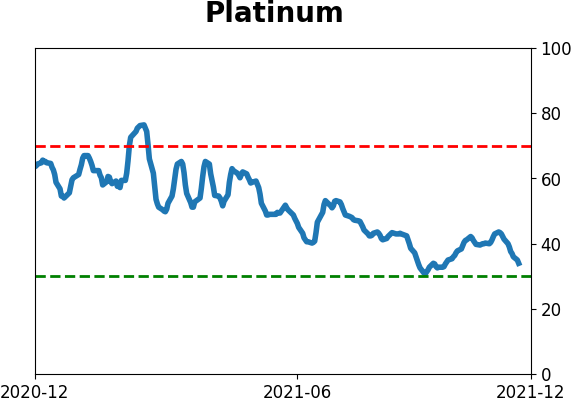
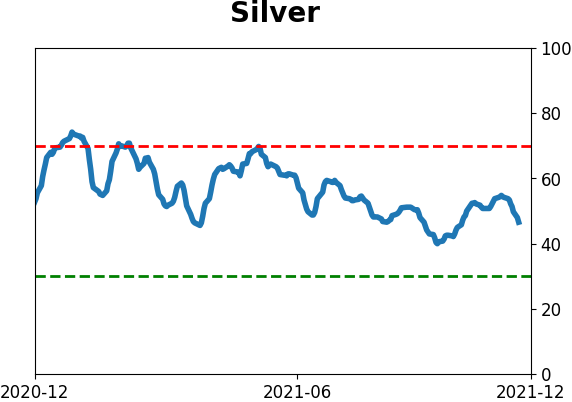
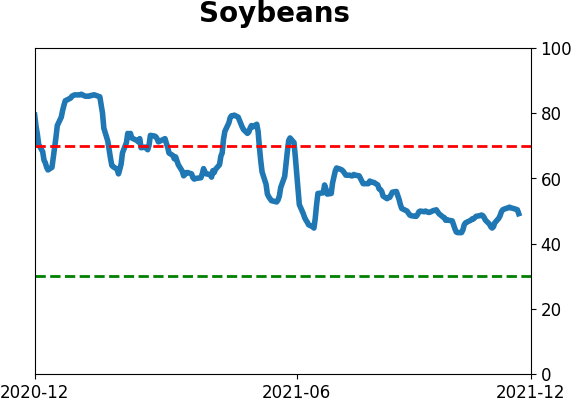
Commodity ETF's - 5-Day Moving Average
|
|