Headlines
|
|
Growth continues its massive outperformance through November:
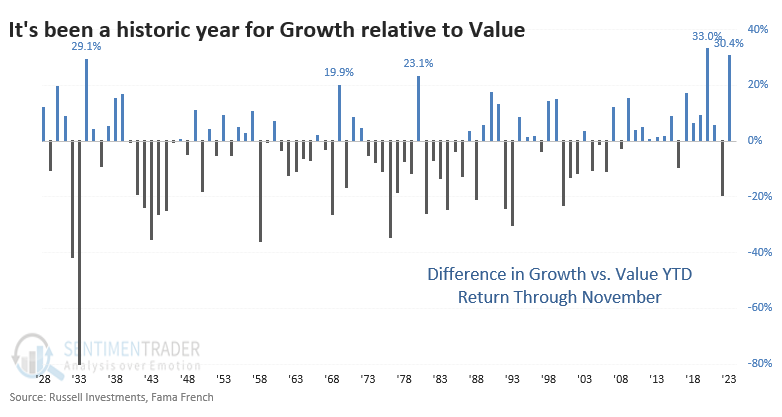
With a couple of days left in the month, Growth stocks have a massive lead over Value in year-to-date returns. By outpacing Value by more than +30%, Growth stocks have enjoyed a historic year. Other years with big Growth outperformance through November tended to precede more gains, especially for the Growth stocks.
|
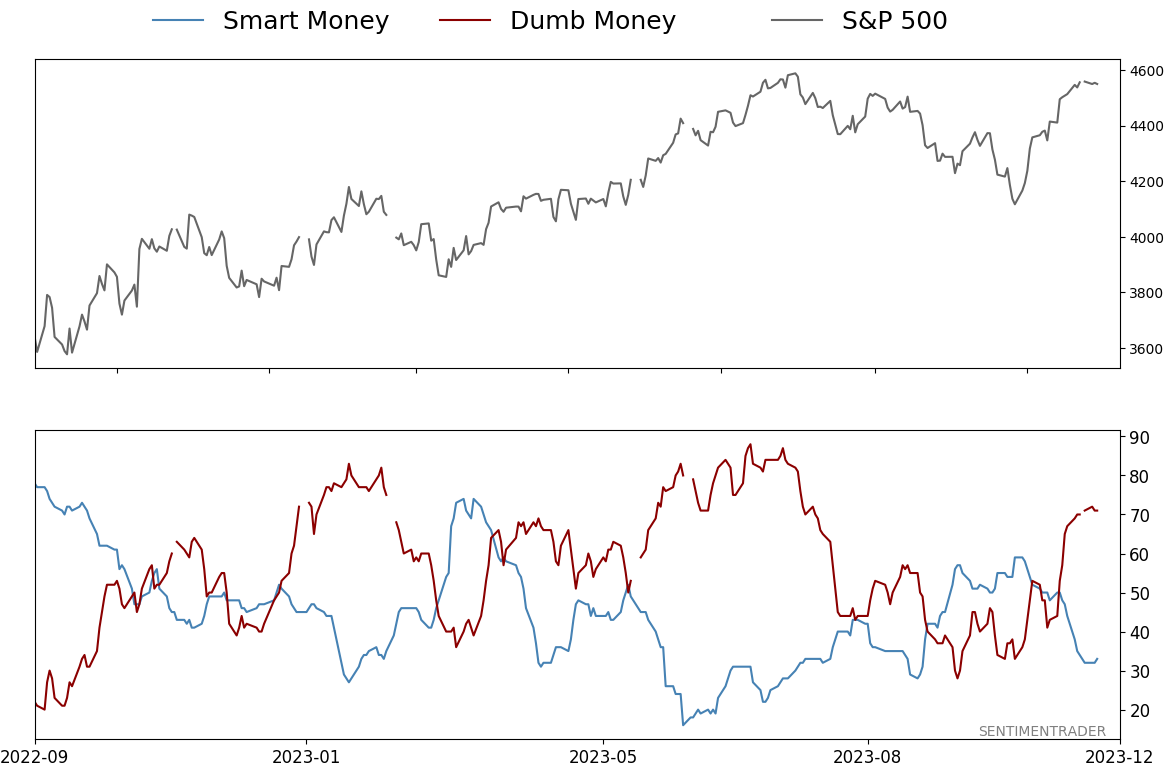
Smart / Dumb Money Confidence
|
Smart Money Confidence: 33%
Dumb Money Confidence: 71%
|
|
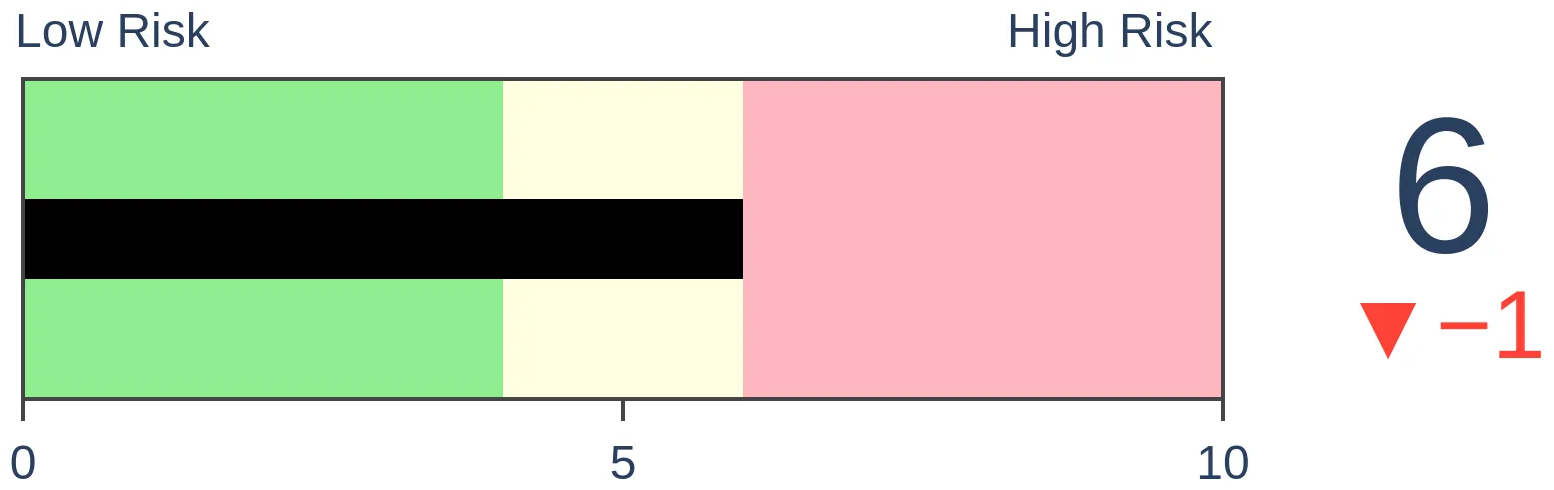
Risk Levels
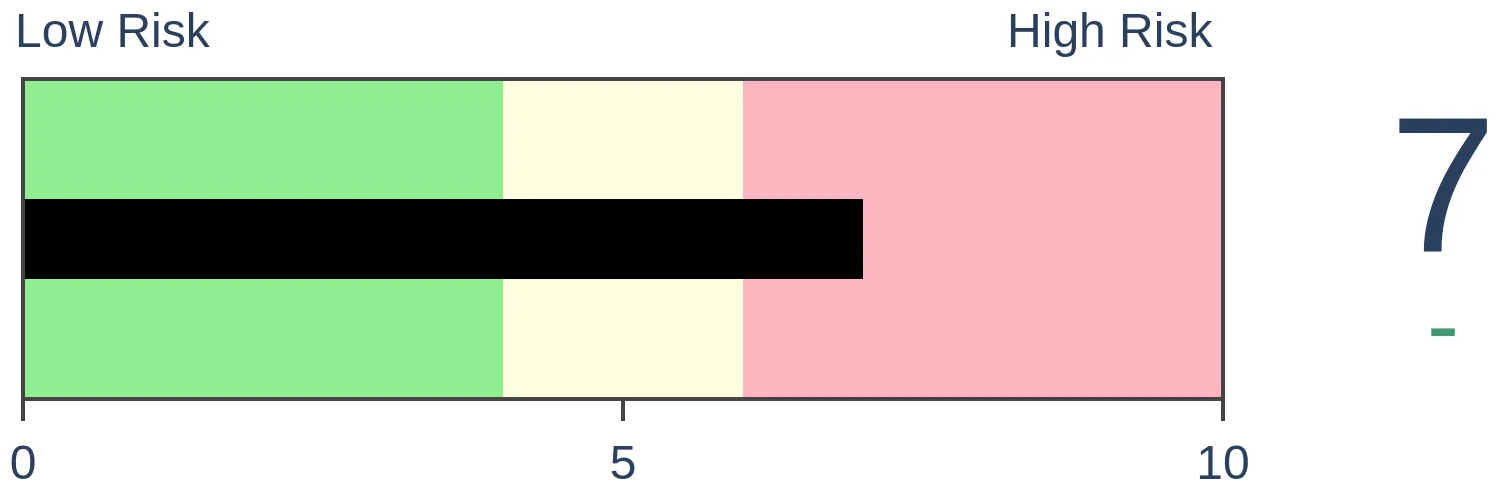
Stocks Short-Term
|
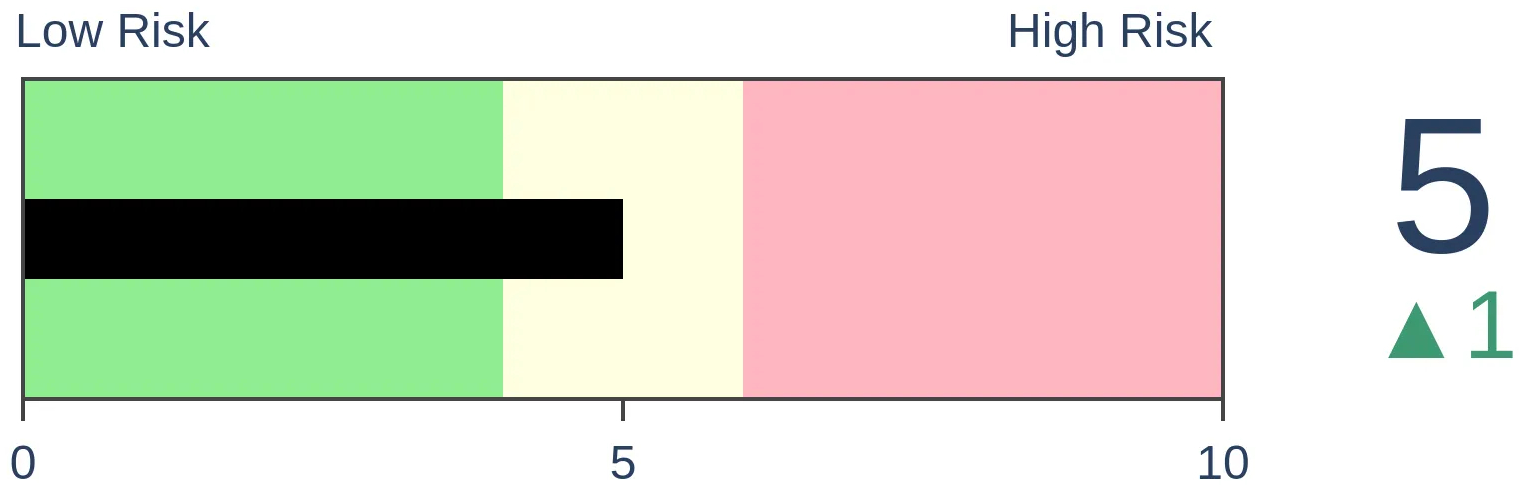
Stocks Medium-Term
|
|
Bonds
|
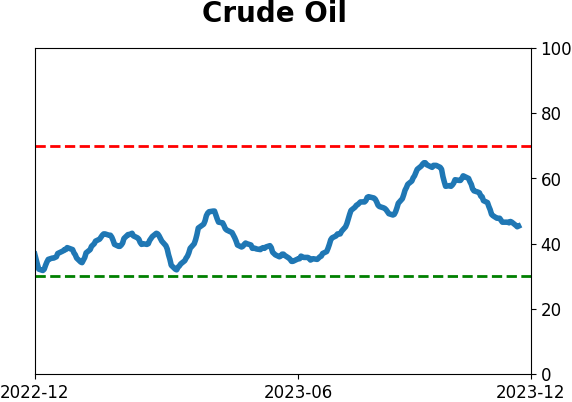
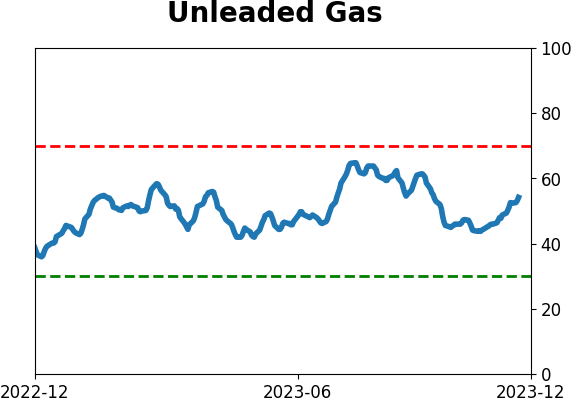
Crude Oil

|
|
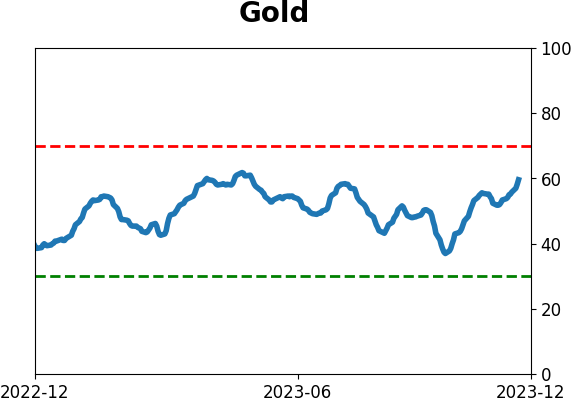
Gold
|
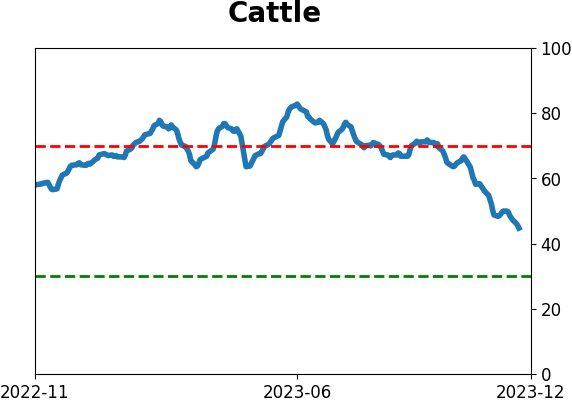
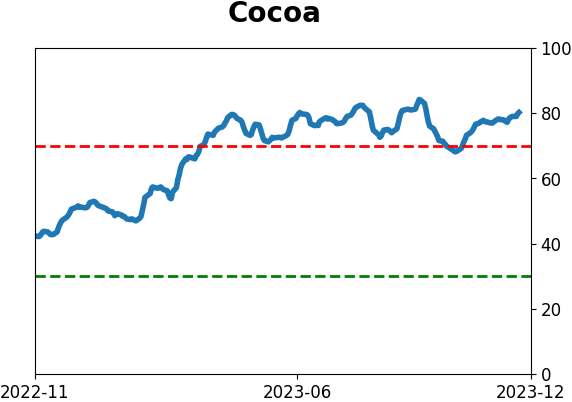
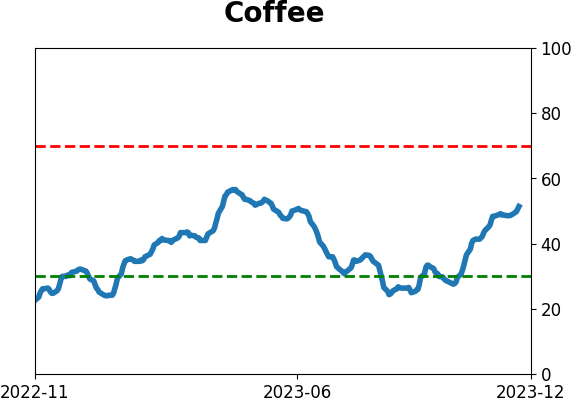
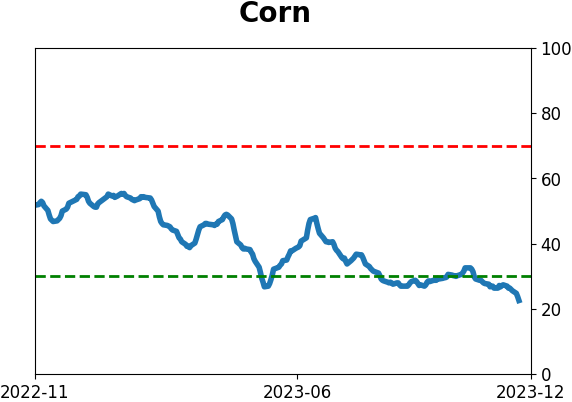
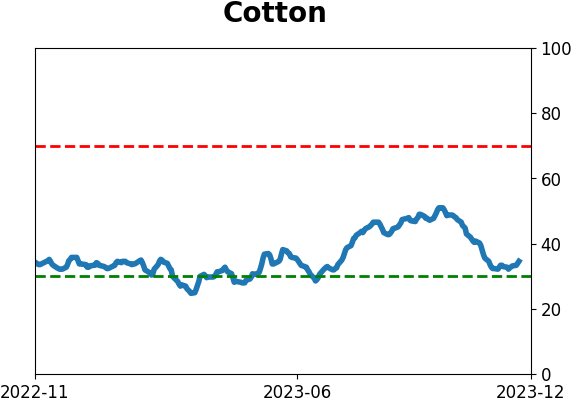
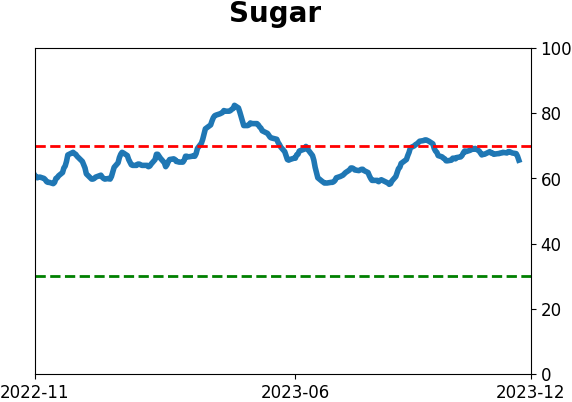
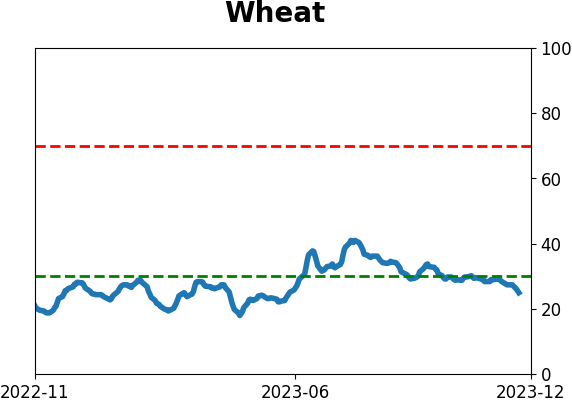
Agriculture

|
|
Research
By Jason Goepfert
BOTTOM LINE
With a couple of days left in the month, Growth stocks have a massive lead over Value in year-to-date returns. By outpacing Value by more than +30%, Growth stocks have enjoyed a historic year. Other years with big Growth outperformance through November tended to precede more gains, especially for the Growth stocks.
FORECAST / TIMEFRAME
None
|
Key points:
- Growth stocks have outperformed Value by more than +30% year-to-date through November
- This is the 2nd-biggest spread between the two factors through November dating back to 1928
- Big years for Growth over Value tended to be a good (not great) sign for the broader market
This has been a historic year for Growth over Value
It what must be one of the all-time shockers for doomers, the rapid rise in interest rates didn't kneecap Growth stocks in 2023. This year has been anything but difficult for the group. As noted by The Wall Street Journal:
The Russell 3000 Value Index has returned just 2.1% this year through Monday, lagging behind the Russell 3000 Growth Index by 31 percentage points. That is the second-biggest underperformance on record dating back to 2000, according to Dow Jones Market Data.
Indeed, that has been the case, as both factors followed the same general price path during the year, but Growth's trajectory was supercharged by a handful of outstanding stocks that drove the group higher.
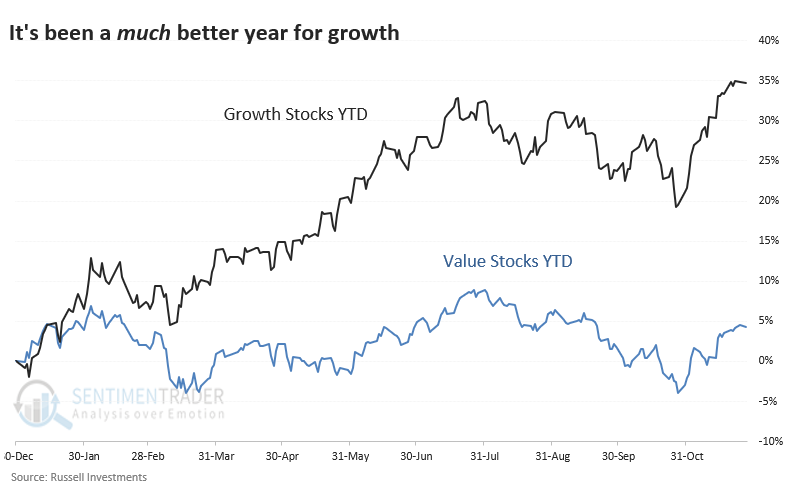
This isn't just the 2nd-biggest underperformance since 2000; it is the 2nd-biggest since...ever. The explosive rally in the latter half of 2020 was the only other time Growth outpaced Value by more than +30% through November.
Big years for Growth tended to keep going
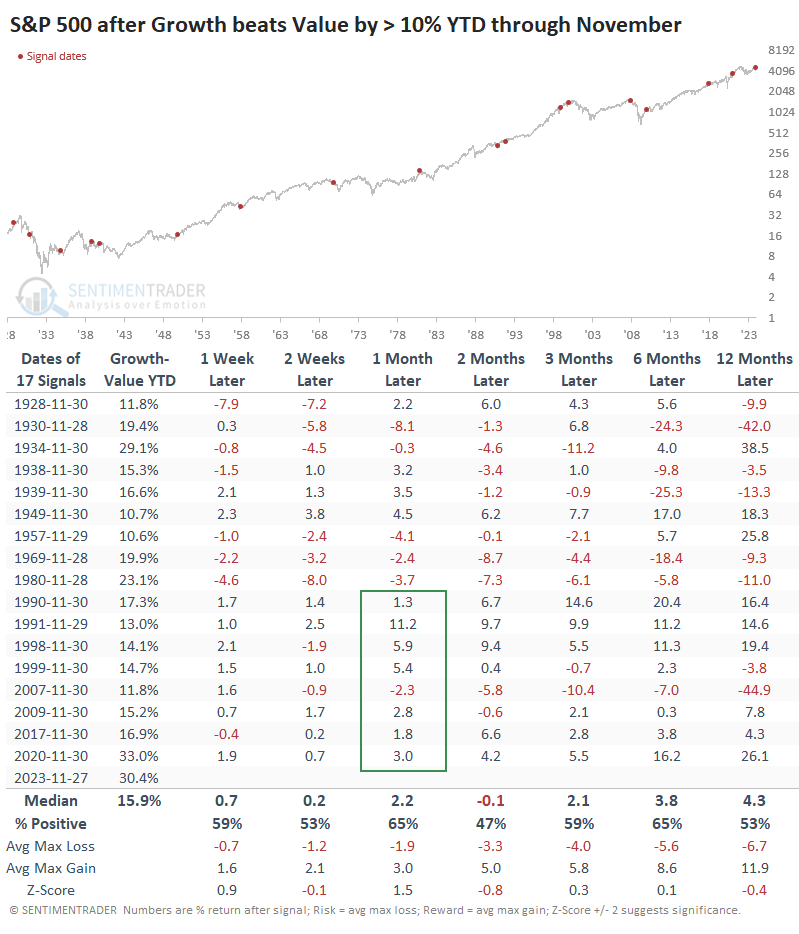
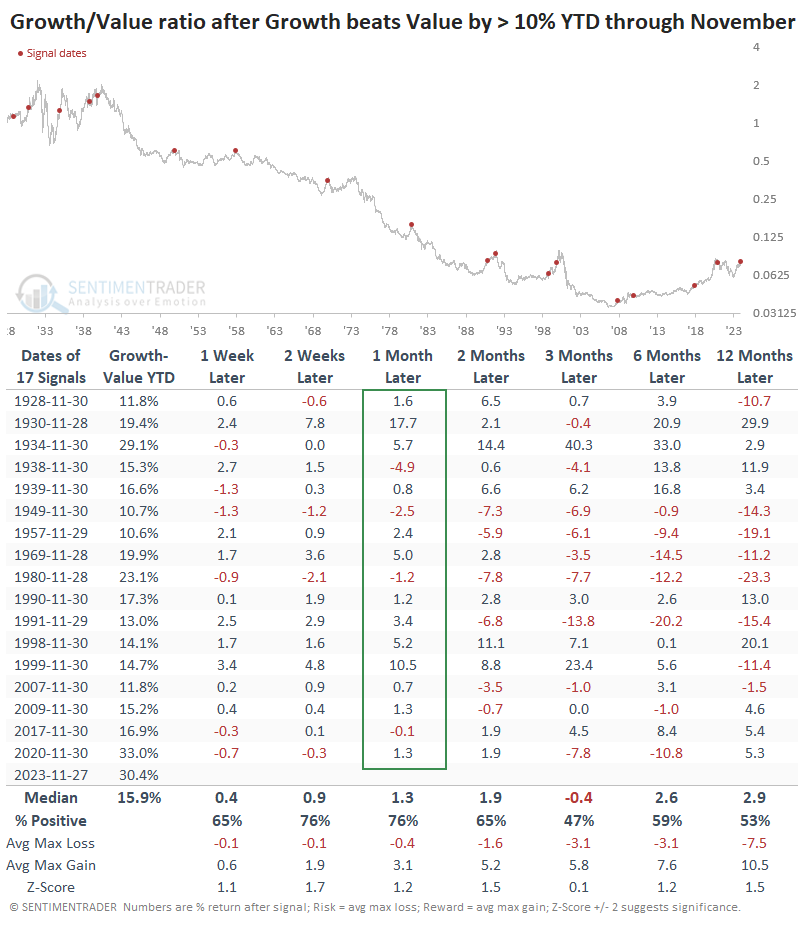
We're less concerned with market trivia and more concerned about what this might mean going forward. The table below shows returns in the S&P 500 in the weeks and months following similar investor behavior.
Somewhat surprisingly, it wasn't much of a sign either way. It gained most of the time across most time frames, but two months later (roughly through January), it was down more than up and sported a negative median return. Most of the negative returns occurred prior to 1980, however, and recent decades were much more positive for the S&P, with the notable exception of 2008.
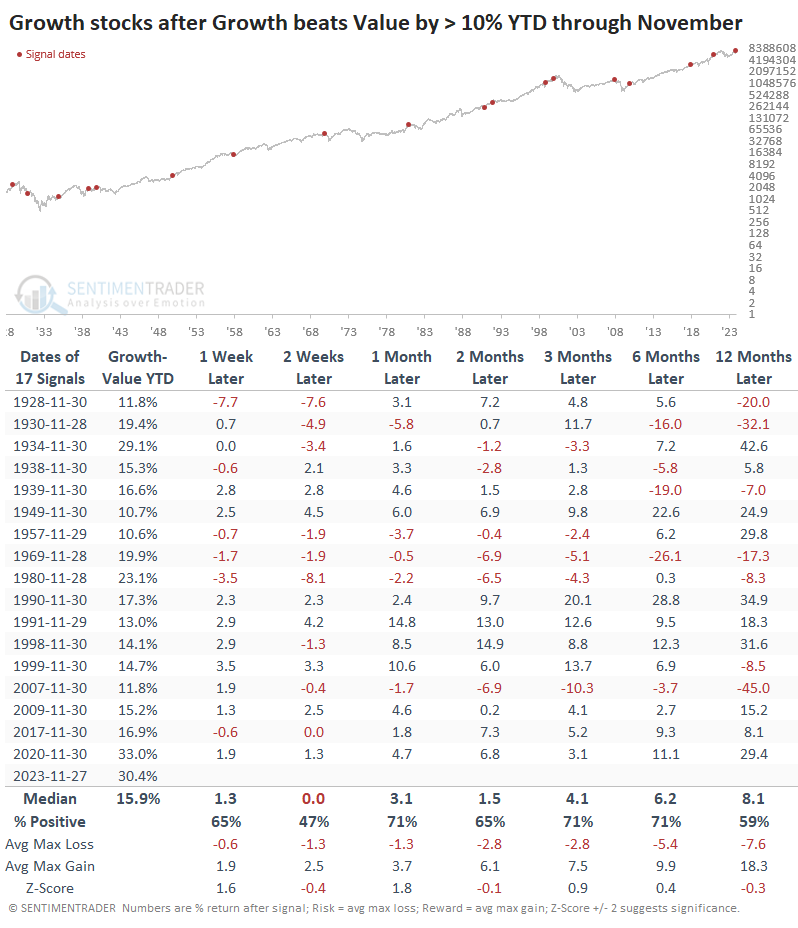
Growth stocks tended to fare better than the S&P 500 after the first couple of weeks, rising more than 70% of the time three and six months later.
Value stocks fared even worse through the first couple weeks of December, then rebounded most of the time, though returns were generally weaker than for Growth stocks.
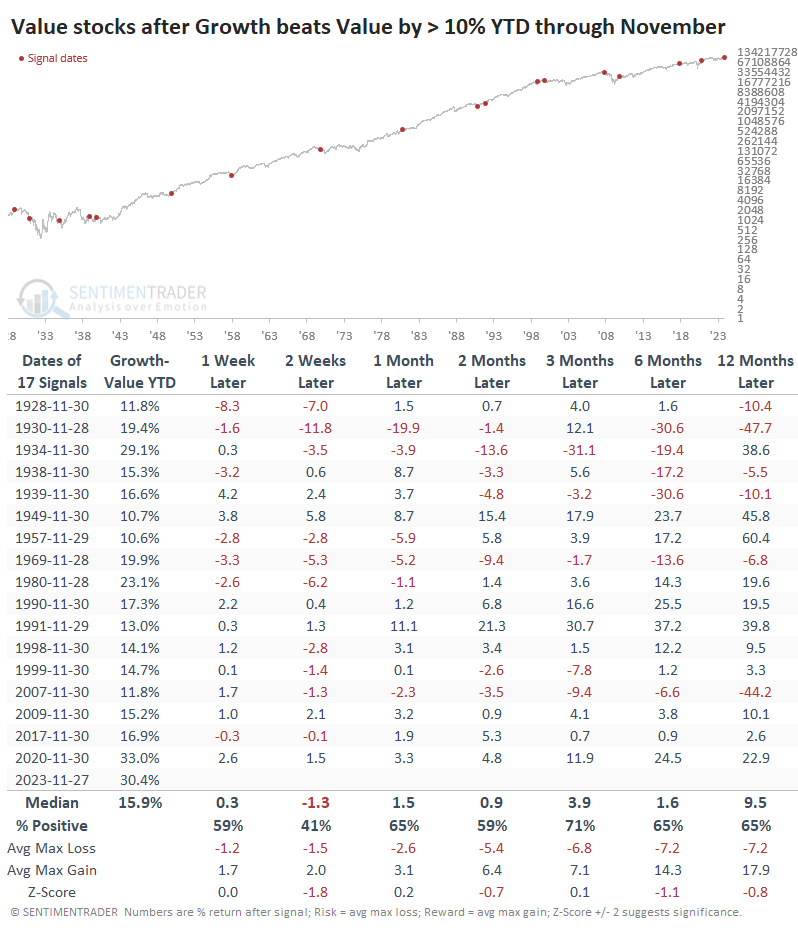
The ratio of Growth to Value shows that over the next month (roughly through year-end), Growth tended to continue to outpace Value. It underperformed by more than -2% only twice. After that, it was more of a mixed bag, particularly three months later when Value actually showed a slight edge.
What the research tells us...
When we see investors prefer particular sectors or factors, there are always prognostications about what that means for the market. Instead of guessing, we prefer to look at similar behavior across as long of a history as we can garner and see if any consistent patterns emerge since investor behavior is relatively consistent.
In this case, the remarkable preference for Growth over Value didn't have much predictive meaning for future returns, though we'd give a slight edge to bulls across most time frames. There is little evidence that Value should mean-revert relative to Growth simply due to their stark differences through November.
Indicators at Extremes
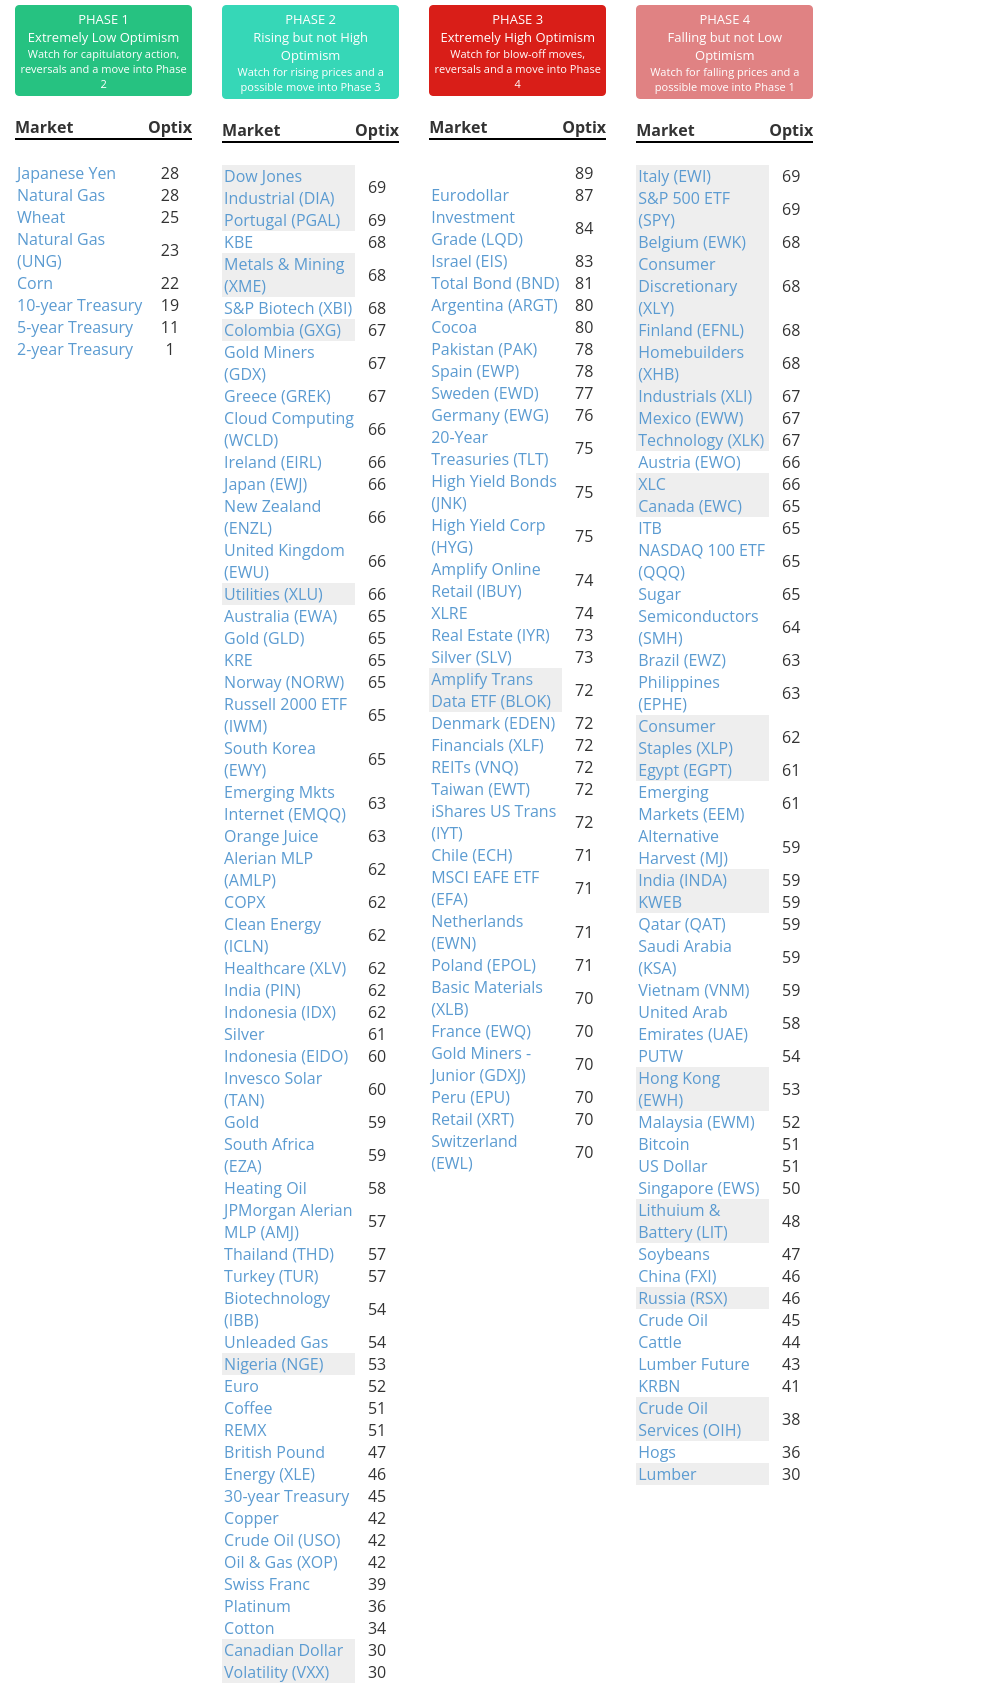
Phase Table
Ranks
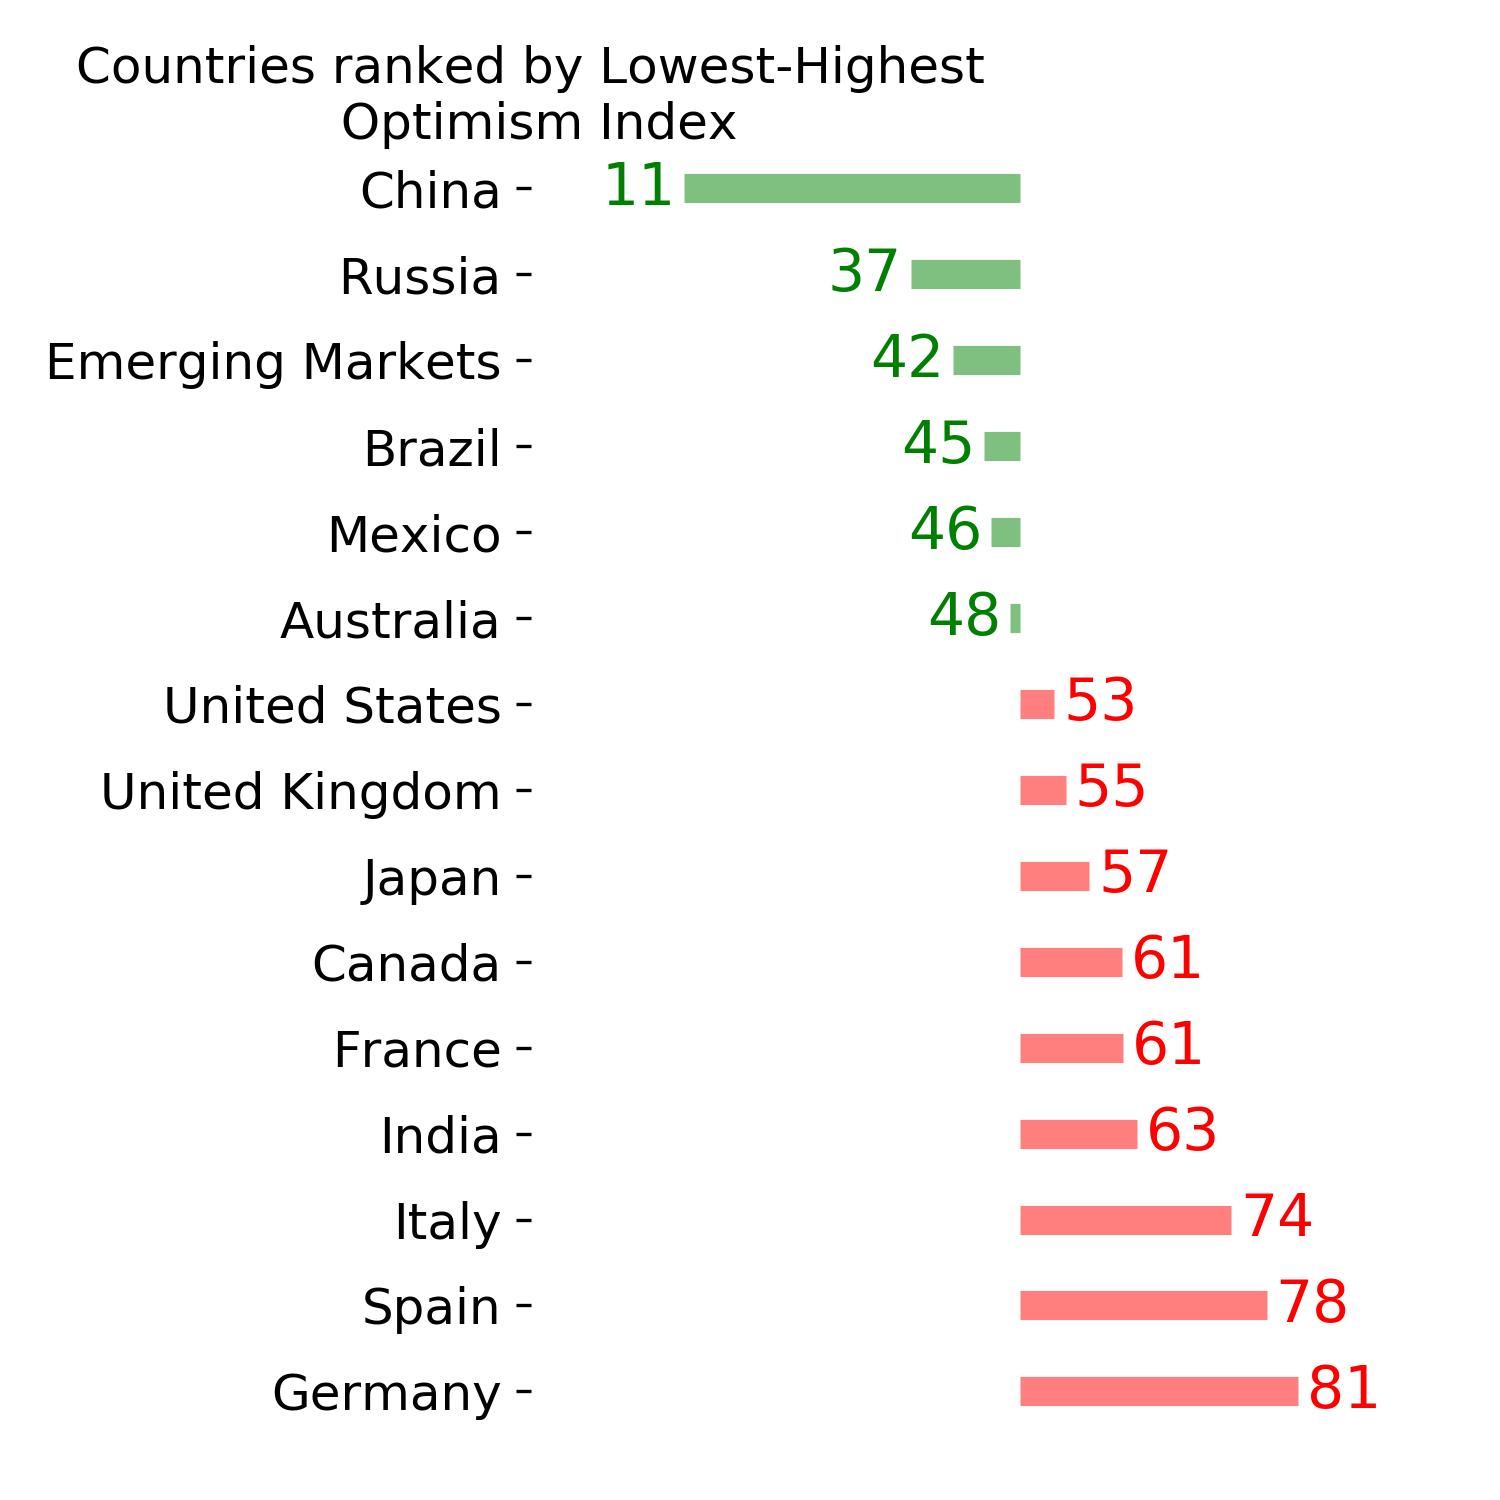
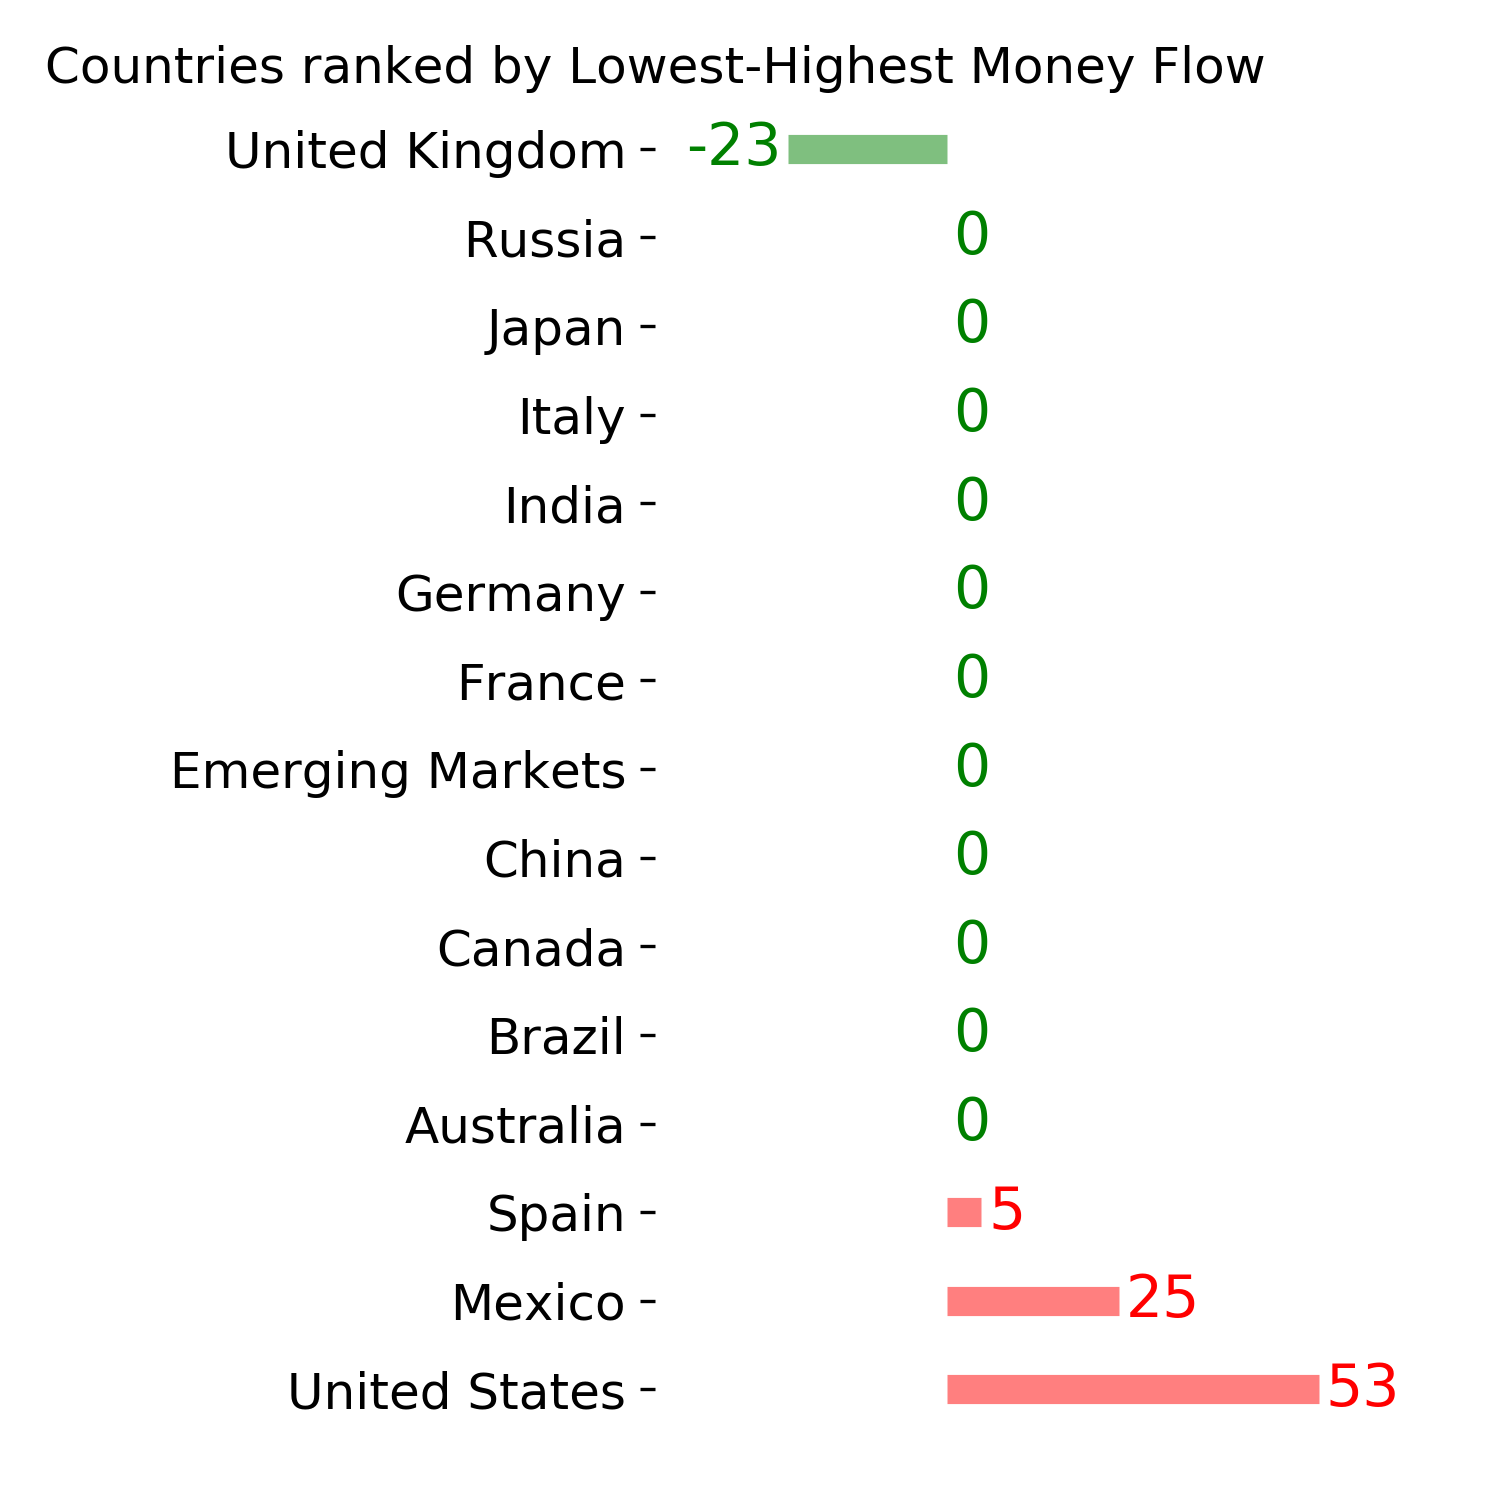
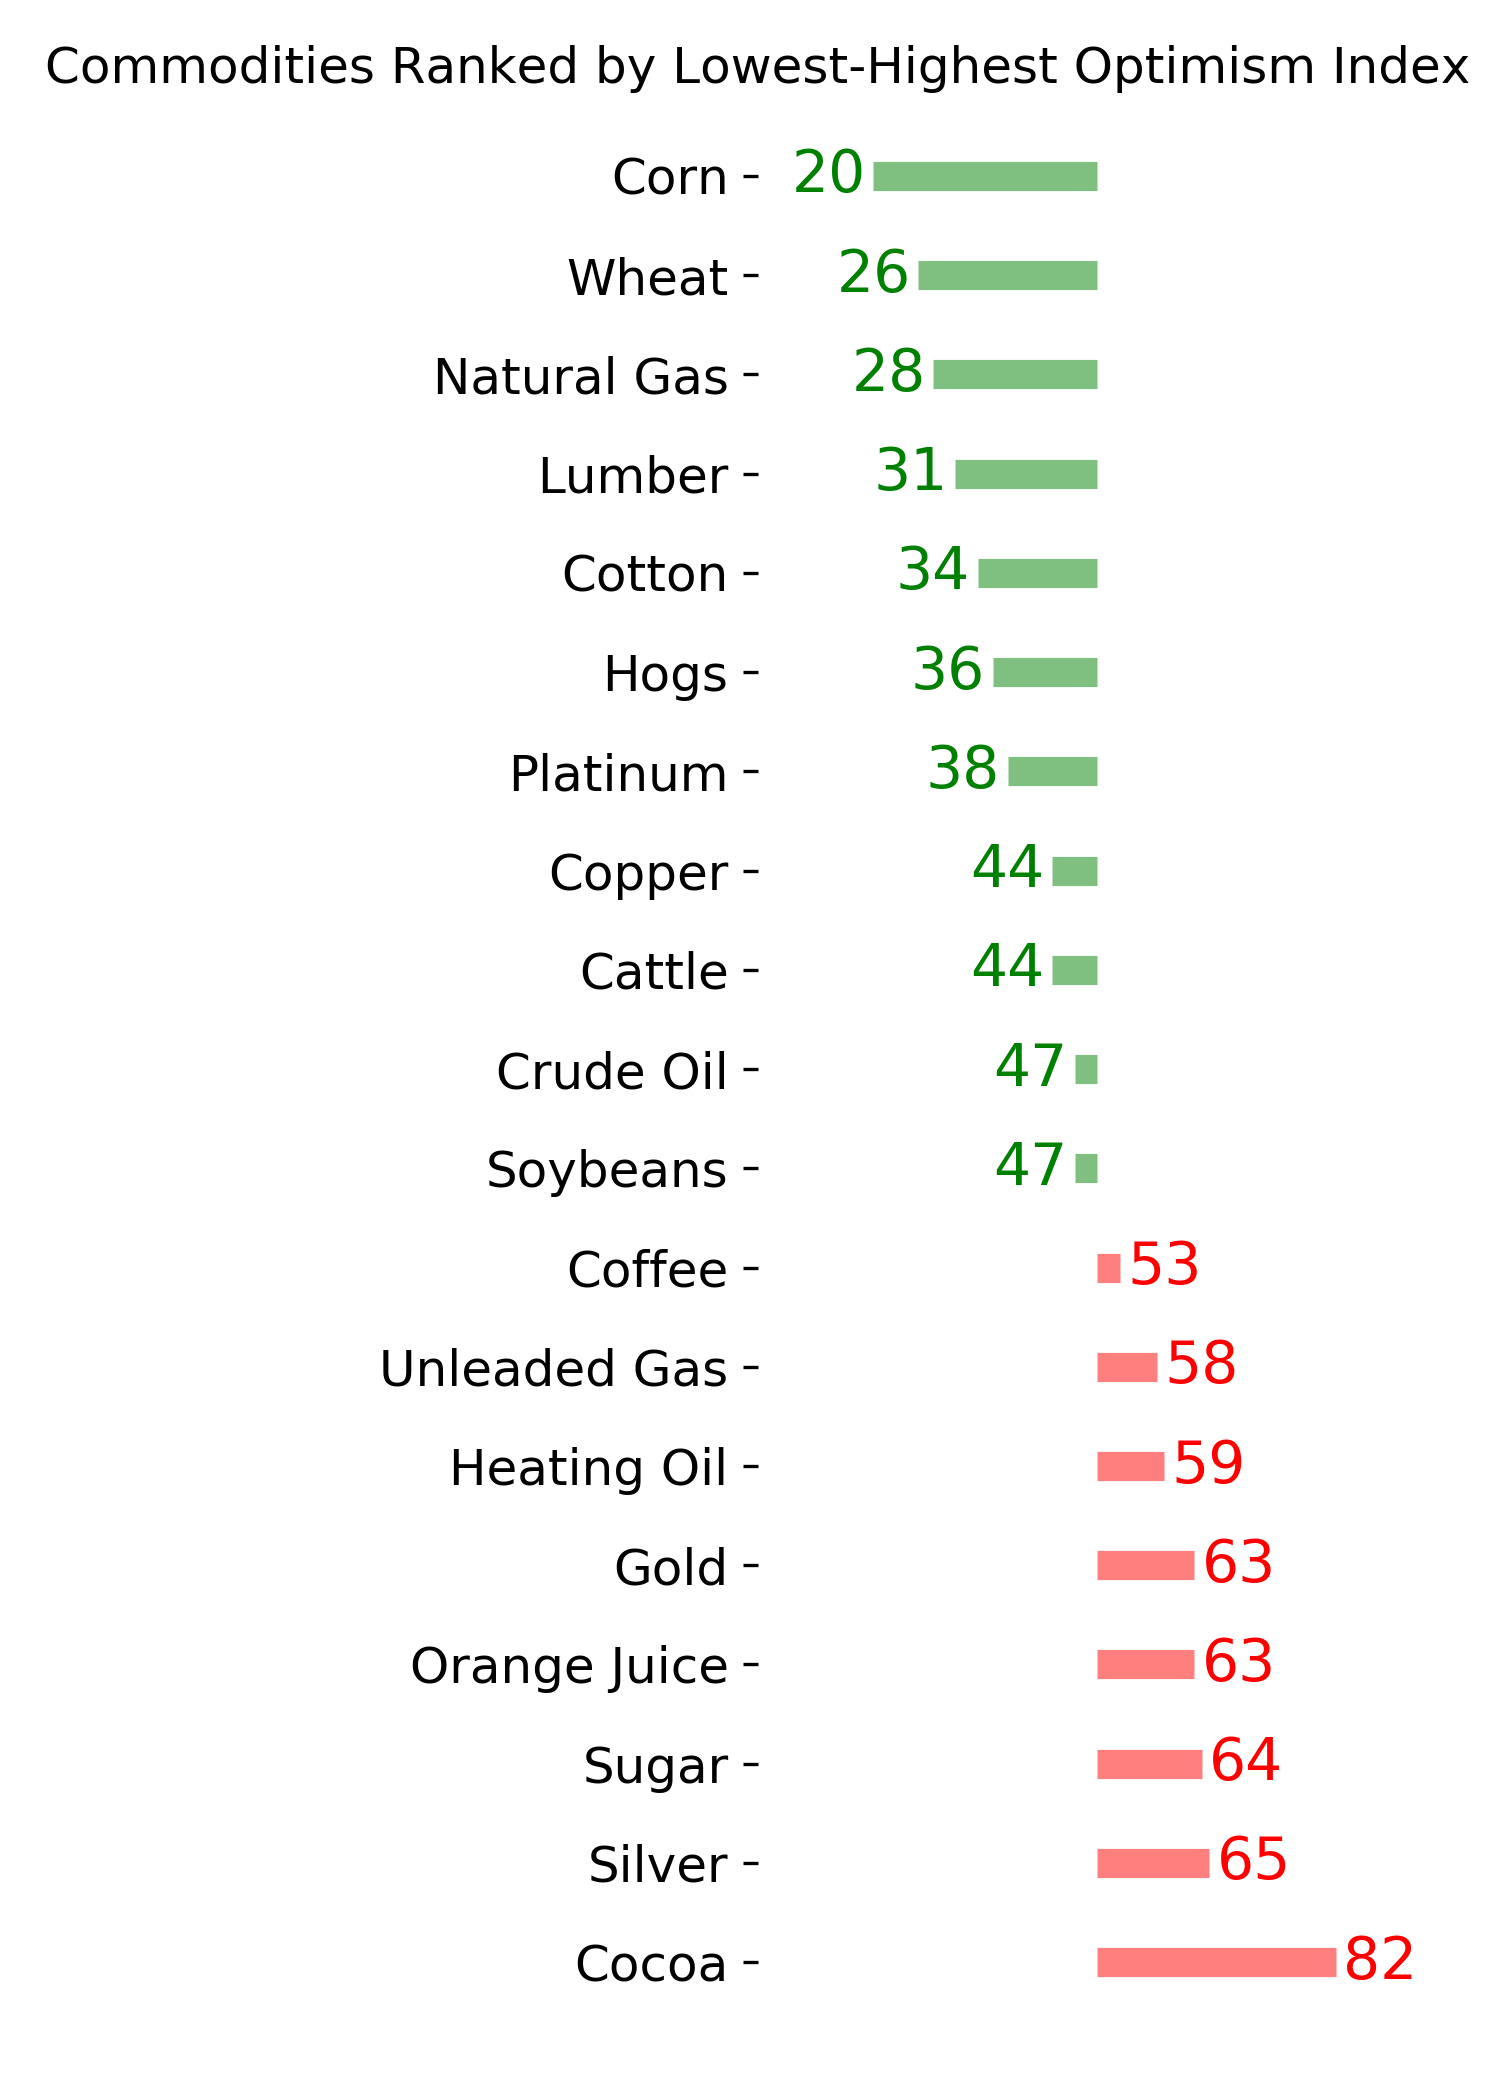
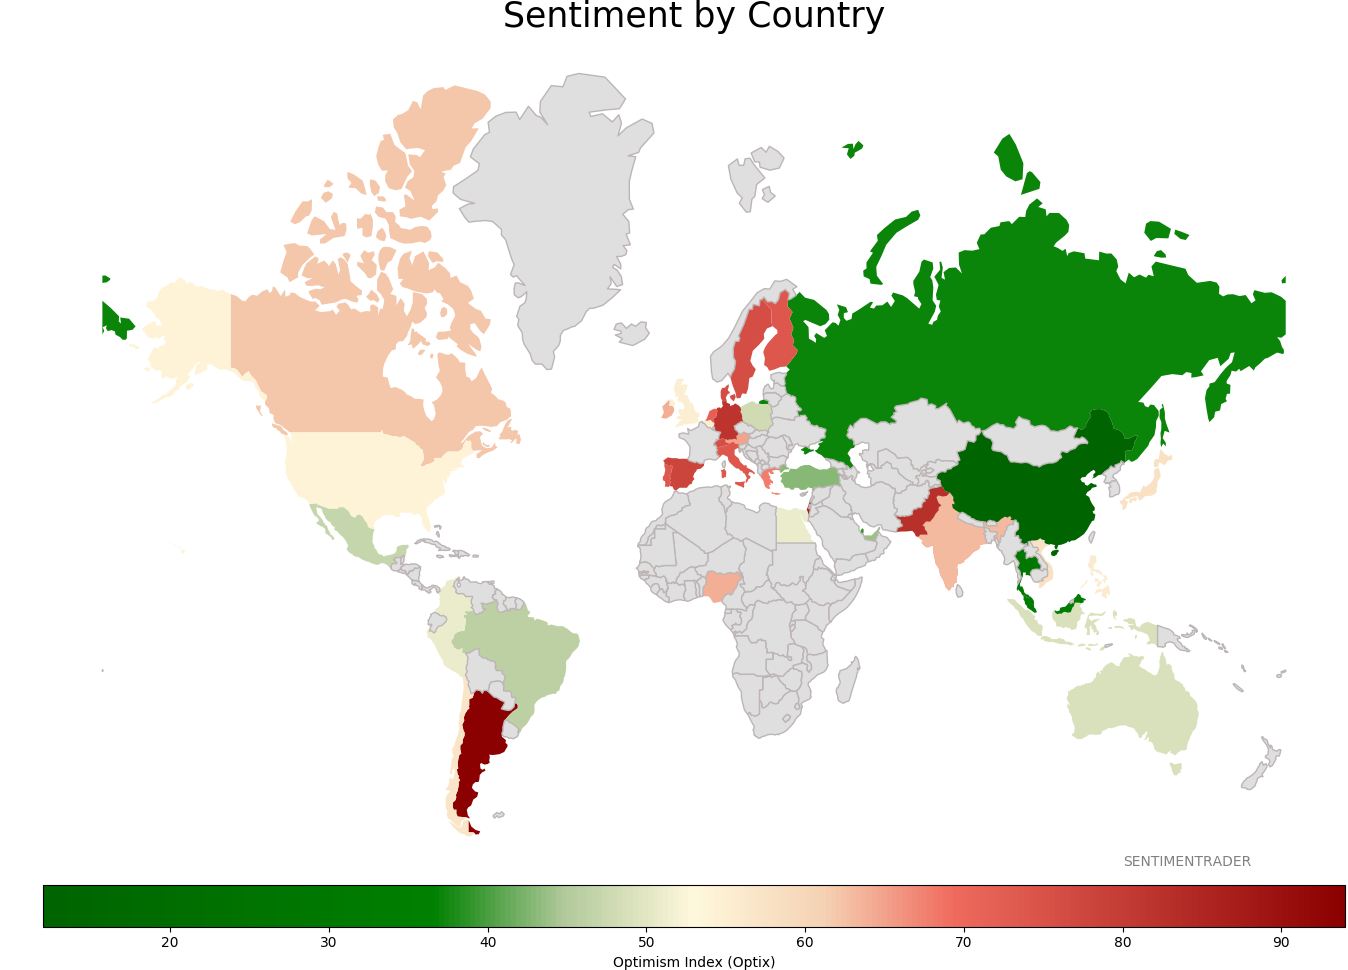
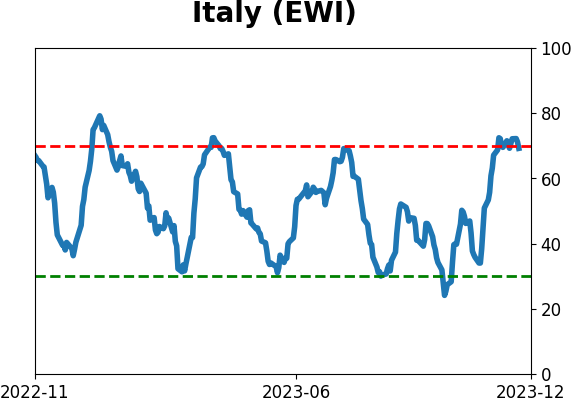
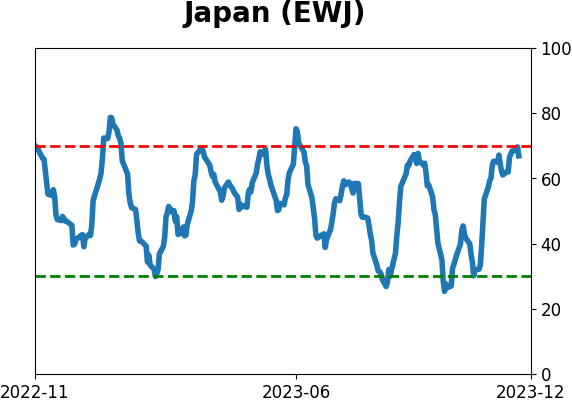
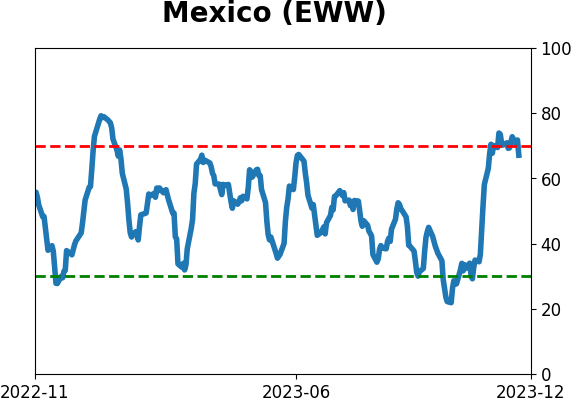
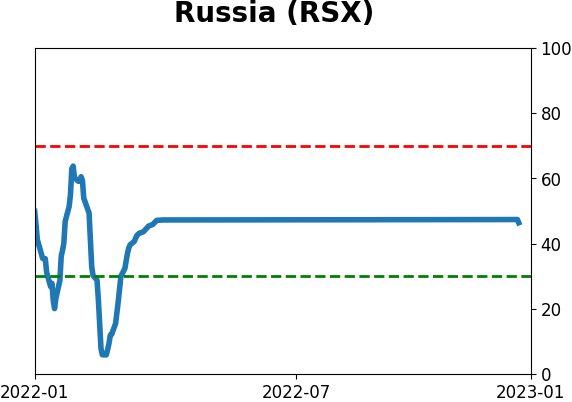
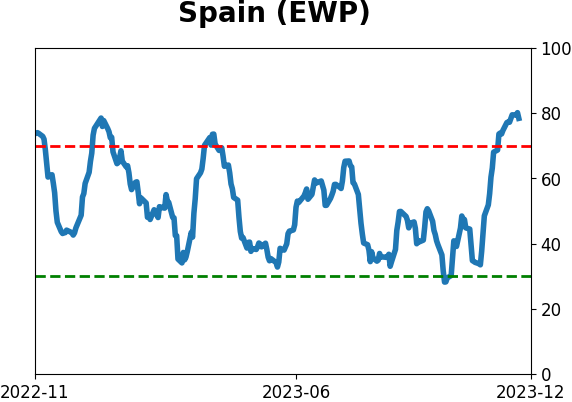
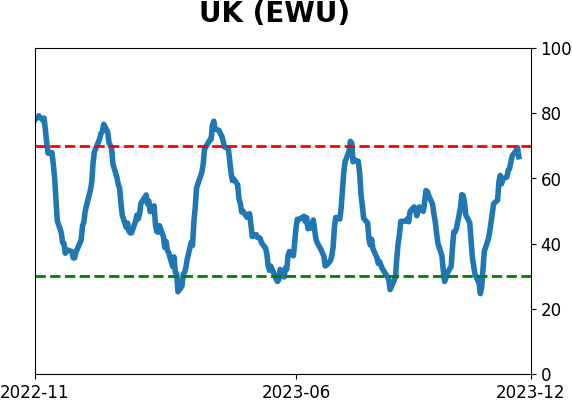
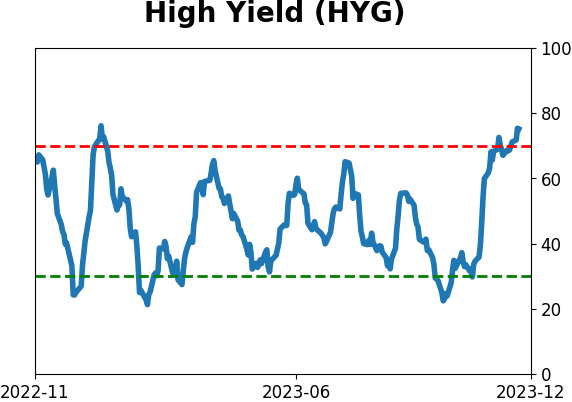
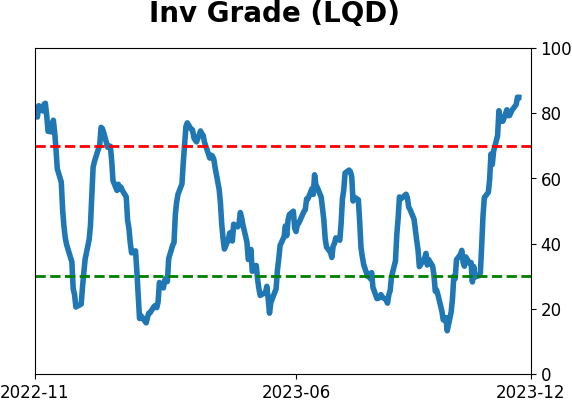
Sentiment Around The World
Optimism Index Thumbnails
|
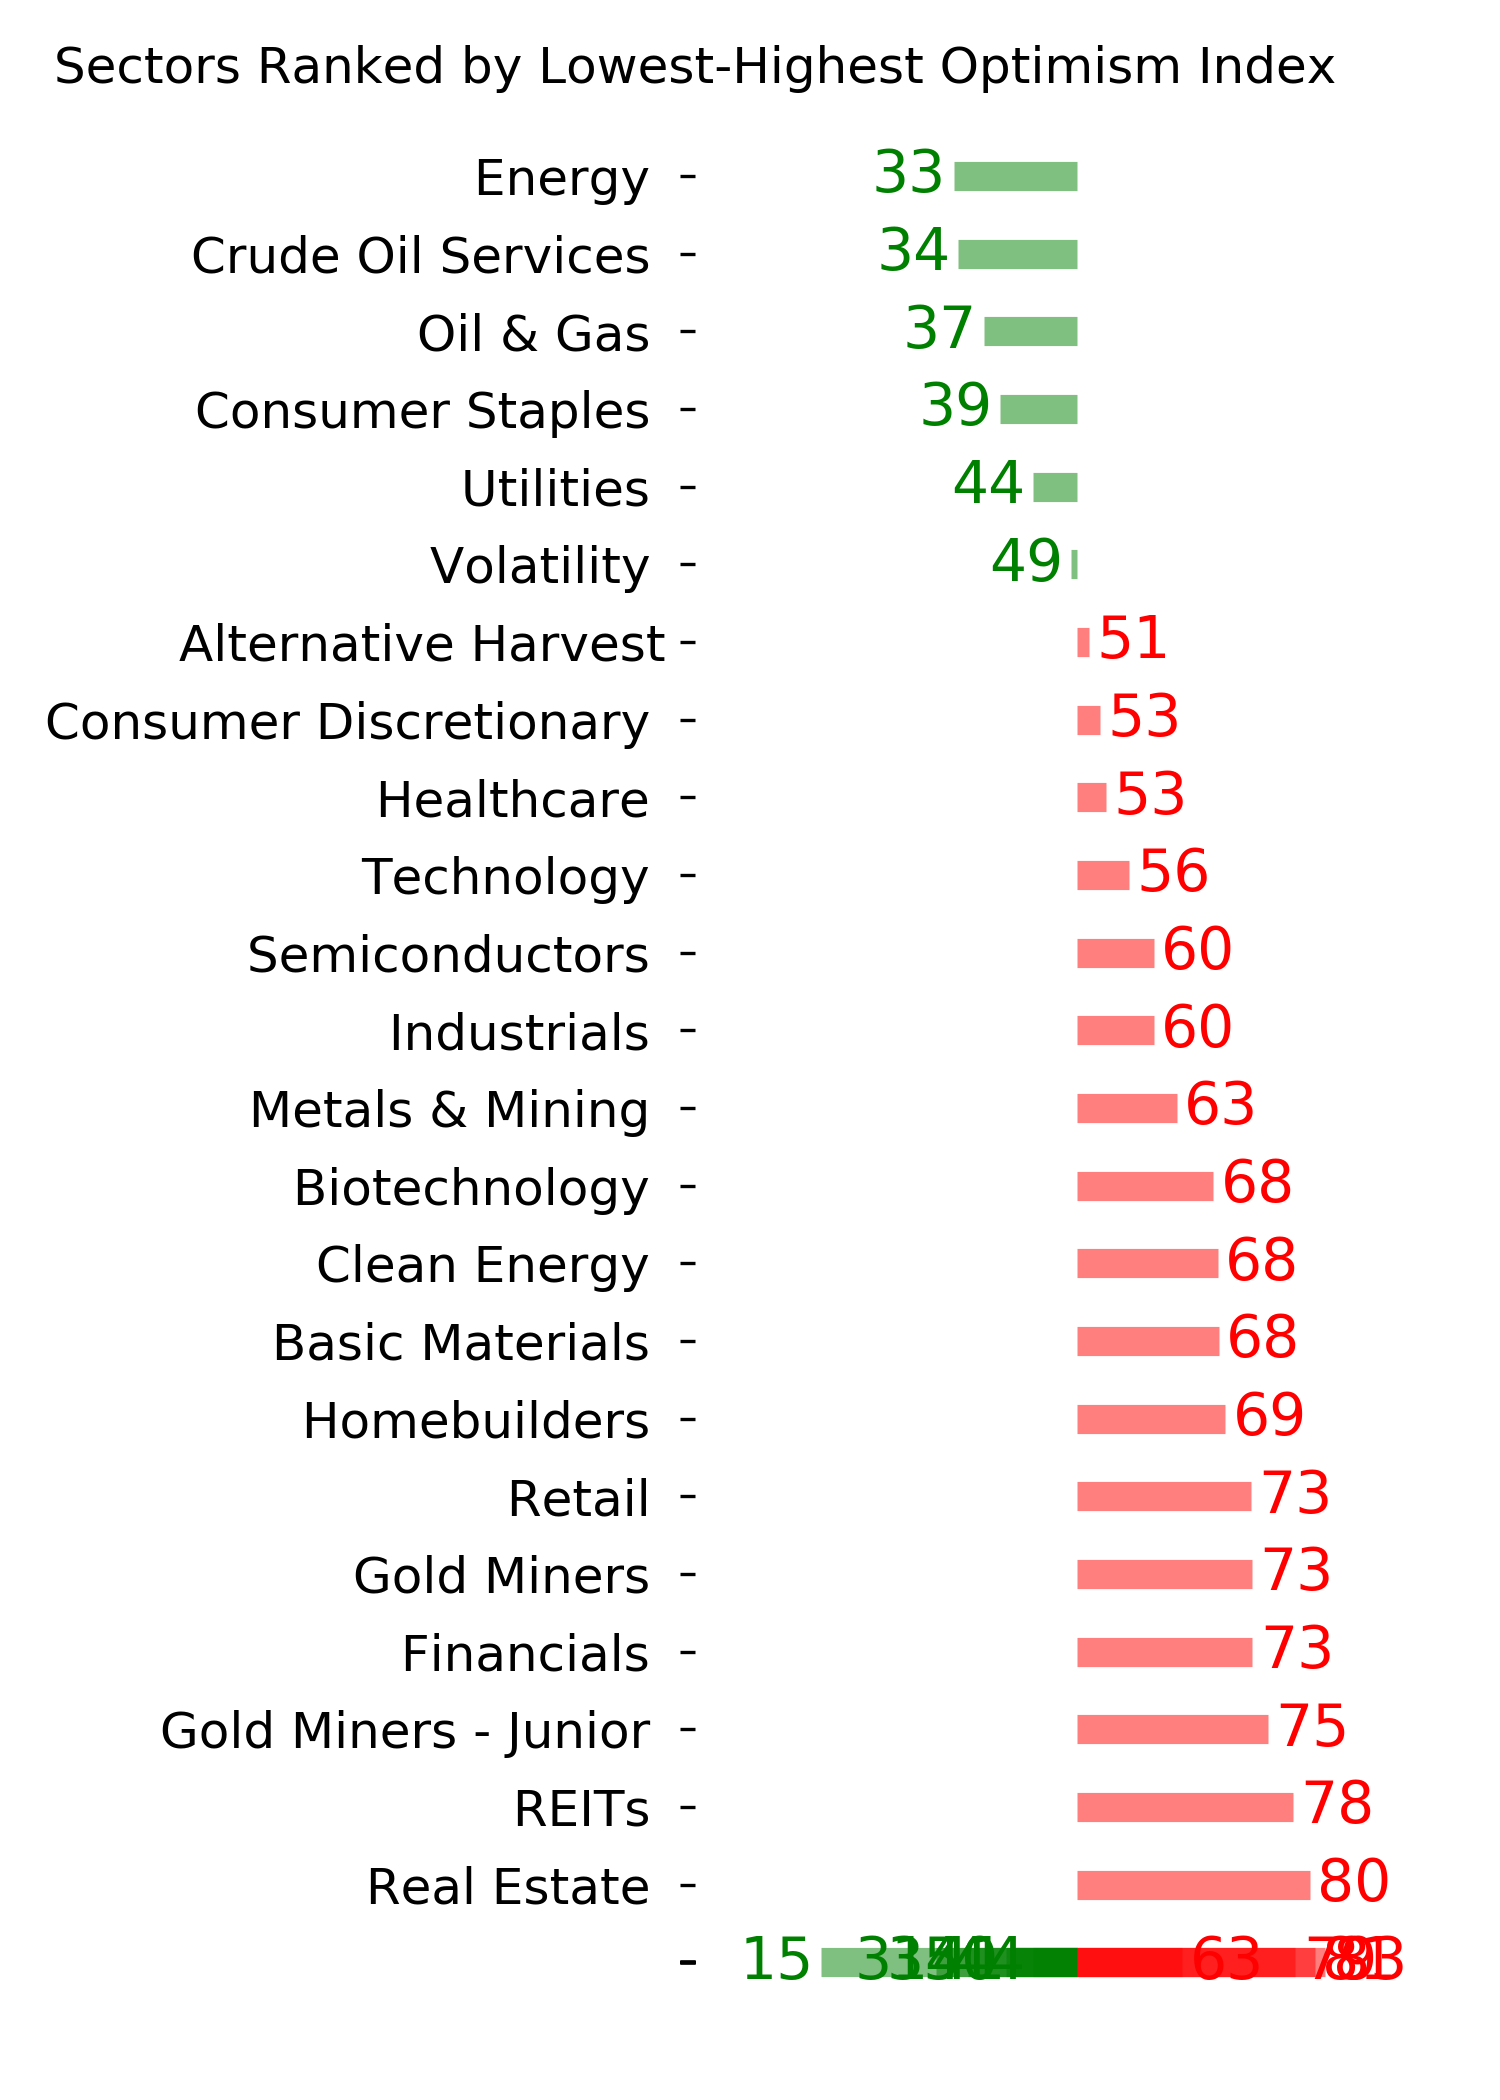
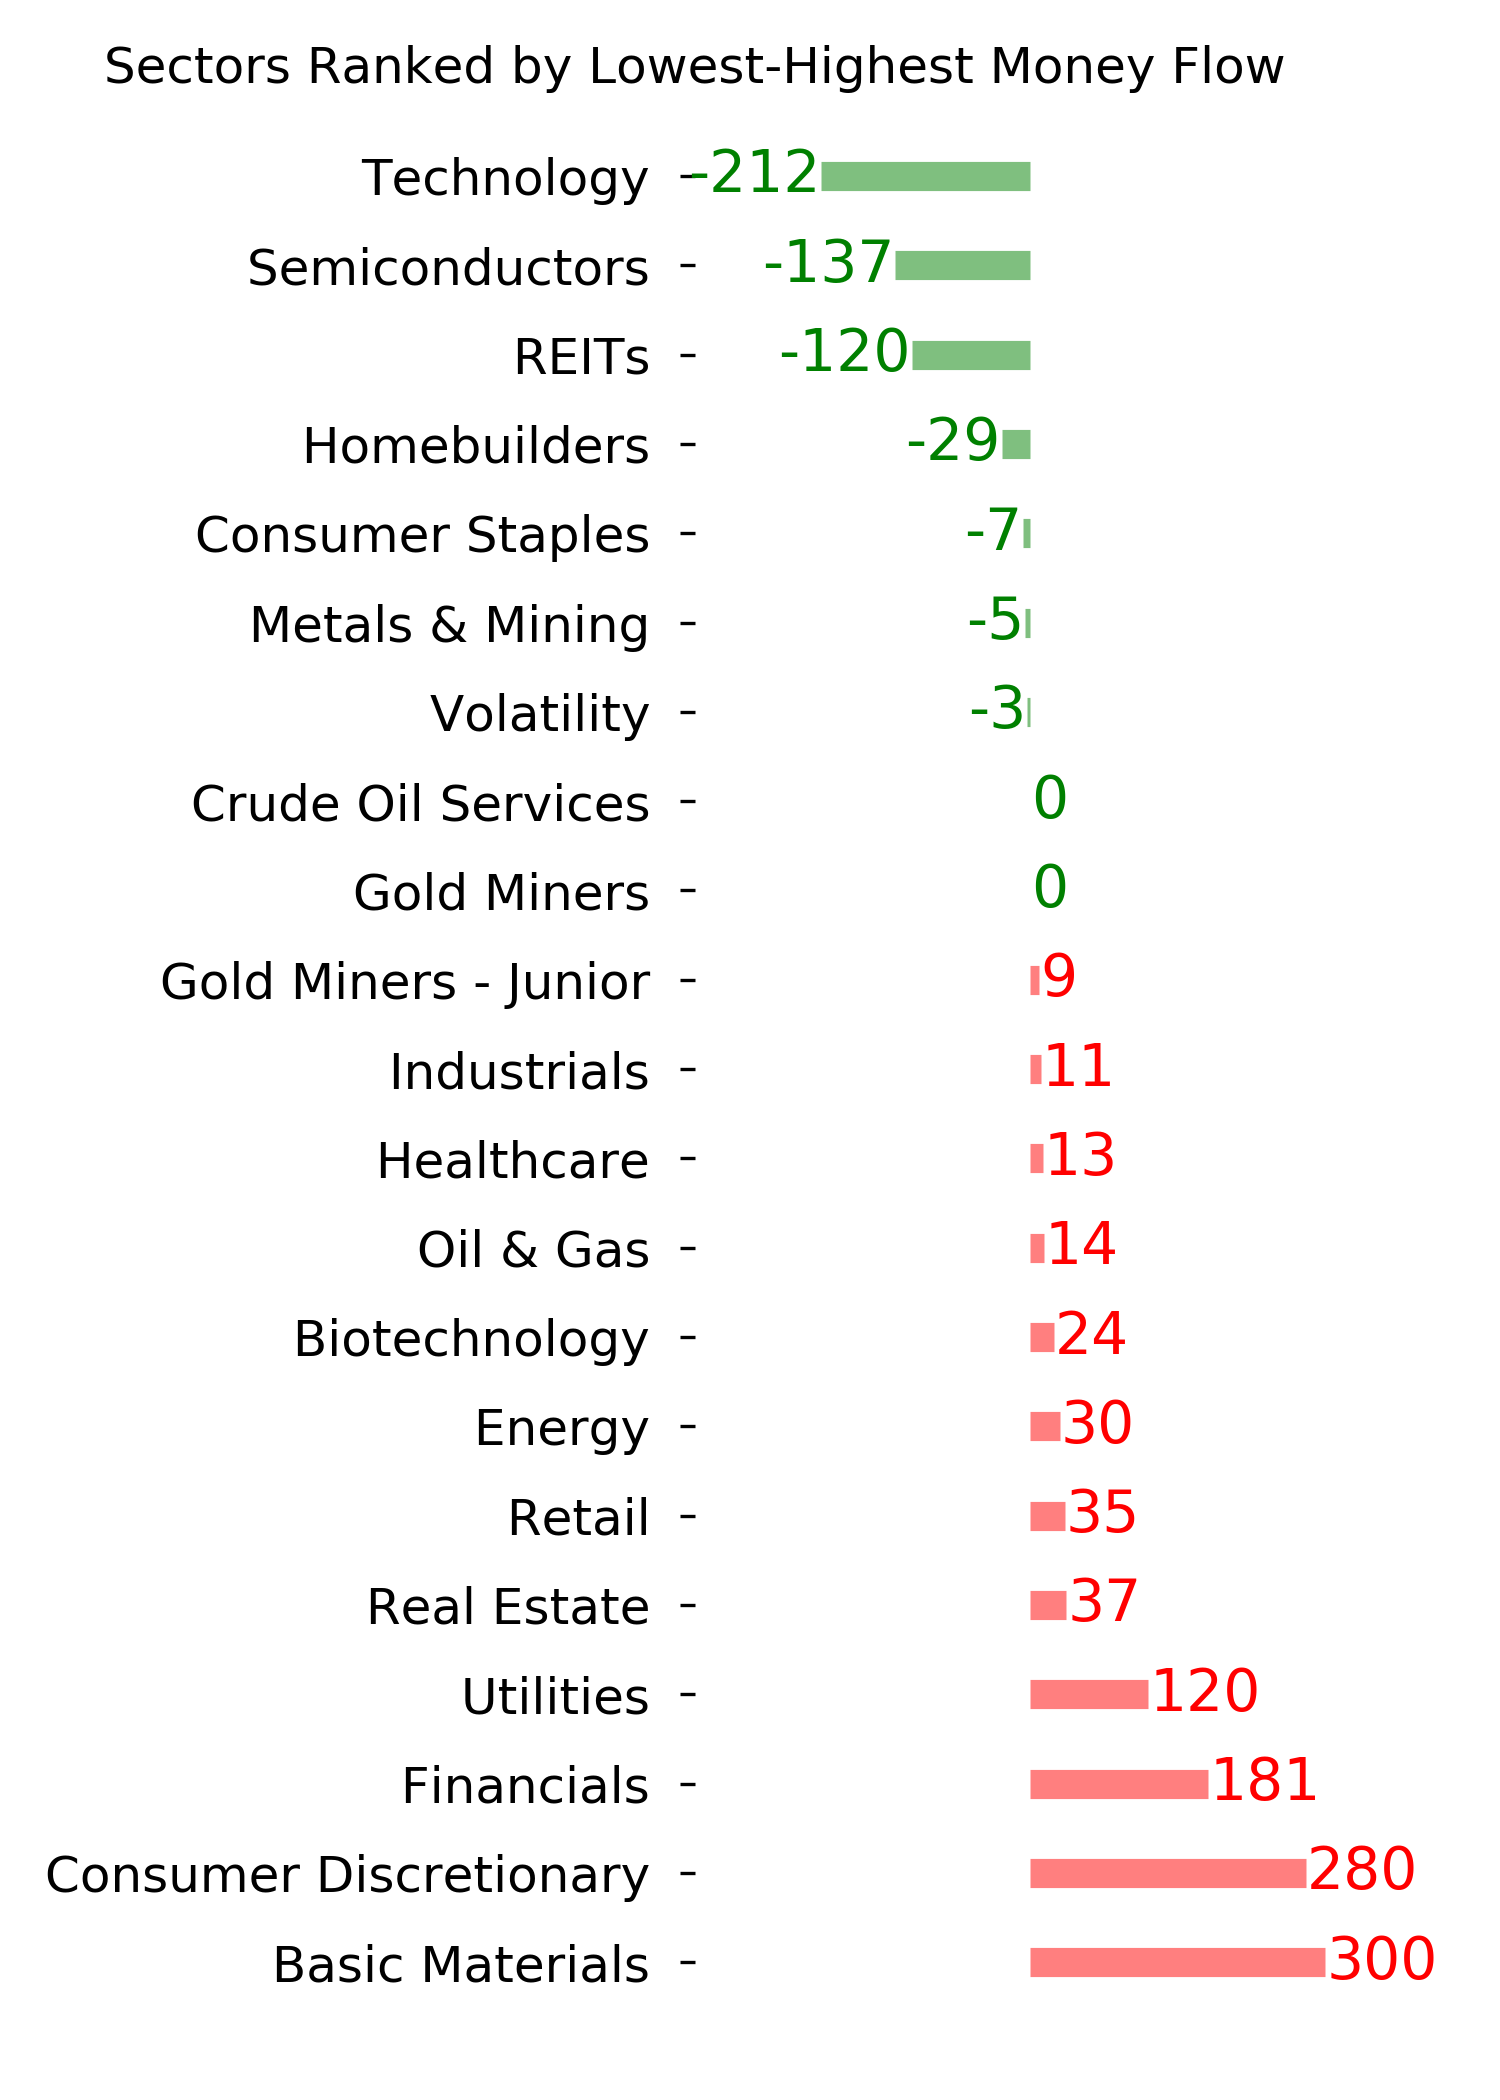
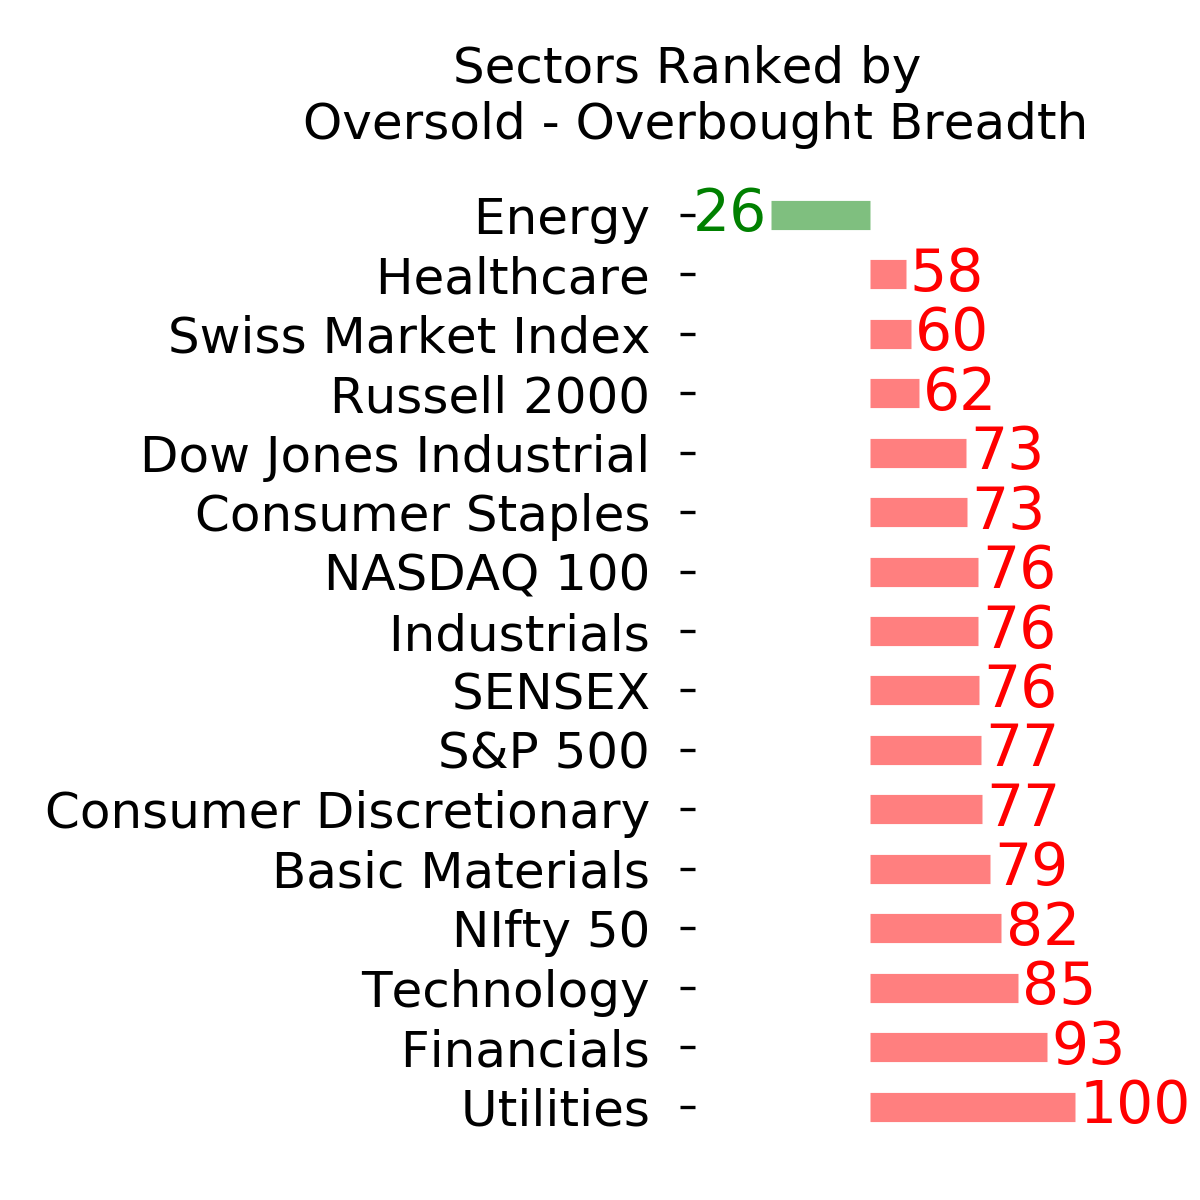
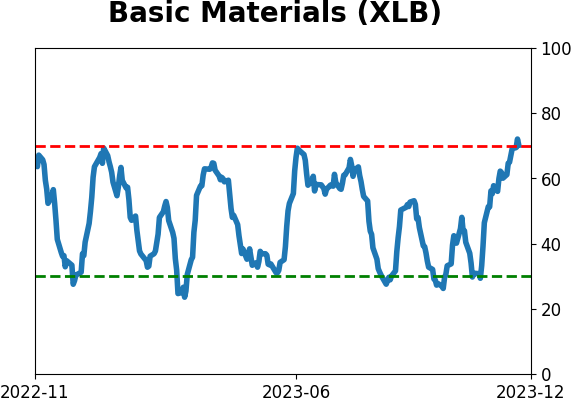
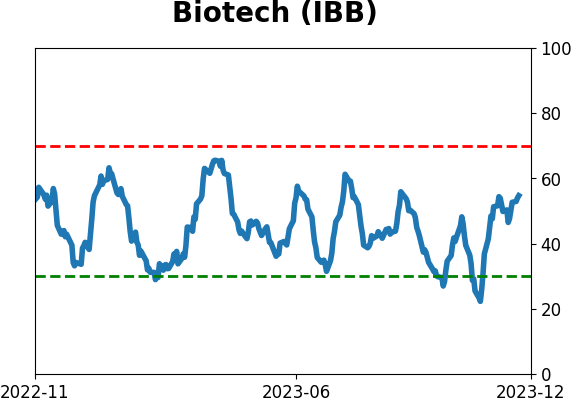
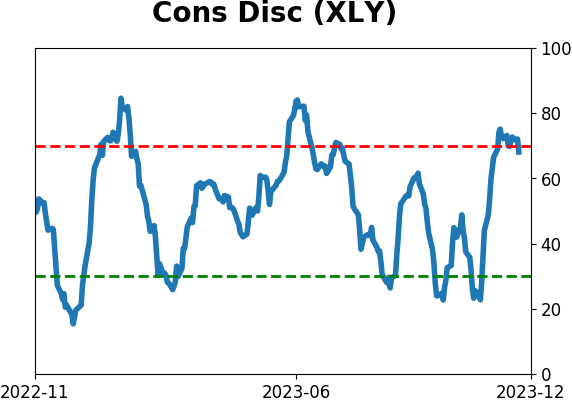
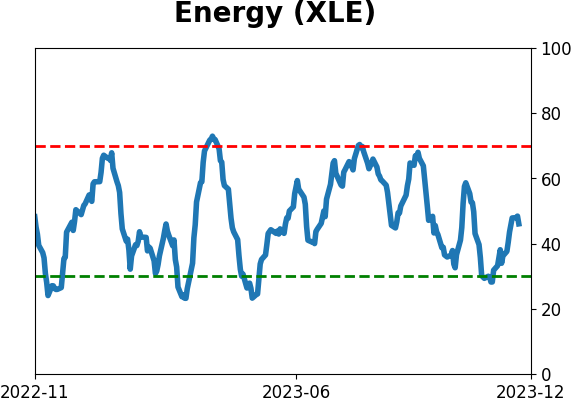
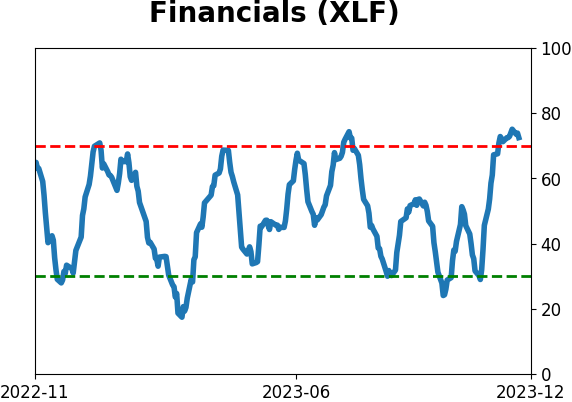
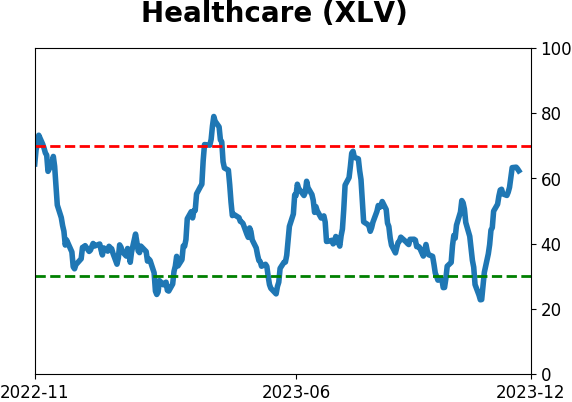
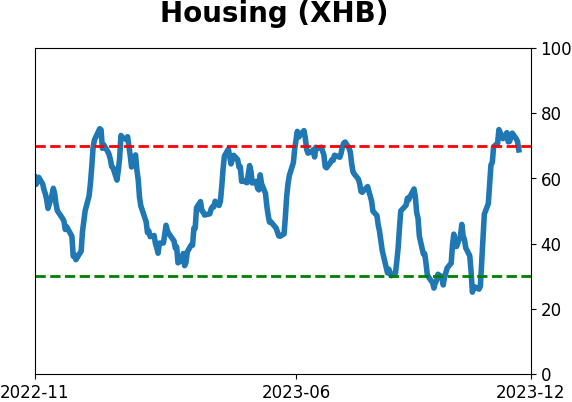
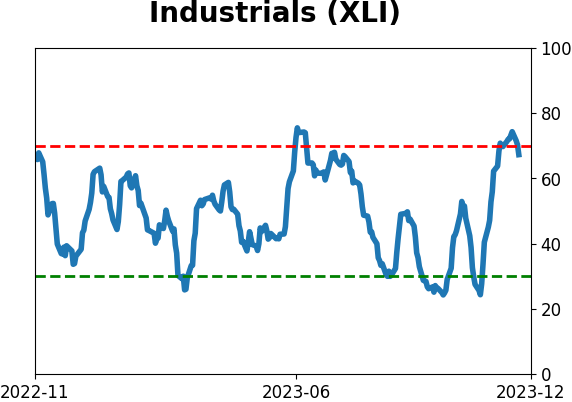
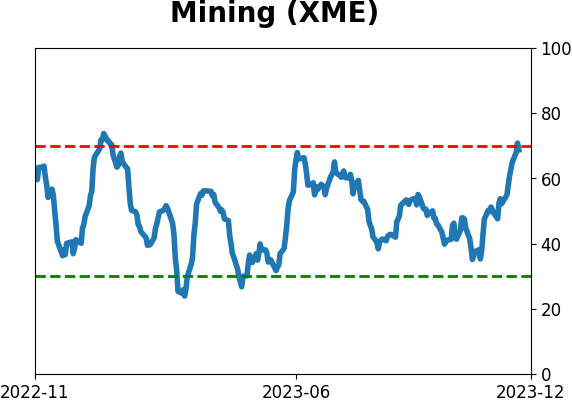
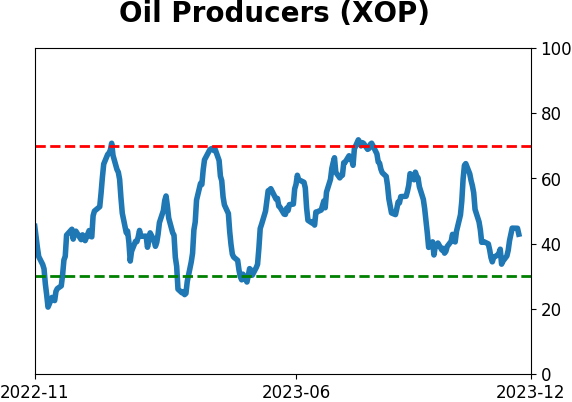
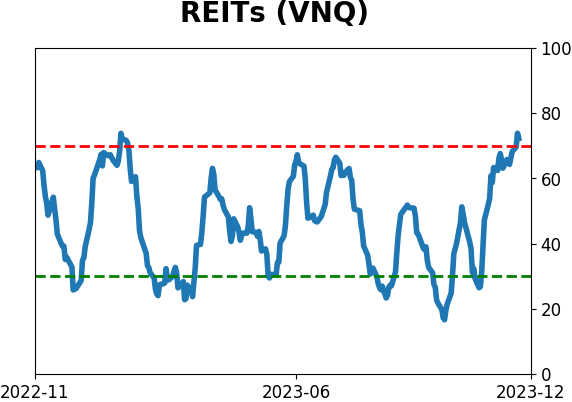
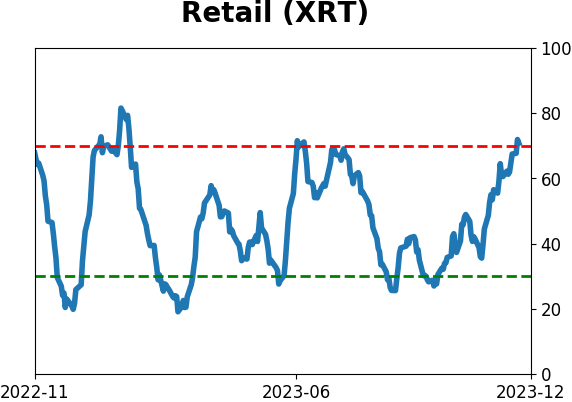
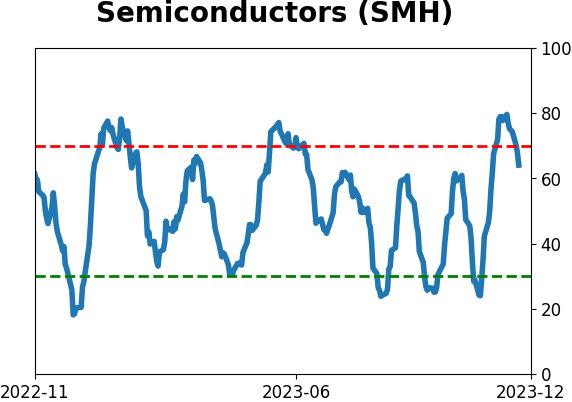
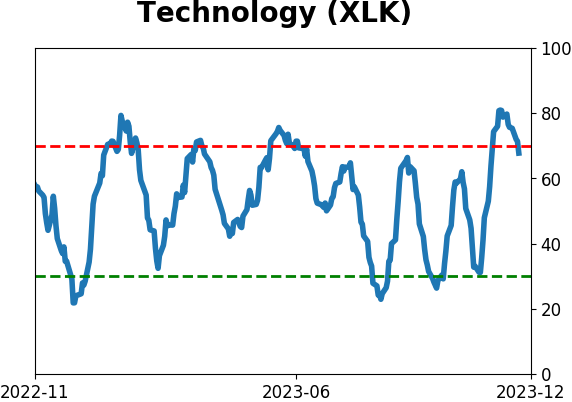
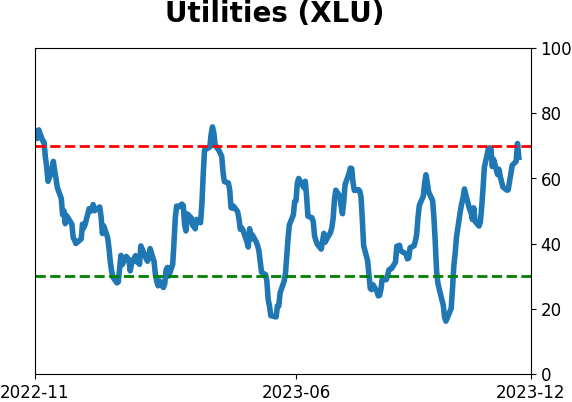
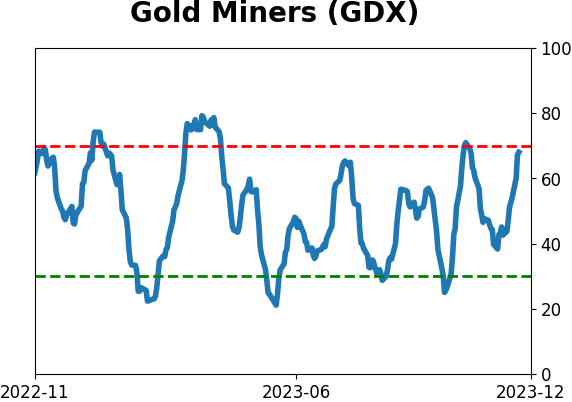
Sector ETF's - 10-Day Moving Average
|
|
|
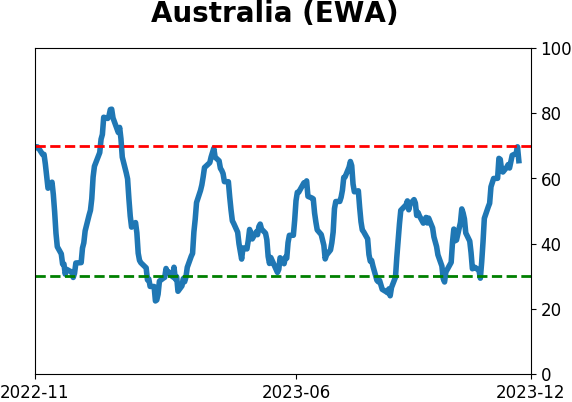
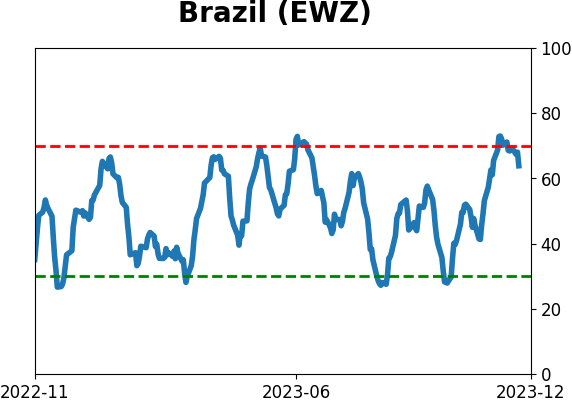
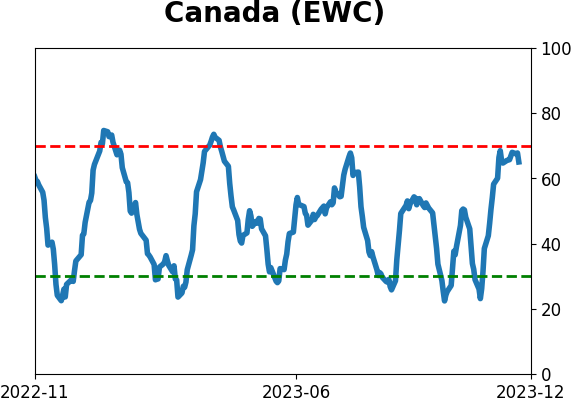
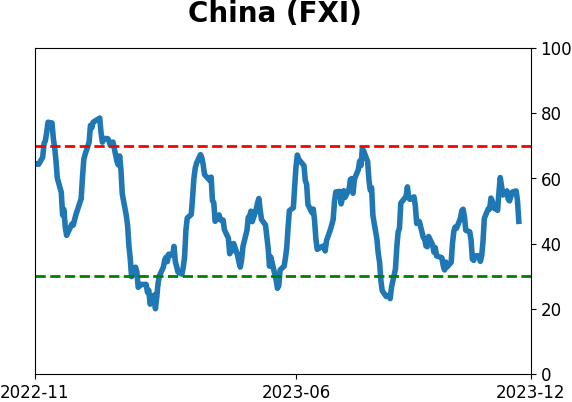
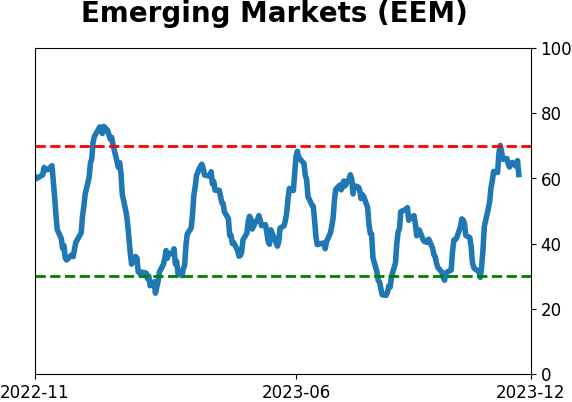
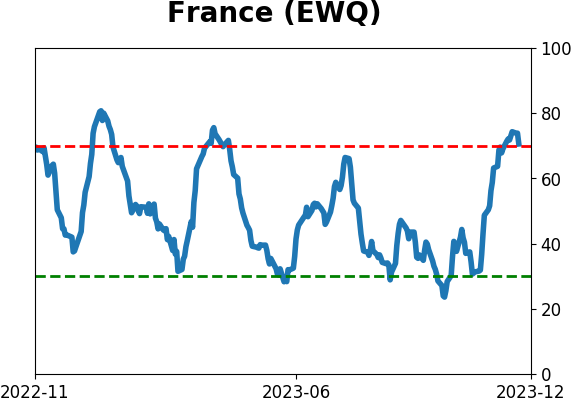
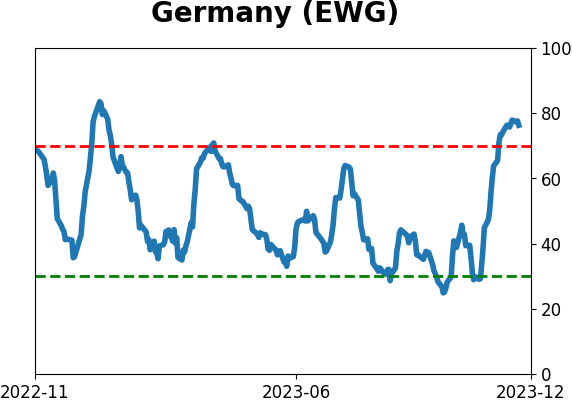
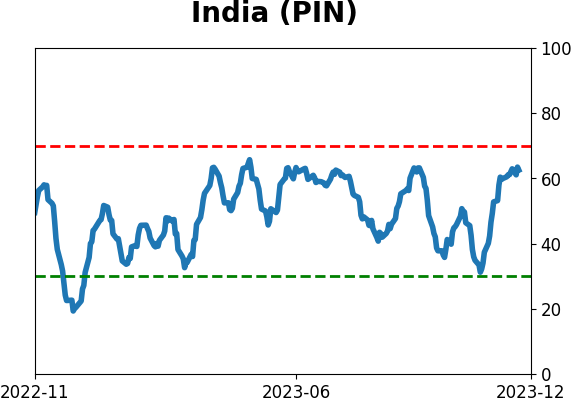
Country ETF's - 10-Day Moving Average
|
|
|
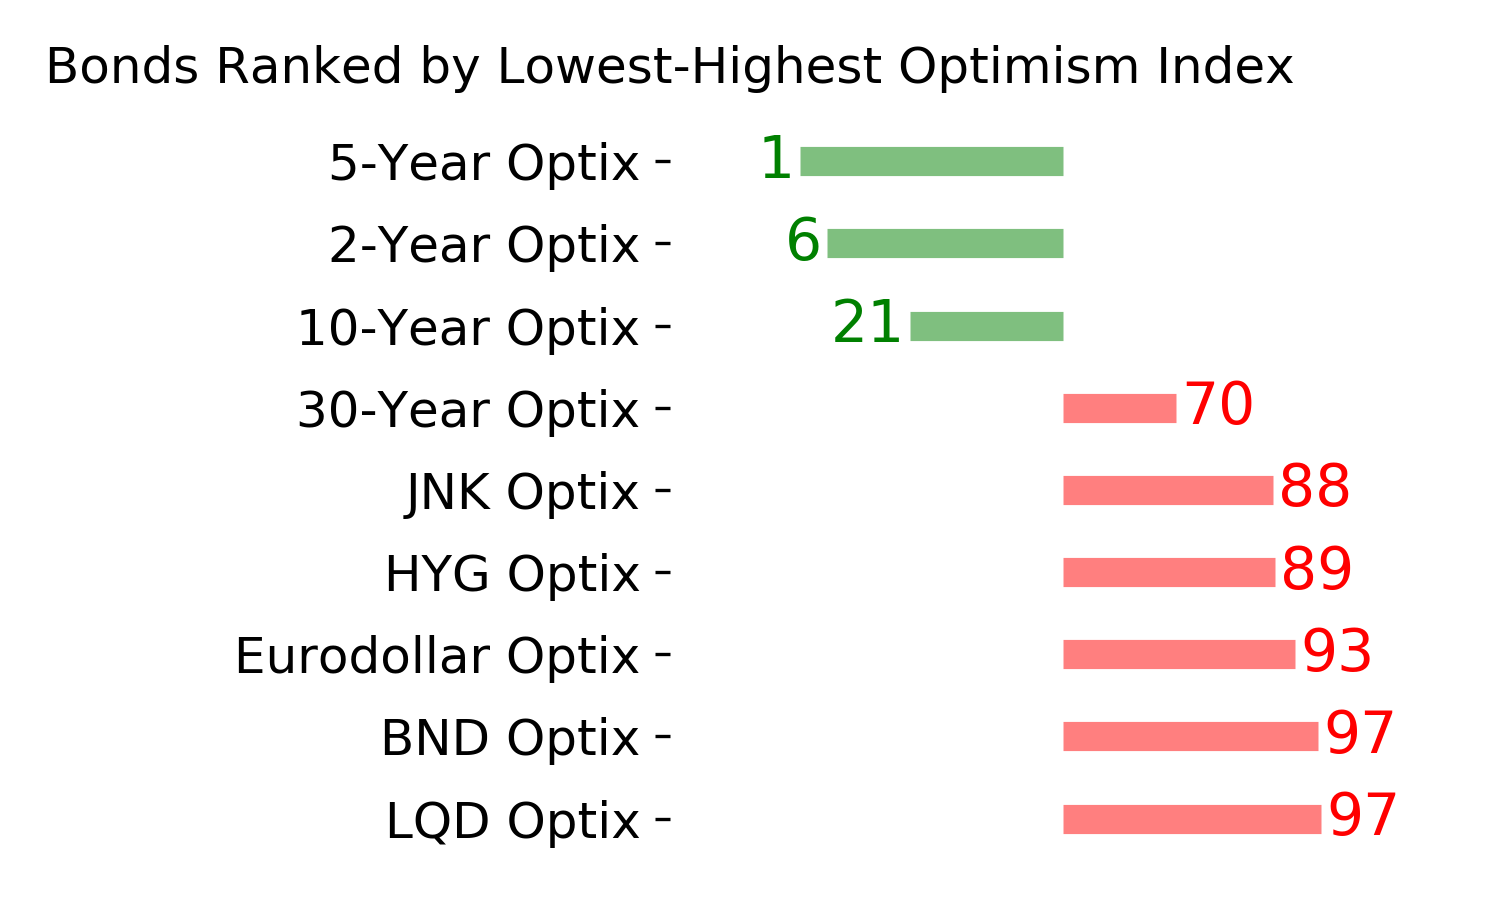
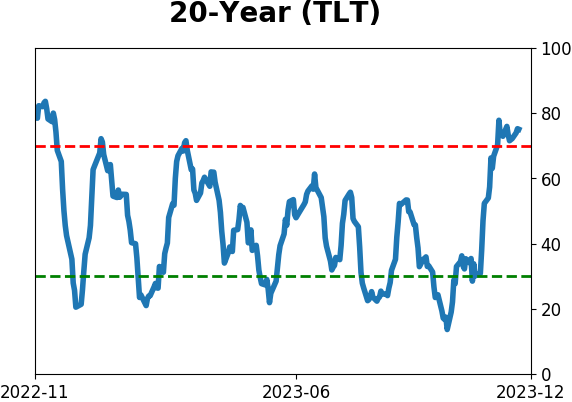
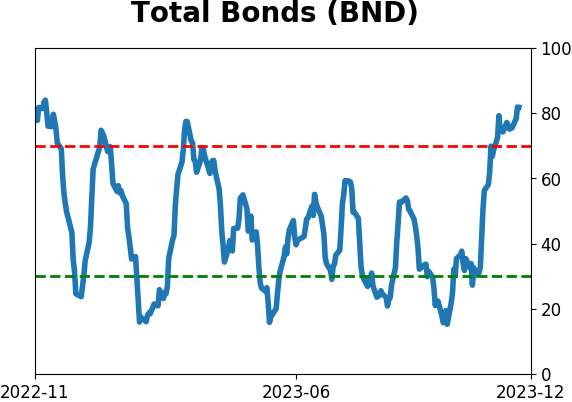
Bond ETF's - 10-Day Moving Average
|
|
|
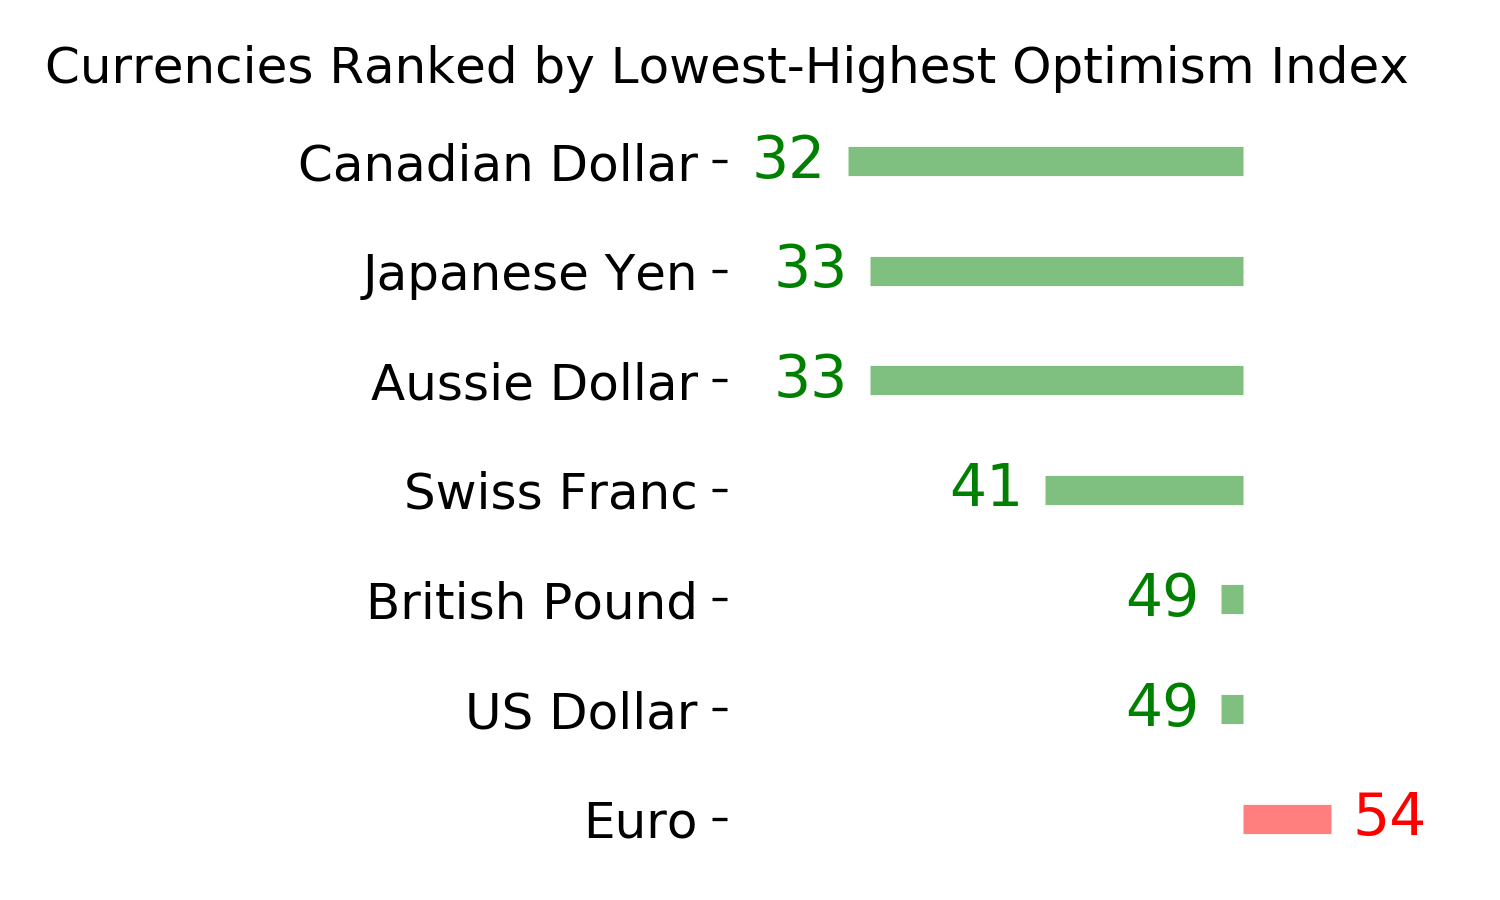
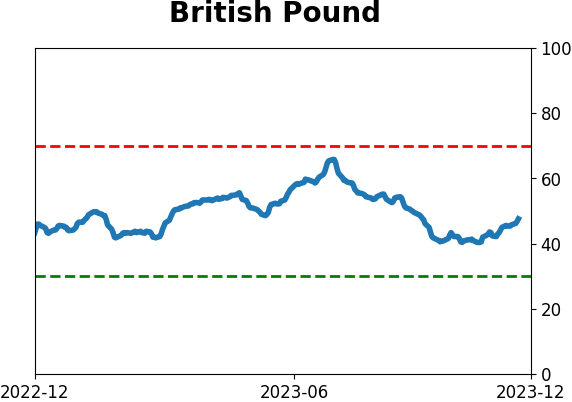
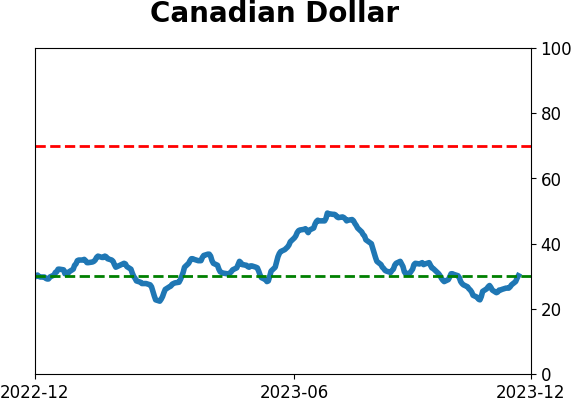
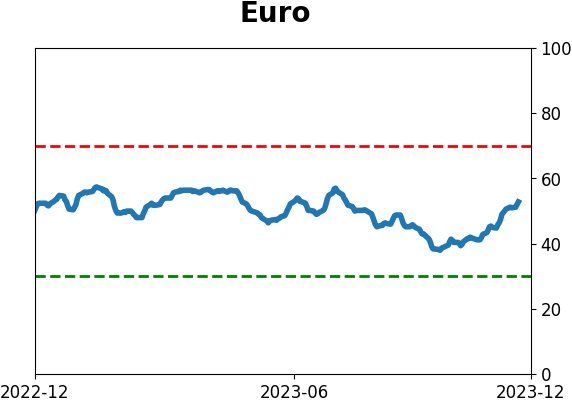
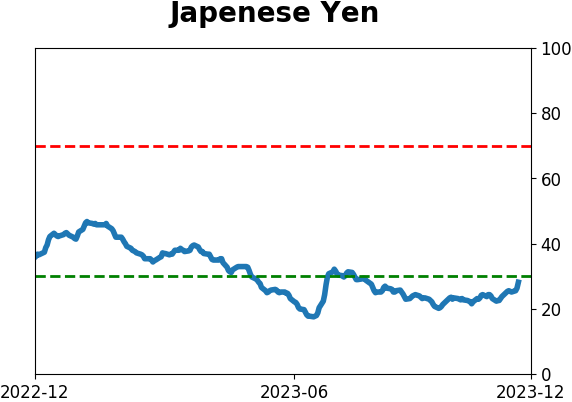
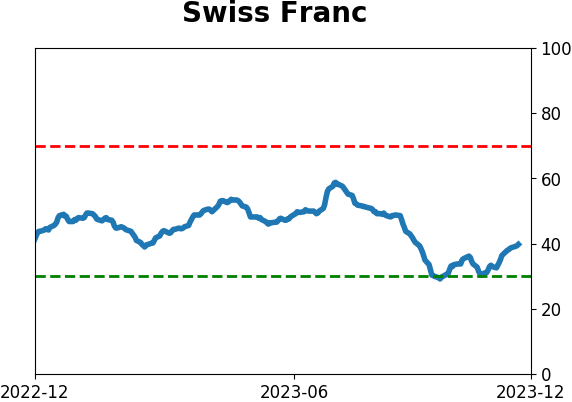
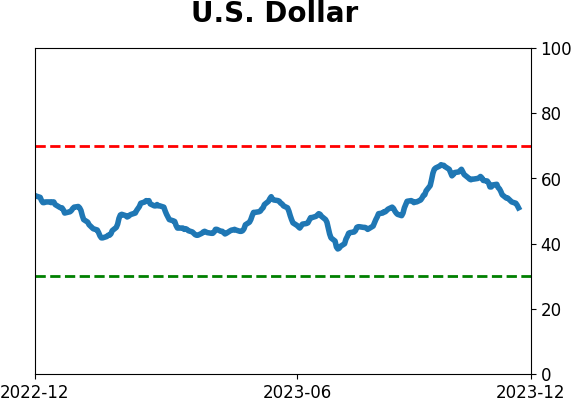
Currency ETF's - 5-Day Moving Average
|
|
|
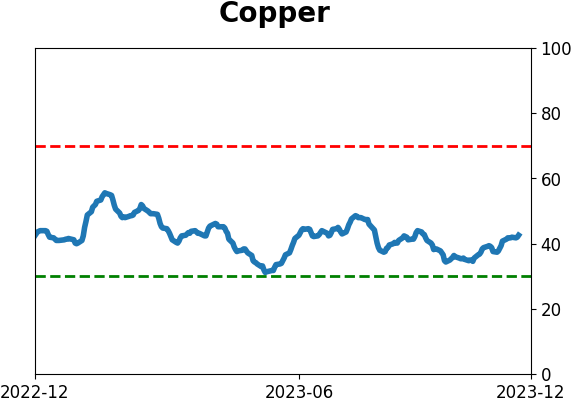
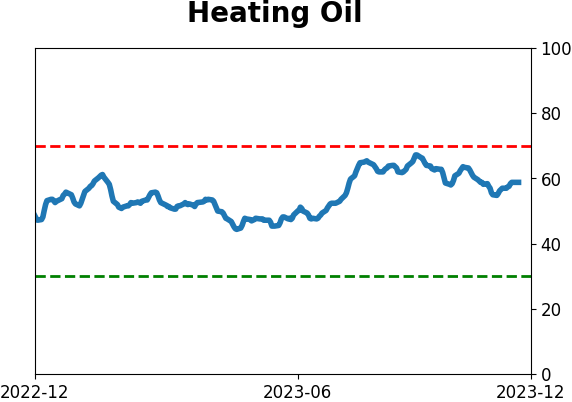
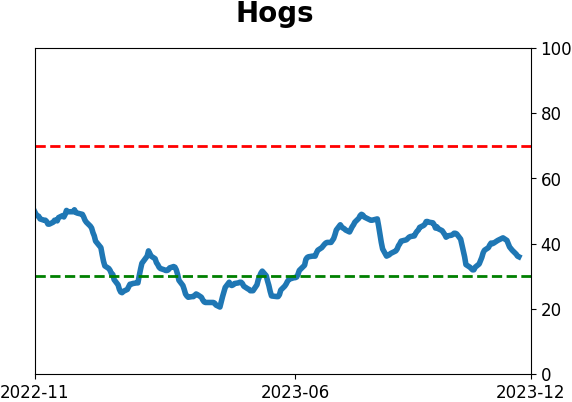
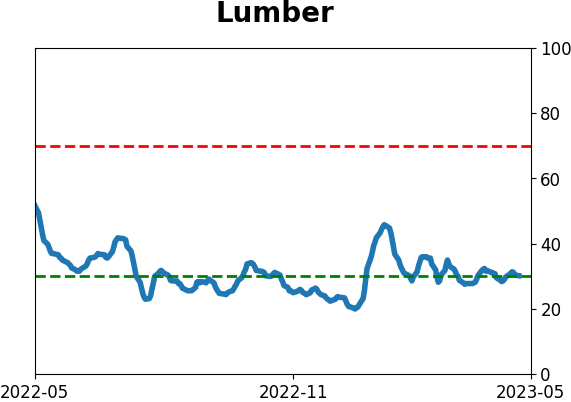
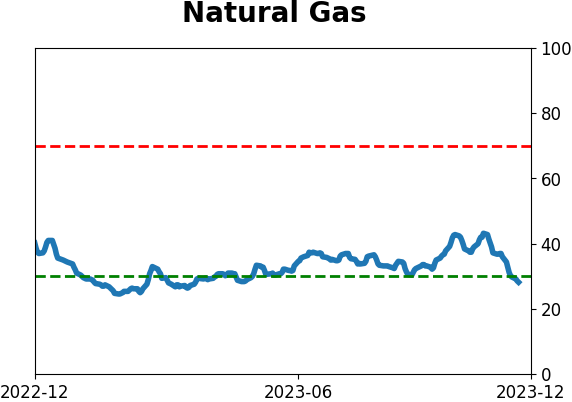
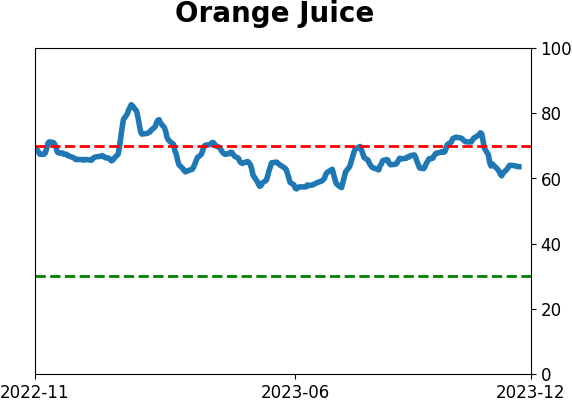
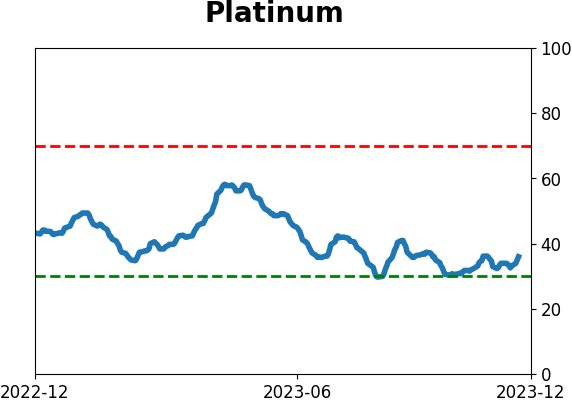
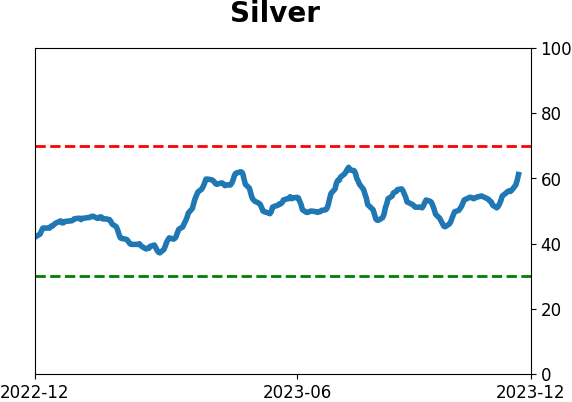
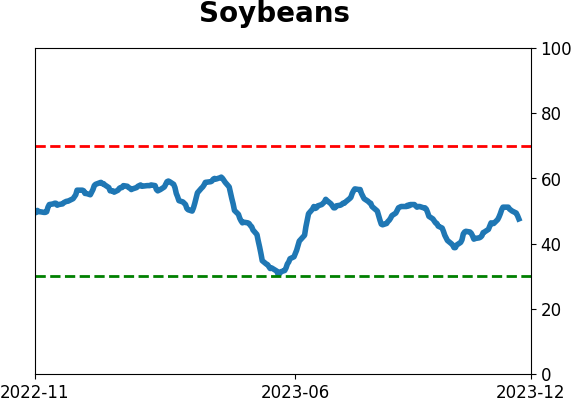
Commodity ETF's - 5-Day Moving Average
|
|