Headlines
|
|
Industrial stocks continue an impressive recovery:
Nearly all Industrial stocks climbed above their 50-day moving averages by late last week. Less than two months ago, fewer than 3% of stocks were doing so. Similar cycles over the past 70 years preceded gains every time over the next 6 months. It was bullish for the broader market, too. It's an added benefit that there has been an impressive recovery in stocks above their long-term 200-day averages.
|
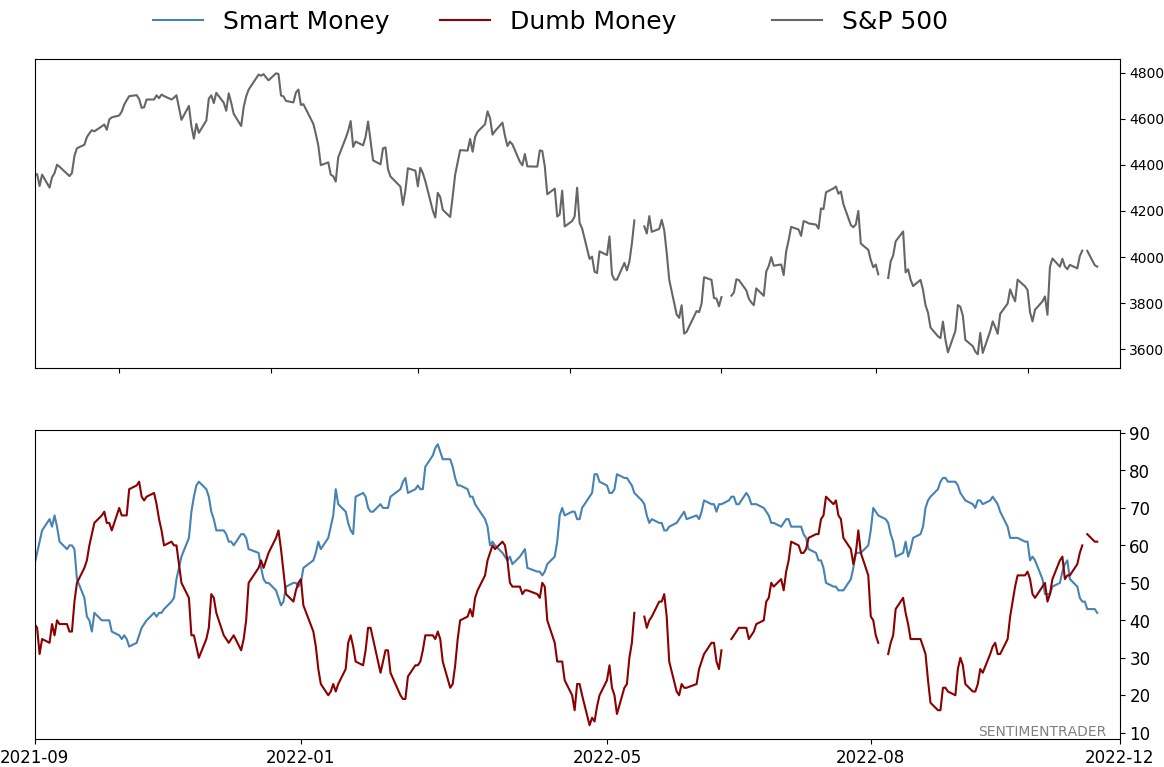
Smart / Dumb Money Confidence
|
Smart Money Confidence: 42%
Dumb Money Confidence: 61%
|
|
Risk Levels
Stocks Short-Term
|
Stocks Medium-Term
|
|
Bonds
|
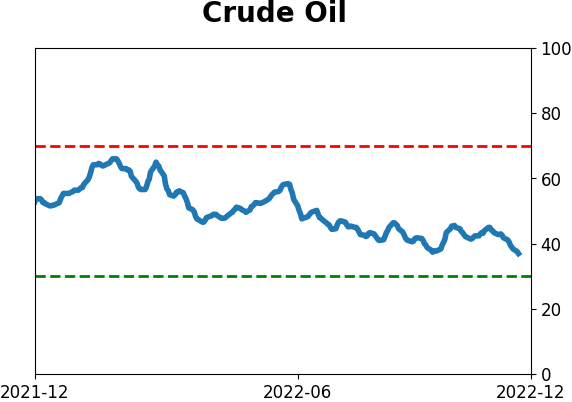
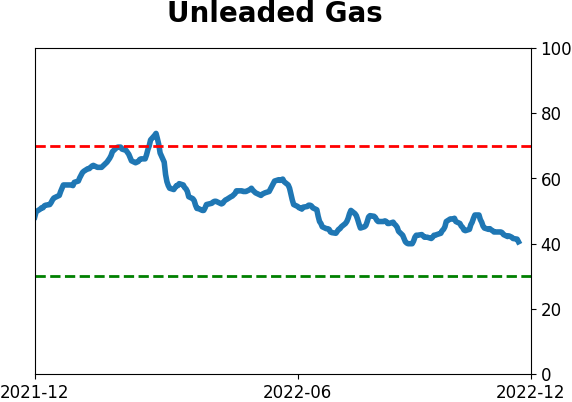
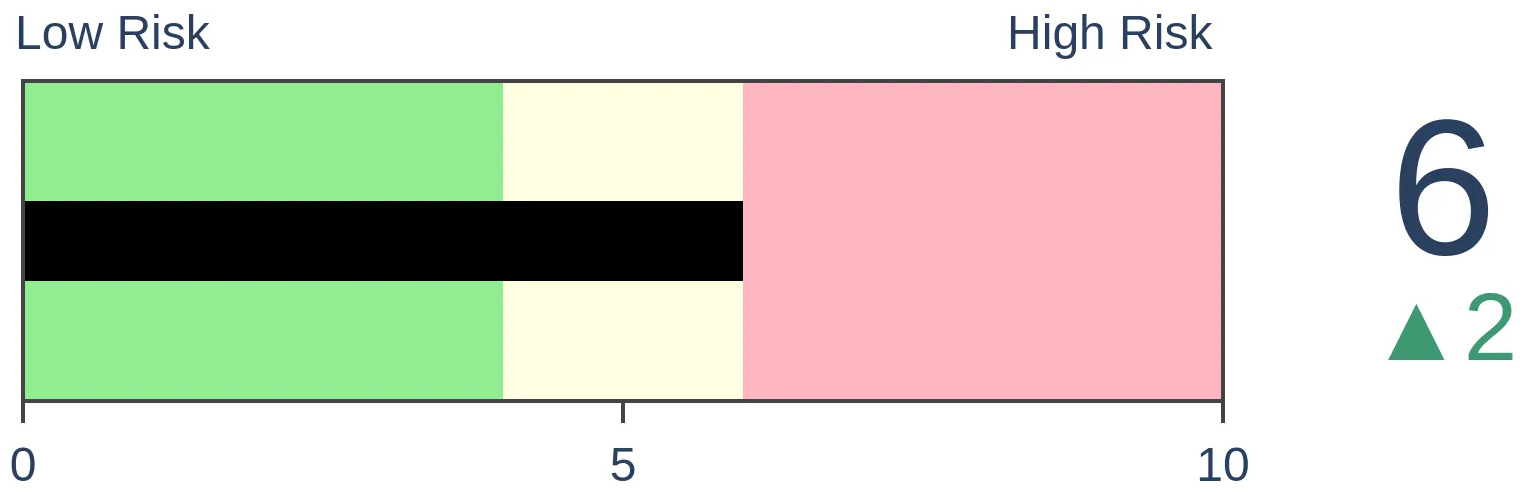
Crude Oil
|
|
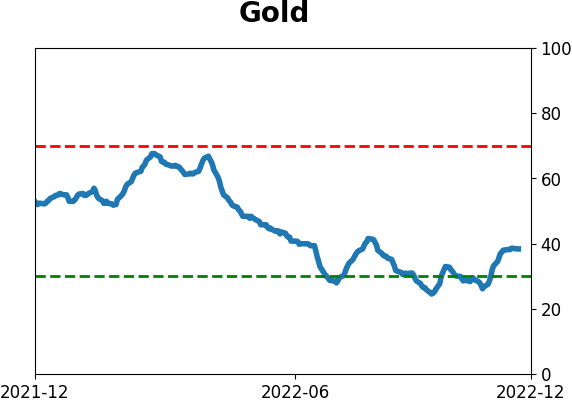
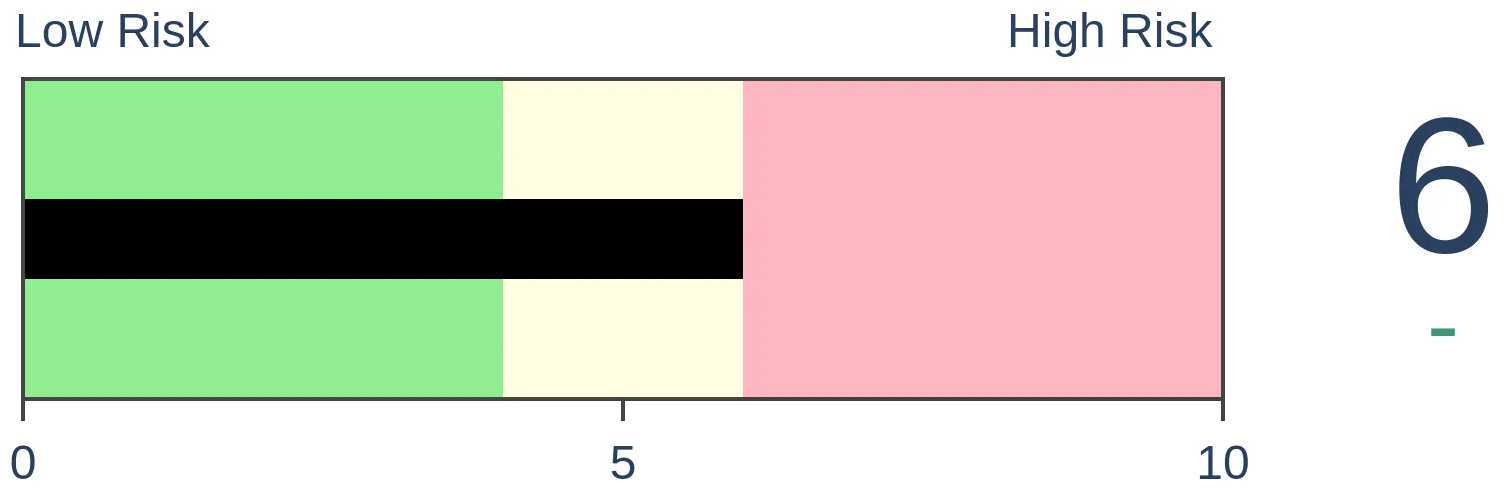
Gold

|
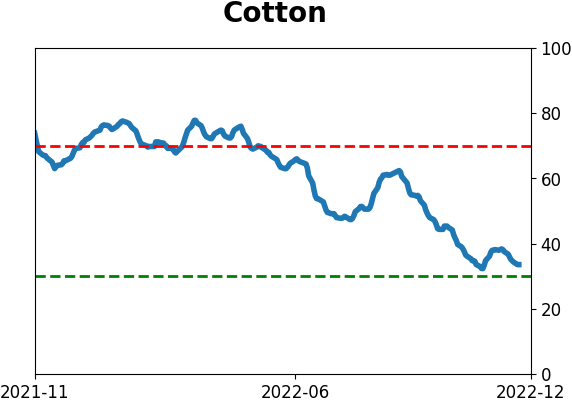
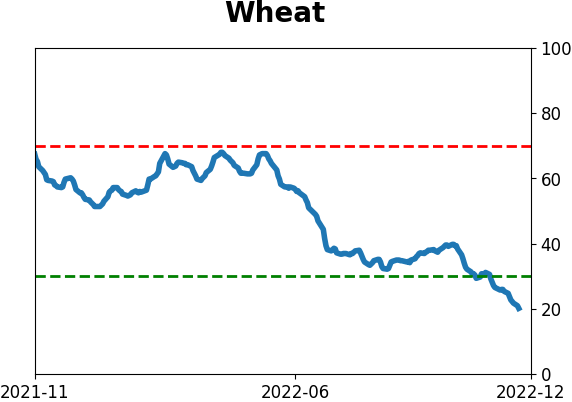
Agriculture
|
|
Research
By Jason Goepfert
BOTTOM LINE
Nearly all Industrial stocks climbed above their 50-day moving averages by late last week. Less than two months ago, fewer than 3% of stocks were doing so. Similar cycles over the past 70 years preceded gains every time over the next 6 months. It was bullish for the broader market, too. It's an added benefit that there has been an impressive recovery in stocks above their long-term 200-day averages.
FORECAST / TIMEFRAME
XLI -- Up, Long-Term
|
Key points:
- Over the past 30 days, almost all Industrial stocks traded below their 50-day averages, then above
- Similar cycles over the past 70 years preceded 6-month gains every time
- It's an added benefit that many of the stocks have also regained their 200-day averages
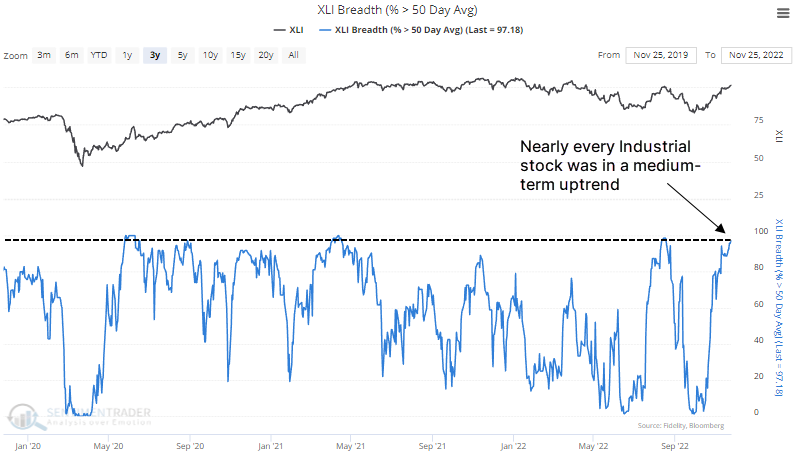
Virtually all Industrial stocks are in medium-term uptrends
We've already looked at the surge in Industrial stocks at the end of October as internal momentum surged, and again a couple of weeks later as they entered a positive seasonal window along with other tailwinds.
They've continued to climb, and as of last week, more than 97% of the stocks managed to hold above their 50-day moving averages.
 Granted, this happened in early August, and the sector immediately turned tail, which is disturbing. But historically, this kind of internal momentum doesn't happen during ongoing, protracted bear markets. At no point during the 2001-02 or 2007-08 bear markets did more than 97% of Industrials trade above their 50-day averages.
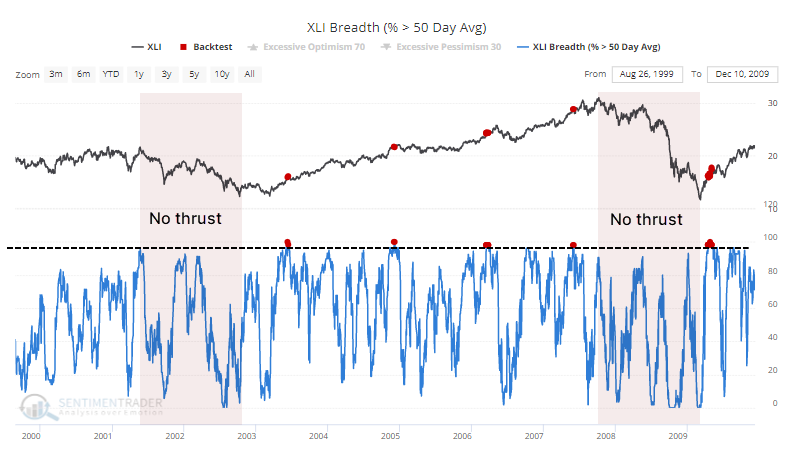
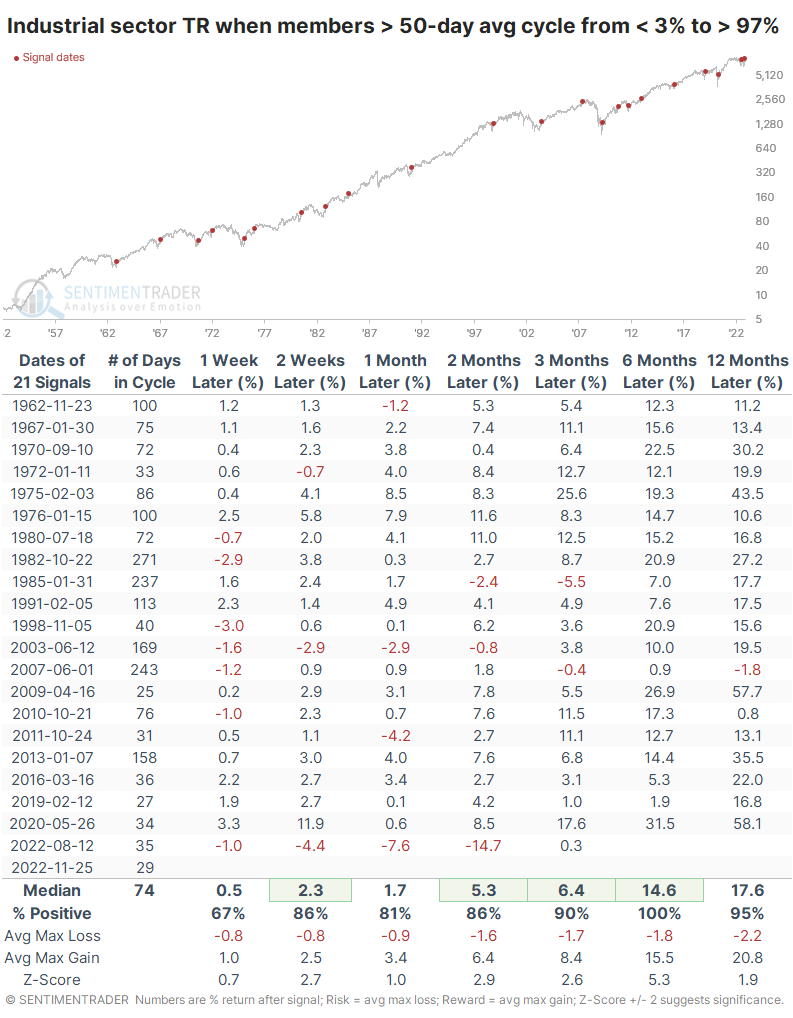
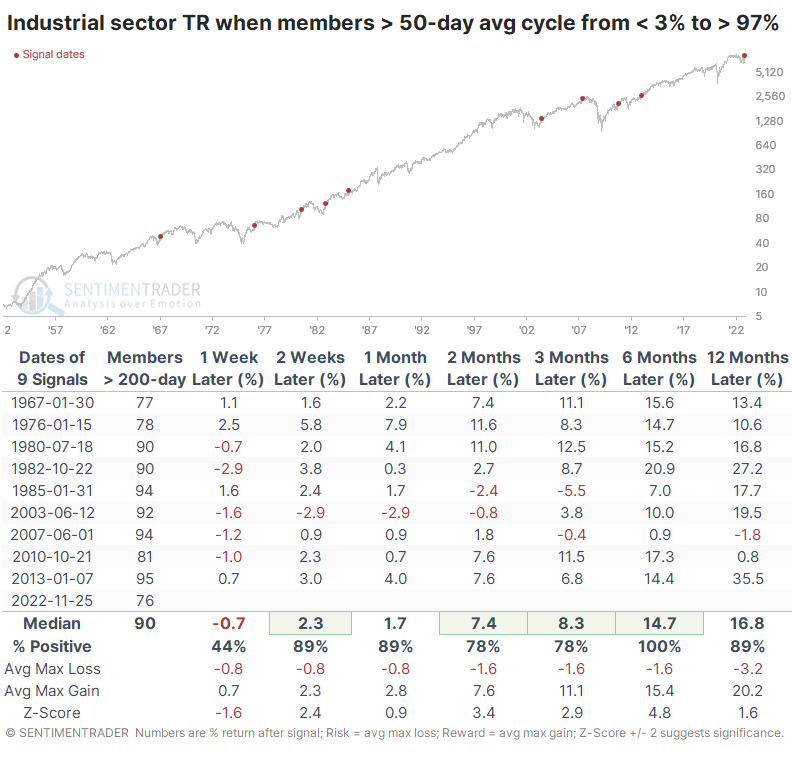
If we look at the past 70 years, there have been 21 times when fewer than 3% of Industrials traded above their 50-day averages, then a recovery pushed more than 97% of them above their averages. It took an average of 74 trading days for these cycles to occur, but the current one took only 29 days, one of the quickest on record.
In the six months following these cycles, Industrial stocks showed a positive total return every time. The maximum loss during the next six months averaged only -1.8%, while the sector enjoyed an average maximum gain of 15.5%. The largest six-month drawdown out of all 21 signals was only -6.5%.
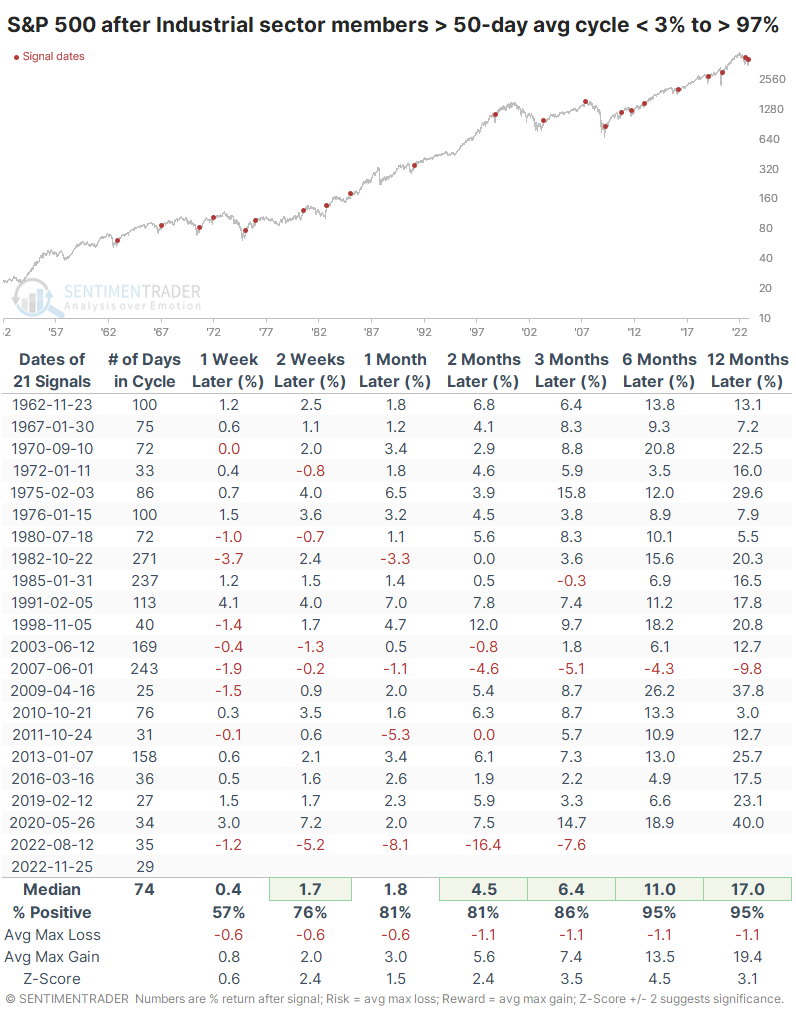
These signals were good for the broader market, too. The S&P 500 (price only, not including dividends) sported only one loss over the next 6-12 months, though it was a notable one.
Long-term uptrends are improving, too
We've noted many times that during healthy trends, sectors tend to have more than 60% of their members consistently trade above their 200-day moving averages. In August, the Industrial sector topped out almost immediately after reaching that threshold. This time, it didn't, and more stocks have resumed their long-term uptrends. This is a positive nascent sign that the poor environment has ended.
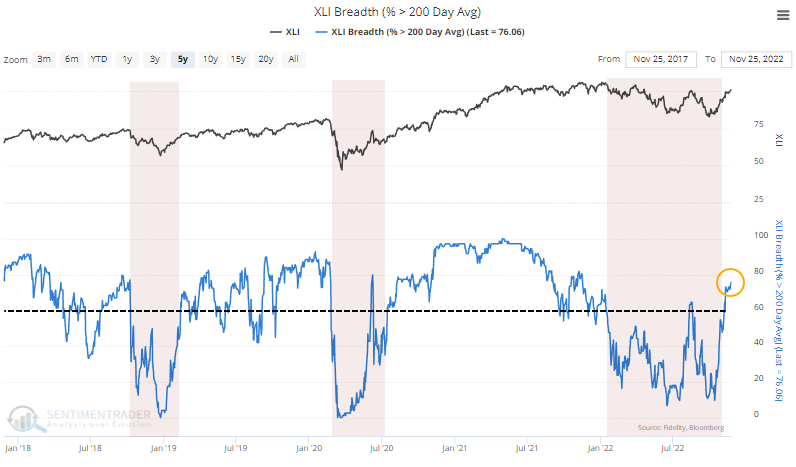
If we filter the table above for those dates with the most Industrial stocks above their 200-day averages, forward returns generally improved, though that pesky 2007 signal remains.
What the research tells us...
We'll leave the macro guessing about what a resurgent Industrial sector means for the economy to others. Based on an objective look at seven decades of history, cycles like the past 30 days in the sector have been unequivocally bullish for those stocks and the broader stock market. The impressive increase in the number of stocks ensconced in long-term uptrends is an added bullish factor, especially the longer we go with more than 60% of members trading above their long-term averages.
Indicators at Extremes
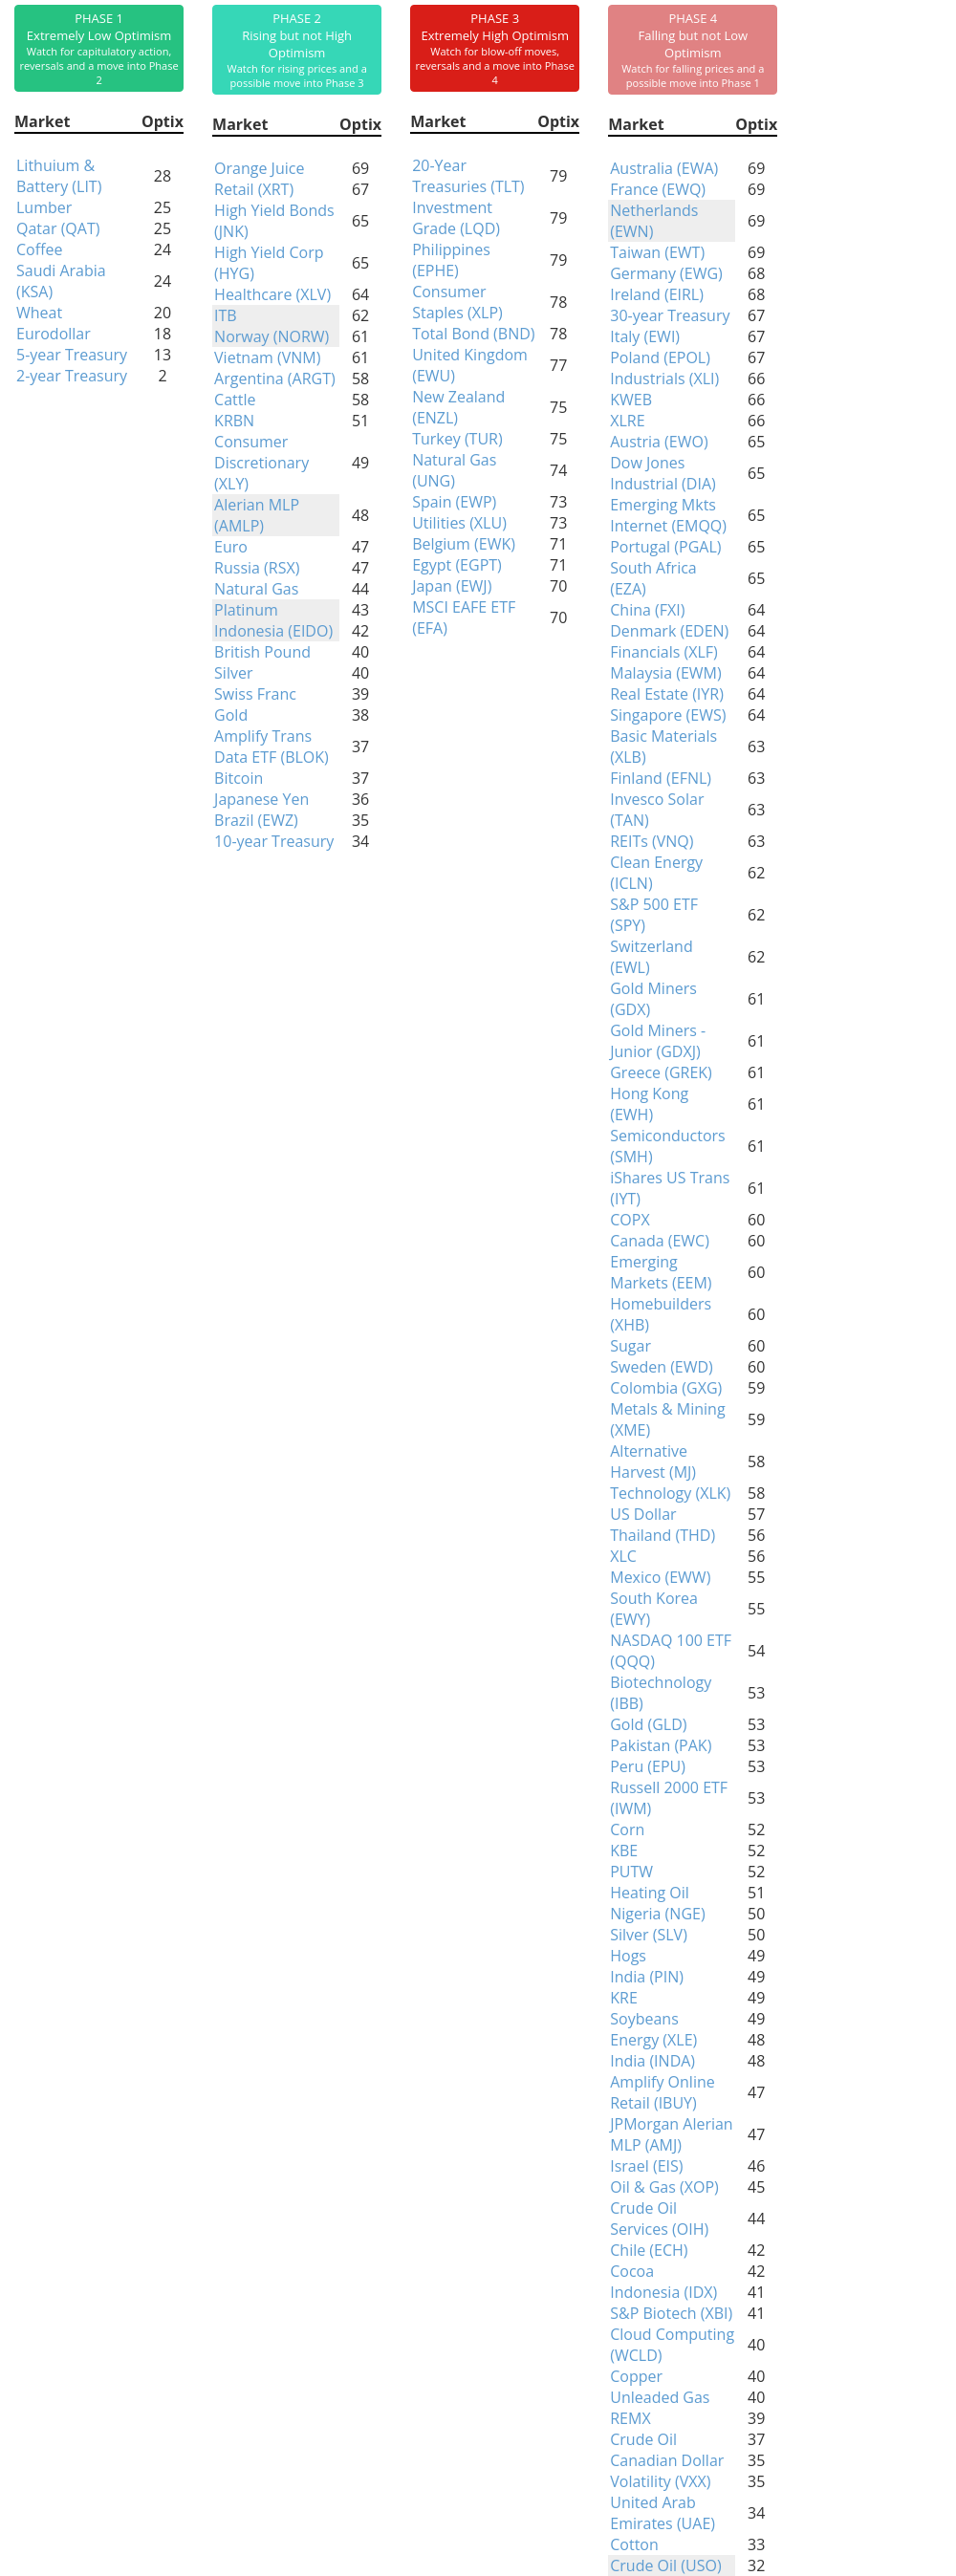
Phase Table
Ranks
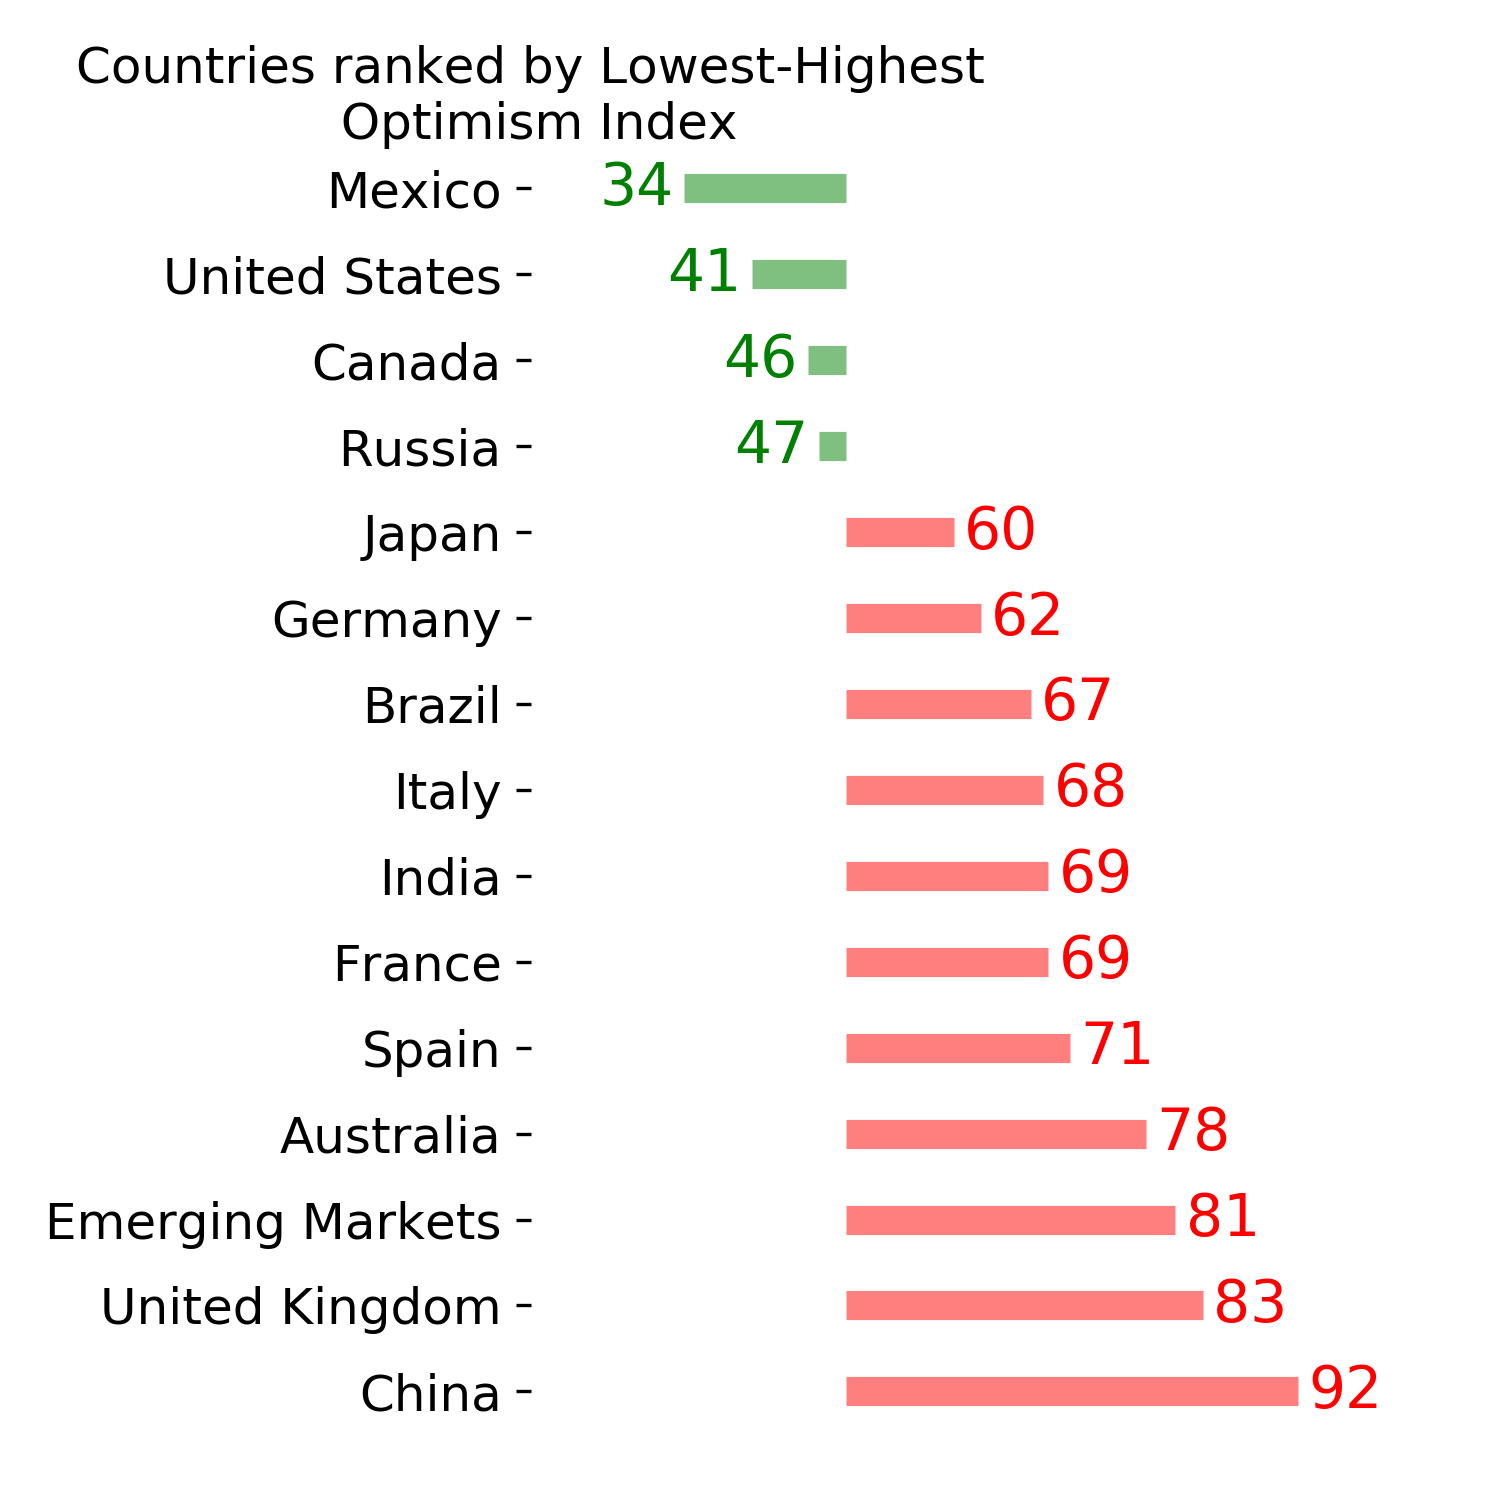
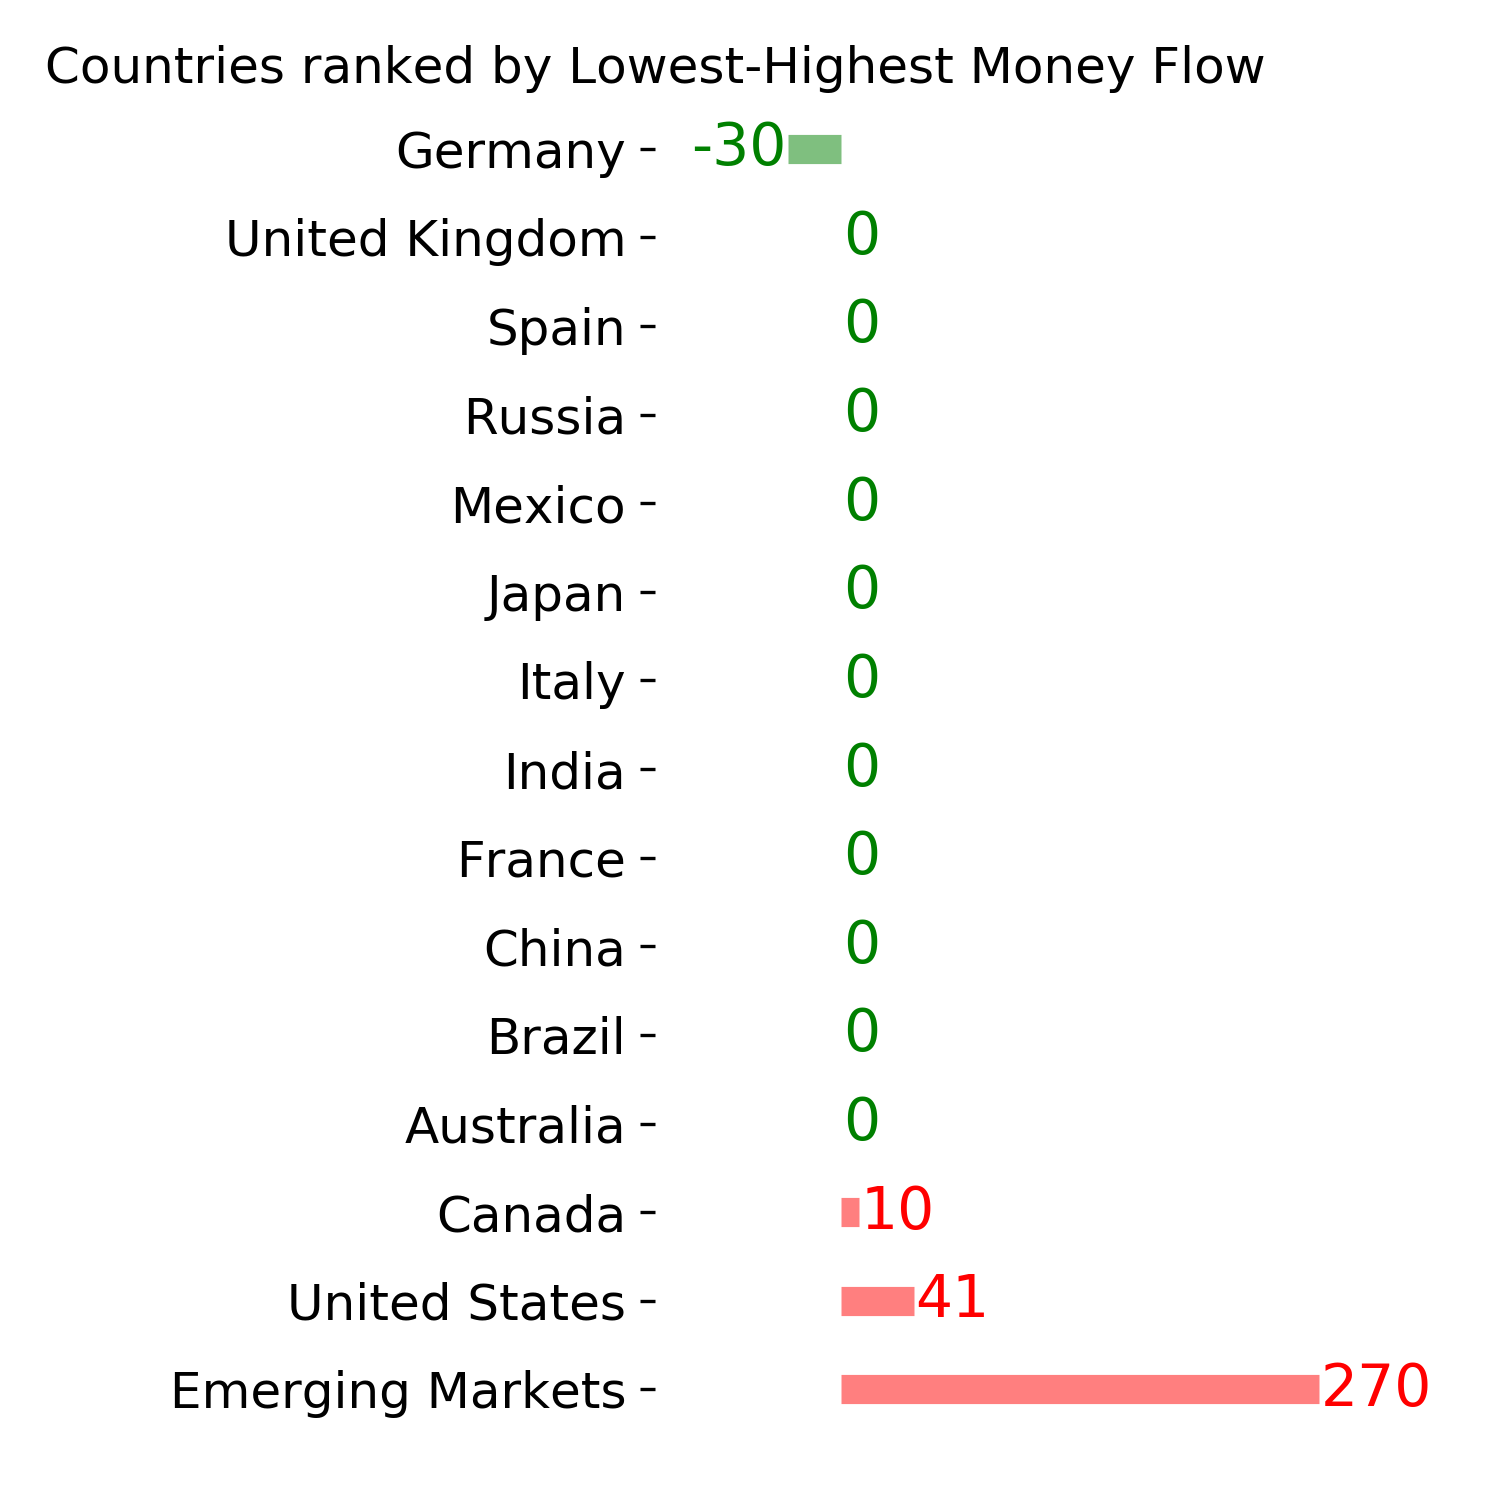
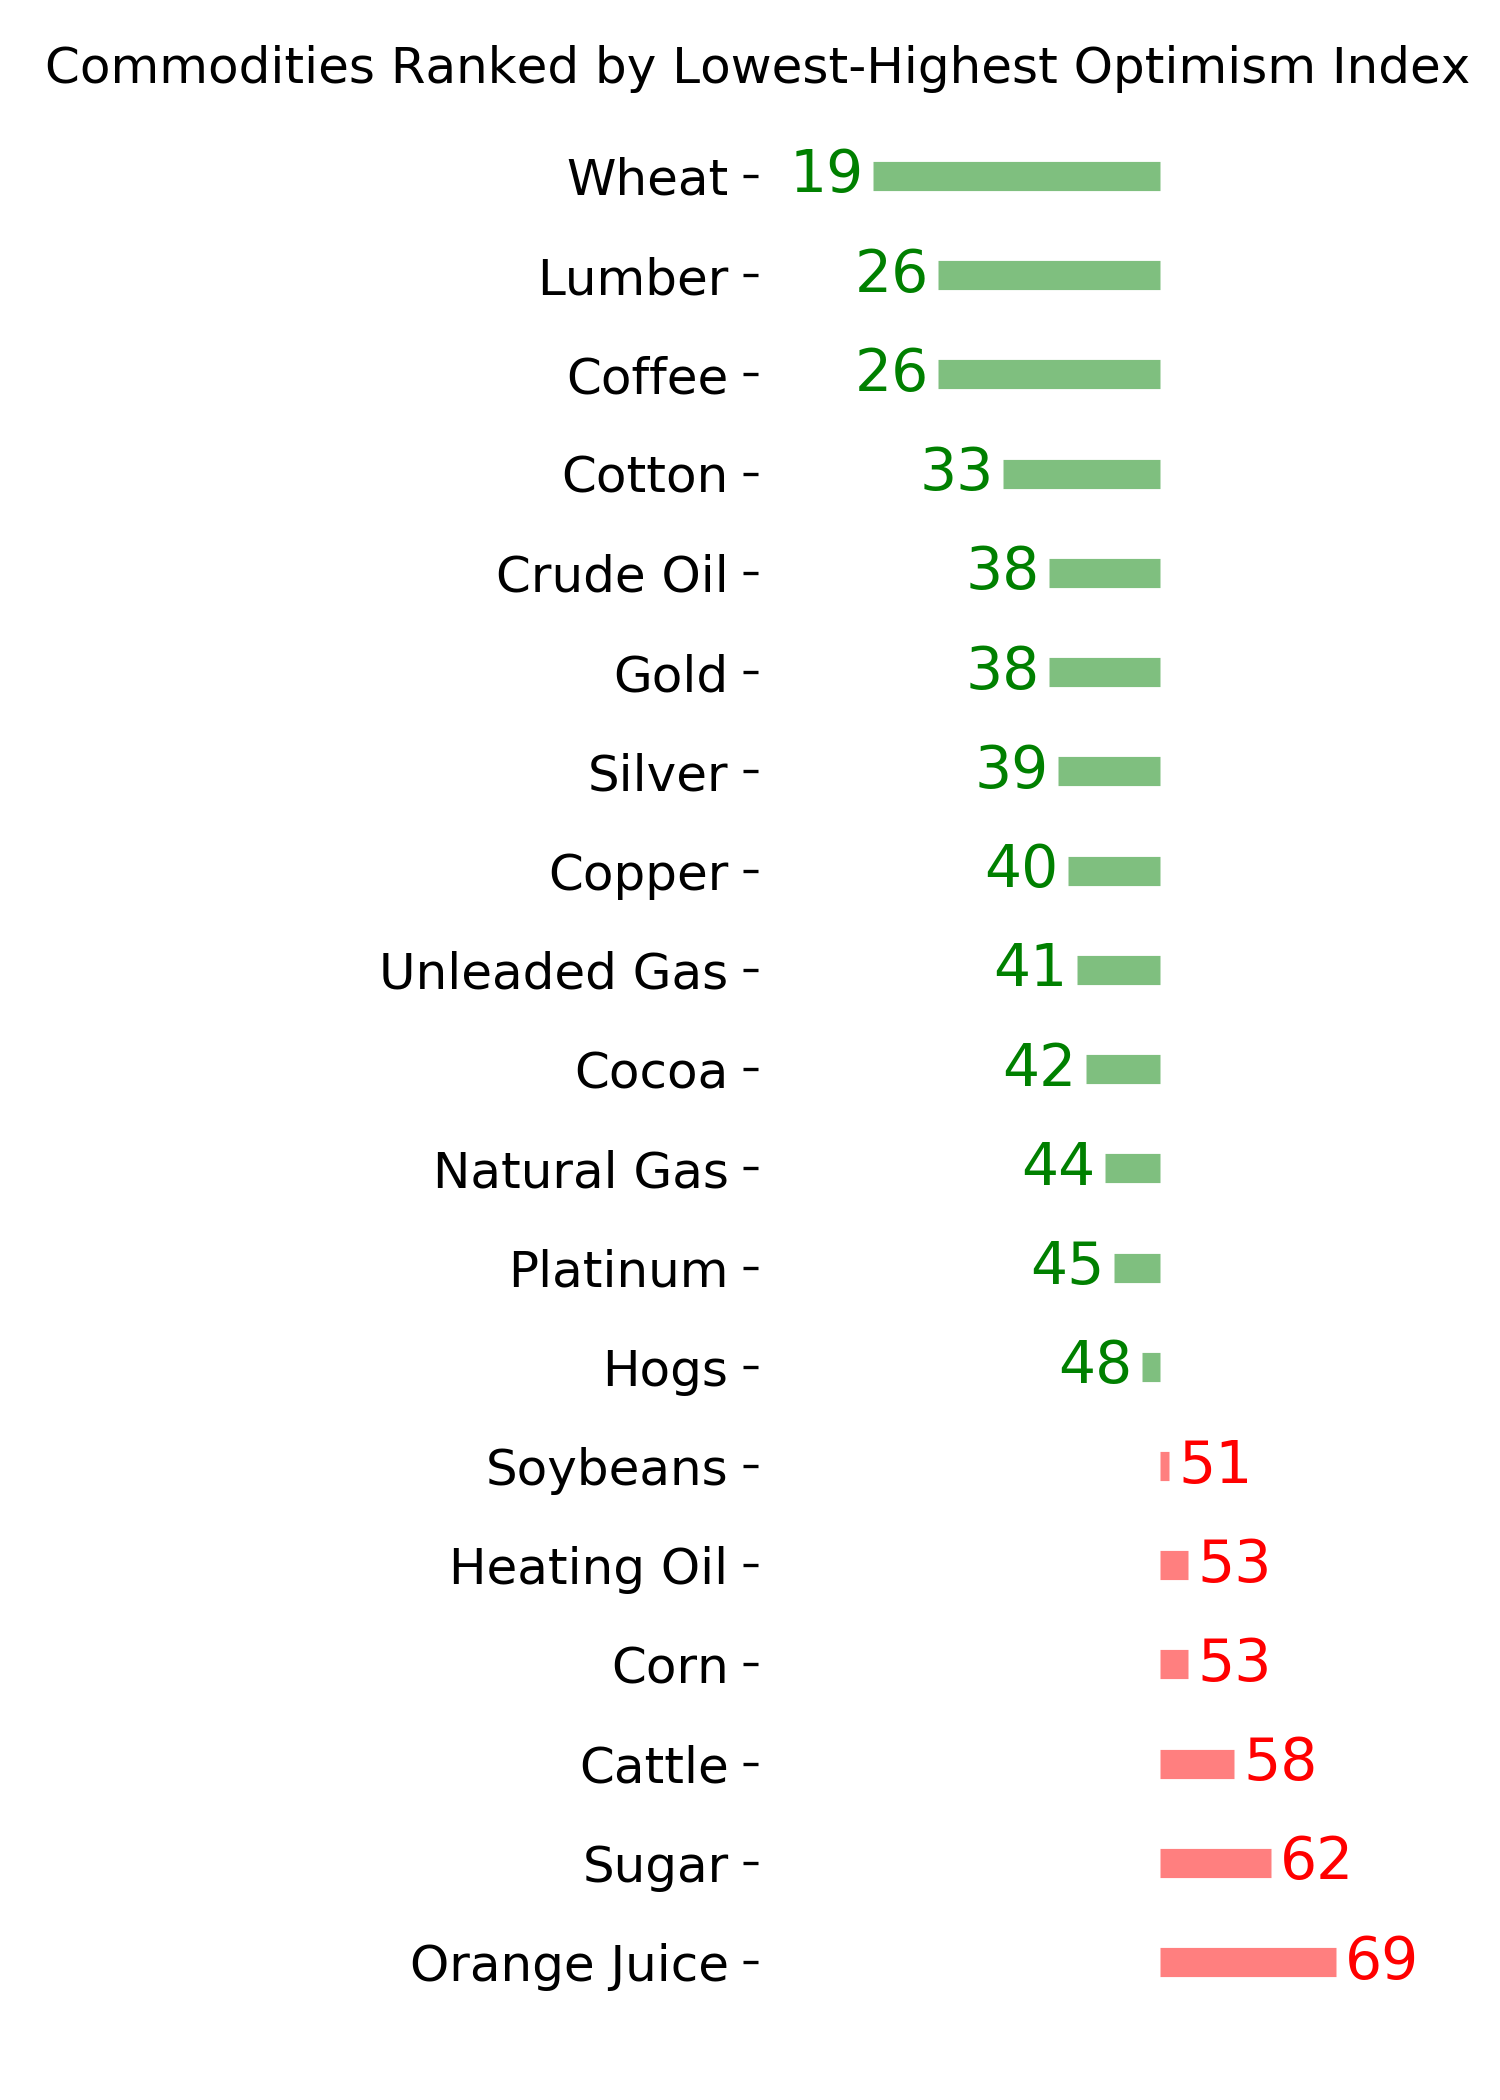
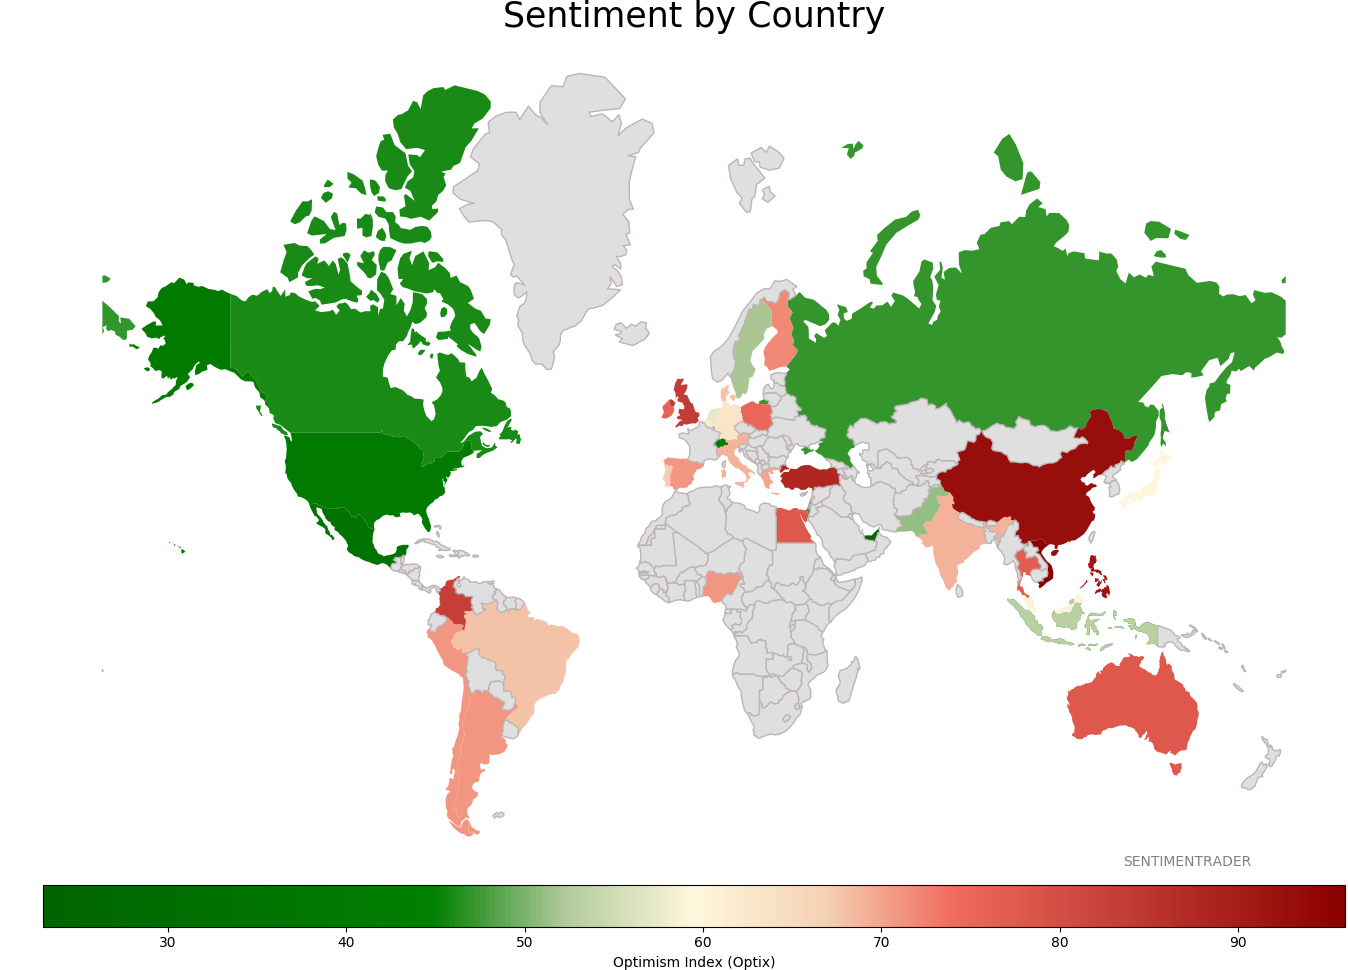
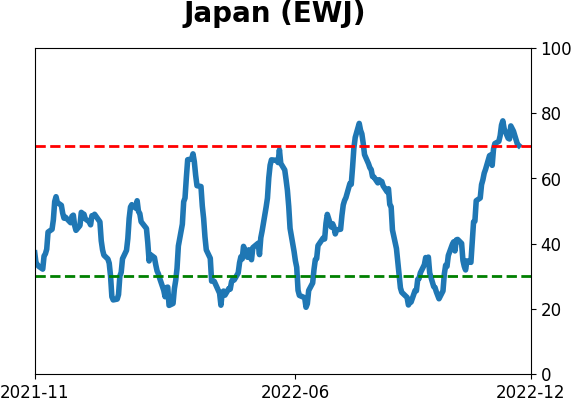
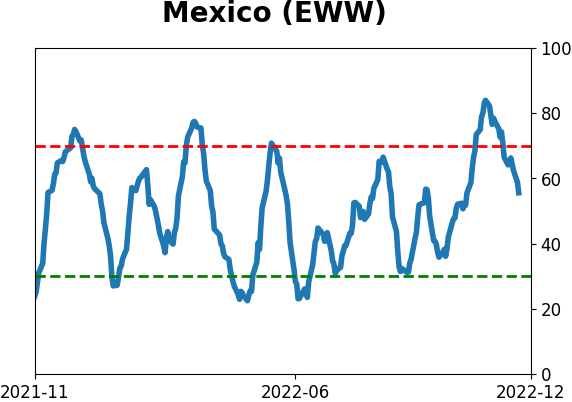
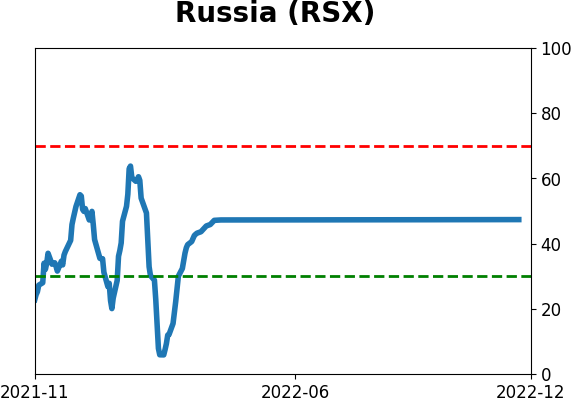
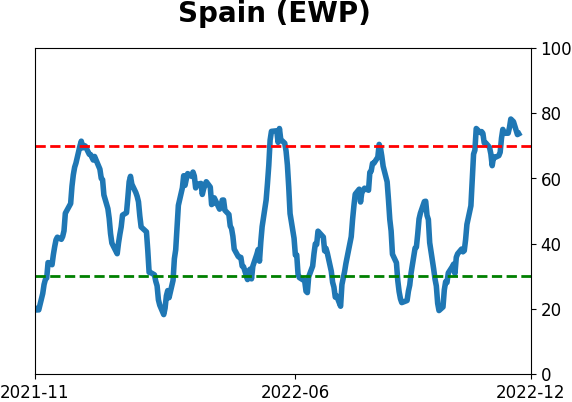
Sentiment Around The World
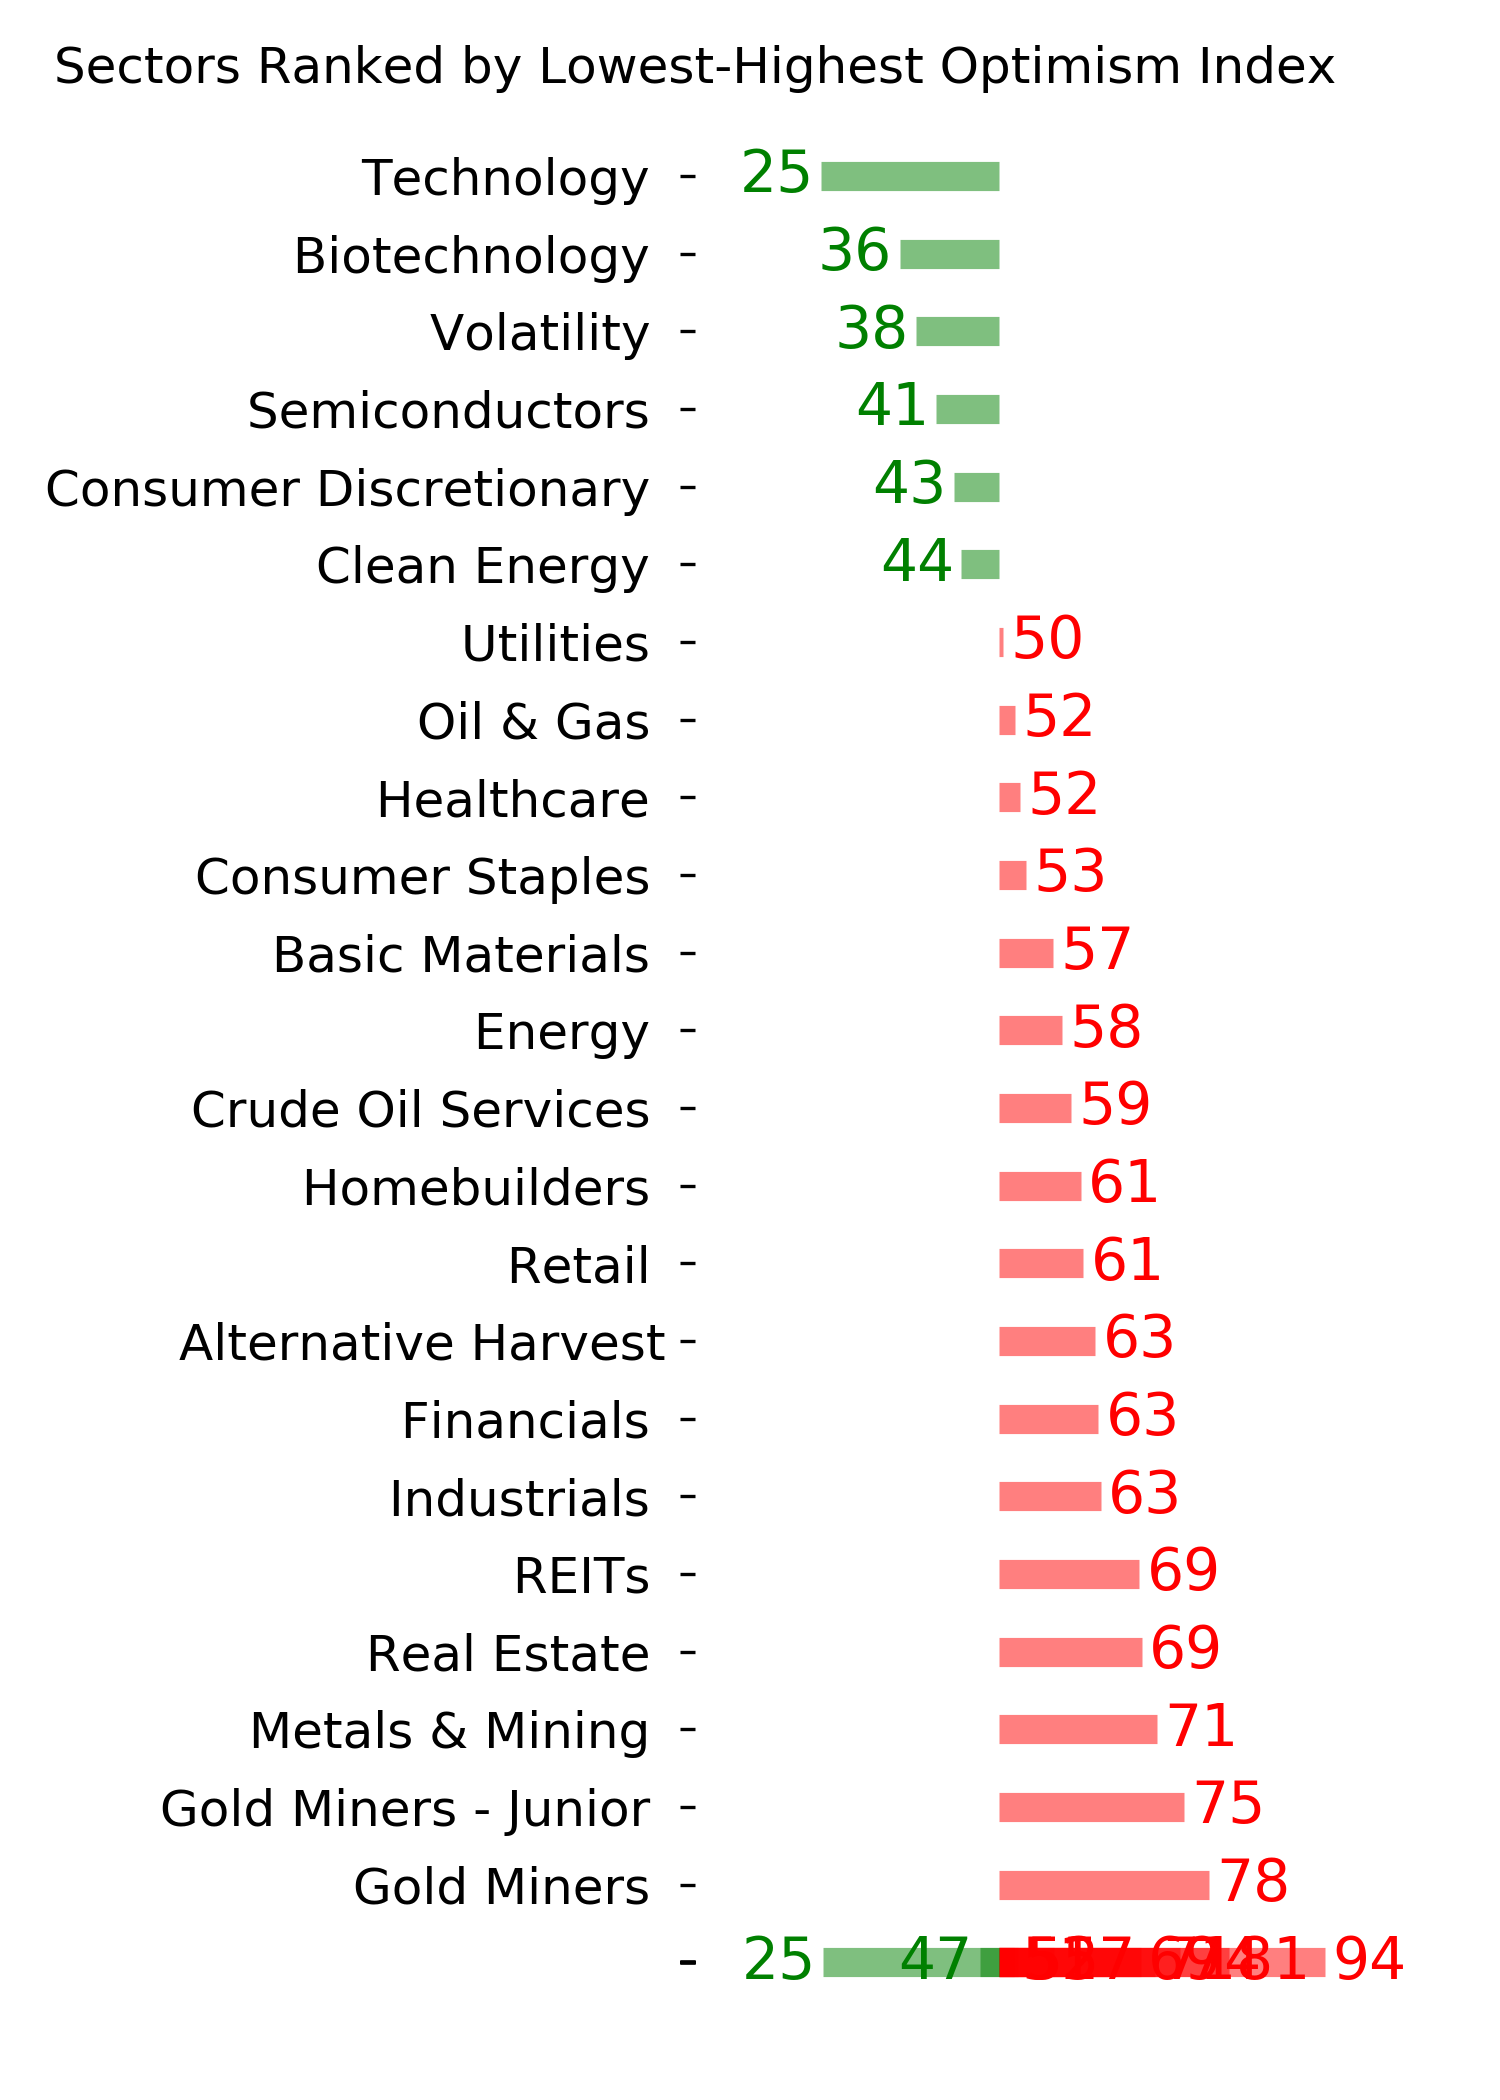
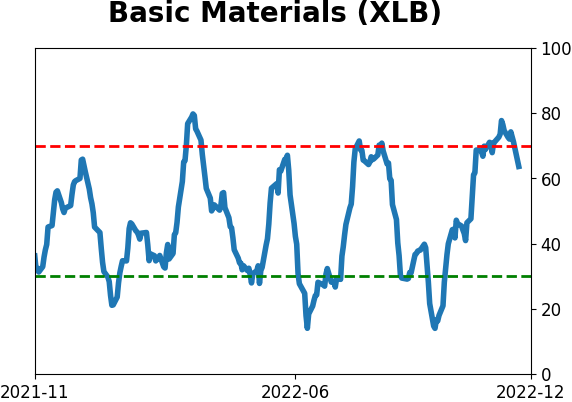
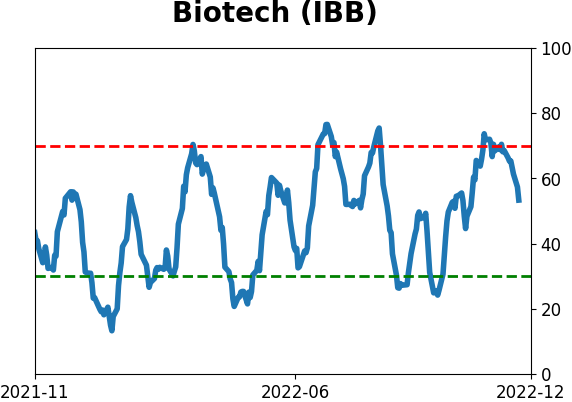
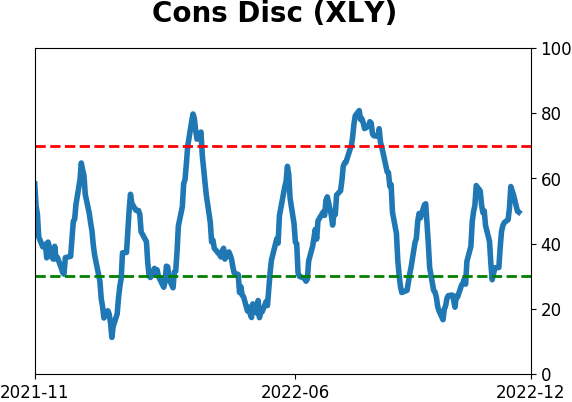
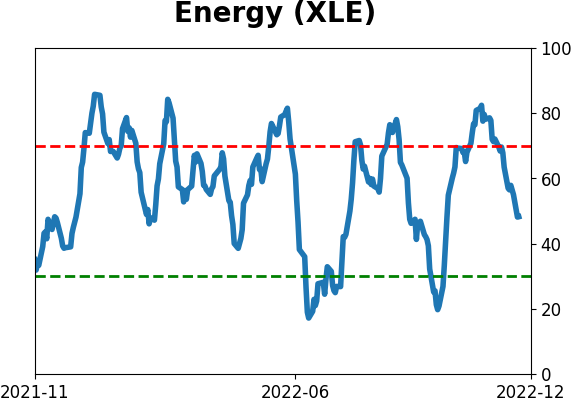
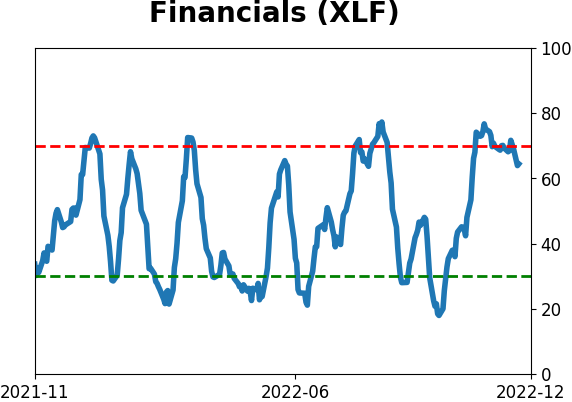
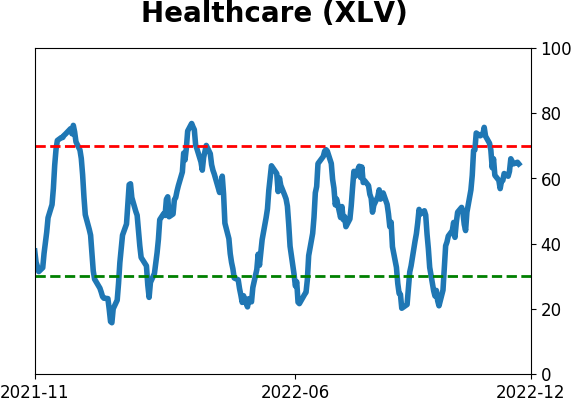
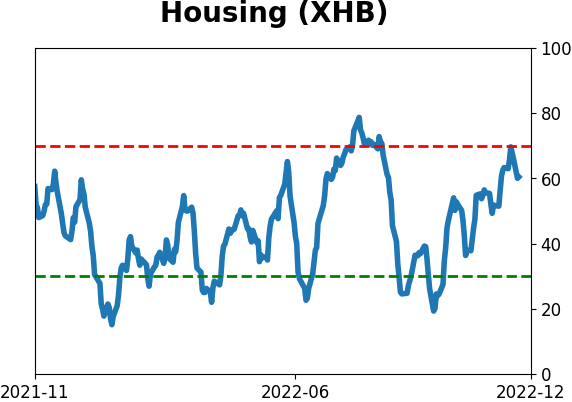
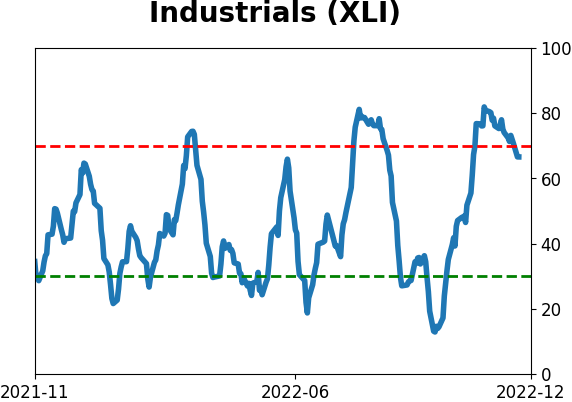
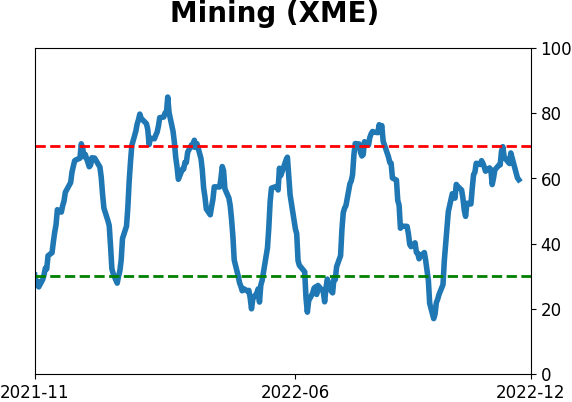
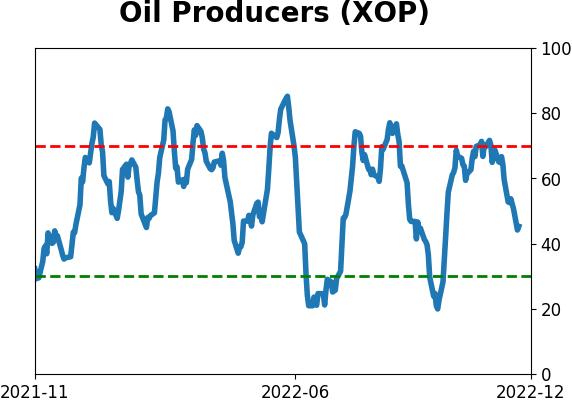
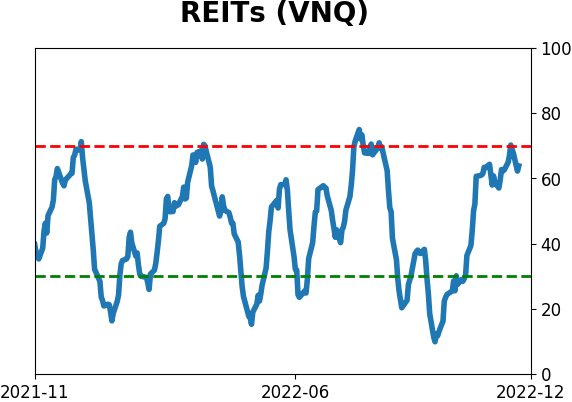
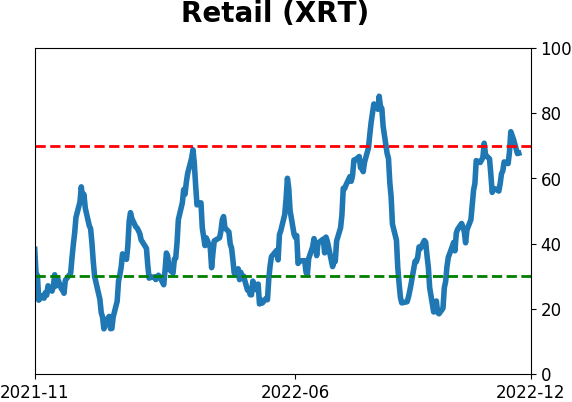
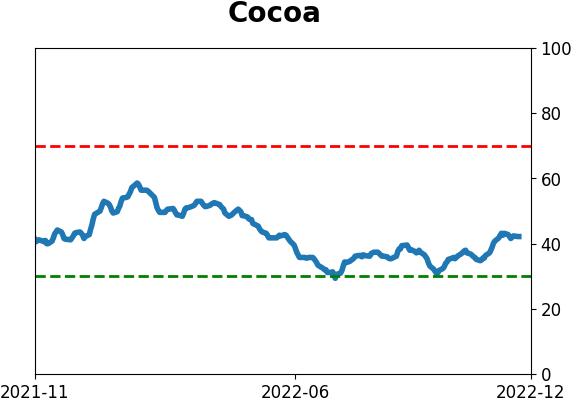
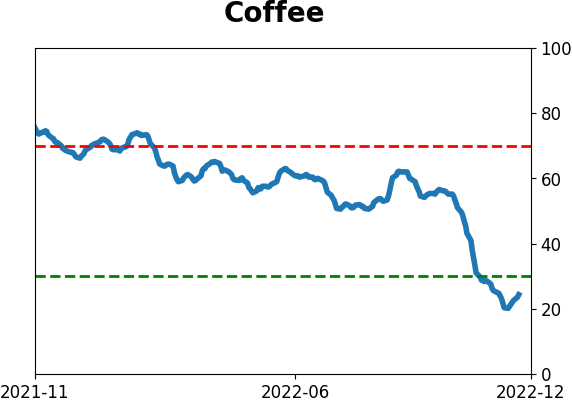
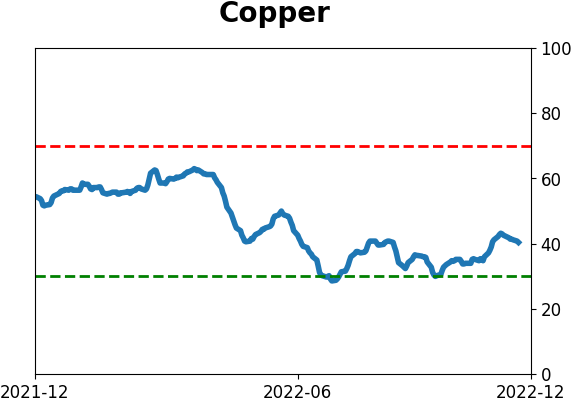
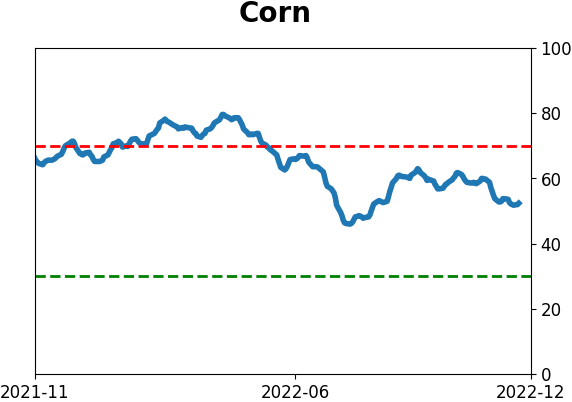
Optimism Index Thumbnails
|
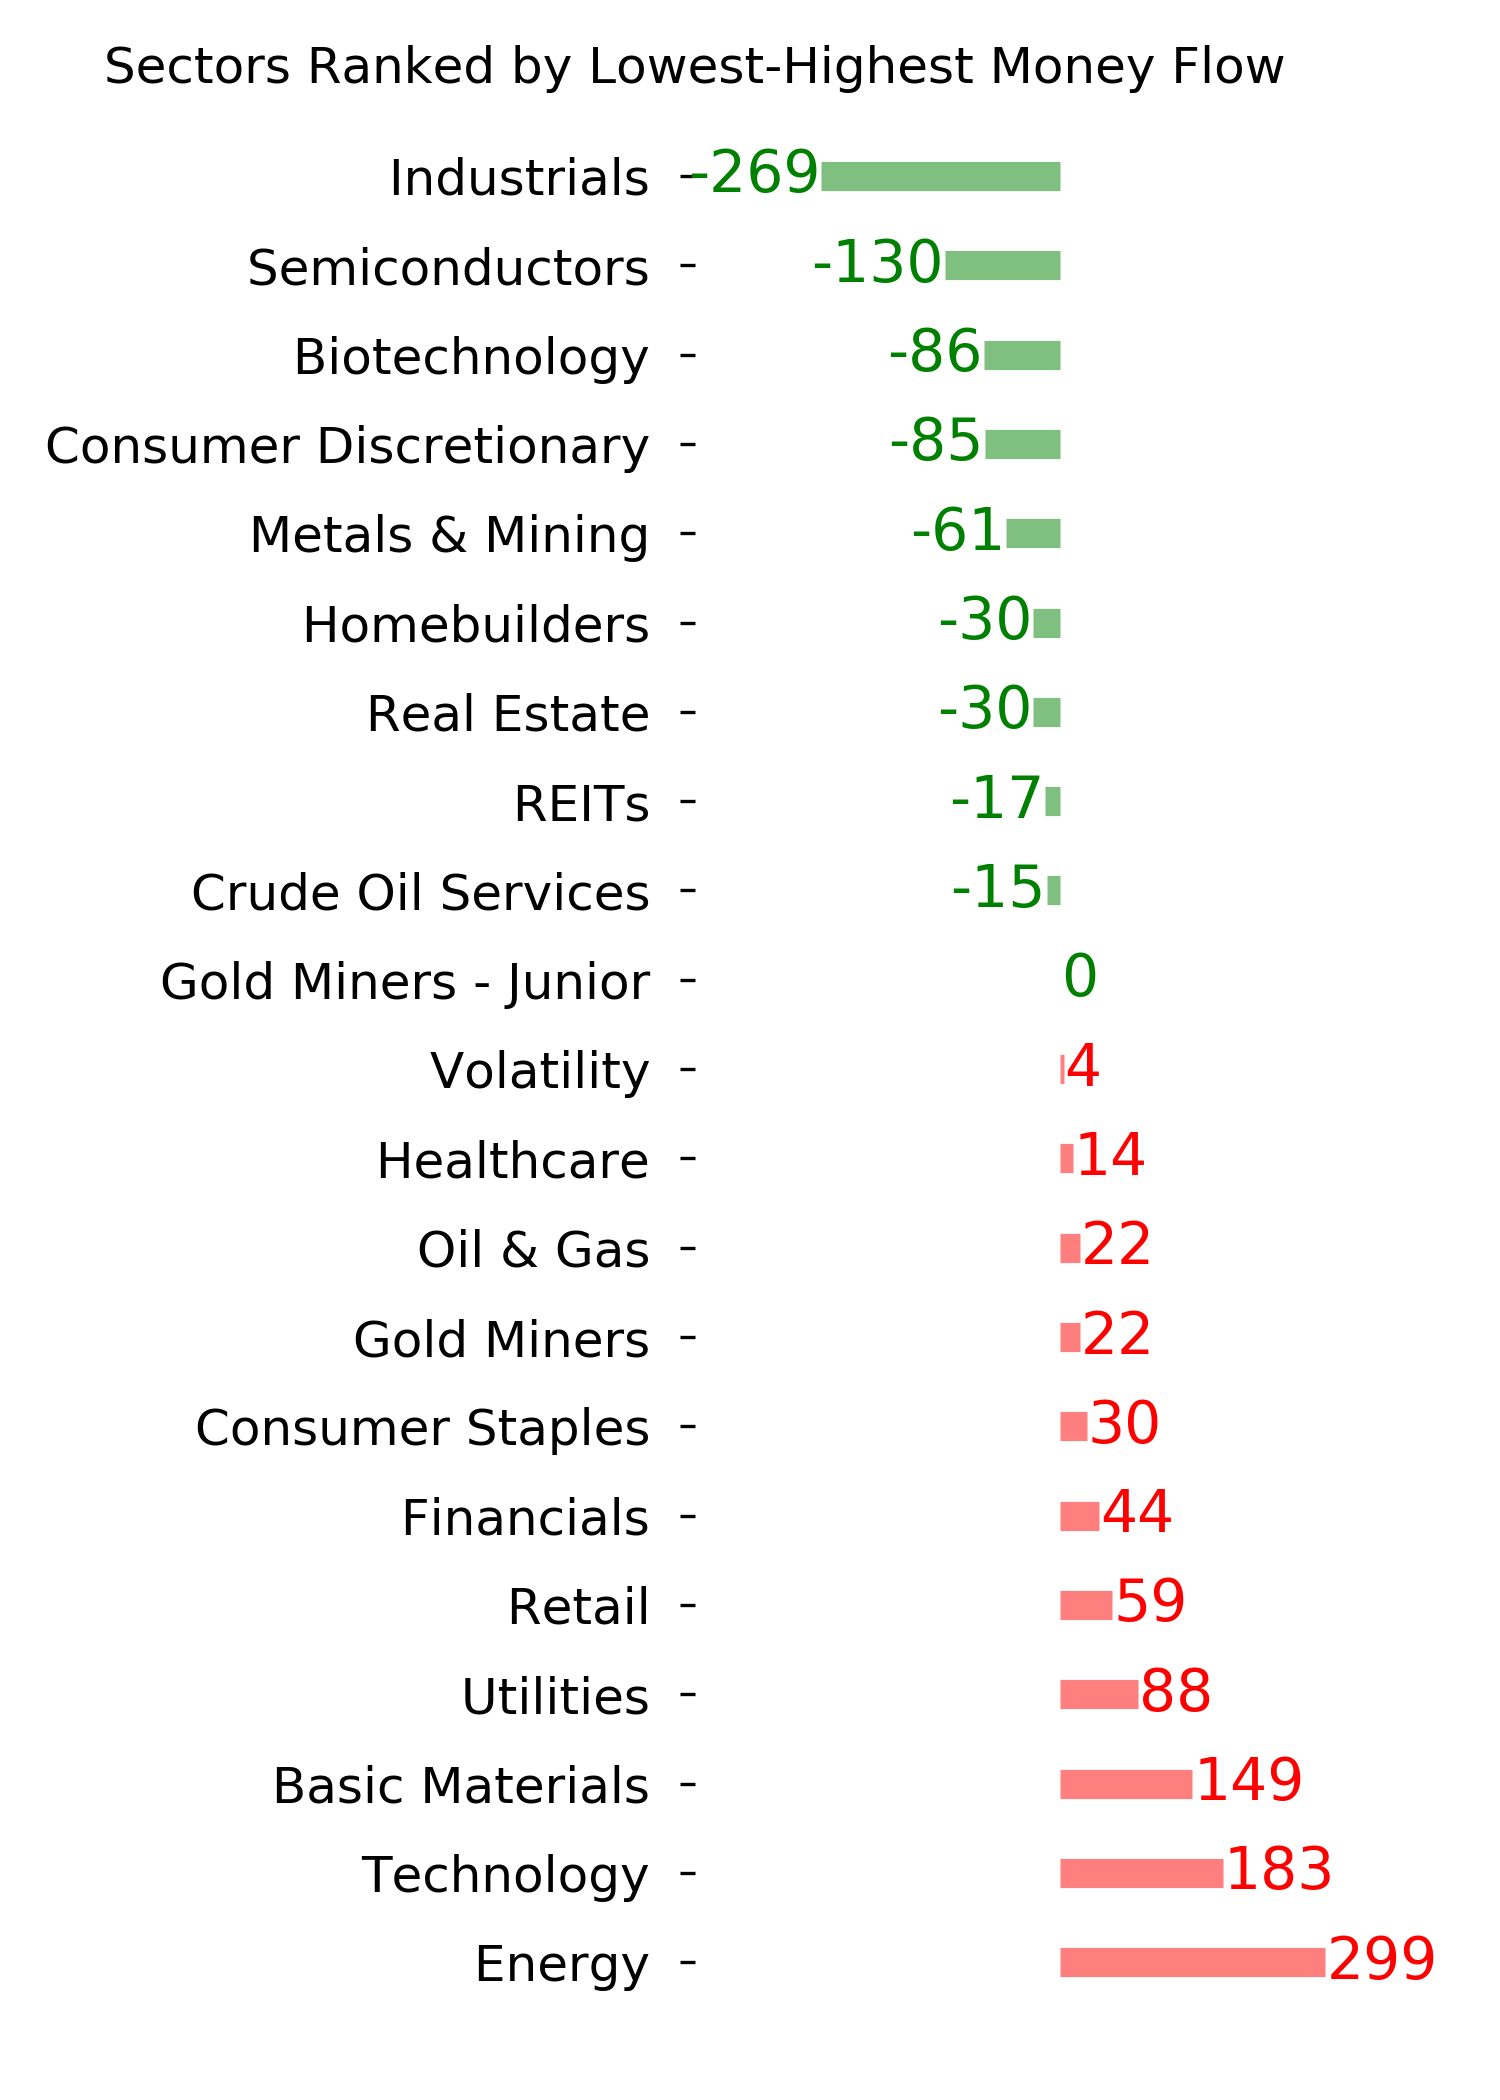
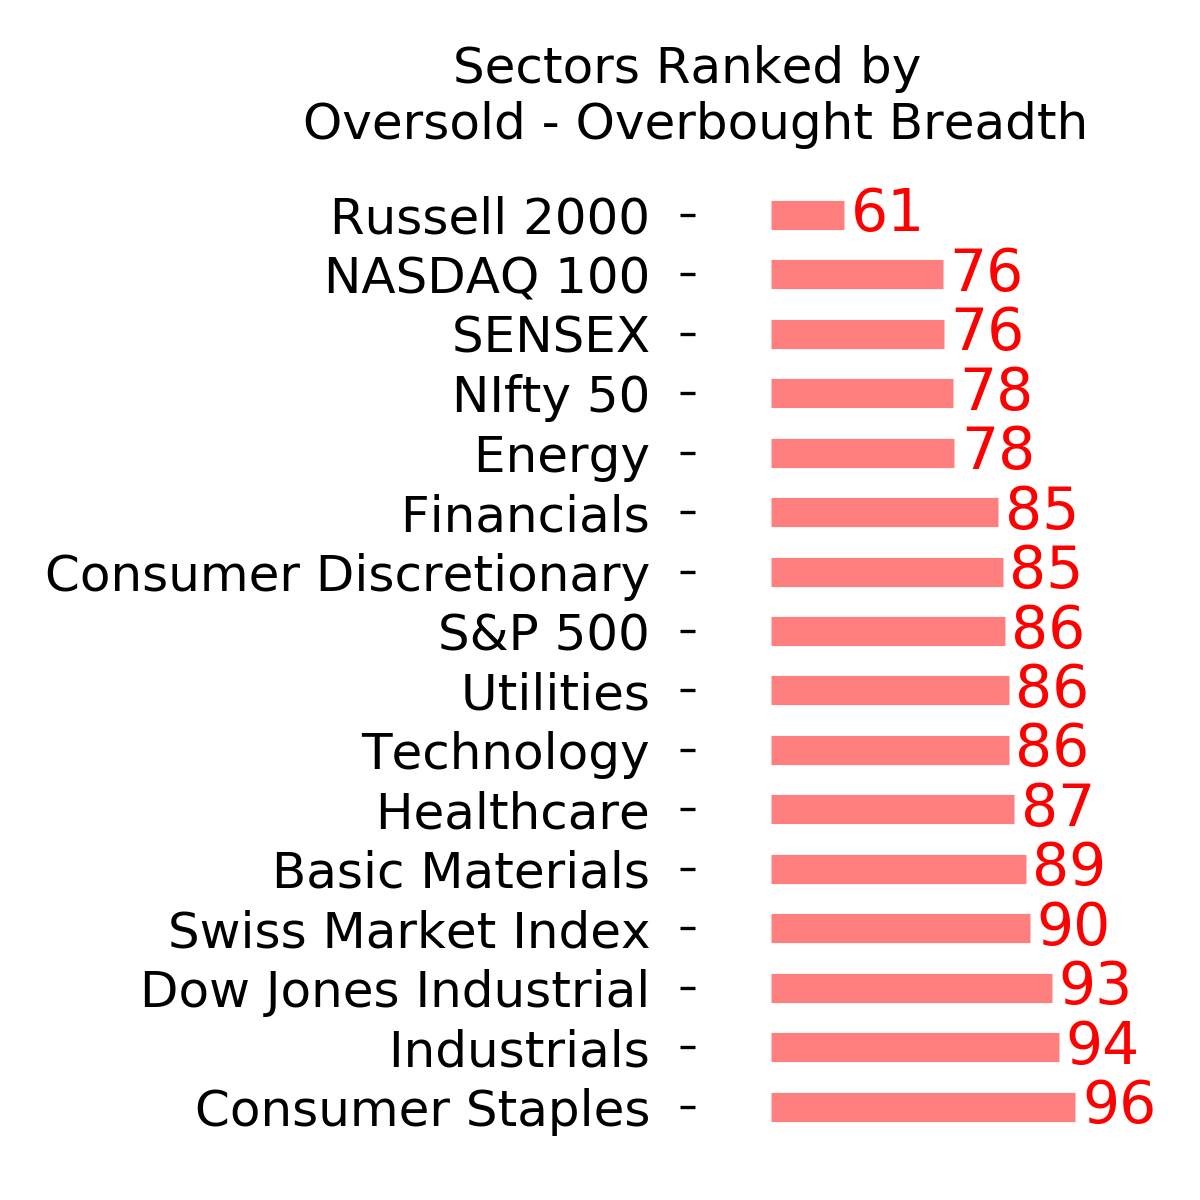
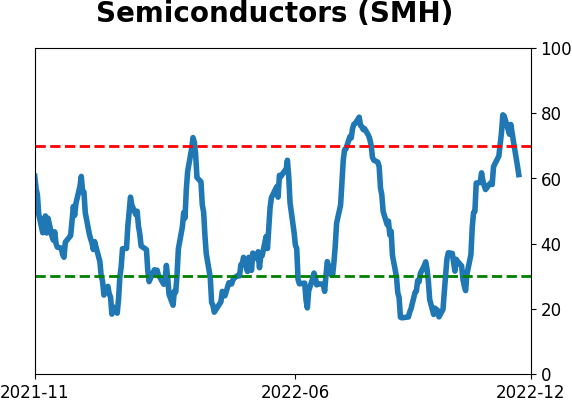
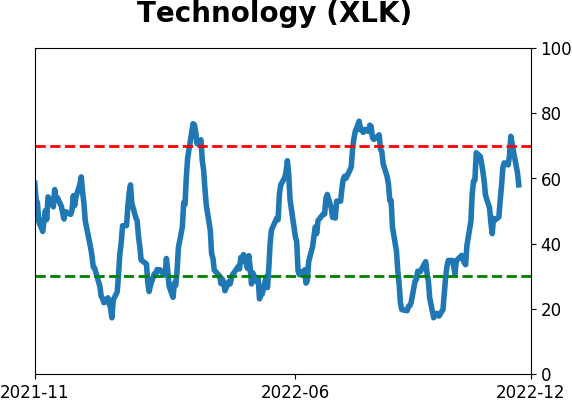
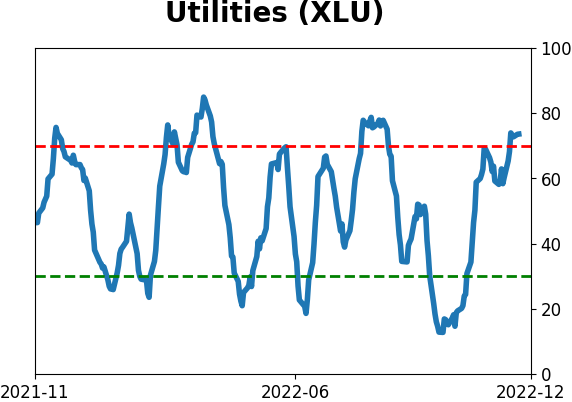
Sector ETF's - 10-Day Moving Average
|
|
|
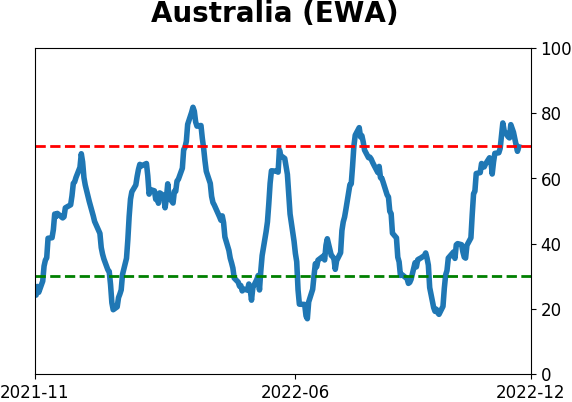
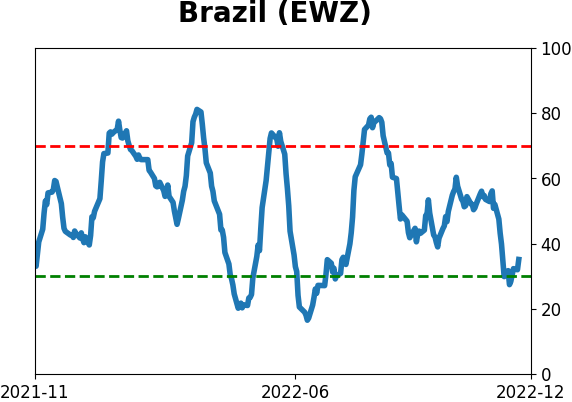
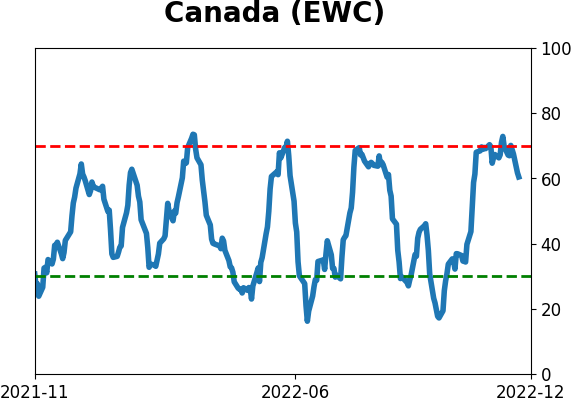
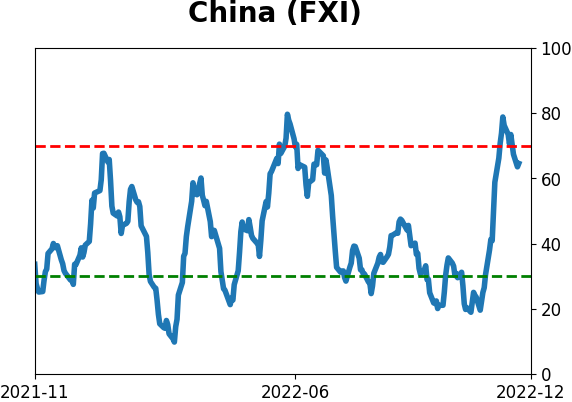
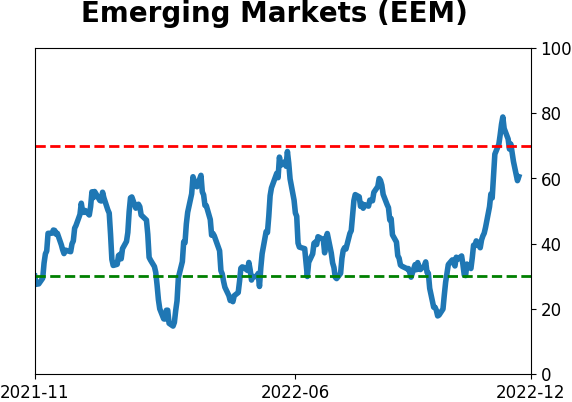
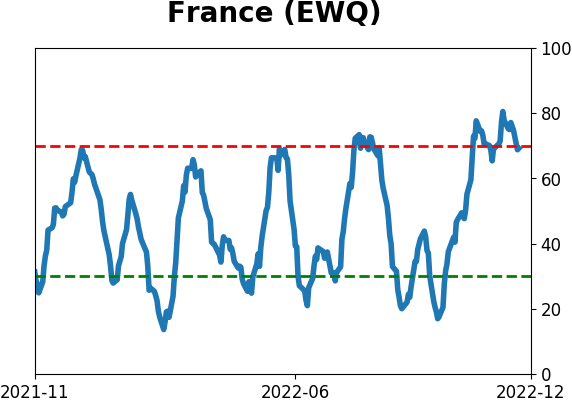
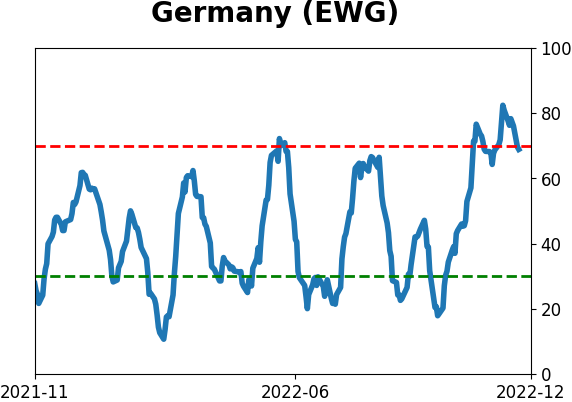
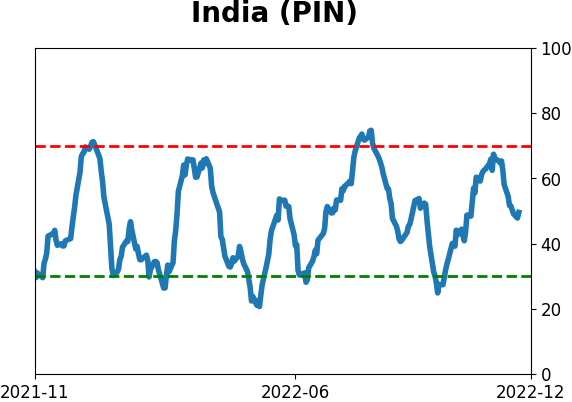
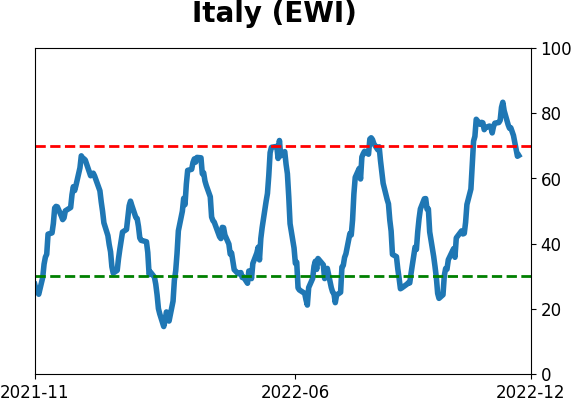
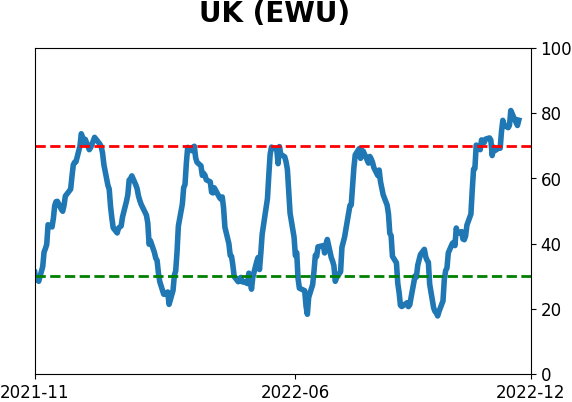
Country ETF's - 10-Day Moving Average
|
|
|
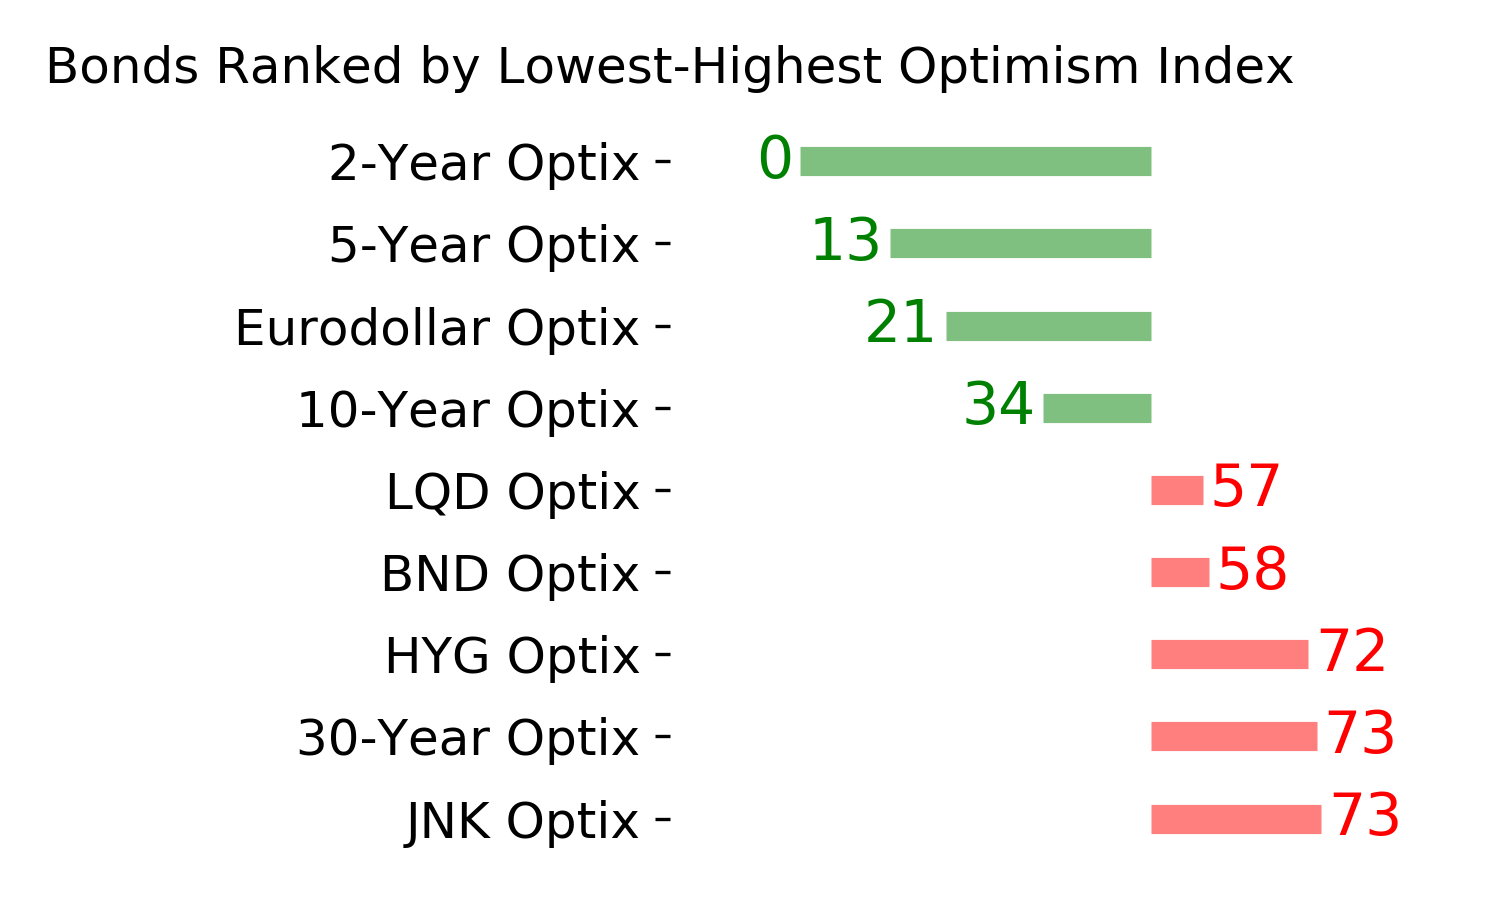
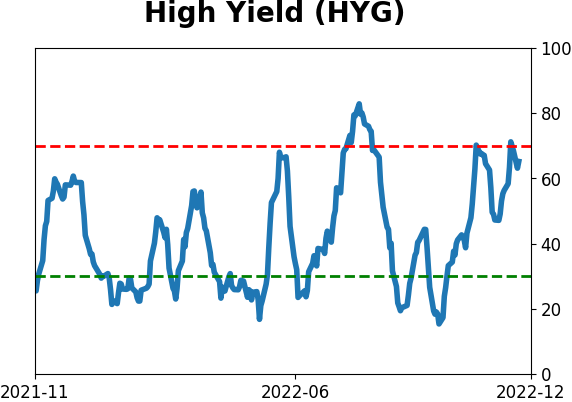
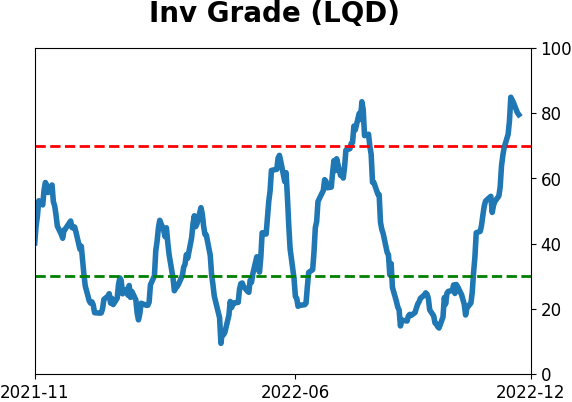
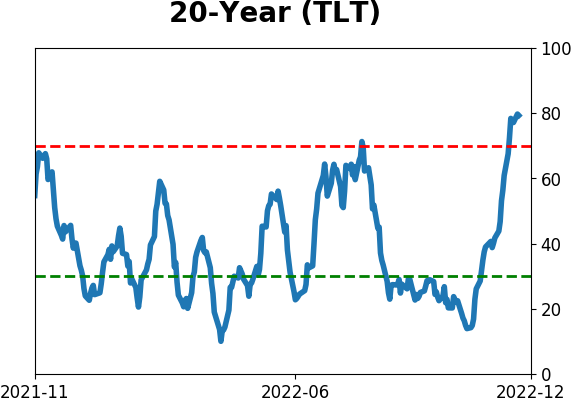
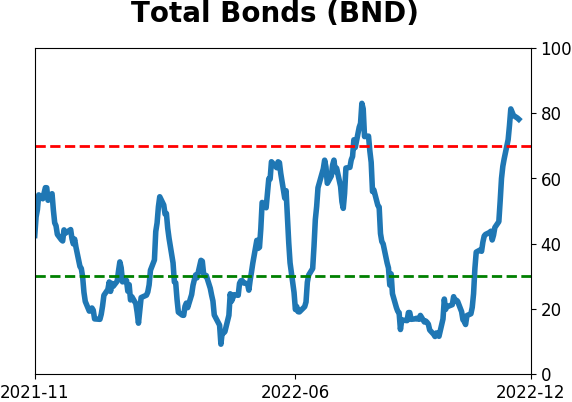
Bond ETF's - 10-Day Moving Average
|
|
|
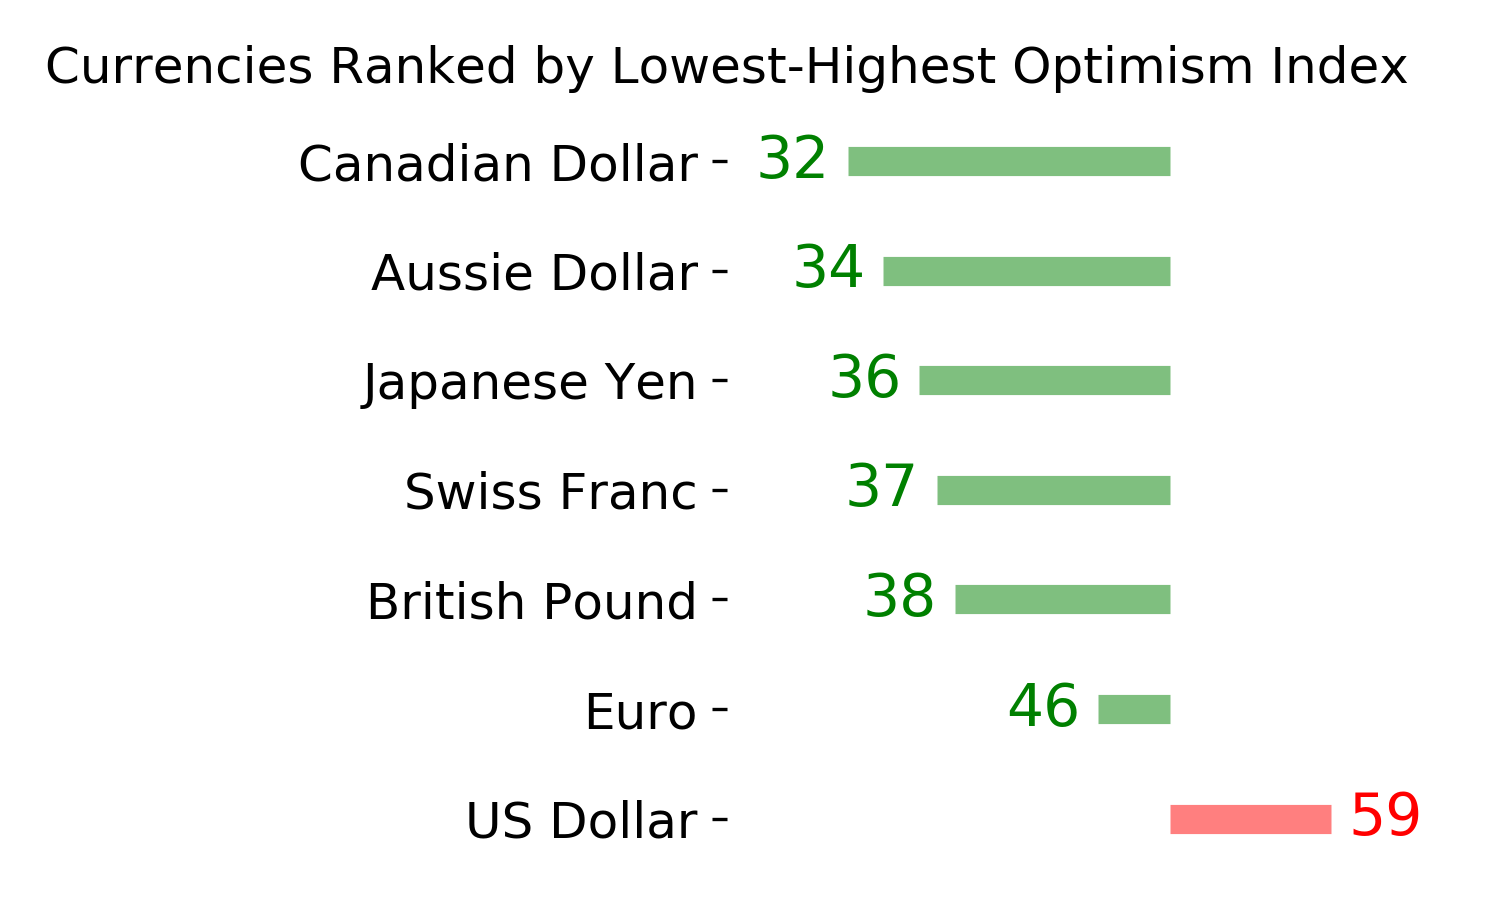
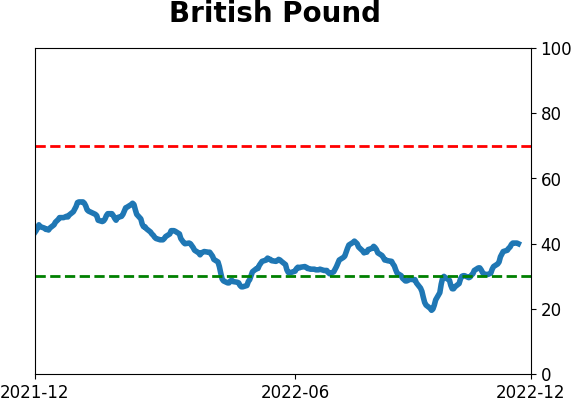
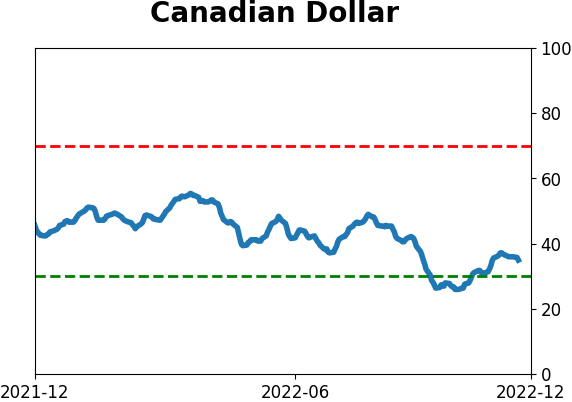
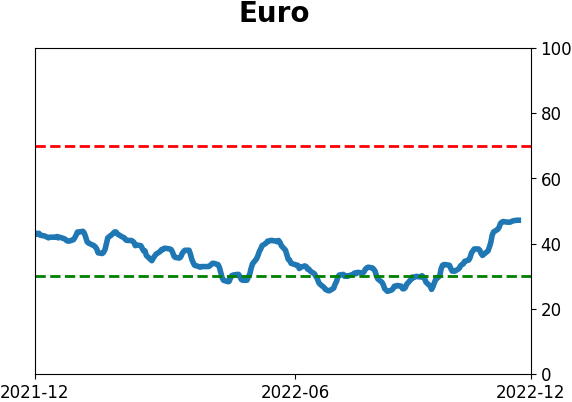
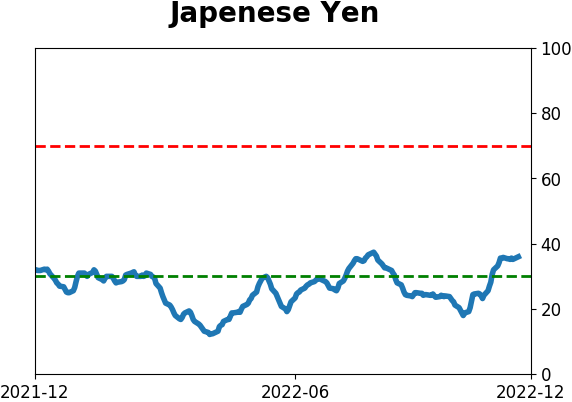
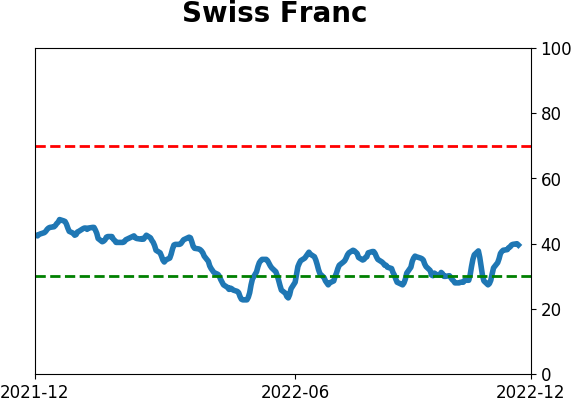
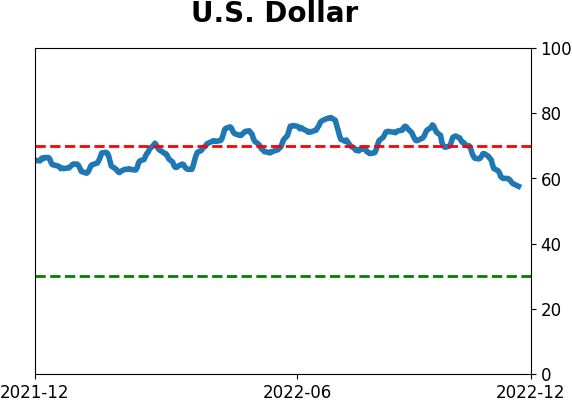
Currency ETF's - 5-Day Moving Average
|
|
|
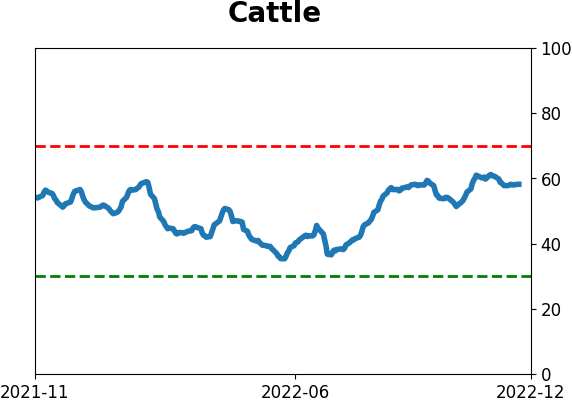
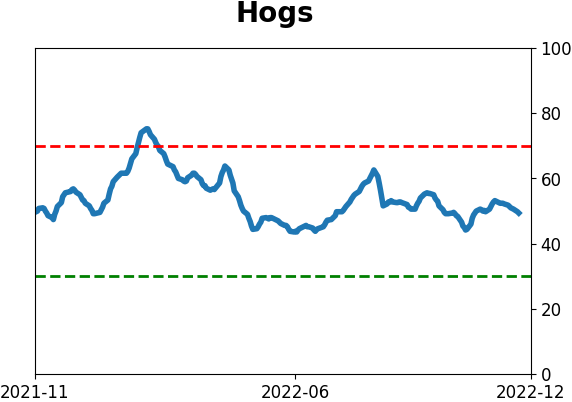
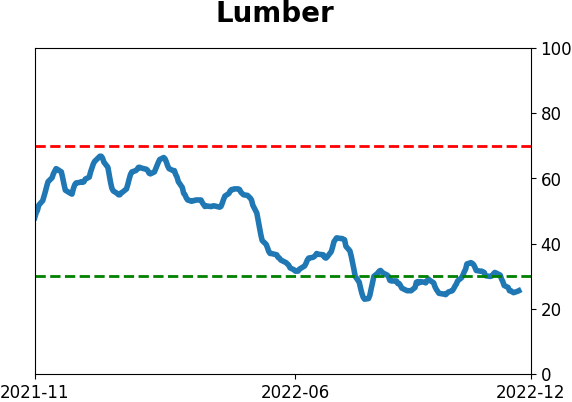
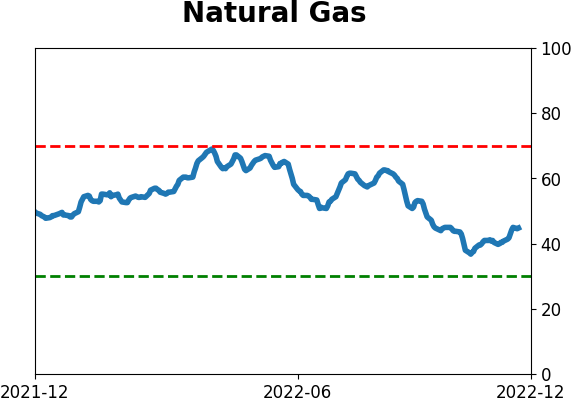
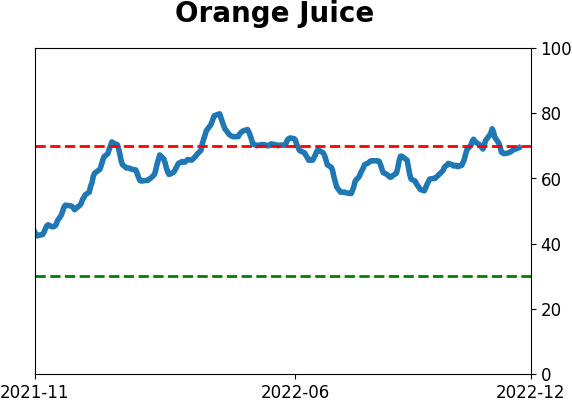
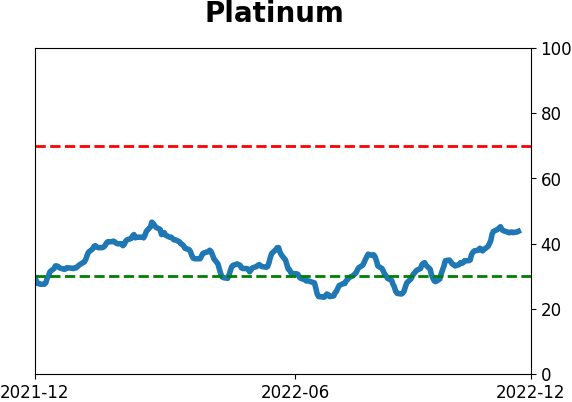
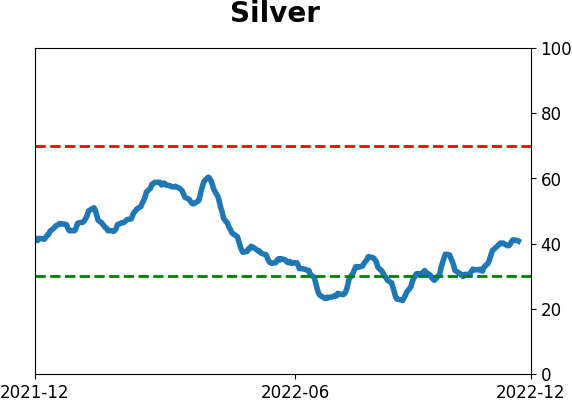
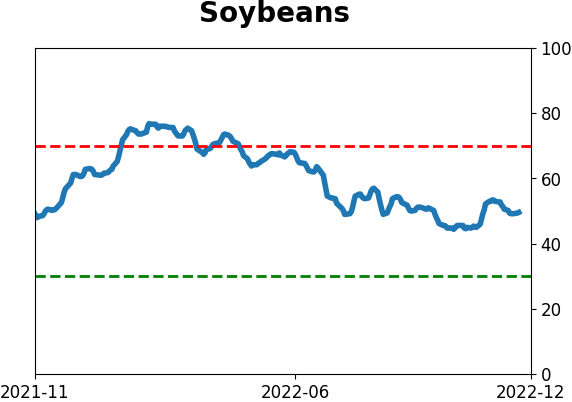
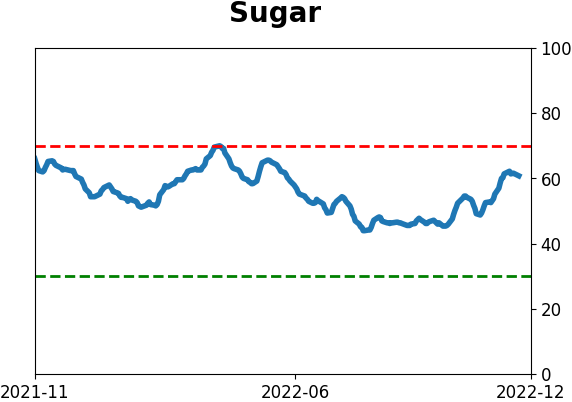
Commodity ETF's - 5-Day Moving Average
|
|