Headlines
|
|
Investors continue to shovel money into cash assets at a furious pace:
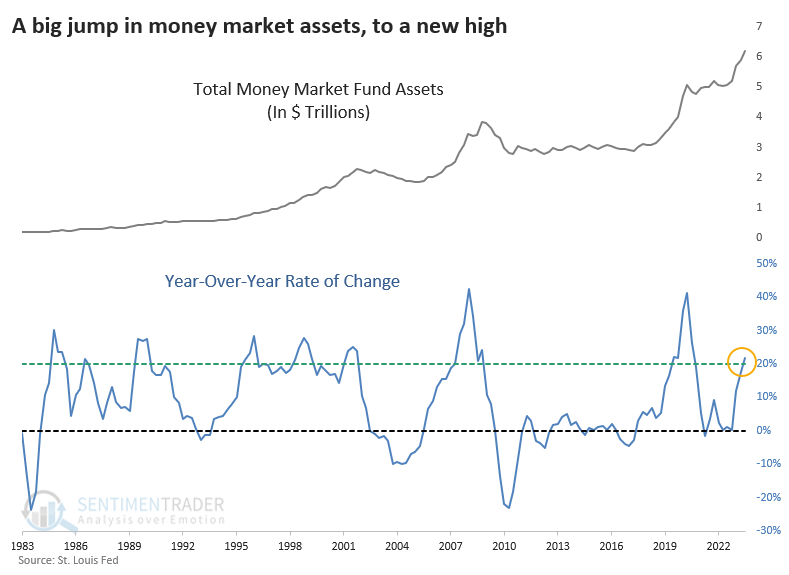
At the end of October, assets in money market funds likely totaled more than $6.1 trillion, a record high and 20% above the level from a year ago. Big jumps in money market assets have preceded some inconsistently tough stock markets, but also long-term S&P 500 returns that were above average.
|
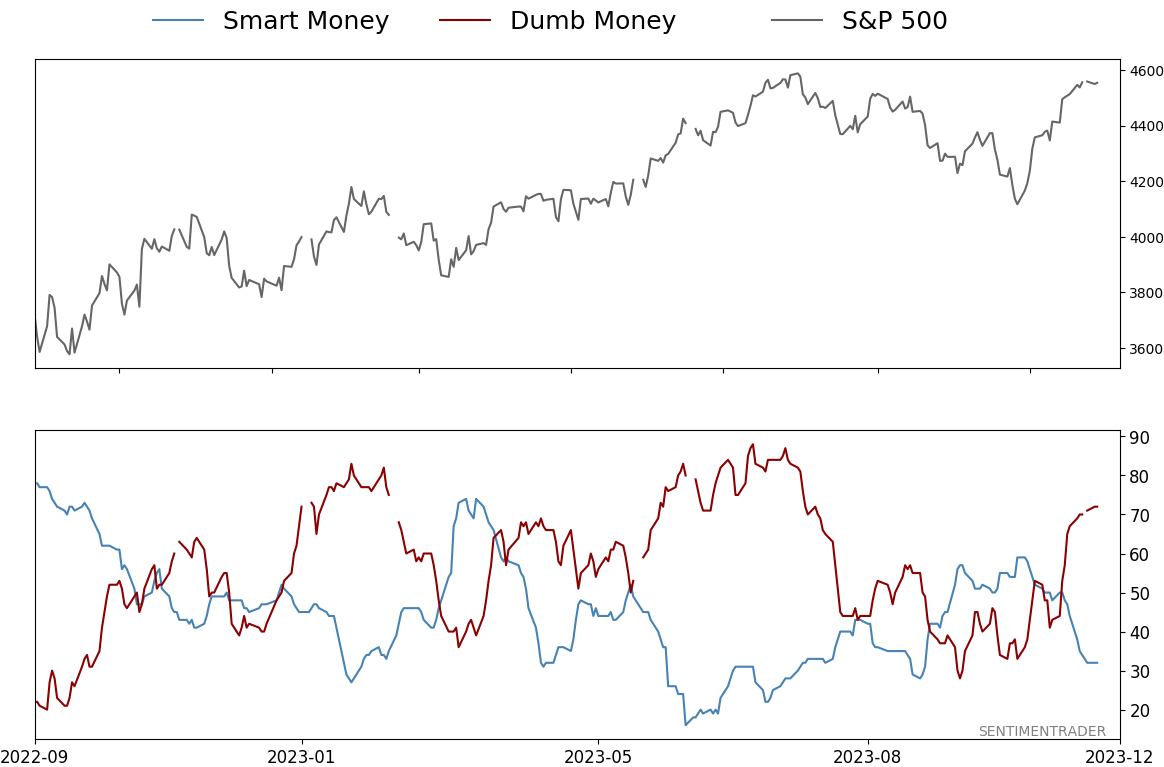
Smart / Dumb Money Confidence
|
Smart Money Confidence: 32%
Dumb Money Confidence: 72%
|
|
Risk Levels
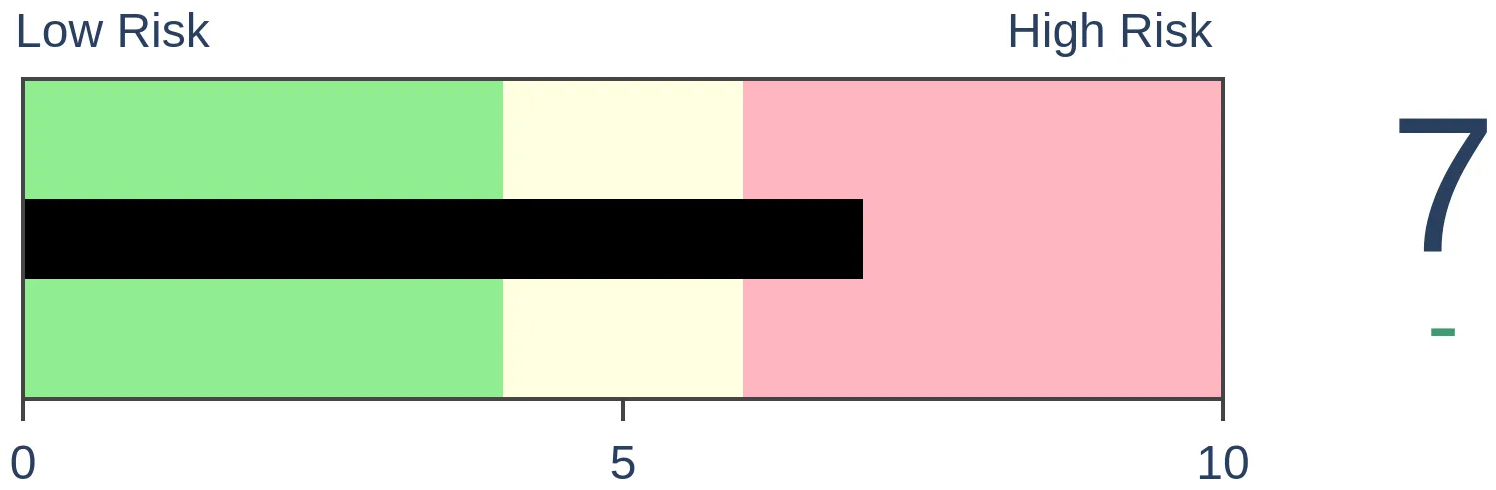
Stocks Short-Term
|
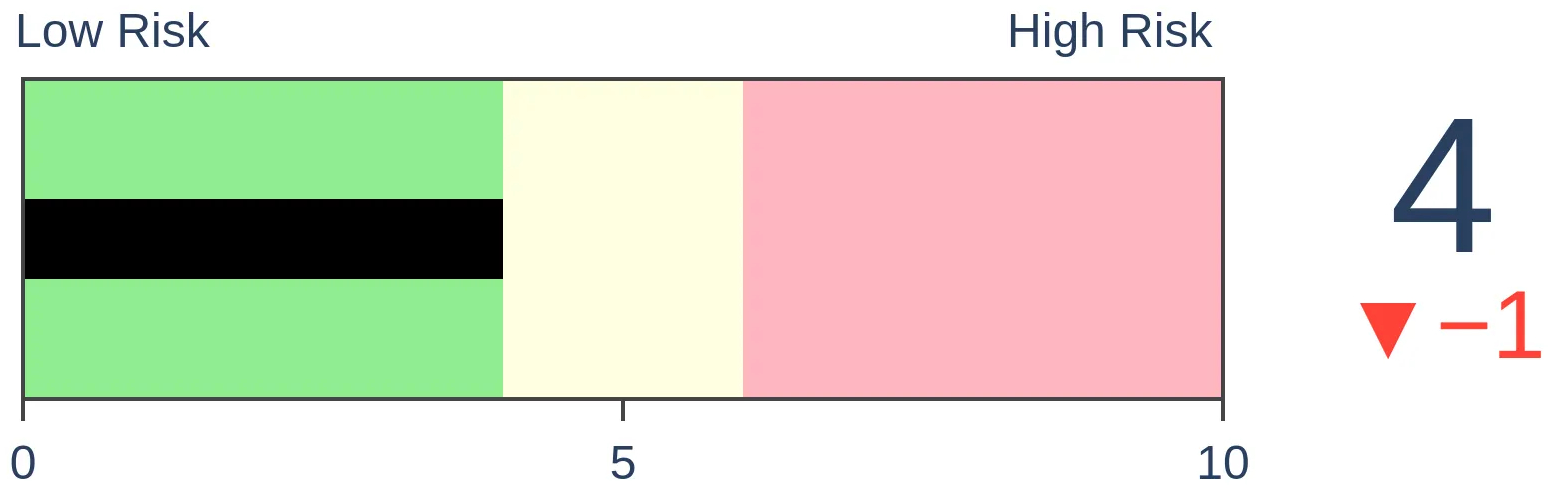
Stocks Medium-Term
|
|
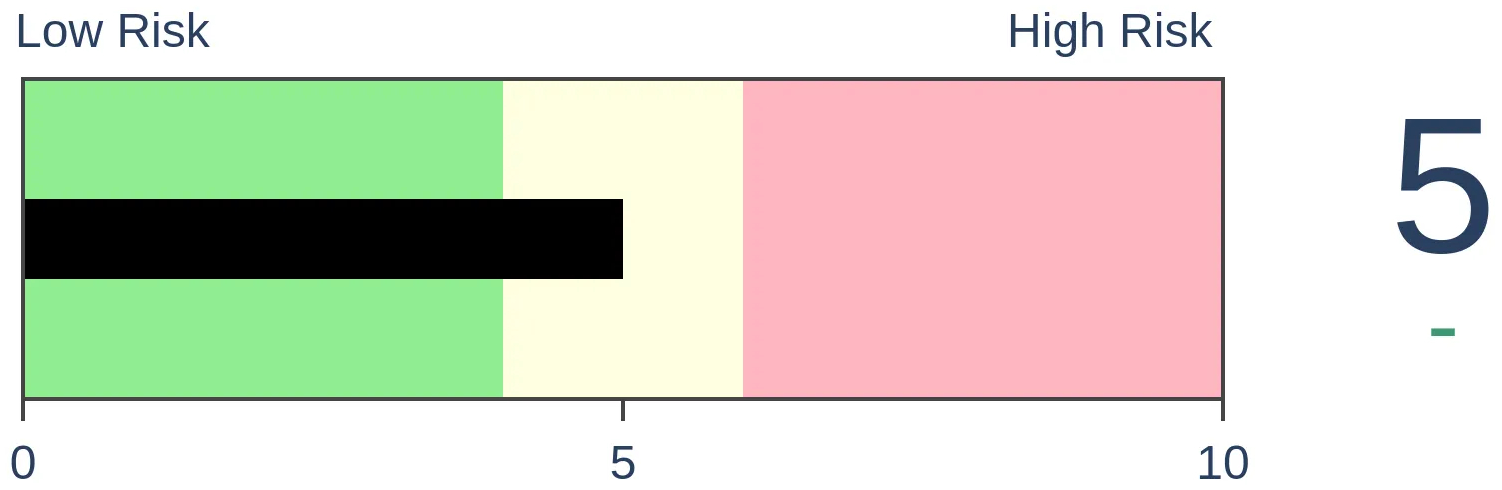
Bonds
|
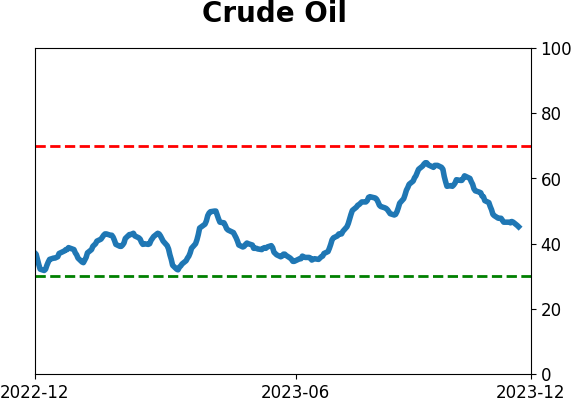
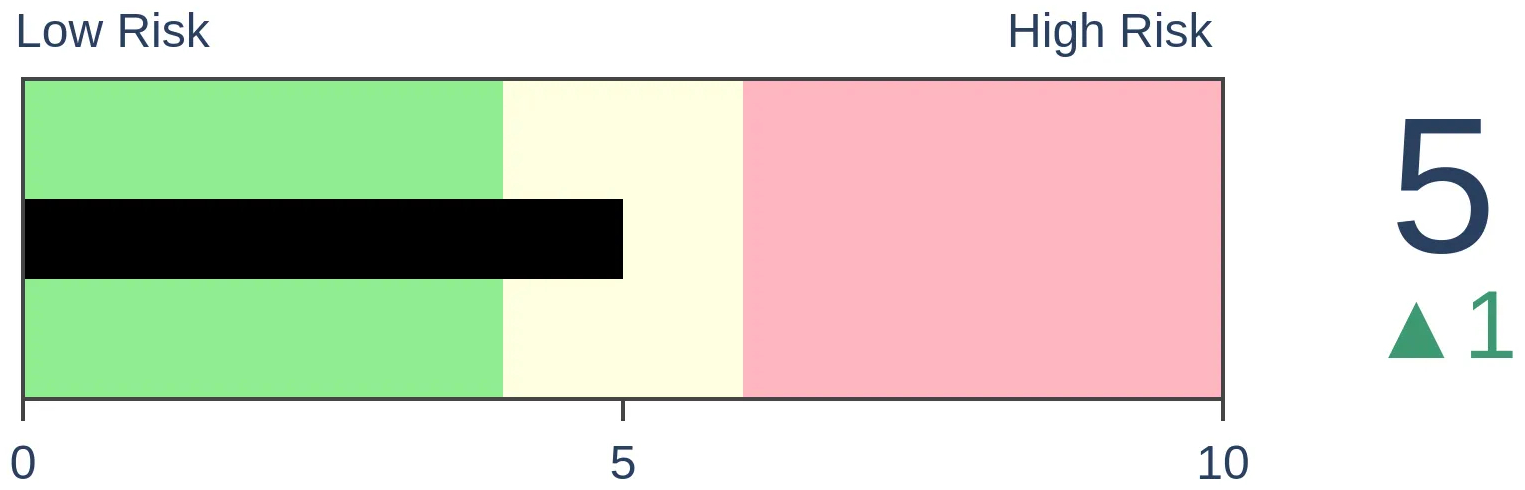
Crude Oil
|
|
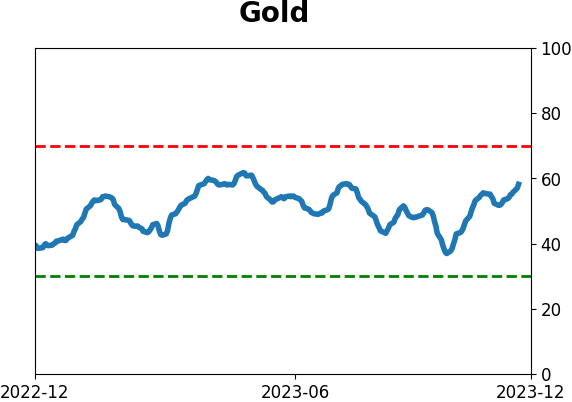
Gold
|
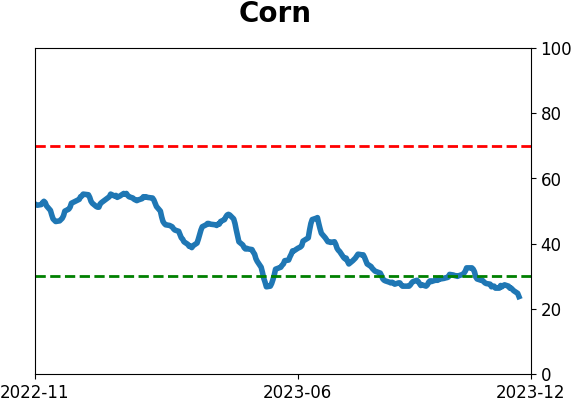
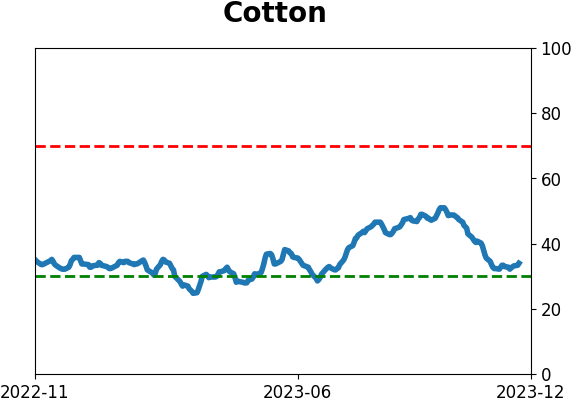
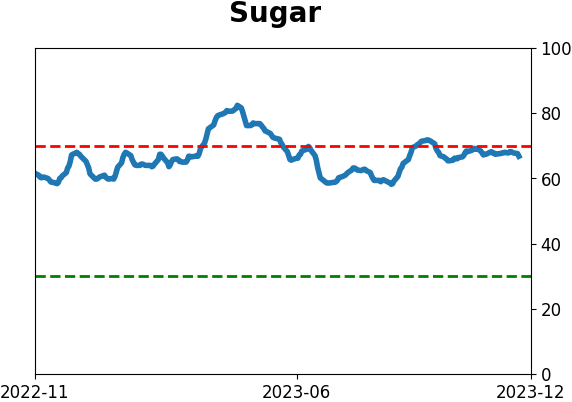
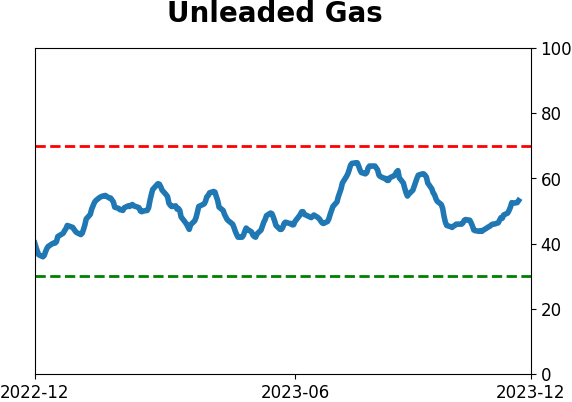
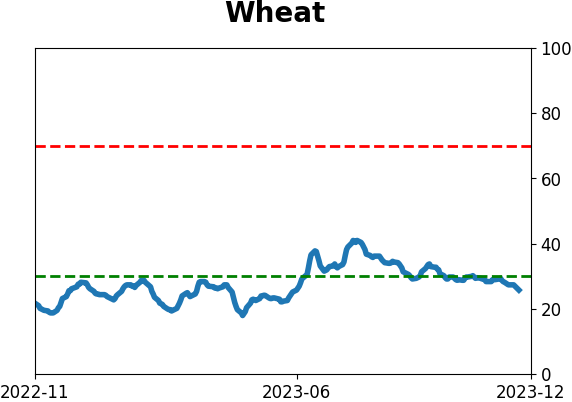
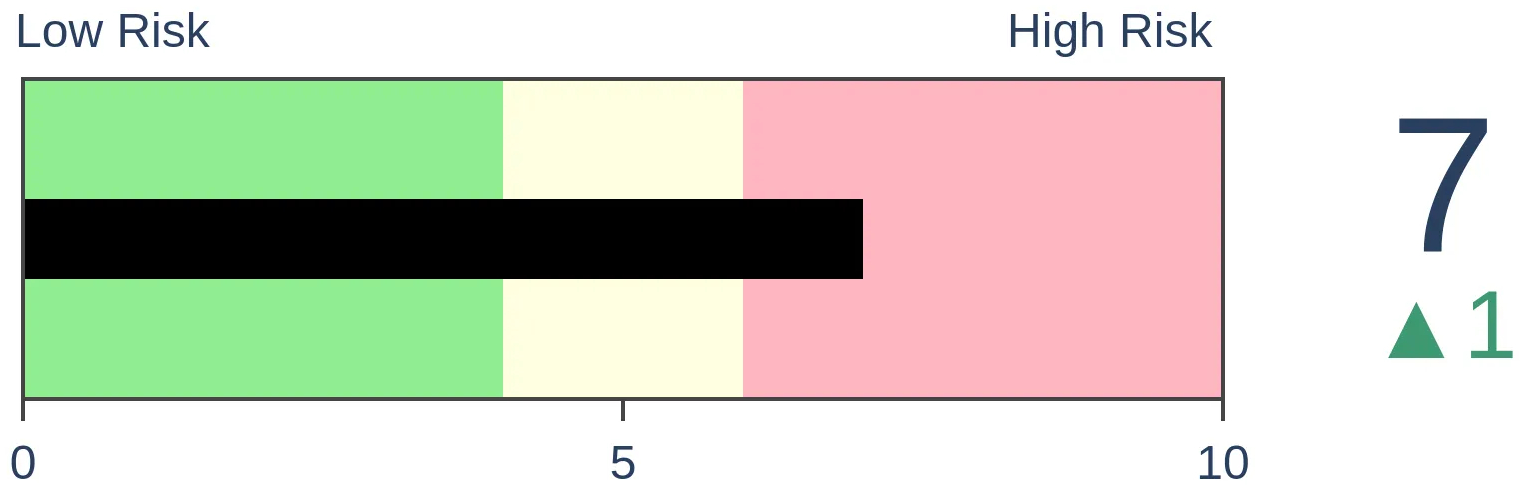
Agriculture

|
|
Research
By Jason Goepfert
BOTTOM LINE
At the end of October, assets in money market funds likely totaled more than $6.1 trillion, a record high and 20% above the level from a year ago. Big jumps in money market assets have preceded some inconsistently tough stock markets, but also long-term S&P 500 returns that were above average.
FORECAST / TIMEFRAME
None
|
Key points:
- Assets in money market funds have grown more than 20% over the past year and hit a record high
- Big jumps in these funds show risk-off investor behavior and have preceded some challenging markets
- But that high risk was over inconsistent time frames and was accompanied by high long-term reward
Unrelenting money market assets hit yet another record
The age-old debate about cash on the sidelines is roaring again. The amount of money investors have been pouring into money market funds has been staggering and shows no signs of letting up; the latest weekly figure from the Investment Company Institute shows yet another record high.
As The Wall Street Journal noted:
Some on Wall Street see the cash as a bullish signal and a potential tailwind for stocks and bonds if the inflation outlook continues to improve. Others say some of that money has simply shifted to higher-yielding money markets from traditional bank accounts. They question the idea that the money is waiting on the sidelines and ready to enter the market.
If we extrapolate a long-term data series from the Federal Reserve to include data as of quarter-end, money market assets totaled nearly $6.2 trillion. That's enough - sitting in money market funds alone - to pay off nearly 1/3 of all household debt obligations. Or, investors could take the entire Russell 2000 private and still have a cool $4 trillion left over.
Not only is the absolute level high, it's rising at a faster rate. Assets at the end of Q3 were likely 20% higher than this time last year.
The second anyone suggests that stocks should rise because there is "money on the sidelines" or "a lot of dry powder," they will be smacked by the market police, who relish pointing out that there is a seller for every buyer. There is never any cash coming off the sidelines.
Okay, fine. We've never made that argument, anyway (I think). More than anything, money market assets can serve as a risk appetite gauge. If investors are moving into cash, they are feeling relatively risk-off. That's why we almost always see money market assets rise during recessions and bear markets.
The argument that it's different this time is compelling because we've never witnessed conditions precisely like now. Investors have had to transition from rates at essentially zero to above what stocks can offer, all in a year and a half.
Big jumps in money market assets have preceded high risk...and high reward
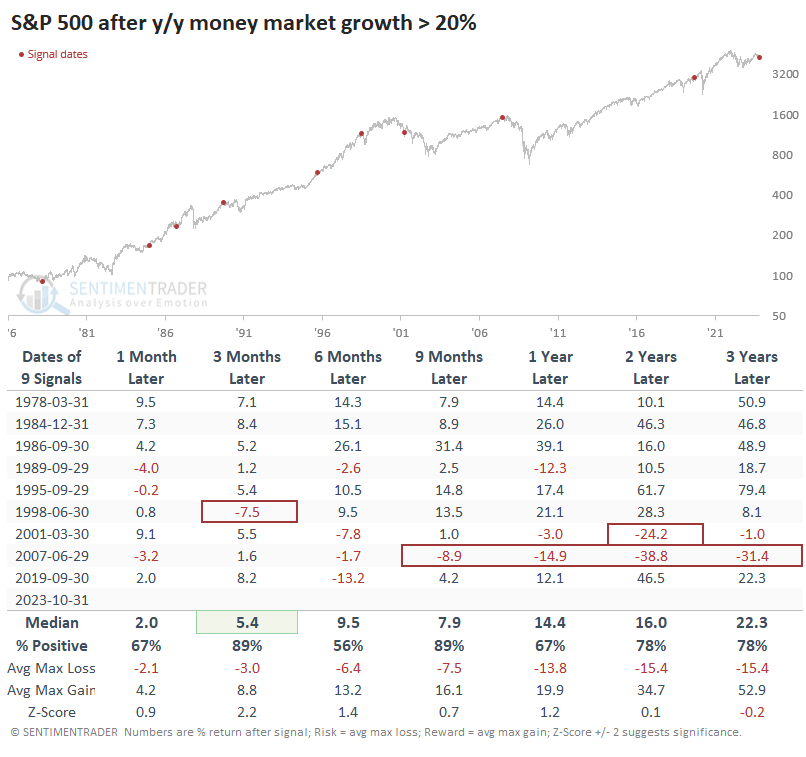
If we take the 20% growth rate in money market assets at face value, the table below shows that long-term returns in the S&P 500 were decent, with the last two protracted bear markets being the exceptions.
Three and nine months later, there was only a single loss. Still, investors seemed prescient in ramping up their cash levels ahead of rocky markets in 1990, 1998, 2002, 2008, and 2020, even if losses were unevenly spread after those dates.
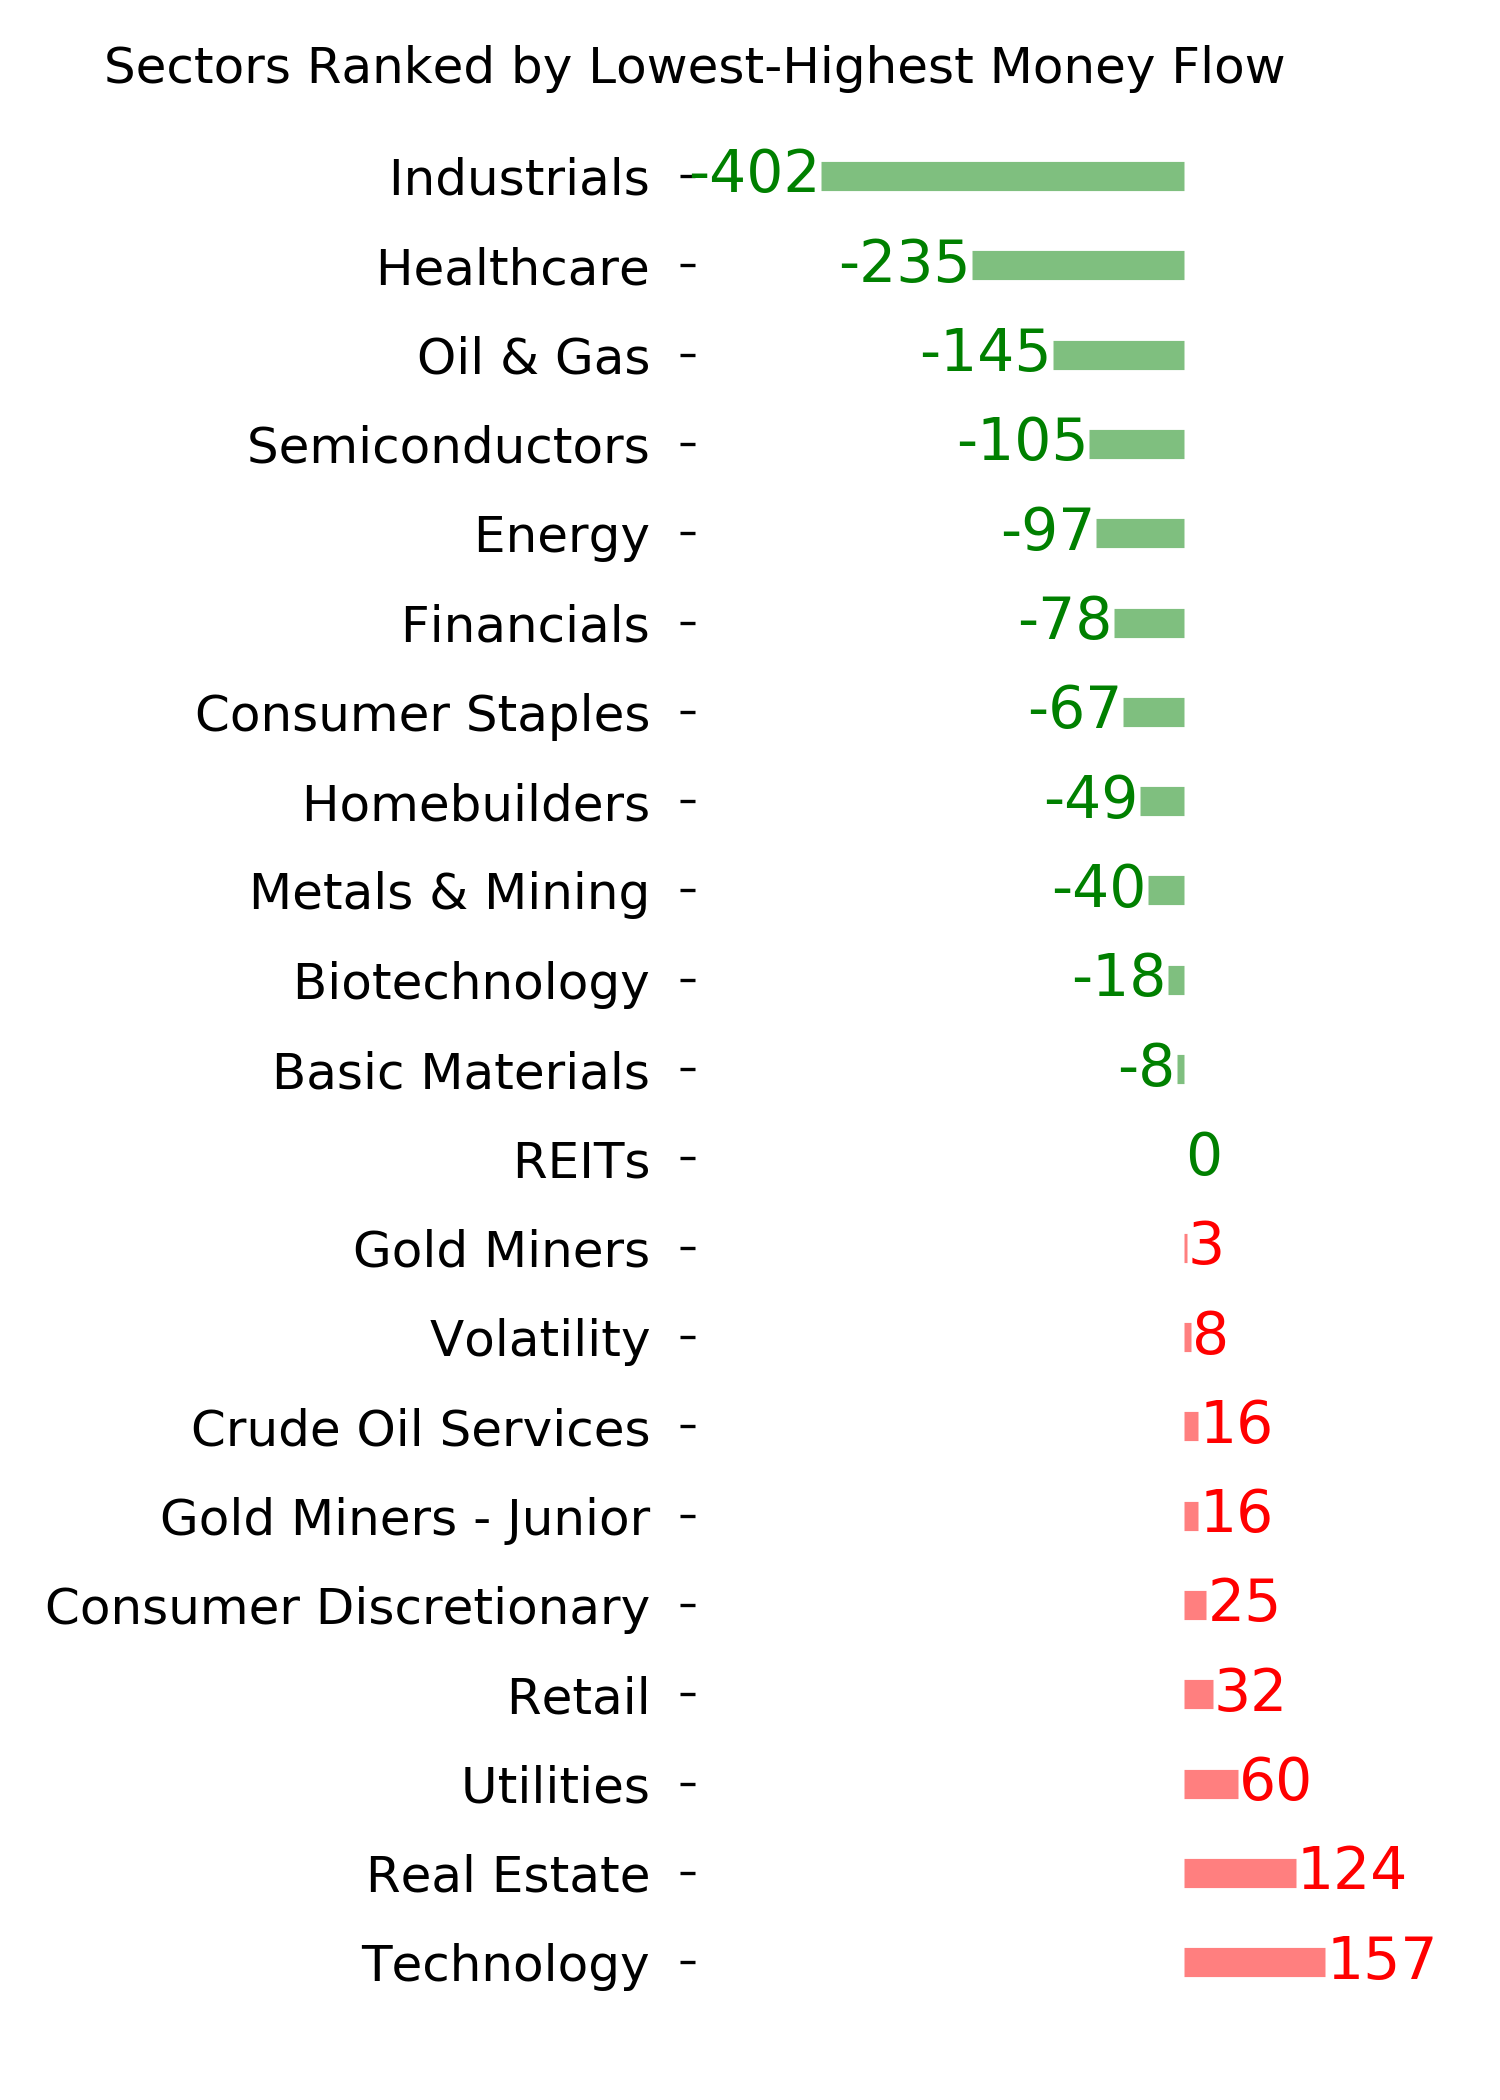
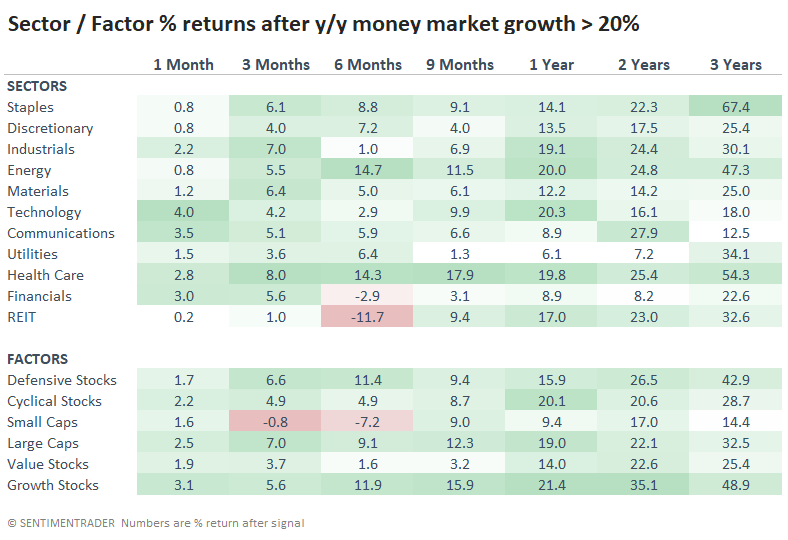
Since a rapid and significant increase in money market assets tended to precede some tough markets, it's unsurprising that some defensive sectors showed among the strongest returns. Consumer Staples and Health Care were standouts.
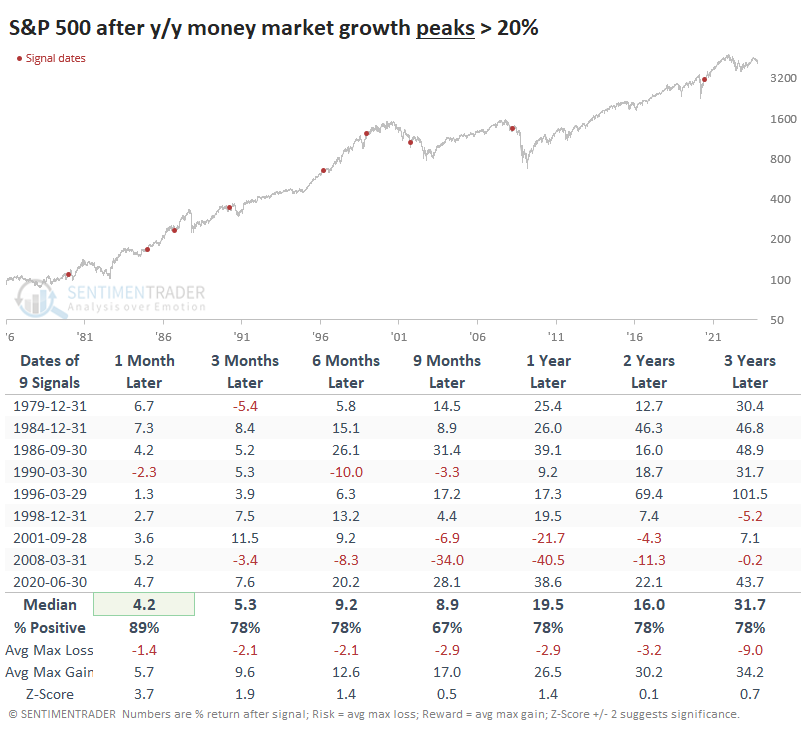
Interest rates are easing, and Wall Street is increasingly expecting the next Fed move to be a cut, so it's entirely likely that money market assets have peaked or are close to it. If we waited for money market assets to peak, it helped to lessen some of the risk. Since markets are cruel, it also lessened reward on longer time frames. Even if we had patience and perfect knowledge of when assets would peak, it didn't prevent us from suffering heavy losses in 2002 or 2008.
What the research tells us...
We will avoid the suggestion that stocks should rise because investors are sitting on a bunch of cash that's likely to find its way to the stock market. We would suggest that the yields offered are high enough to entice a lot of people to park their money there instead of gambling on stocks or anything else. That's a sign of apprehension that tends to lead to above-average long-term returns for stocks.
The biggest problem is that when money market assets rise quickly, it has preceded some really tough markets. And the problem with that, for bears, is that "really tough" has been really inconsistent. Sometimes, the tough conditions hit right away, sometimes not for a year or more, and sometimes not at all. The most we can suggest with modest empirical support is that current behavior supports above-average long-term returns and relatively high risk.
Indicators at Extremes
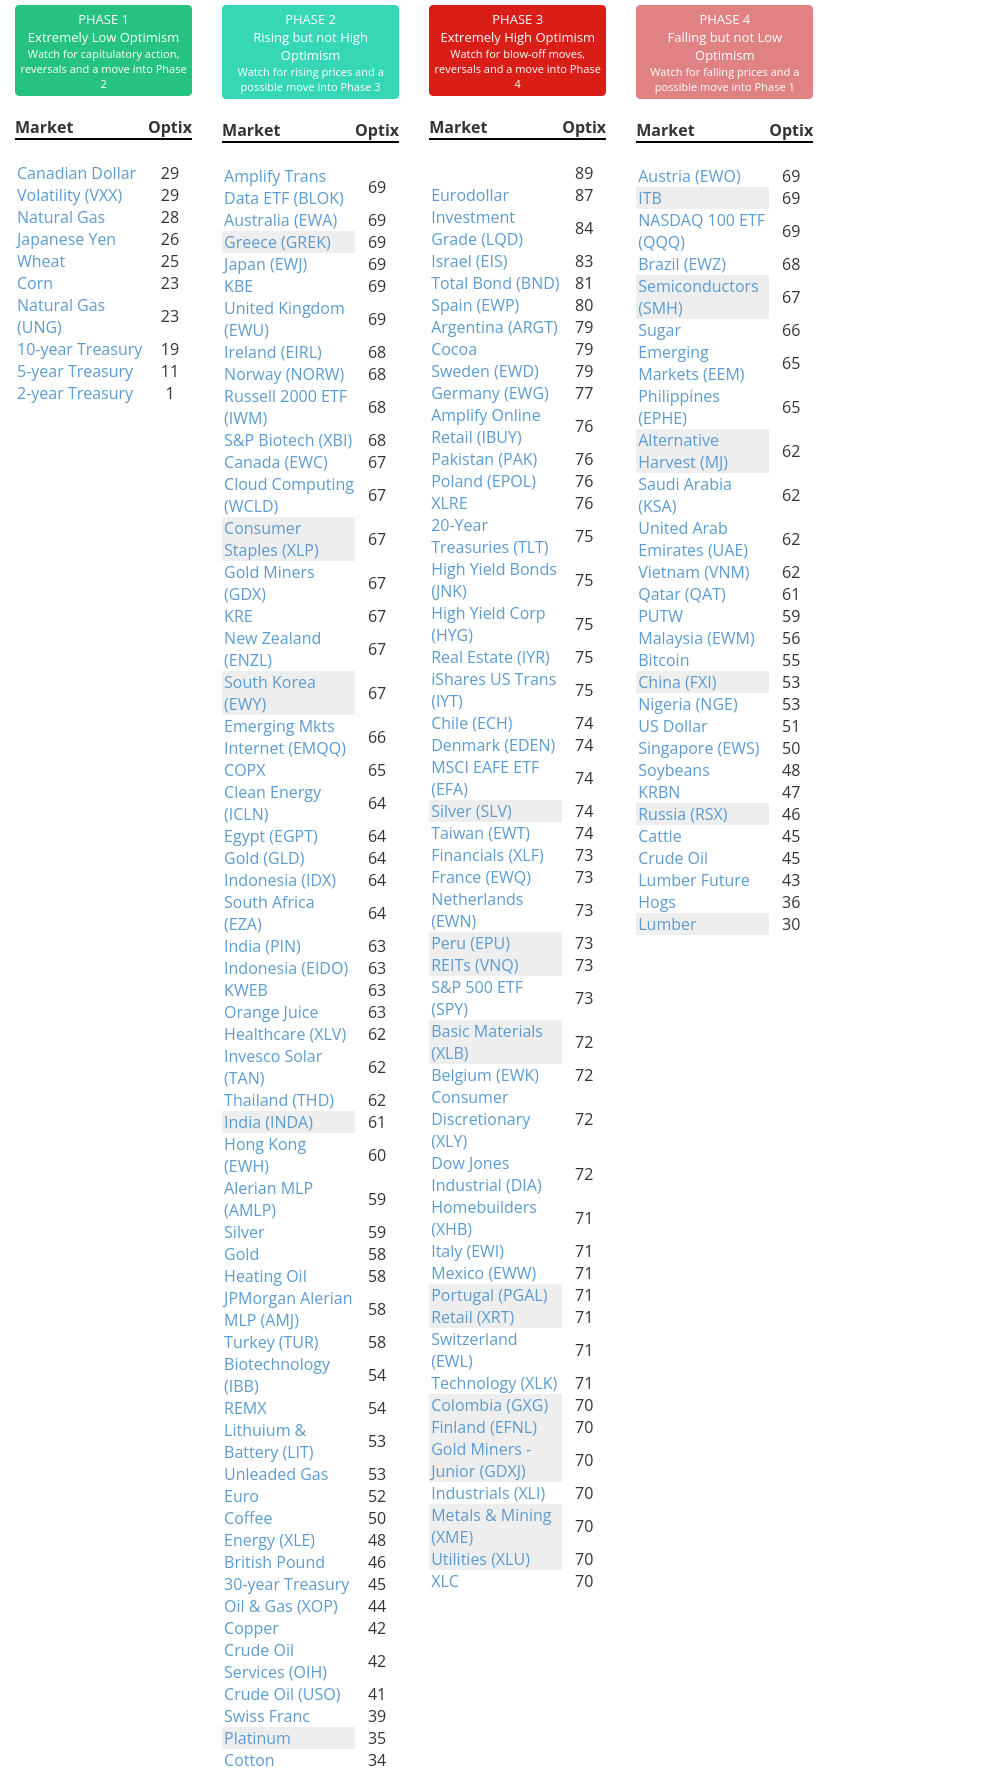
Phase Table
Ranks
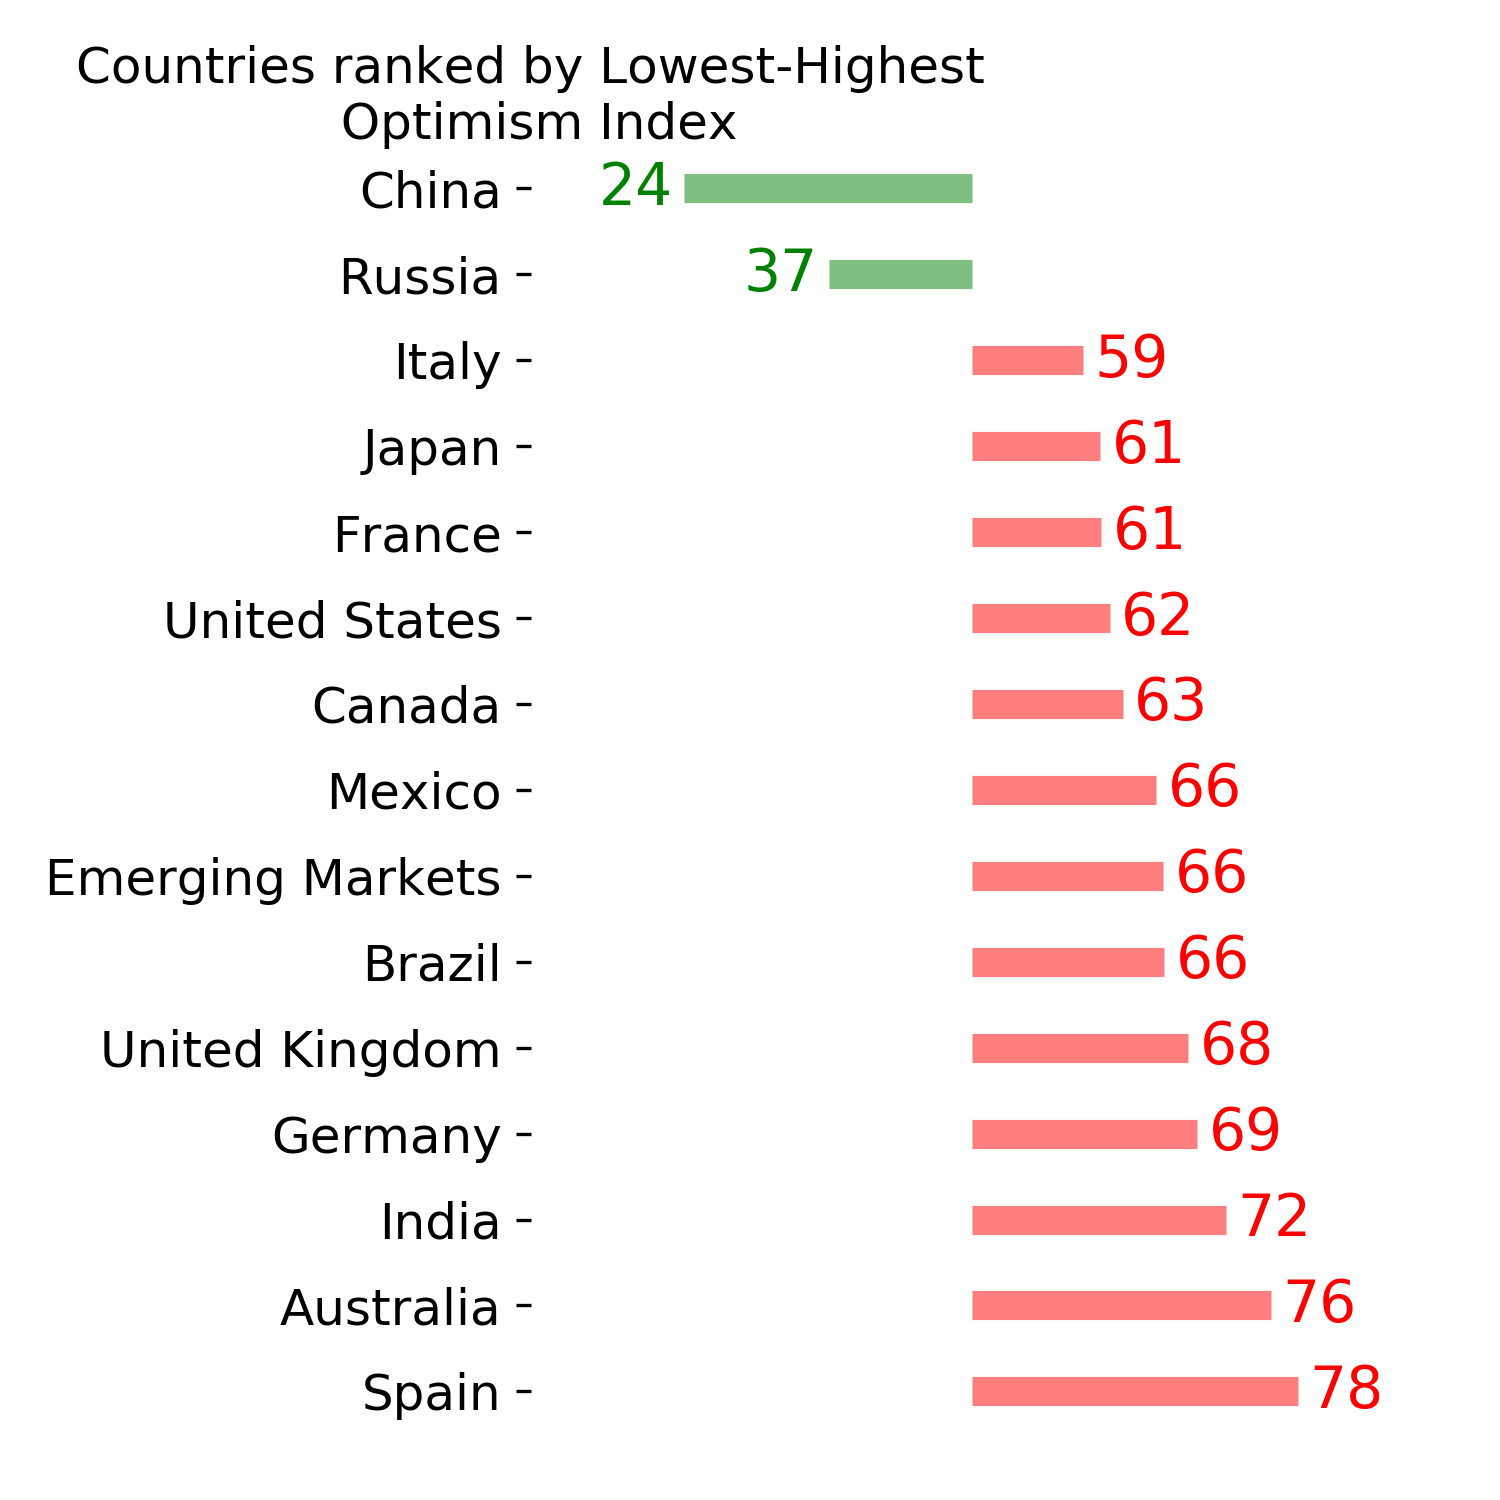
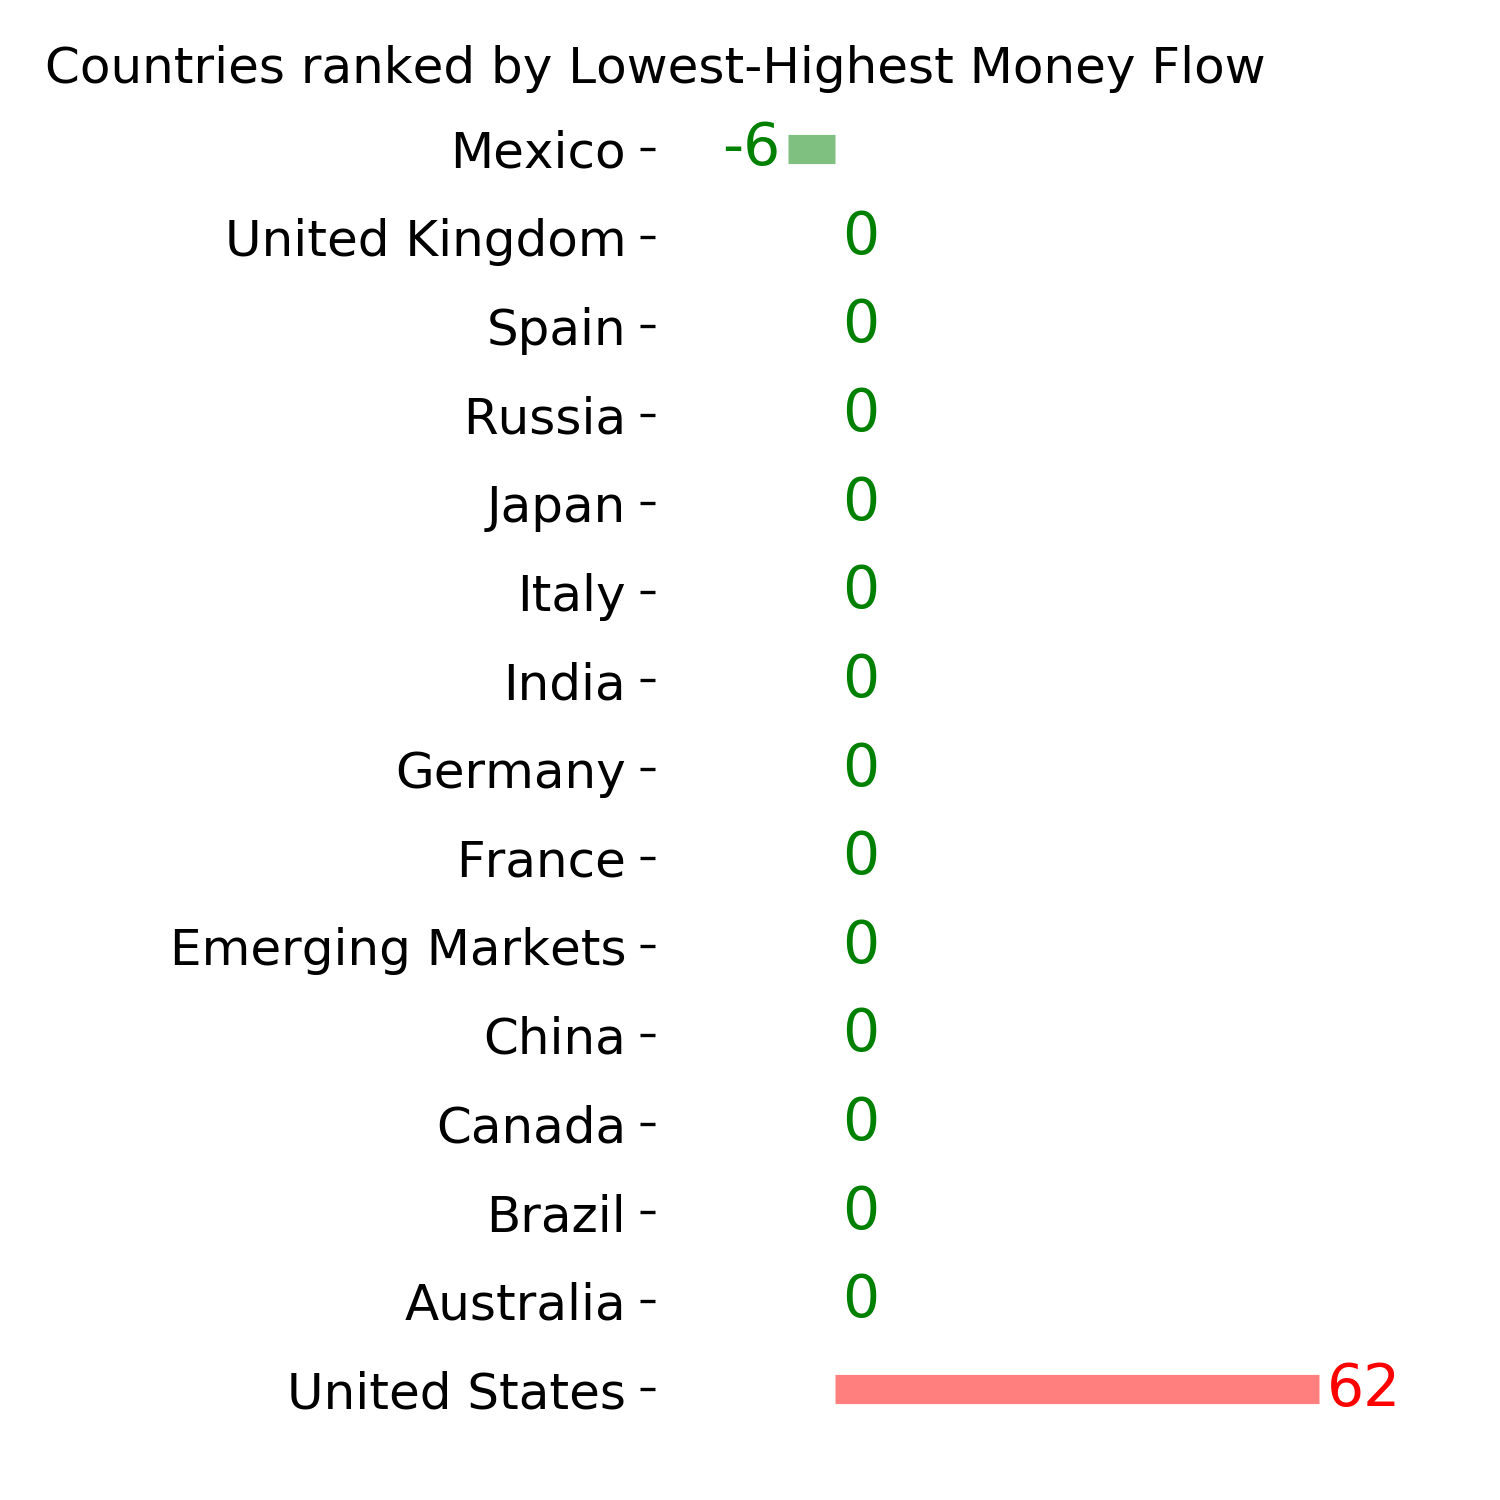
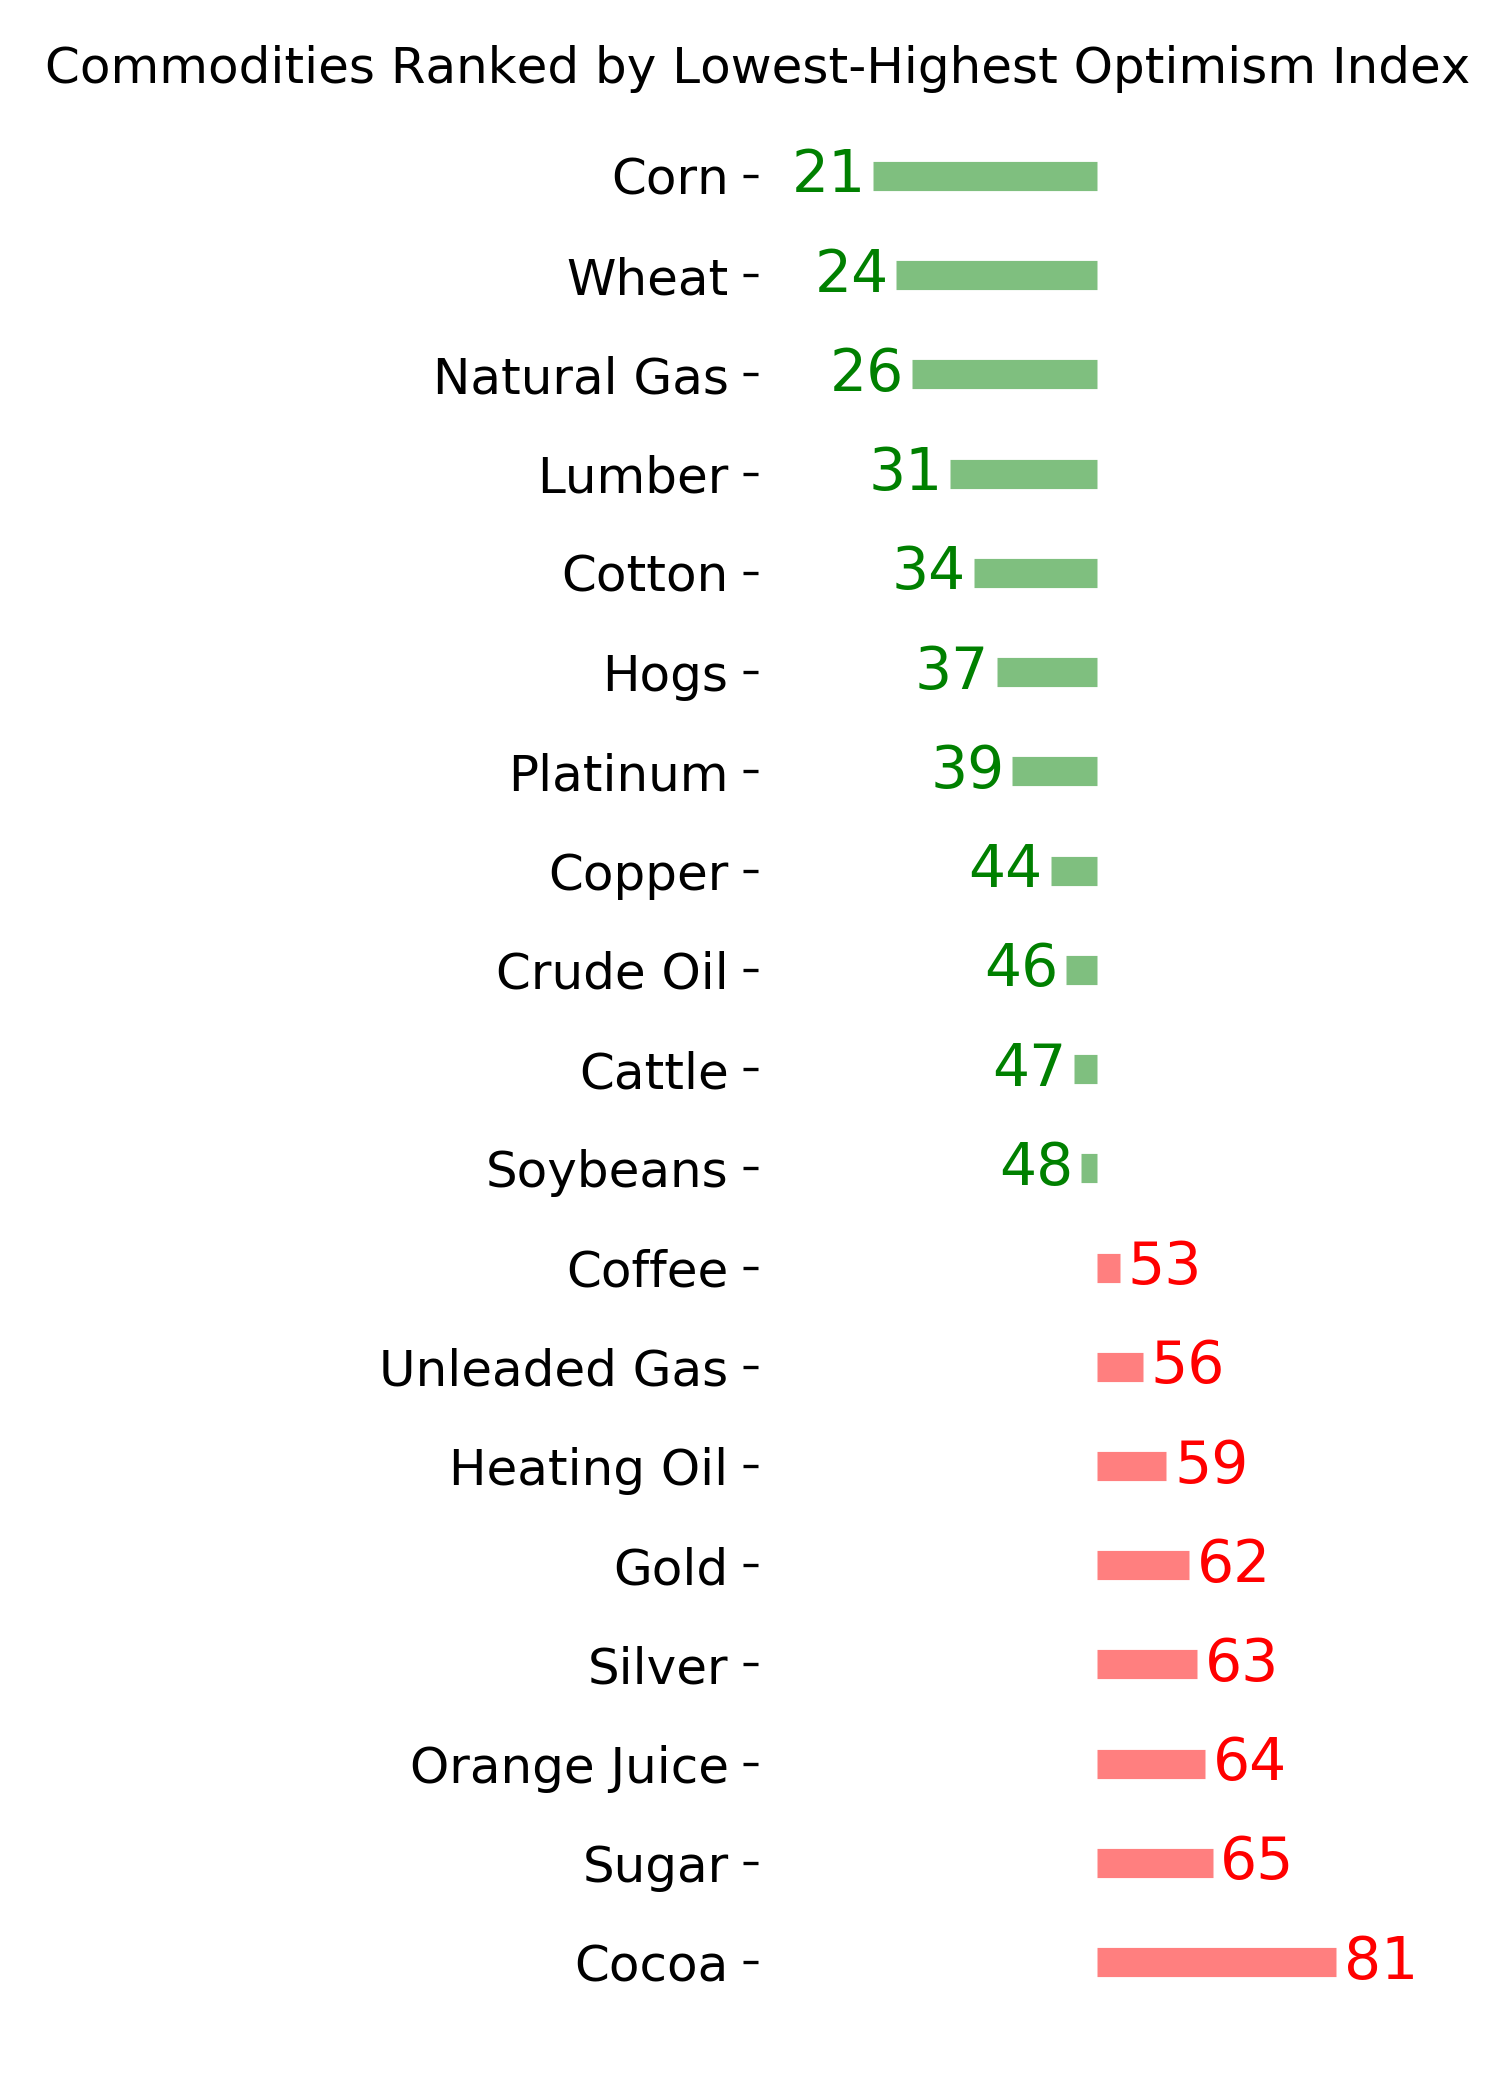
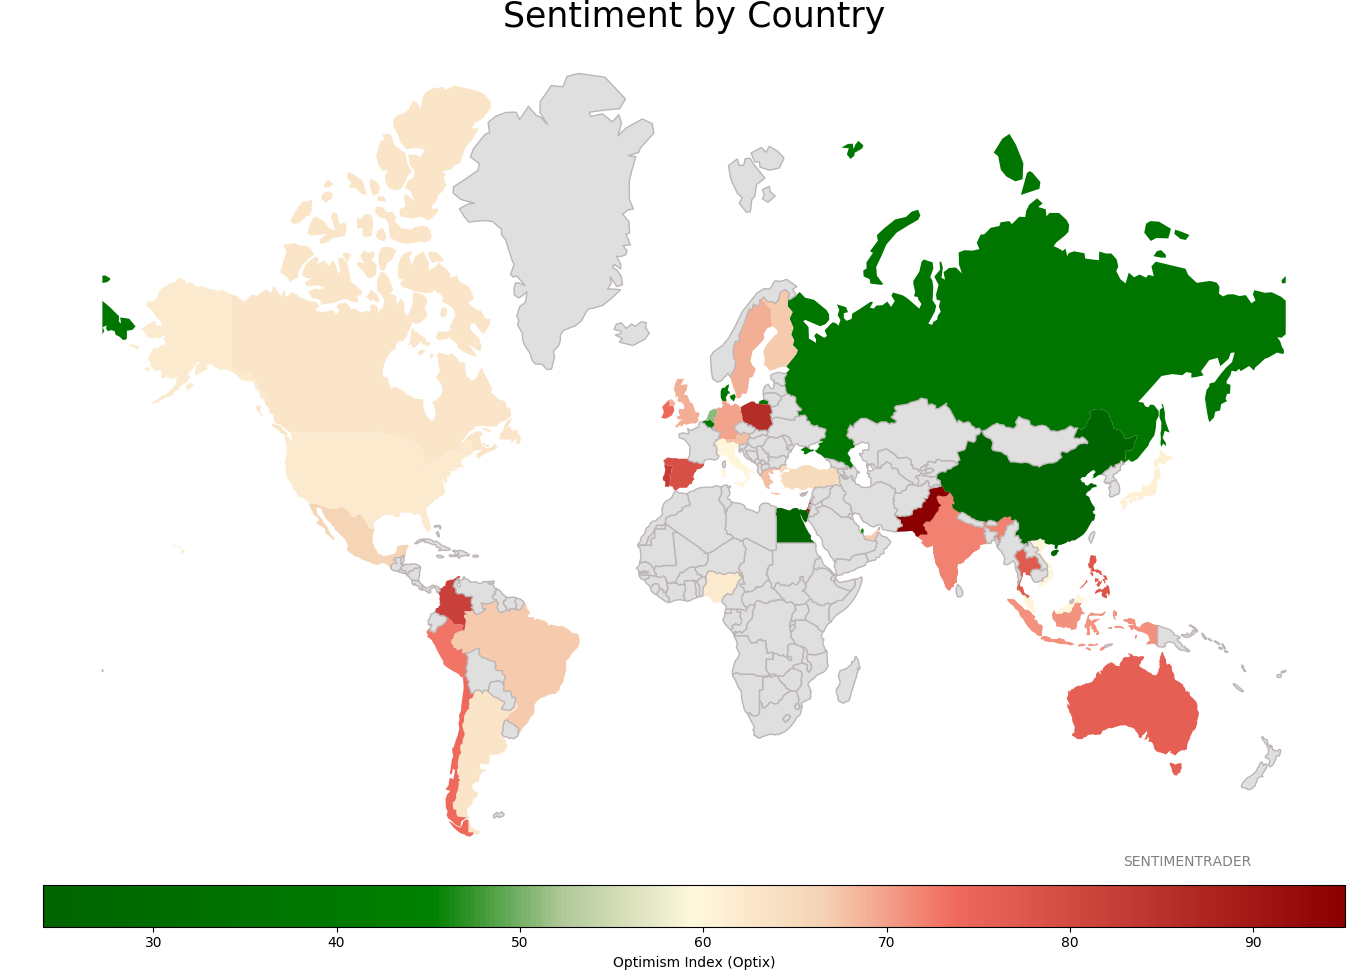
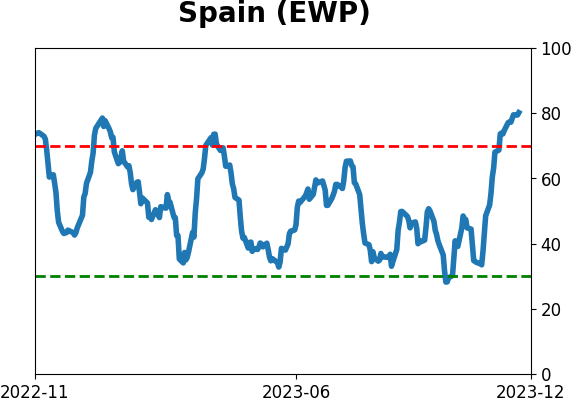
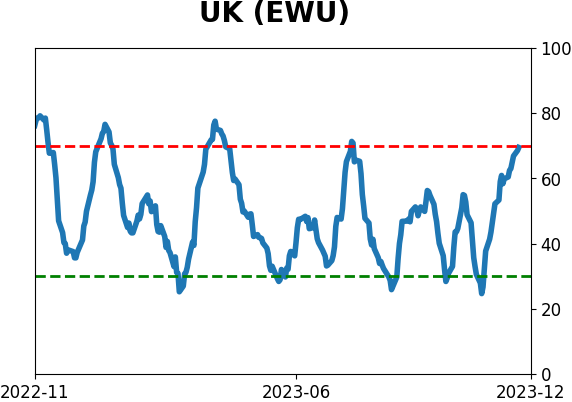
Sentiment Around The World
Optimism Index Thumbnails
|
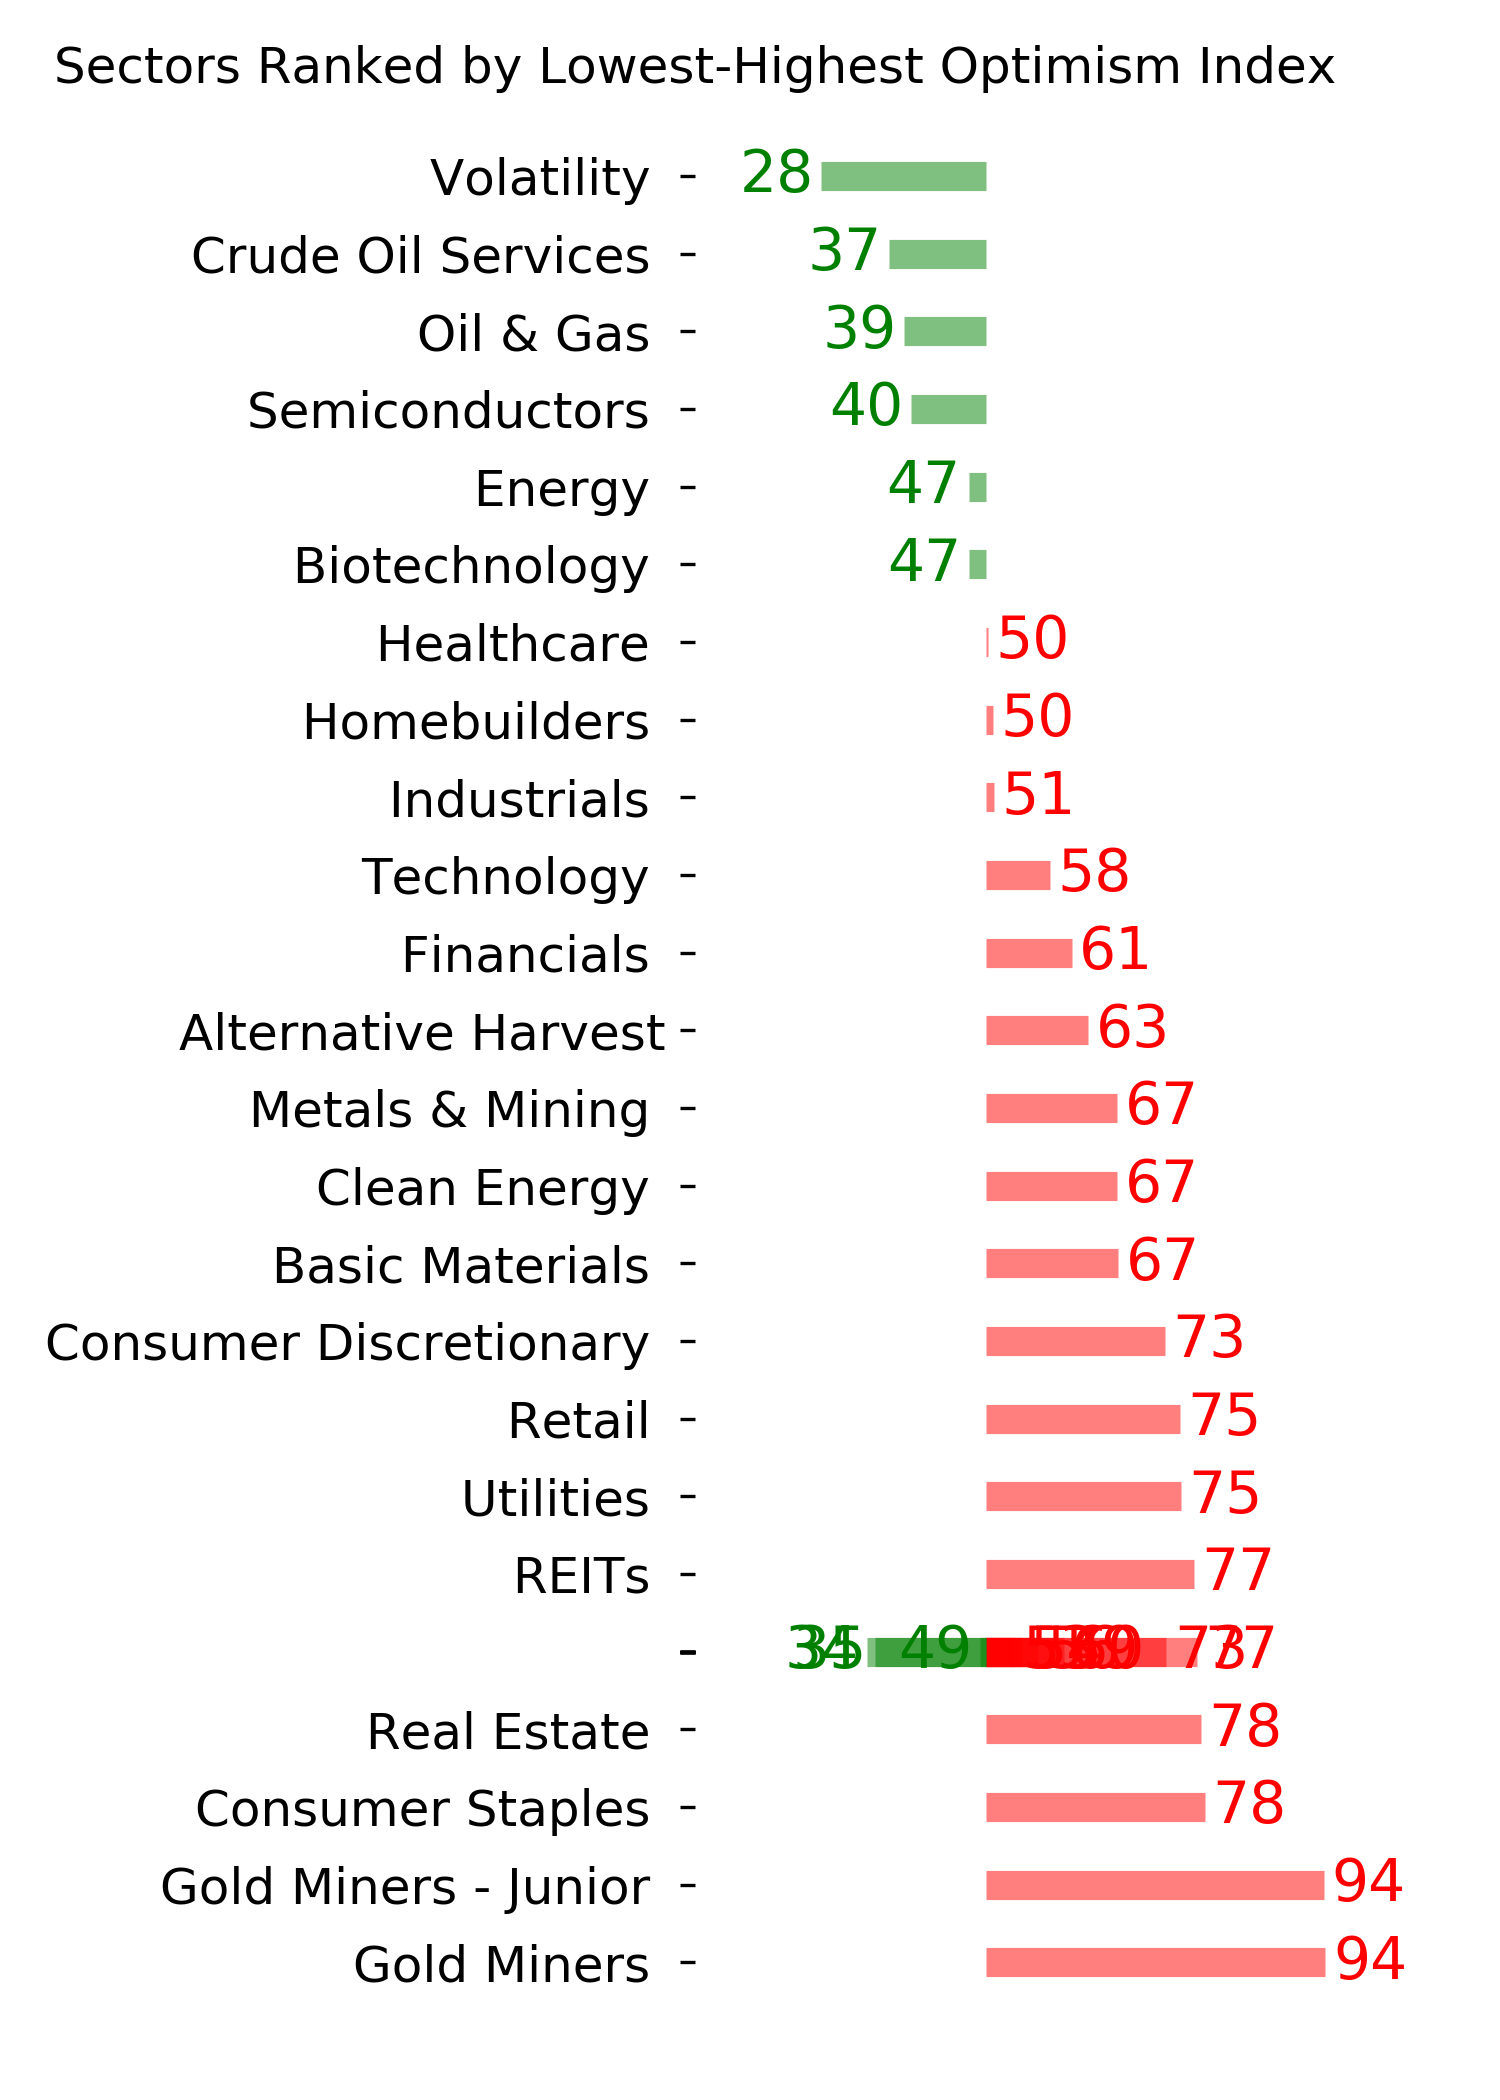
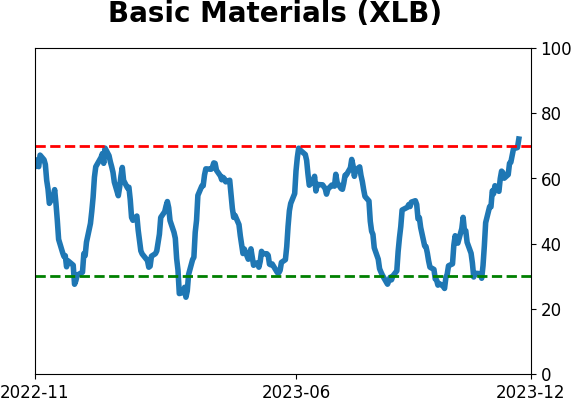
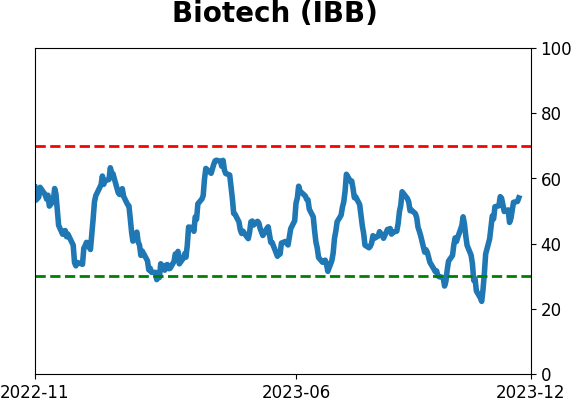
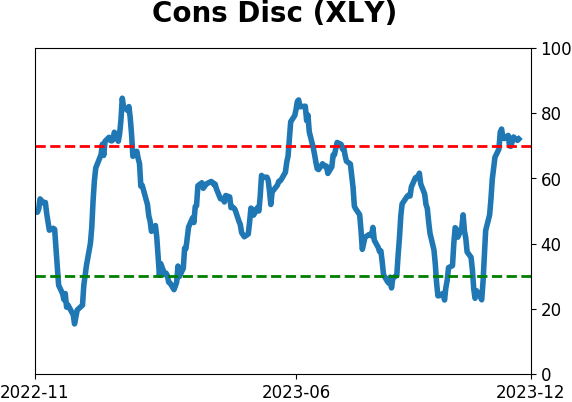
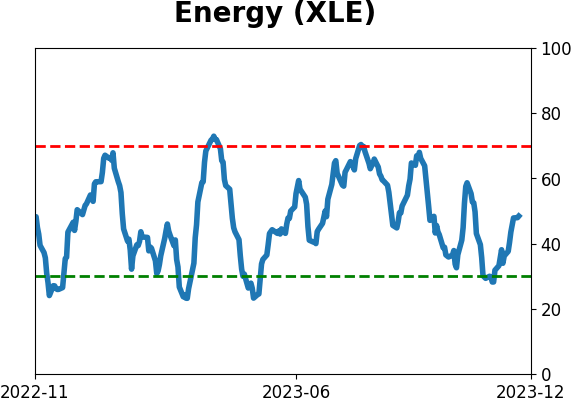
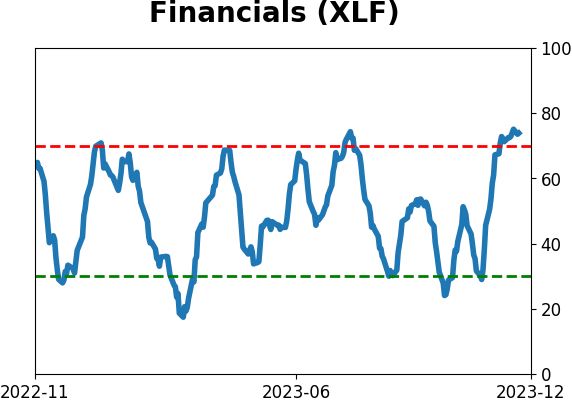
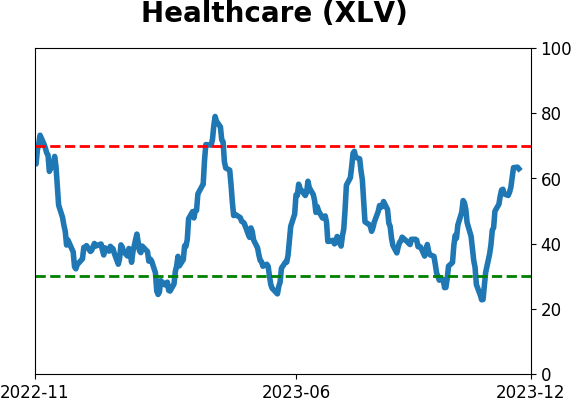
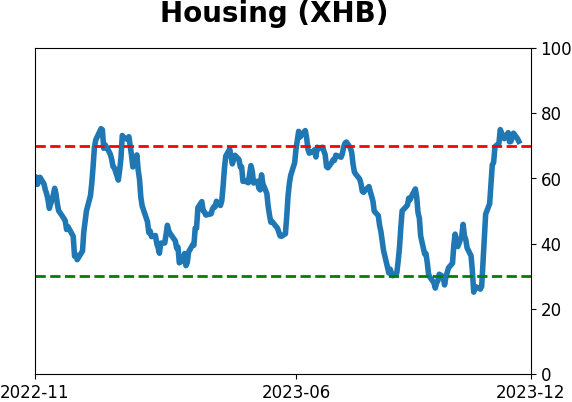
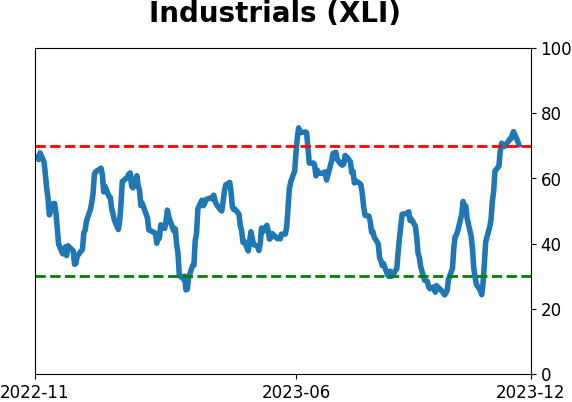
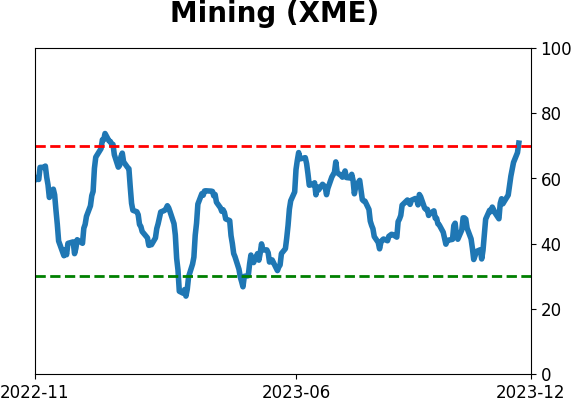
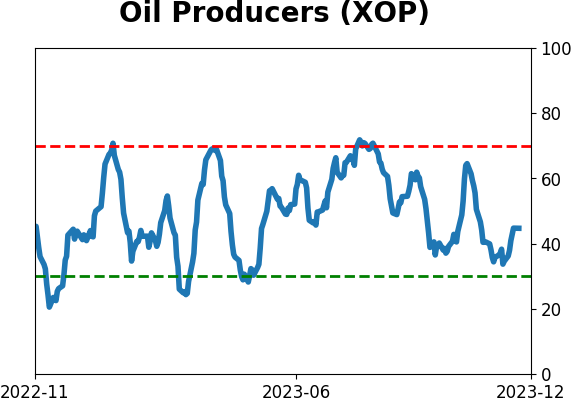
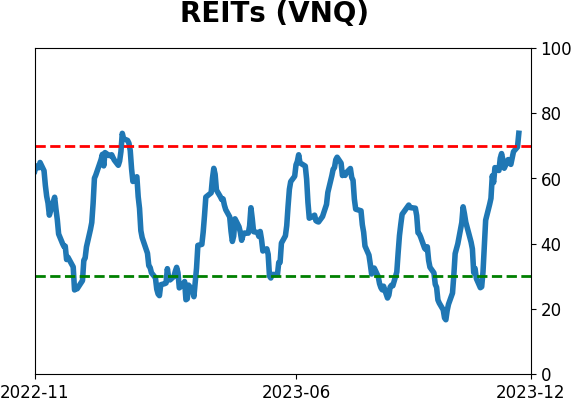
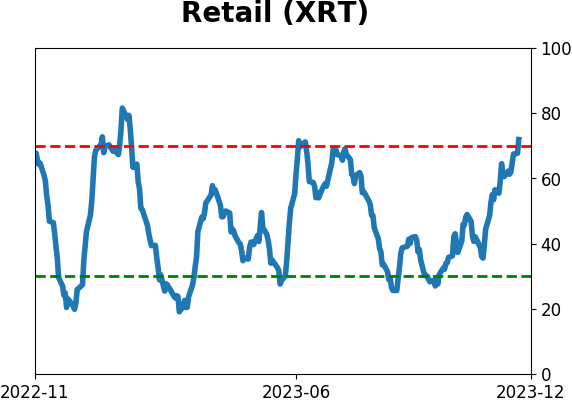
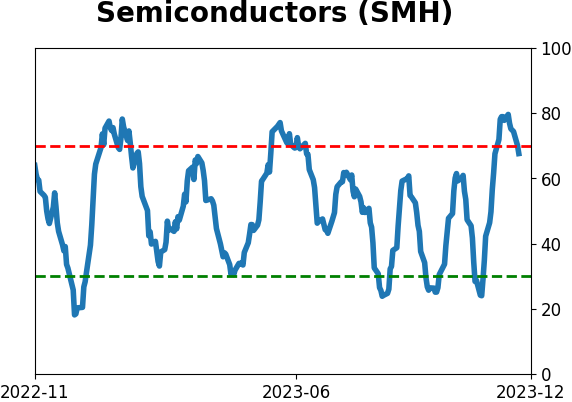
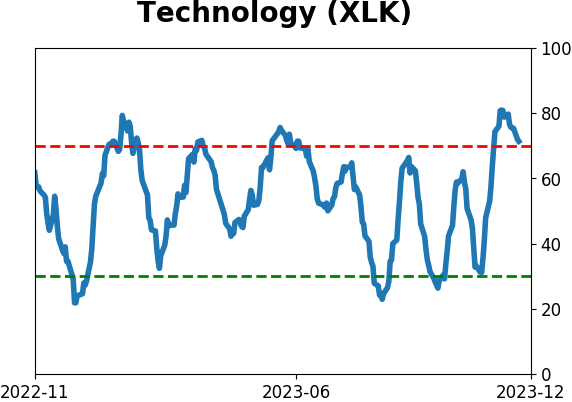
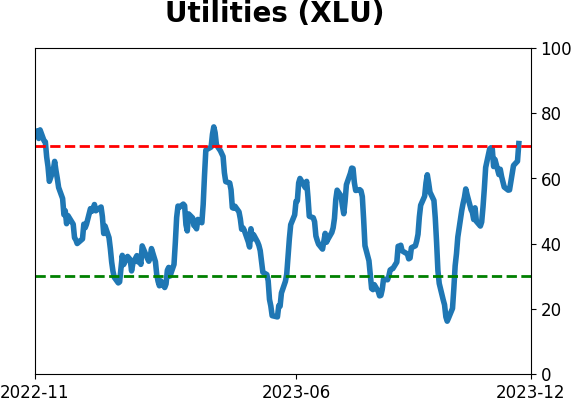
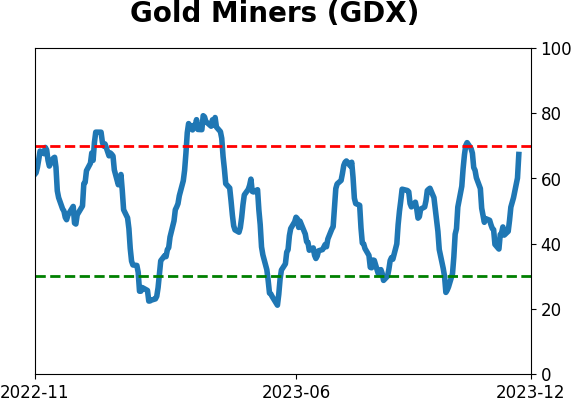
Sector ETF's - 10-Day Moving Average
|
|
|
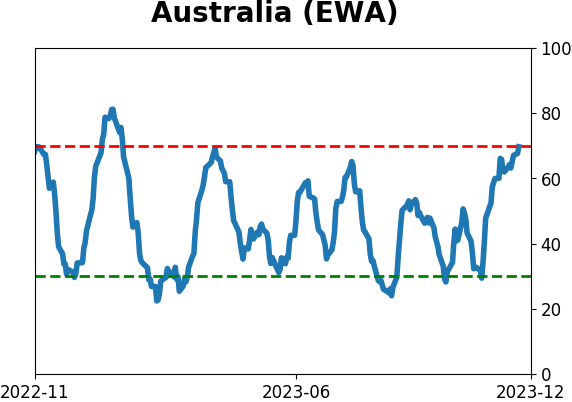
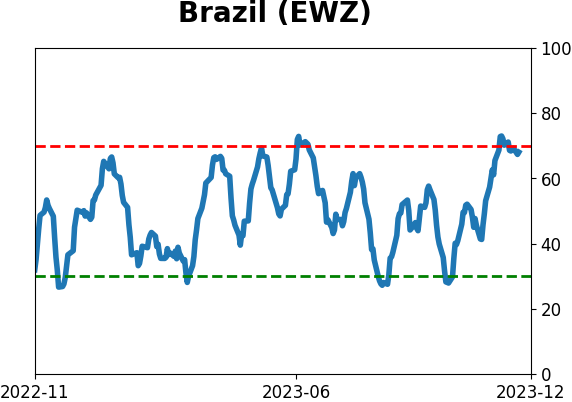
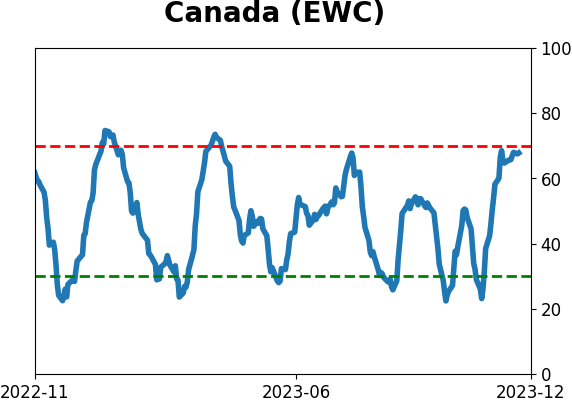
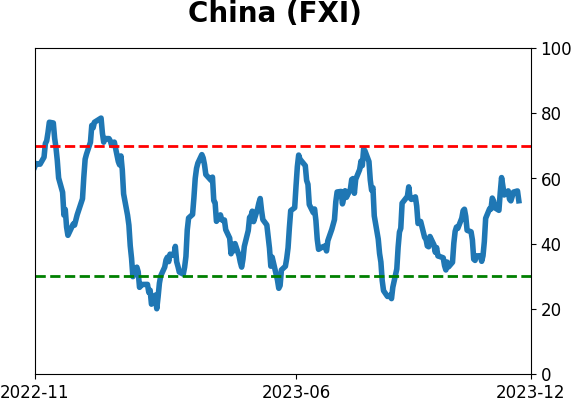
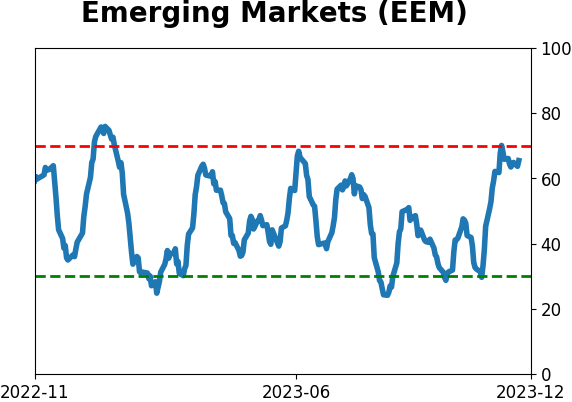
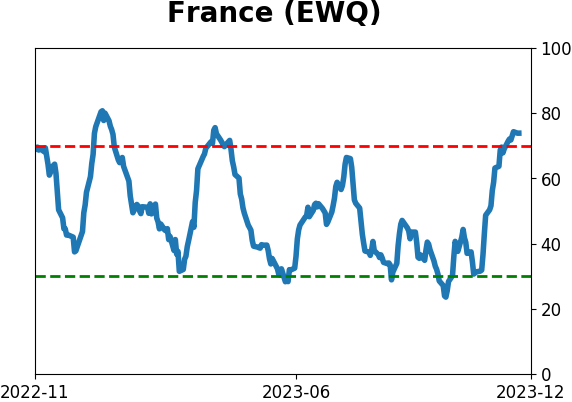
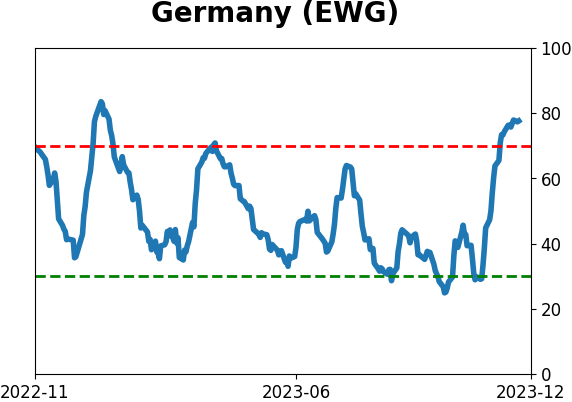
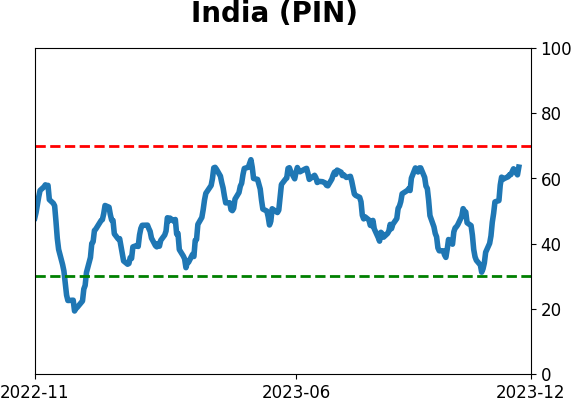
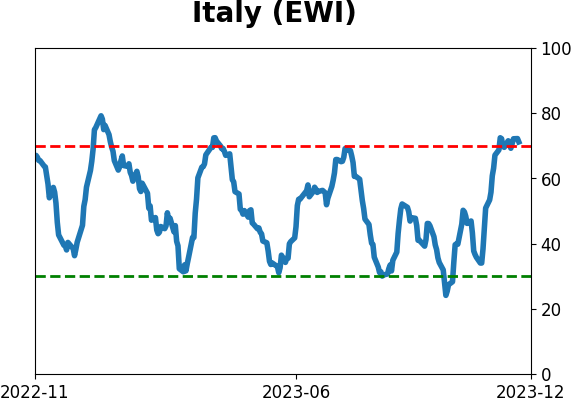
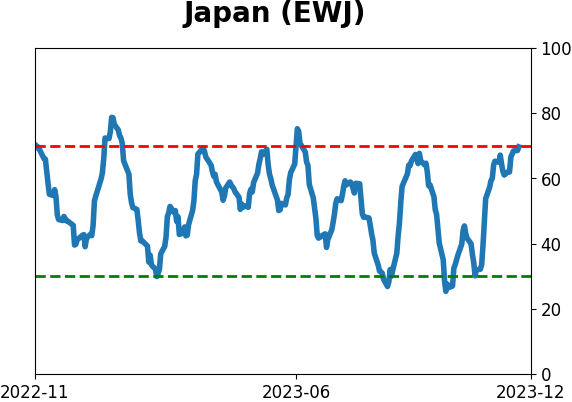
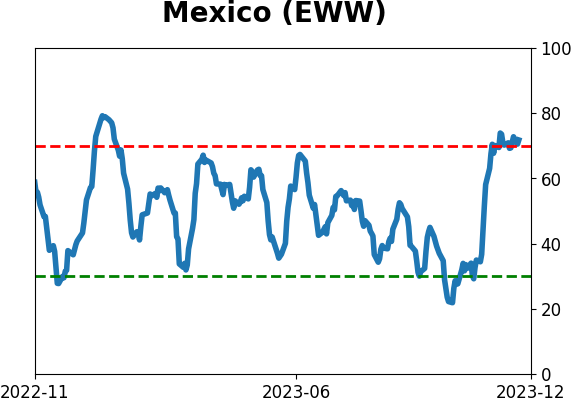
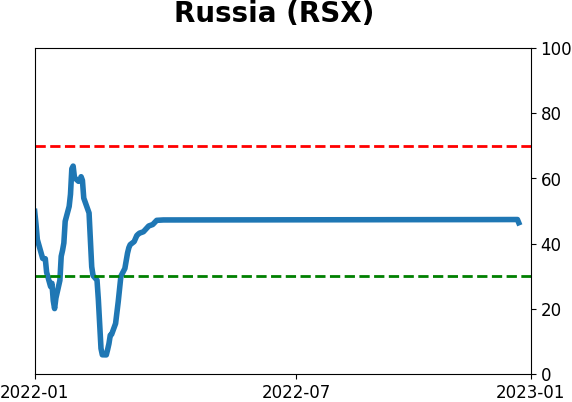
Country ETF's - 10-Day Moving Average
|
|
|
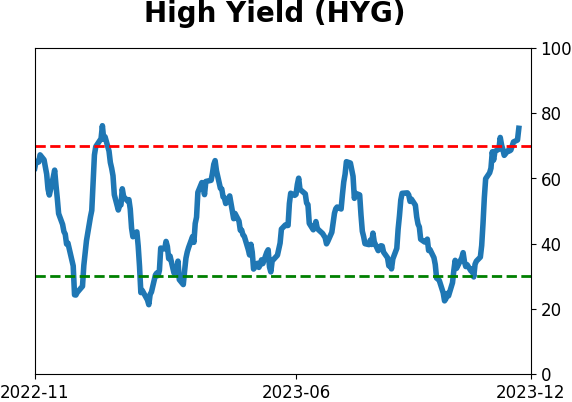
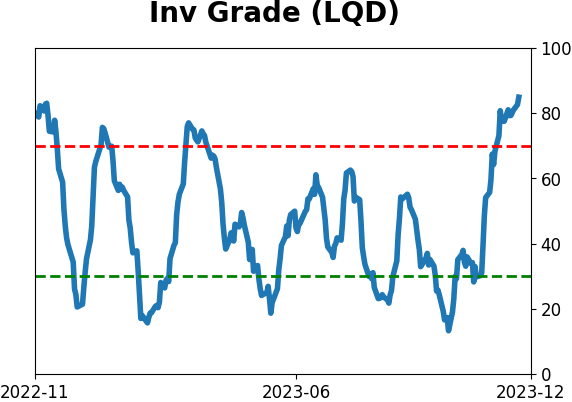
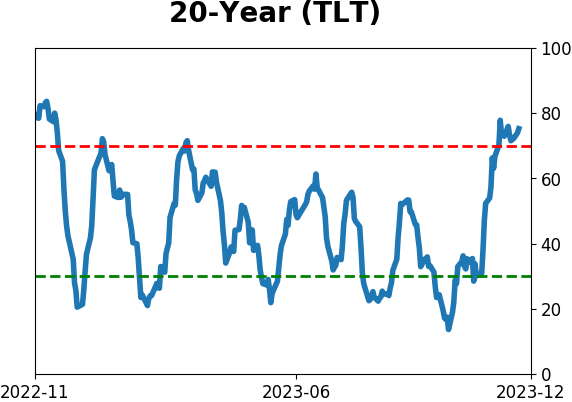
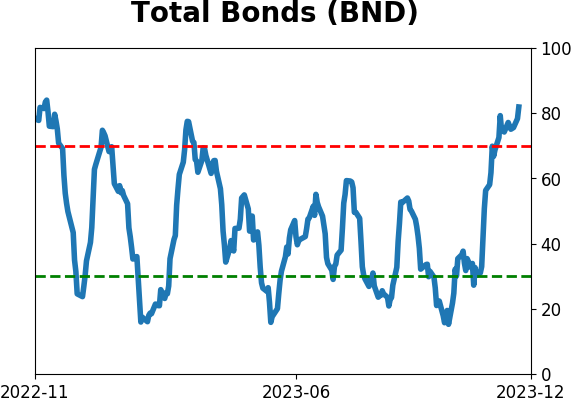
Bond ETF's - 10-Day Moving Average
|
|
|
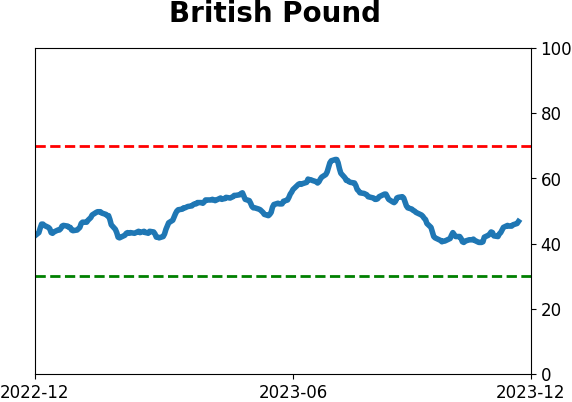
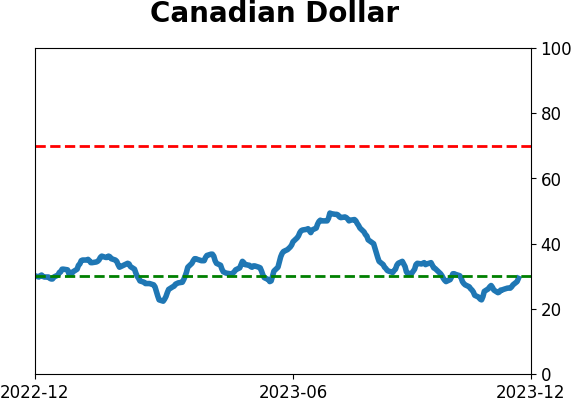
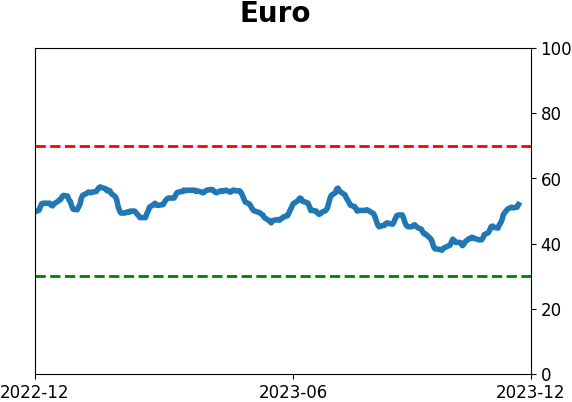
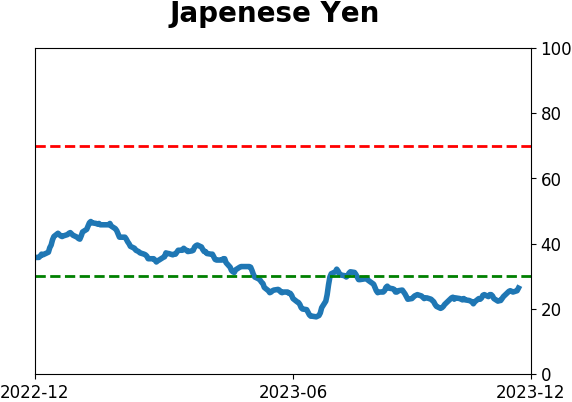
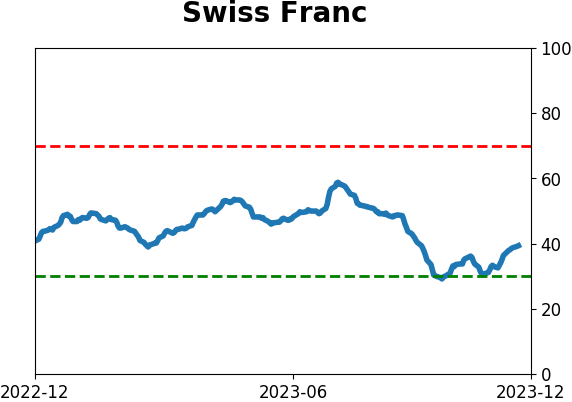
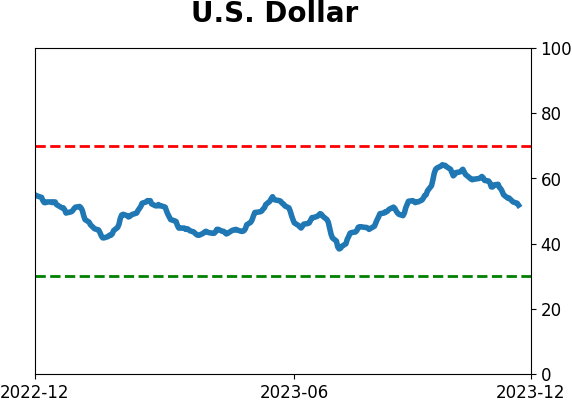
Currency ETF's - 5-Day Moving Average
|
|
|
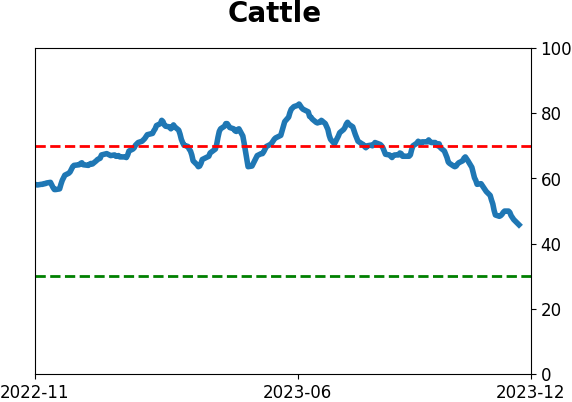
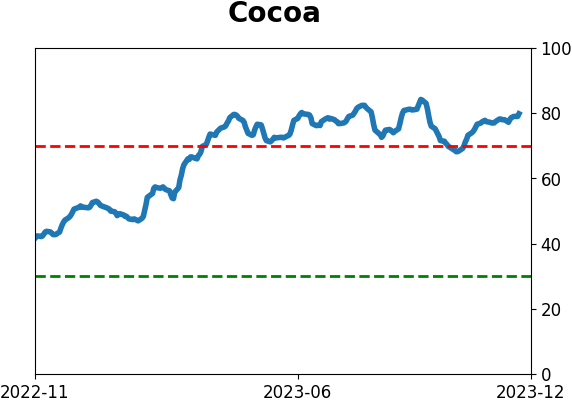
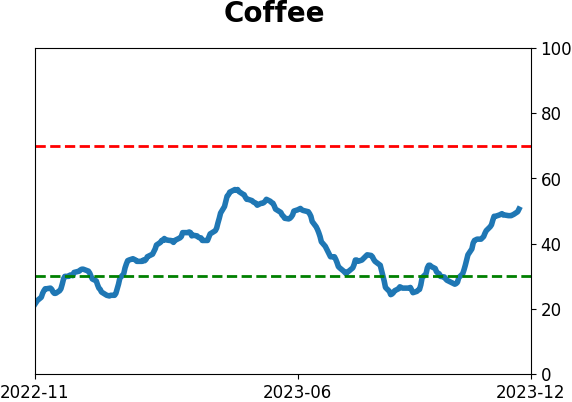
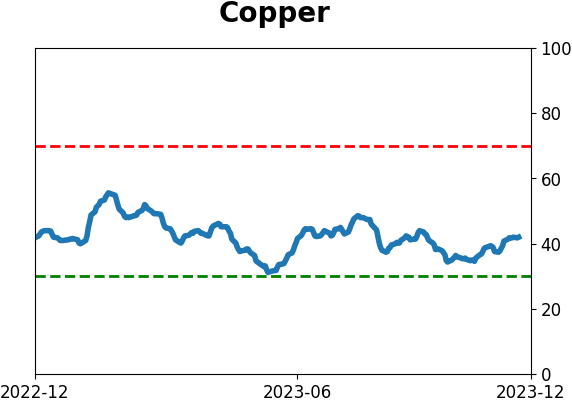
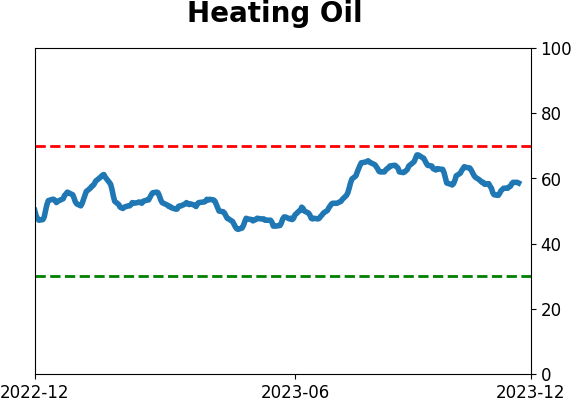
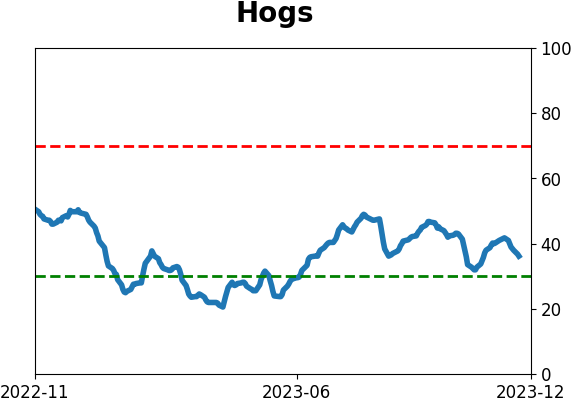
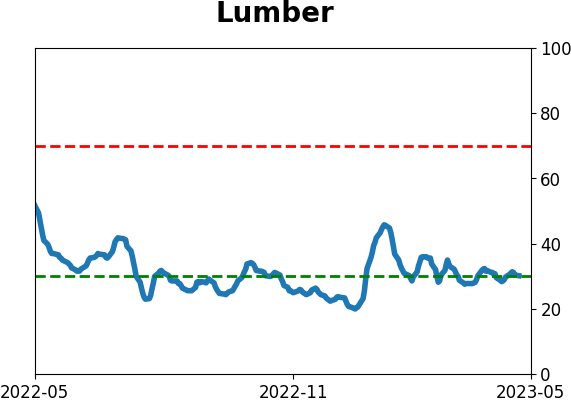
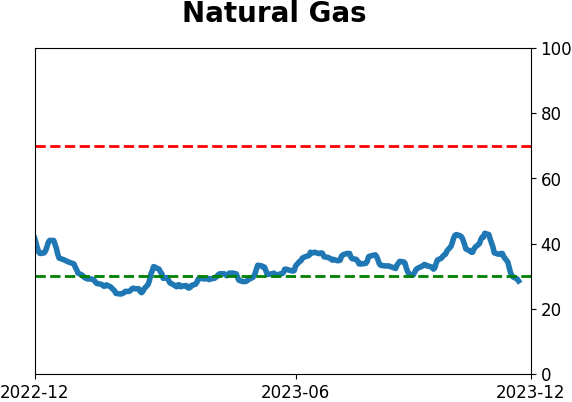
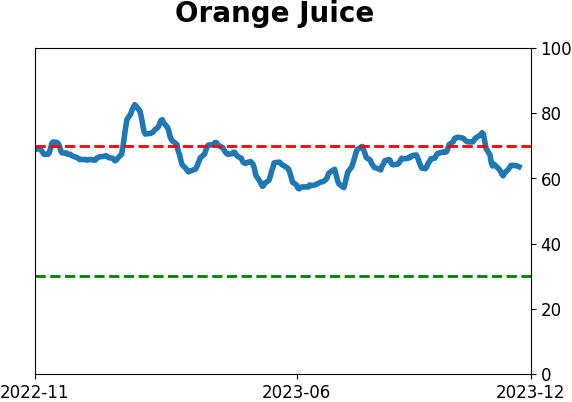
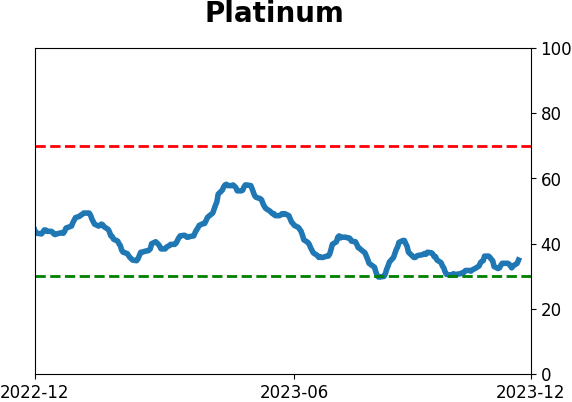
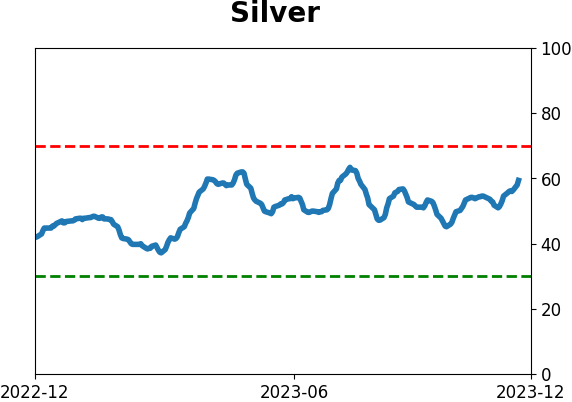
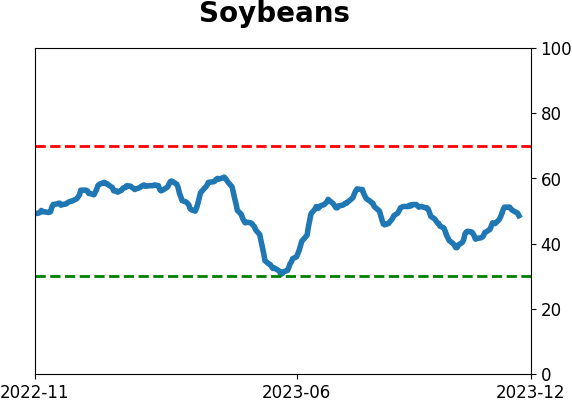
Commodity ETF's - 5-Day Moving Average
|
|