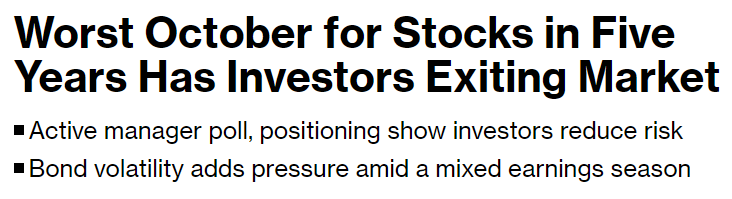
Headlines
|
|
Investors have fully recovered from their October anxiety:
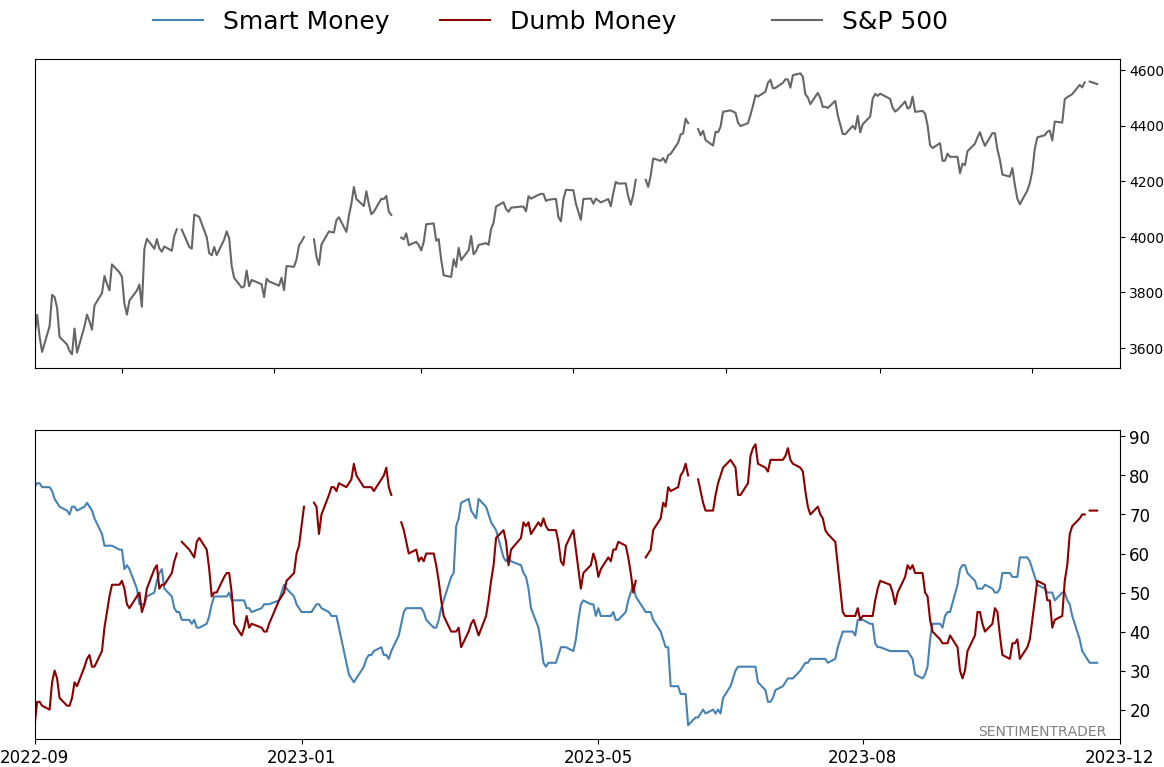
After becoming anxious in October, investors have embraced the rally and appear to believe more gains are in store. The spread between Smart and Dumb Money Confidence has quickly swung from one extreme to the other, which was preceded relatively weak short- to medium-term returns but not protracted declines.
|
Smart / Dumb Money Confidence
|
Smart Money Confidence: 32%
Dumb Money Confidence: 71%
|
|
Risk Levels
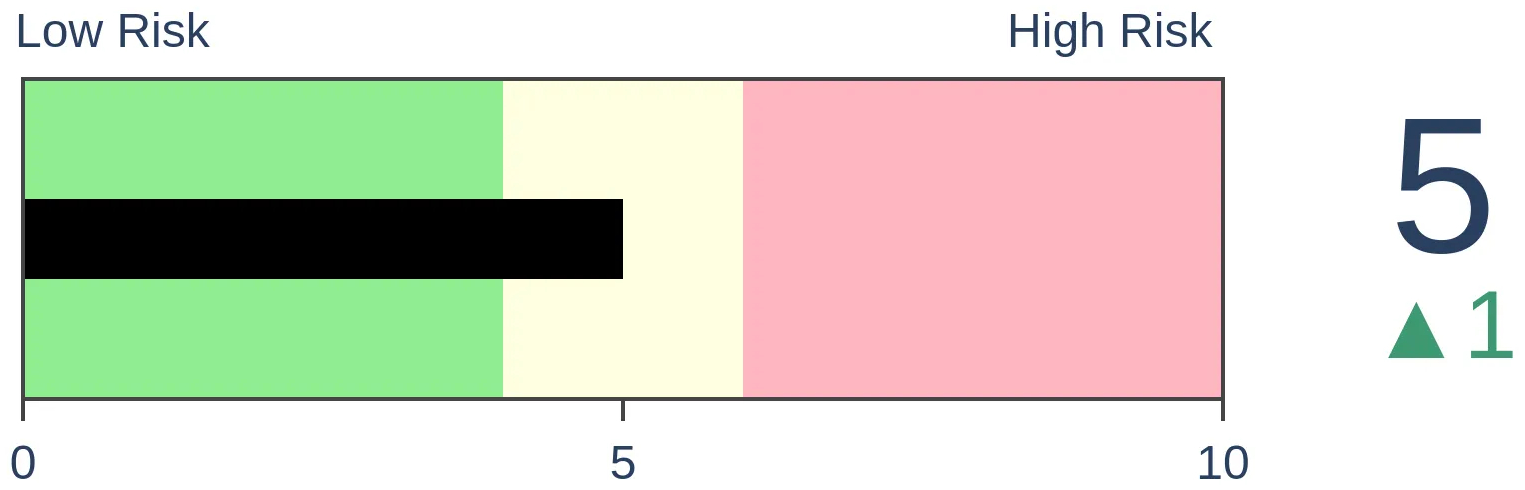
Stocks Short-Term
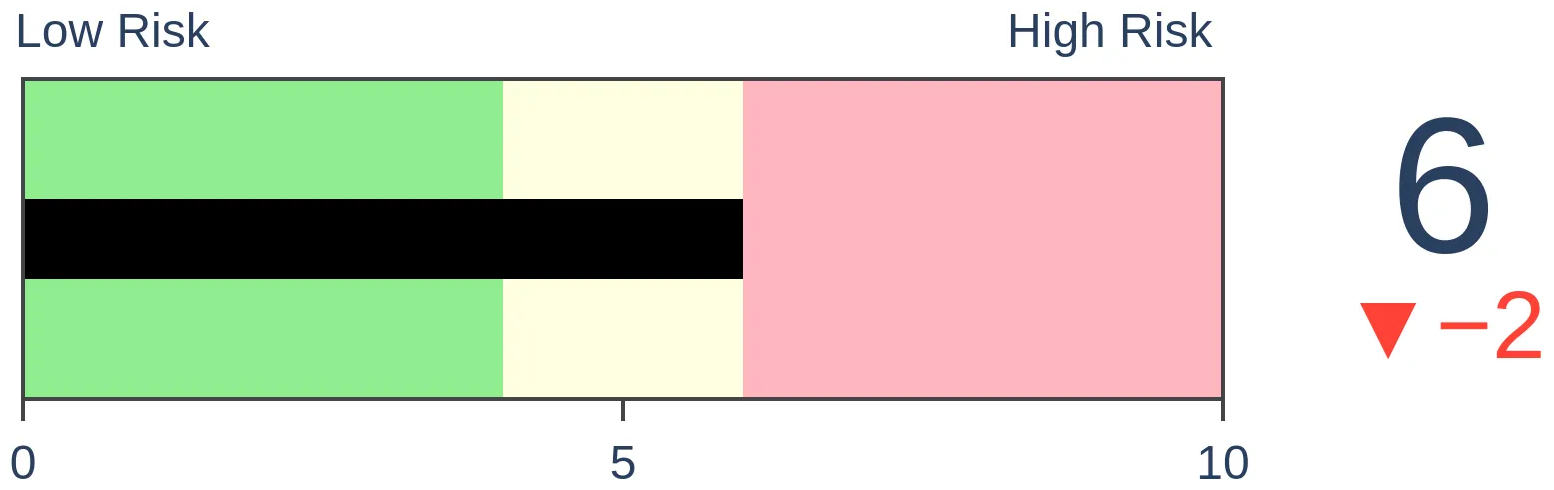
|
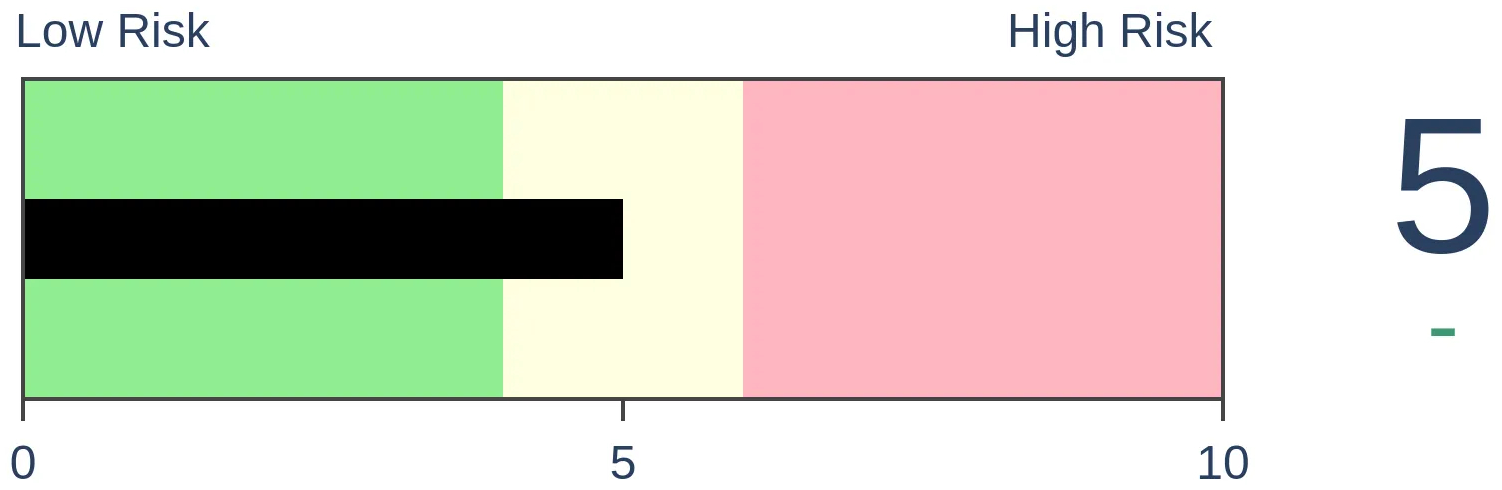
Stocks Medium-Term
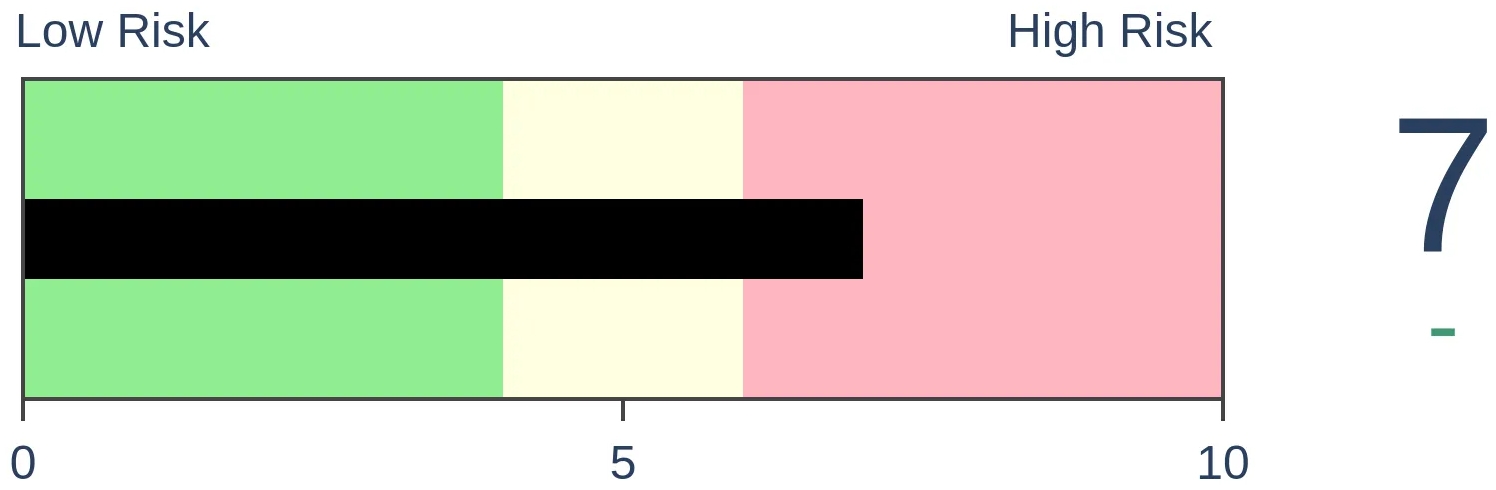
|
|
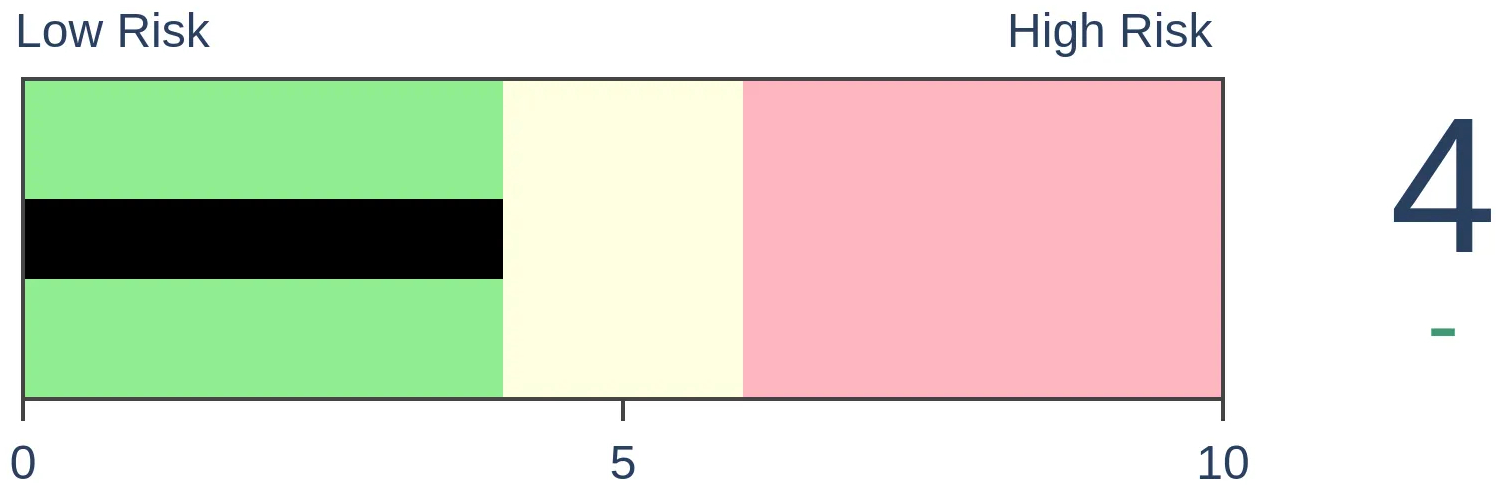
Bonds
|
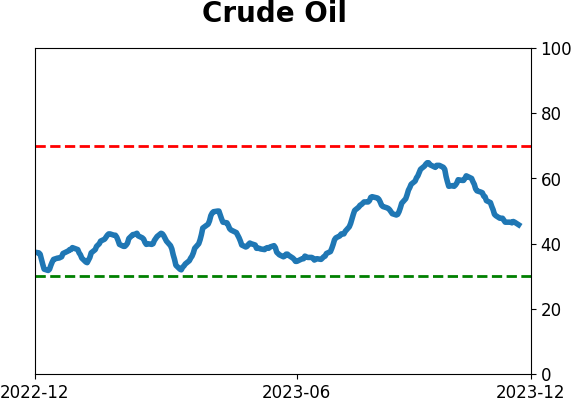
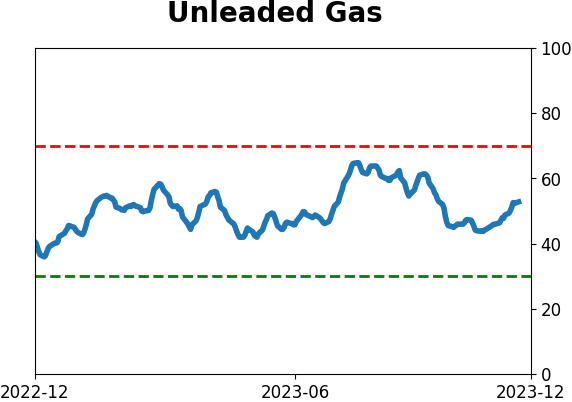
Crude Oil
|
|
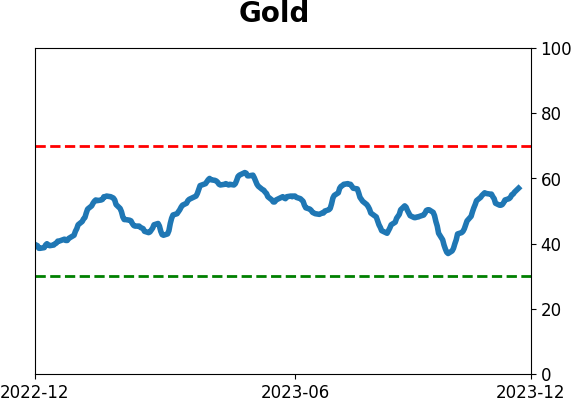
Gold
|
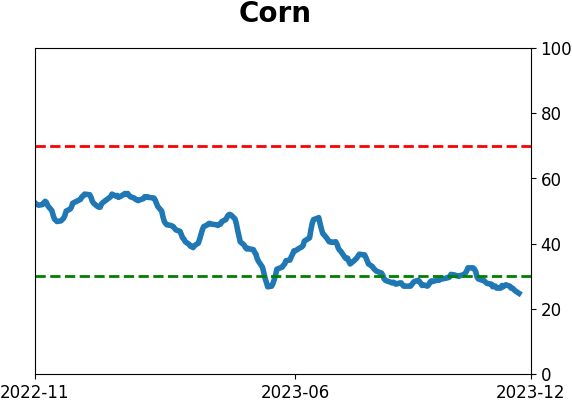
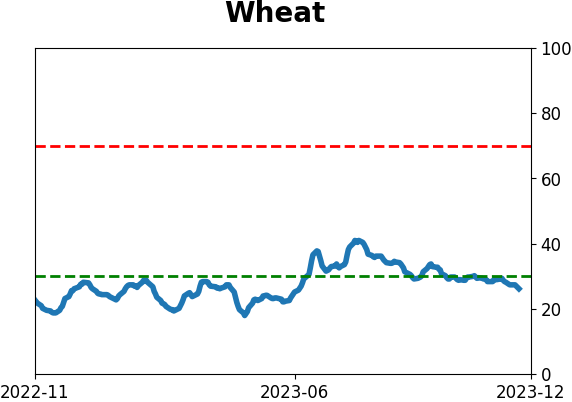
Agriculture

|
|
Research
By Jason Goepfert
BOTTOM LINE
After becoming anxious in October, investors have embraced the rally and appear to believe more gains are in store. The spread between Smart and Dumb Money Confidence has quickly swung from one extreme to the other, which was preceded relatively weak short- to medium-term returns but not protracted declines.
FORECAST / TIMEFRAME
None
|
Key points:
- The spread between Smart Money and Dumb Money Confidence has cycled from anxiety to comfort
- A modest extreme in optimism has not been a consistent reason to sell
- Quick cycles in sentiment have led to poor 1-3 month returns but not much else
Investors have cycled from anxiety to comfort
Here is a tale in two acts. First, from October 27...
...and then a month later...

After a bout of some relatively extreme fear, or at least high anxiety, in October, investors have fully reversed course. Trend-following traders have become more comfortable with the idea of a further rally, while contrarians have started to express some doubts.
The spread between Smart Money and Dumb Money Confidence has fully cycled from one modest extreme to the other. This is similar to their behavior in March and April.
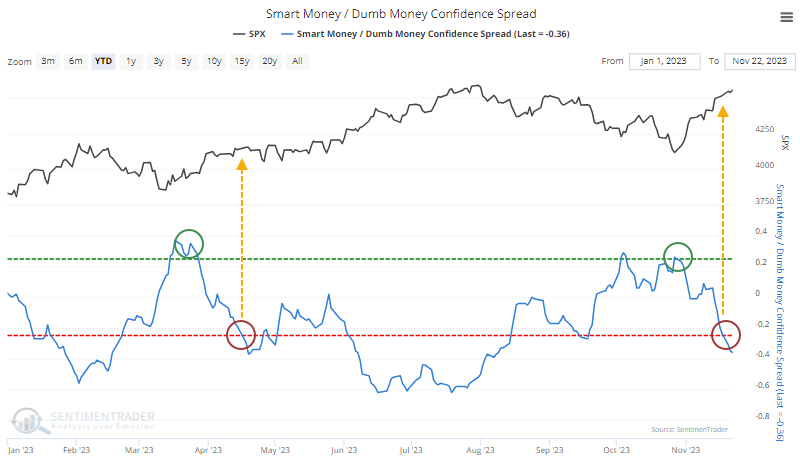
The spread isn't all that extreme, but it's at least through the lower threshold.
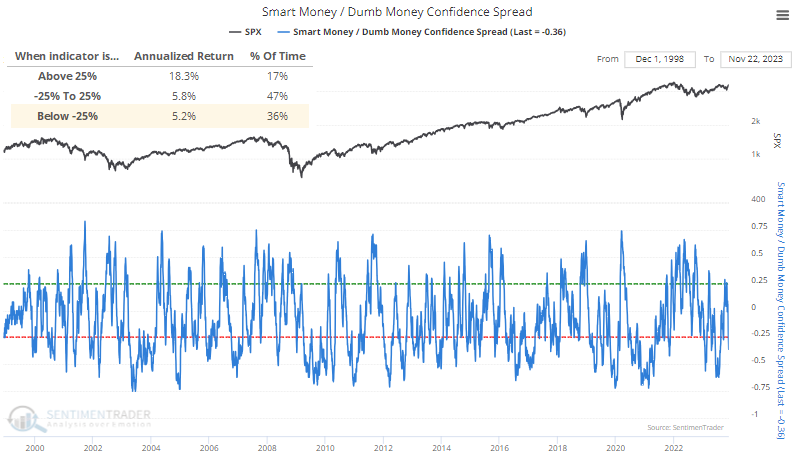
Because strong bull market trends tend to generate extreme sentiment and then keep going, the S&P 500's annualized return when the spread is below its lower threshold isn't all that bad at +5.2%. That's less than when it's neutral or showing extreme pessimism, but it's okay.
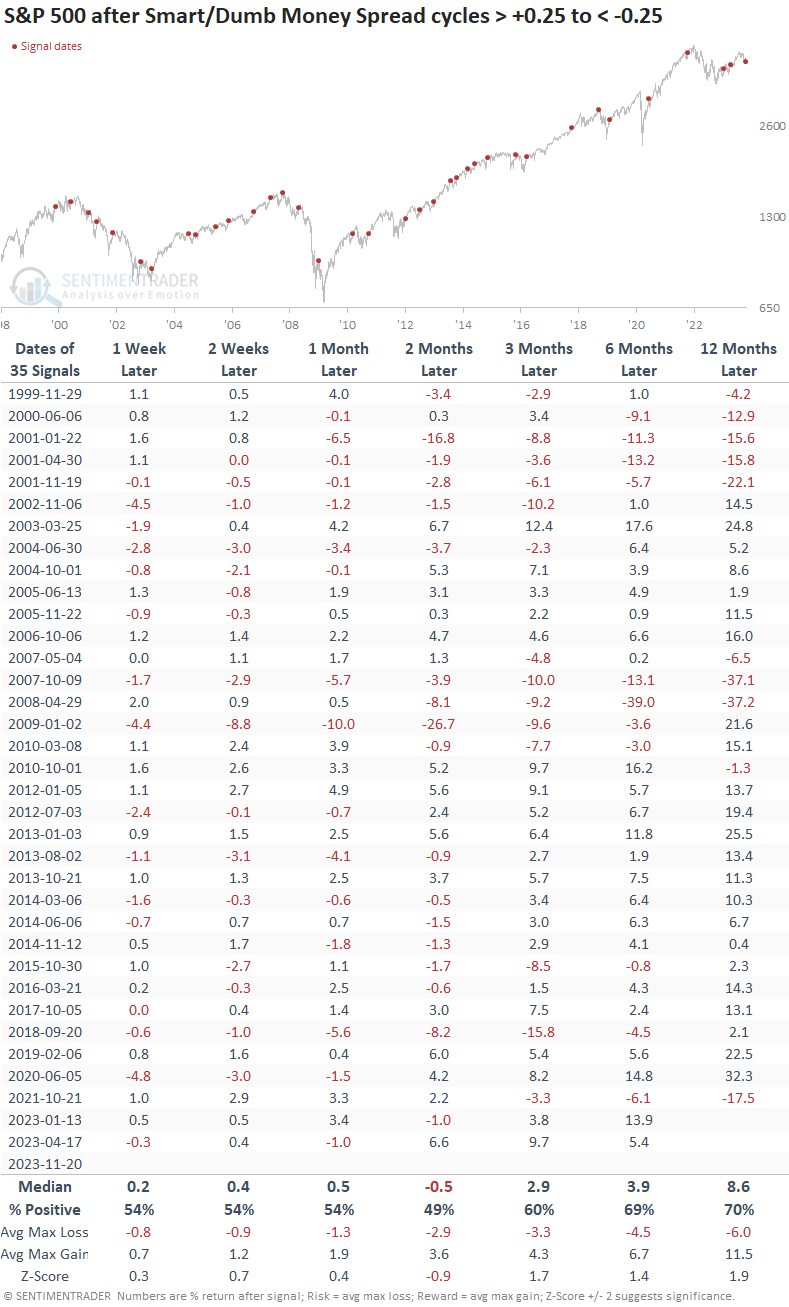
Quick cycles in sentiment have preceded some choppy markets
If we look at times when sentiment cycled from a moderate pessimistic extreme to a modest optimistic one, the S&P's return two months later was unimpressive at -0.5%. Other than that time frame, its median returns were positive but mediocre.
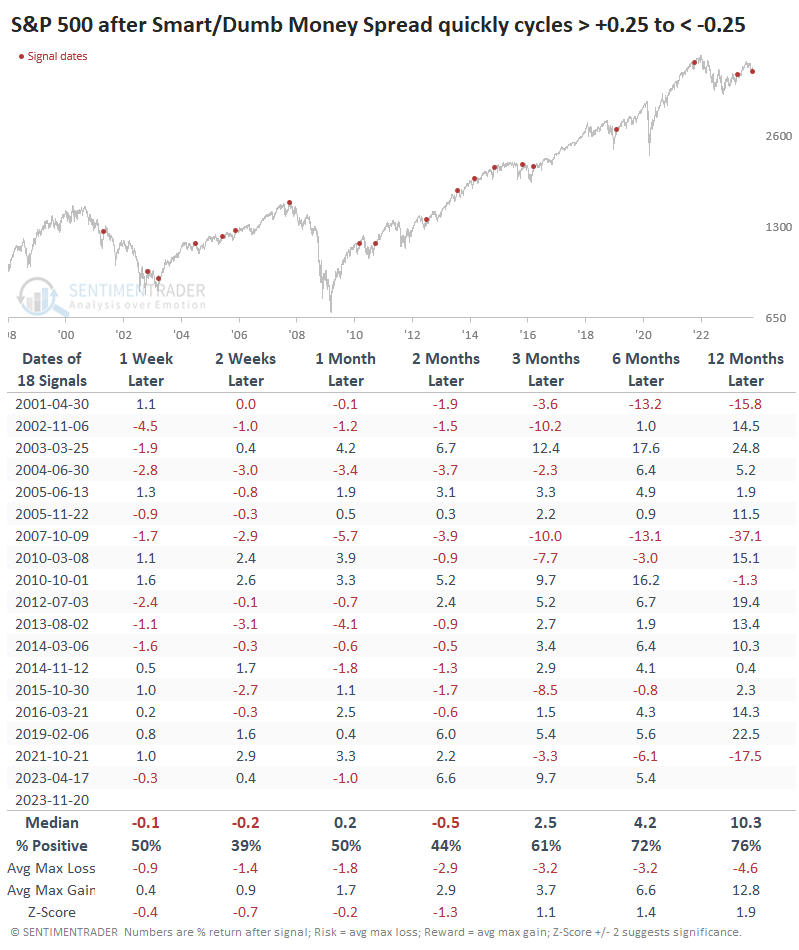
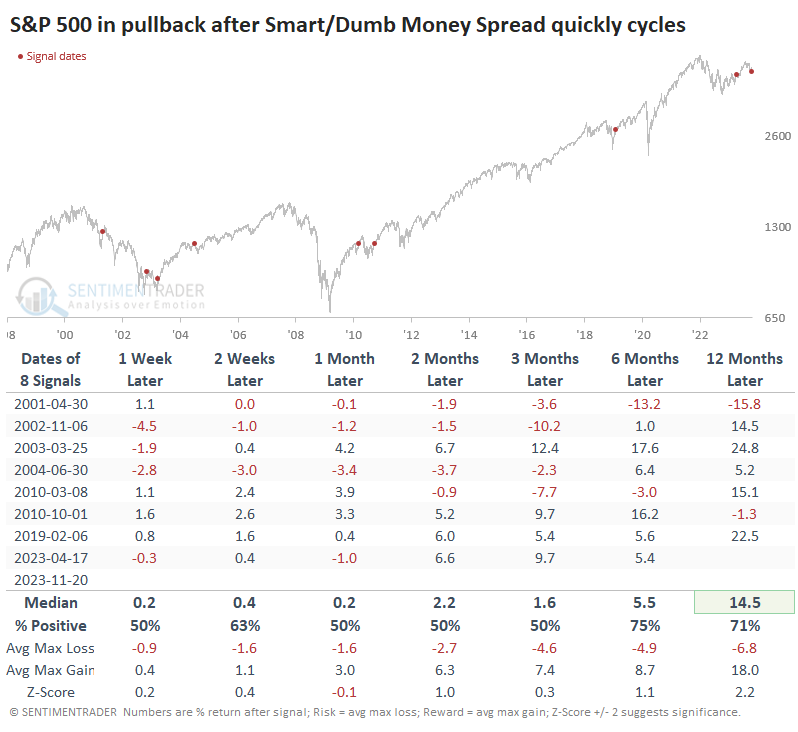
After a rapid sentiment cycle, when it took a month or less to go from one extreme to the other, its returns worsened in the short term. Over the next 6-12 months, however, its returns improved and with less risk.
And it got even worse over the next two months when the S&P was in a pullback. These are signals when the index was at least 5% off a multi-year high. Almost every signal before 2010 was a loser; almost every one after that was a winner, so it may not be as bearish as it seems.
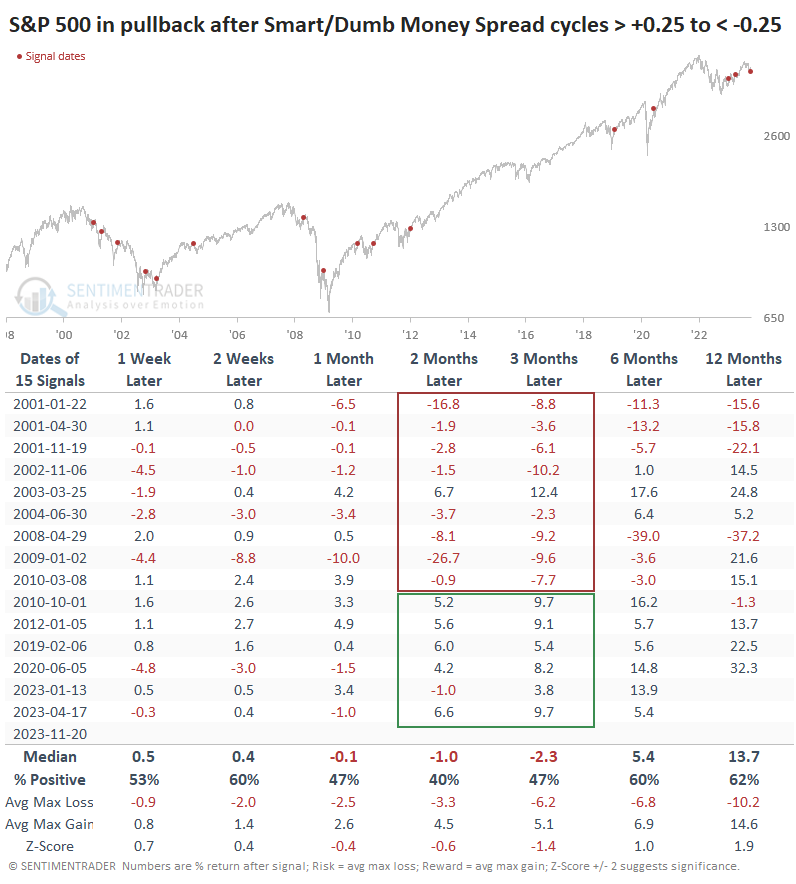
If we combine the two pieces of context and look at quick cycles in sentiment when the S&P was still mired in a pullback, then forward returns were okay, though the sample size necessarily gets smaller. There weren't any significant losses within the next two months, though two signals did lose more than that in the months after. A year later, there was only one large loss: the totally failed signal in 2001.
What the research tells us...
Contrarians always get nervous when there is evidence of other investors becoming comfortable. Sometimes, that nervousness is for a good reason, but more often, it's not particularly problematic.
During protracted bear markets, extreme sentiment tends to precede a market peak soon after. During bull markets, there is usually a 1-3 month period of choppiness at worst. We've already seen investors willing to buy even as sentiment started to become overheated last week, which is a good sign. Even if we've started another prolonged uptrend, we can reasonably expect price action to even out and become more choppy than the thrust of the past few weeks. So far, we're seeing little that would suggest an outright decline.
Indicators at Extremes
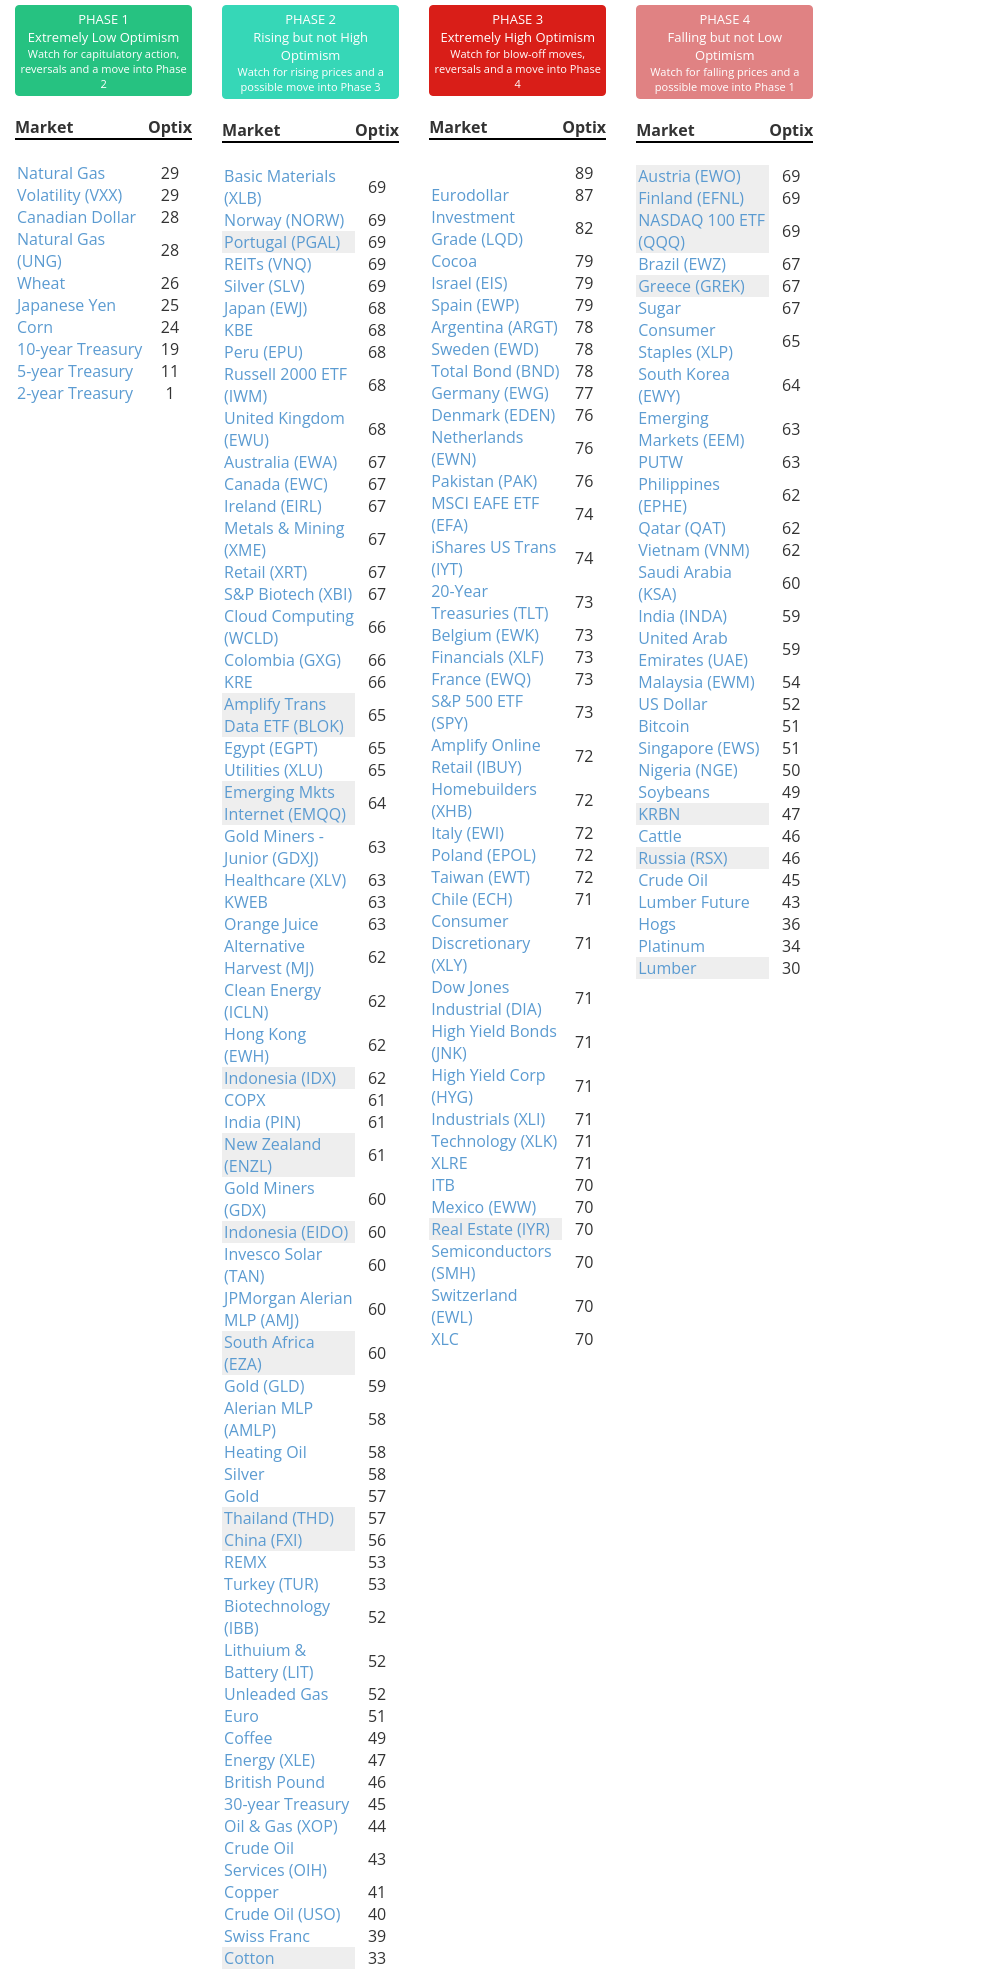
Phase Table
Ranks
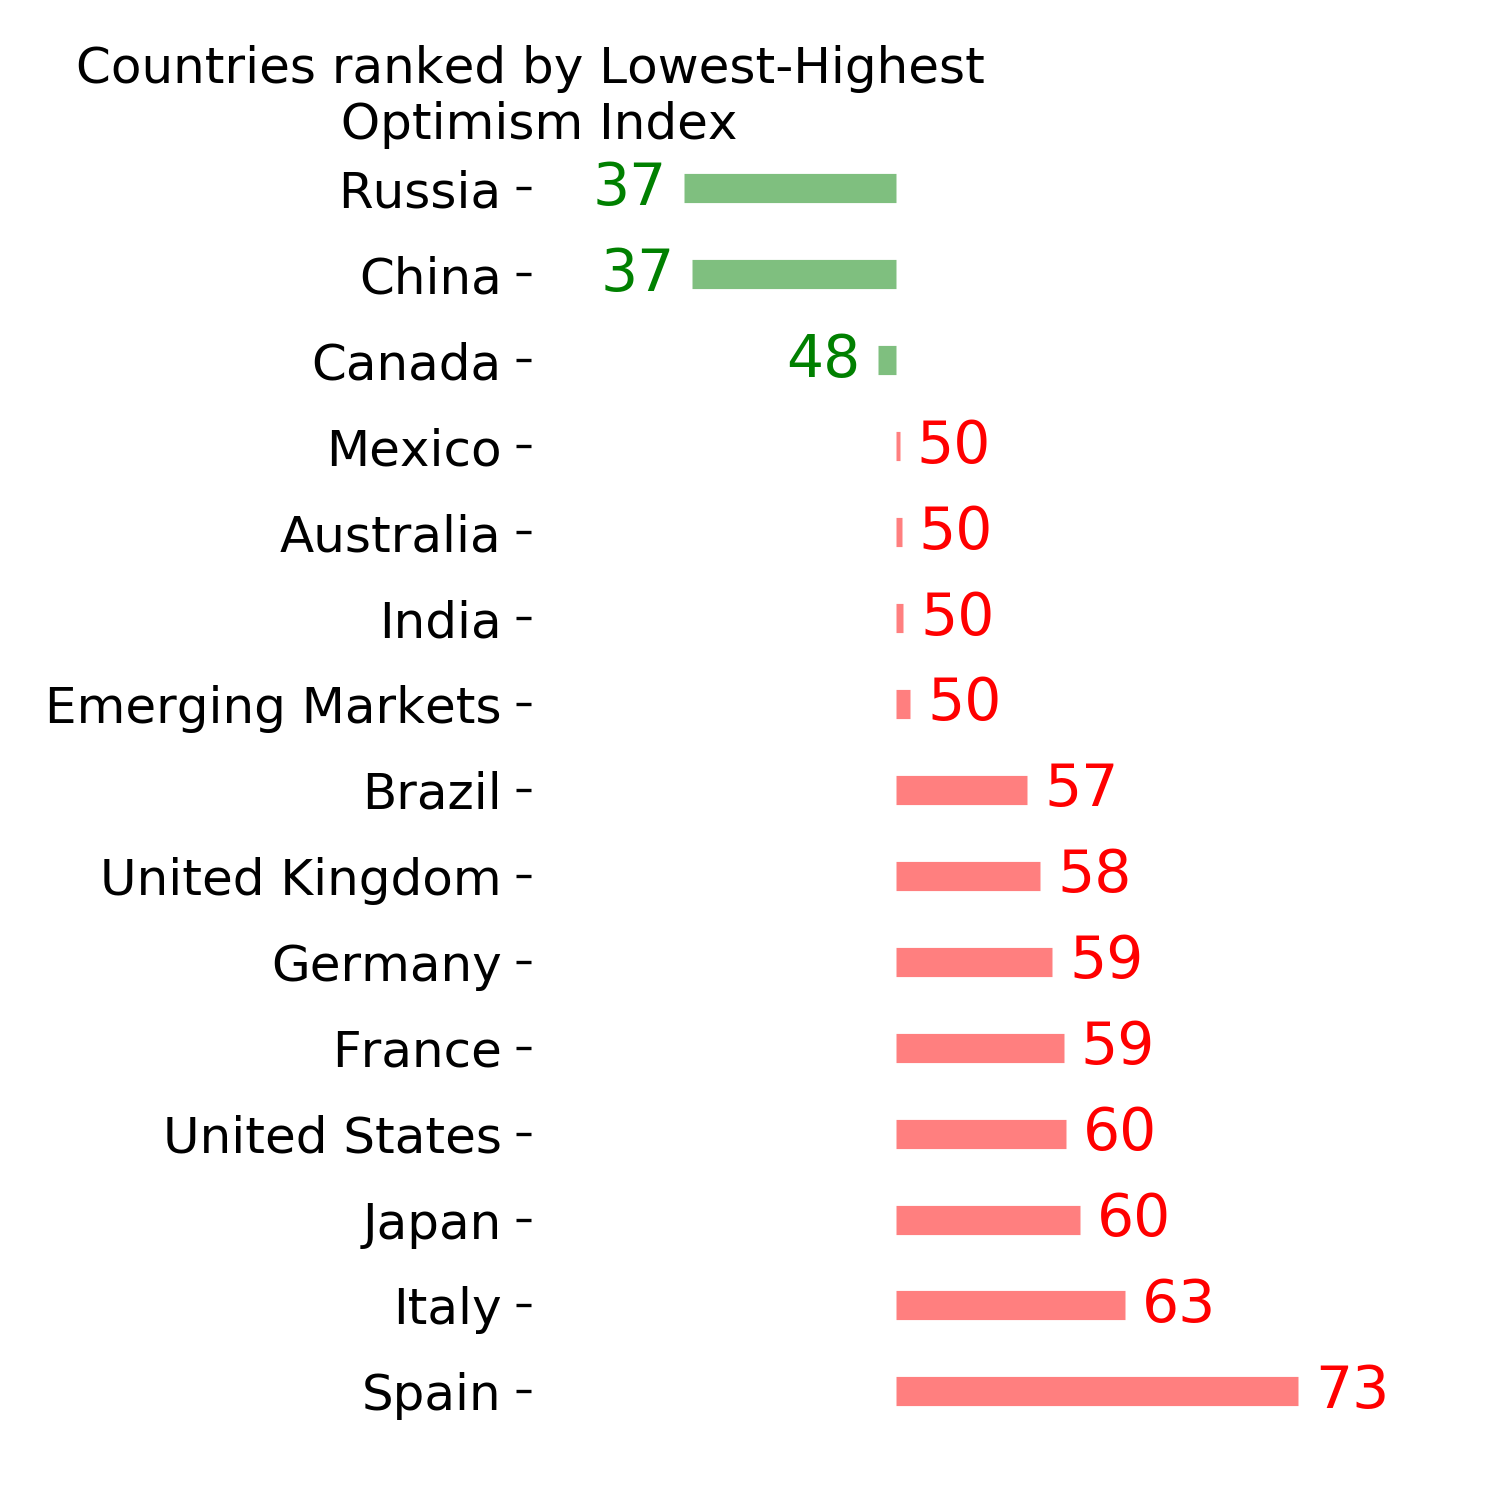
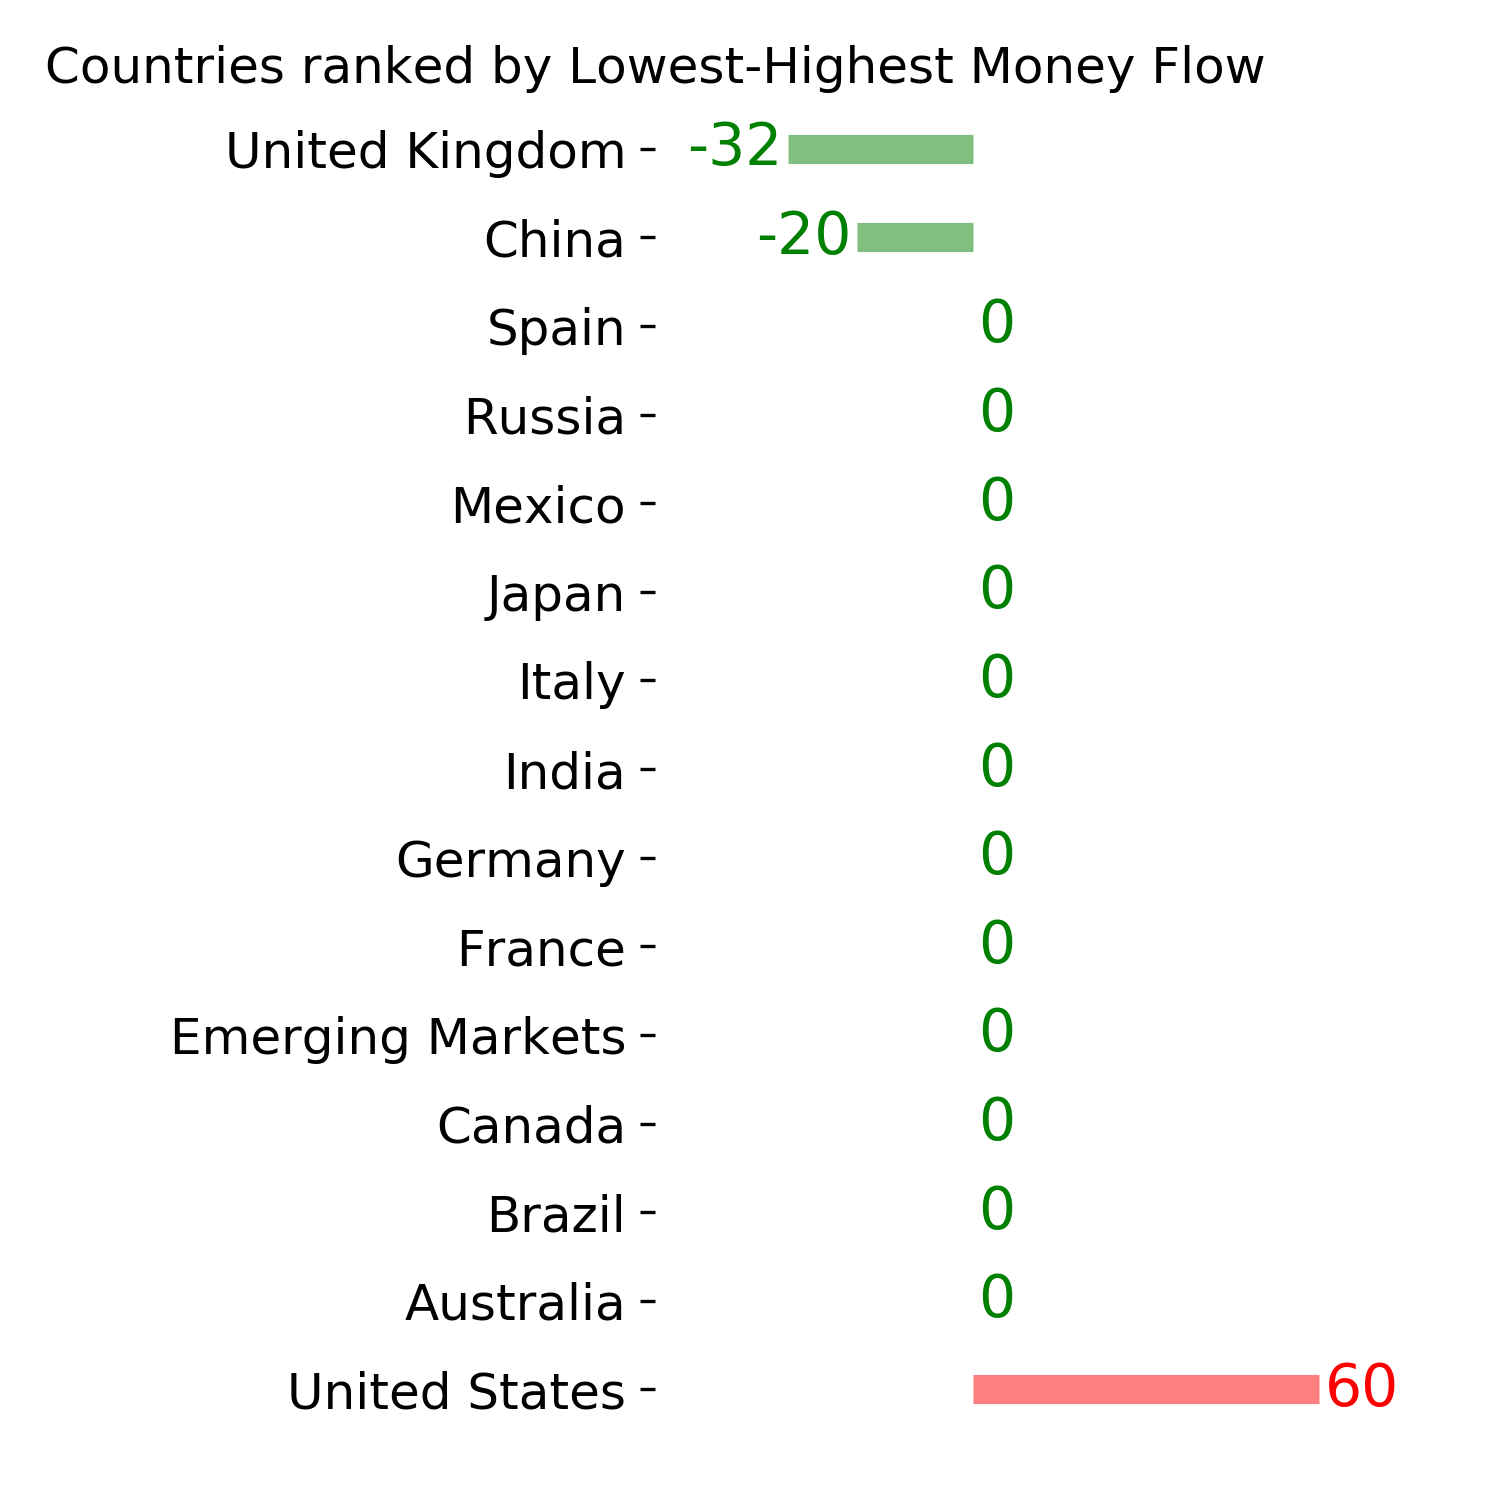
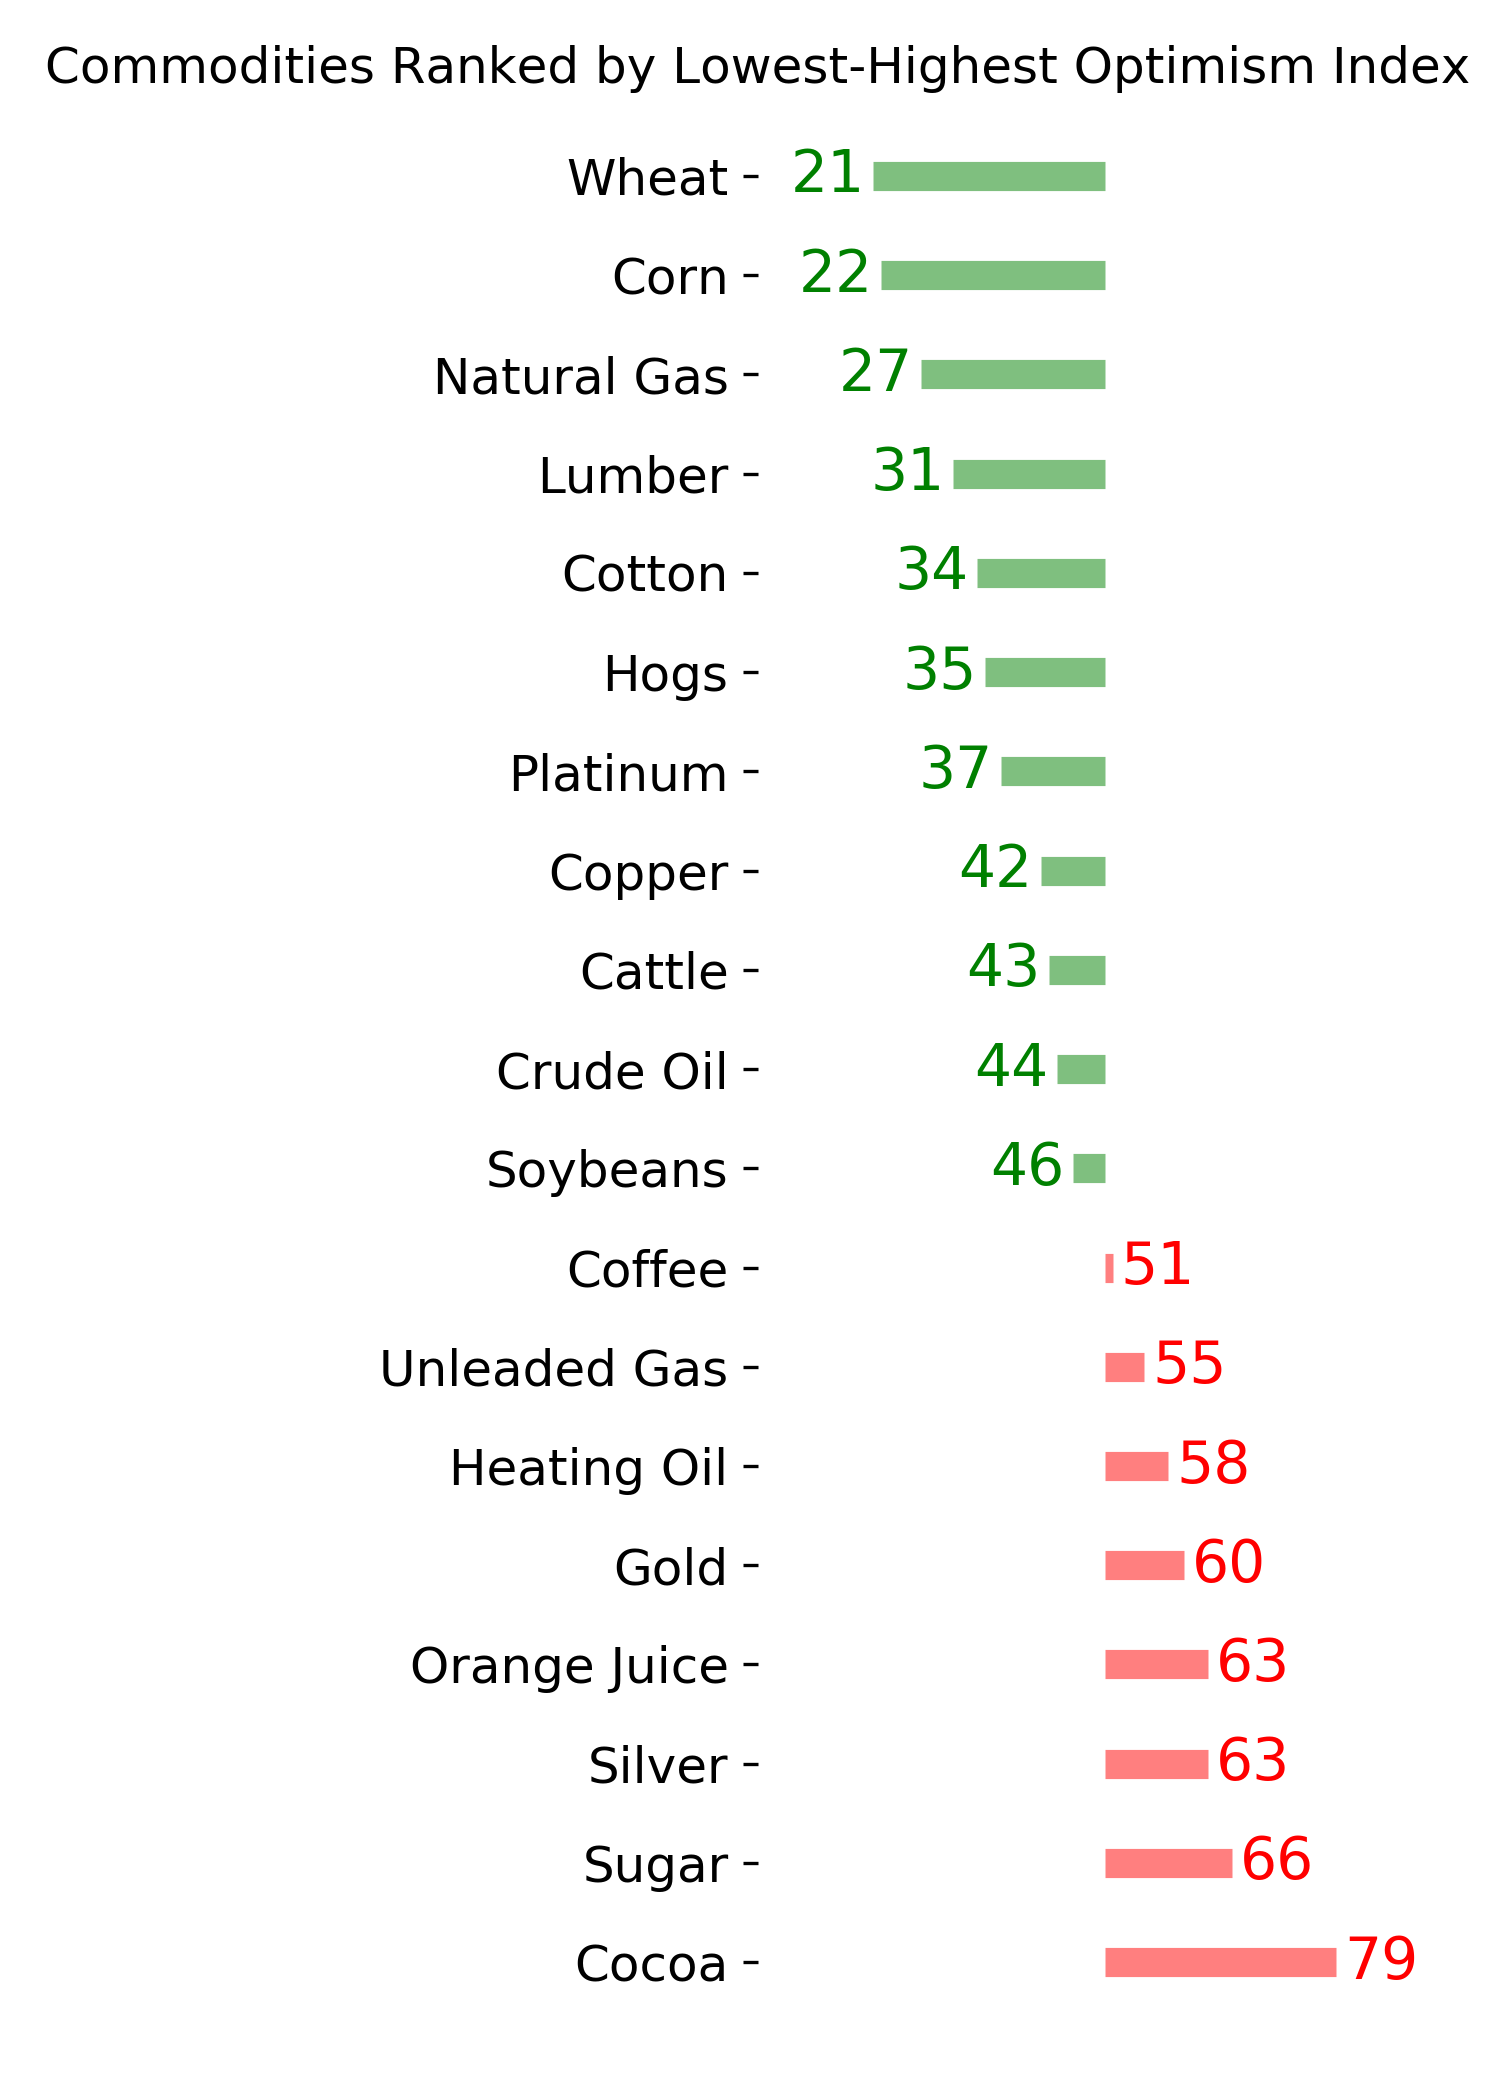
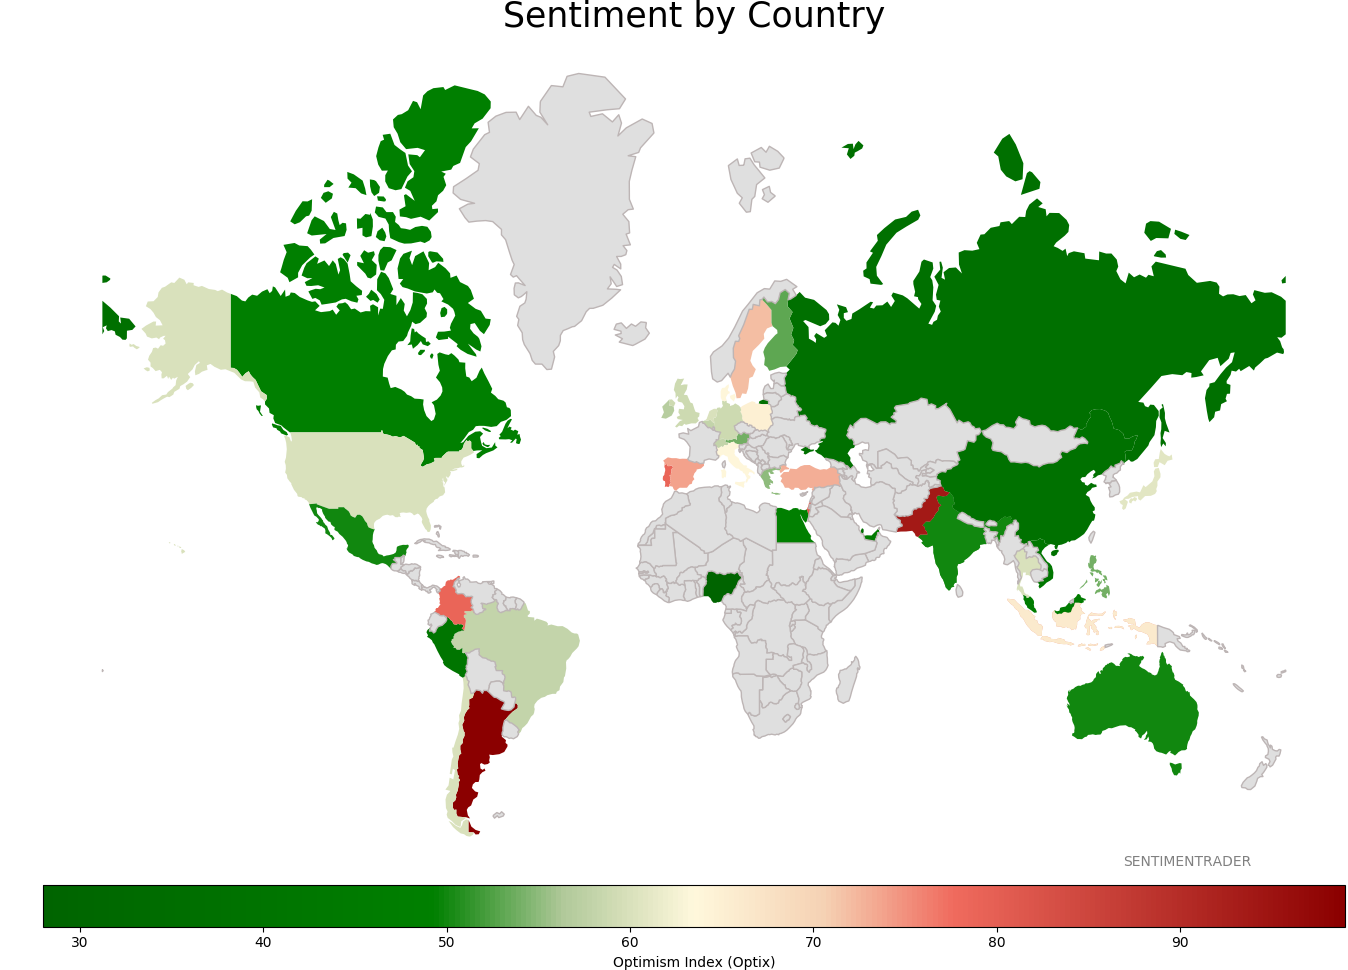
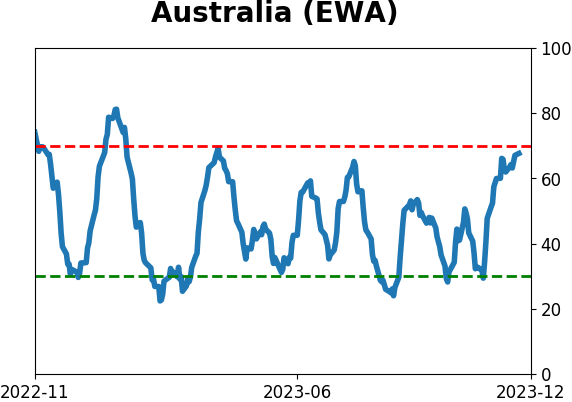
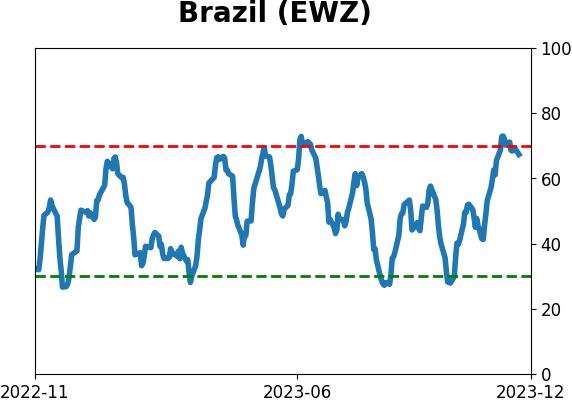
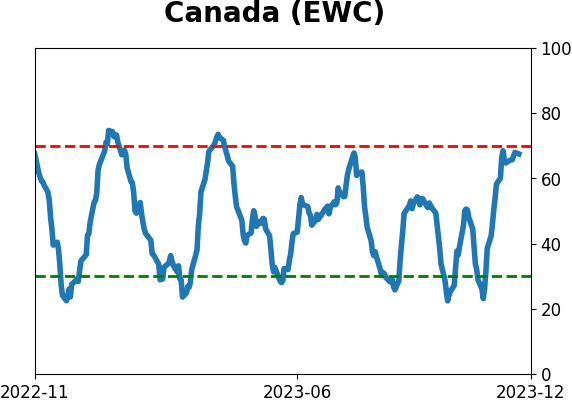
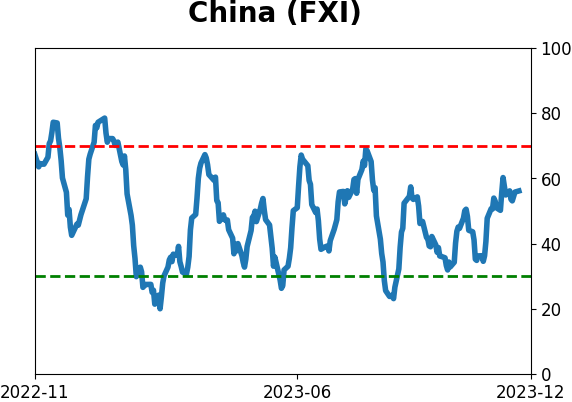
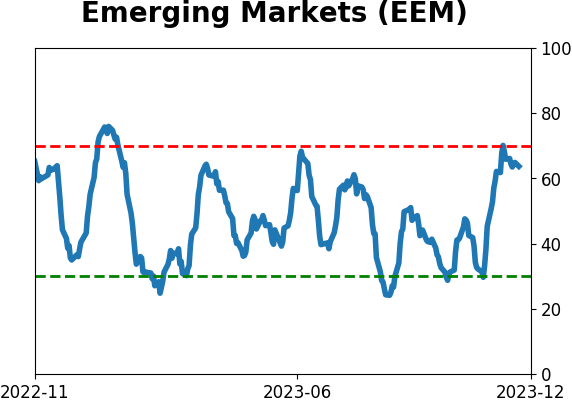
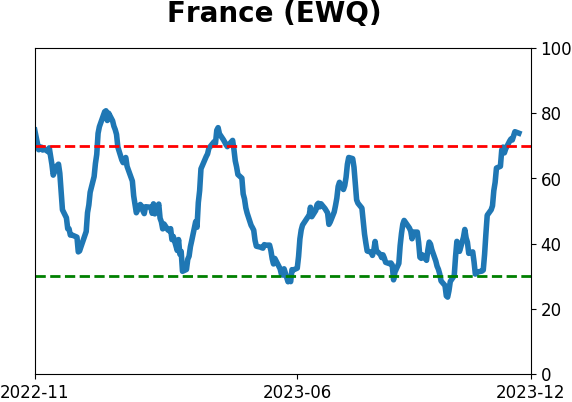
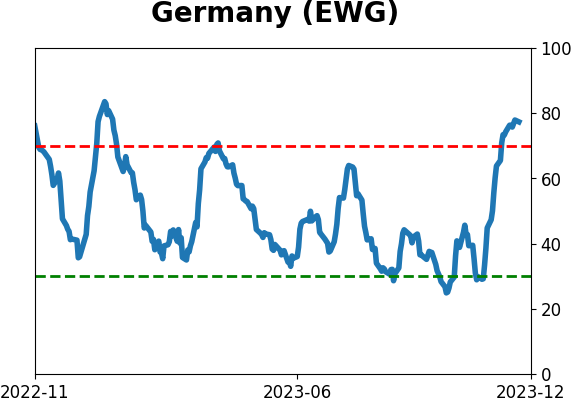
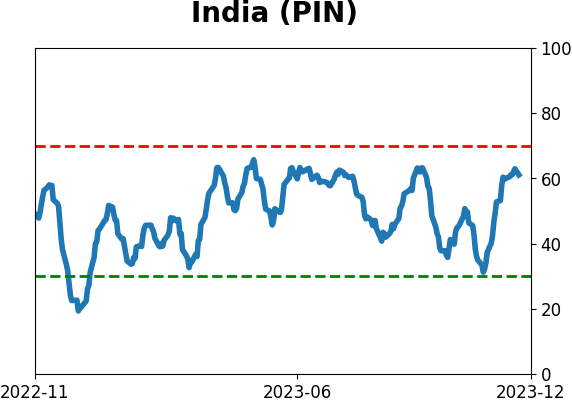
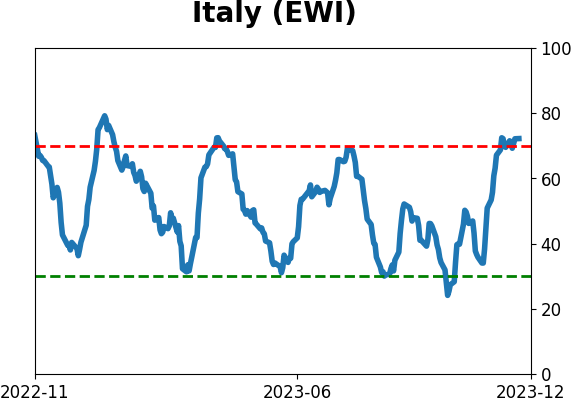
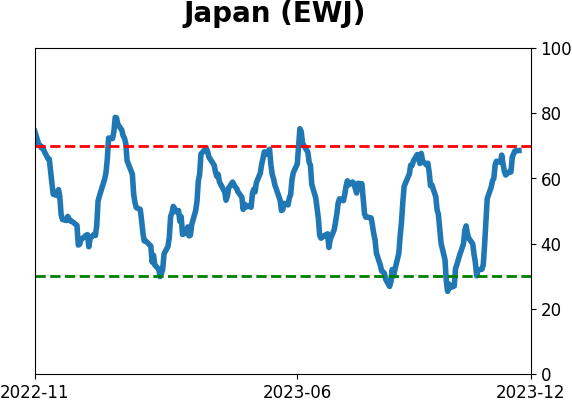
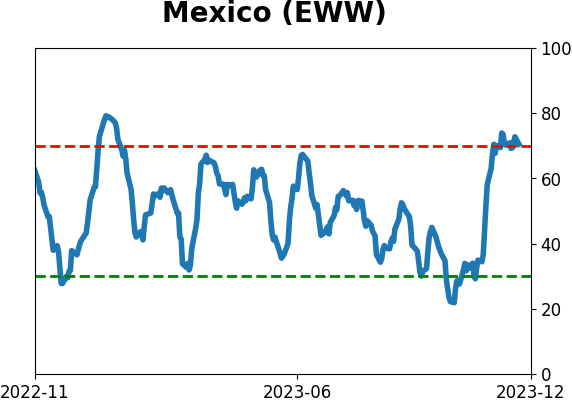
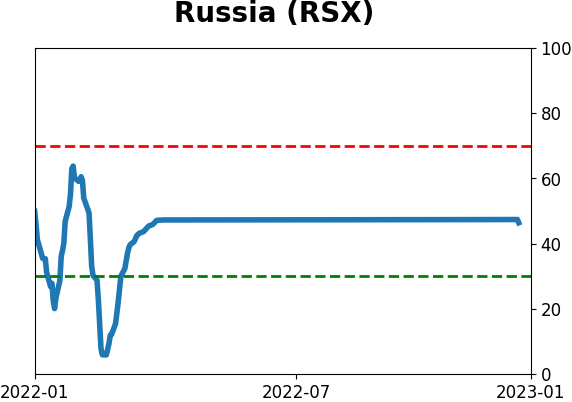
Sentiment Around The World
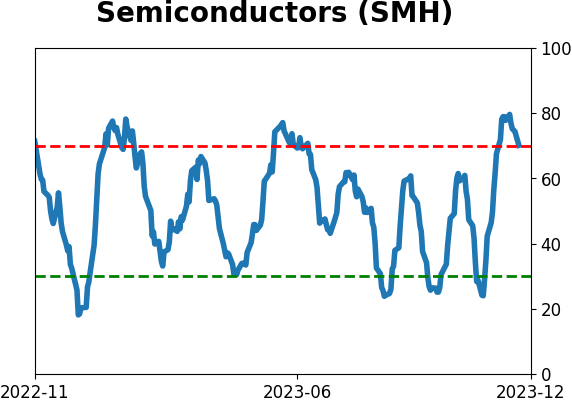
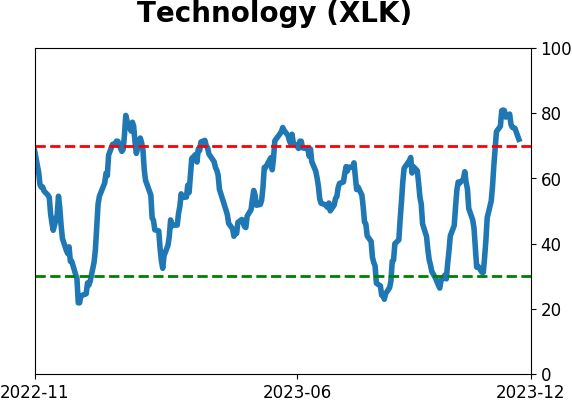
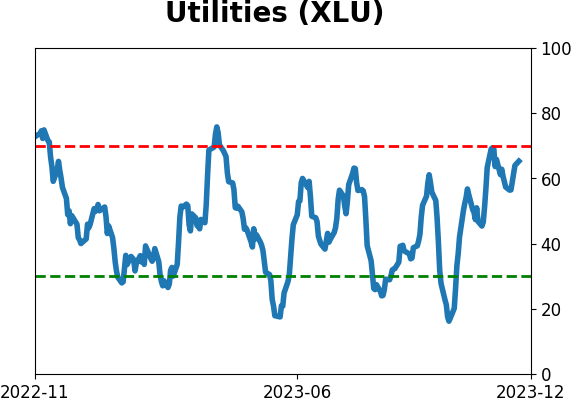
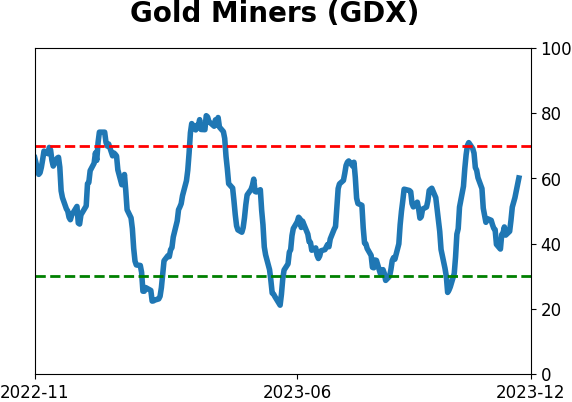
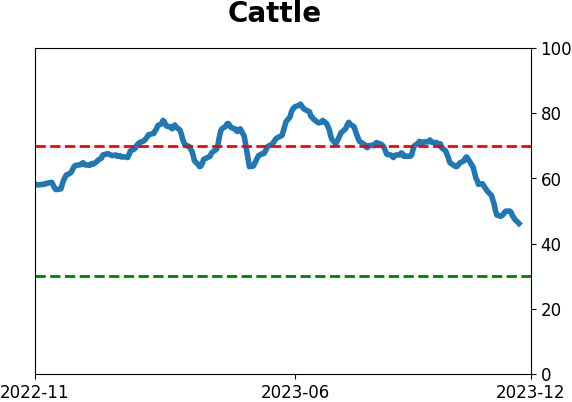
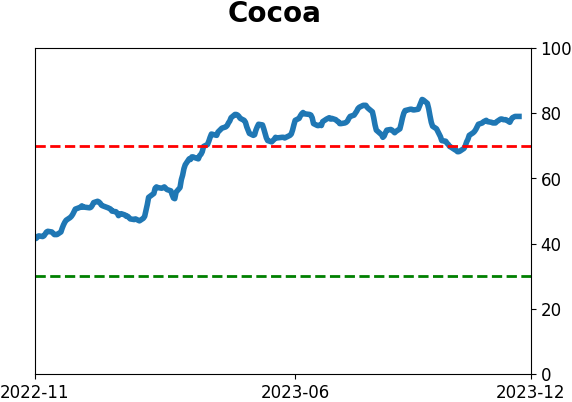
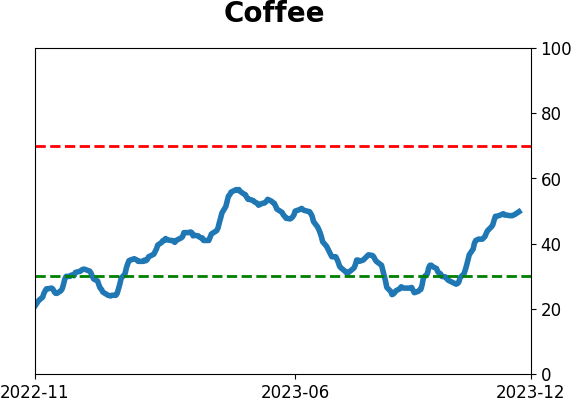
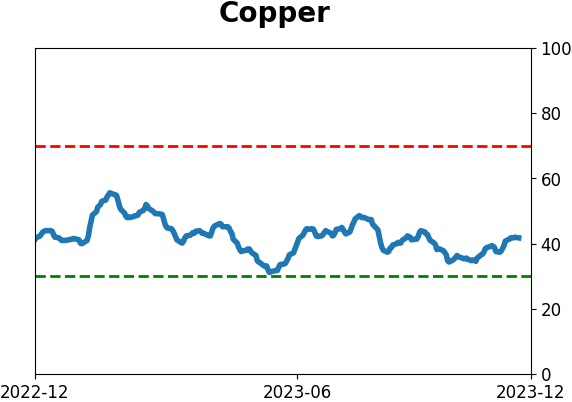
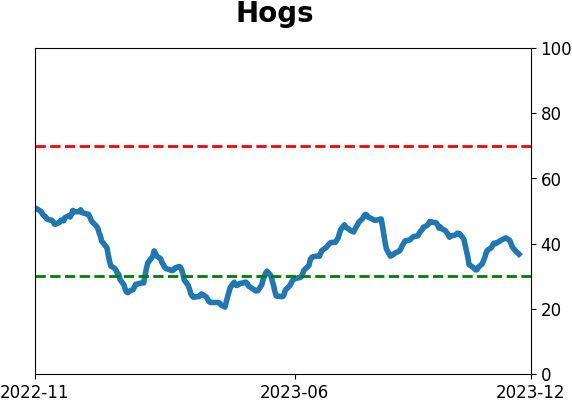
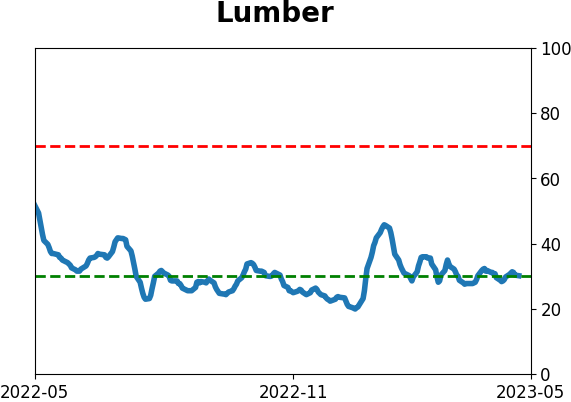
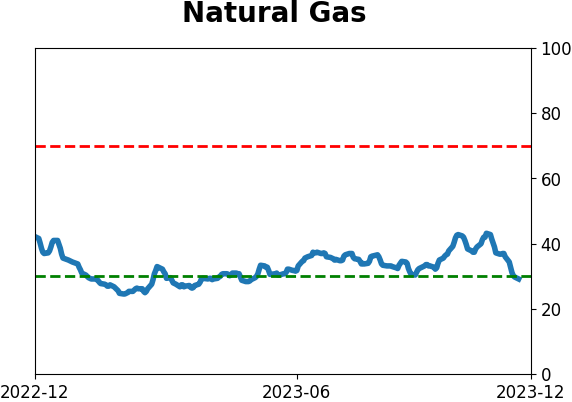
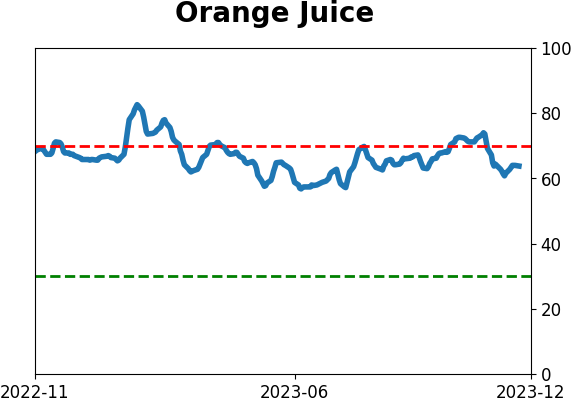
Optimism Index Thumbnails
|
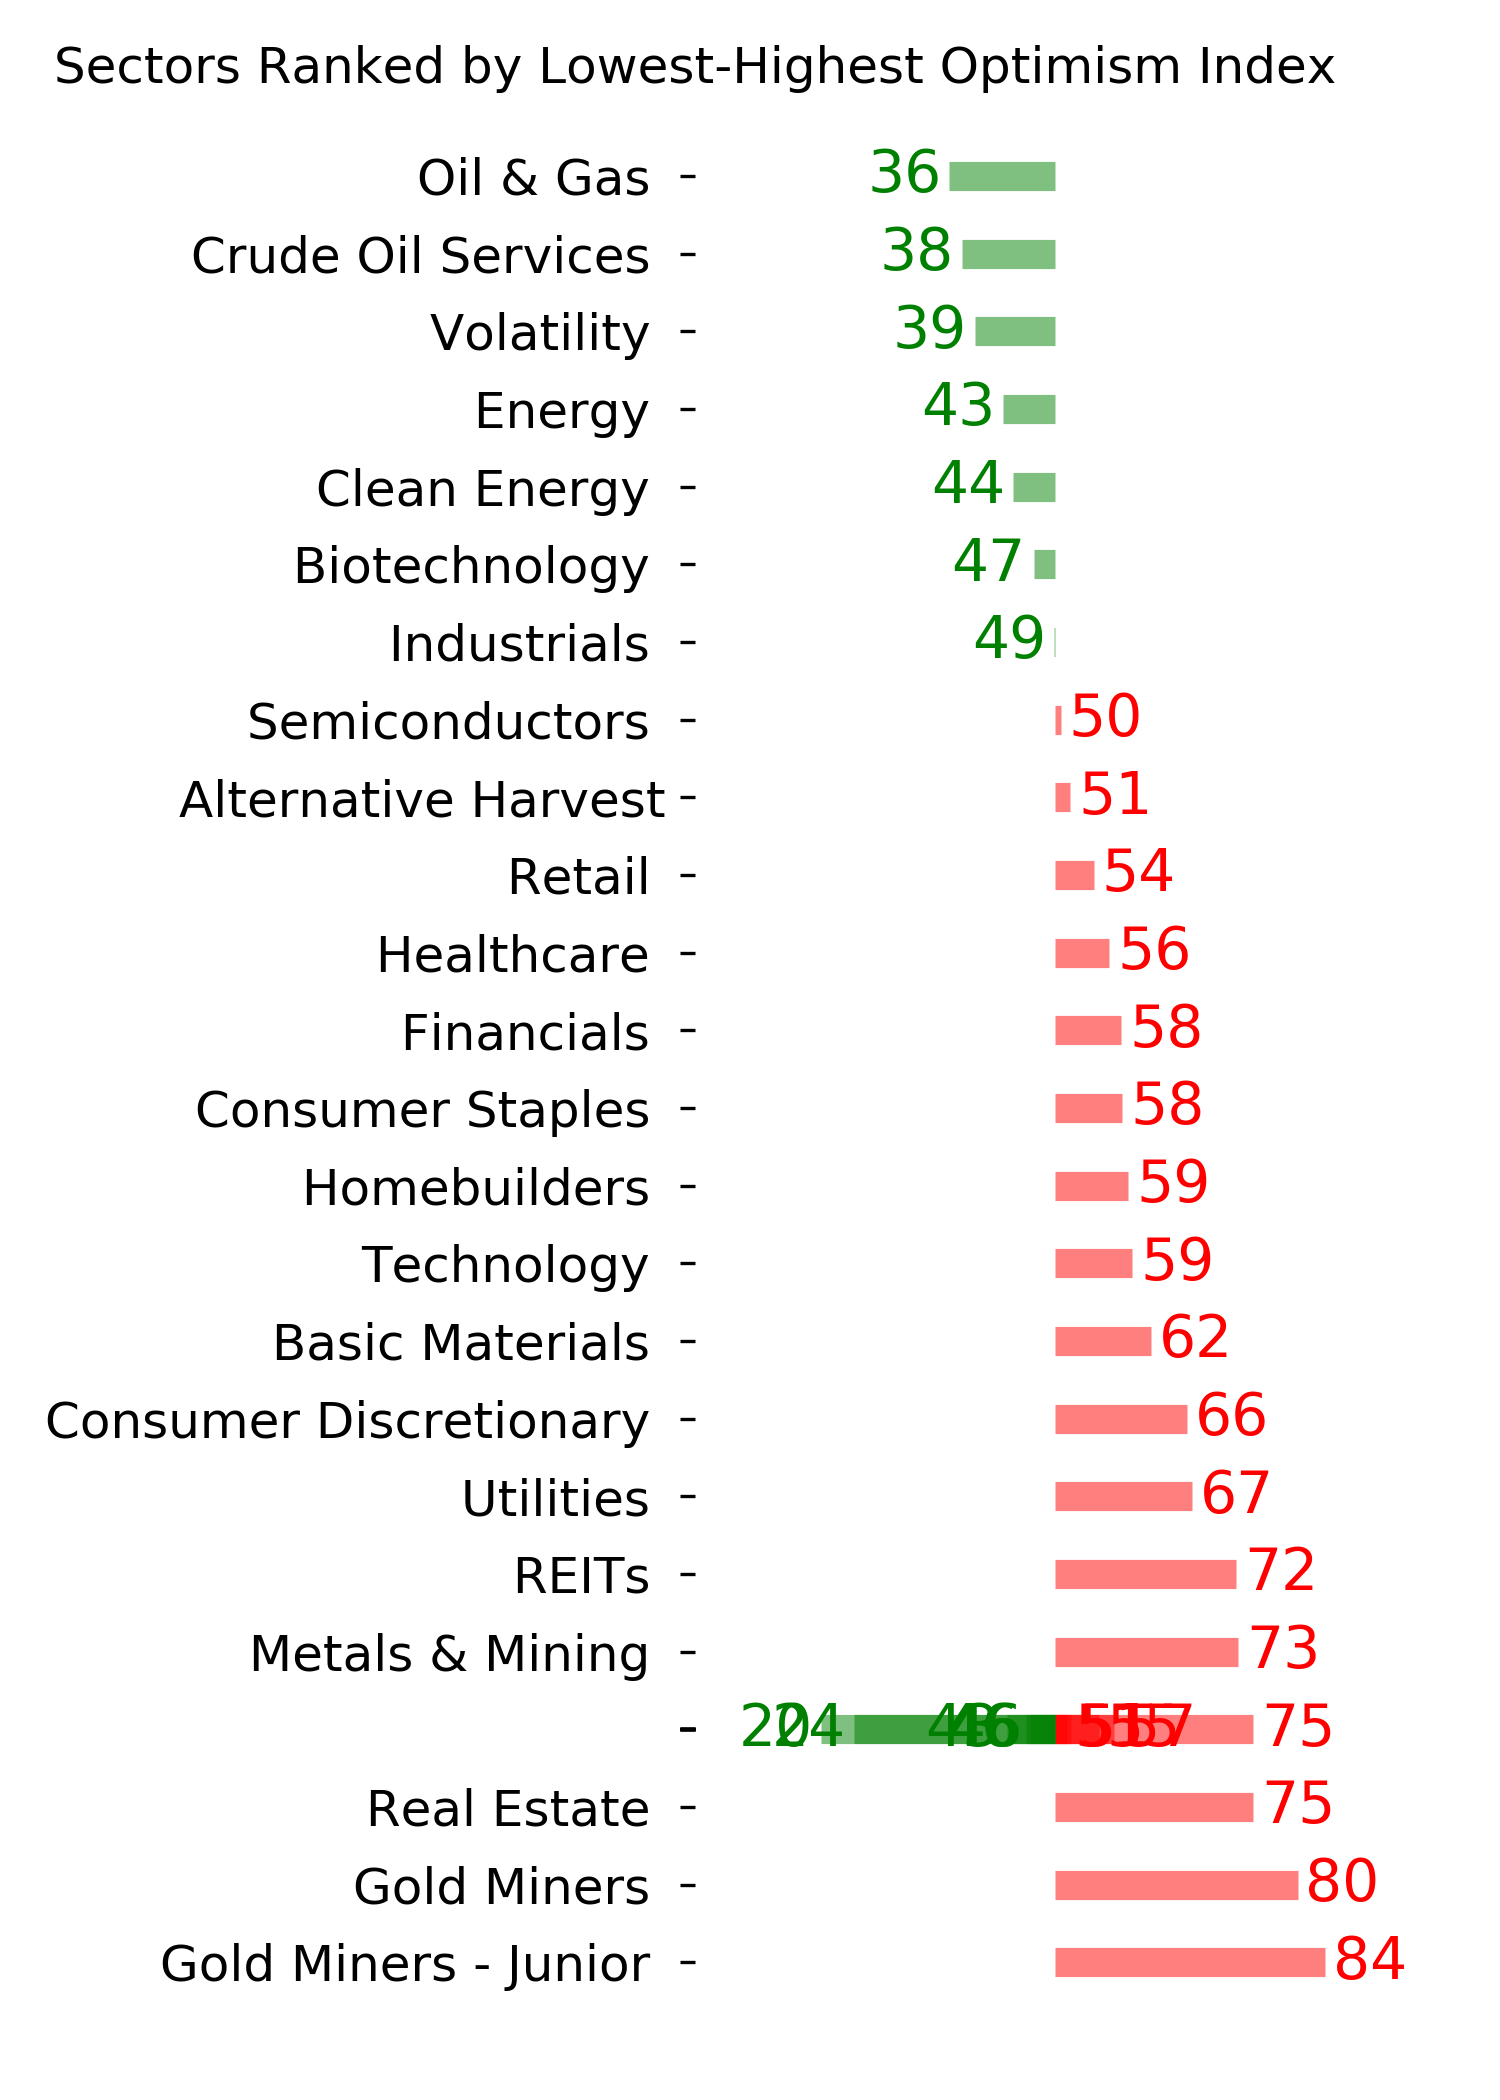
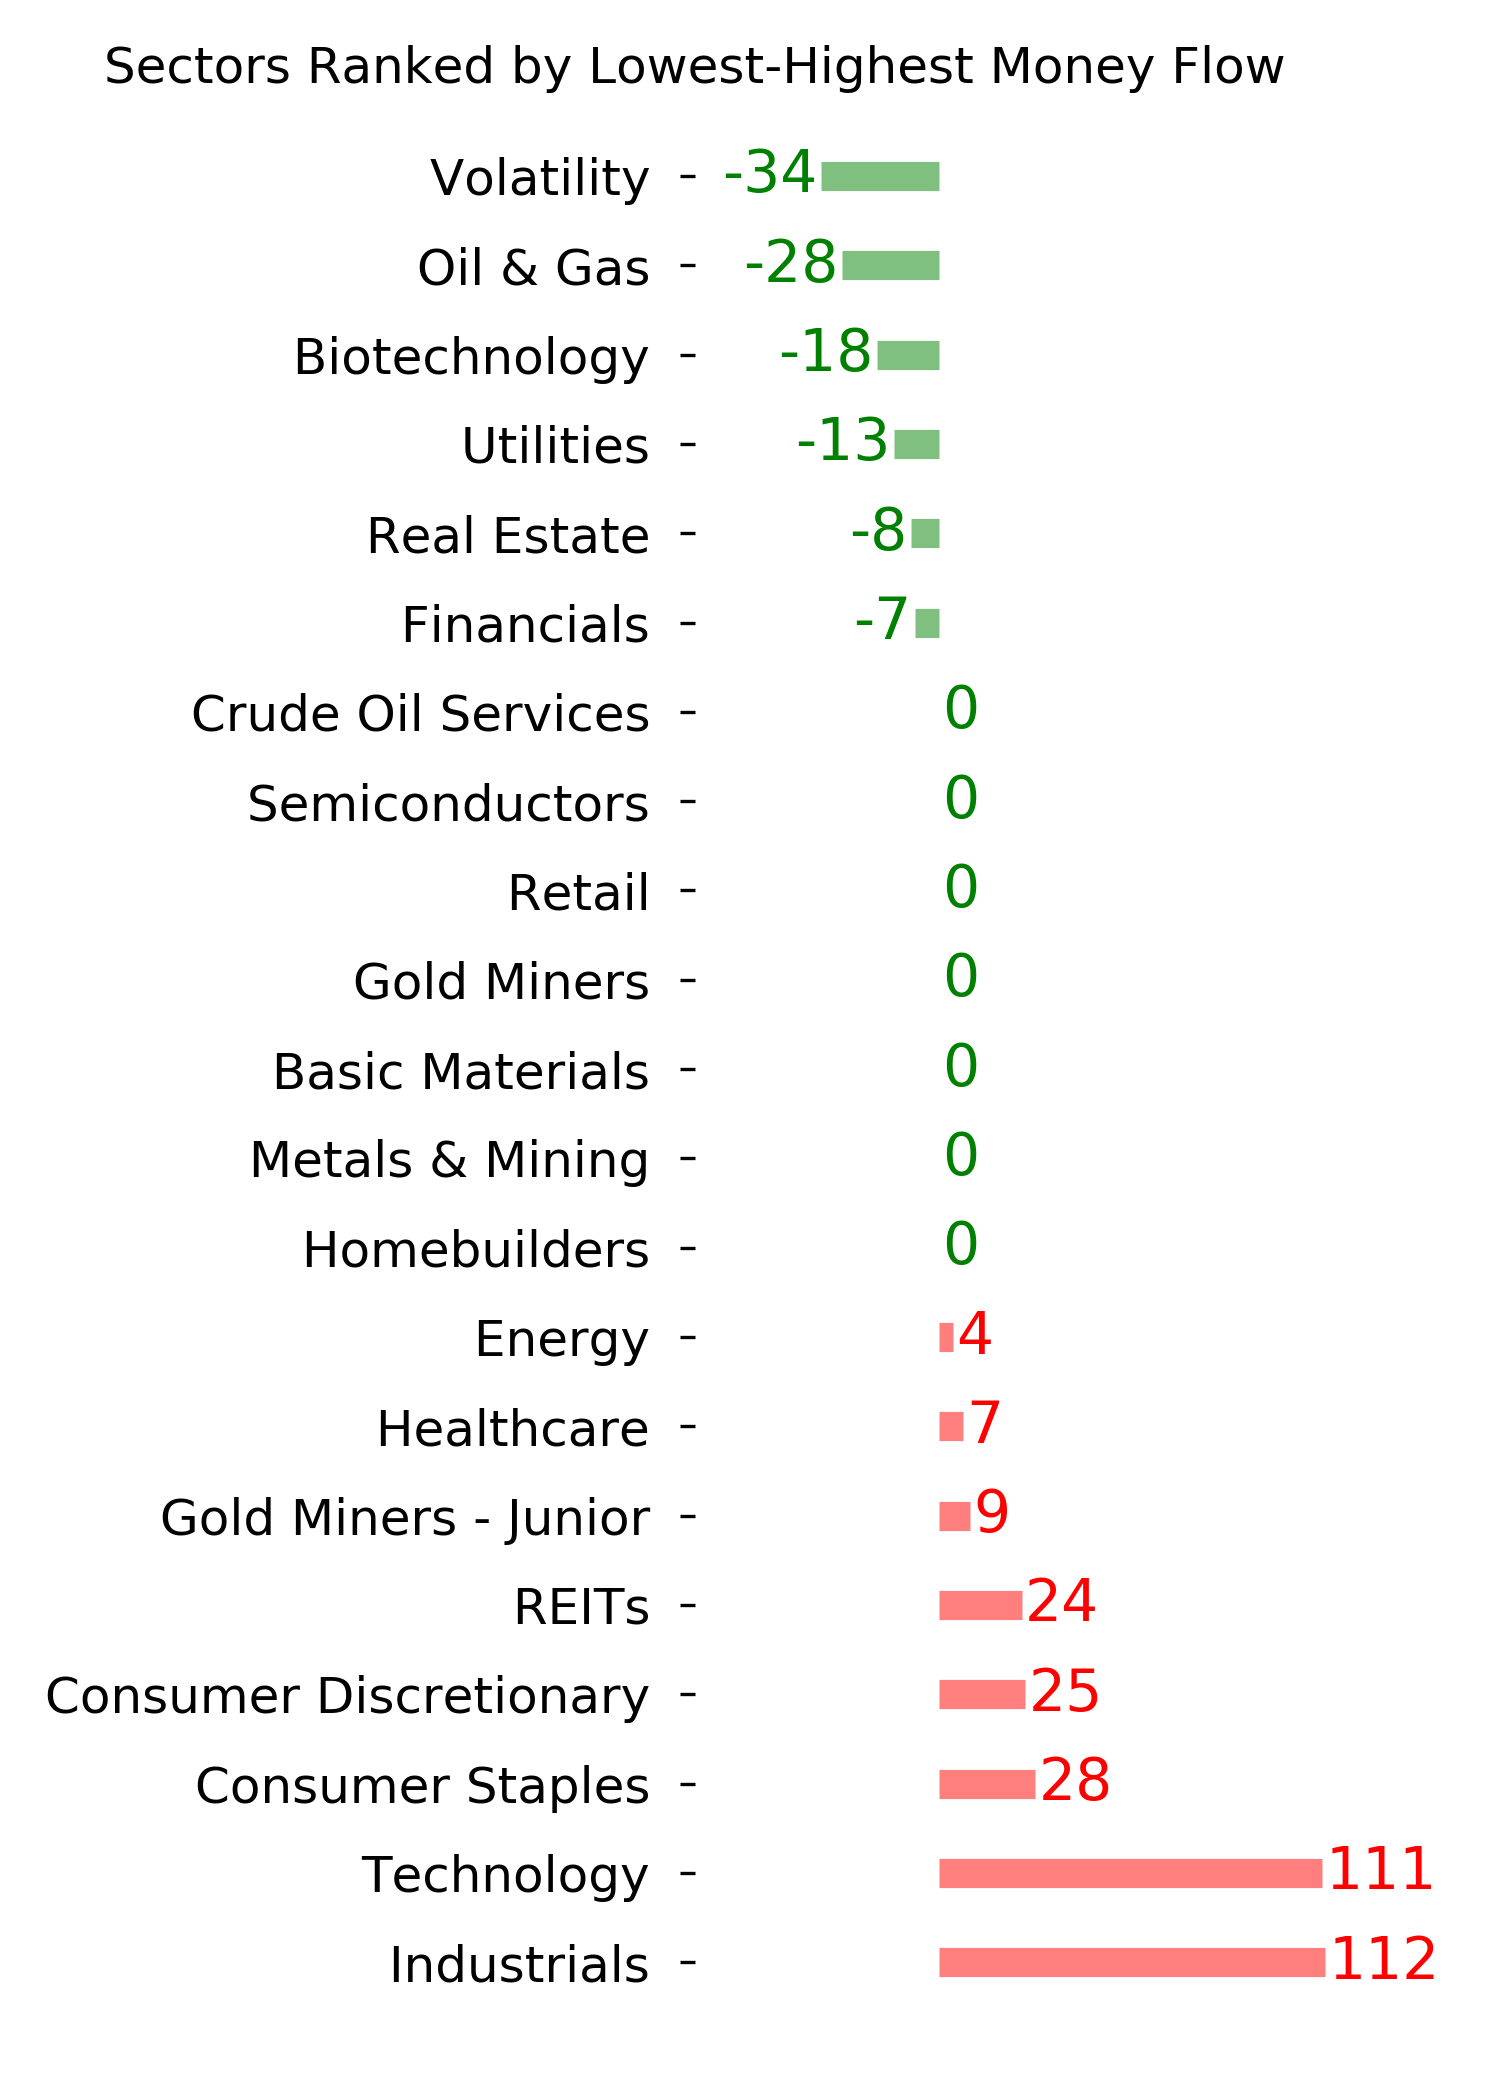
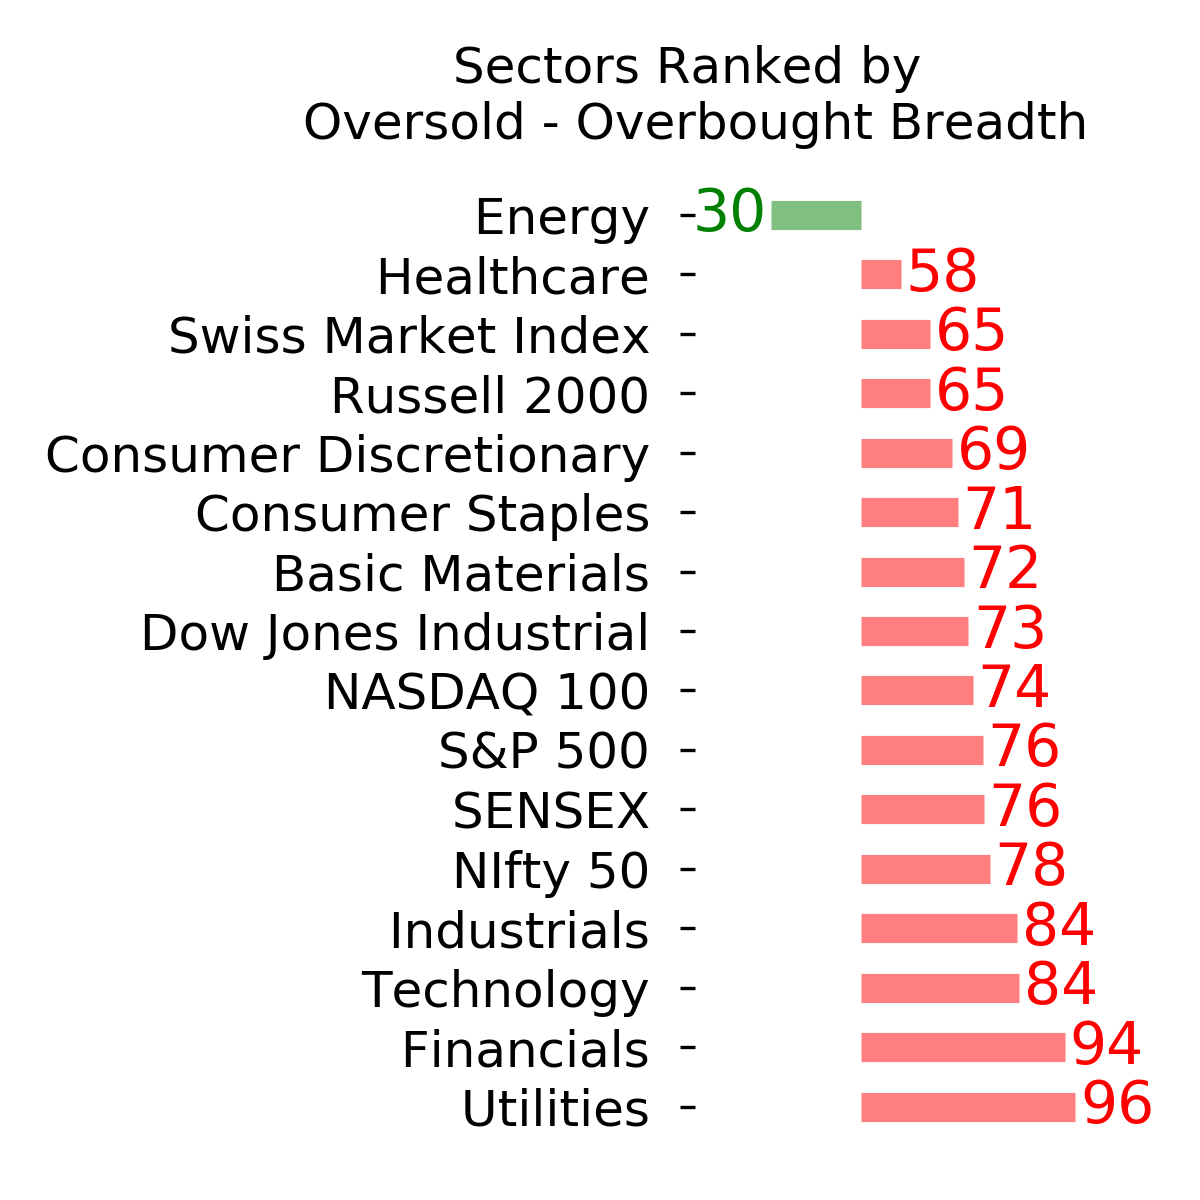
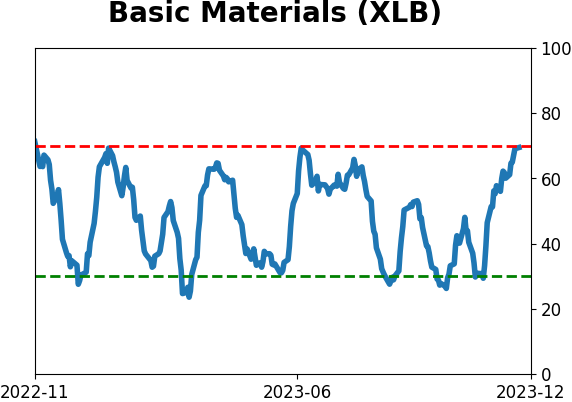
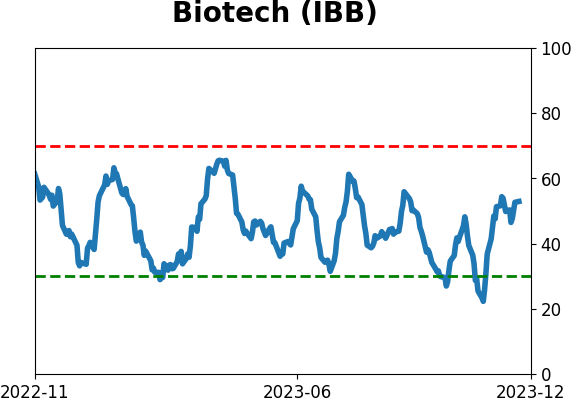
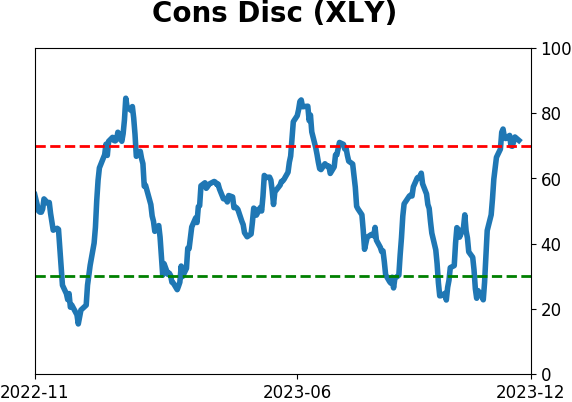
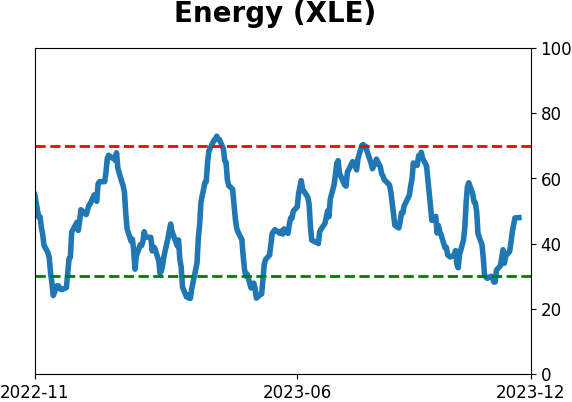
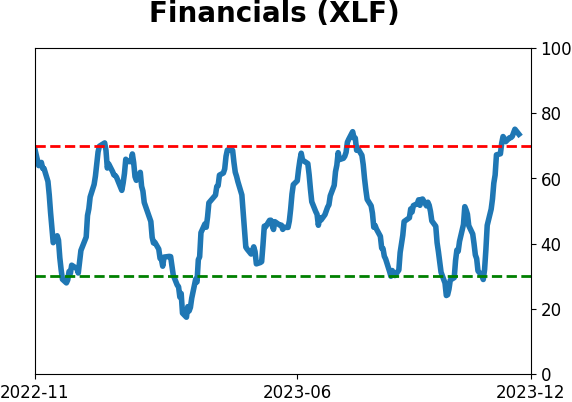
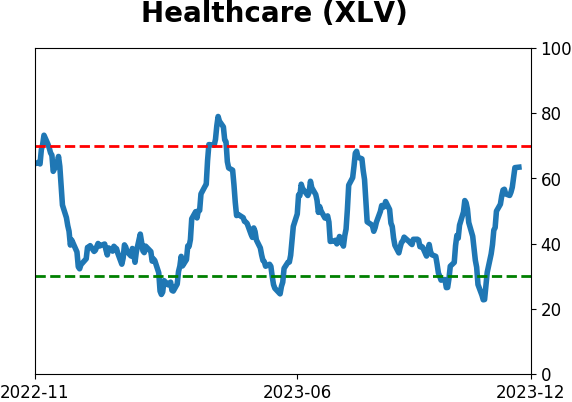
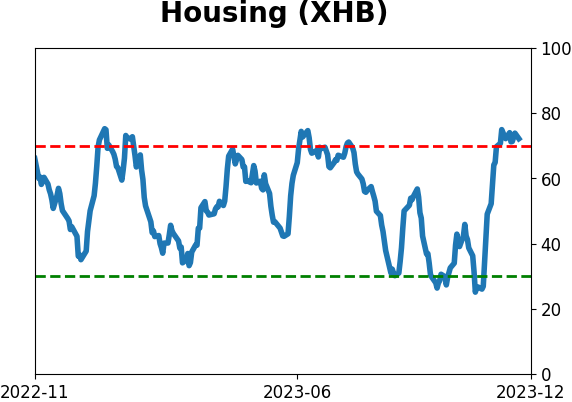
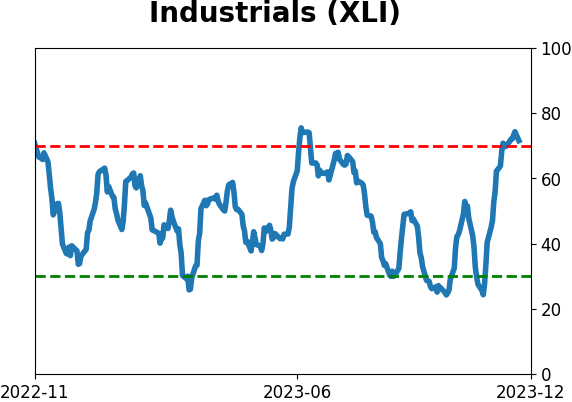
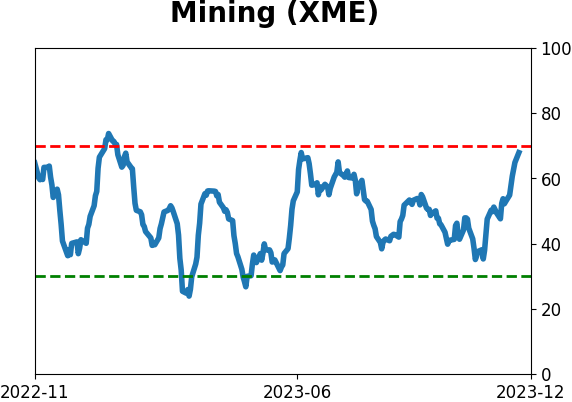
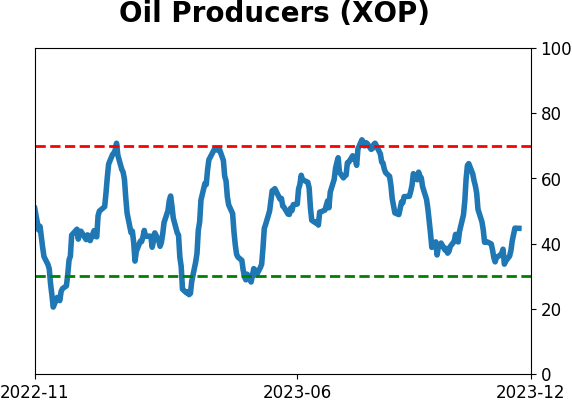
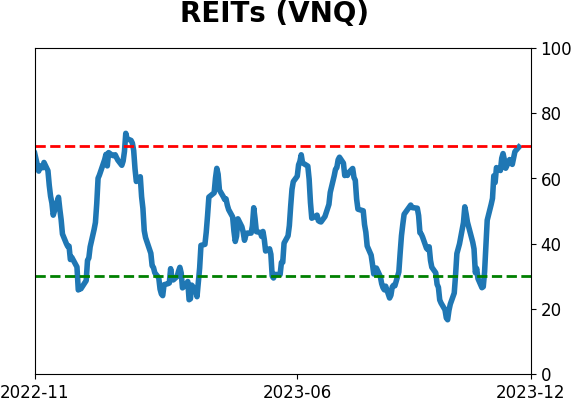
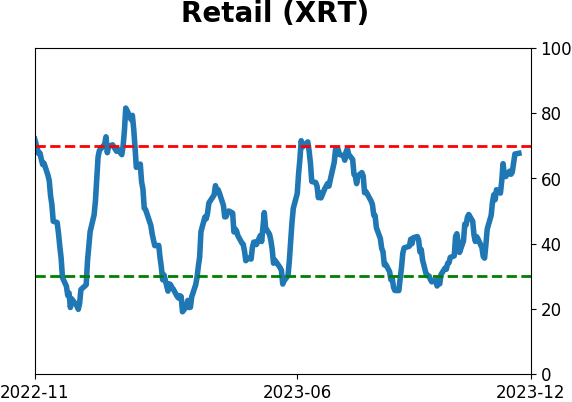
Sector ETF's - 10-Day Moving Average
|
|
|
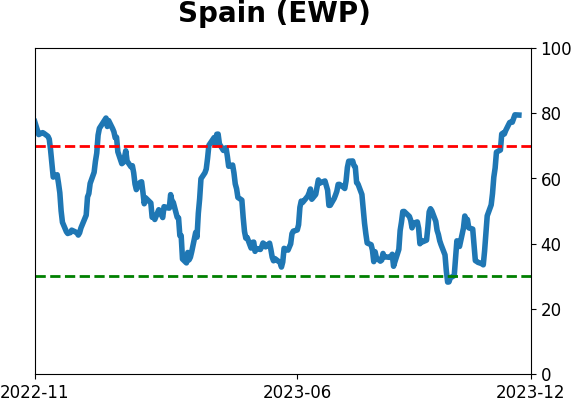
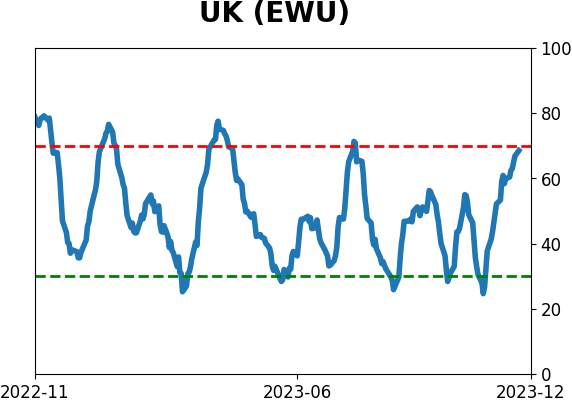
Country ETF's - 10-Day Moving Average
|
|
|
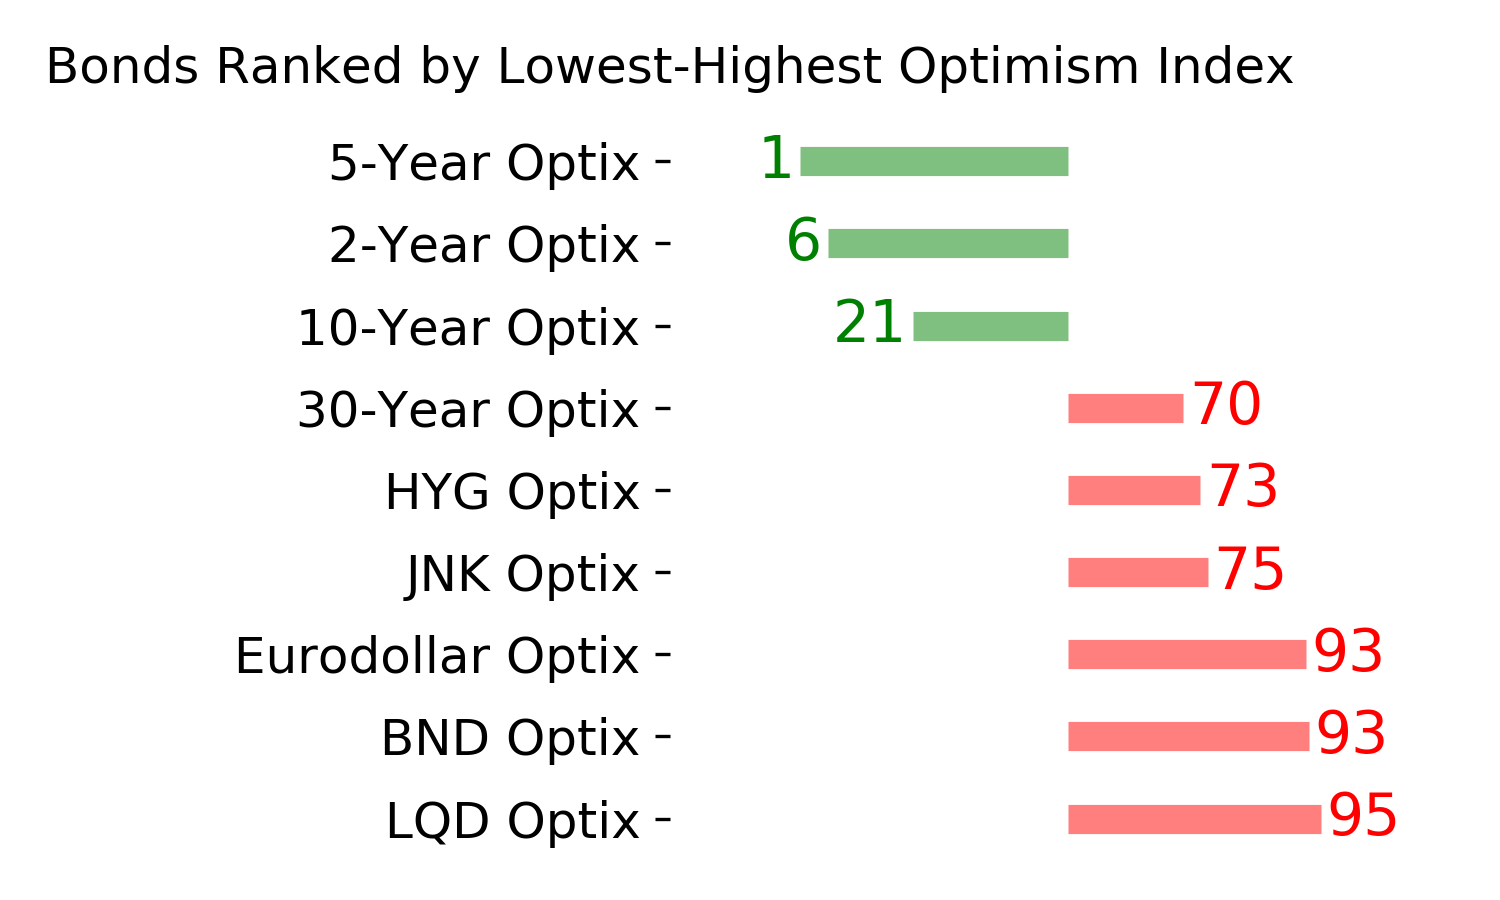
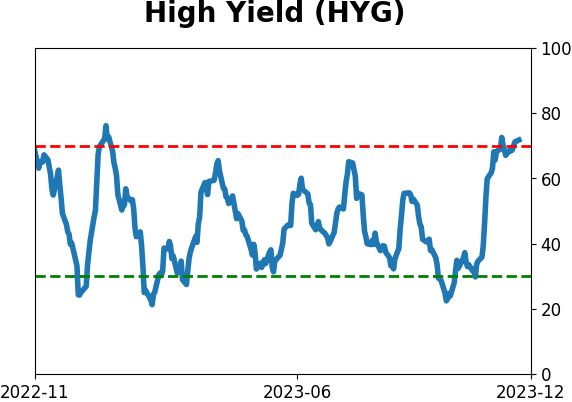
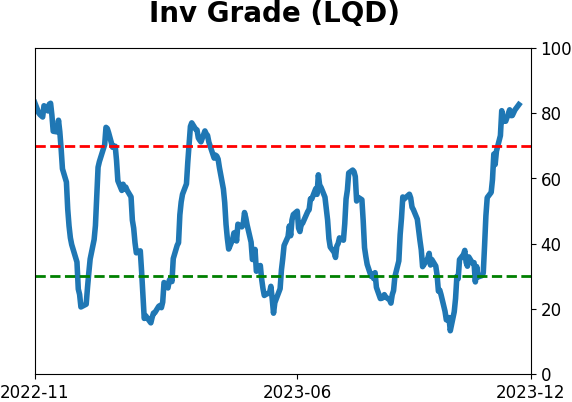
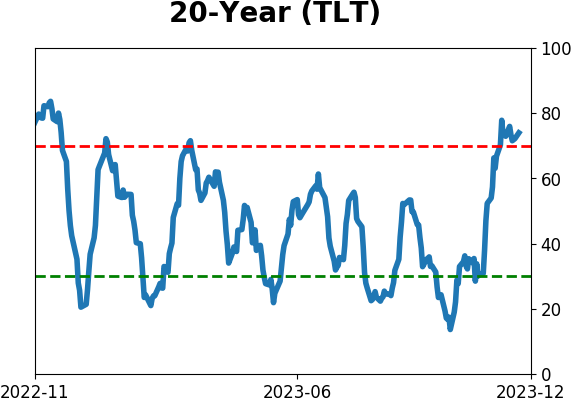
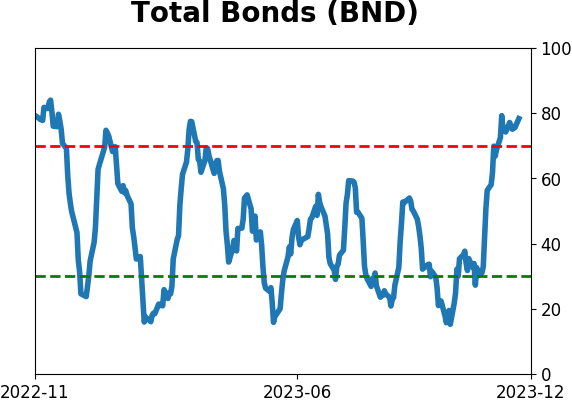
Bond ETF's - 10-Day Moving Average
|
|
|
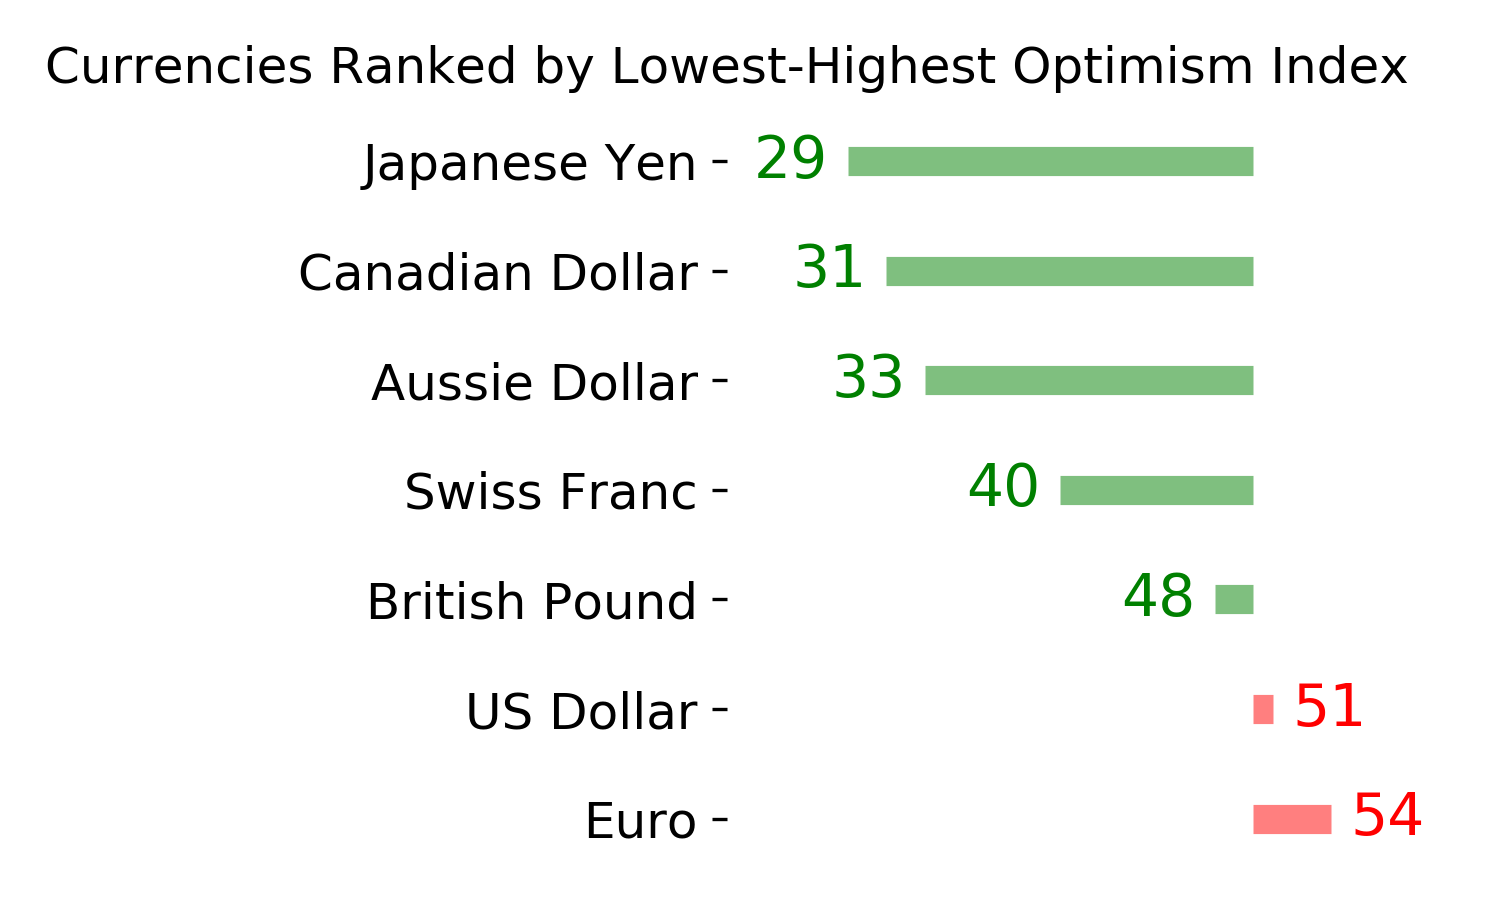
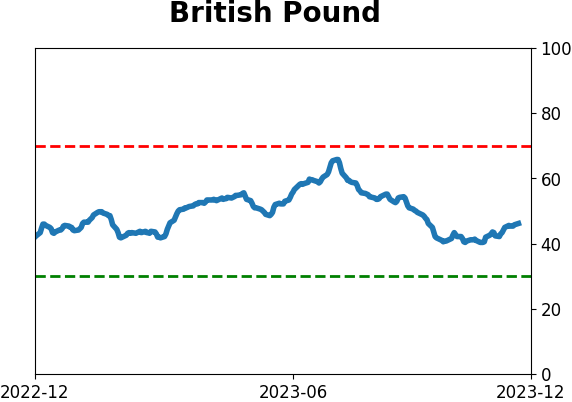
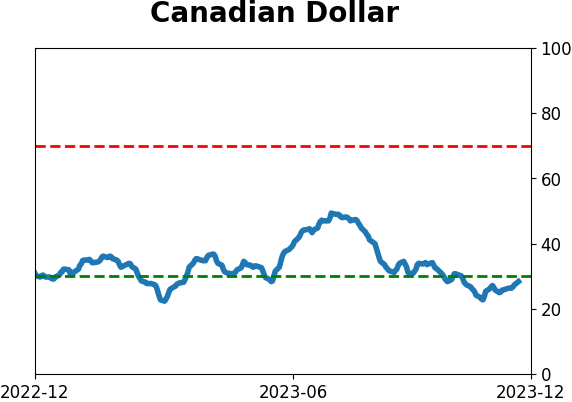
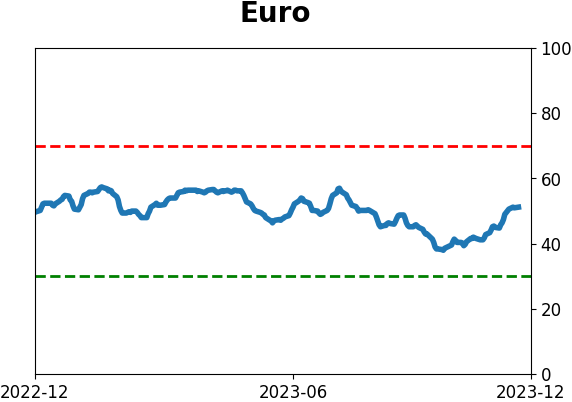
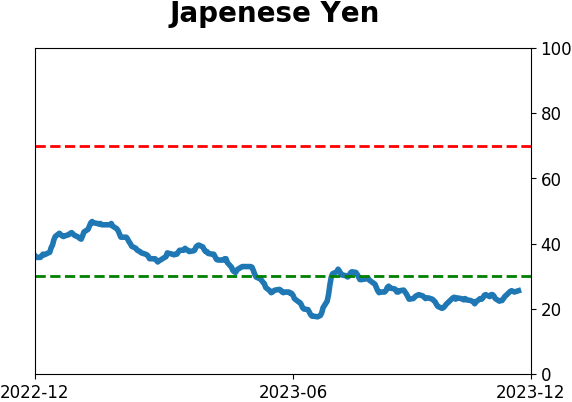
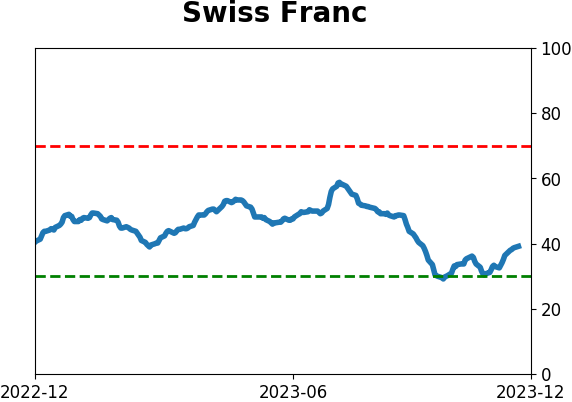
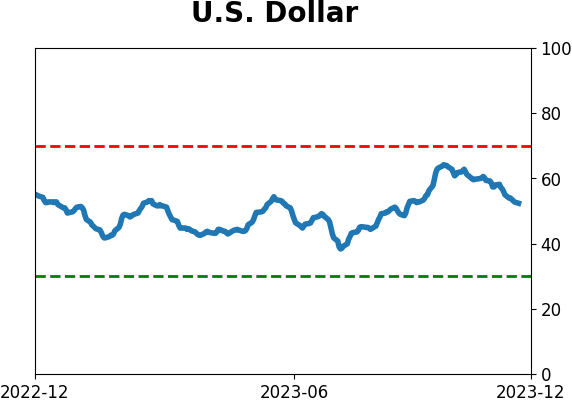
Currency ETF's - 5-Day Moving Average
|
|
|
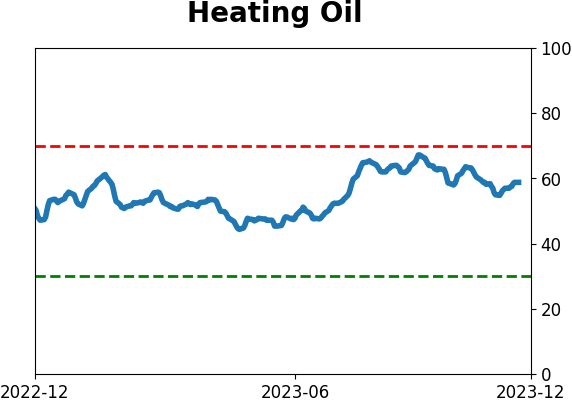
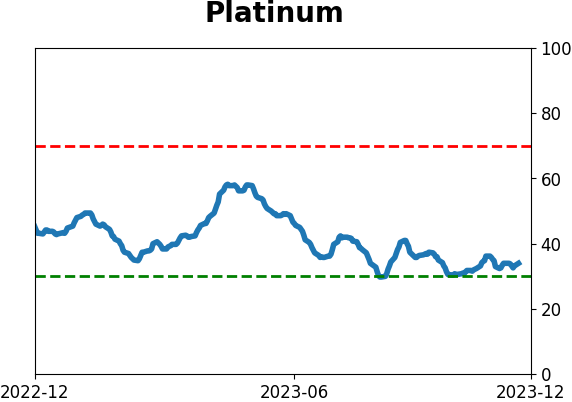
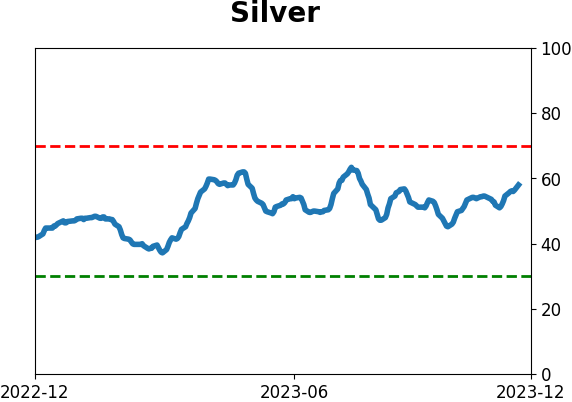
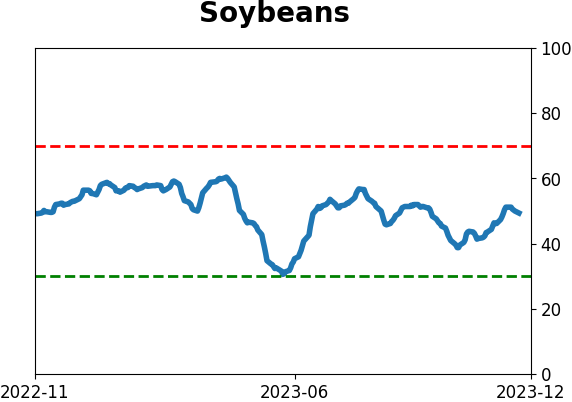
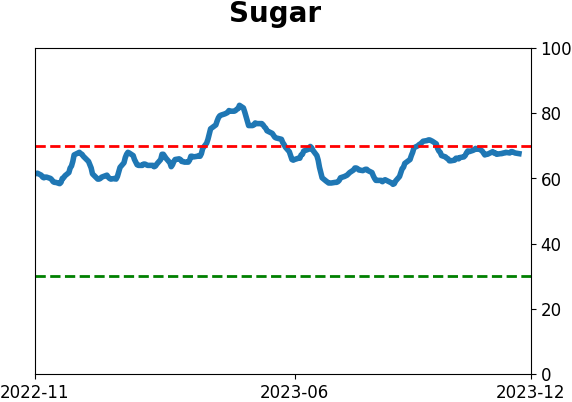
Commodity ETF's - 5-Day Moving Average
|
|