Headlines
|
|
This breadth signal triggered for only the 6th since 1926:
A rare New York stock exchange breadth signal suggests a pause in the uptrend.
Bottom Line:
STOCKS: Hold By early October, sentiment had reset. Several important momentum streaks ended, which has brought in buyers in the past, and seasonality turned positive. We're now seeing signs that sentiment has quickly shifted, especially among options traders. It's gotten to an extreme that has preceded weaker-than-average returns.
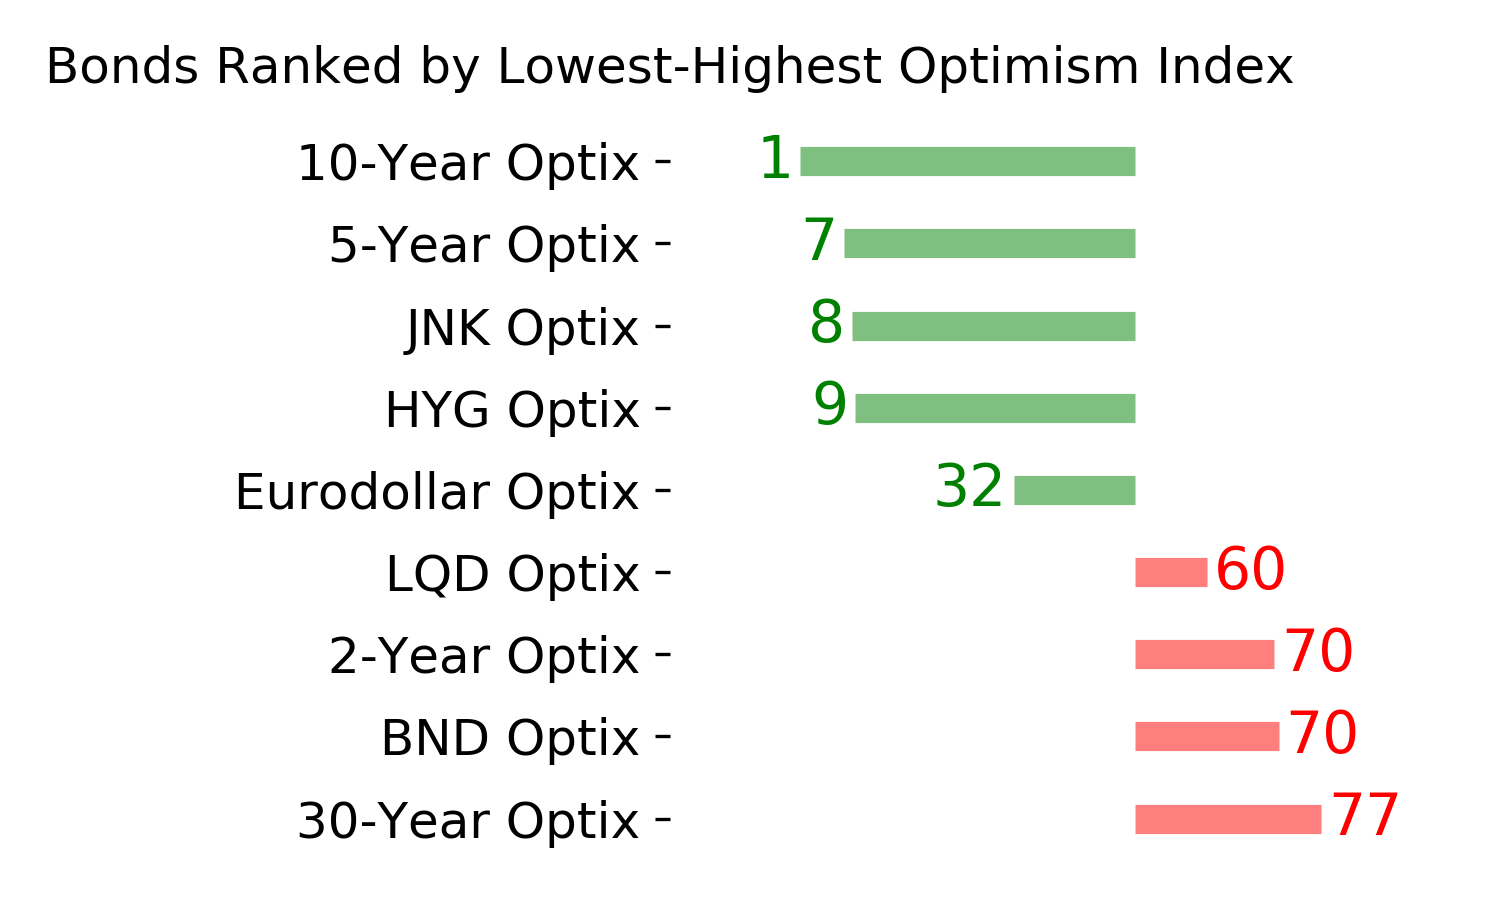
BONDS: Hold In late October, sentiment on bonds - from Treasuries to corporates - entered pessimistic territory. It's now starting to recover, with some quick moves in corporate bonds. We'll see if those bonds, in particular, can hold recent gains.
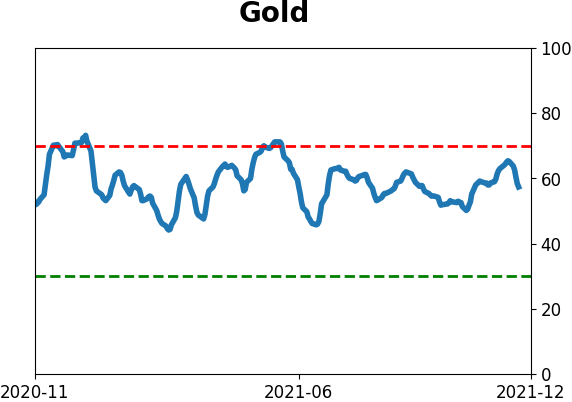
GOLD: Hold
Gold and miners were rejected after trying to recover above their 200-day averages in May. Some oversold extremes in breadth measures among miners triggered in late September, and they've recovered a bit since then. The group still has some proving to do.
|
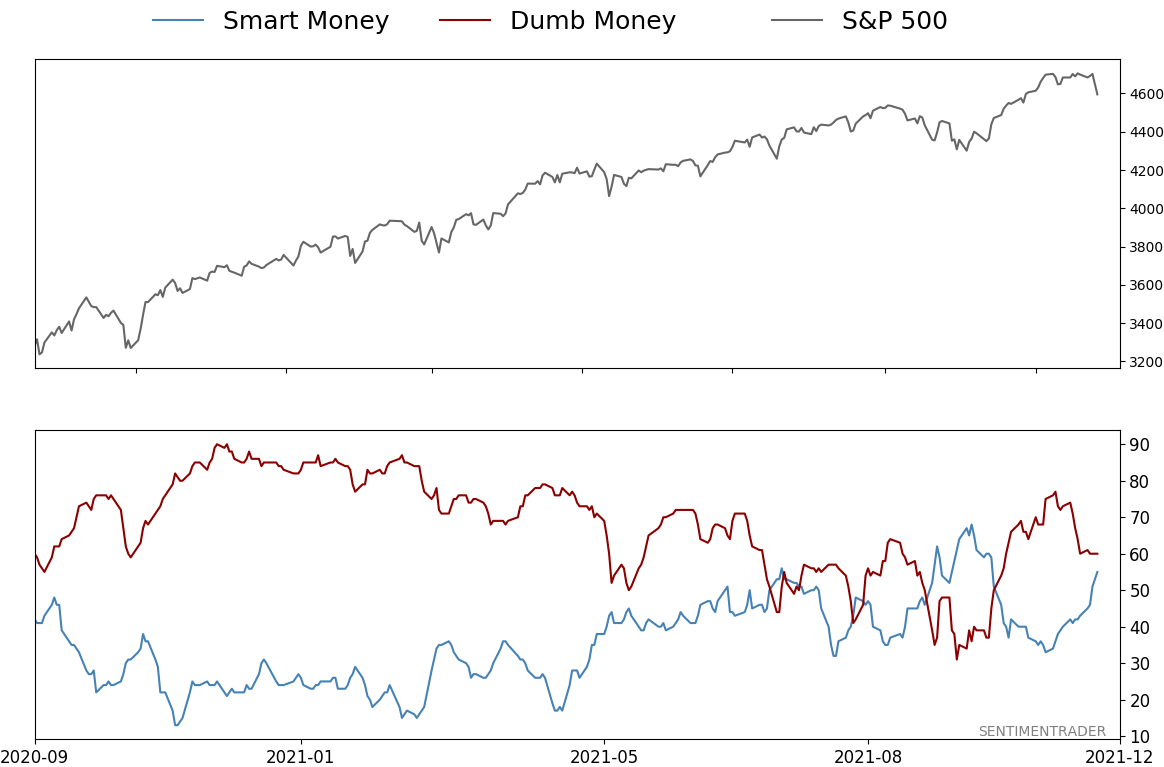
Smart / Dumb Money Confidence
|
Smart Money Confidence: 55%
Dumb Money Confidence: 60%
|
|
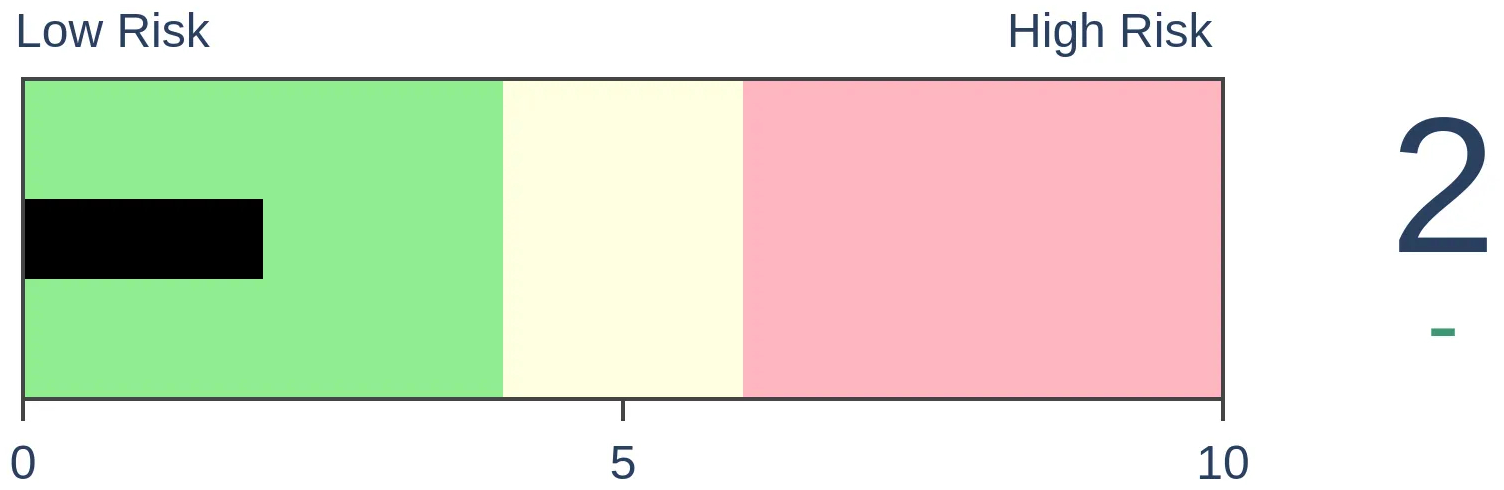
Risk Levels
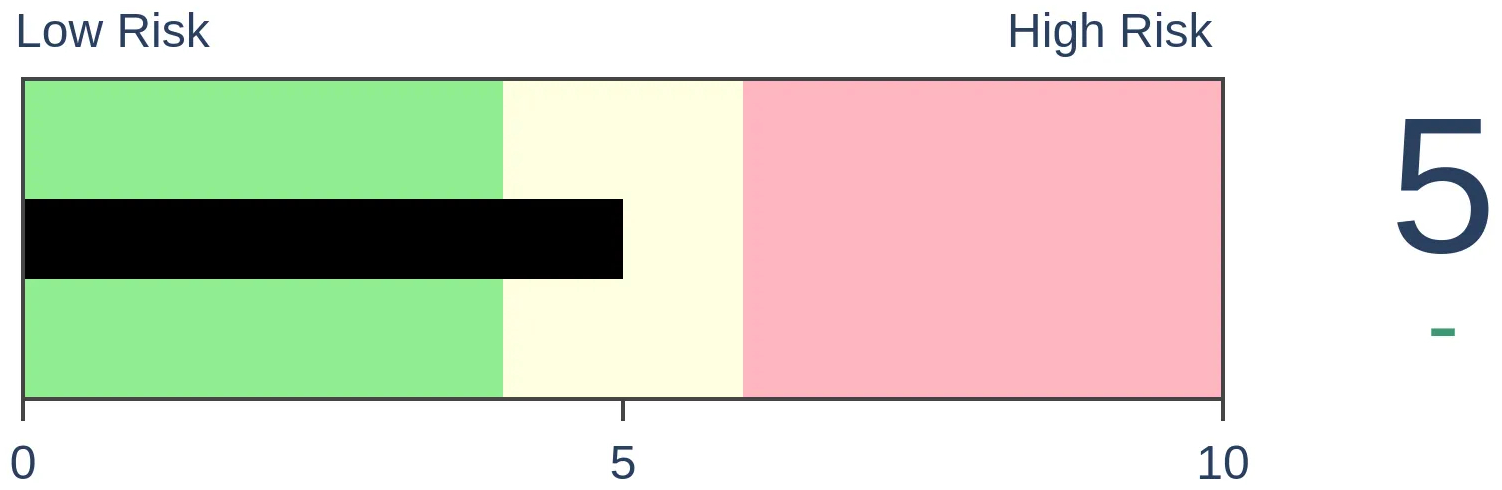
Stocks Short-Term
|
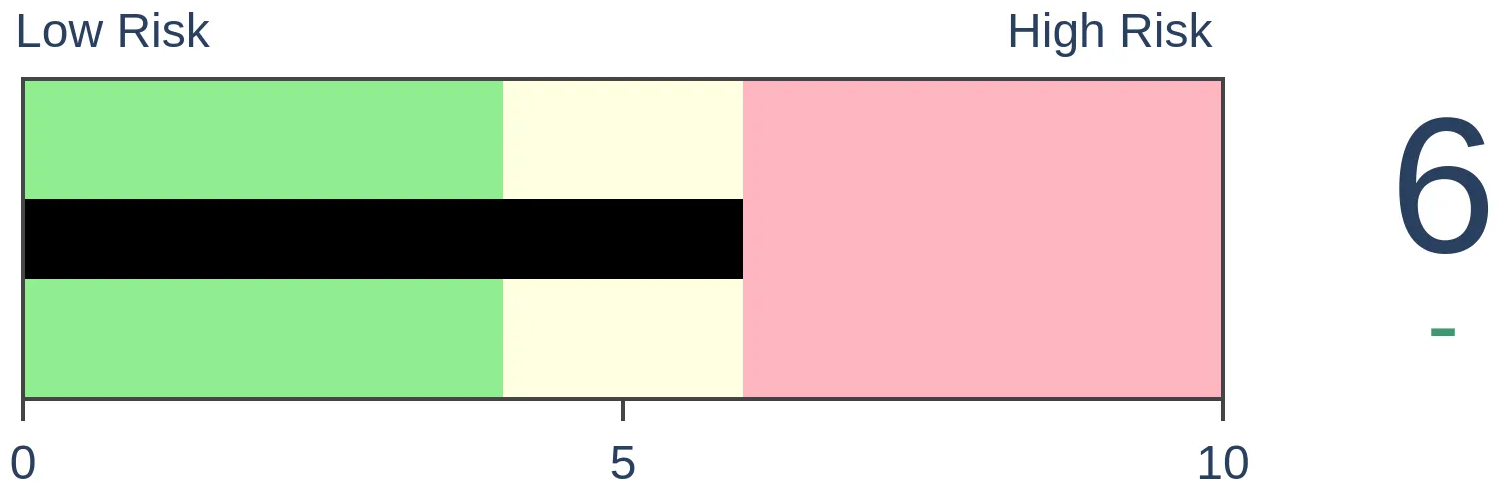
Stocks Medium-Term
|
|
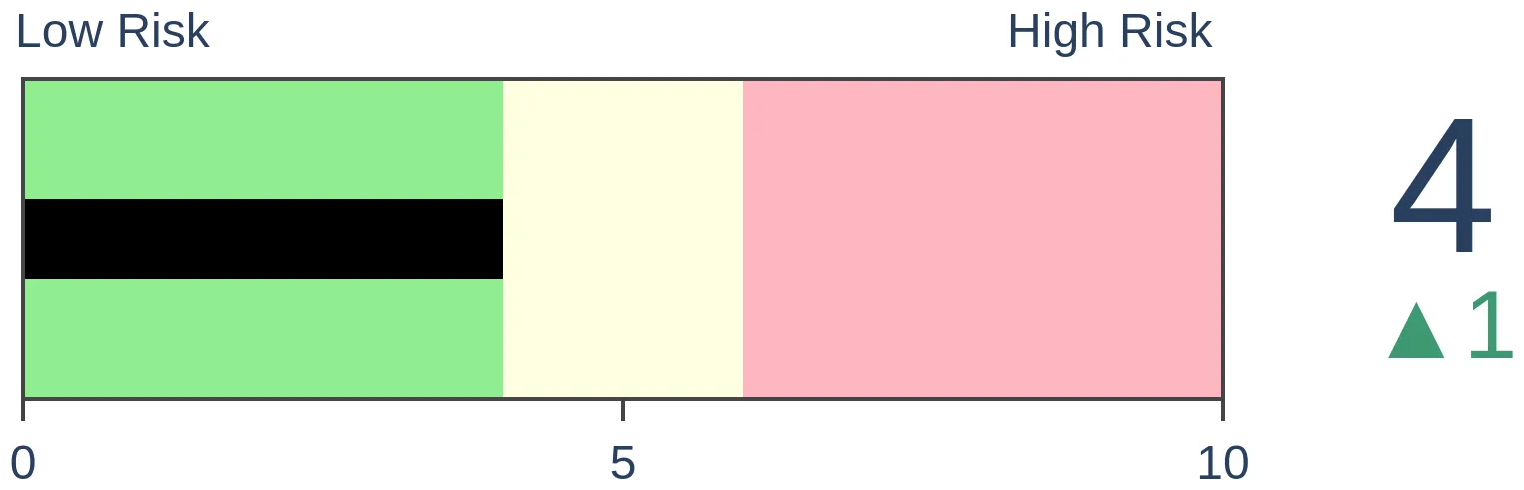
Bonds
|
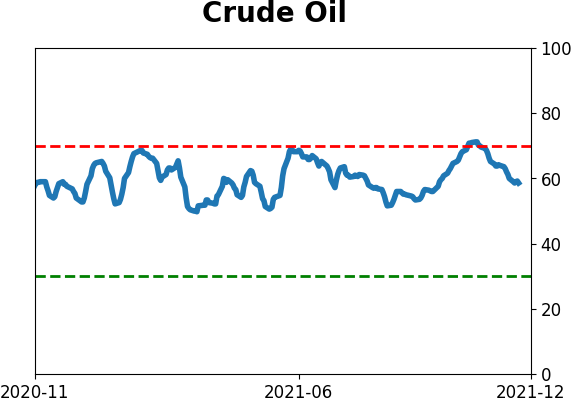
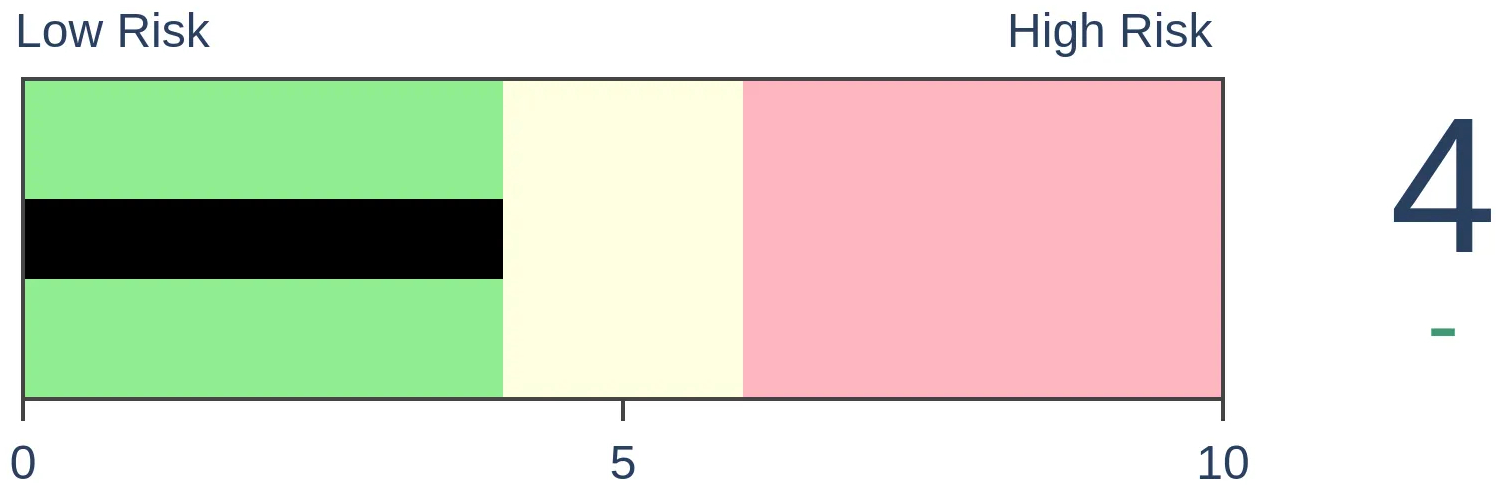
Crude Oil

|
|
Gold
|
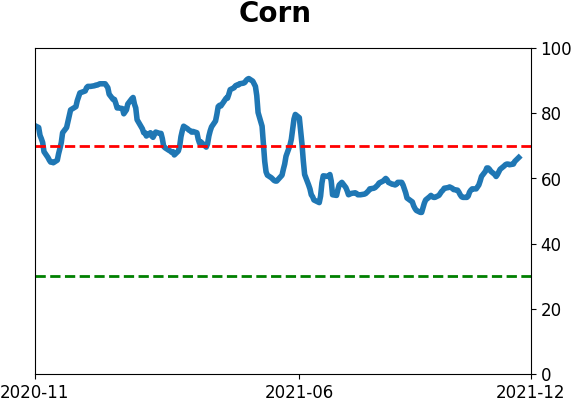
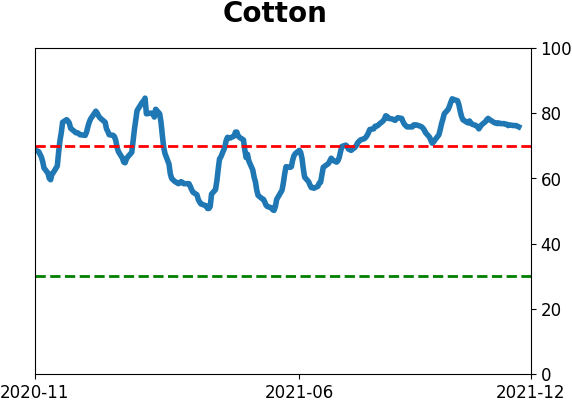
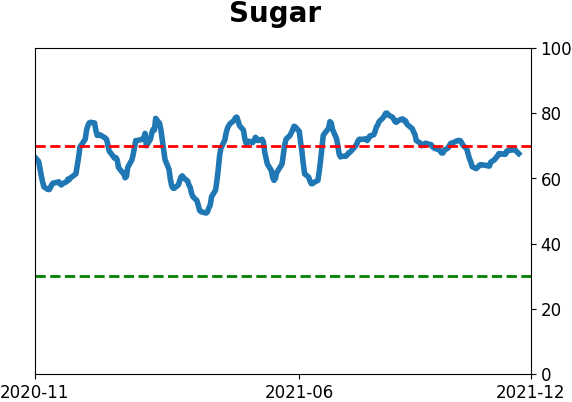
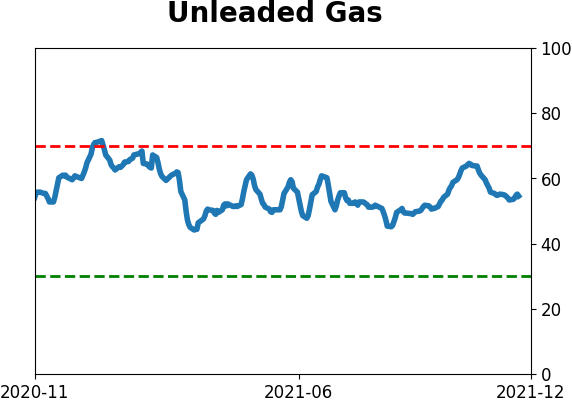
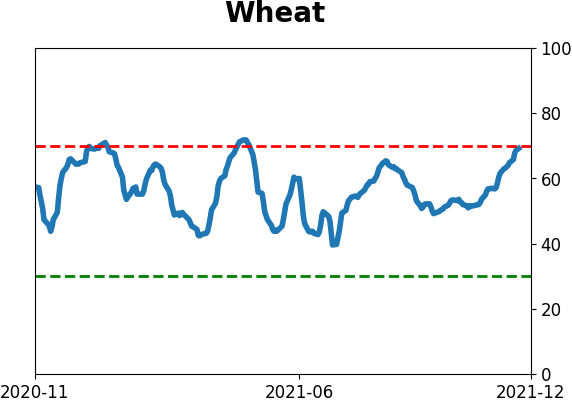
Agriculture
|
|
Research
By Dean Christians
BOTTOM LINE
A rare New York stock exchange breadth signal suggests a pause in the uptrend.
FORECAST / TIMEFRAME
None
|
Key points:
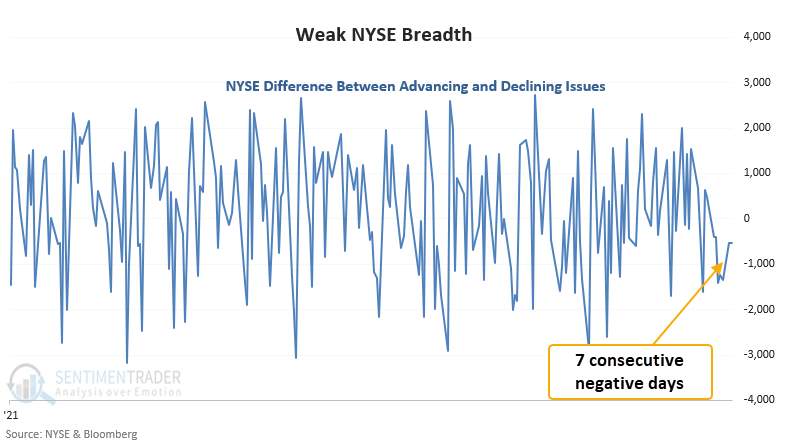
- The NYSE has registered 7 consecutive days with more declining issues than advancing issues
- At the same time, the S&P 500 is 0.29% below a 252-day high
- Similar streaks of negative breadth near a high have suggested a pause
New York stock exchange breadth has been consistently negative of late
Let's conduct a study to assess the outlook for stocks when declining issues on the New York stock exchange outnumber advancing issues for 7 consecutive days, and the S&P 500 is within 2% of a 252-day high. I lowered the threshold distance below the high to 2% so I could capture more historical instances.
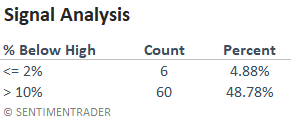
This type of market breadth is rare when the S&P 500 is near a high
For only the 6th time since 1926, declining issues outnumbered advancing issues for 7 consecutive days when the S&P 500 closed 2% or less from its 252-day high. If I eliminate the distance below the high condition, the study returns 123 instances when screening out repeats. Almost half of those signals occurred when the S&P 500 was down 10% or more from its 252-day high.
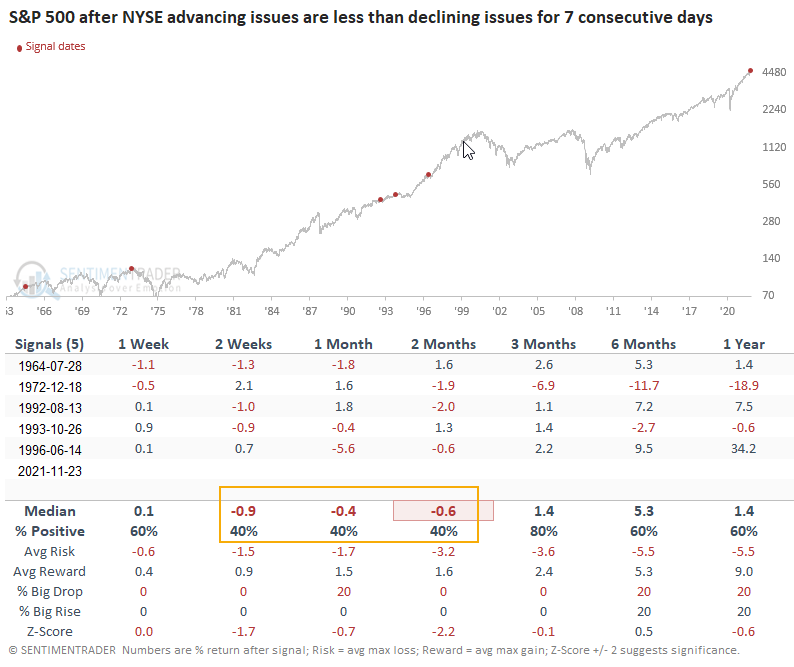
Similar signals preceded short-term consolidations
This signal triggered 5 other times over the past 96 years. After the others, future returns and win rates were weak in the 2-to-8-week time frame. If I optimize a short signal, the test returns 27 days as the best time frame to hold a negative view of the market. And, the S&P 500 closed down in 5 out of 6 instances. The sample size is small.
What the research tells us...
When NYSE breadth is negative for 7 consecutive days and the S&P 500 is near a high, one needs to be mindful that all is not well with market participation. Similar setups to what we're seeing now have preceded negative returns in the short term.
Active Studies
| Time Frame | Bullish | Bearish | | Short-Term | 2 | 0 | | Medium-Term | 11 | 0 | | Long-Term | 13 | 6 |
|
Indicators at Extremes
Portfolio
| Position | Description | Weight % | Added / Reduced | Date | | Stocks | RSP | 10.7 | Added 6.4% | 2021-10-01 | | Bonds | 32.7% BND, 7.1% SCHP | 39.8 | Added 8.3% | 2021-10-26 | | Commodities | GCC | 2.4 | Reduced 2.1%
| 2020-09-04 | | Precious Metals | GDX | 4.6 | Reduced 4.2% | 2021-05-19 | | Special Situations | 9.8% KWEB, 4.7% XLE, 2.9% PSCE | 17.3 | Added 9.78% | 2021-10-01 | | Cash | | 24.1 | | |
|
Updates (Changes made today are underlined)
Much of our momentum and trend work has remained positive for several months, with some scattered exceptions. Almost all sentiment-related work has shown a poor risk/reward ratio for stocks, especially as speculation drove to record highs in exuberance in February. Much of that has worn off, and most of our models are back toward neutral levels. There isn't much to be excited about here. The same goes for bonds and even gold. Gold has been performing well lately and is back above long-term trend lines. The issue is that it has a poor record of holding onto gains when attempting a long-term trend change like this, so we'll take a wait-and-see approach. Momentum has ebbed quickly in recent weeks, and nearing oversold levels in some indicators. This can be a dangerous area, with a lot of short-term volatility, but we'd be more inclined to add medium- to long-term exposure rather than sell on much more of a decline, thanks to already rock-bottom exposure. Other areas look more attractive, including some overseas markets. RETURN YTD: 11.3% 2020: 8.1%, 2019: 12.6%, 2018: 0.6%, 2017: 3.8%, 2016: 17.1%, 2015: 9.2%, 2014: 14.5%, 2013: 2.2%, 2012: 10.8%, 2011: 16.5%, 2010: 15.3%, 2009: 23.9%, 2008: 16.2%, 2007: 7.8%
|
|
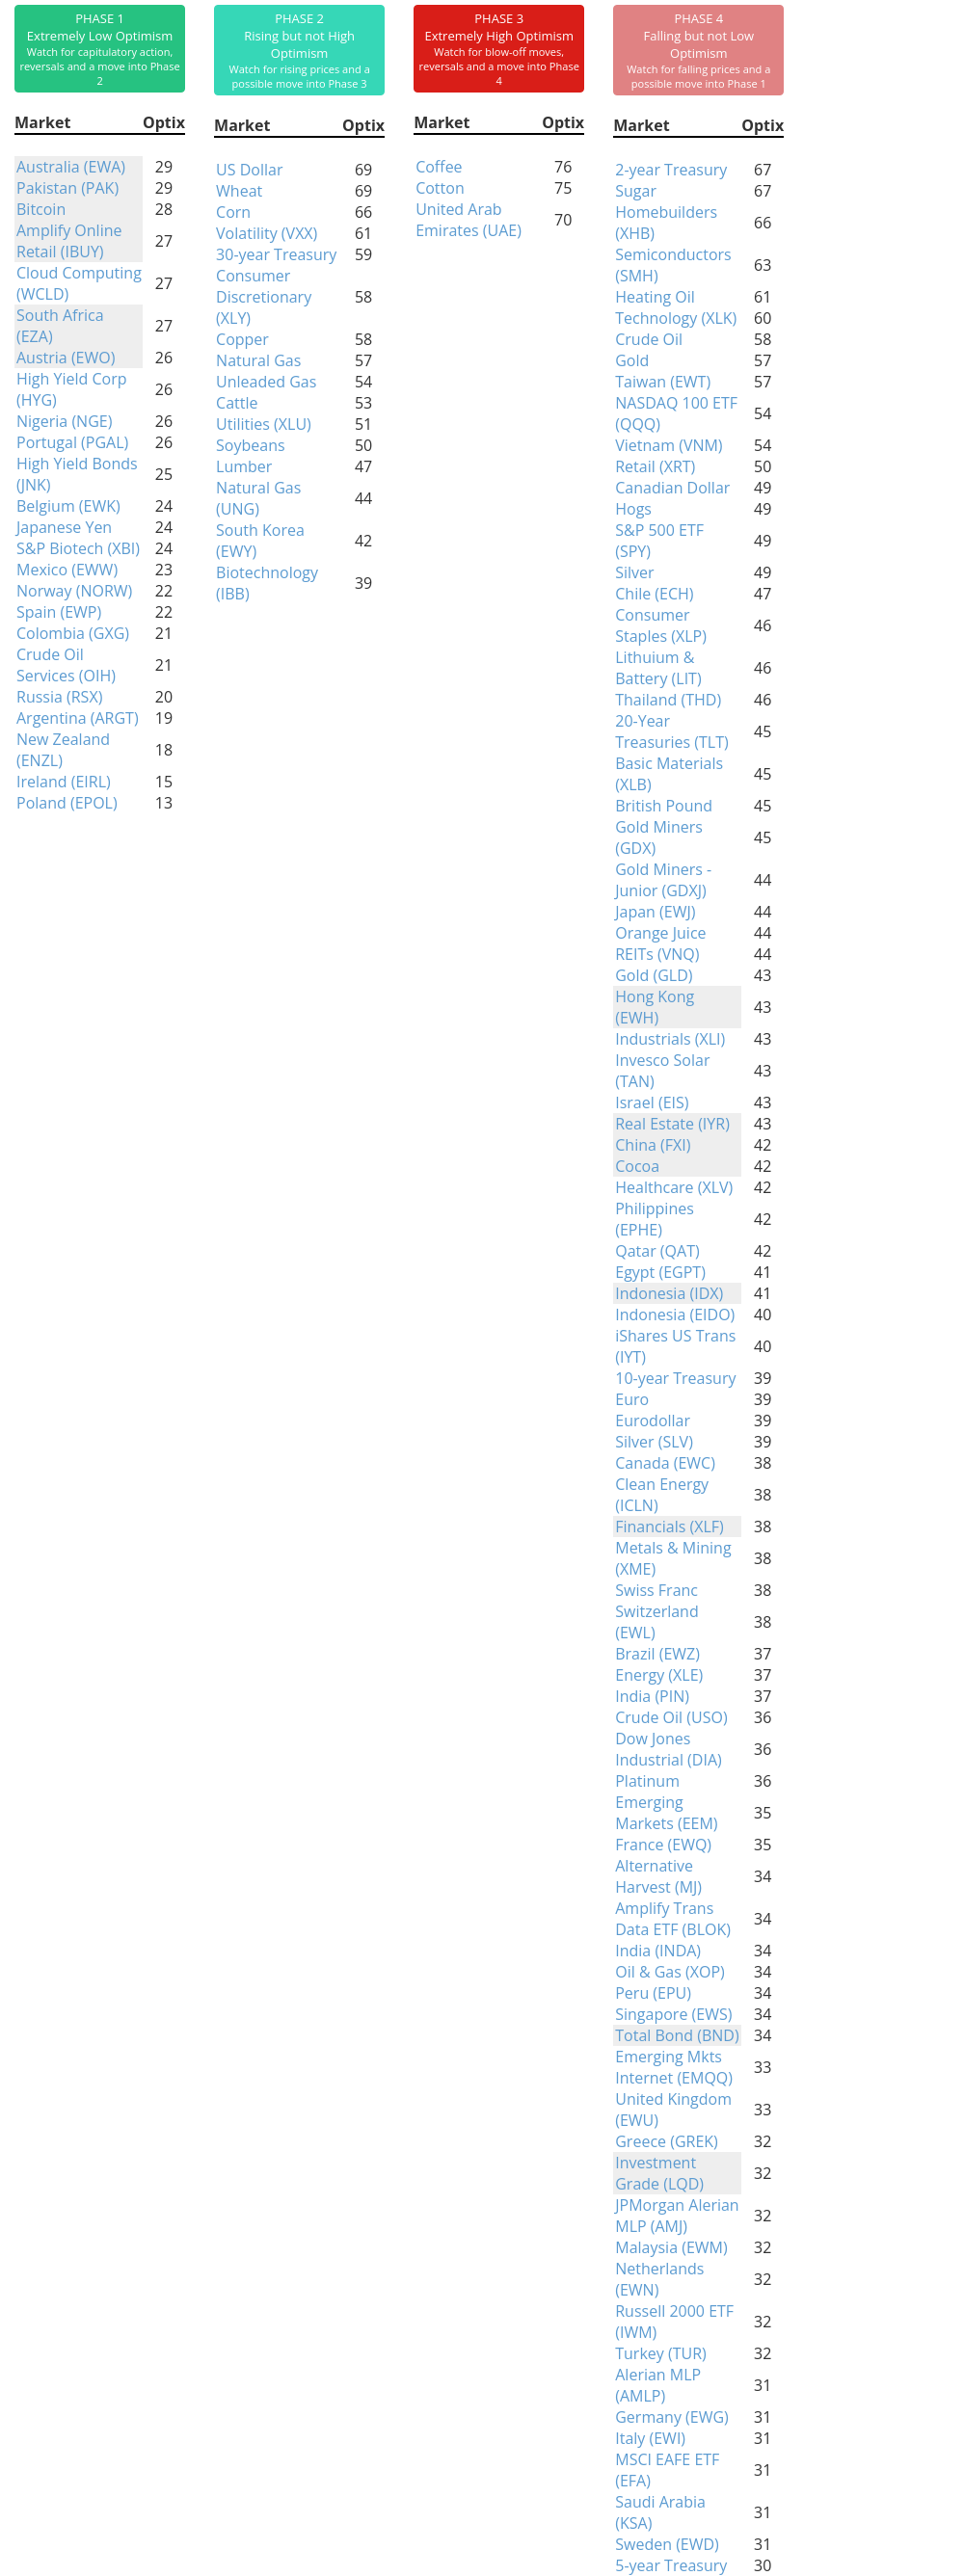
Phase Table
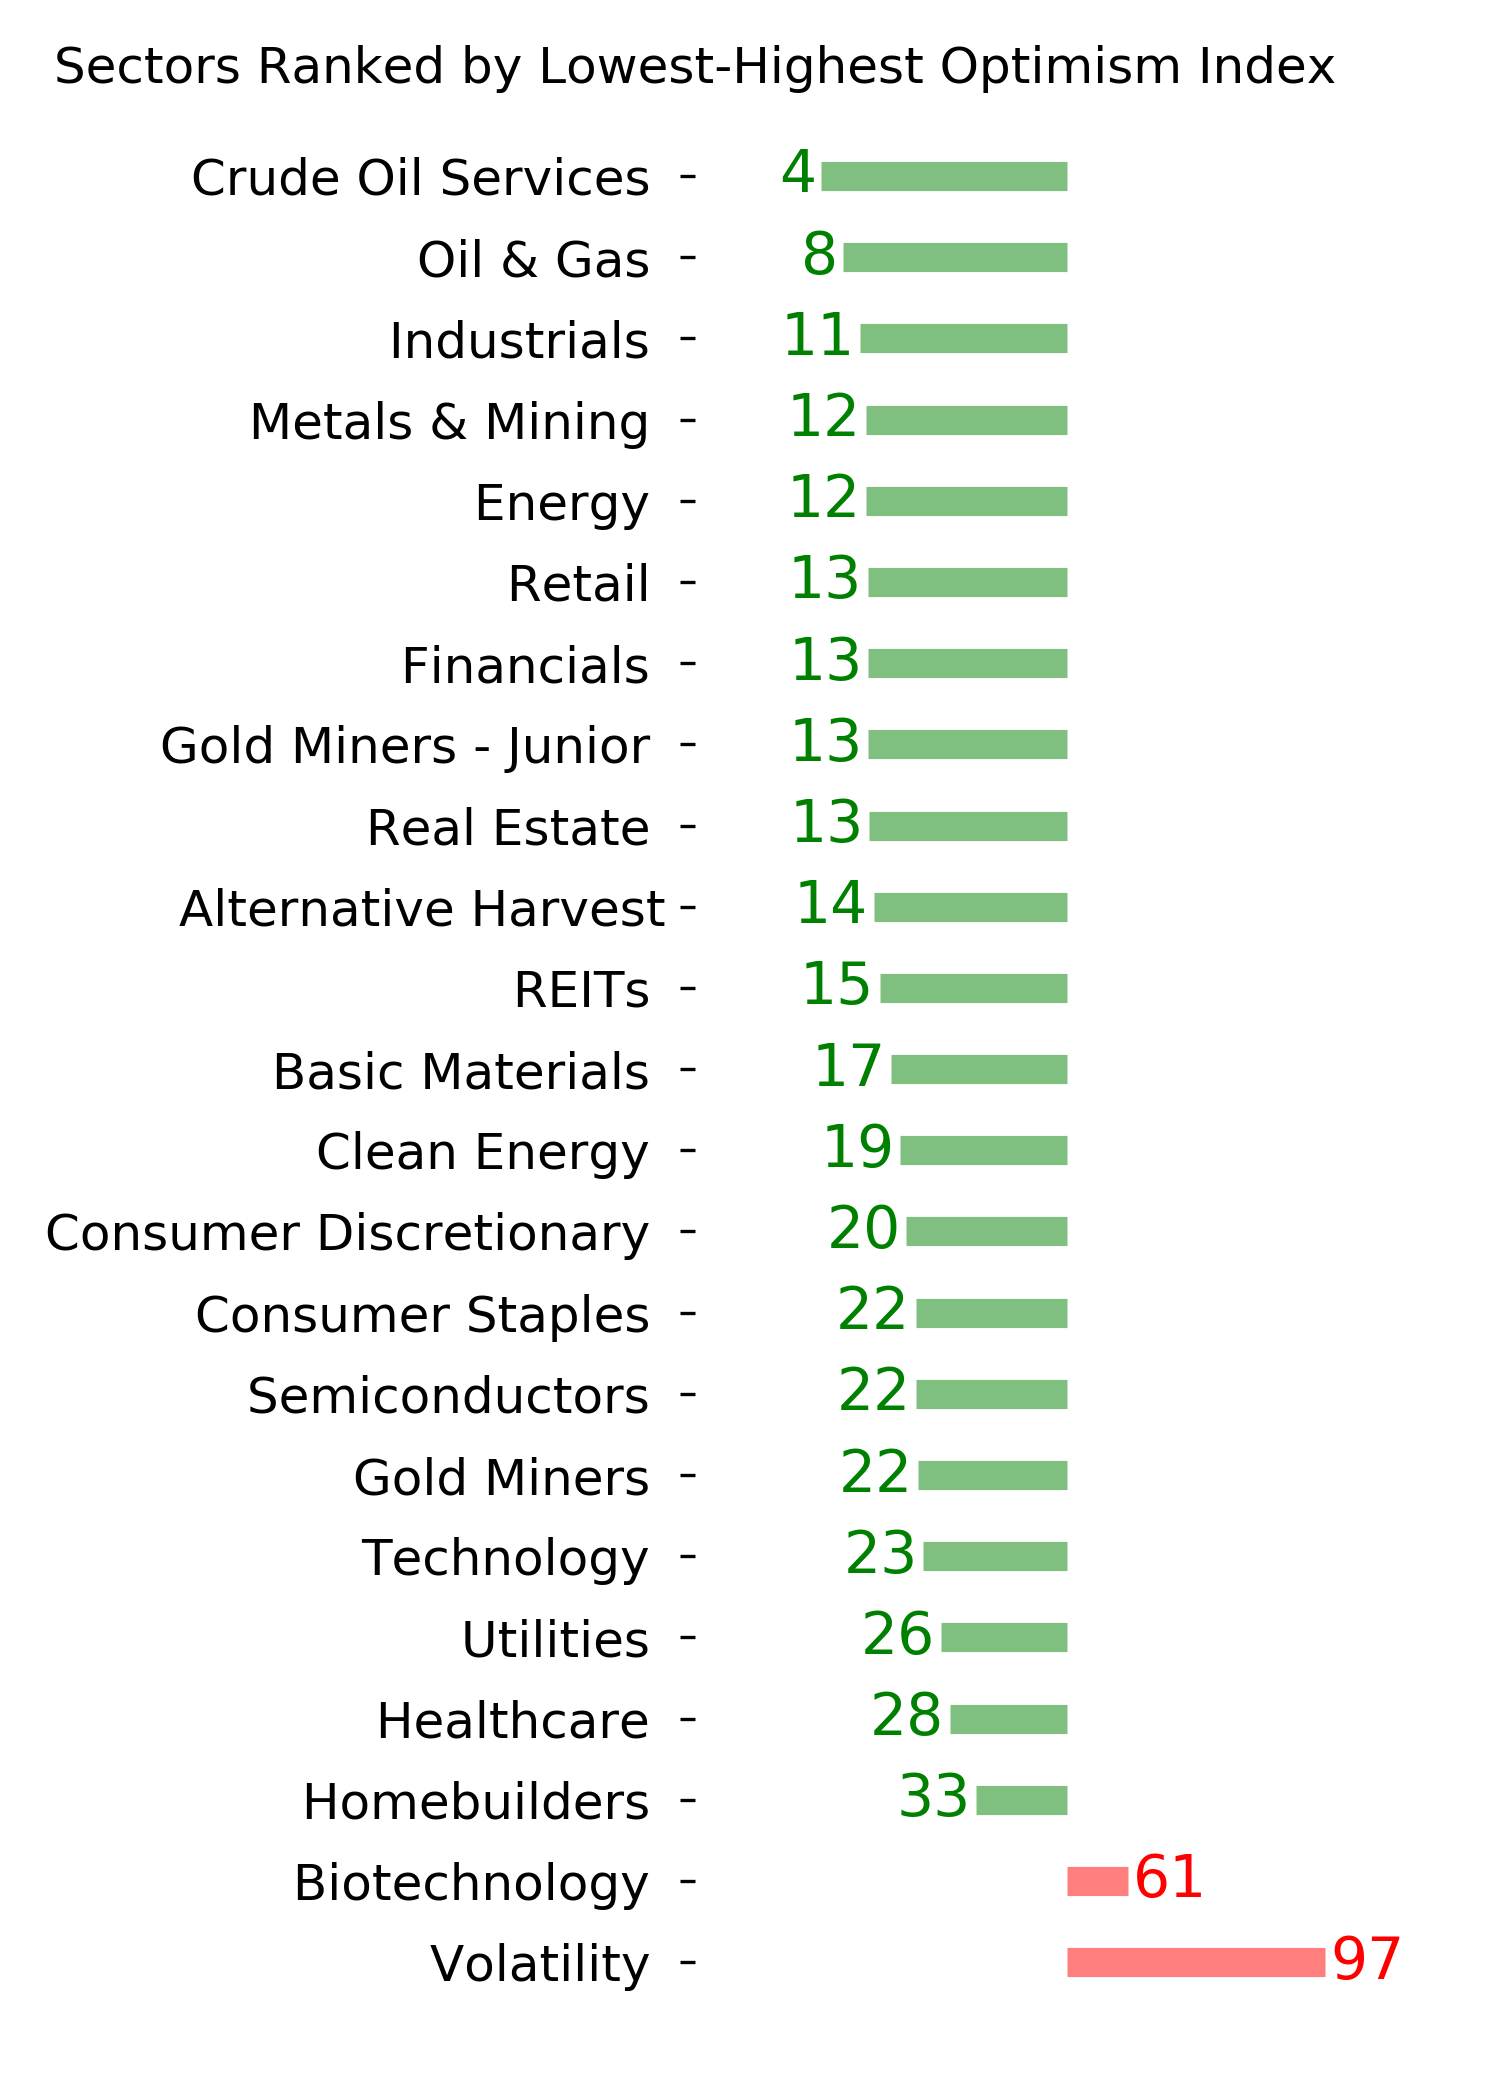
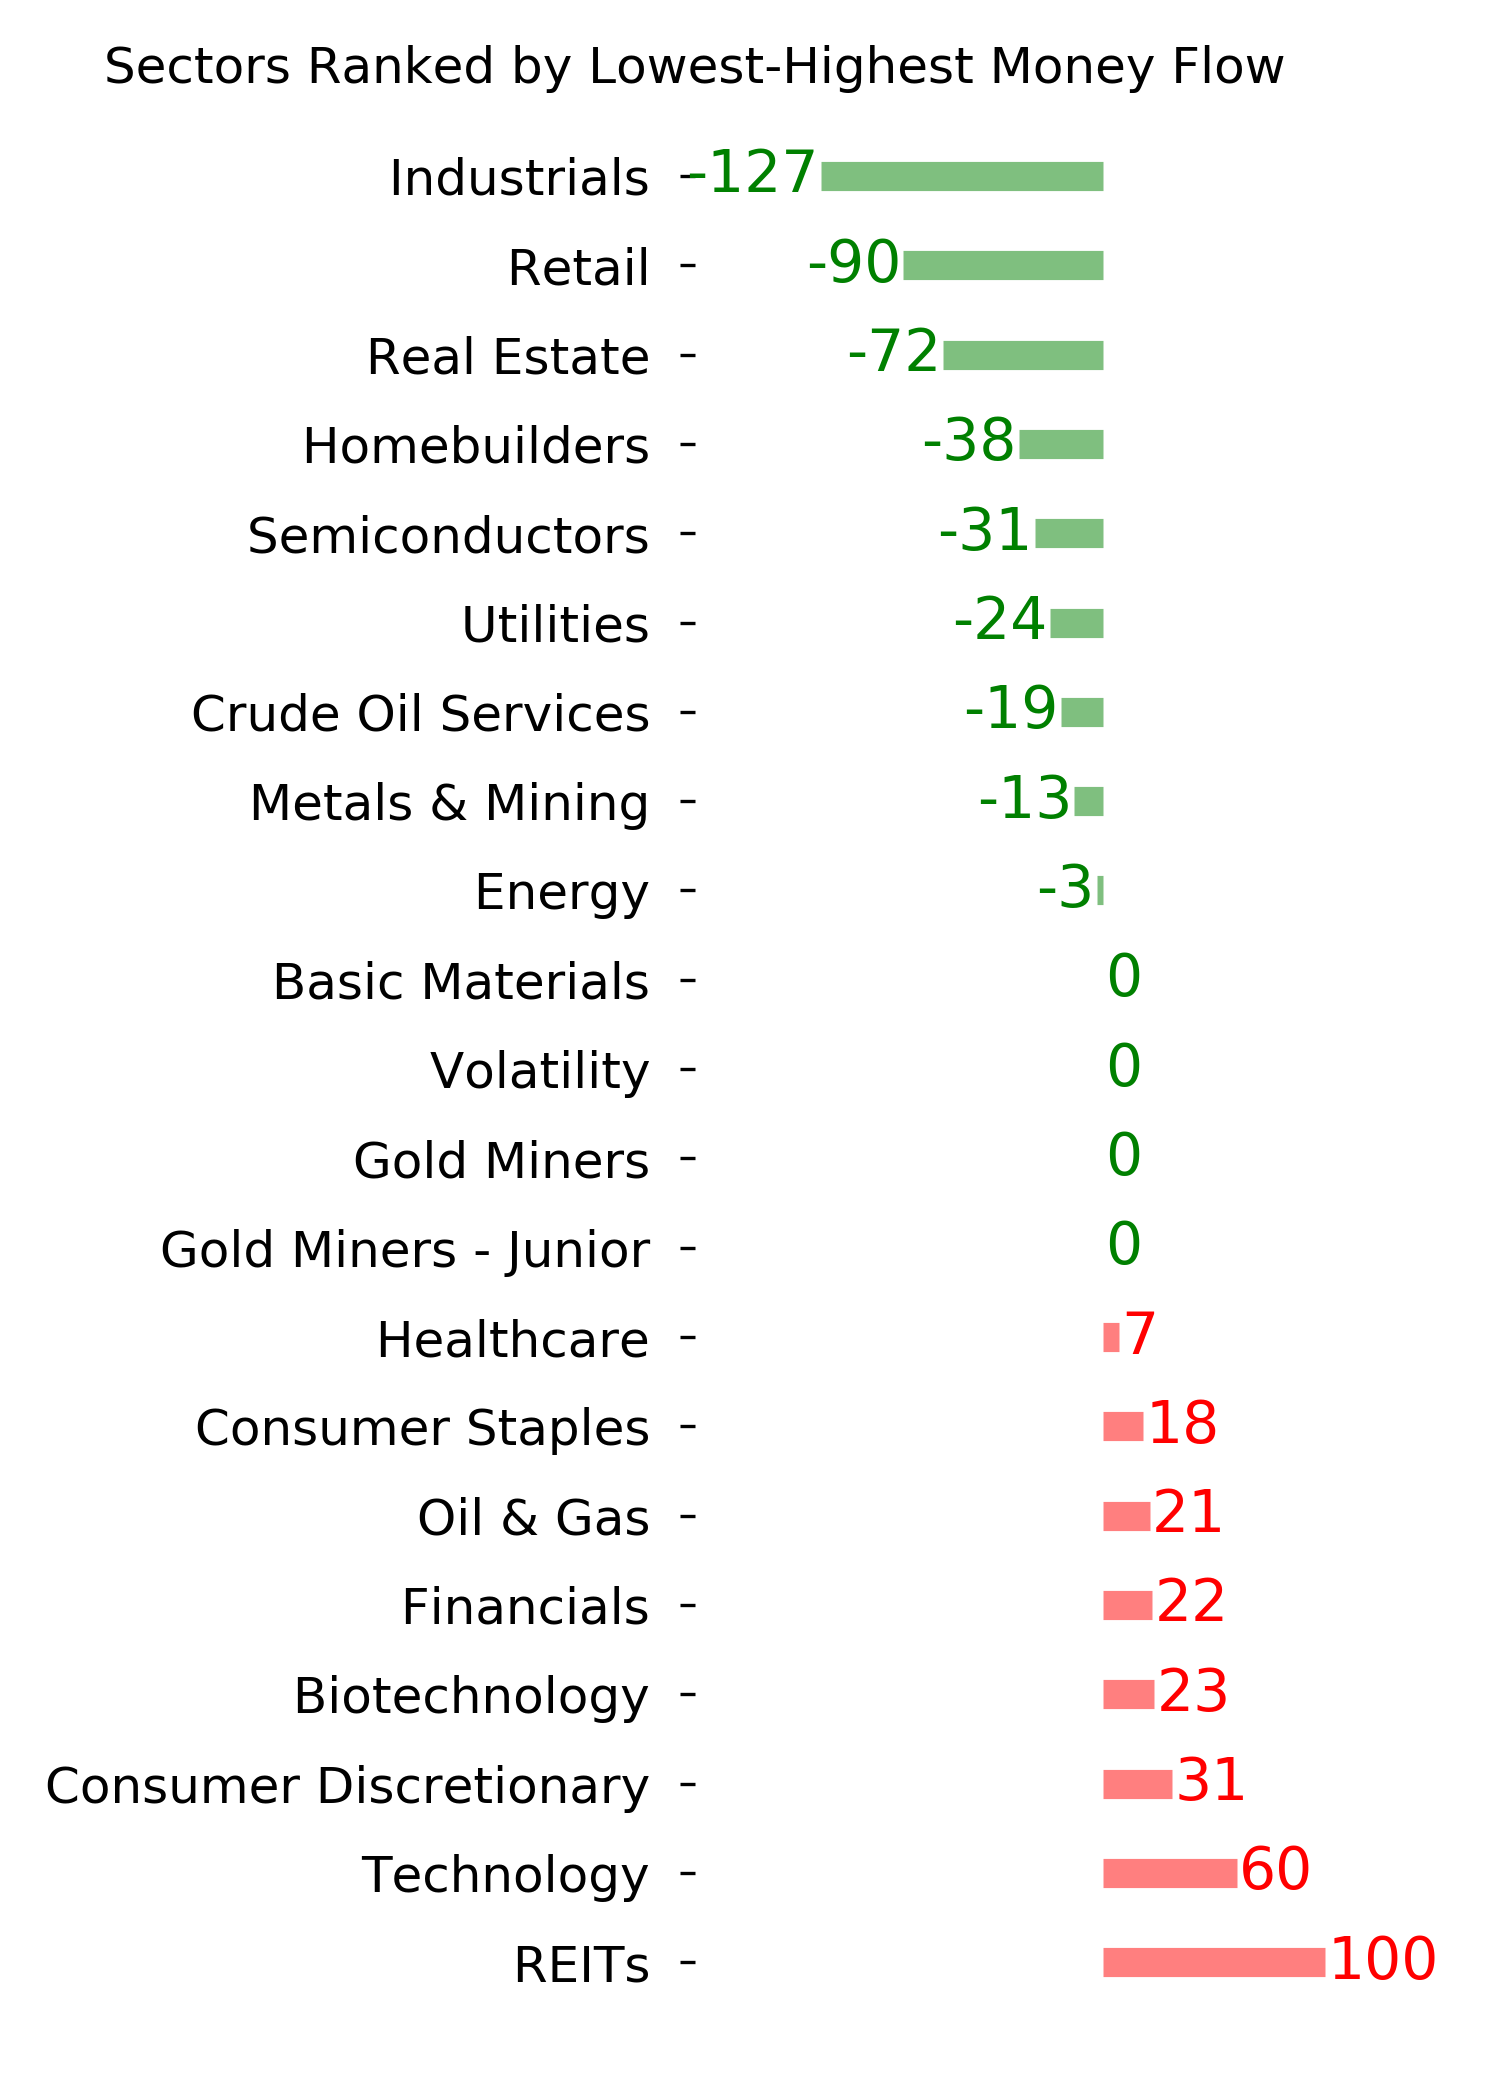
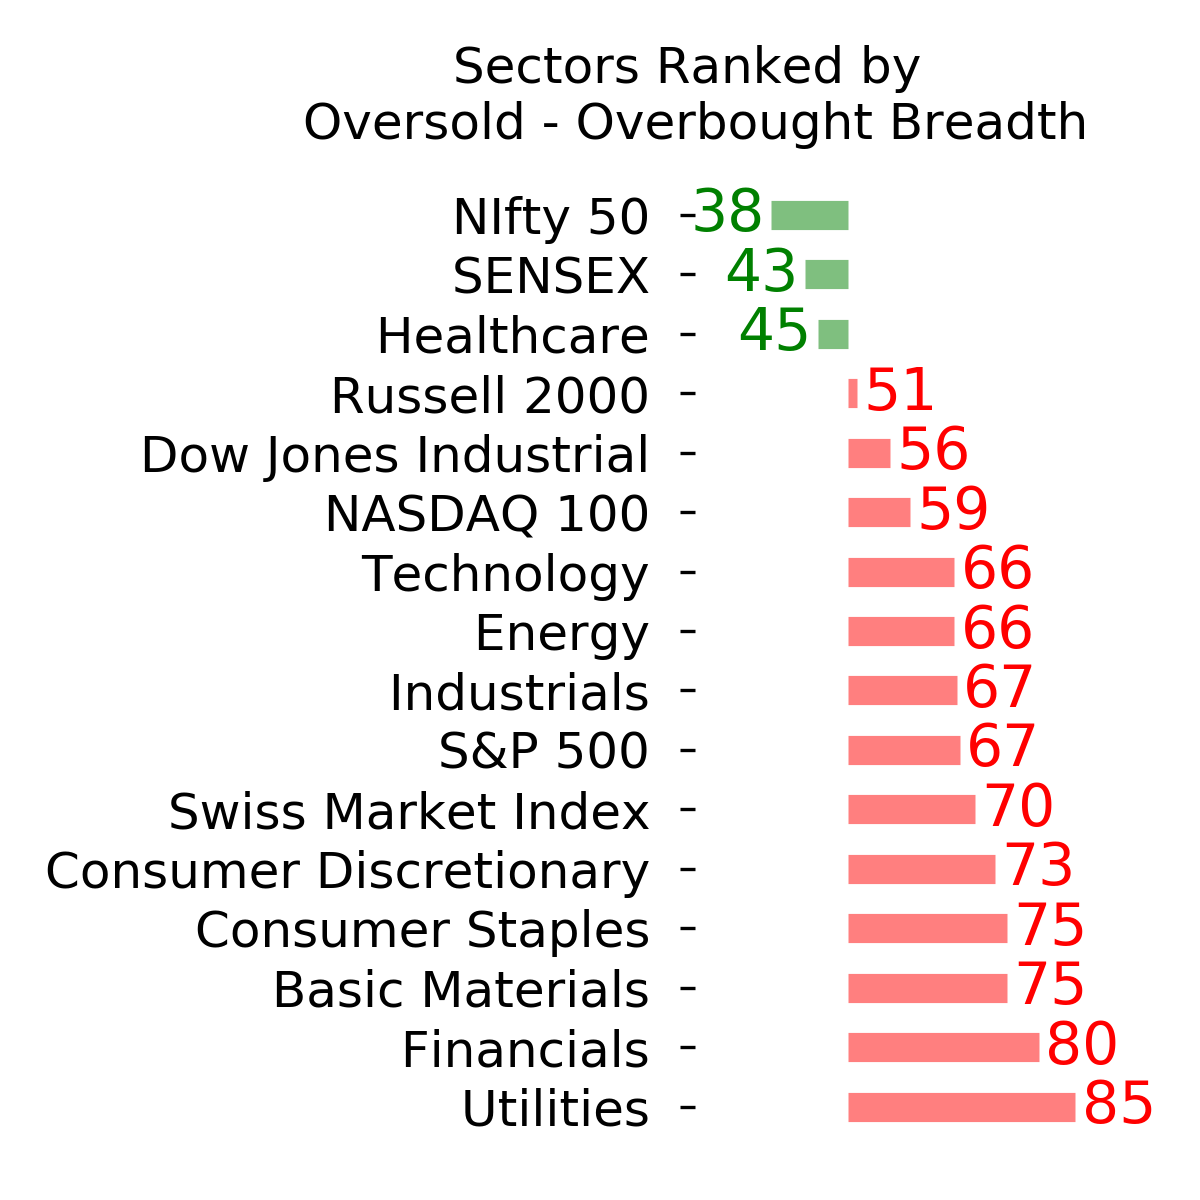
Ranks
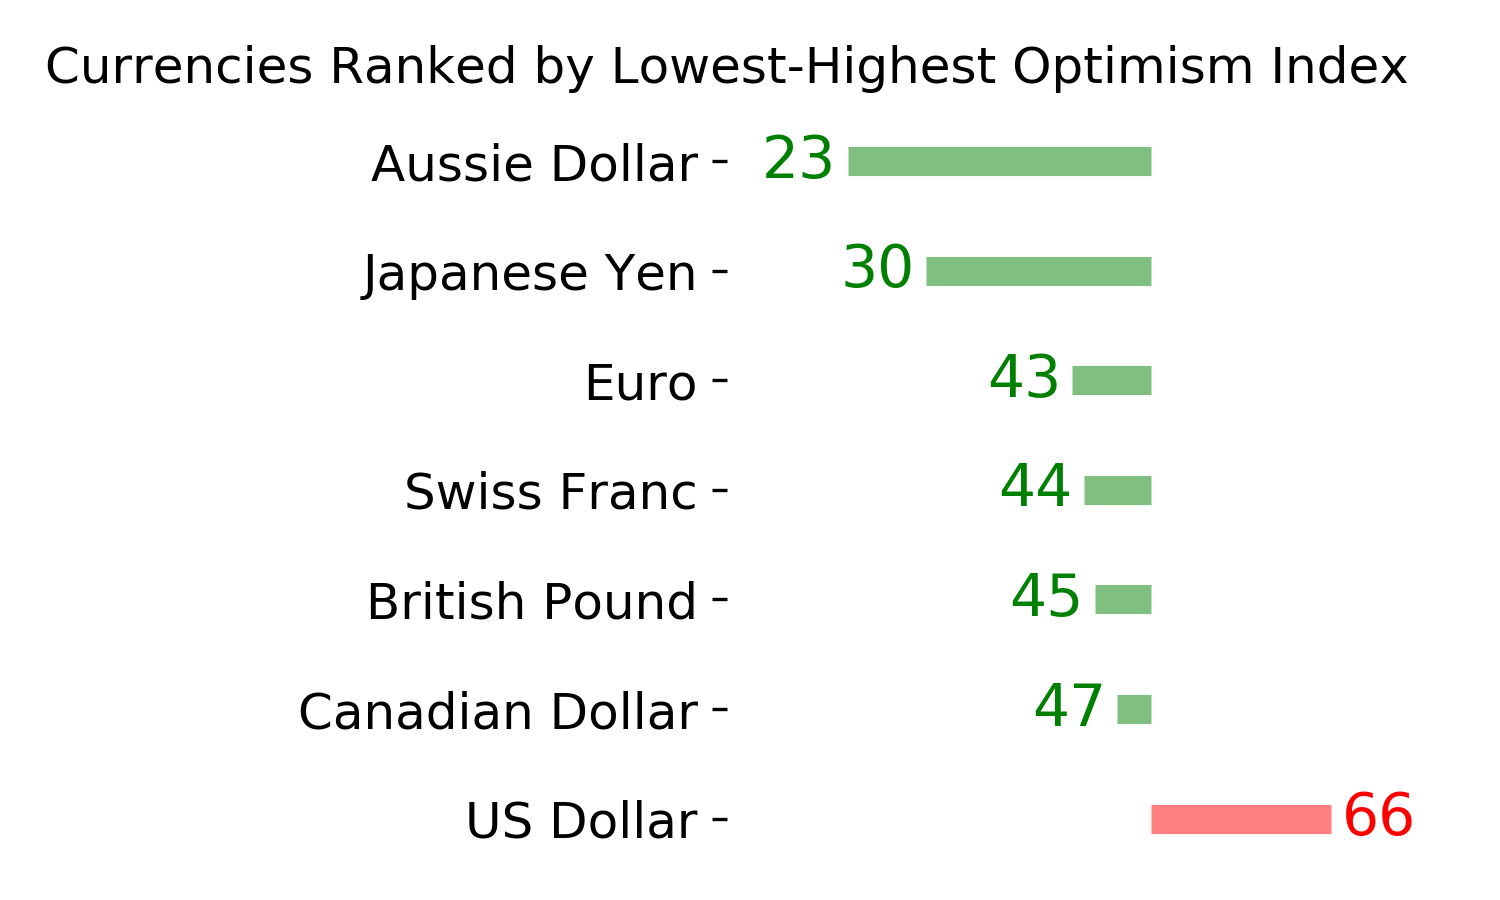
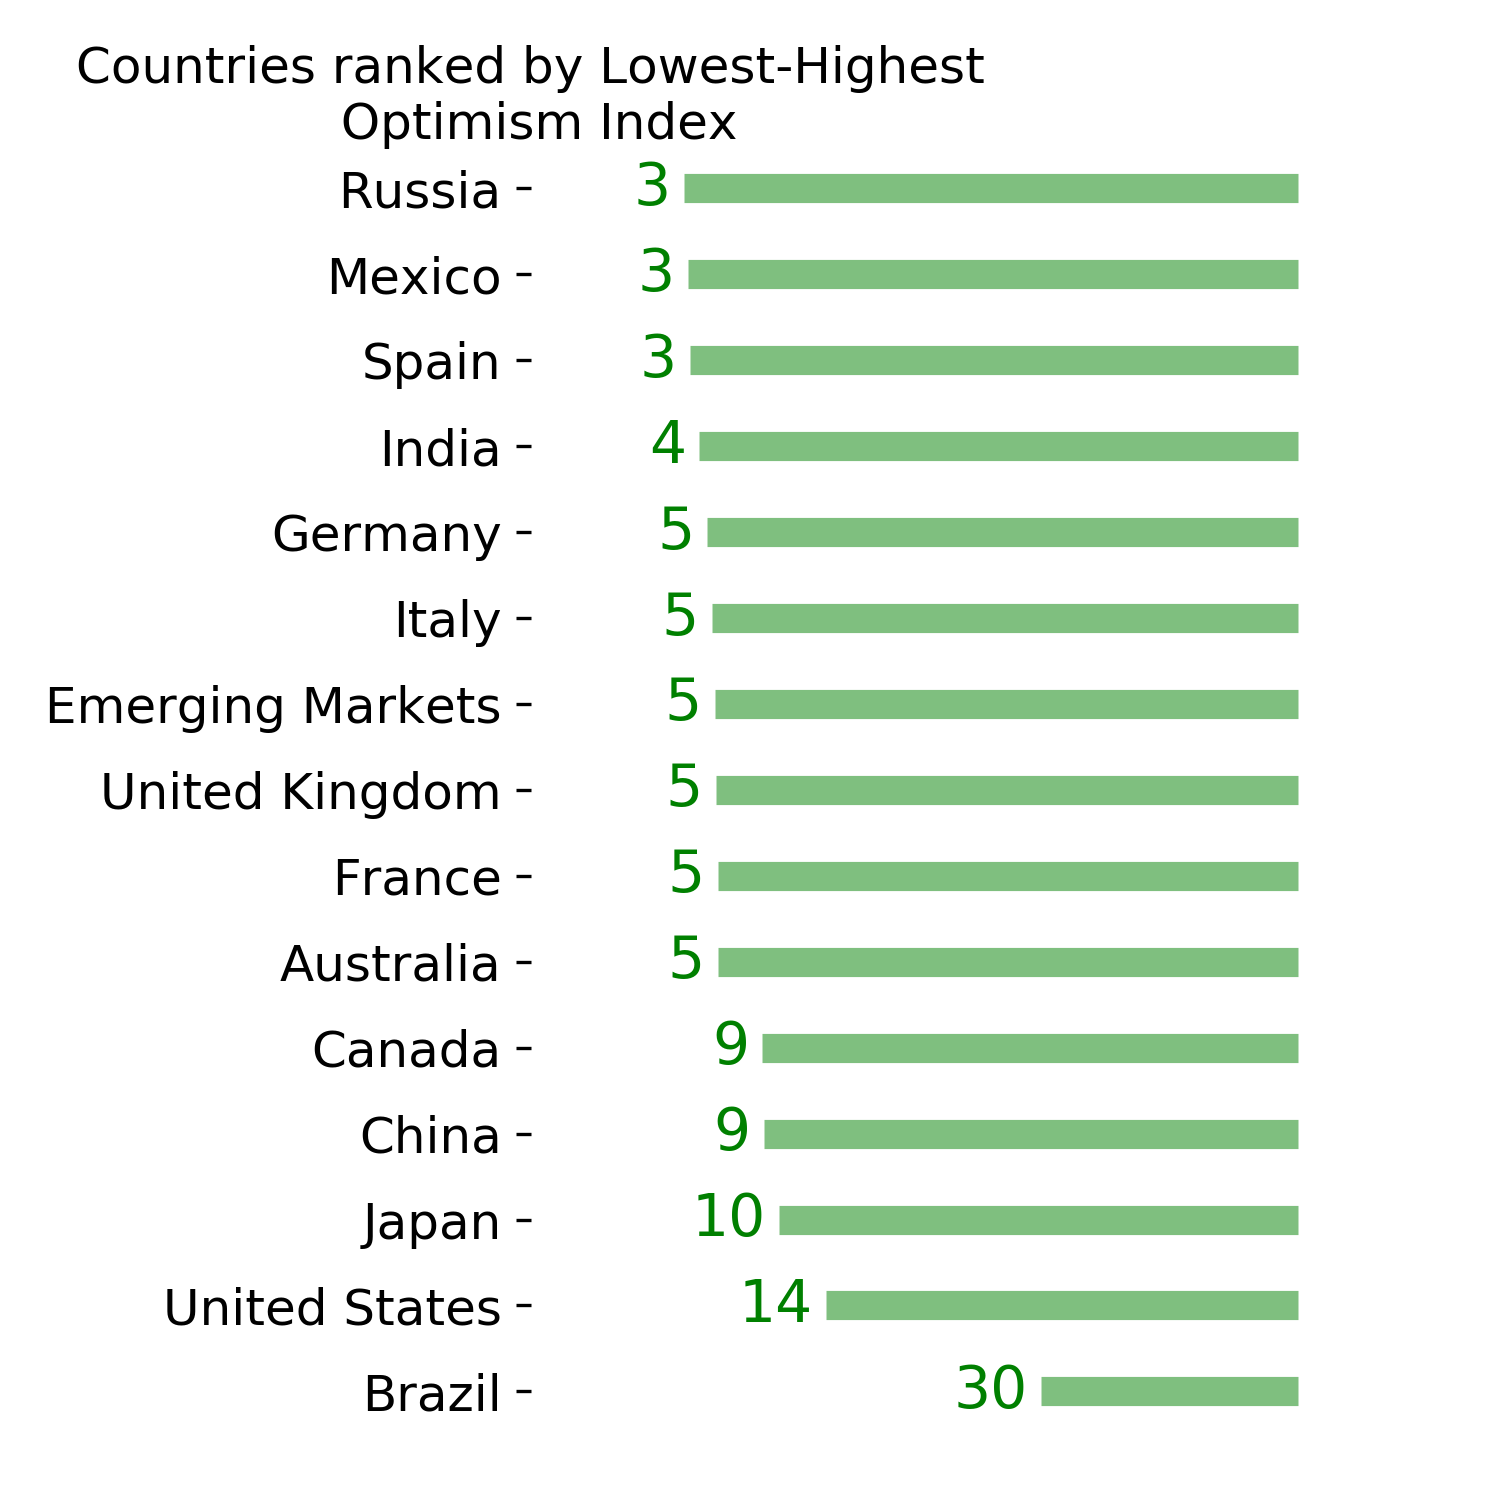
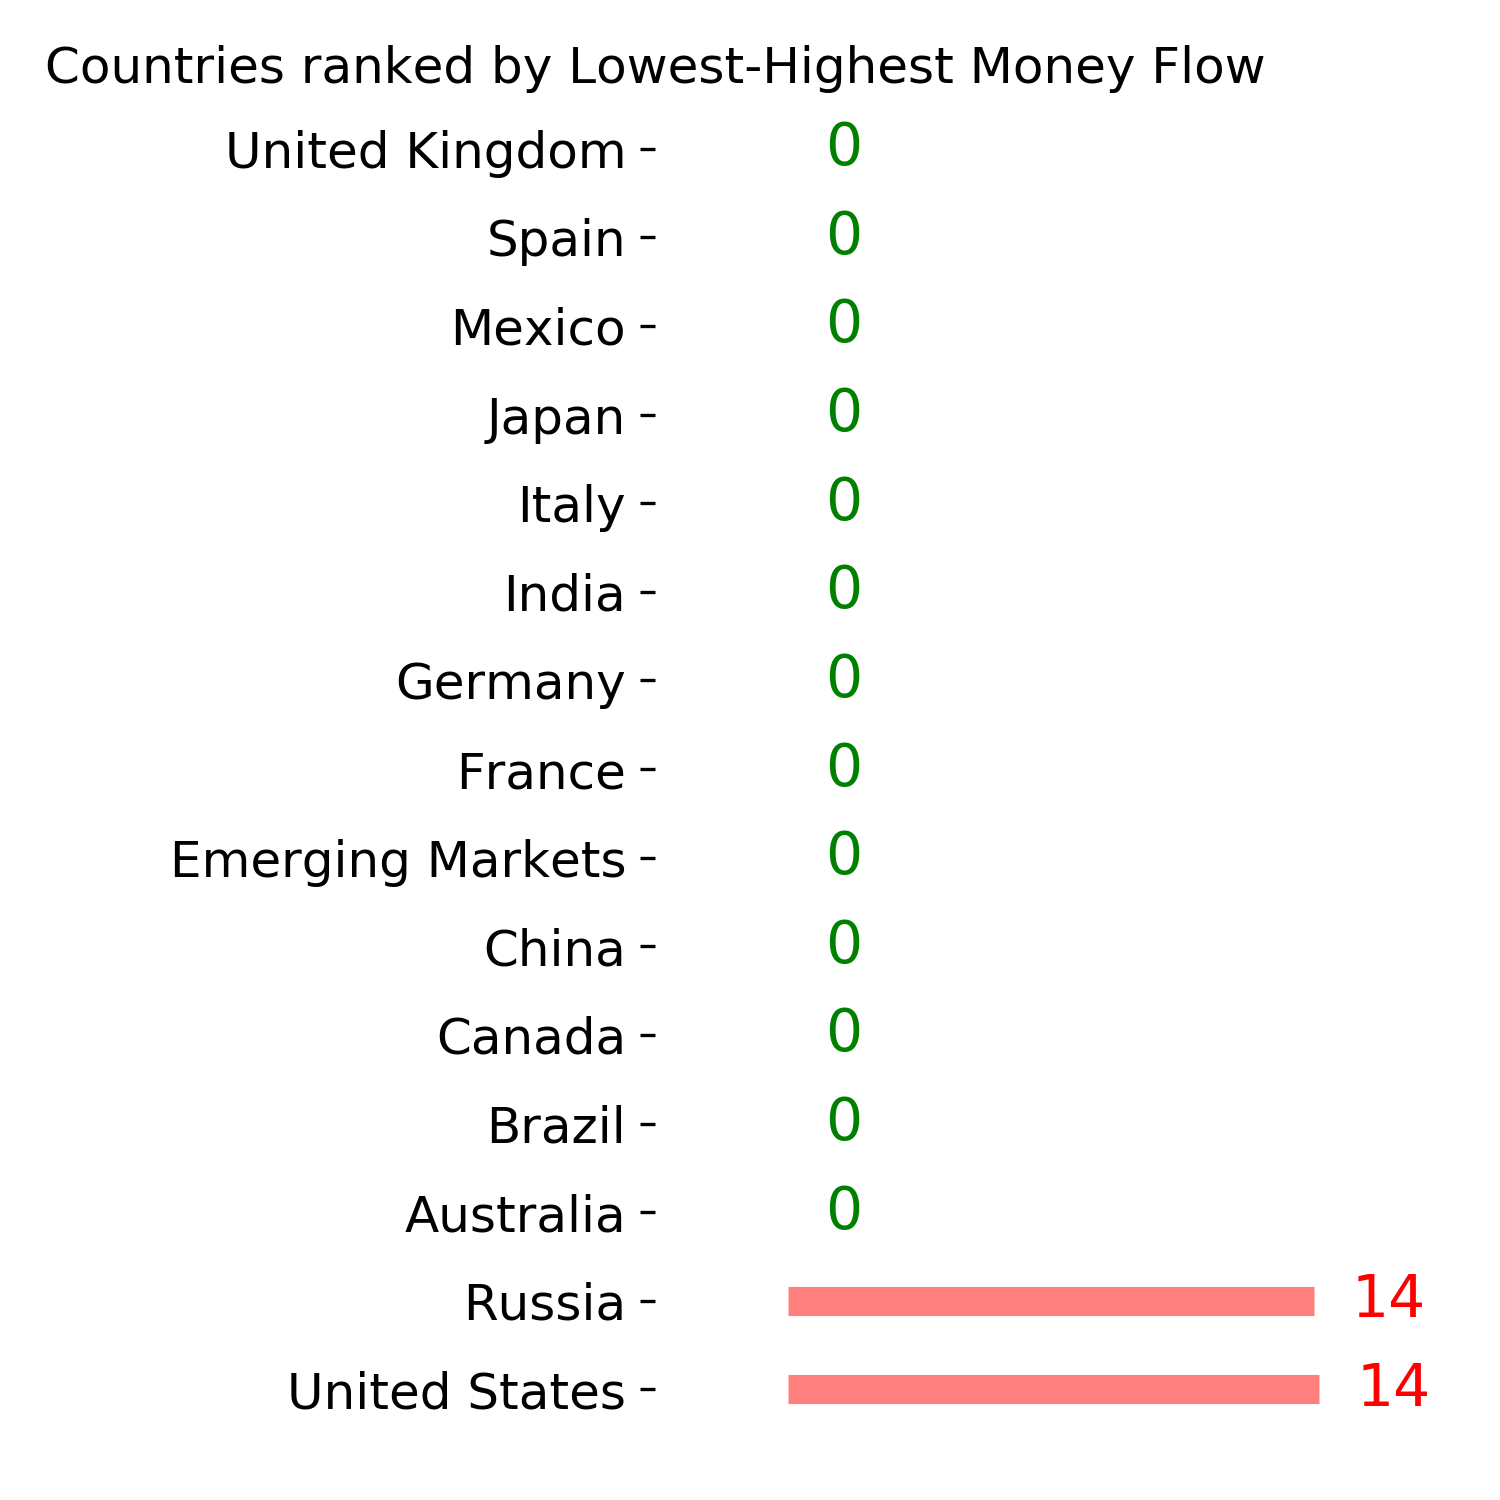
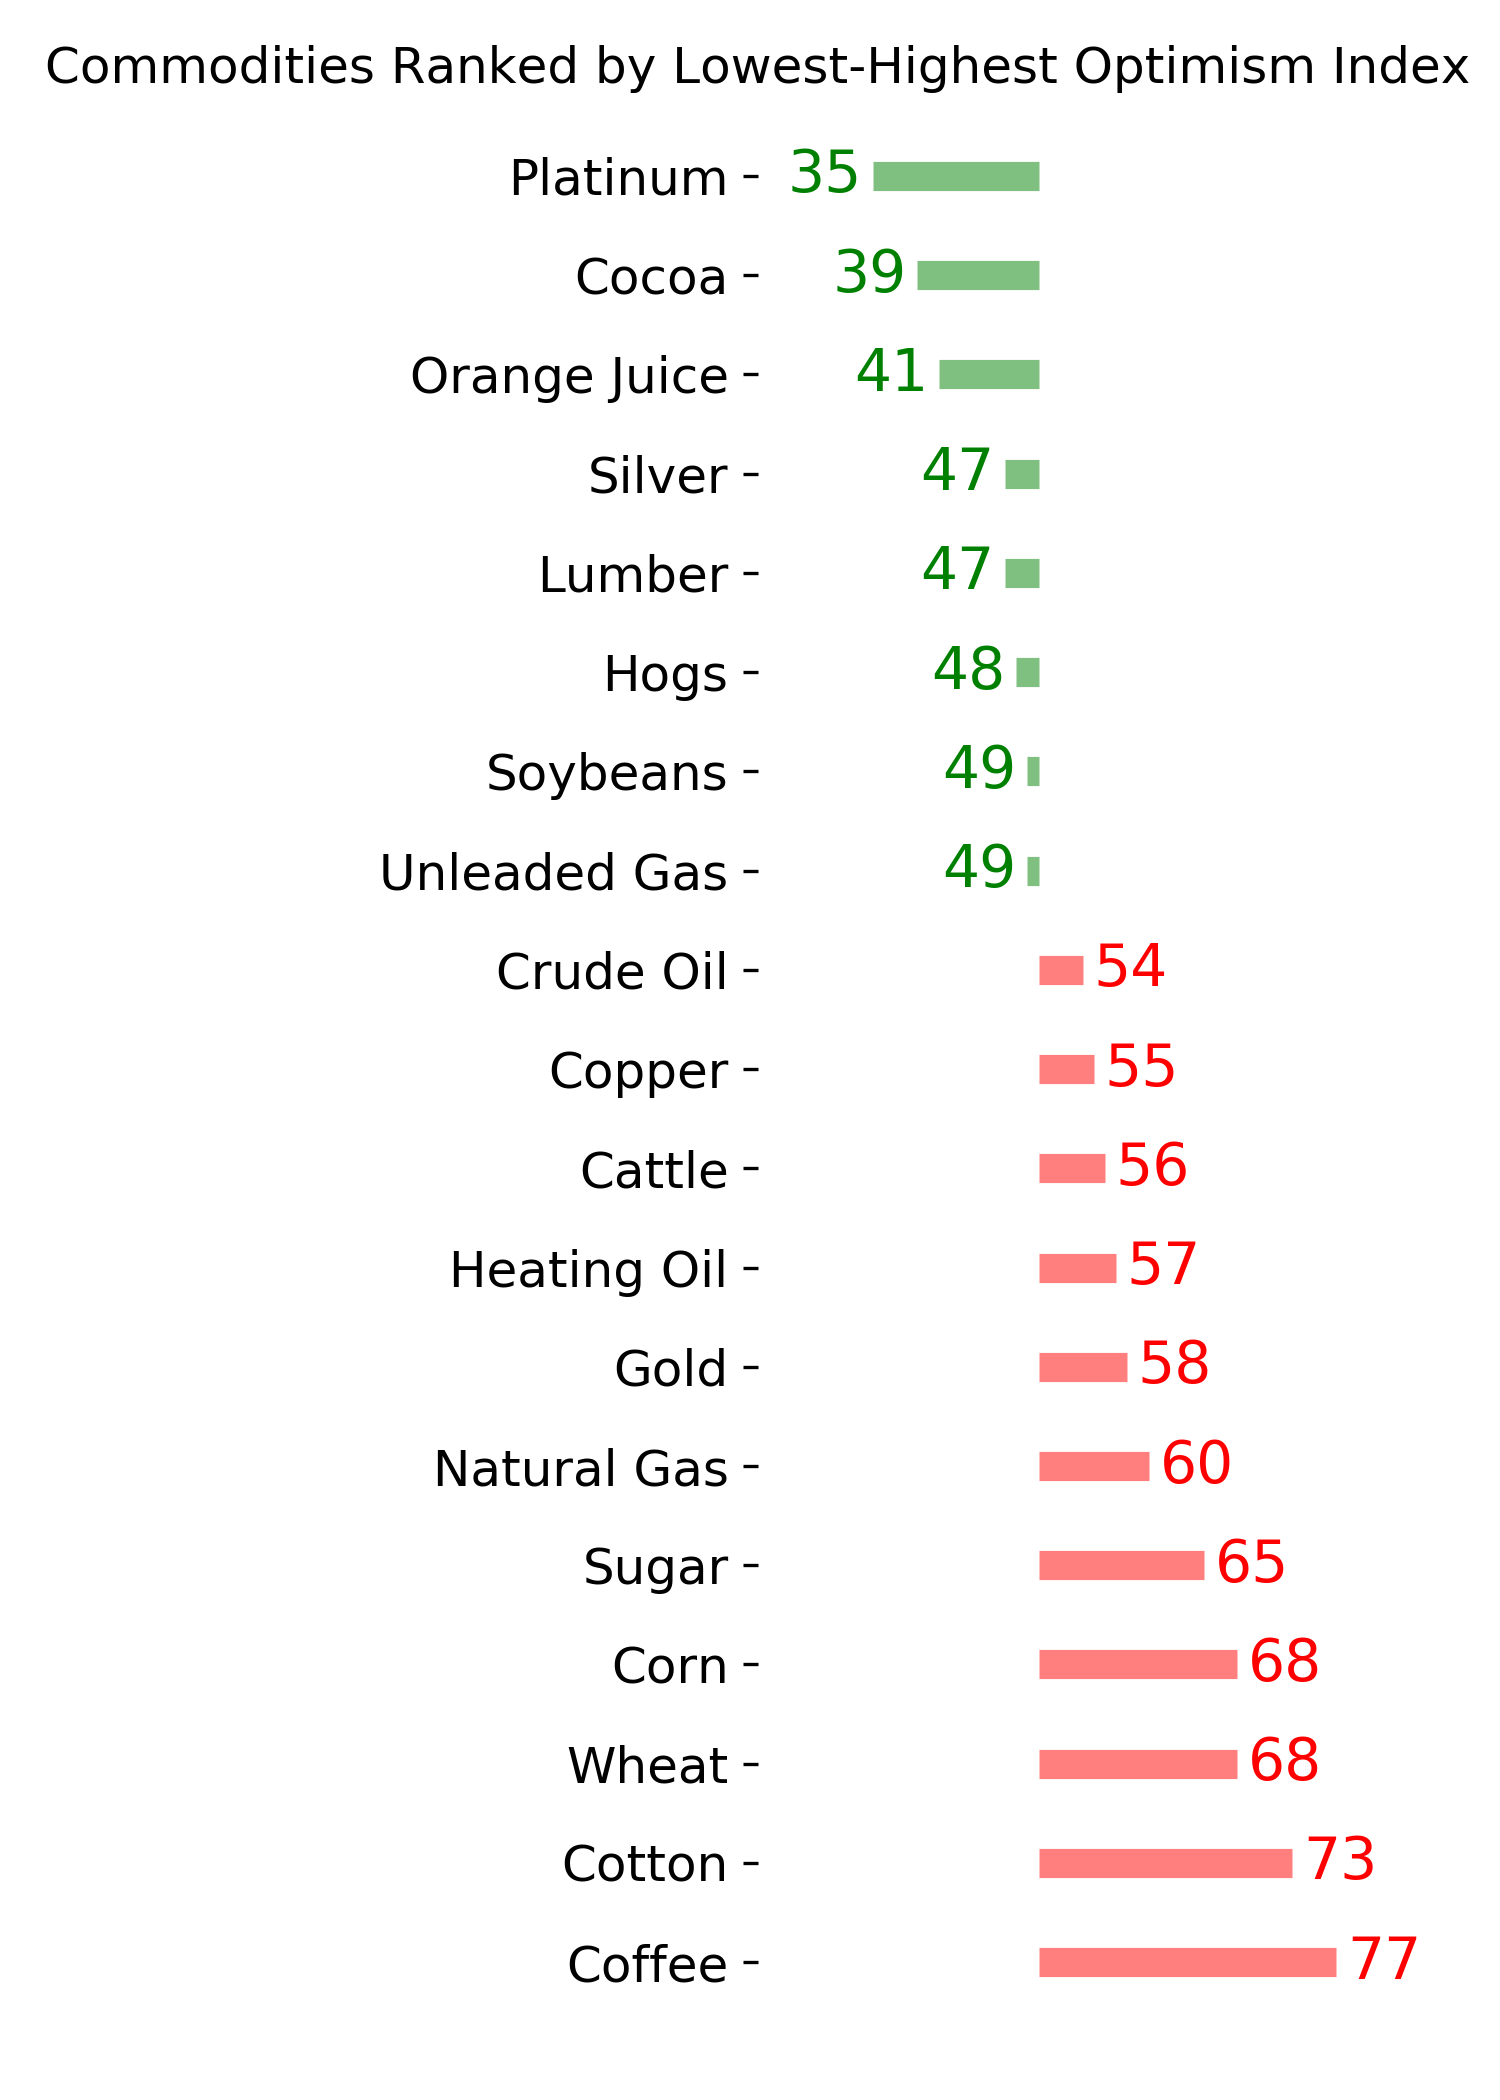
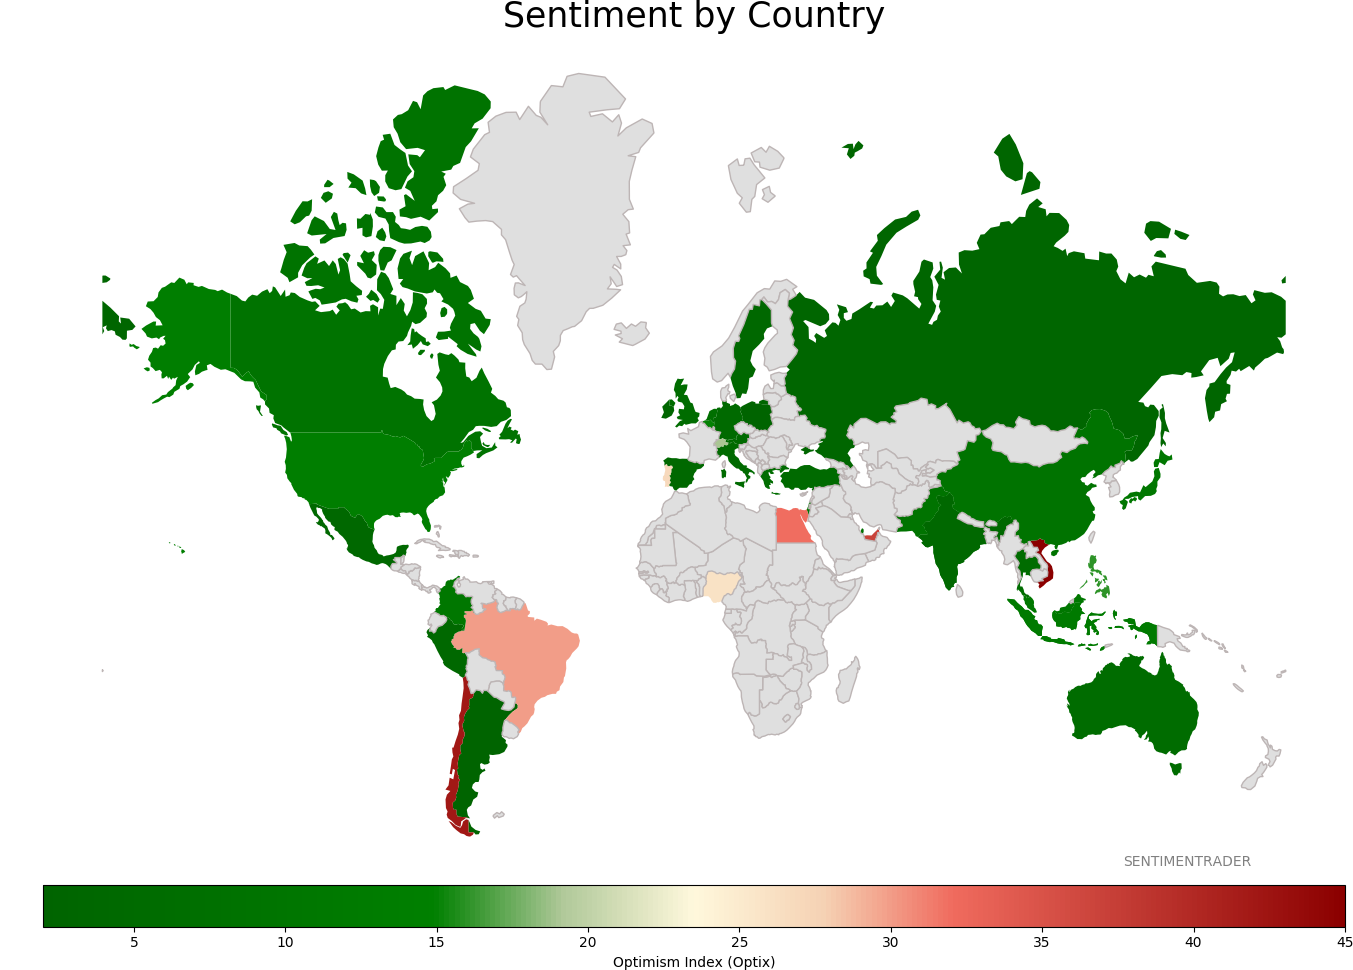
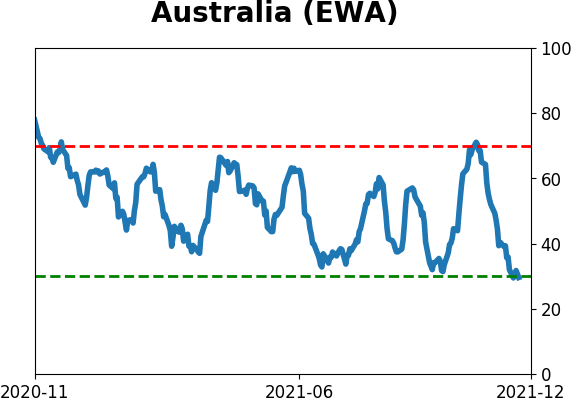
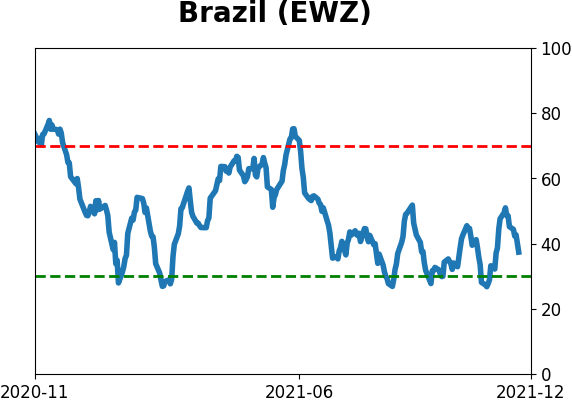
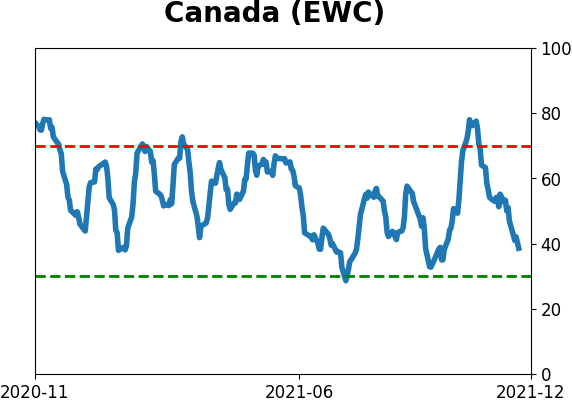
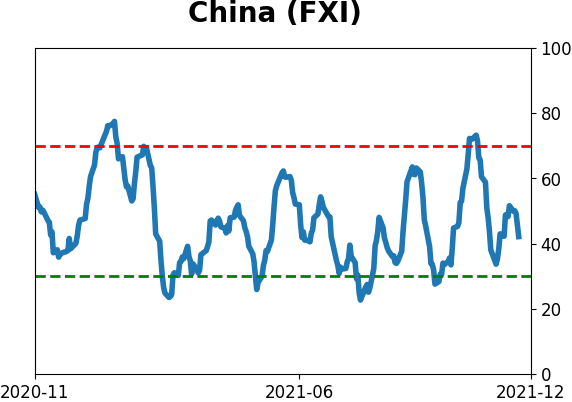
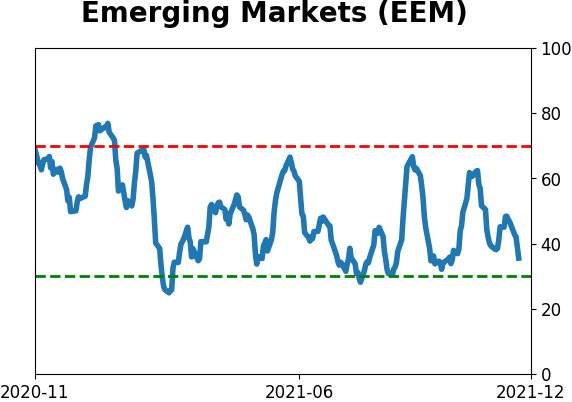
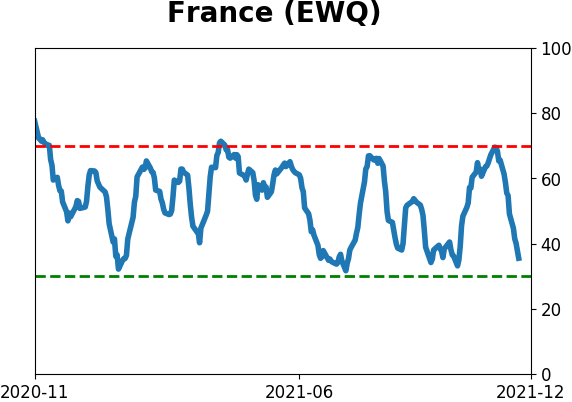
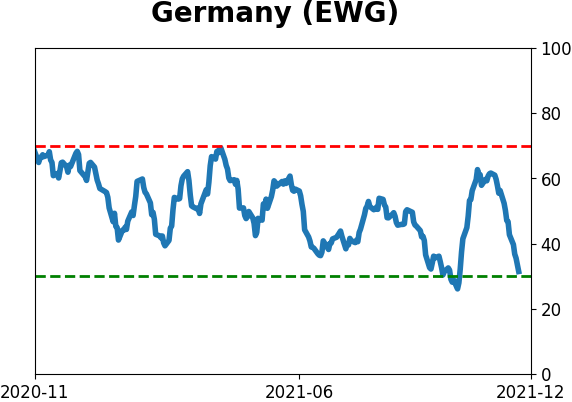
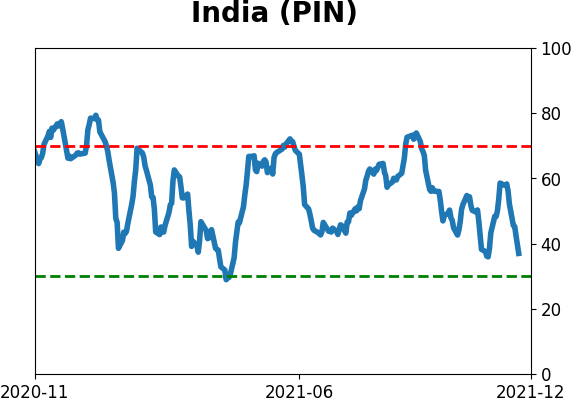
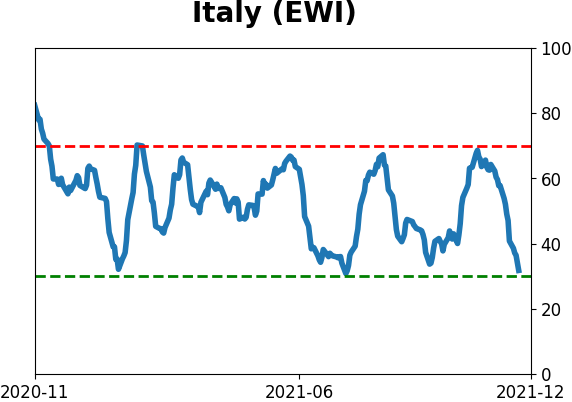
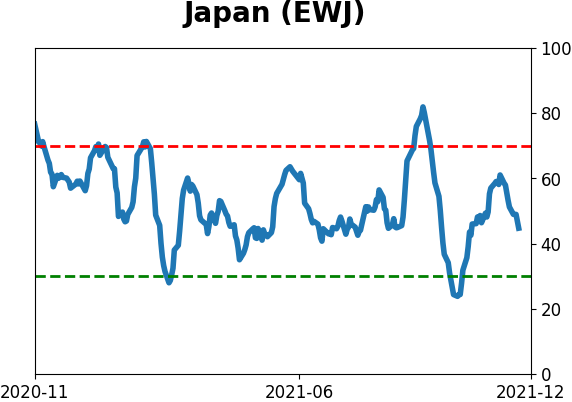
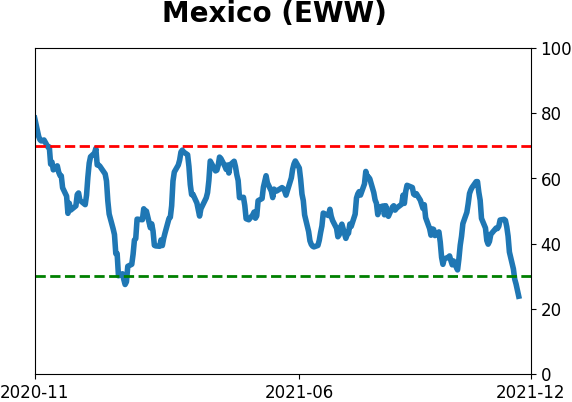
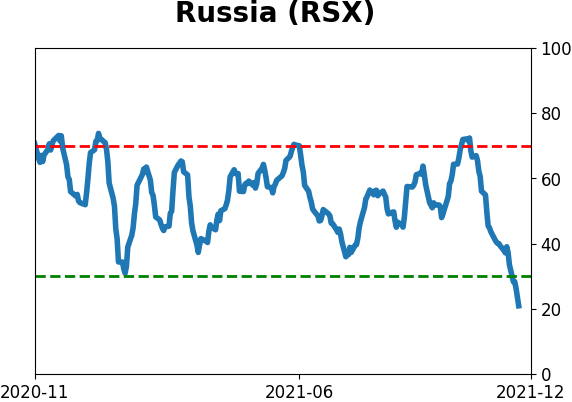
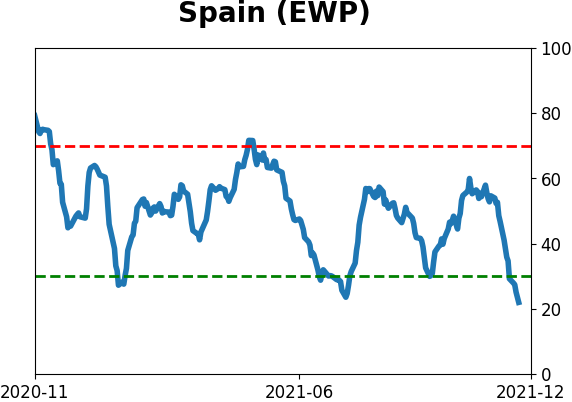
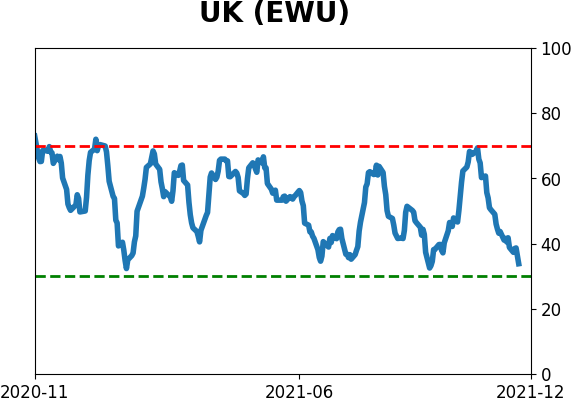
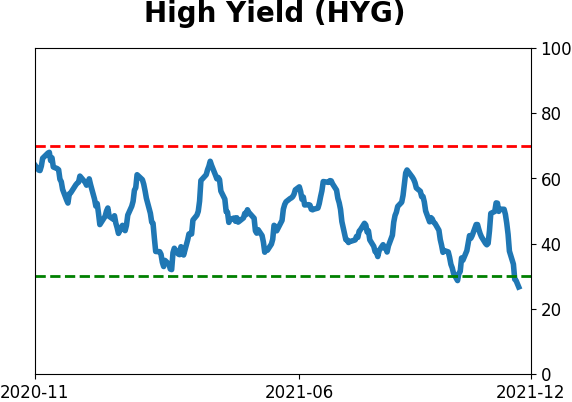
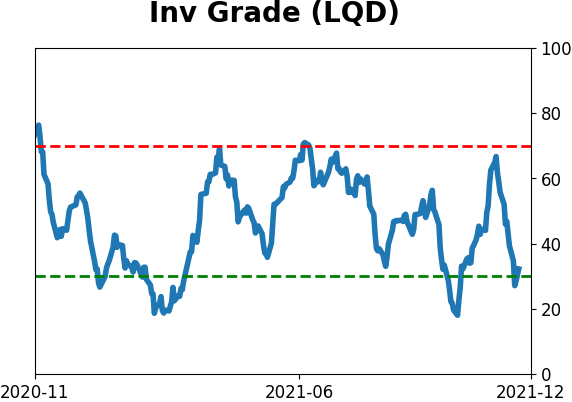
Sentiment Around The World
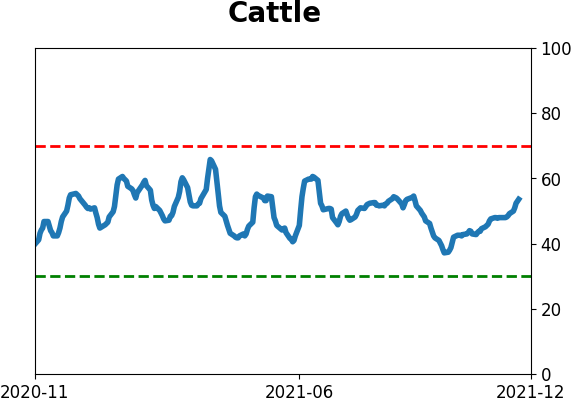
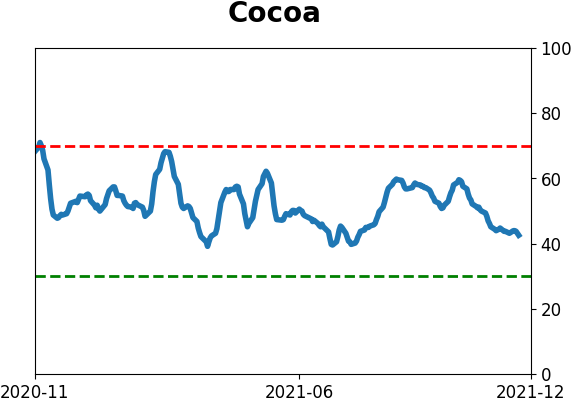
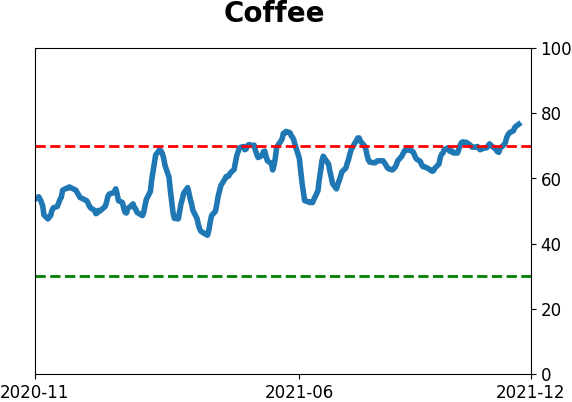
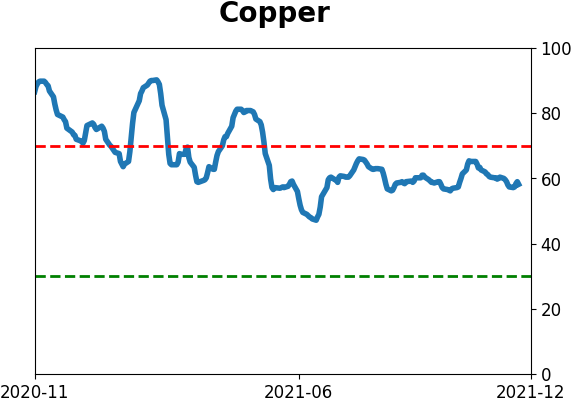
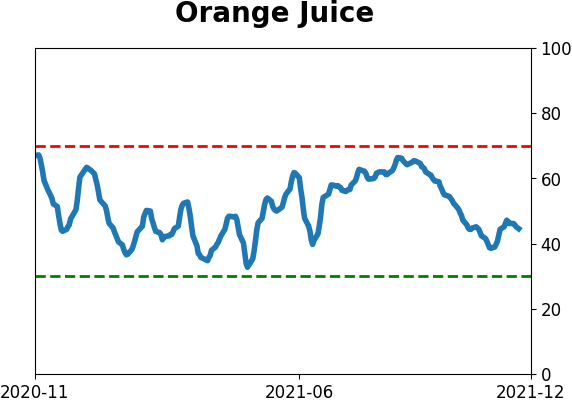
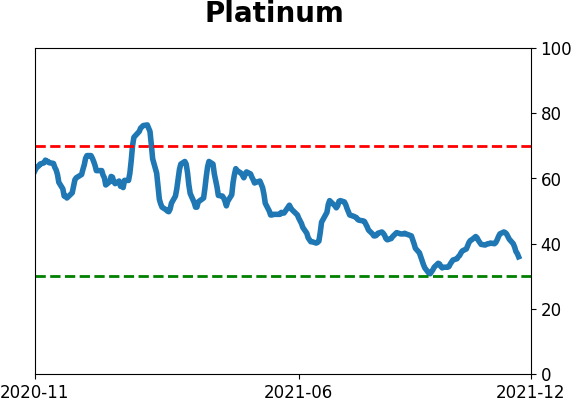
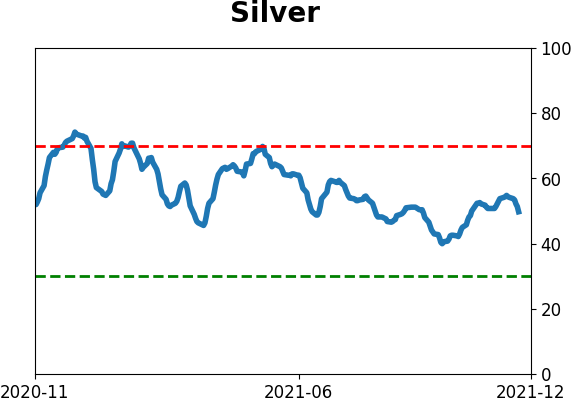
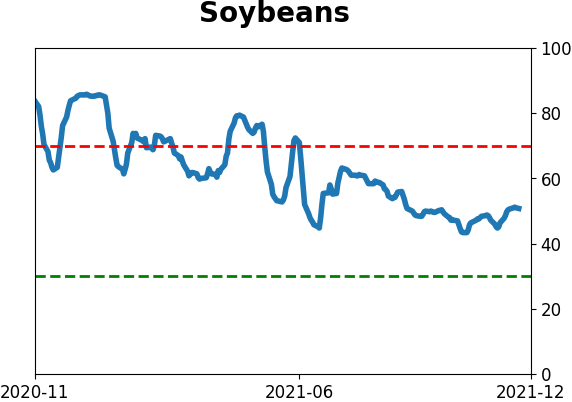
Optimism Index Thumbnails
|
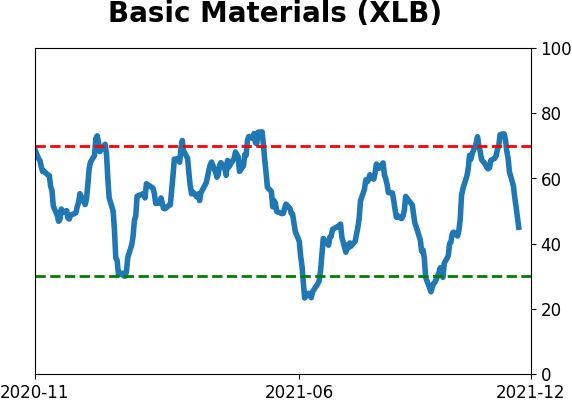
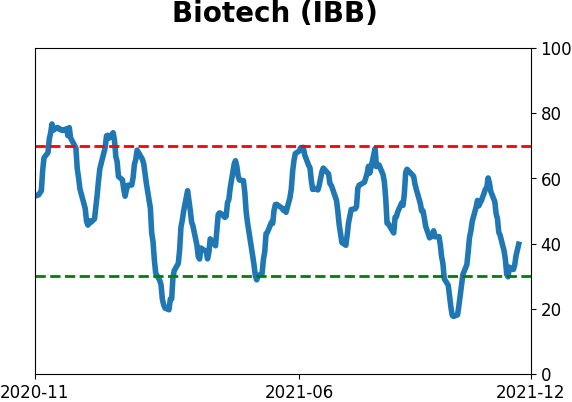
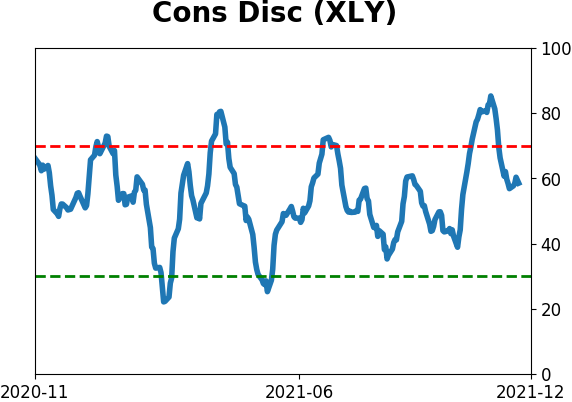
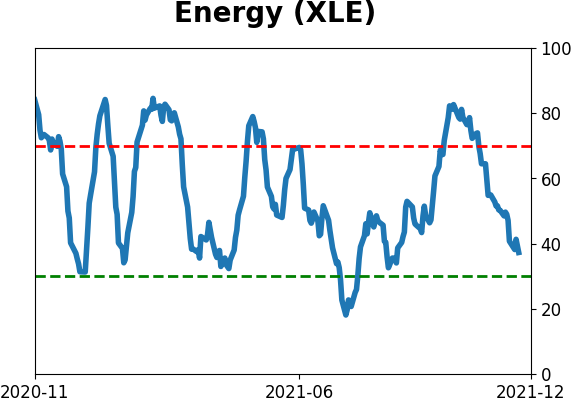
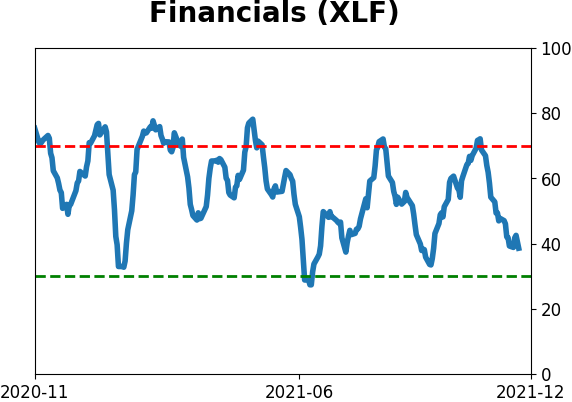
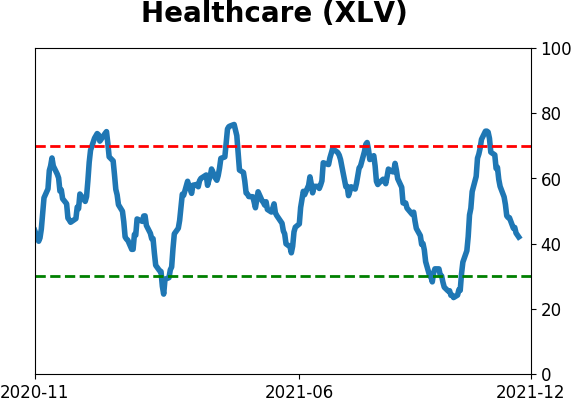
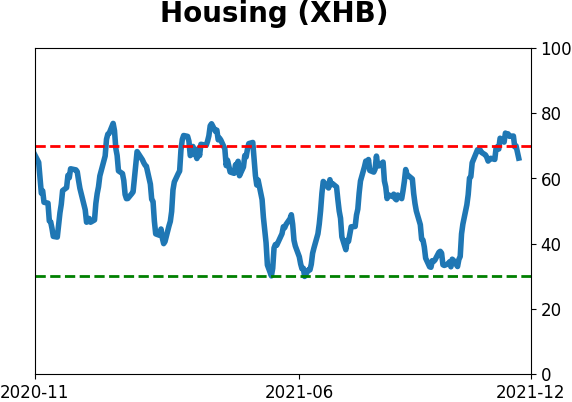
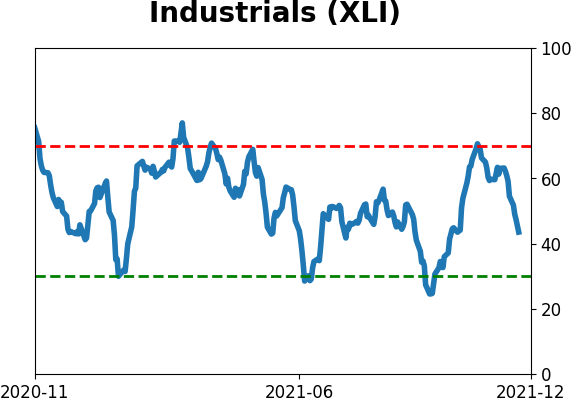
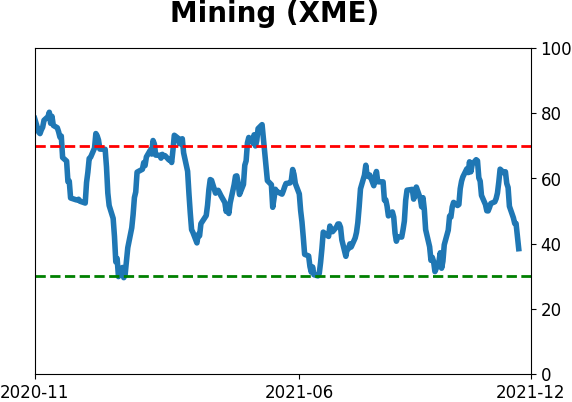
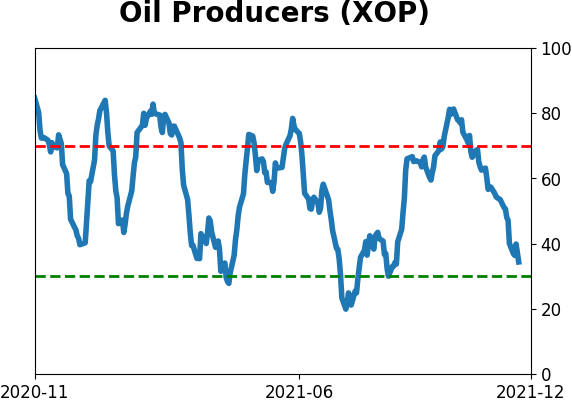
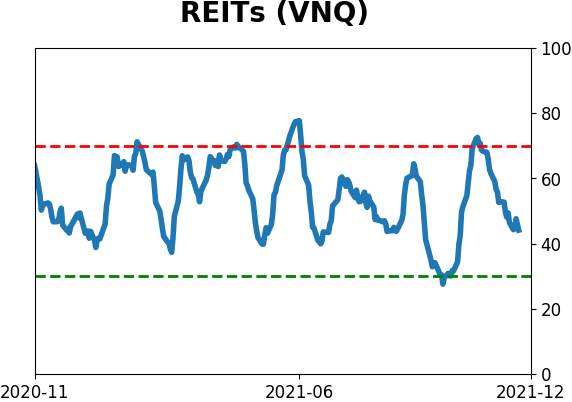
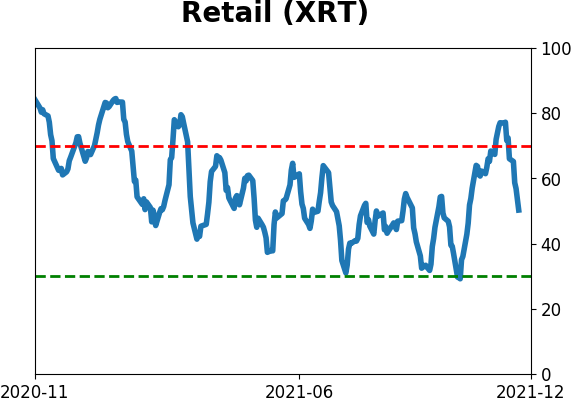
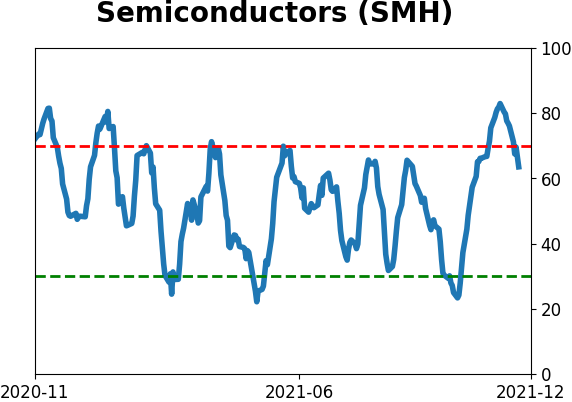
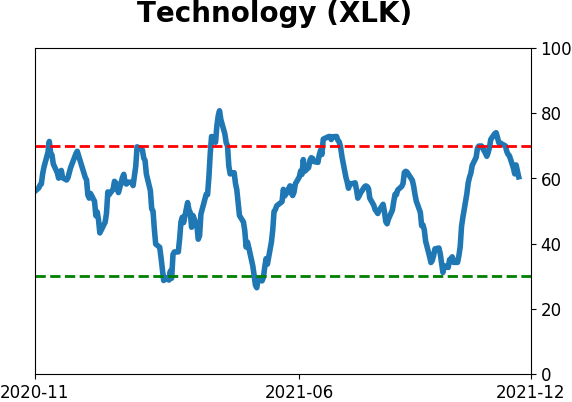
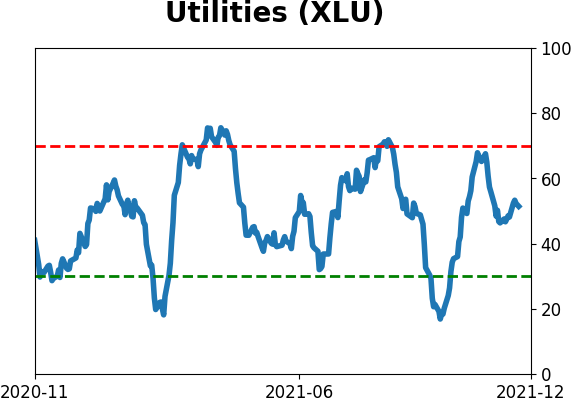
Sector ETF's - 10-Day Moving Average
|
|
|
Country ETF's - 10-Day Moving Average
|
|
|
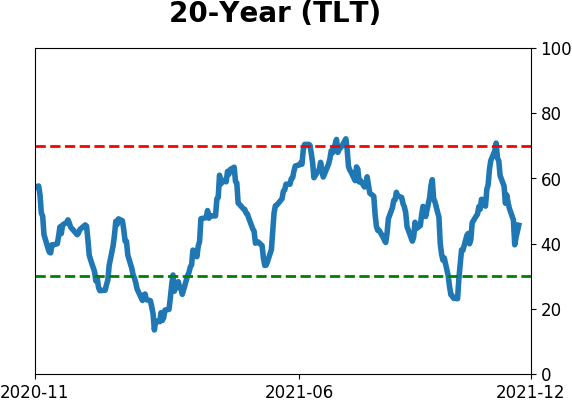
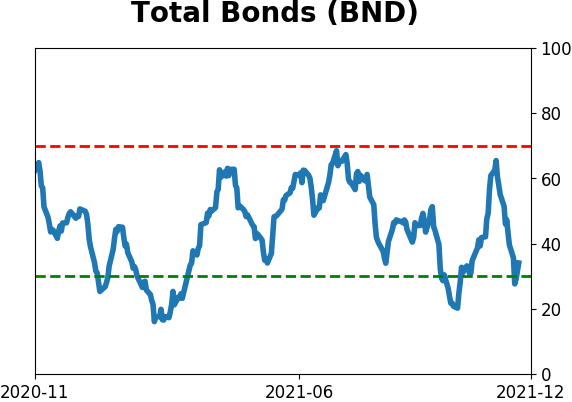
Bond ETF's - 10-Day Moving Average
|
|
|
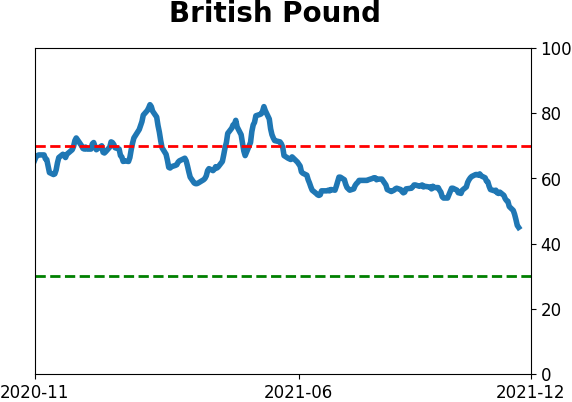
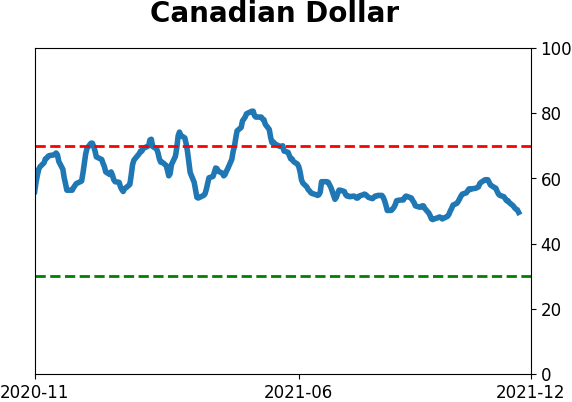
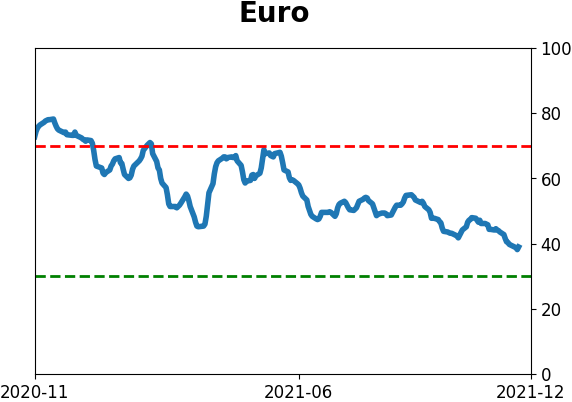
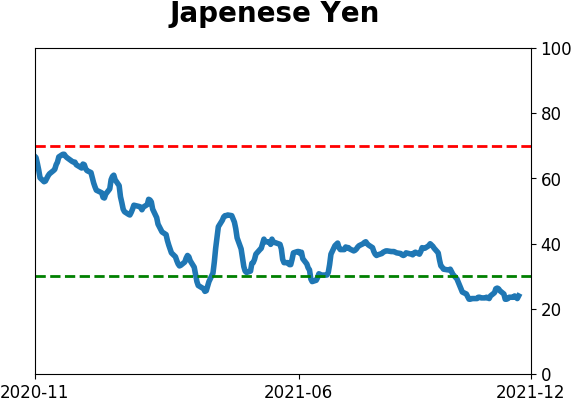
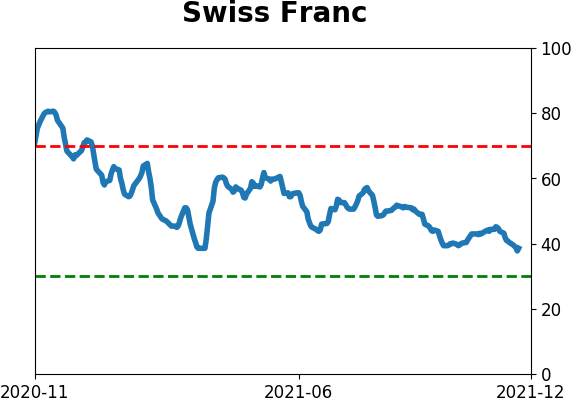
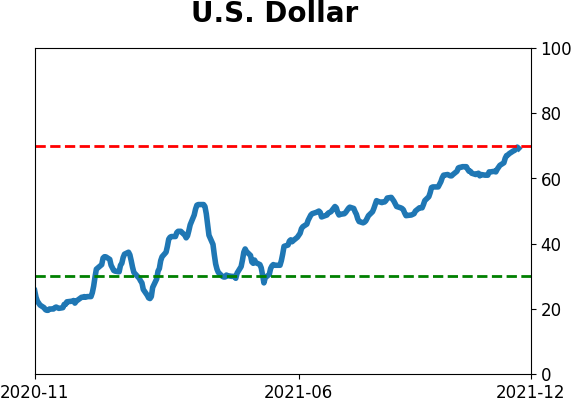
Currency ETF's - 5-Day Moving Average
|
|
|
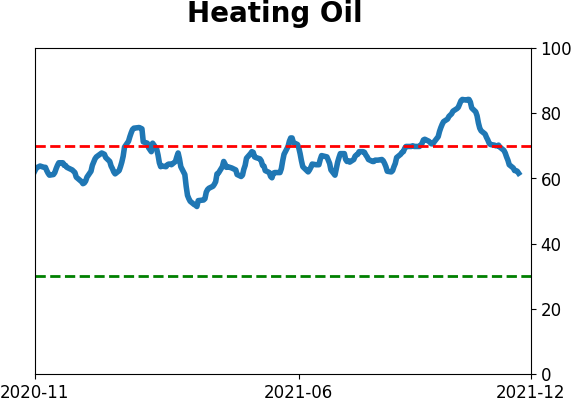
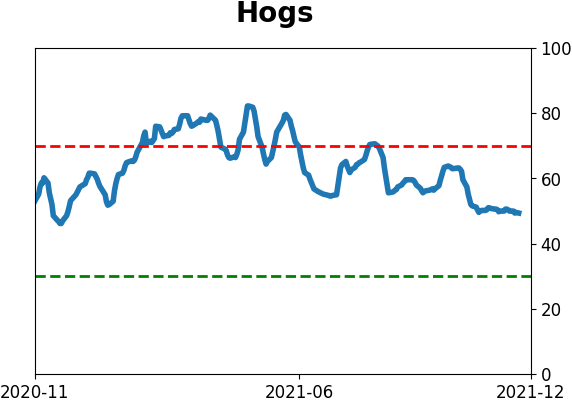
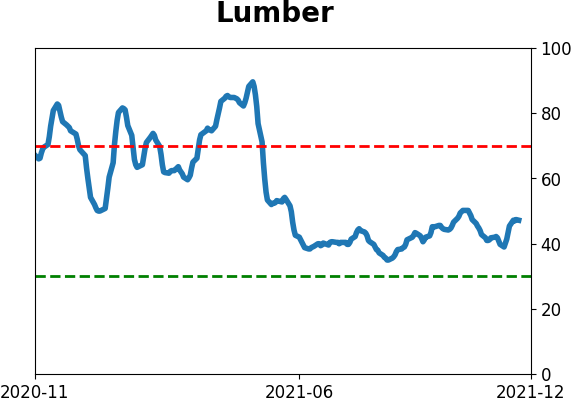
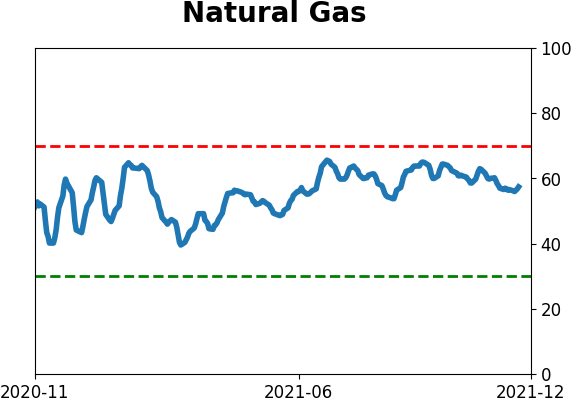
Commodity ETF's - 5-Day Moving Average
|
|