Headlines
|
|
Twas the day before Thanksgiving...:
The trading days around Thanksgiving have demonstrated a favorable tendency over many decades. In this piece, we take a closer look at the results.
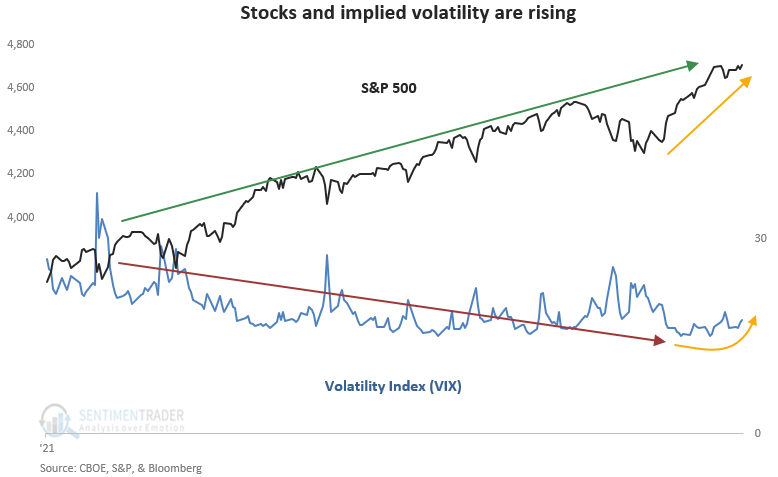
A rising S&P 500 and VIX suggests a consolidation:
Stocks and implied volatility are rising, suggesting a short-term consolidation.
Bottom Line:
STOCKS: Hold By early October, sentiment had reset. Several important momentum streaks ended, which has brought in buyers in the past, and seasonality turned positive. We're now seeing signs that sentiment has quickly shifted, especially among options traders. It's gotten to an extreme that has preceded weaker-than-average returns.
BONDS: Hold In late October, sentiment on bonds - from Treasuries to corporates - entered pessimistic territory. It's now starting to recover, with some quick moves in corporate bonds. We'll see if those bonds, in particular, can hold recent gains.
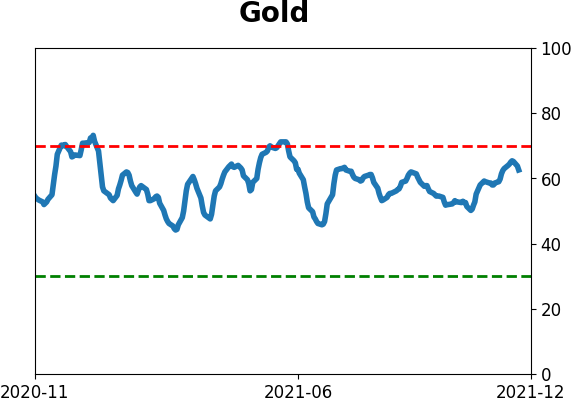
GOLD: Hold
Gold and miners were rejected after trying to recover above their 200-day averages in May. Some oversold extremes in breadth measures among miners triggered in late September, and they've recovered a bit since then. The group still has some proving to do.
|
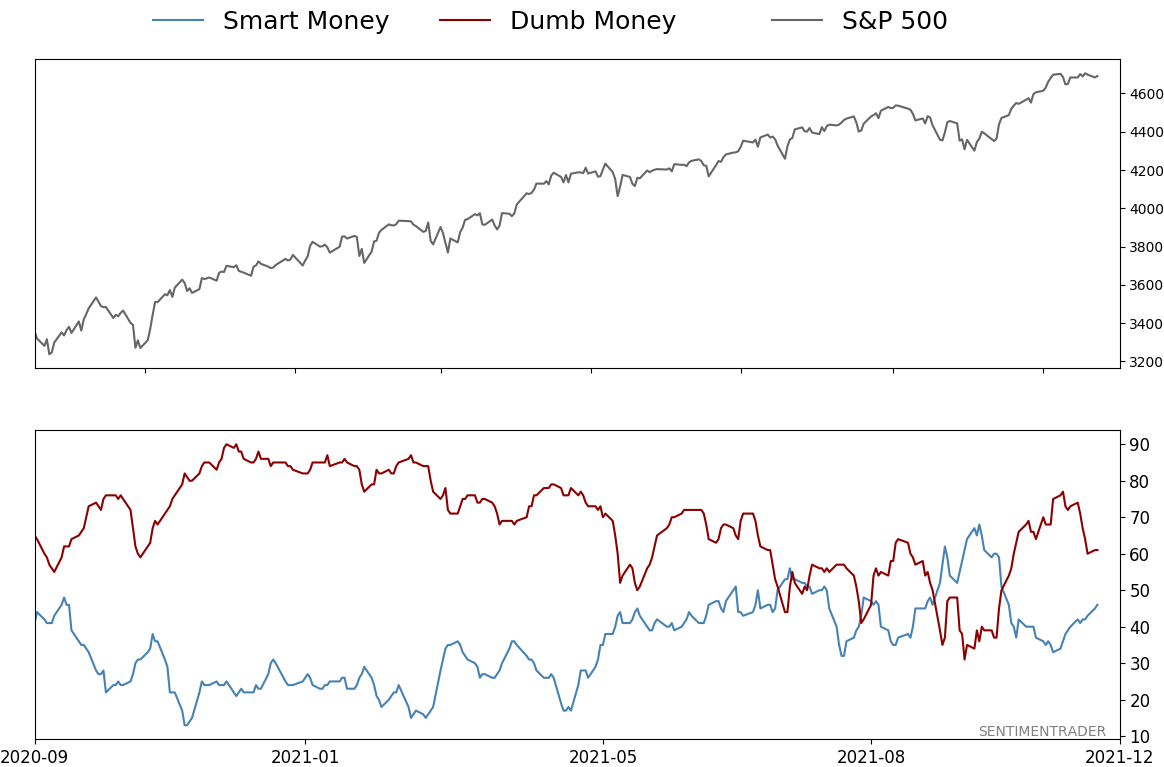
Smart / Dumb Money Confidence
|
Smart Money Confidence: 46%
Dumb Money Confidence: 61%
|
|
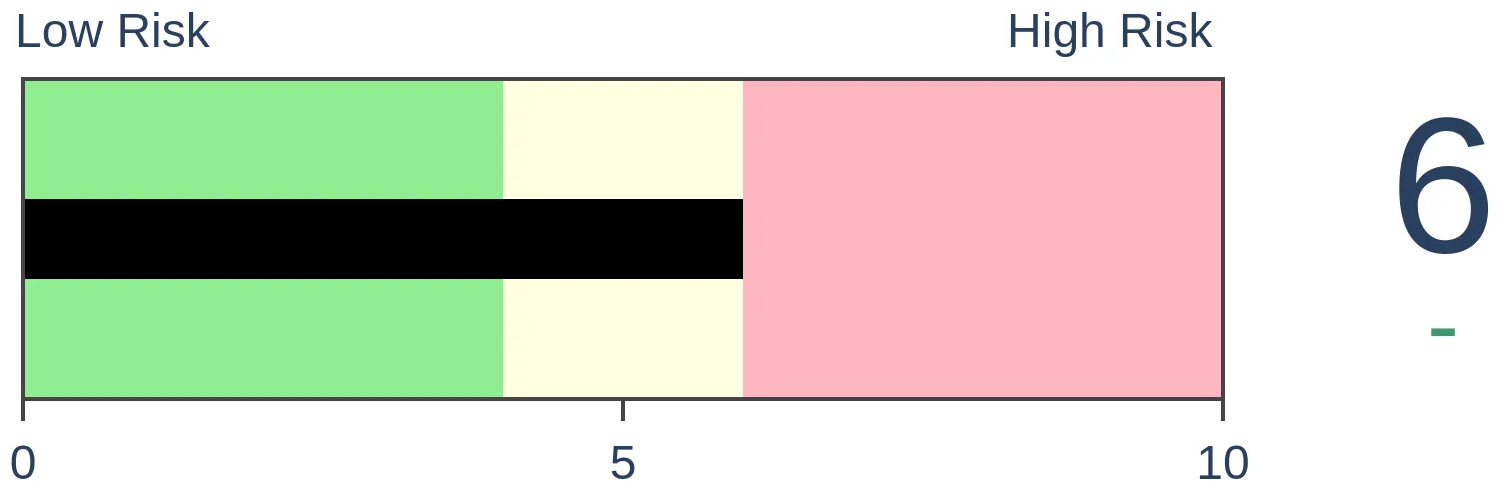
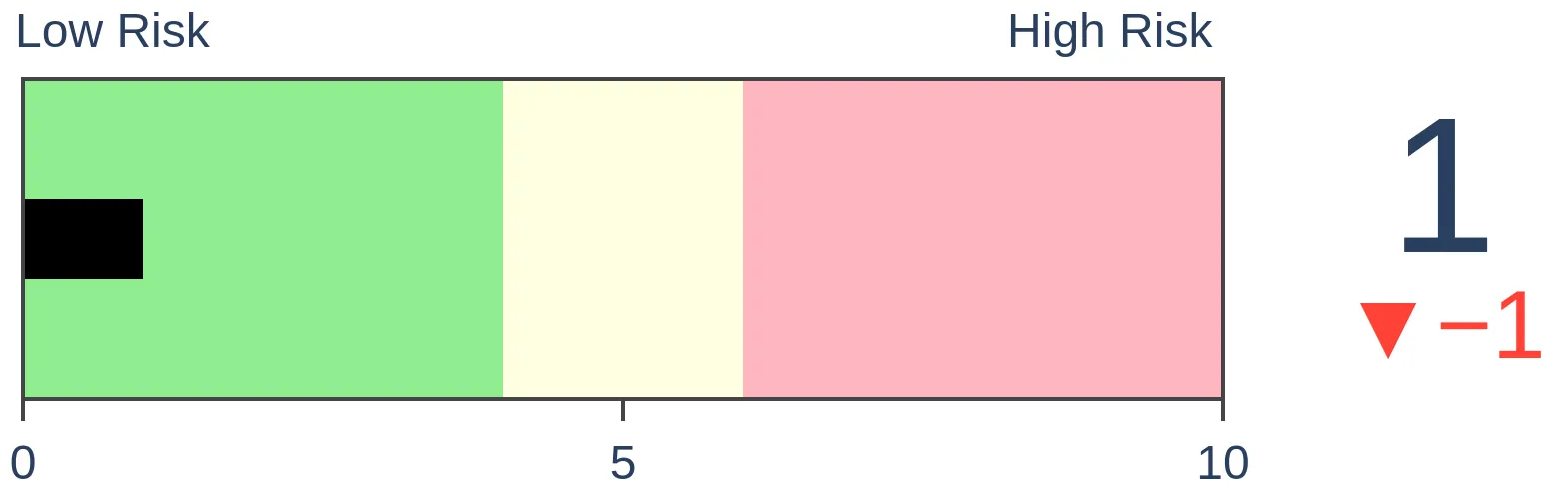
Risk Levels
Stocks Short-Term

|
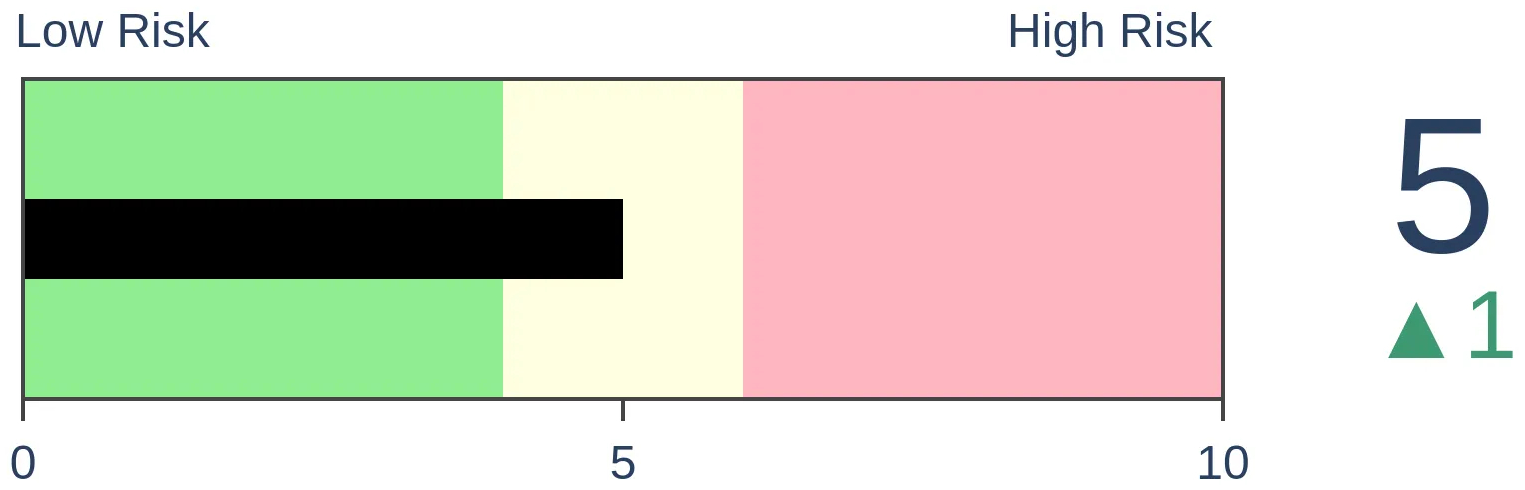
Stocks Medium-Term
|
|
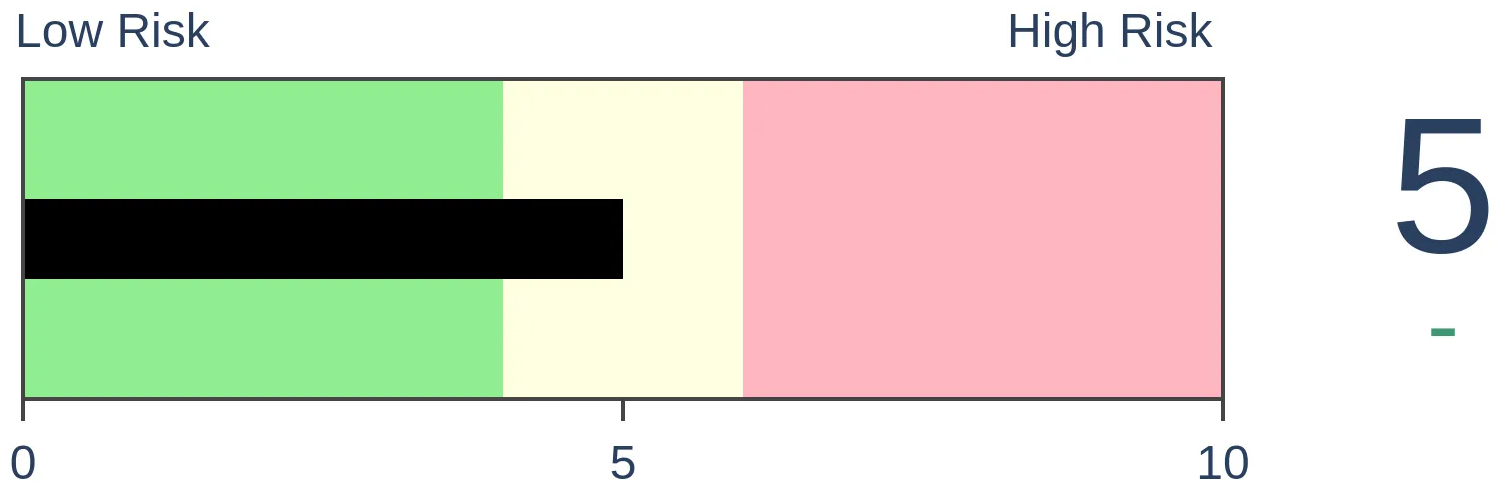
Bonds
|
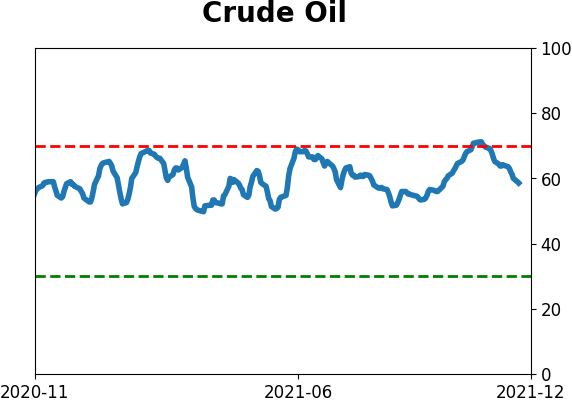
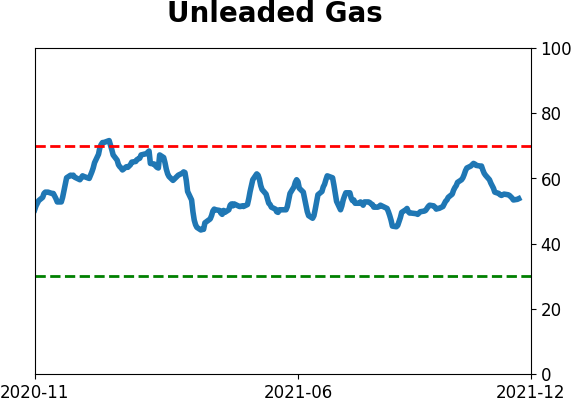
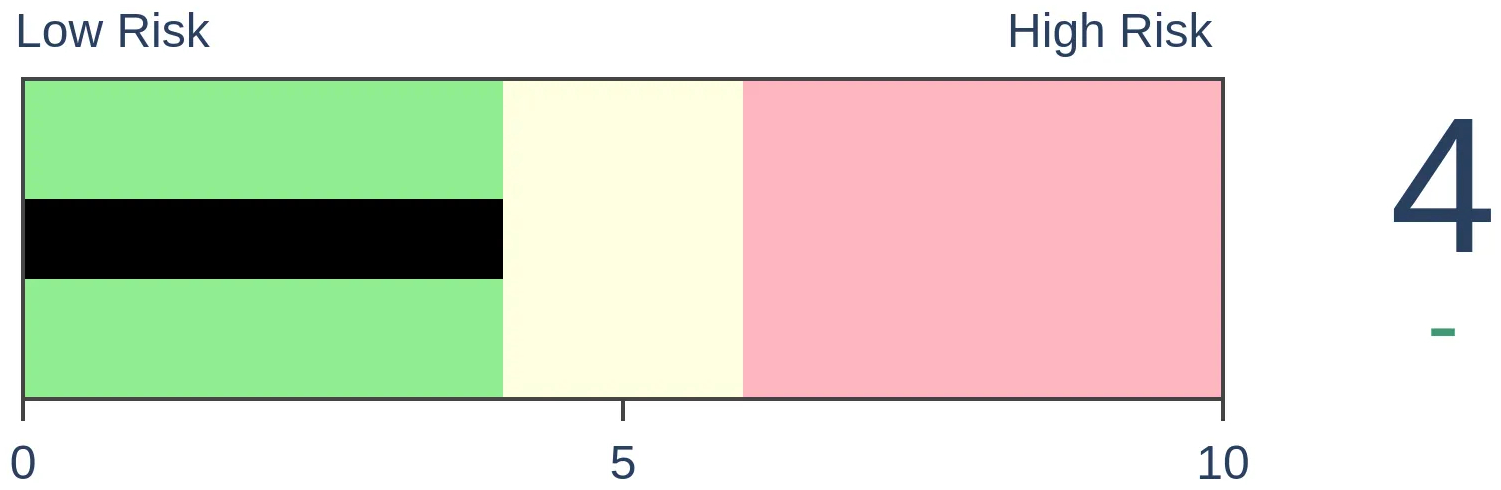
Crude Oil
|
|
Gold
|
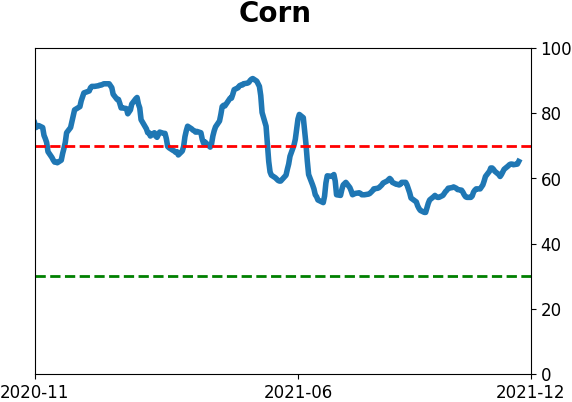
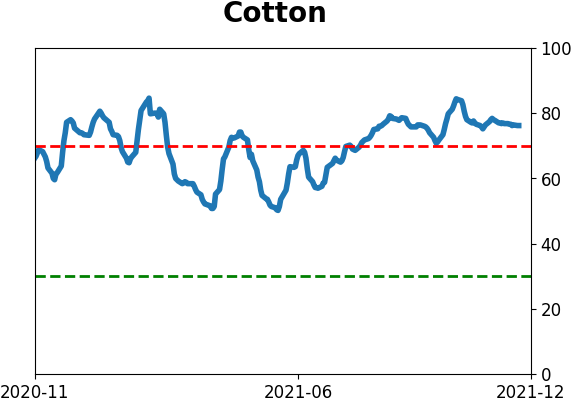
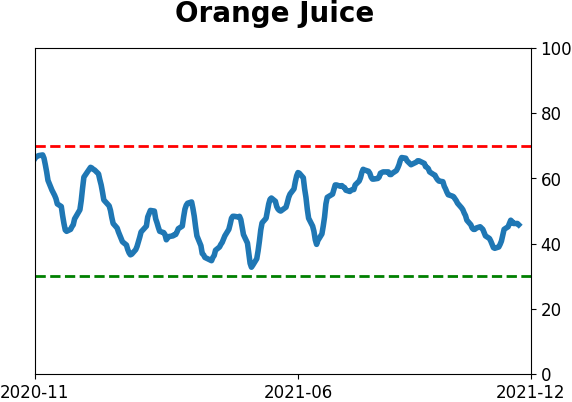
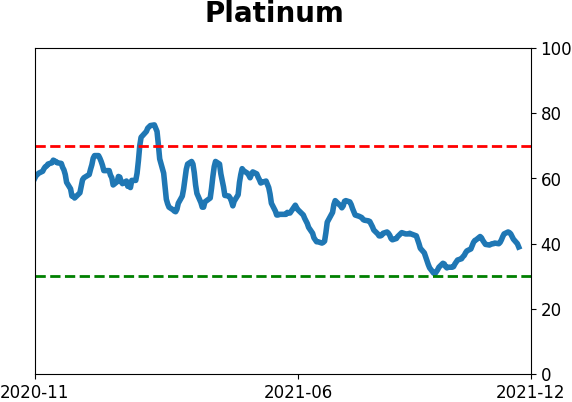
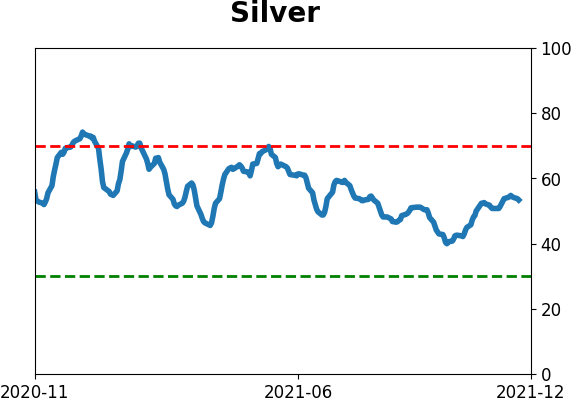
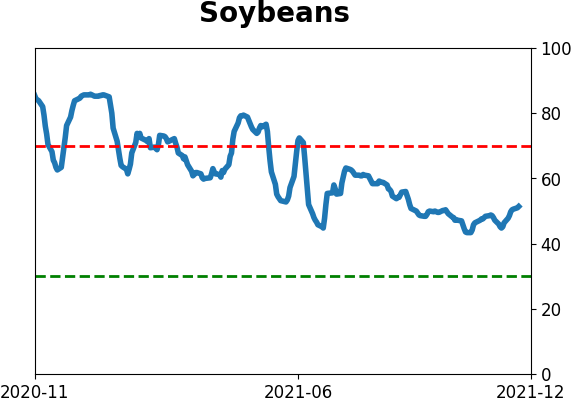
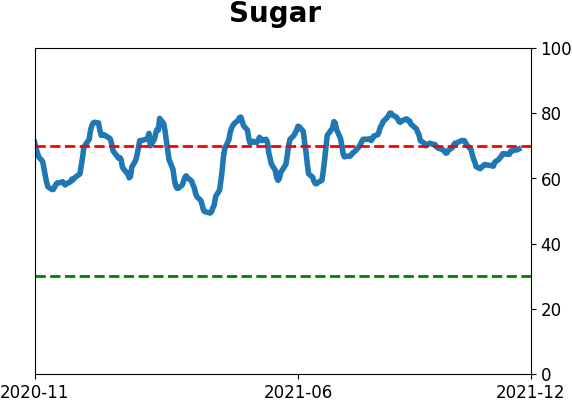
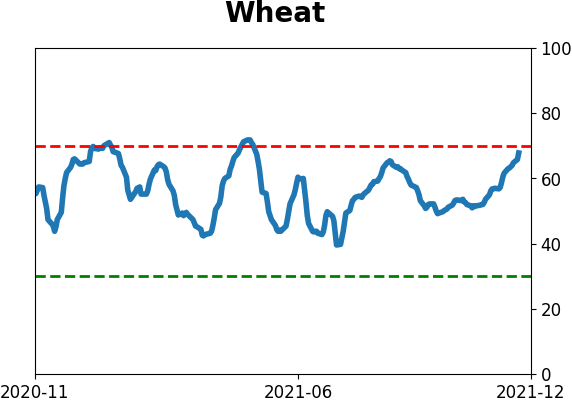
Agriculture
|
|
Research
By Jay Kaeppel
BOTTOM LINE
The trading days around Thanksgiving have demonstrated a favorable tendency over many decades. In this piece, we take a closer look at the results.
FORECAST / TIMEFRAME
None
|
Key Points
- The trading day before and the trading day after Thanksgiving have demonstrated a favorable tendency over the years
- Short-term traders may be able to take advantage of this "edge"
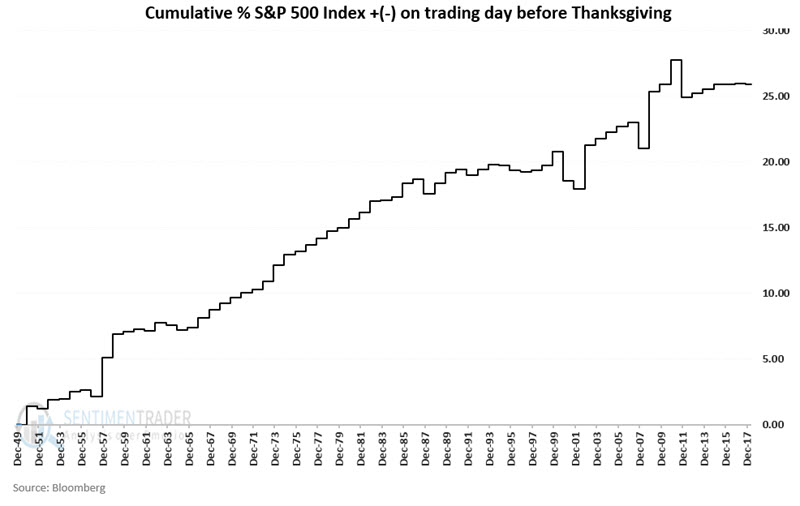
The day before Thanksgiving
The chart below displays the cumulative % gain for the S&P 500 Index held long ONLY on the trading day just BEFORE Thanksgiving (for the record, this implies buying at the close on Tuesday of Thanksgiving week and selling at the close the next day).
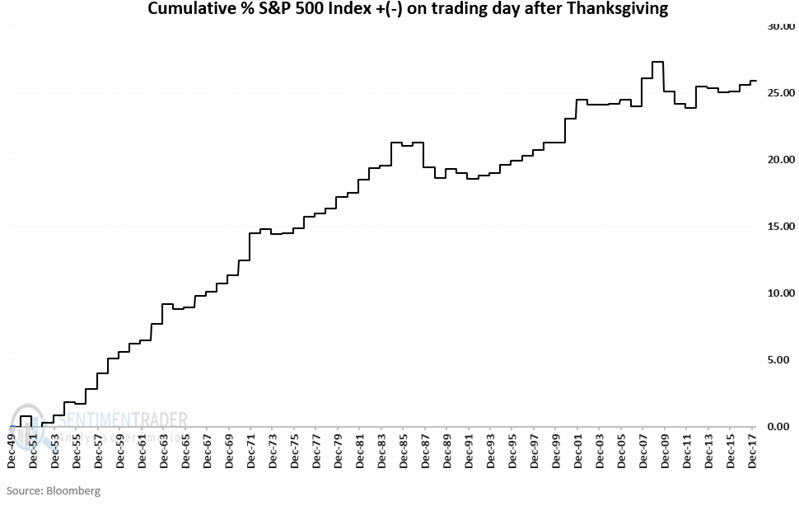
The day after Thanksgiving
The chart below displays the cumulative % gain for the S&P 500 Index held long ONLY on the trading day just AFTER Thanksgiving (for the record, this implies buying at the close on Wednesday of Thanksgiving week and selling at the close on Friday).
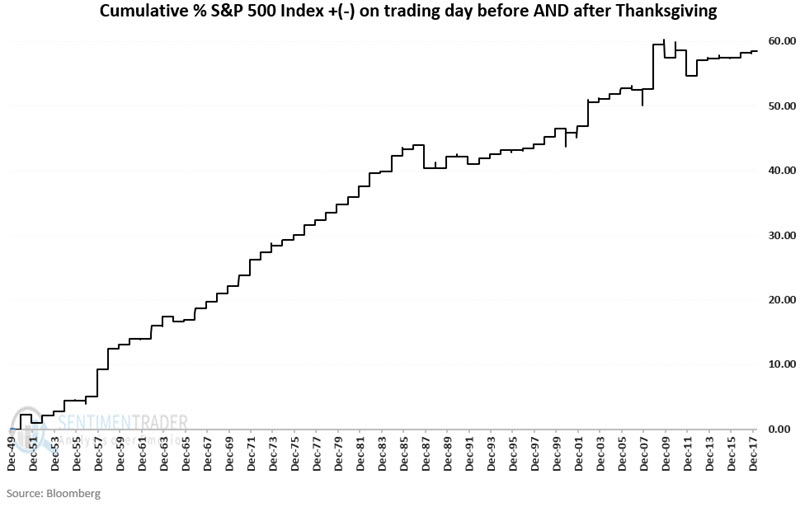
The day before AND after Thanksgiving
The chart below displays the cumulative % gain for the S&P 500 Index held long ONLY on the trading day just BEFORE AND AFTER Thanksgiving (for the record, this implies buying at the close on Tuesday of Thanksgiving week and selling at the close on Friday).
Analyzing results
The chart below displays the year-by-year % gain or loss for the S&P 500 Index held long ONLY on the trading day just BEFORE AND AFTER Thanksgiving.
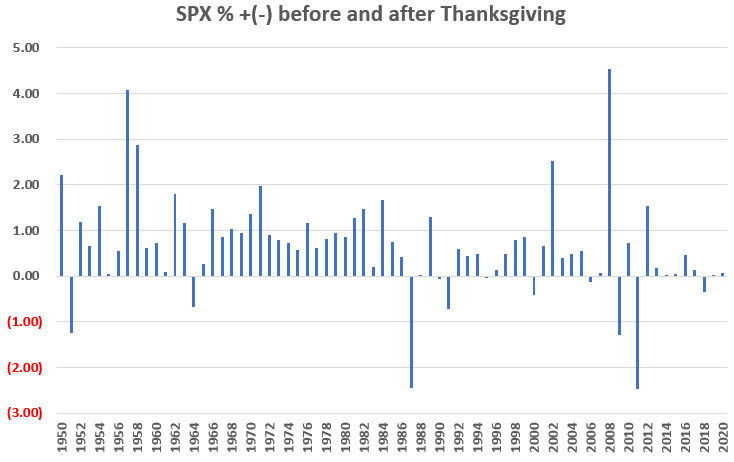
The table below displays the particulars.
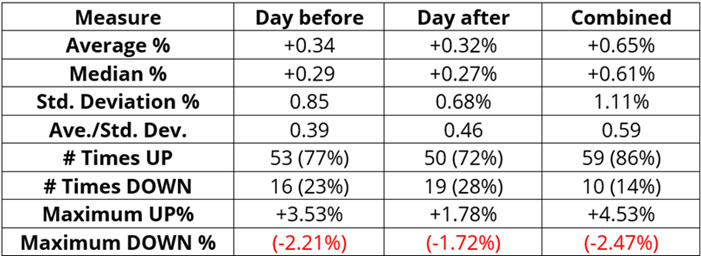
What the research tells us…
- The stock market has demonstrated a strong tendency to rally during the days just around Thanksgiving
- That said, results in recent years have not been as uniformly favorable as in prior years
- The strategy above can be traded with any standard or leveraged ETF or mutual fund (as long as there are no switching restrictions) that tracks the S&P 500 Index.
By Dean Christians
BOTTOM LINE
Stocks and implied volatility are rising, suggesting a short-term consolidation.
FORECAST / TIMEFRAME
None
|
Key points:
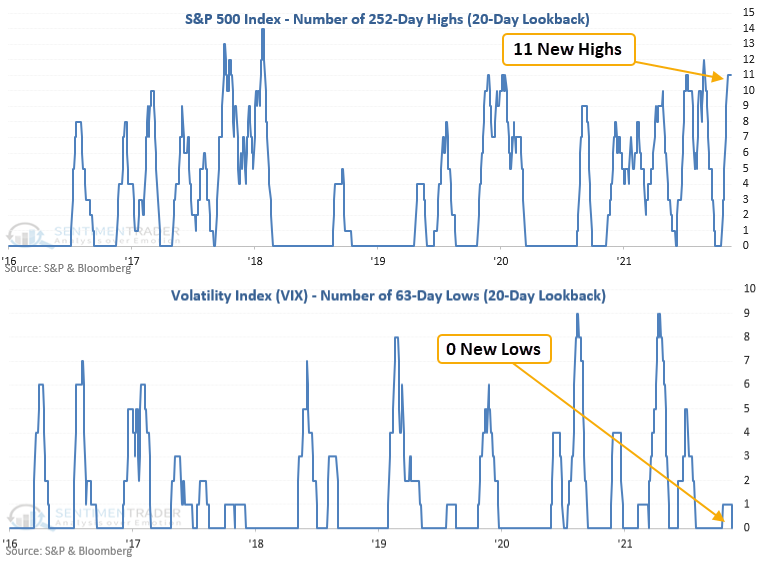
- The S&P 500 Index has recorded 11 new highs in the trailing 20-day period
- The Volatility Index (VIX) has recorded 0 new lows in the trailing 20-day period
- When the S&P 500 and the VIX rise in unison, it suggests a short-term consolidation
Implied volatility and stocks move in opposite directions
The Volatility Index (VIX) measures the market's expectations for volatility over the coming 30 days. It is often referred to as the fear gauge because it tends to rise when the market declines. Conversely, when stocks rise, the fear gauge falls.
However, there are times when the VIX and stocks rise in unison, which is the case now. It can be a sign of optimism in some circumstances as traders are willing to pay any price to get a piece of the action in a FOMO-driven market. The runup to the January 2018 Volmageddon peak comes to mind.
Let's assess the outlook for the S&P 500 when the S&P 500 has recorded 11 new 252-day highs, and the VIX index has recorded 0 new 63-day lows in a trailing 20-day period.
Similar signals preceded short-term consolidations
This signal has triggered 12 other times over the past 27 years. After the others, future returns and win rates were mixed to slightly weak in the short term. However, the long-term results suggest the muddled near-term picture is most likely nothing more than a healthy consolidation.
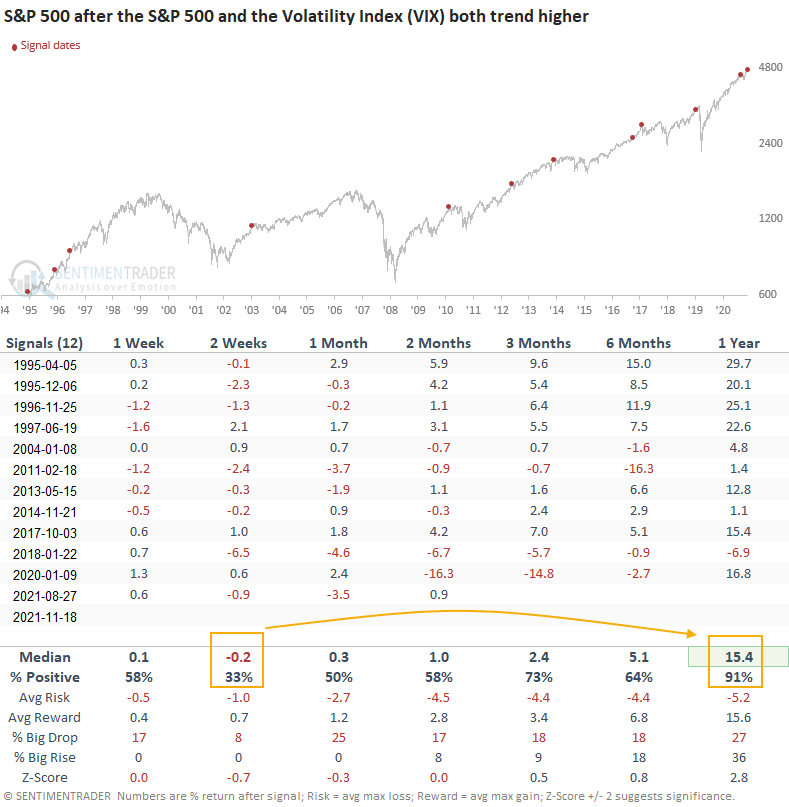
What the research tells us...
When the S&P 500 and the VIX Index rise in unison over a 1-month time frame, a fear-of-missing-out environment creates an optimistic sentiment backdrop. Similar setups to what we're seeing now have preceded consolidations in the short term. However, the outlook suggests a timeout that refreshes a bullish medium and long-term trend backdrop.
Active Studies
| Time Frame | Bullish | Bearish | | Short-Term | 2 | 0 | | Medium-Term | 11 | 0 | | Long-Term | 13 | 6 |
|
Indicators at Extremes
Portfolio
| Position | Description | Weight % | Added / Reduced | Date | | Stocks | RSP | 10.7 | Added 6.4% | 2021-10-01 | | Bonds | 32.7% BND, 7.1% SCHP | 39.8 | Added 8.3% | 2021-10-26 | | Commodities | GCC | 2.4 | Reduced 2.1%
| 2020-09-04 | | Precious Metals | GDX | 4.6 | Reduced 4.2% | 2021-05-19 | | Special Situations | 9.8% KWEB, 4.7% XLE, 2.9% PSCE | 17.3 | Added 9.78% | 2021-10-01 | | Cash | | 24.1 | | |
|
Updates (Changes made today are underlined)
Much of our momentum and trend work has remained positive for several months, with some scattered exceptions. Almost all sentiment-related work has shown a poor risk/reward ratio for stocks, especially as speculation drove to record highs in exuberance in February. Much of that has worn off, and most of our models are back toward neutral levels. There isn't much to be excited about here. The same goes for bonds and even gold. Gold has been performing well lately and is back above long-term trend lines. The issue is that it has a poor record of holding onto gains when attempting a long-term trend change like this, so we'll take a wait-and-see approach. Momentum has ebbed quickly in recent weeks, and nearing oversold levels in some indicators. This can be a dangerous area, with a lot of short-term volatility, but we'd be more inclined to add medium- to long-term exposure rather than sell on much more of a decline, thanks to already rock-bottom exposure. Other areas look more attractive, including some overseas markets. RETURN YTD: 11.3% 2020: 8.1%, 2019: 12.6%, 2018: 0.6%, 2017: 3.8%, 2016: 17.1%, 2015: 9.2%, 2014: 14.5%, 2013: 2.2%, 2012: 10.8%, 2011: 16.5%, 2010: 15.3%, 2009: 23.9%, 2008: 16.2%, 2007: 7.8%
|
|
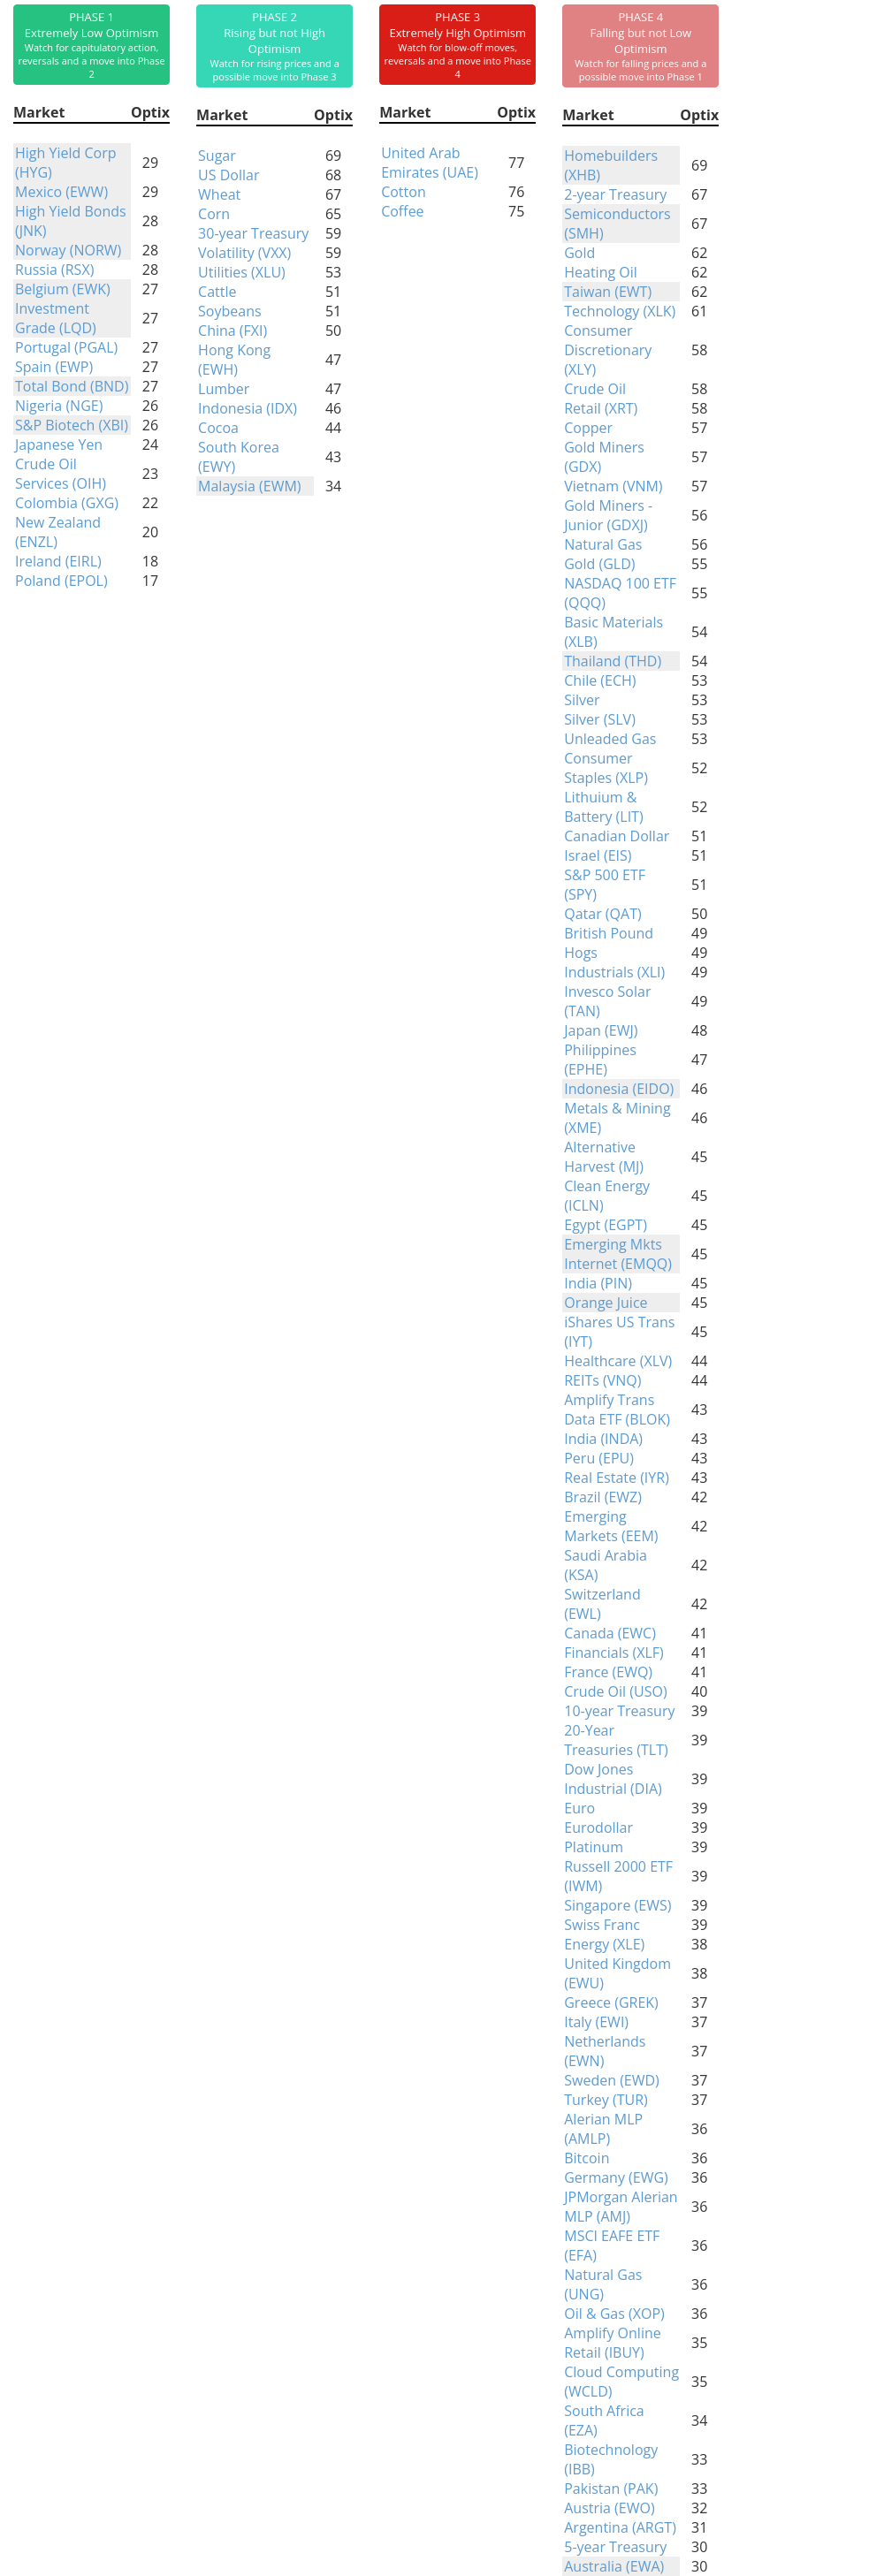
Phase Table
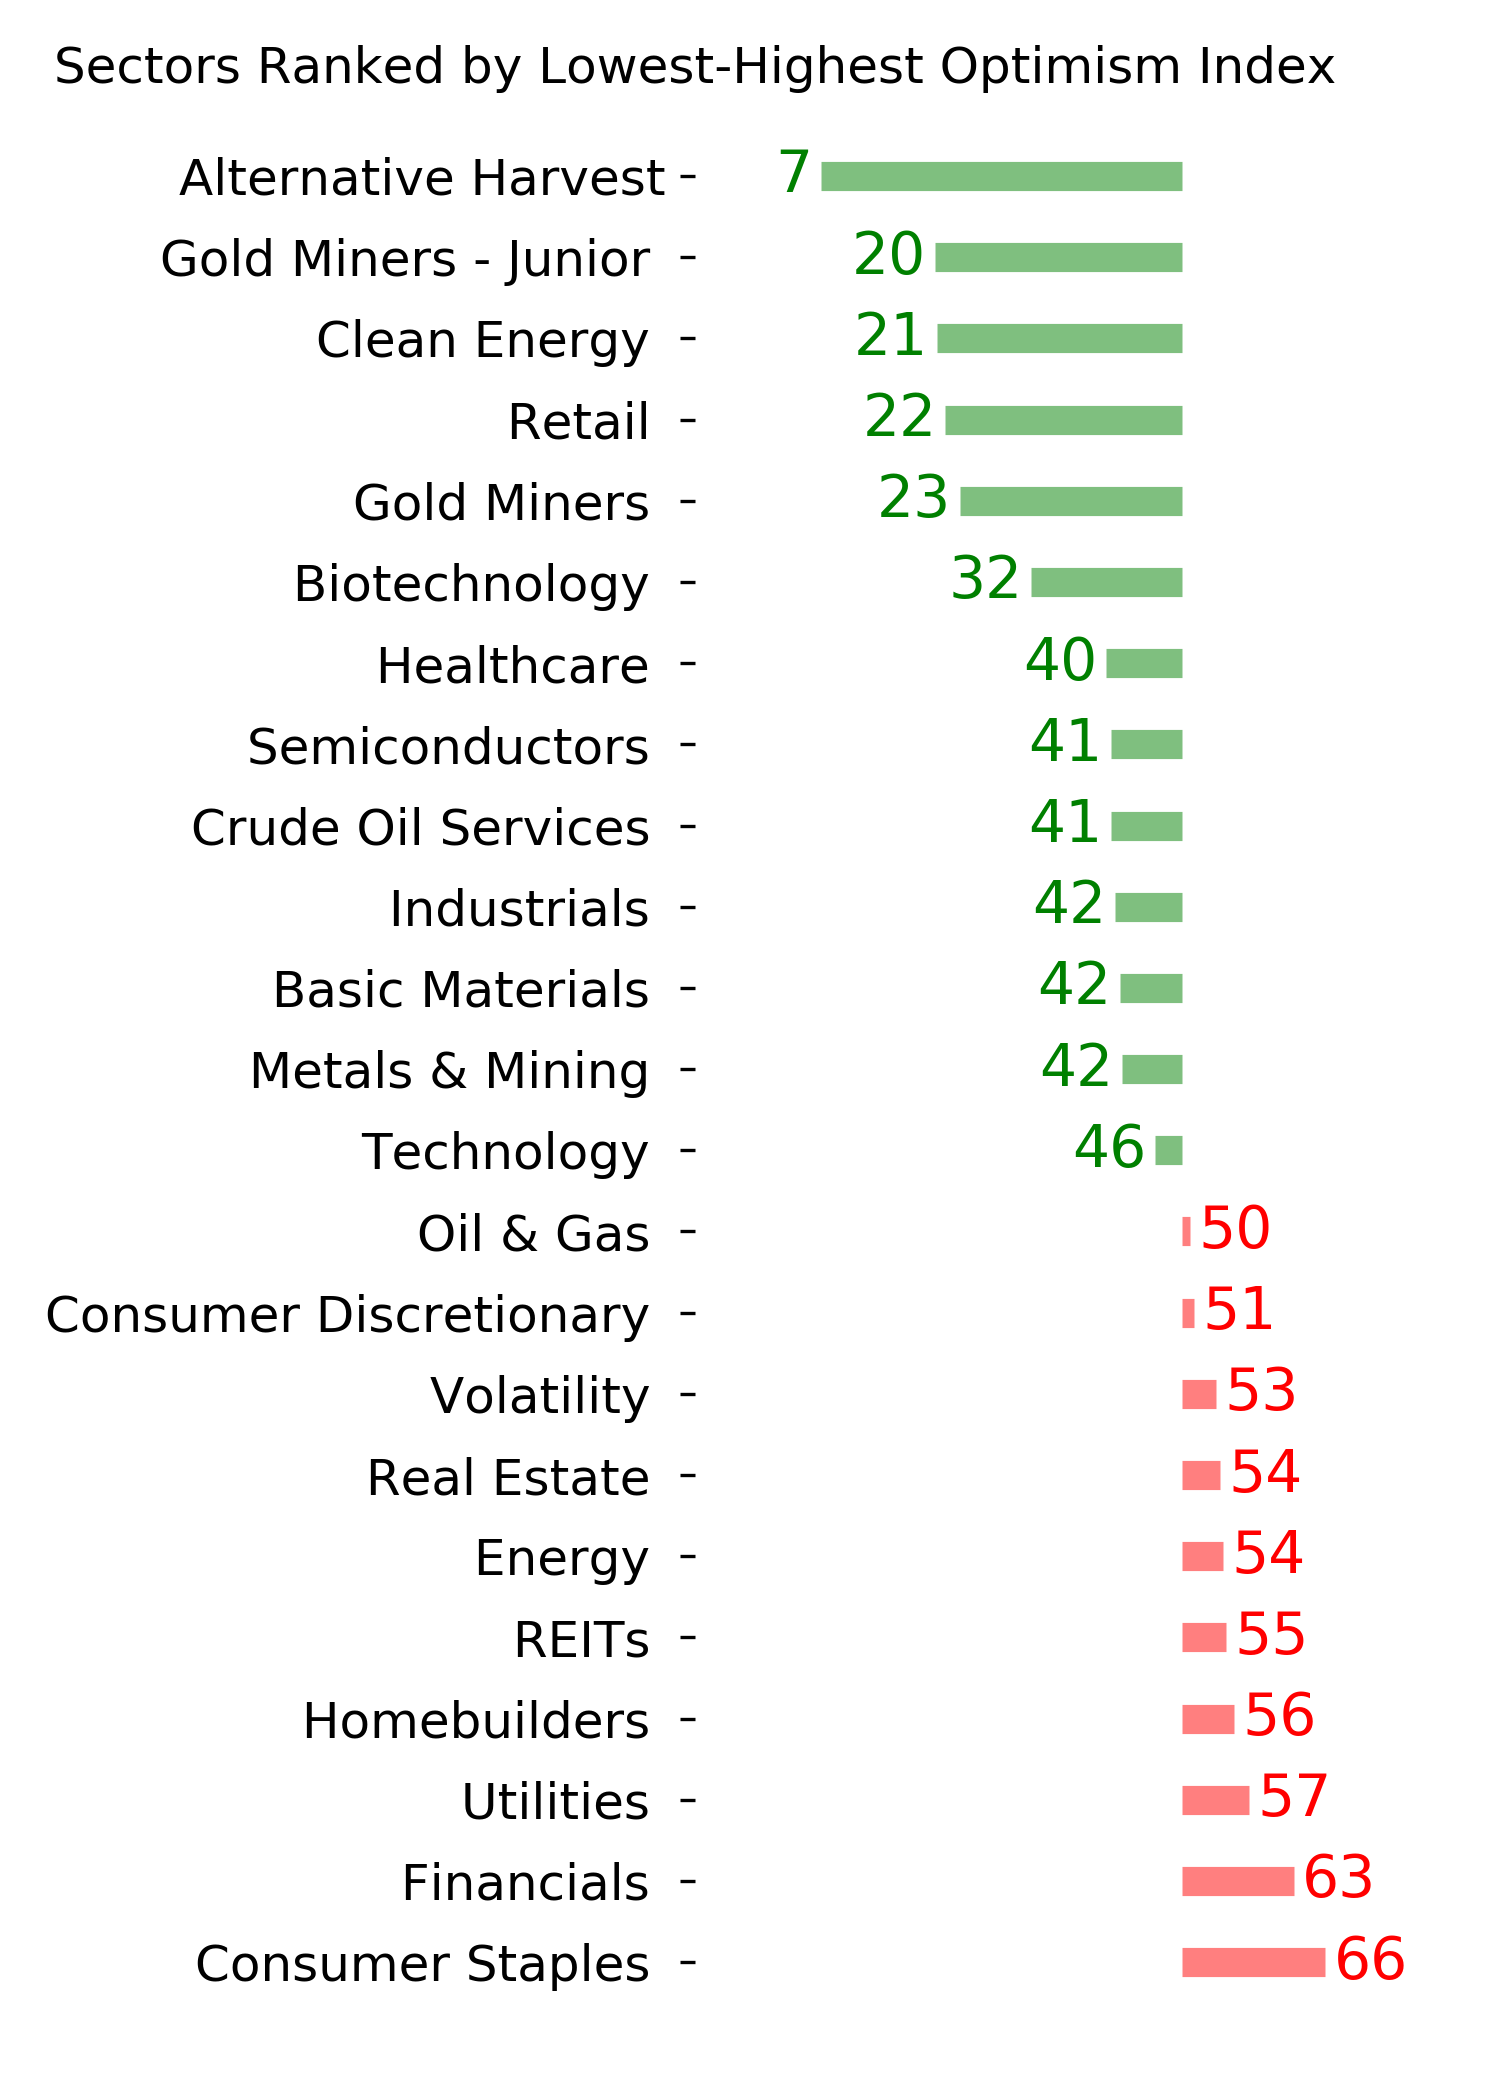
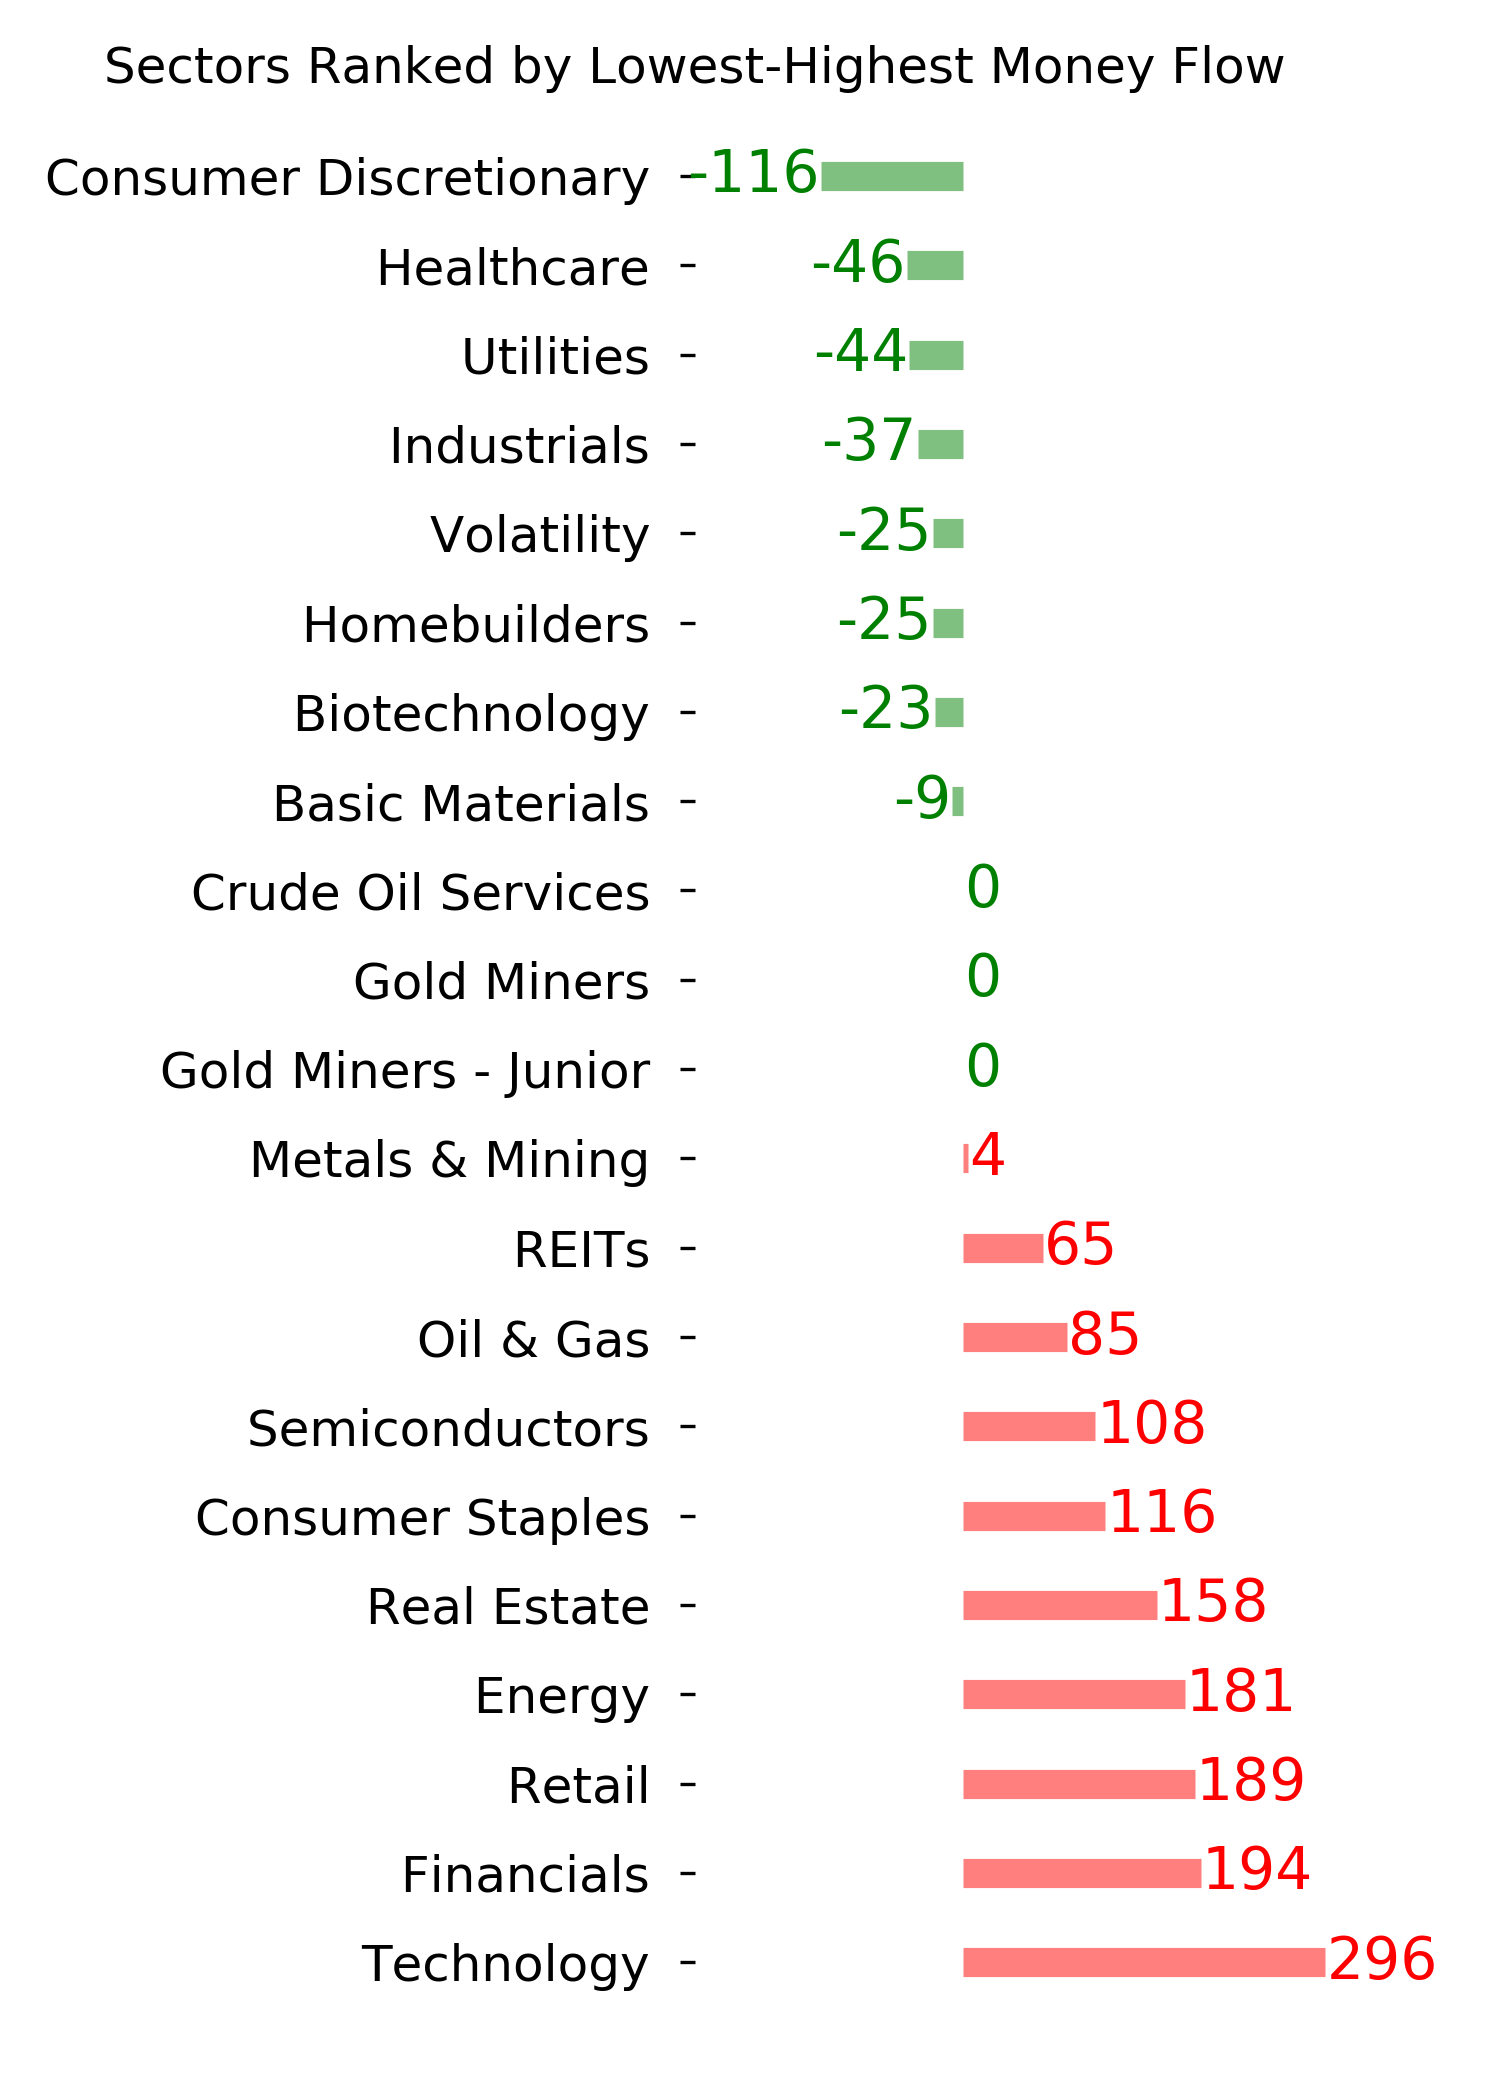
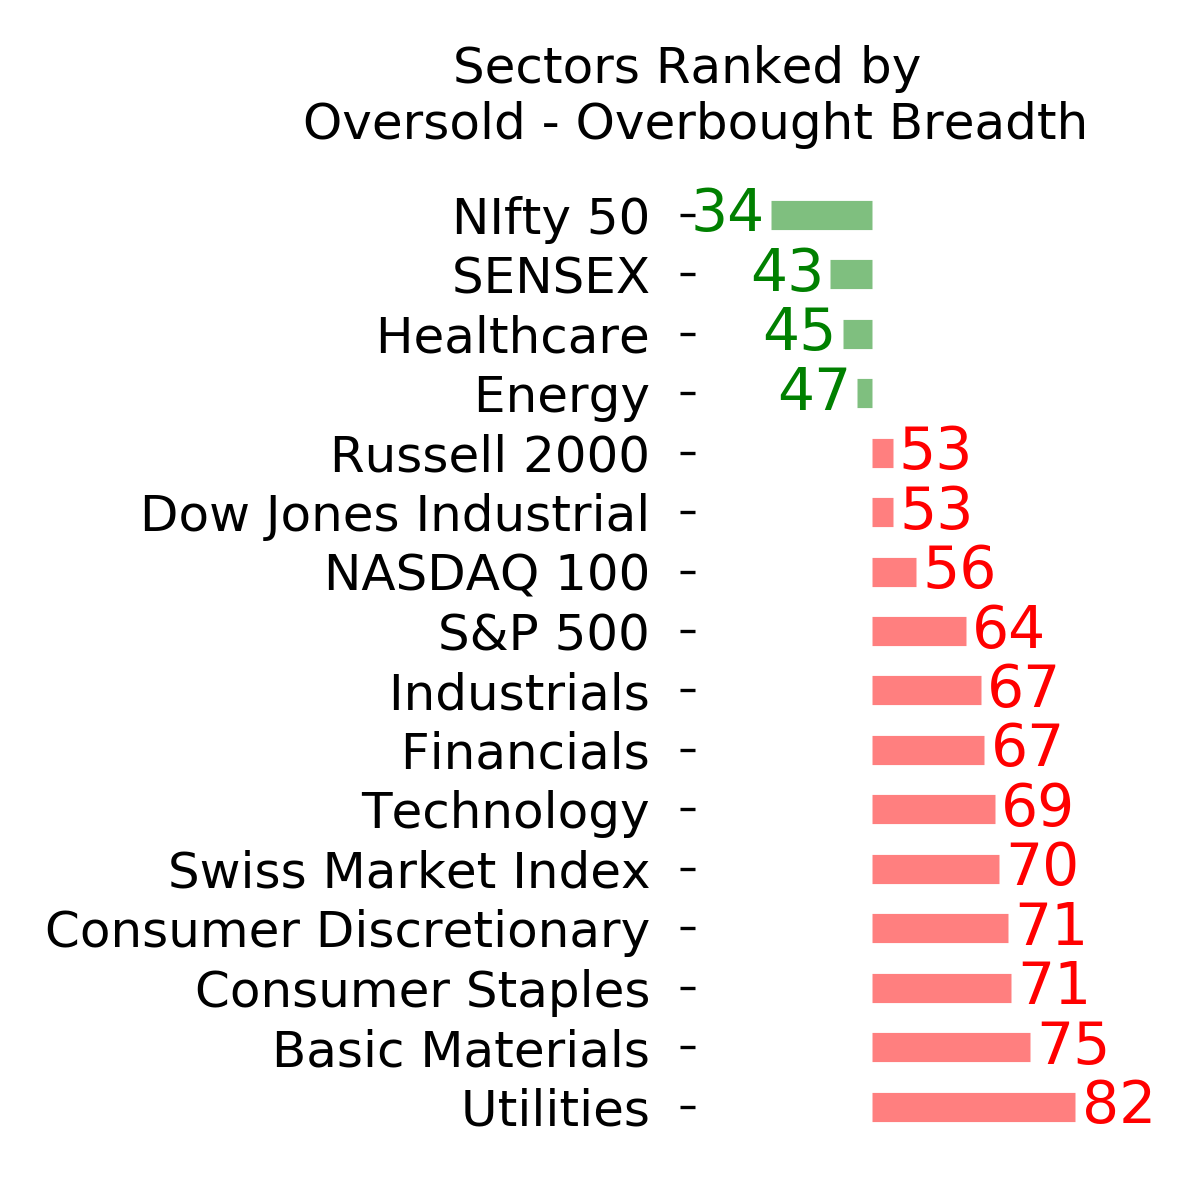
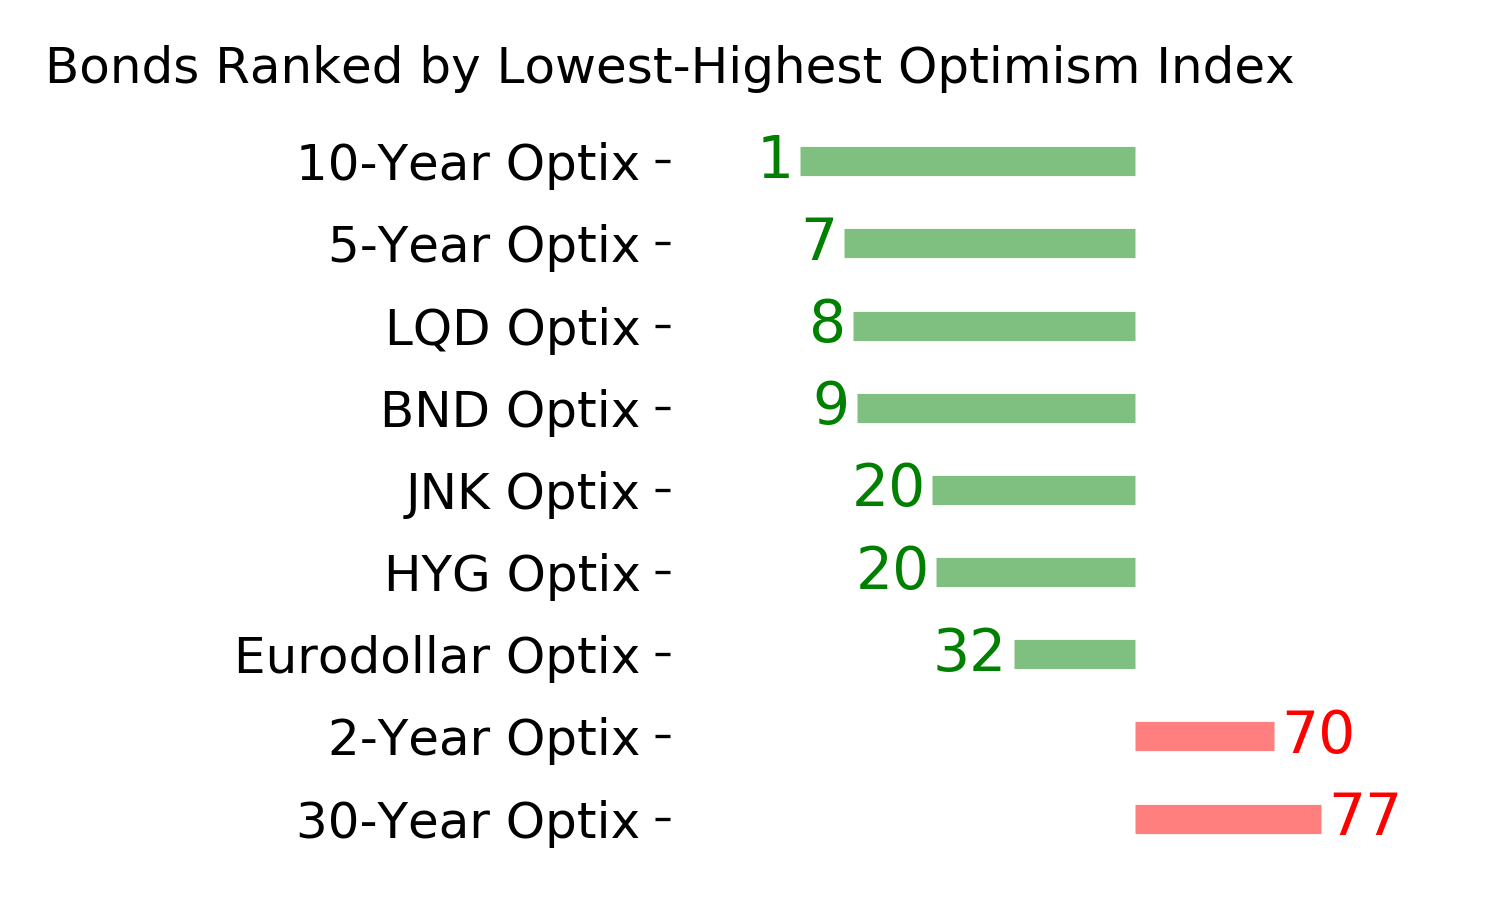
Ranks
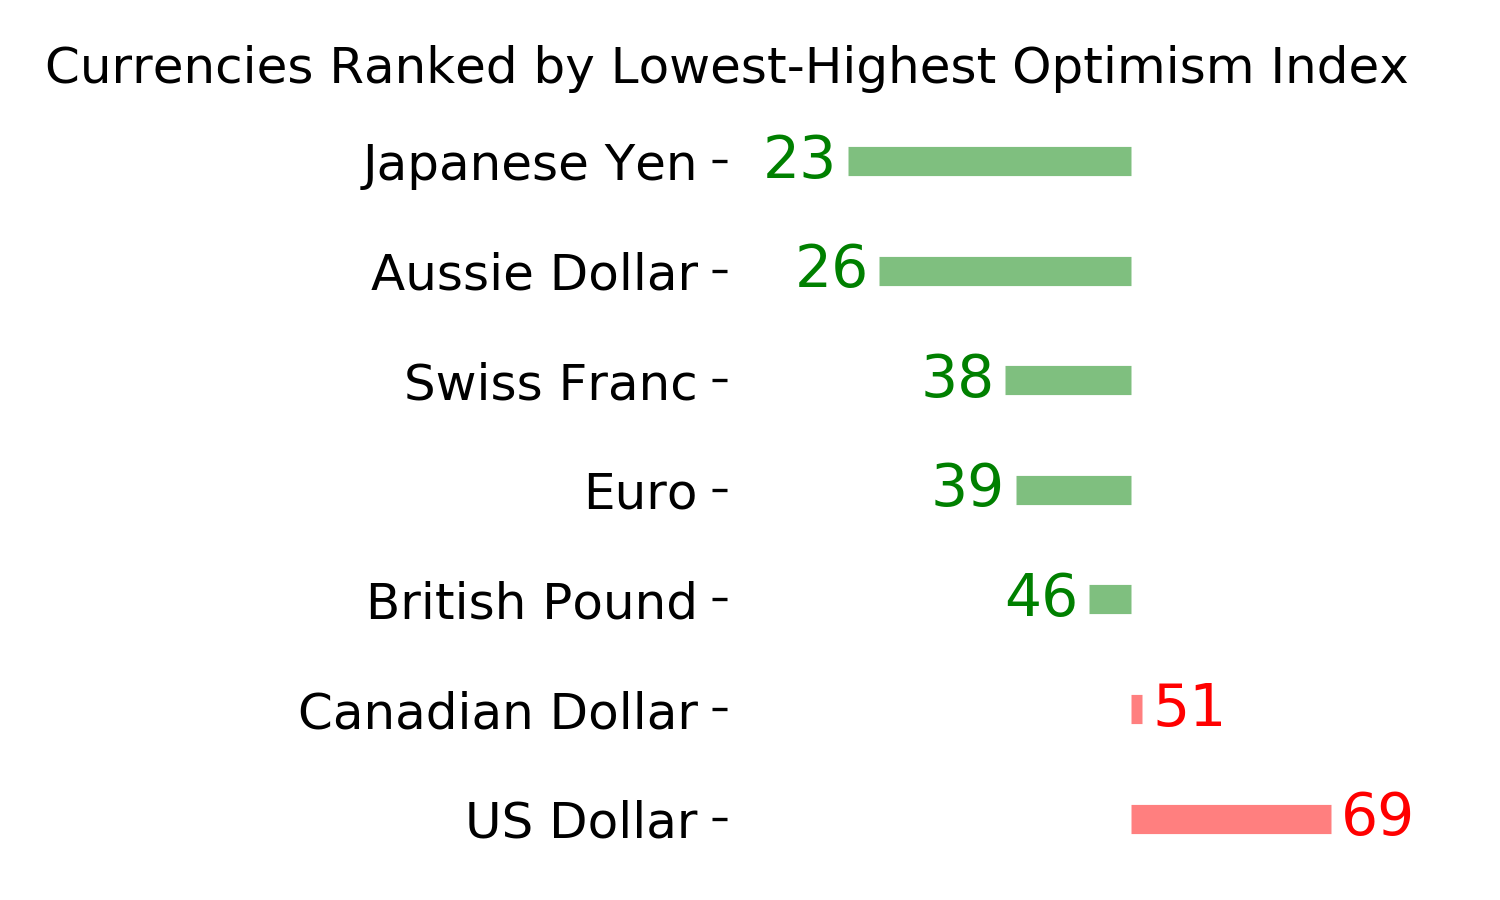
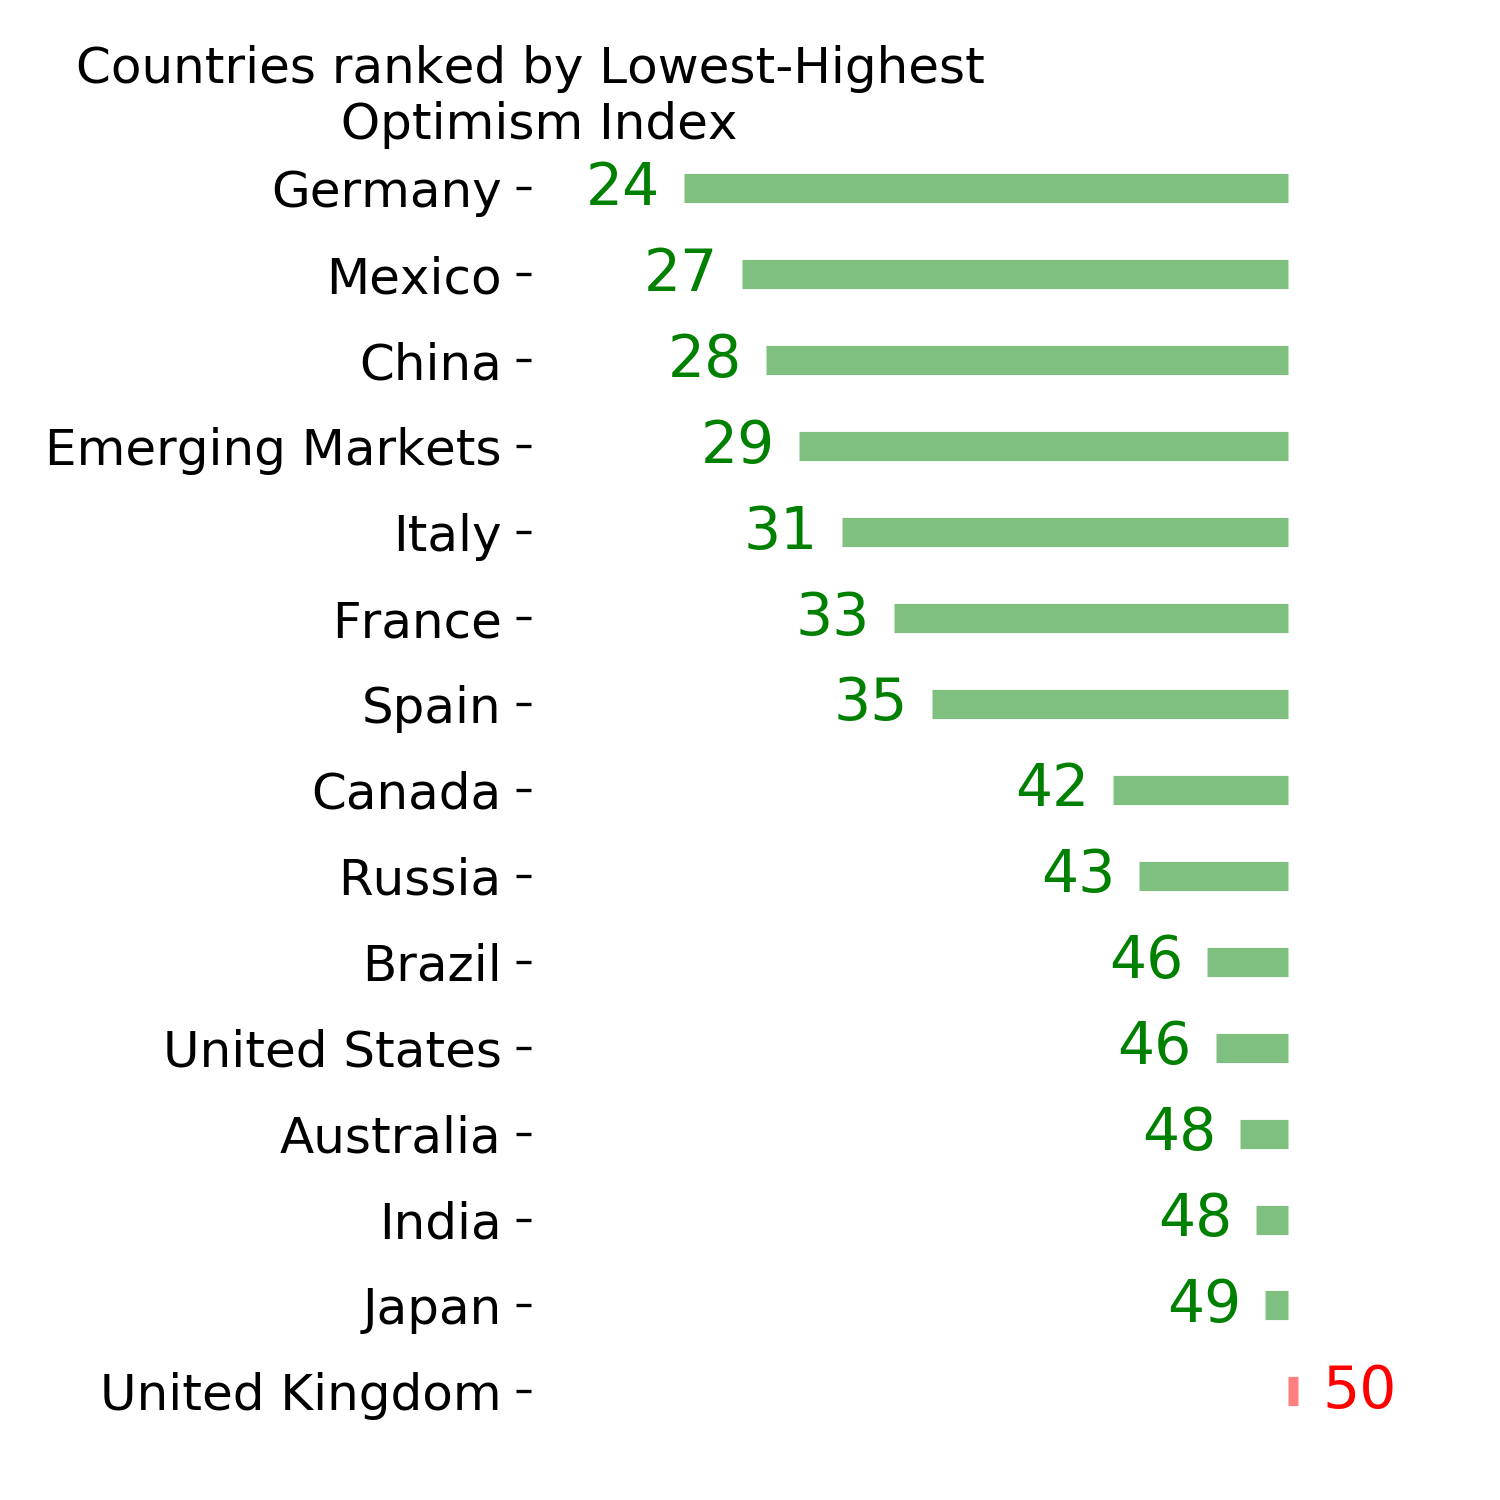
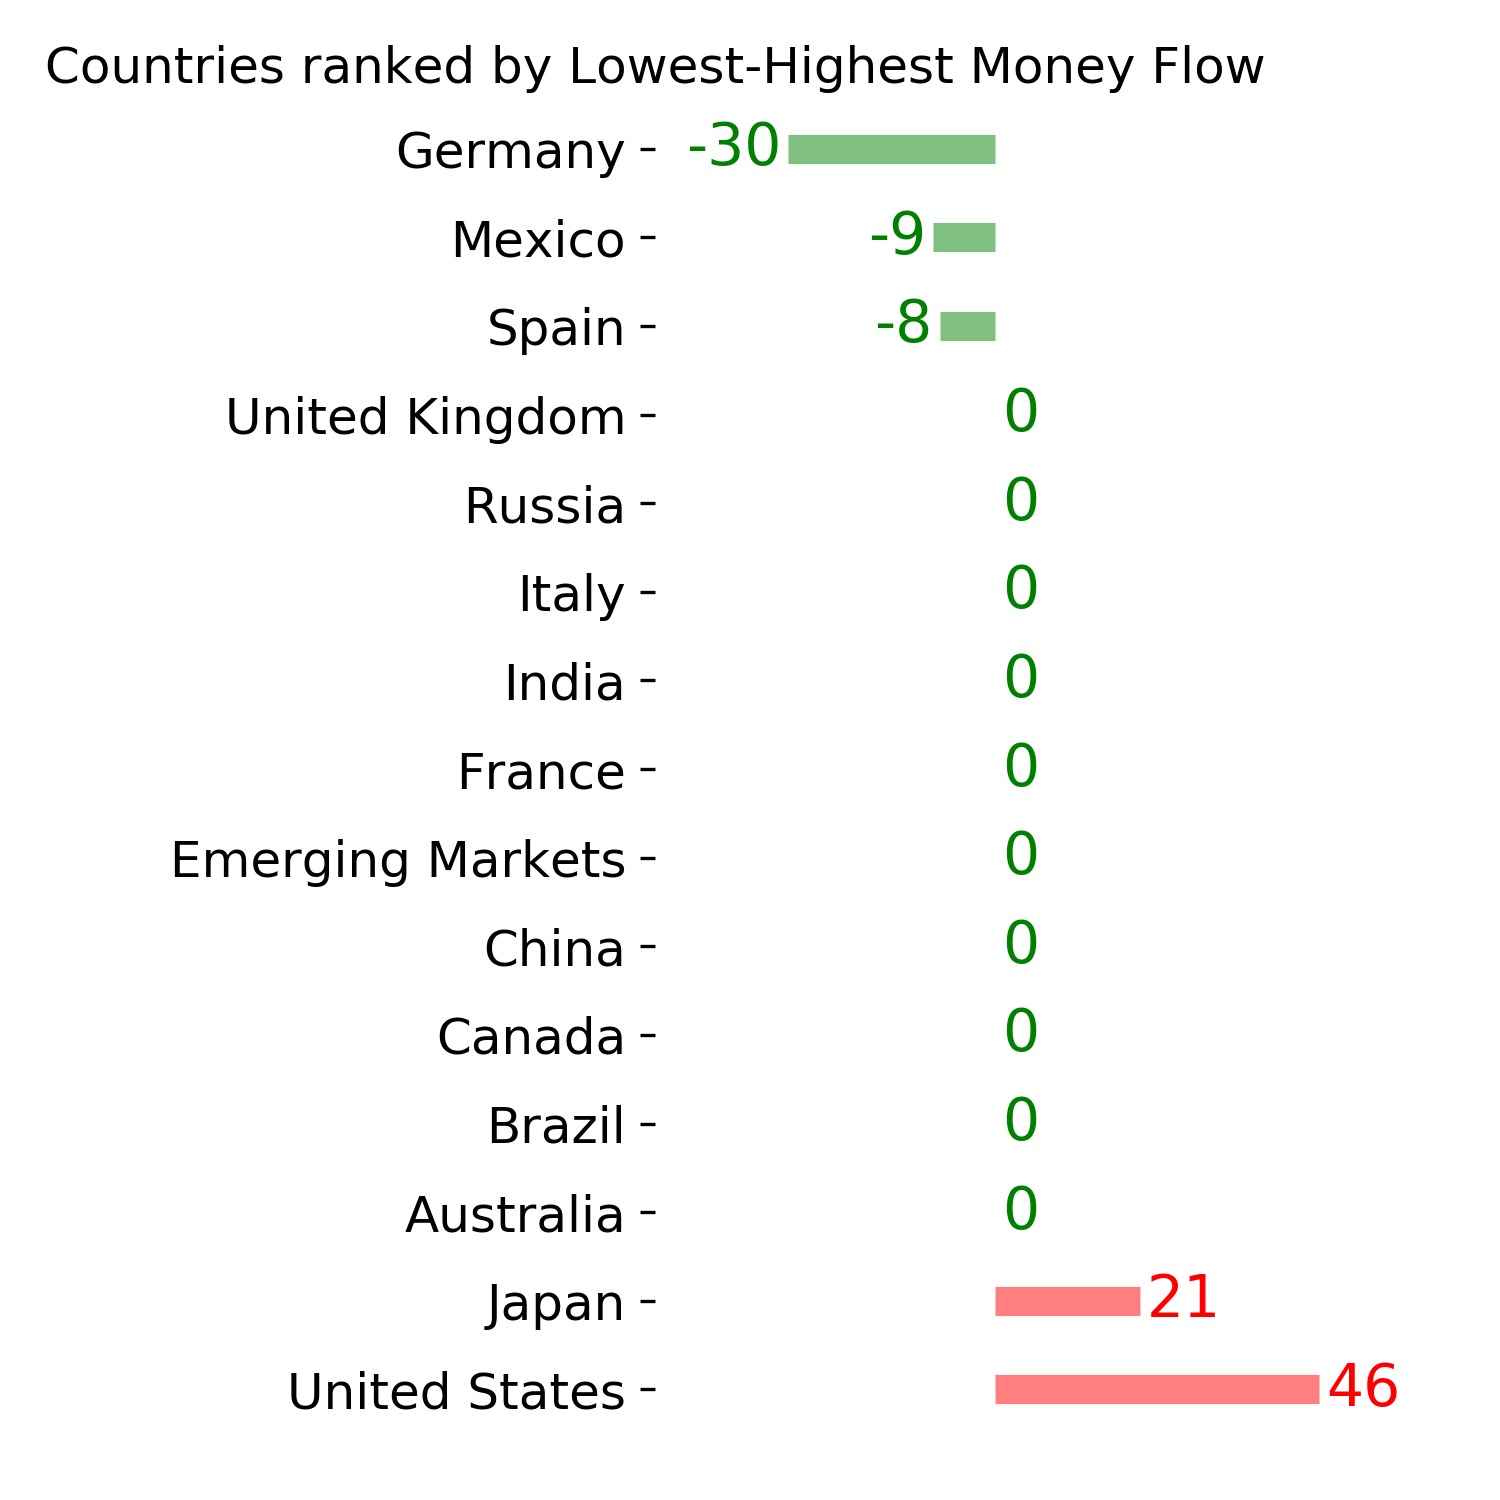
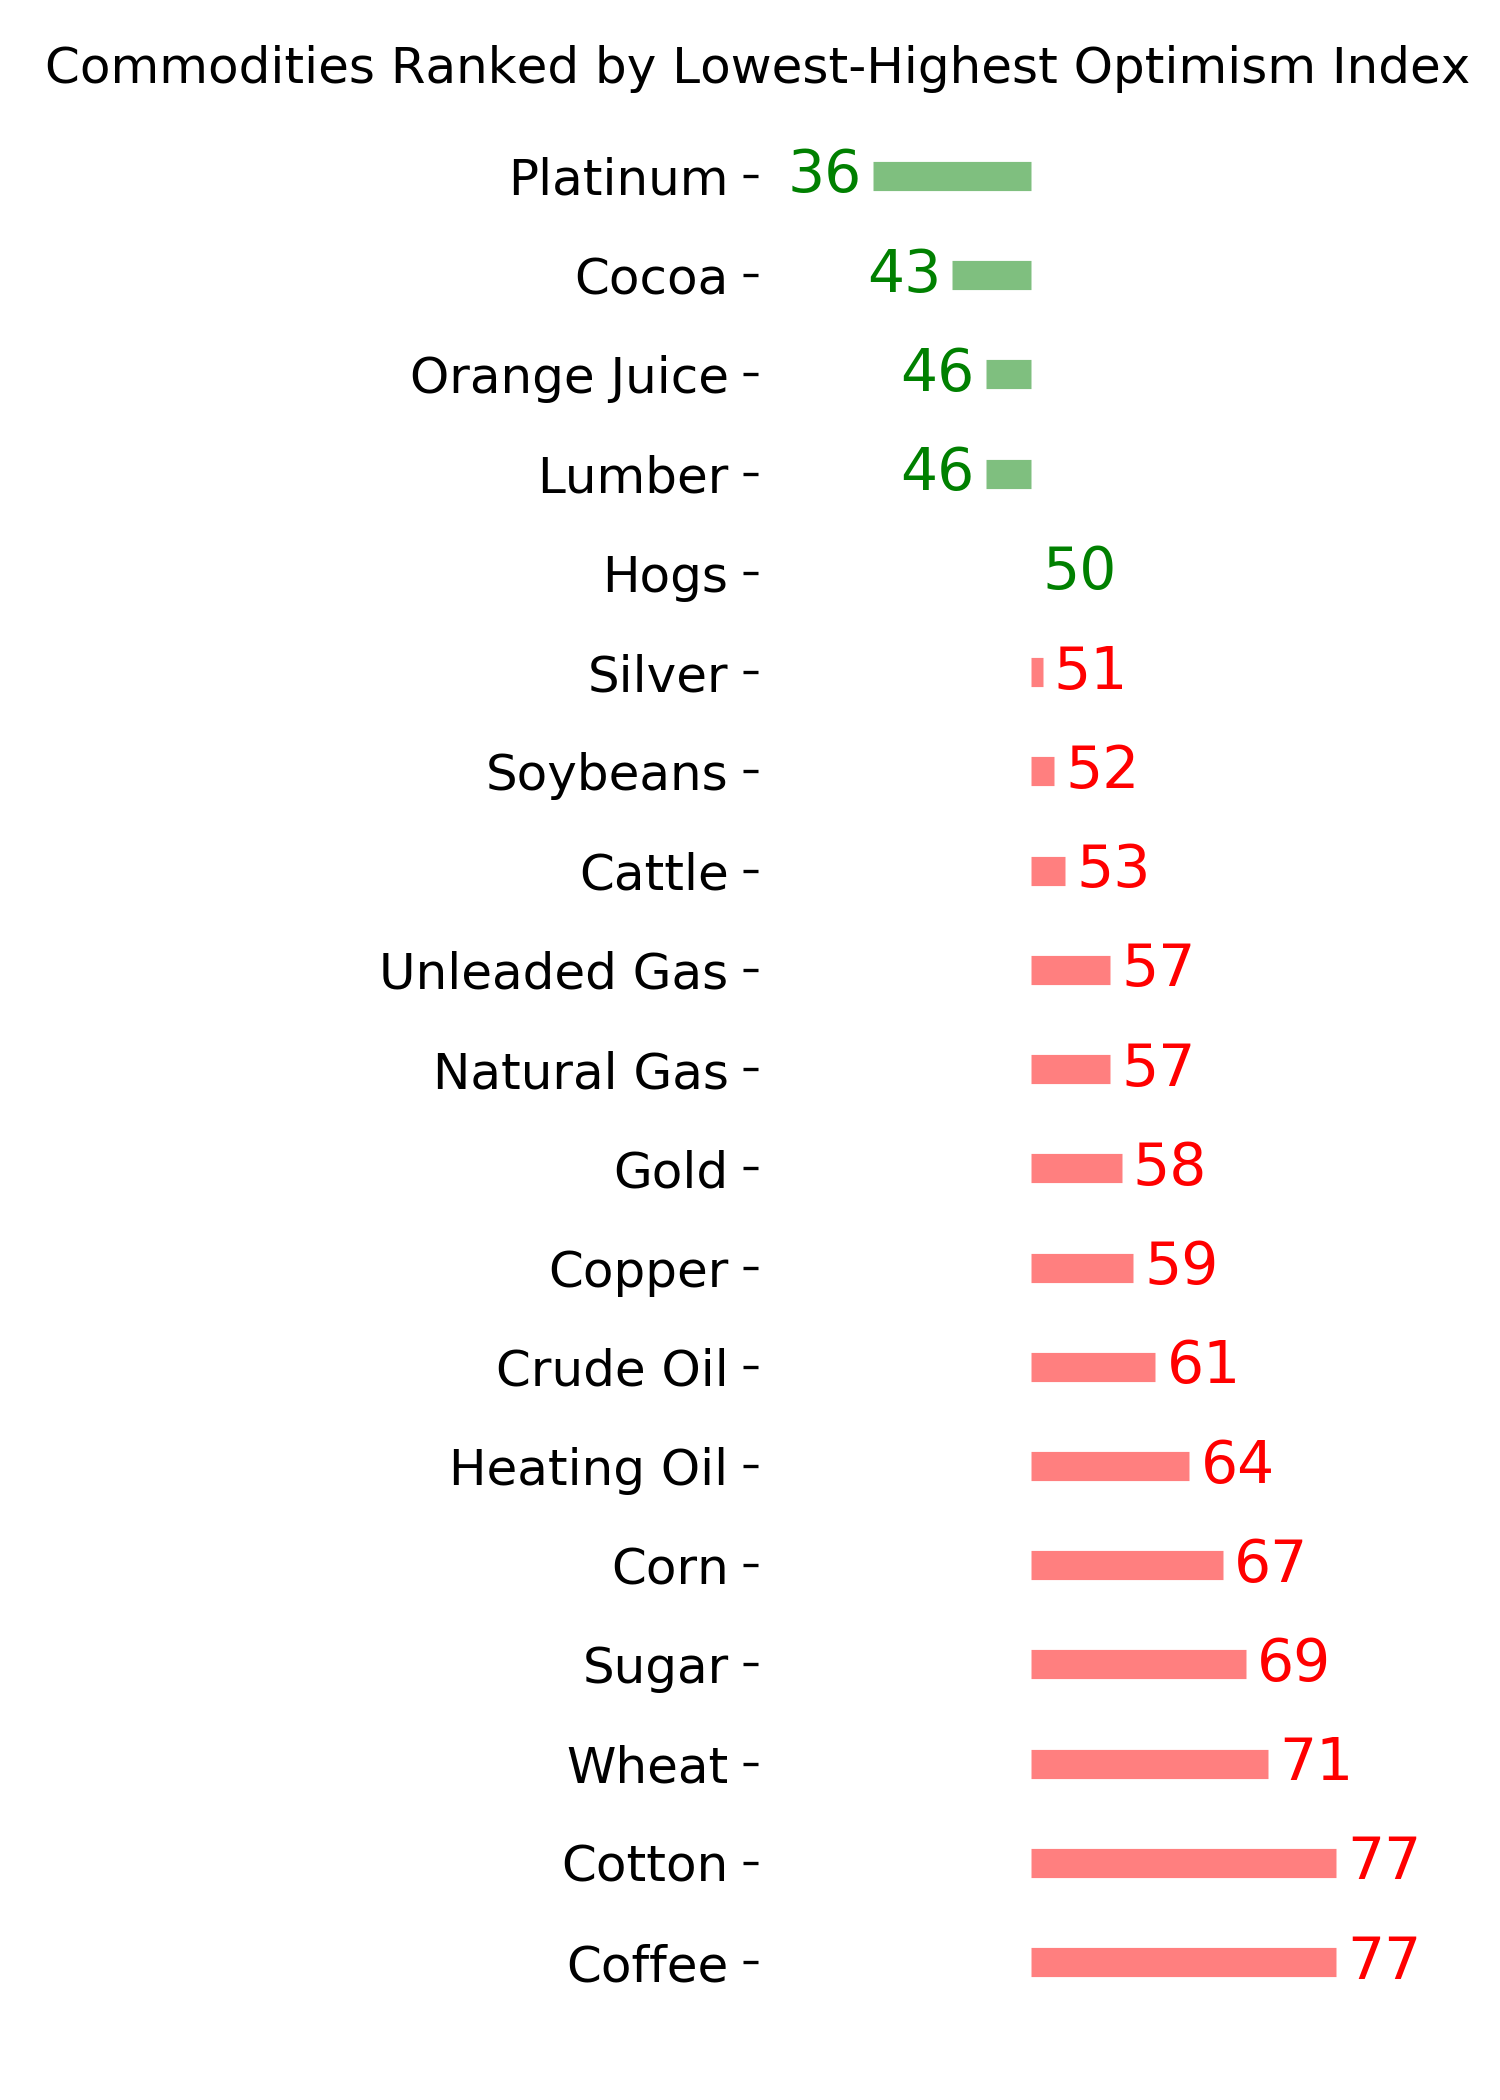
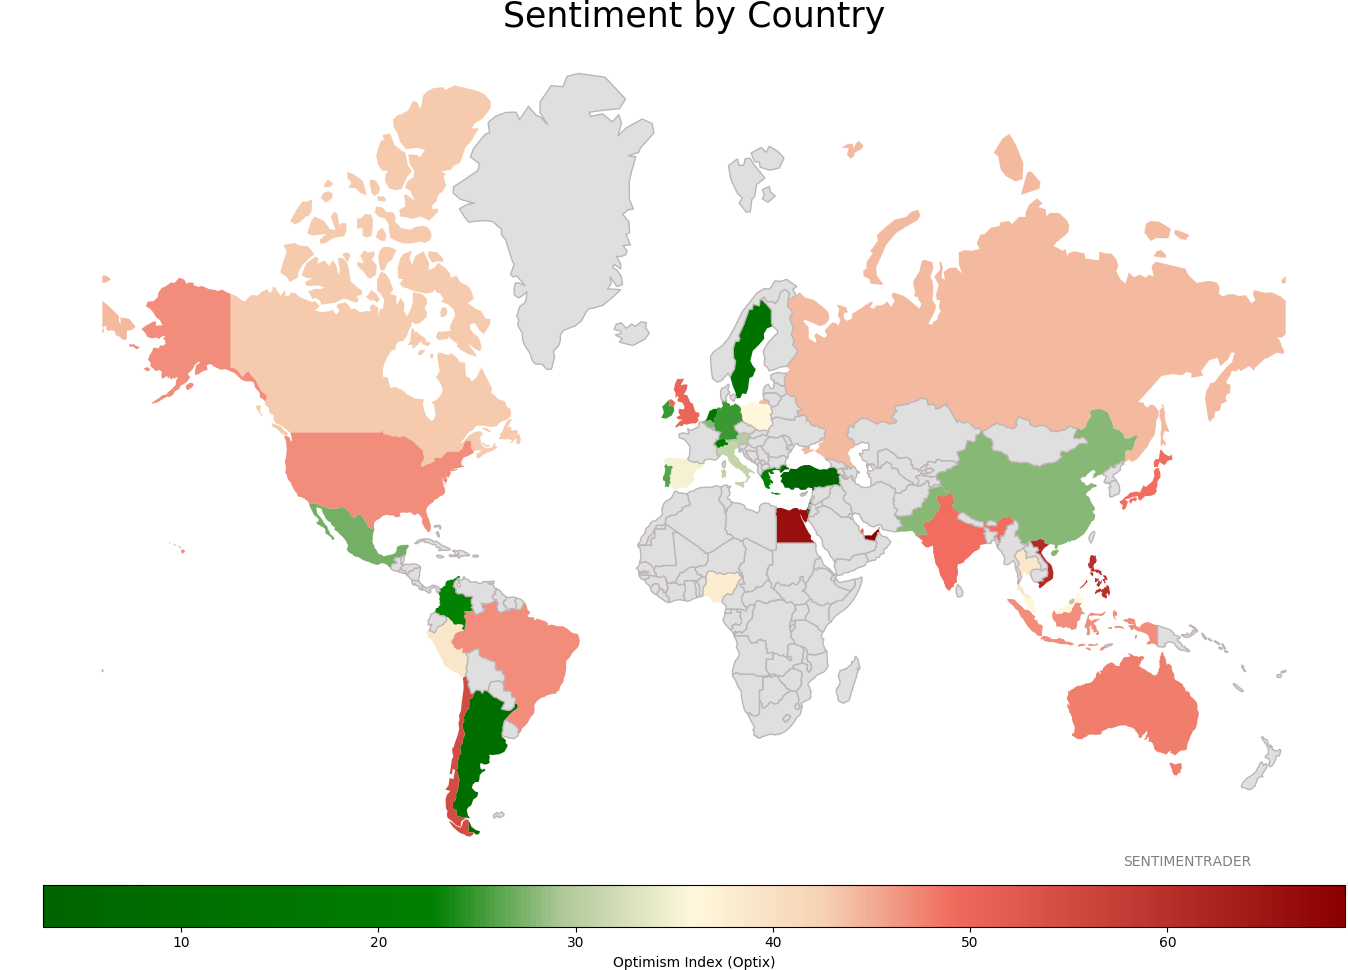
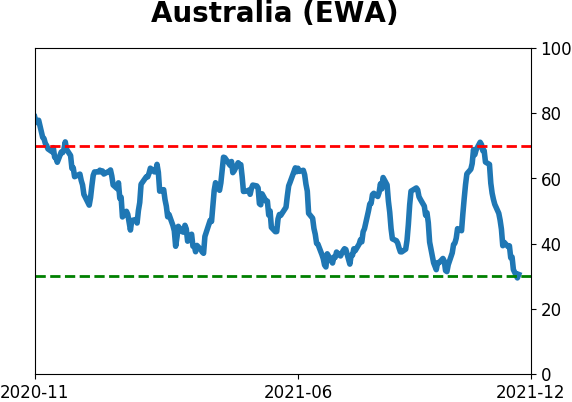
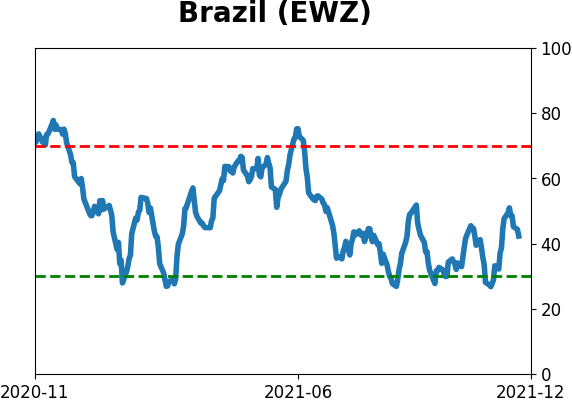
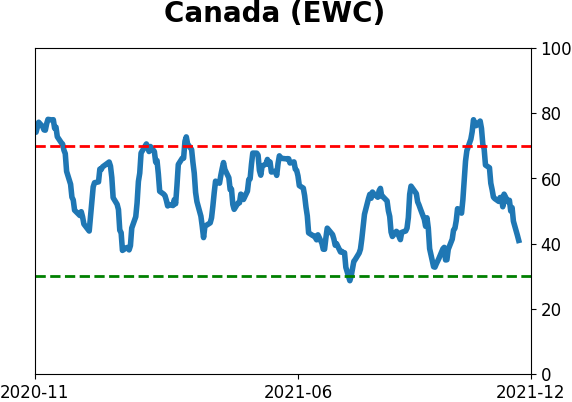
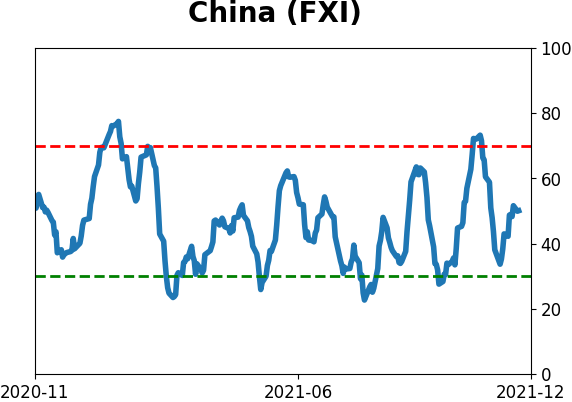
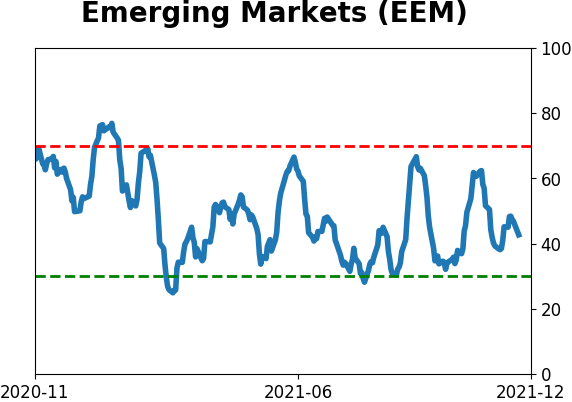
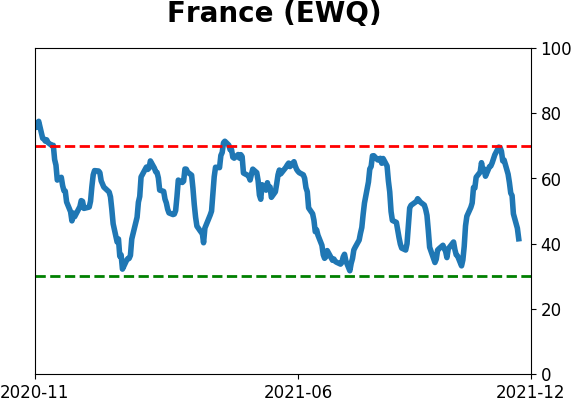
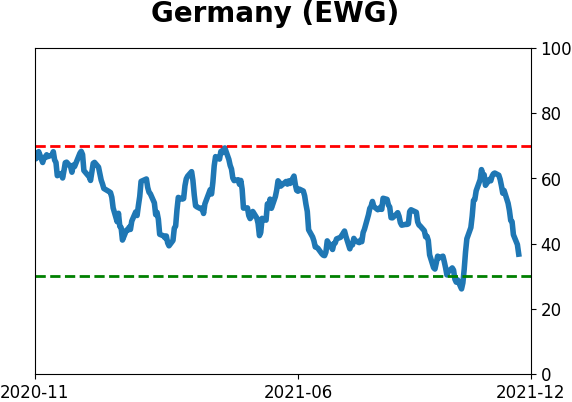
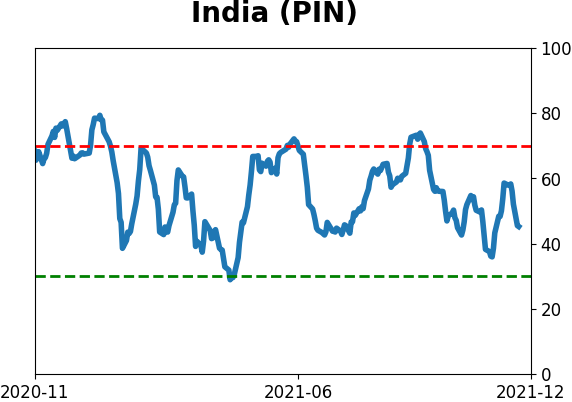
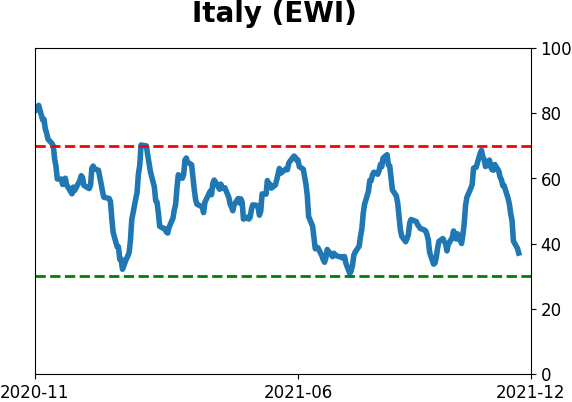
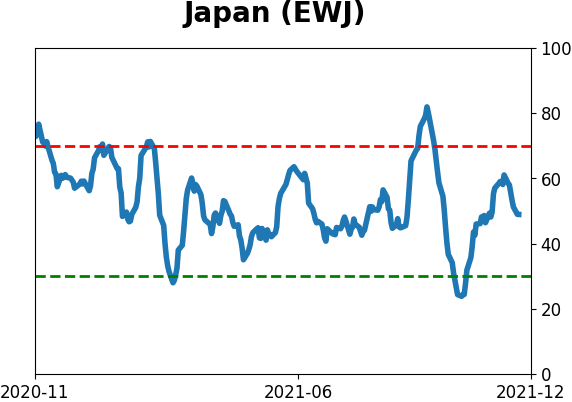
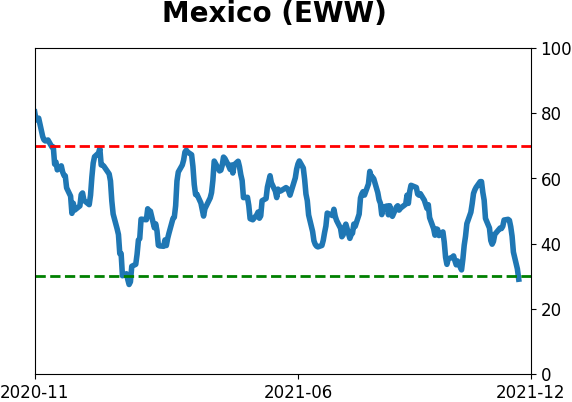
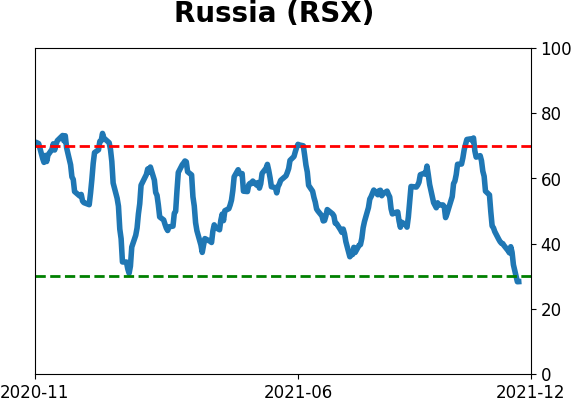
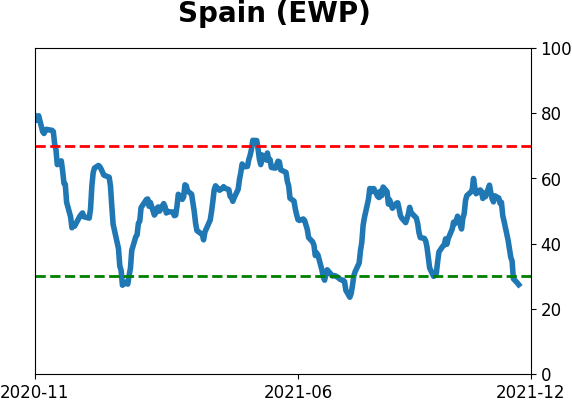
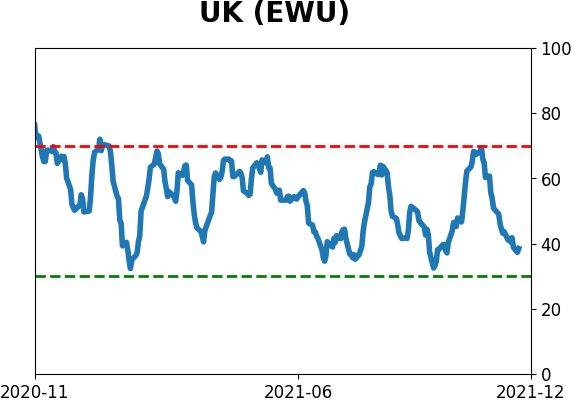
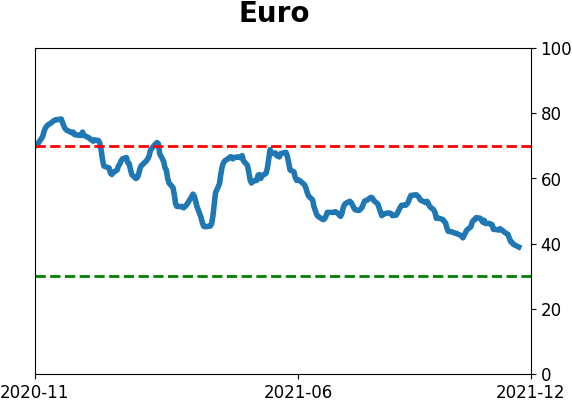
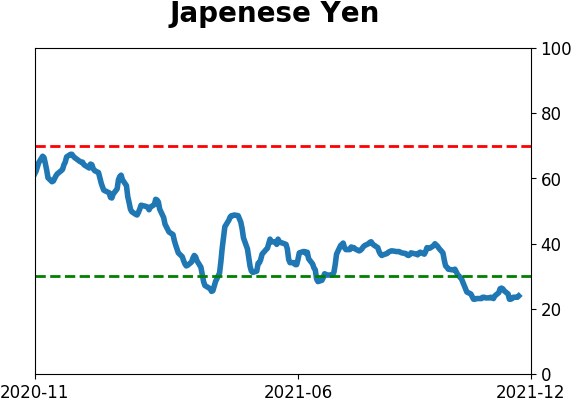
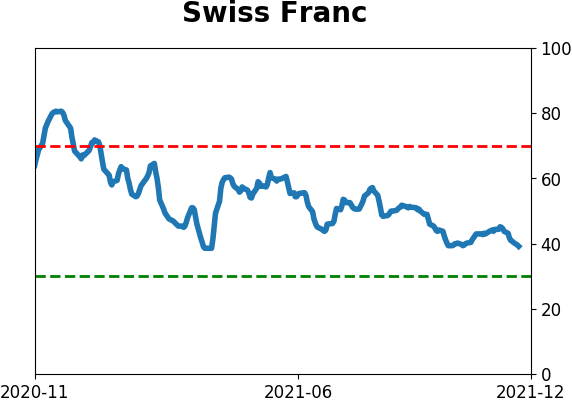
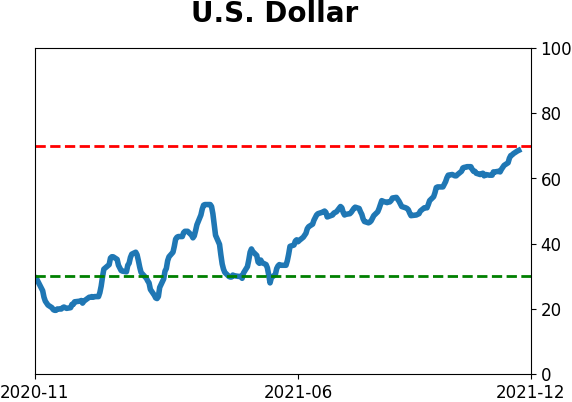
Sentiment Around The World
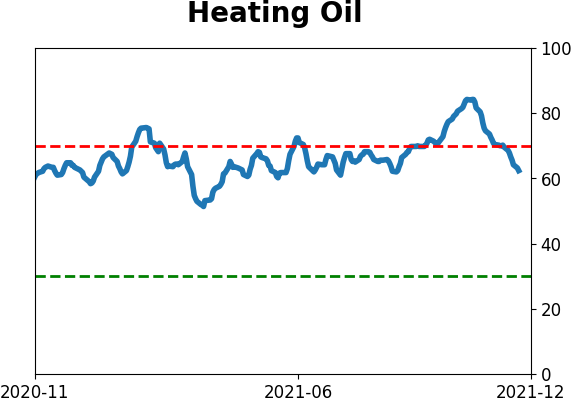
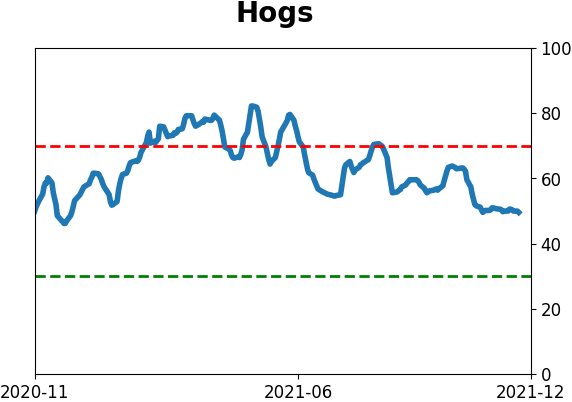
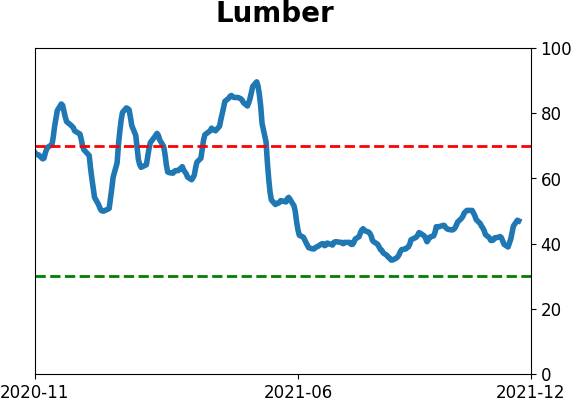
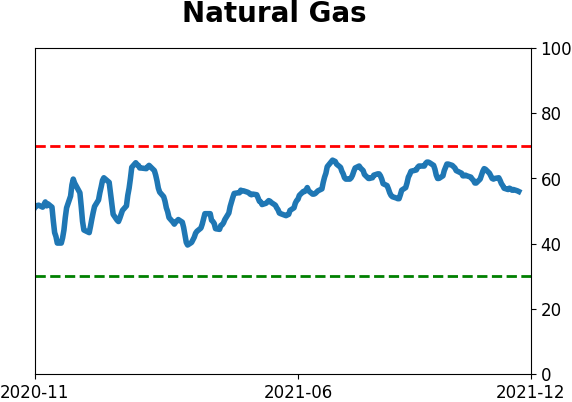
Optimism Index Thumbnails
|
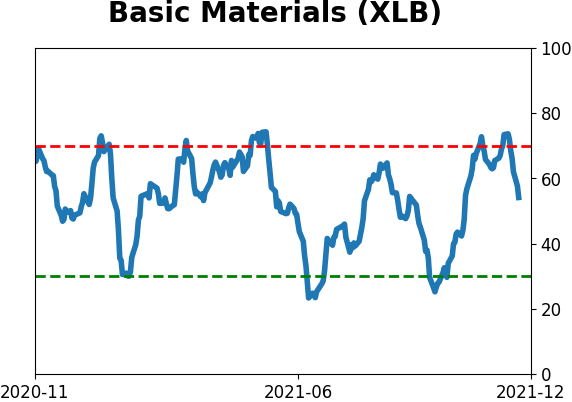
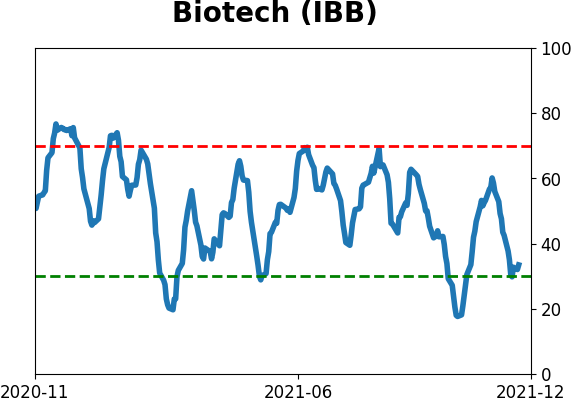
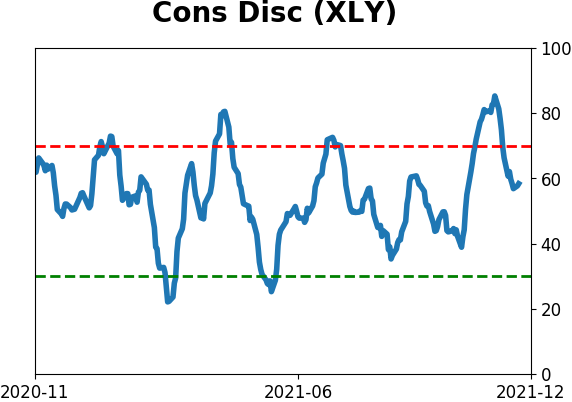
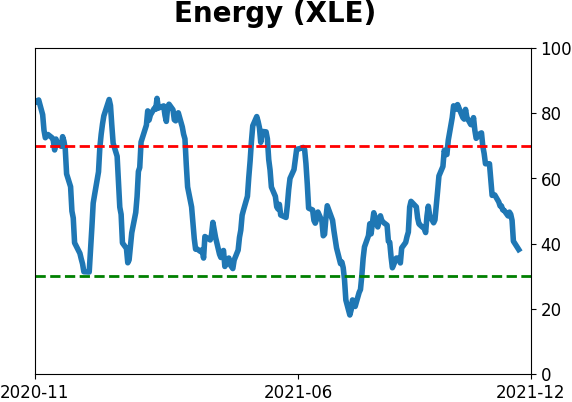
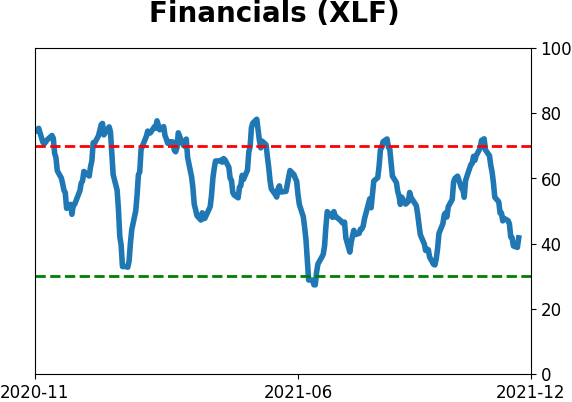
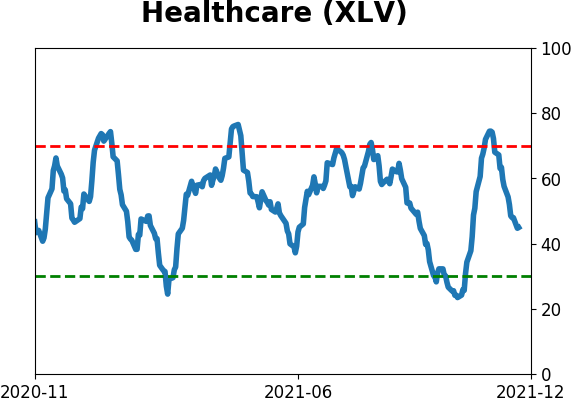
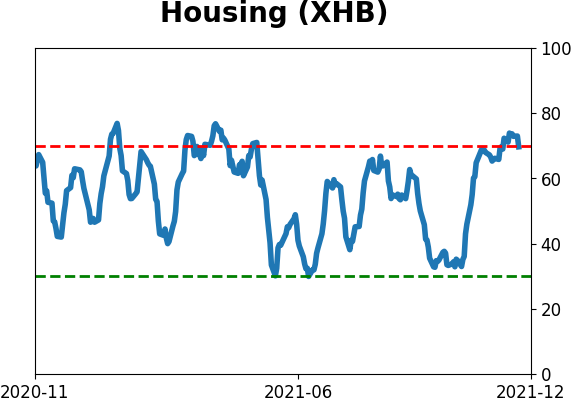
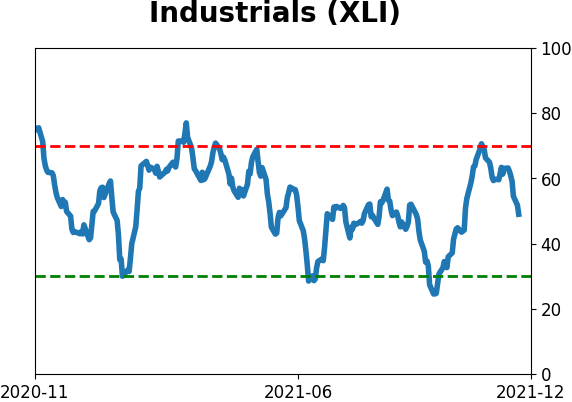
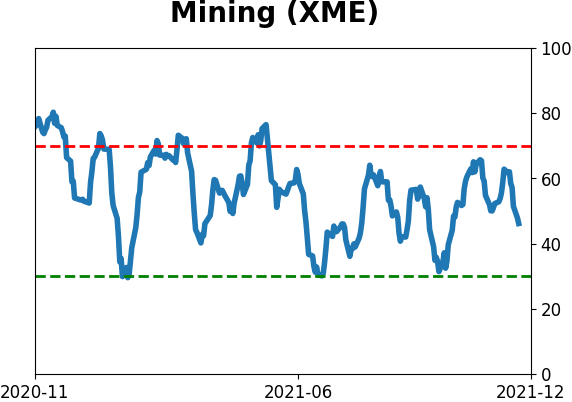
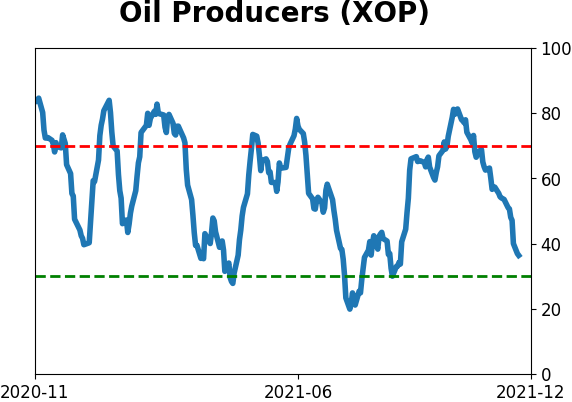
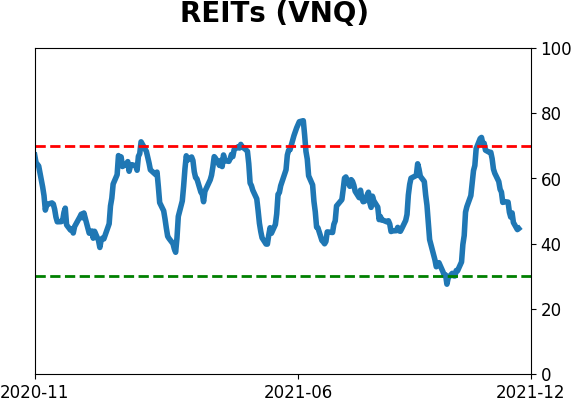
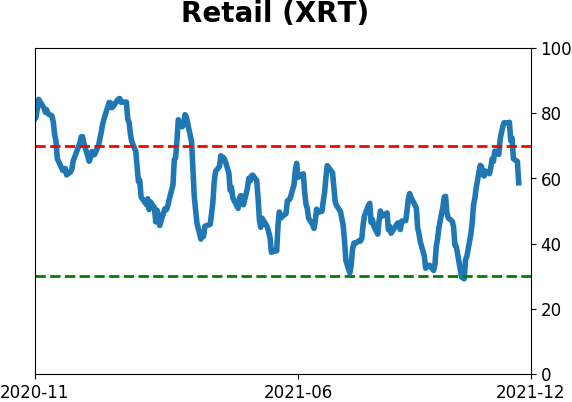
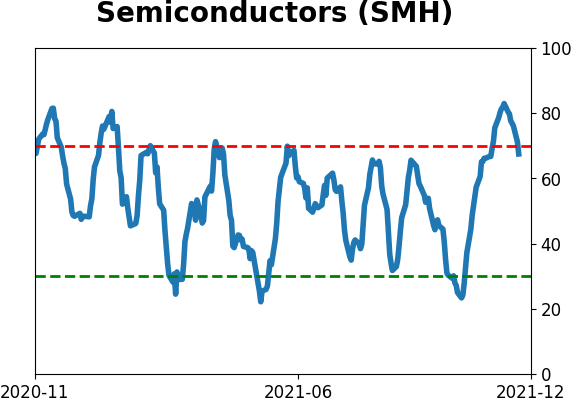
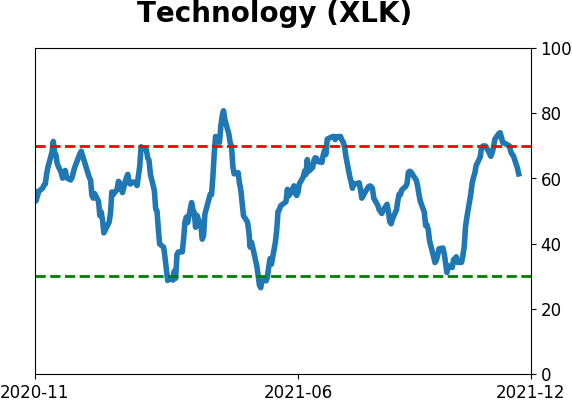
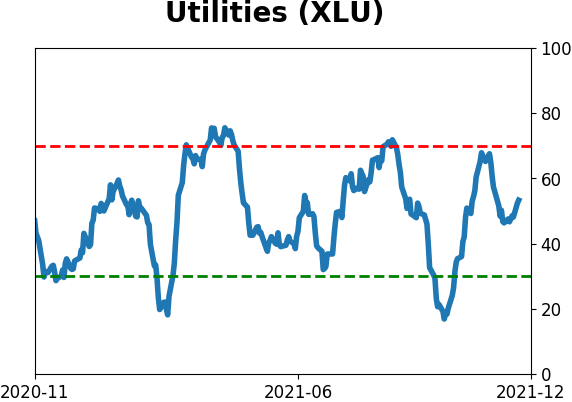
Sector ETF's - 10-Day Moving Average
|
|
|
Country ETF's - 10-Day Moving Average
|
|
|
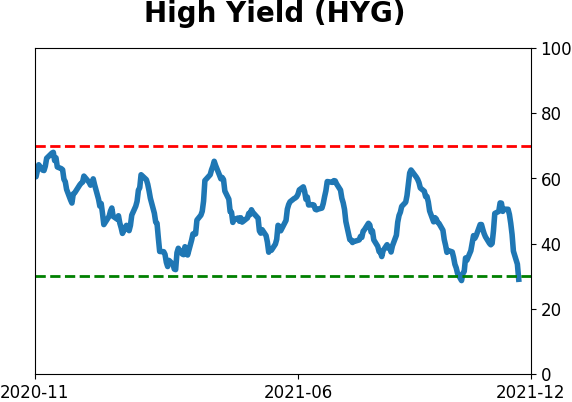
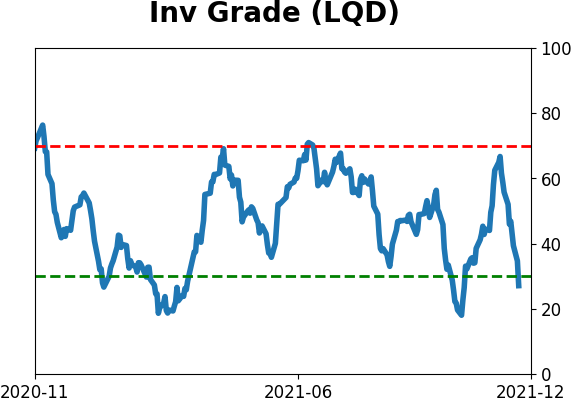
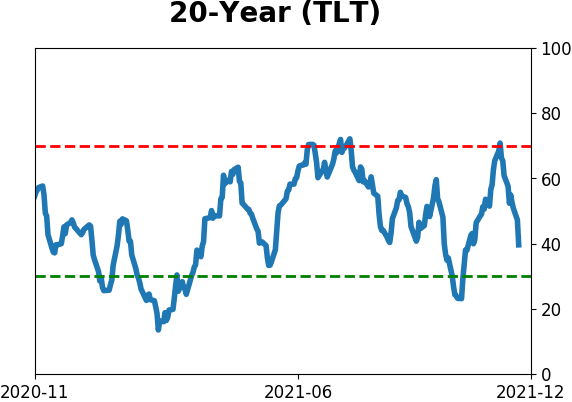
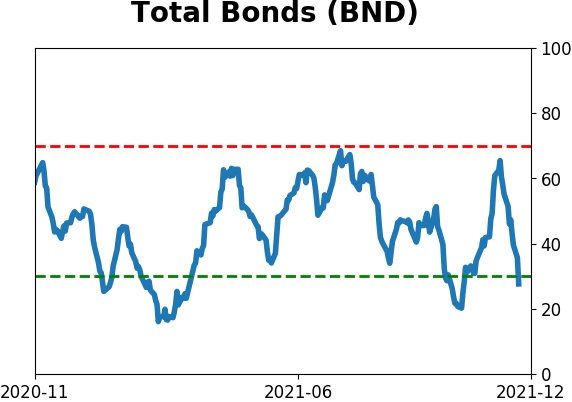
Bond ETF's - 10-Day Moving Average
|
|
|
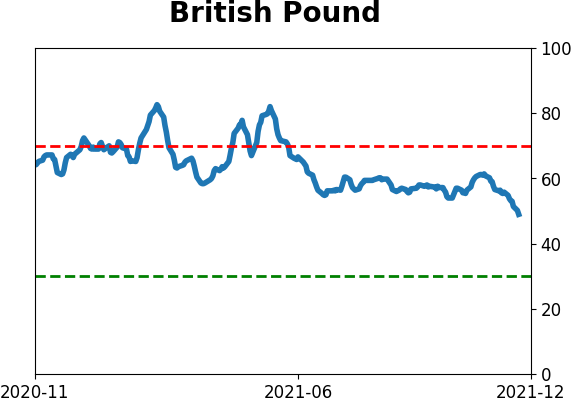
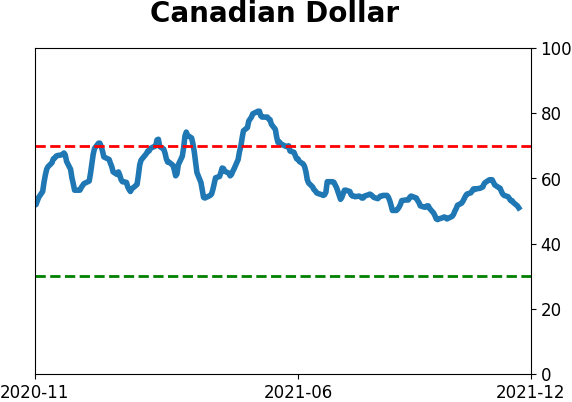
Currency ETF's - 5-Day Moving Average
|
|
|
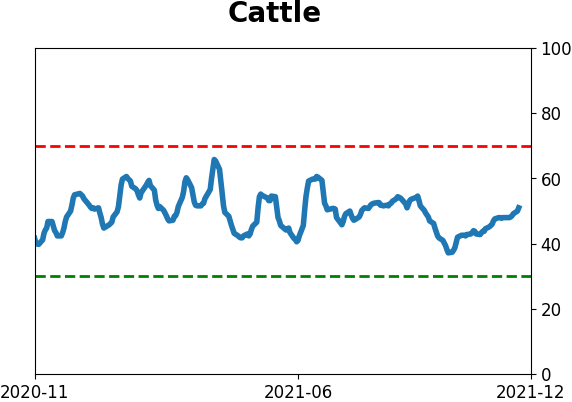
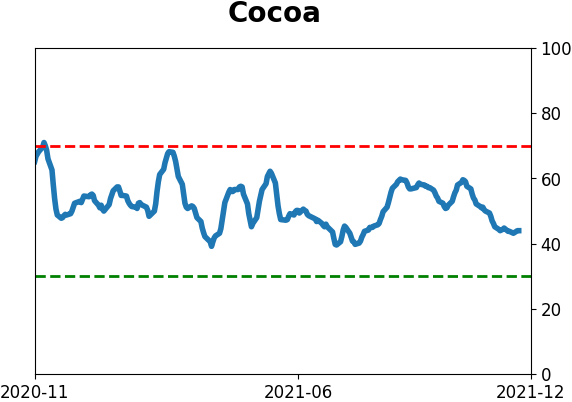
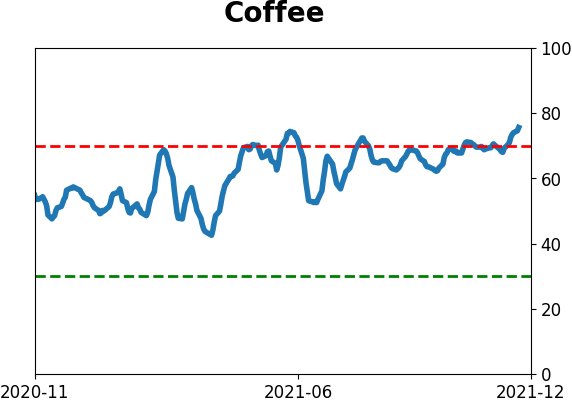
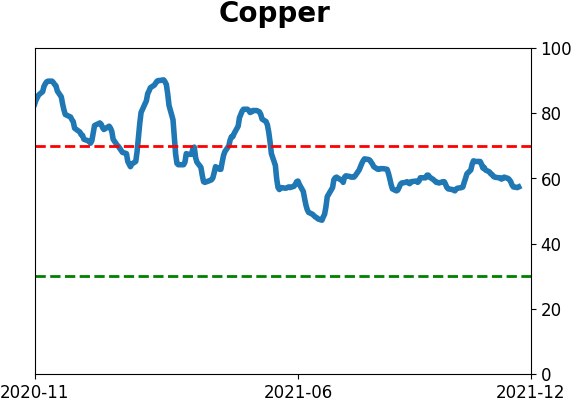
Commodity ETF's - 5-Day Moving Average
|
|