Headlines
|
|
The Gold Miner Calendar - Part II:
Gold mining stocks have demonstrated a fairly consistent - albeit highly volatile - cyclical pattern over the past 60+ years. In Part II, we add two refinements to hopefully improve long-term results.
|
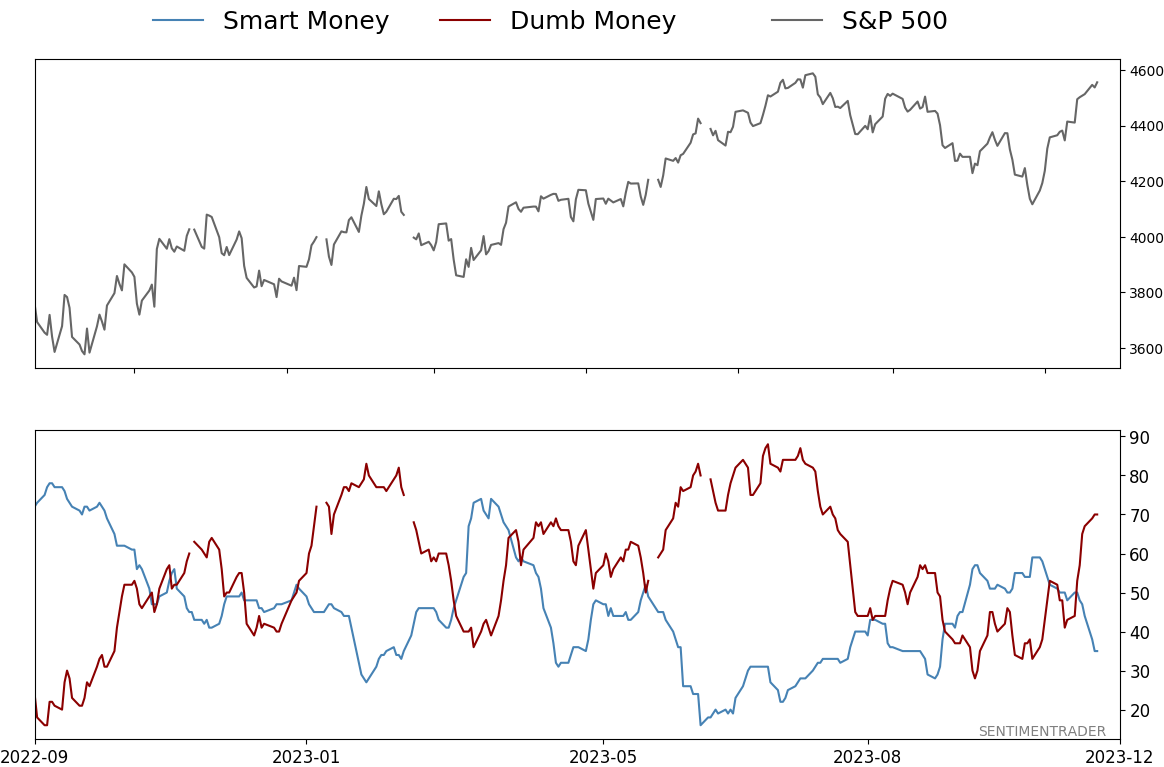
Smart / Dumb Money Confidence
|
Smart Money Confidence: 35%
Dumb Money Confidence: 70%
|
|
Risk Levels
Stocks Short-Term
|
Stocks Medium-Term
|
|
Bonds
|
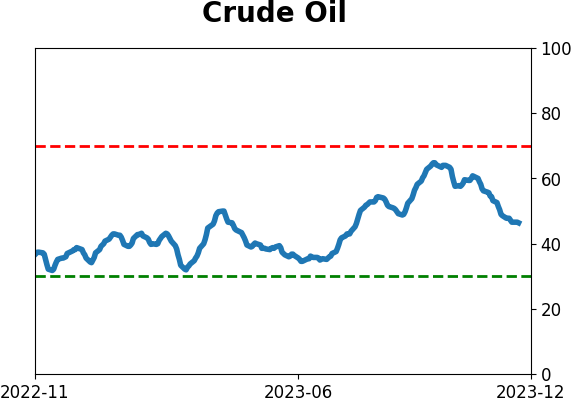
Crude Oil

|
|
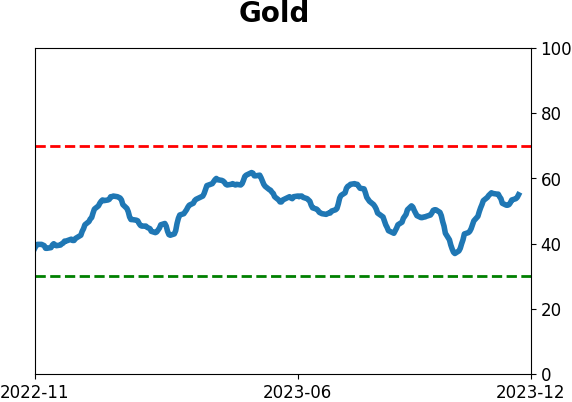
Gold

|
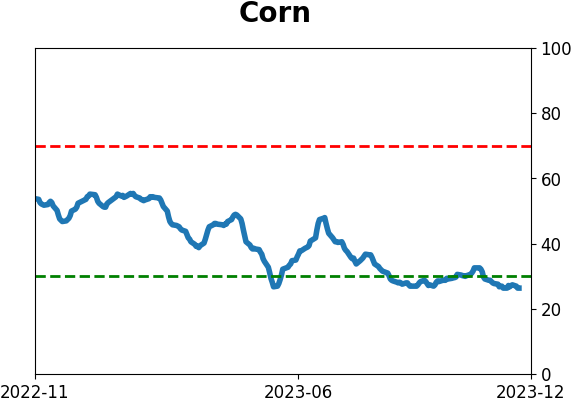
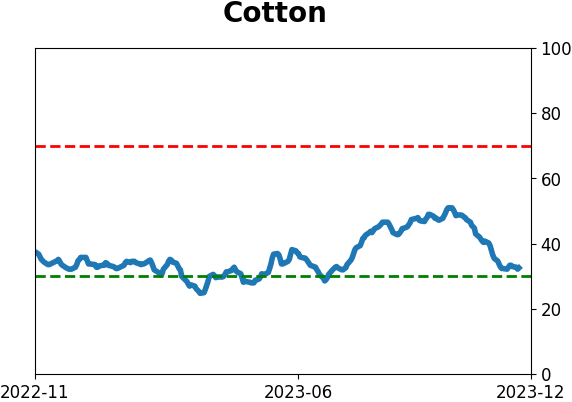
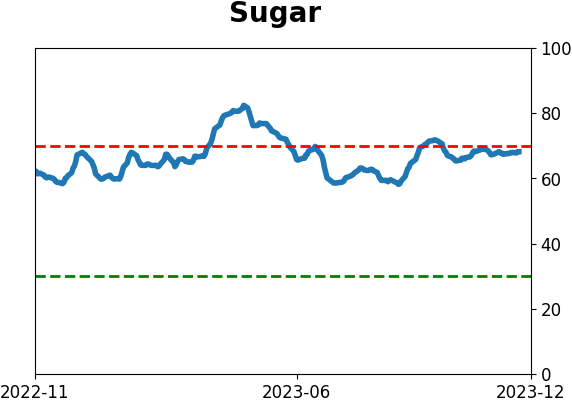
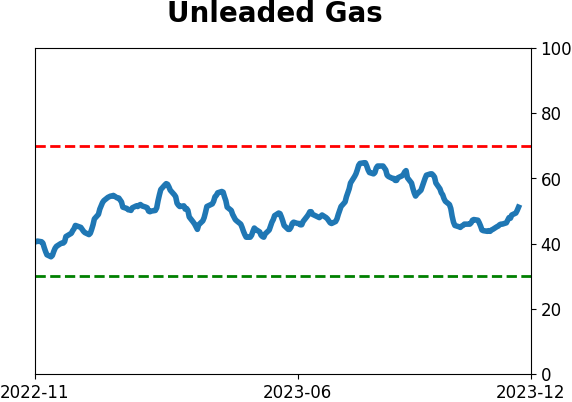
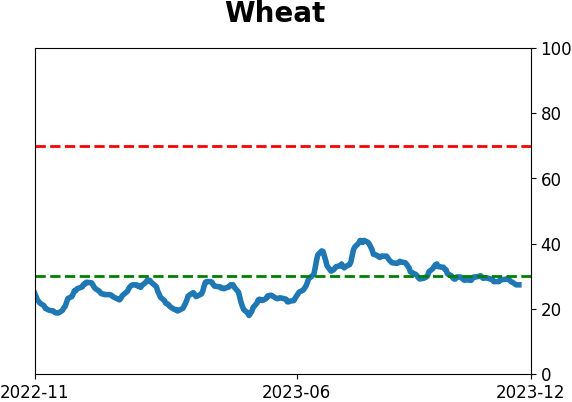
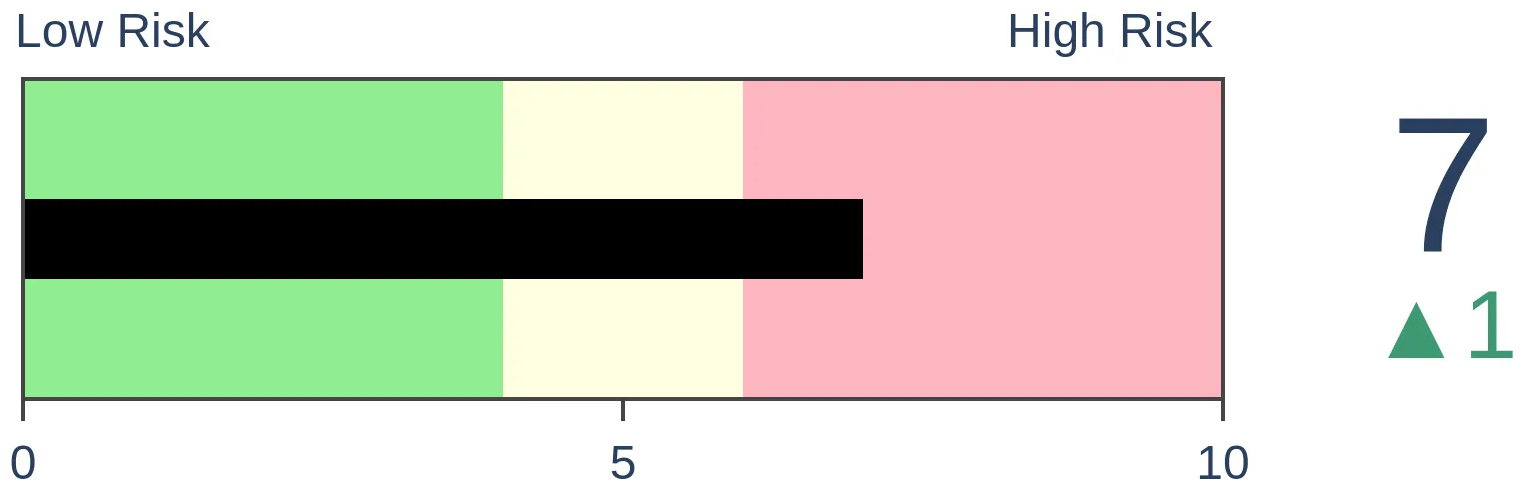
Agriculture
|
|
Research
By Jay Kaeppel
BOTTOM LINE
Gold mining stocks have demonstrated a fairly consistent - albeit highly volatile - cyclical pattern over the past 60+ years. In Part II, we add two refinements to hopefully improve long-term results.
FORECAST / TIMEFRAME
None
|
Key points
- Gold mining stocks have shown a tendency to move in an 8-year wave: four (mostly) favorable years followed by four (mostly) unfavorable years
- In Part I, we highlighted four-year favorable year performance versus the four-year unfavorable year performance
- In Part II, we will add two refinements to create an actual gold miner investment calendar
- The calendar could theoretically be used as a standalone model. However, an investor must allocate capital conservatively, as extreme price volatility is simply a reality of trading gold mining stocks.
An overview of Gold Miner performance based on the calendar
We will use the Gold Bugs Index (ticker HUI), comprised of gold mining stocks. We test data from 1960-12-31 through 2023-11-17. A brief overview of findings:
- The calendar we will present in Part III could be used as a standalone trading system; however, due to the highly volatile nature of gold mining stocks, it is not necessarily recommended
- It can be argued that the gold miner calendar is more about when NOT to hold gold mining stocks than it is about WHEN TO hold them
- History suggests the existence of an underlying eight-year cycle in gold mining stock performance - four years are (mostly) "favorable," then the next four years are (mostly) "unfavorable"
- To make things interesting, there is one month in particular that has shown dreadful long-term results regardless of whether the year in question is rated as "favorable" or "unfavorable"
- There are four months during "unfavorable" years when gold miner performance is pretty good and eight months during "unfavorable" years when gold miner performance has been dreadful.
For a review of favorable and unfavorable four-year performance, please see Part I. Next, let's look more closely at favorable year performance.
One month to avoid during favorable (and unfavorable) years
For reasons I cannot explain, October has been by far the worst month for gold miners over the last 60+ years. The chart below displays the growth of $1 invested in HUI only during October. The table summarizes HUI's October performance for all years.
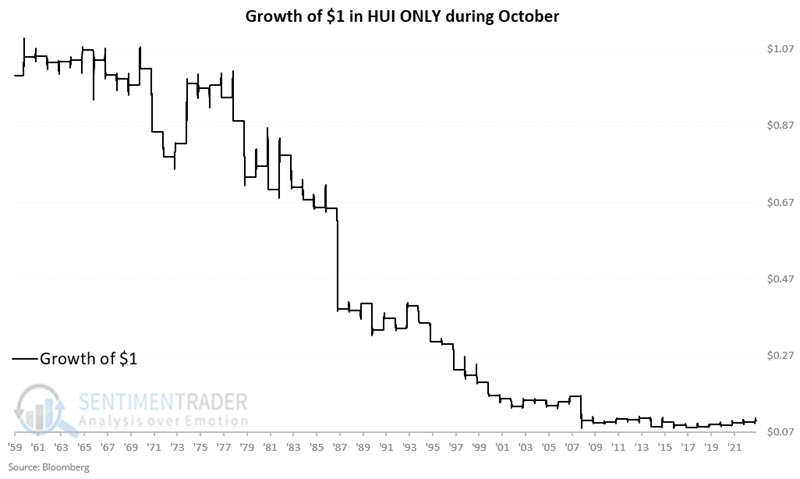
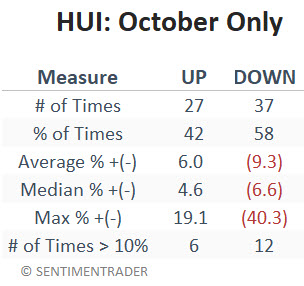
Note that a "down October" is not a sure thing, given a Win Rate of 42%. Nevertheless, the phrase "when it's good, it's OK, and when it's bad, it's awful" seems entirely appropriate.
So, our first added rule is this:
- Regardless of whether the eight-year gold miner cycle is in a favorable or unfavorable four-year phase, we will NOT hold gold miners during October.
A closer look at unfavorable years
In Part I, we found that during unfavorable years, HUI lost over -73% all told. However, the table below breaks down performance by month only during unfavorable years.
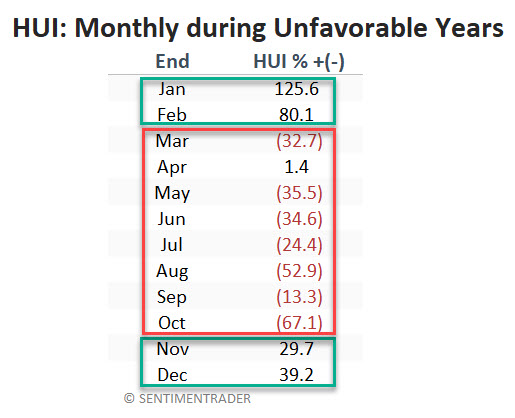
The table above shows positive results for November through February and negative results for March through October (except for a negligible gain during April).
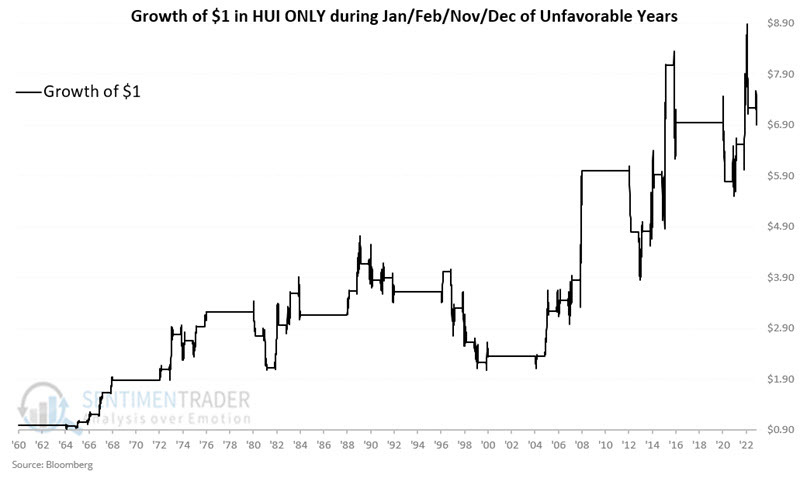
The chart below shows that January, February, November, and December of unfavorable years saw HUI gain +628%. While this is a substantial gain, returns are highly volatile - including some massive drawdowns along the way. The chart below displays the growth of $1 in HUI only during January, February, November, and December of unfavorable years.
When NOT to hold gold miners
As hinted at earlier, the real takeaway from these two articles might be when it is best NOT to hold gold miners. Let's address that now. So far, we have learned:
- in Part I that the second half of the eight-year cycle (with the first starting in 1961 - with 1961 through 1964 favorable and 1965 through 1968 unfavorable) has been overall bearish for gold mining stocks (HUI with a net loss of -73.8% during unfavorable years)
- in Part II that Jan/Feb/Nov/Dec during unfavorable years have been significantly positive (+628% as shown in the chart above)
This means the bulk of gold miner weakness occurs from March through October during unfavorable years. That turns out to be an understatement.
The chart below displays the growth of $1 in HUI only during March through October of unfavorable years.
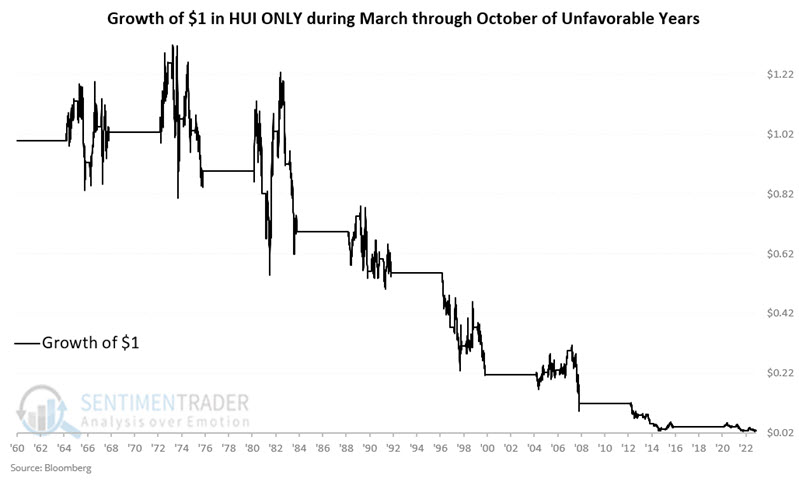
The net result is a staggering cumulative loss of -97.1%. The table below summarizes HUI's performance from March through October of unfavorable years.
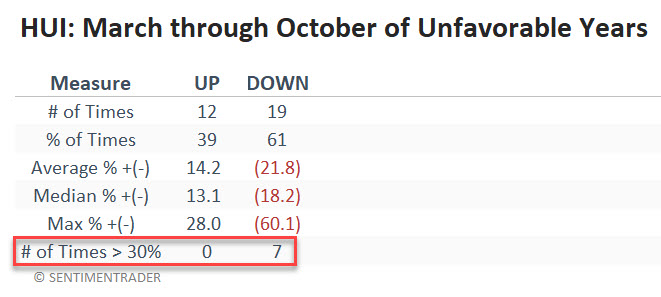
Once again, a reality check is in order. The reality is that gold miners are NOT doomed to plummet every unfavorable year between March and October. Note that the following years saw HUI post 20%+ gains during this purportedly awful period - 1973 (+22.5%), 1982 (+25.4%), 2007 (+28.0%), and 2016 (+26.7%). Nevertheless, the long-term result for the period in question is what it is - a cumulative loss of -97.1%. This seems like a good time to look elsewhere, even if gold miners show signs of life.
What the research tells us…
Part I laid some groundwork by identifying an eight-year cycle in gold miner performance (four favorable years followed by four unfavorable years). Part II added more groundwork by identifying a time to avoid gold miners even during favorable years (i.e., the month of October) and a time to consider holding gold miners even during unfavorable years (i.e., November through February of unfavorable years). In Part III, we will lay out the actual Gold Miner Calendar and analyze hypothetical historical results.
Indicators at Extremes
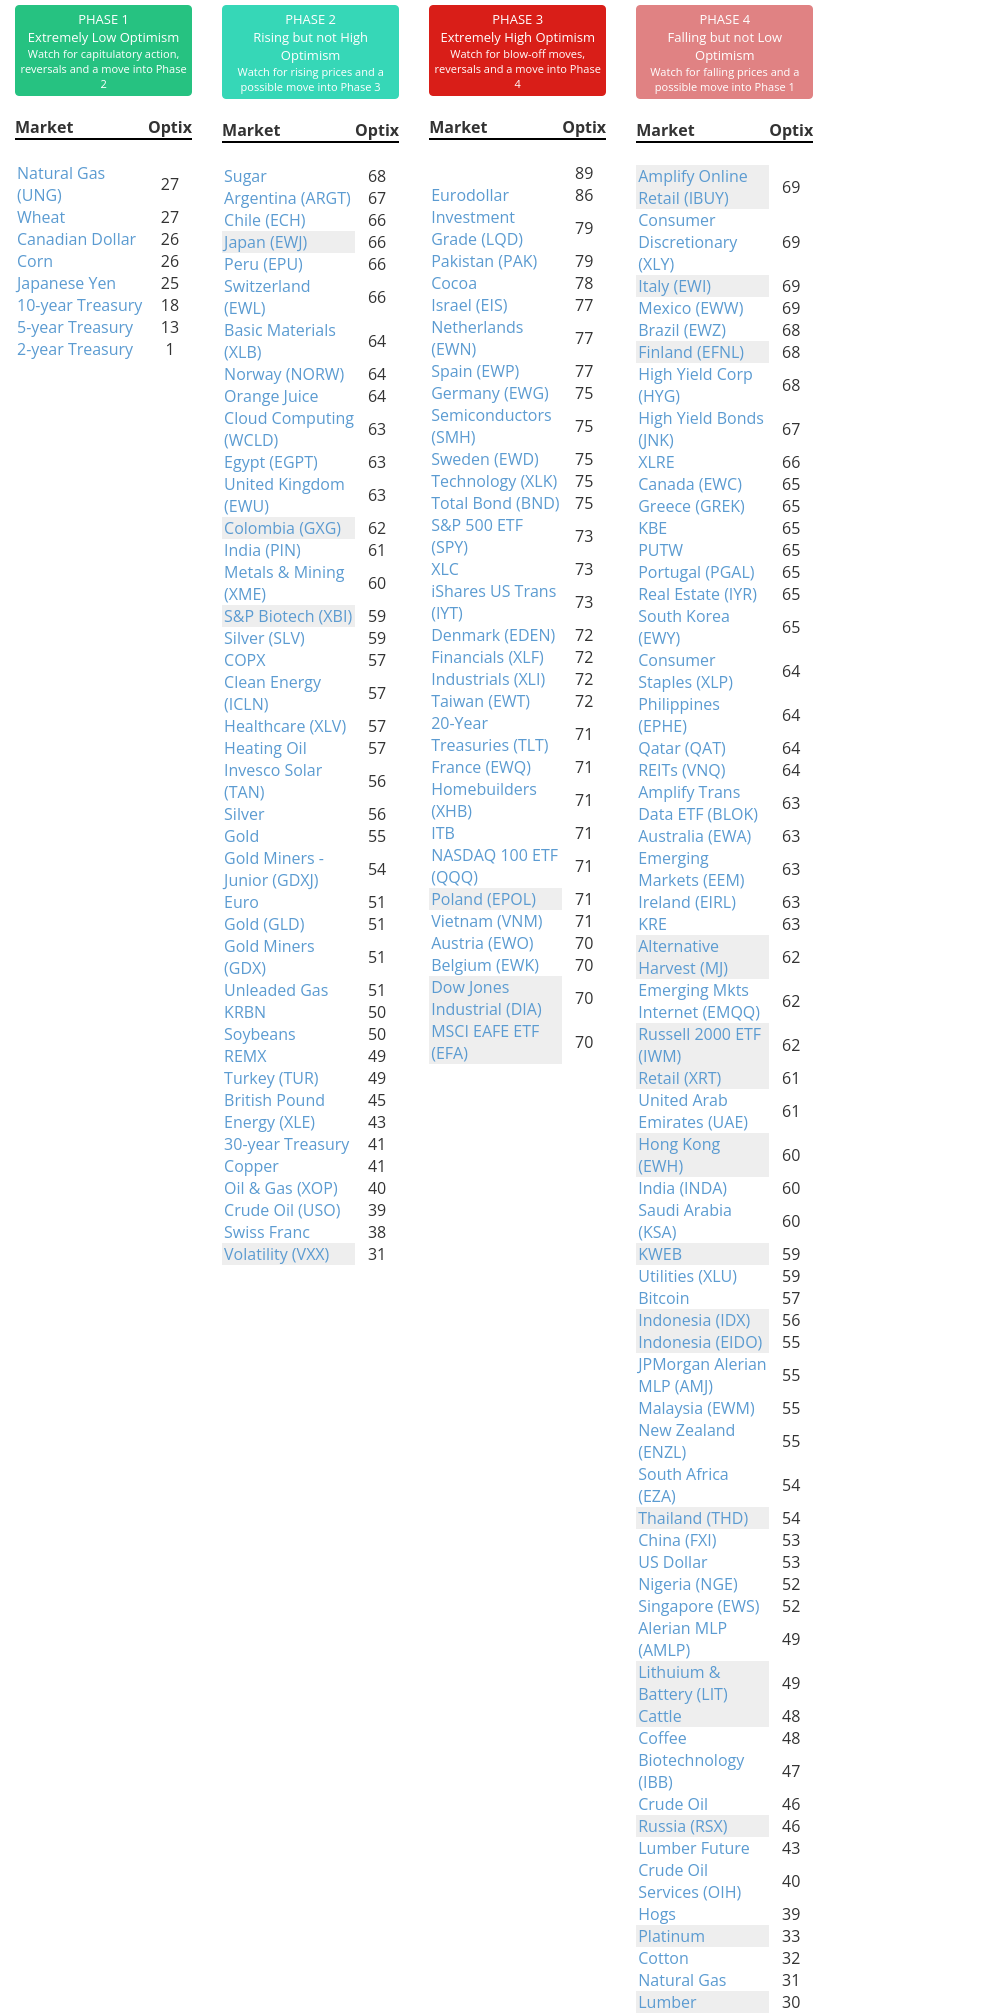
Phase Table
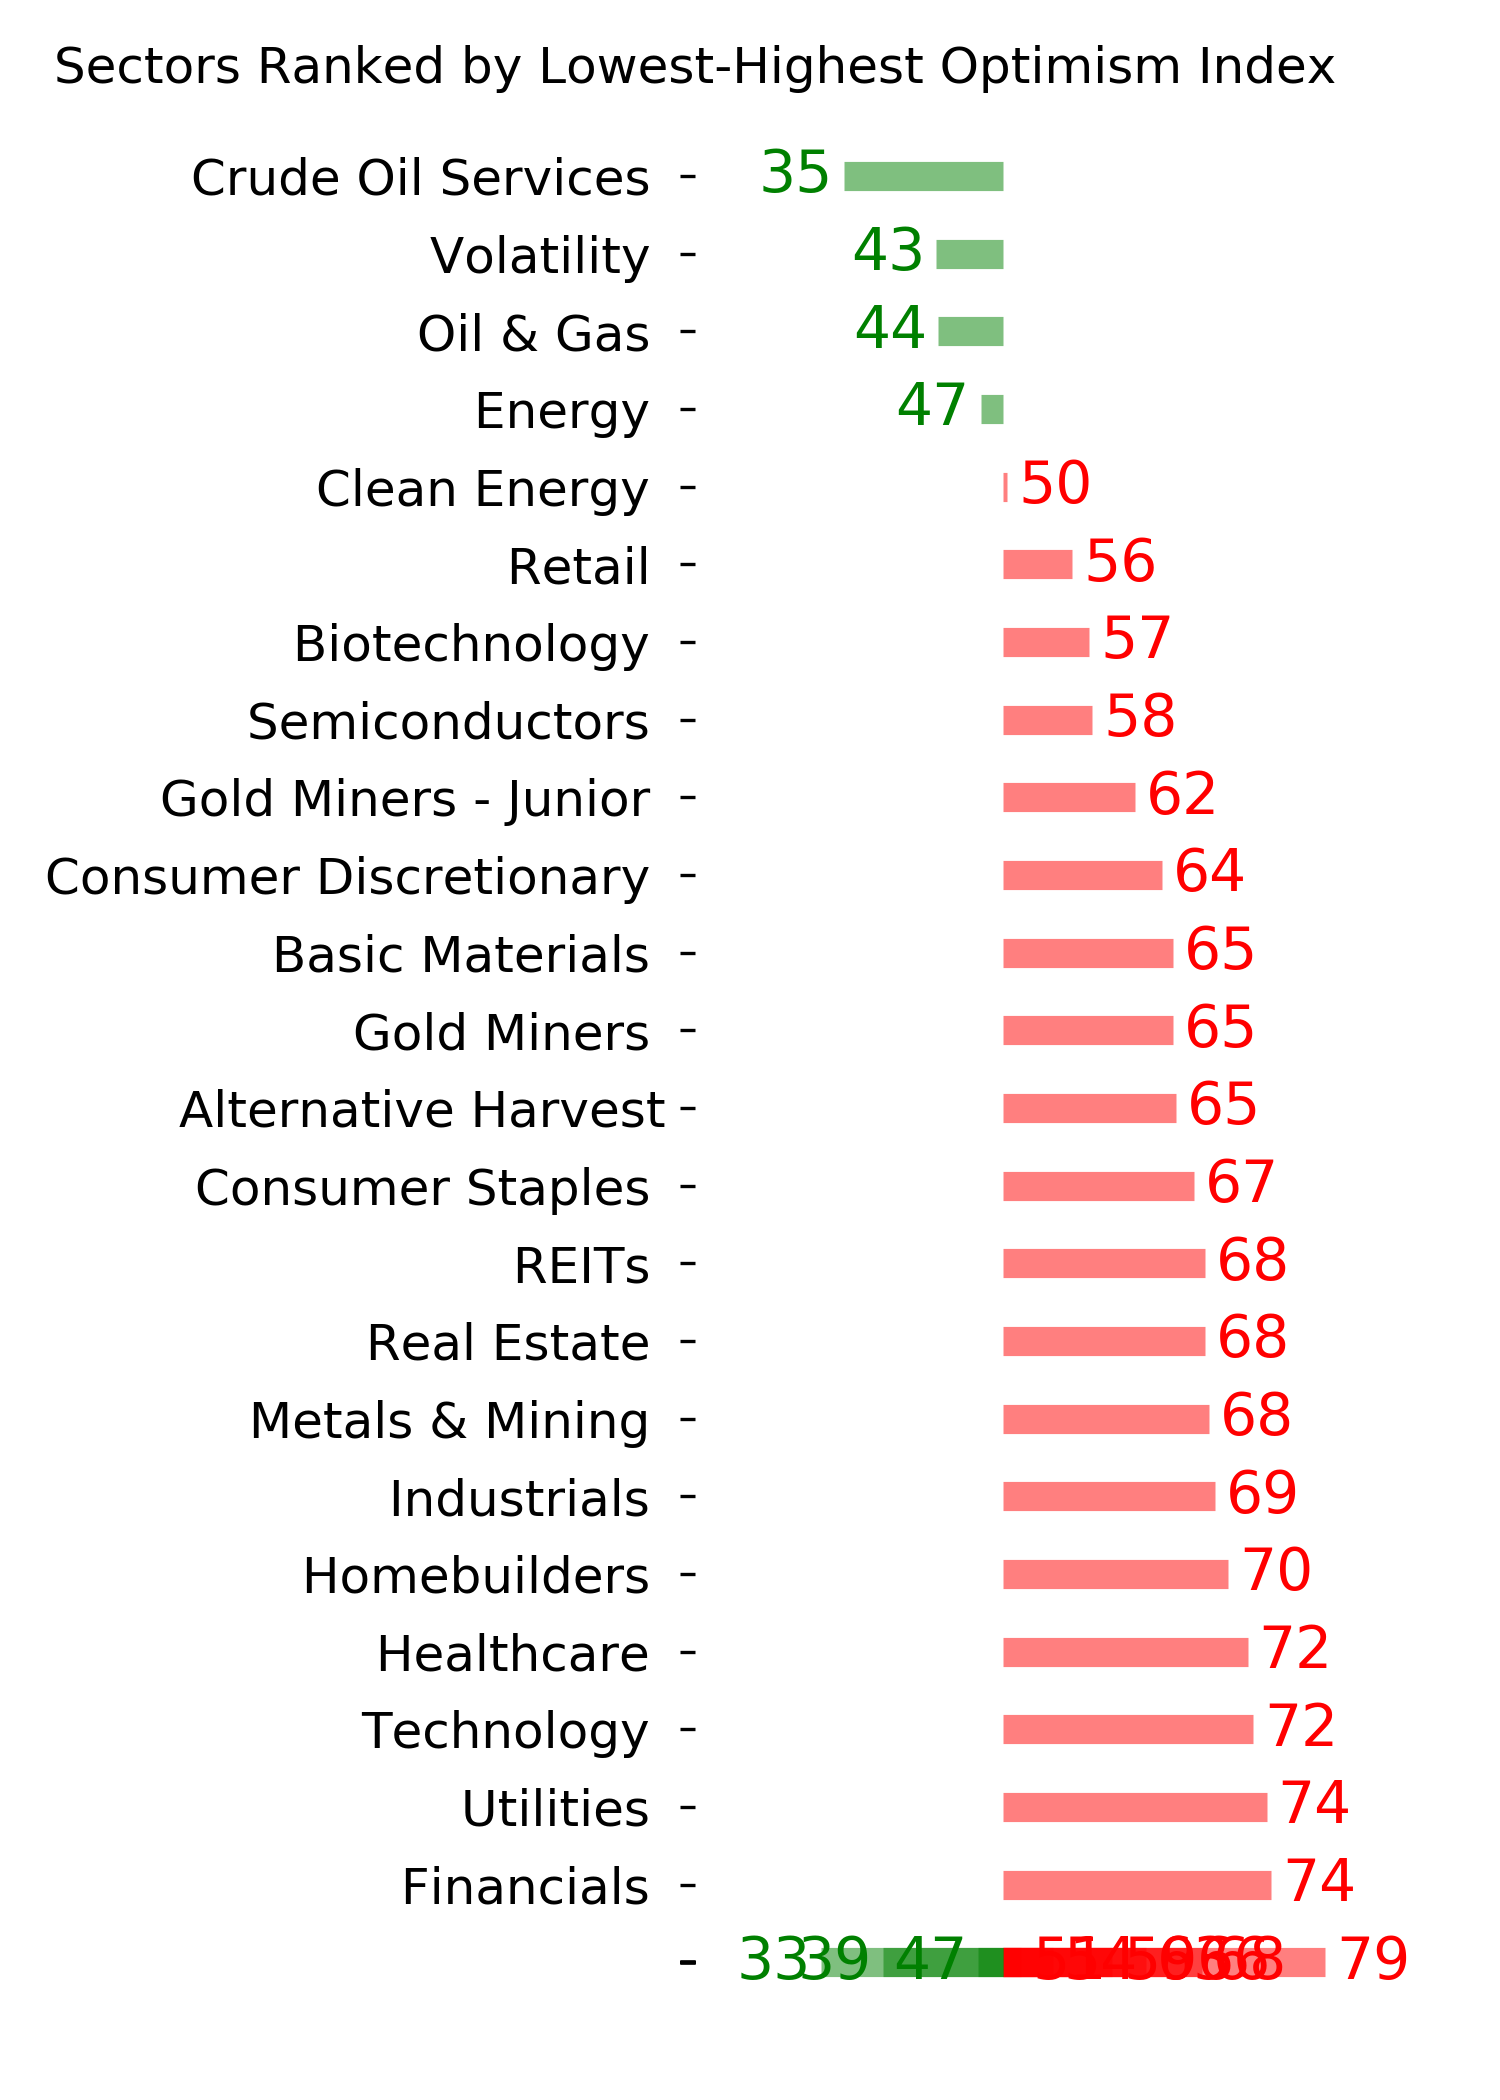
Ranks
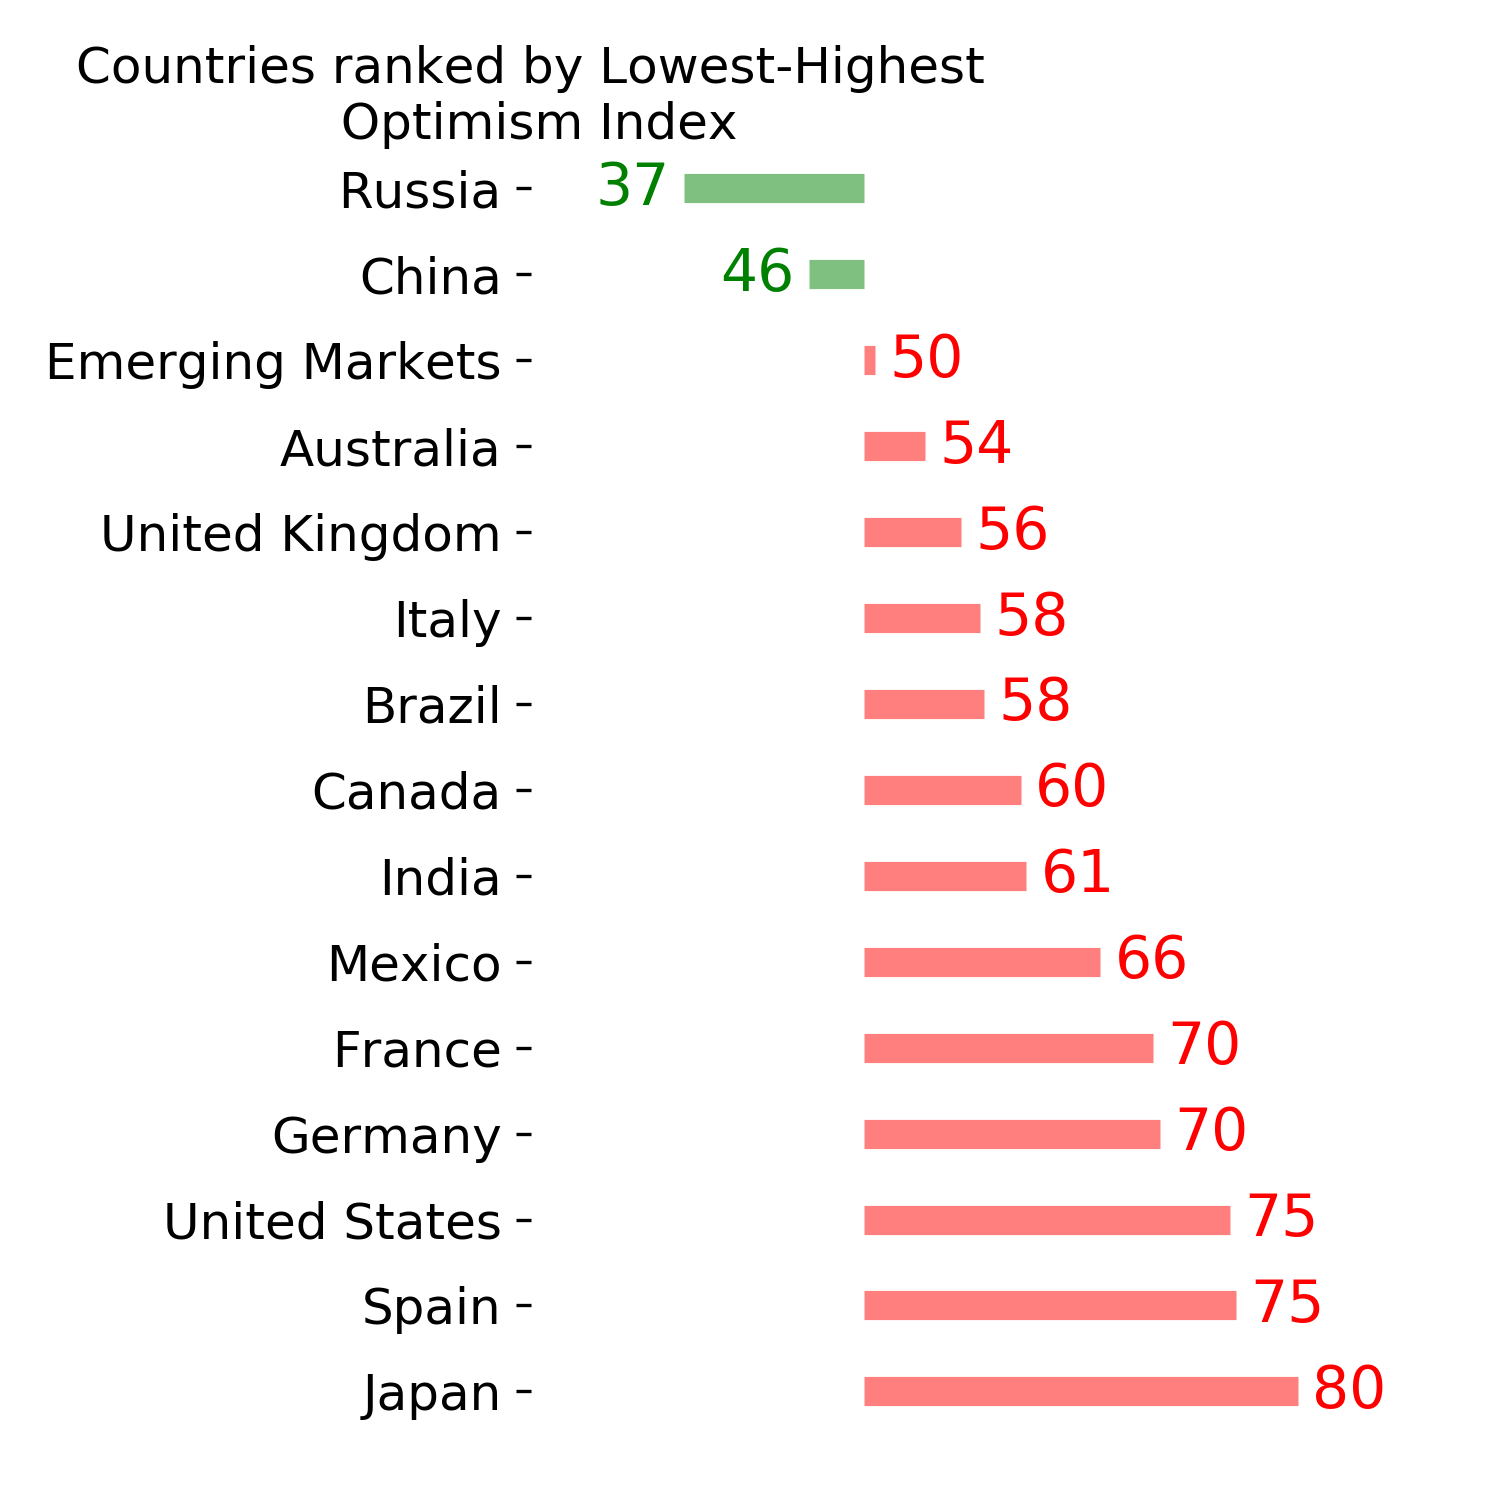
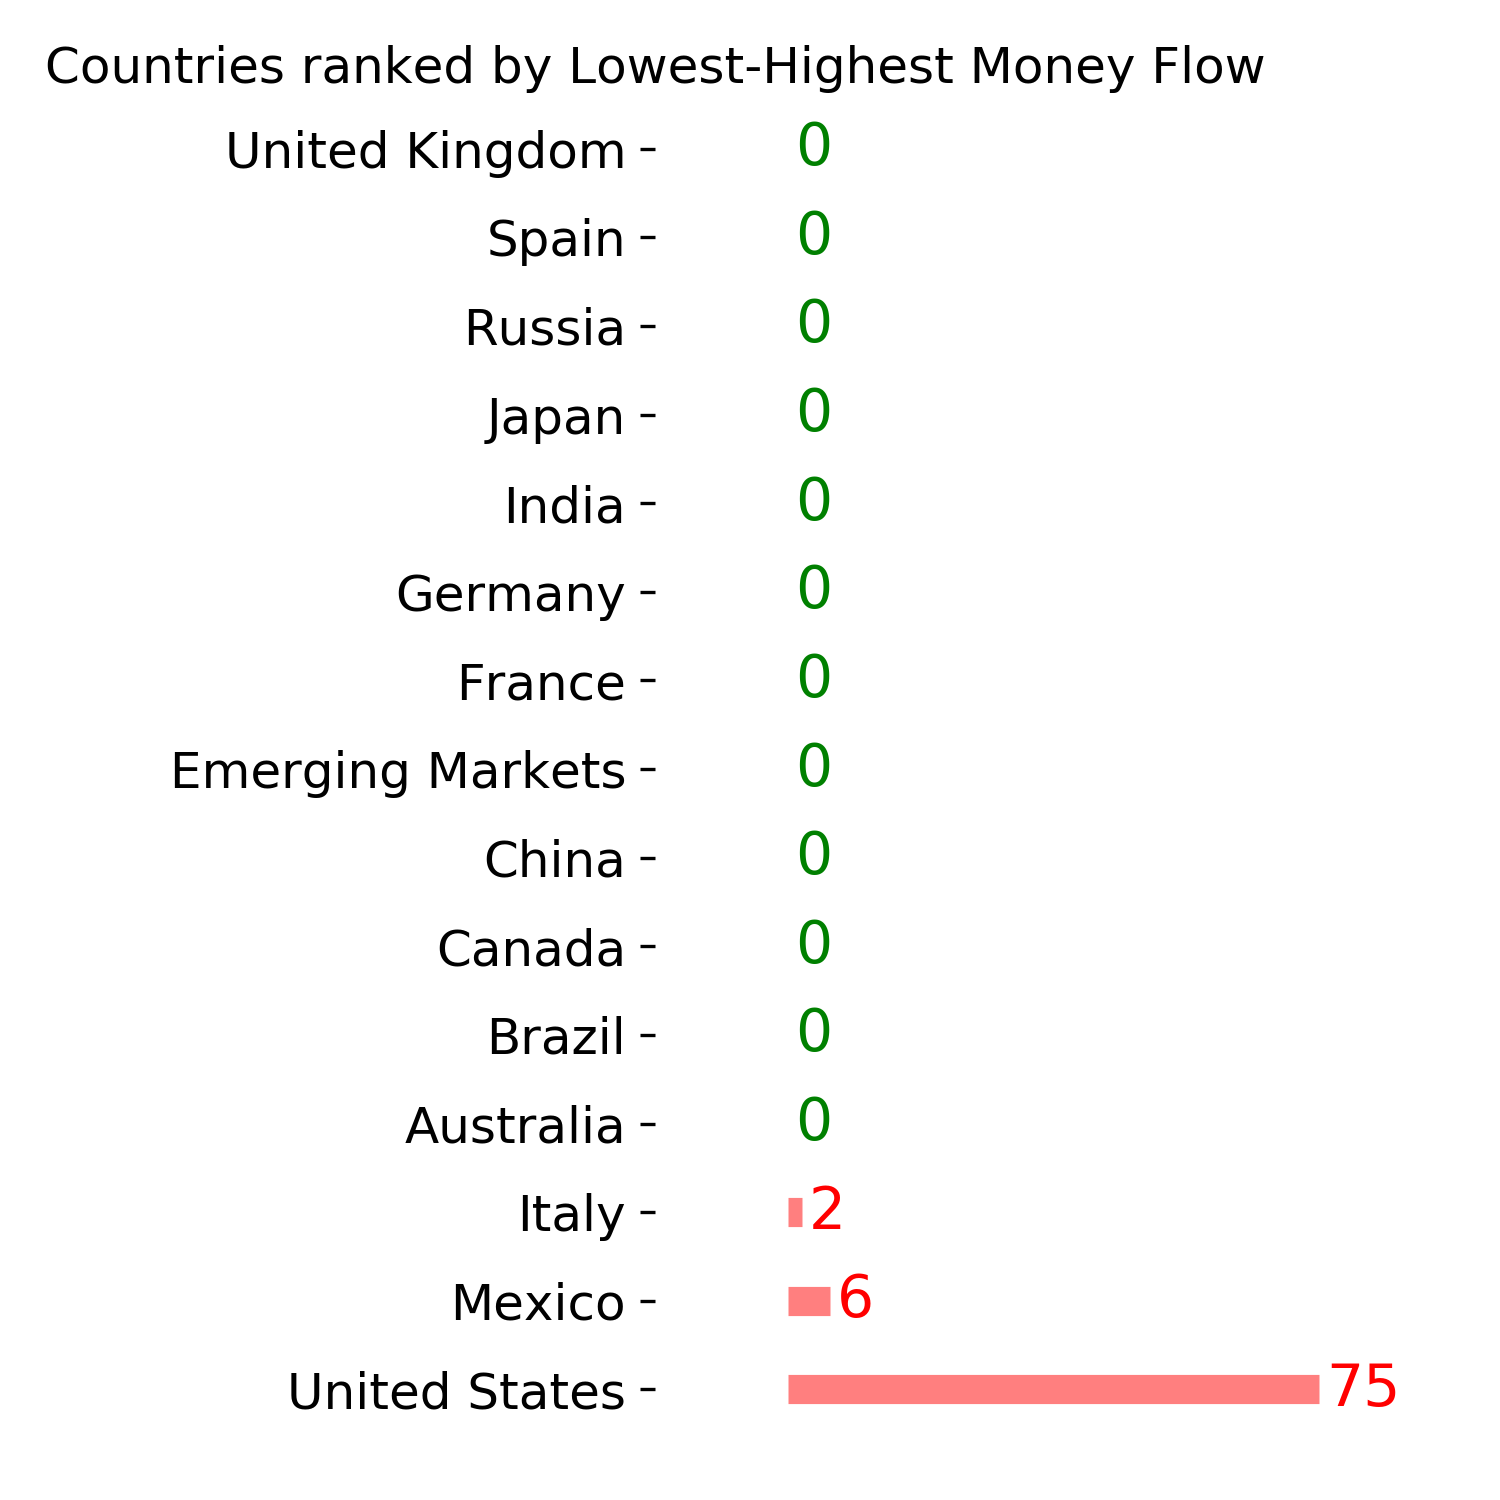
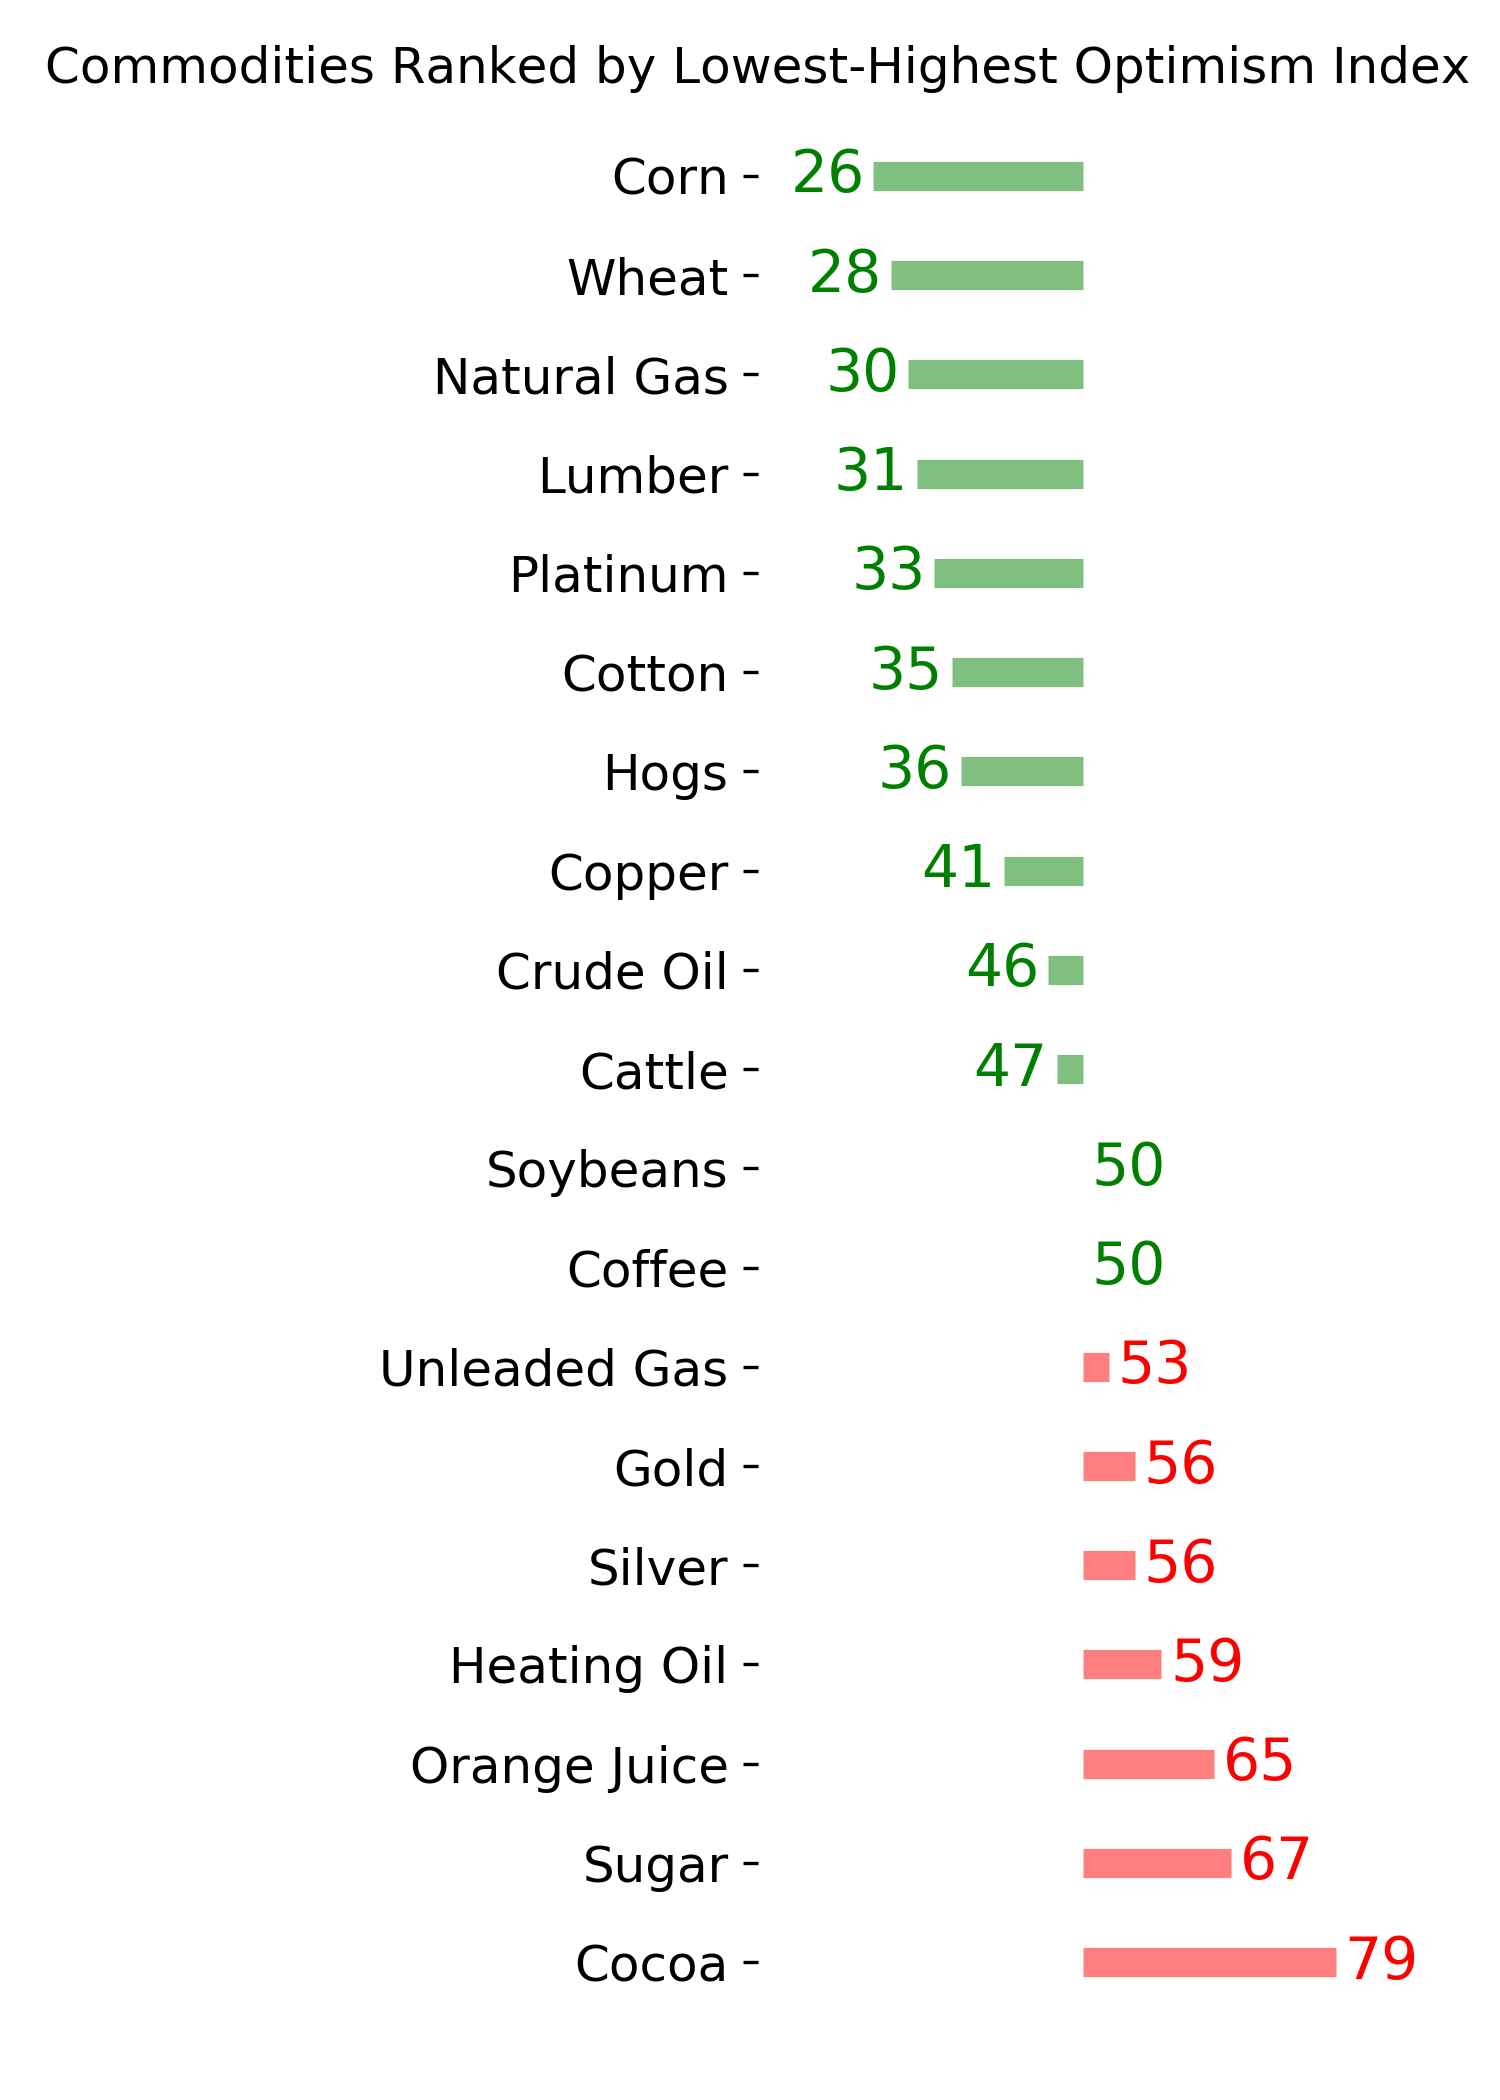
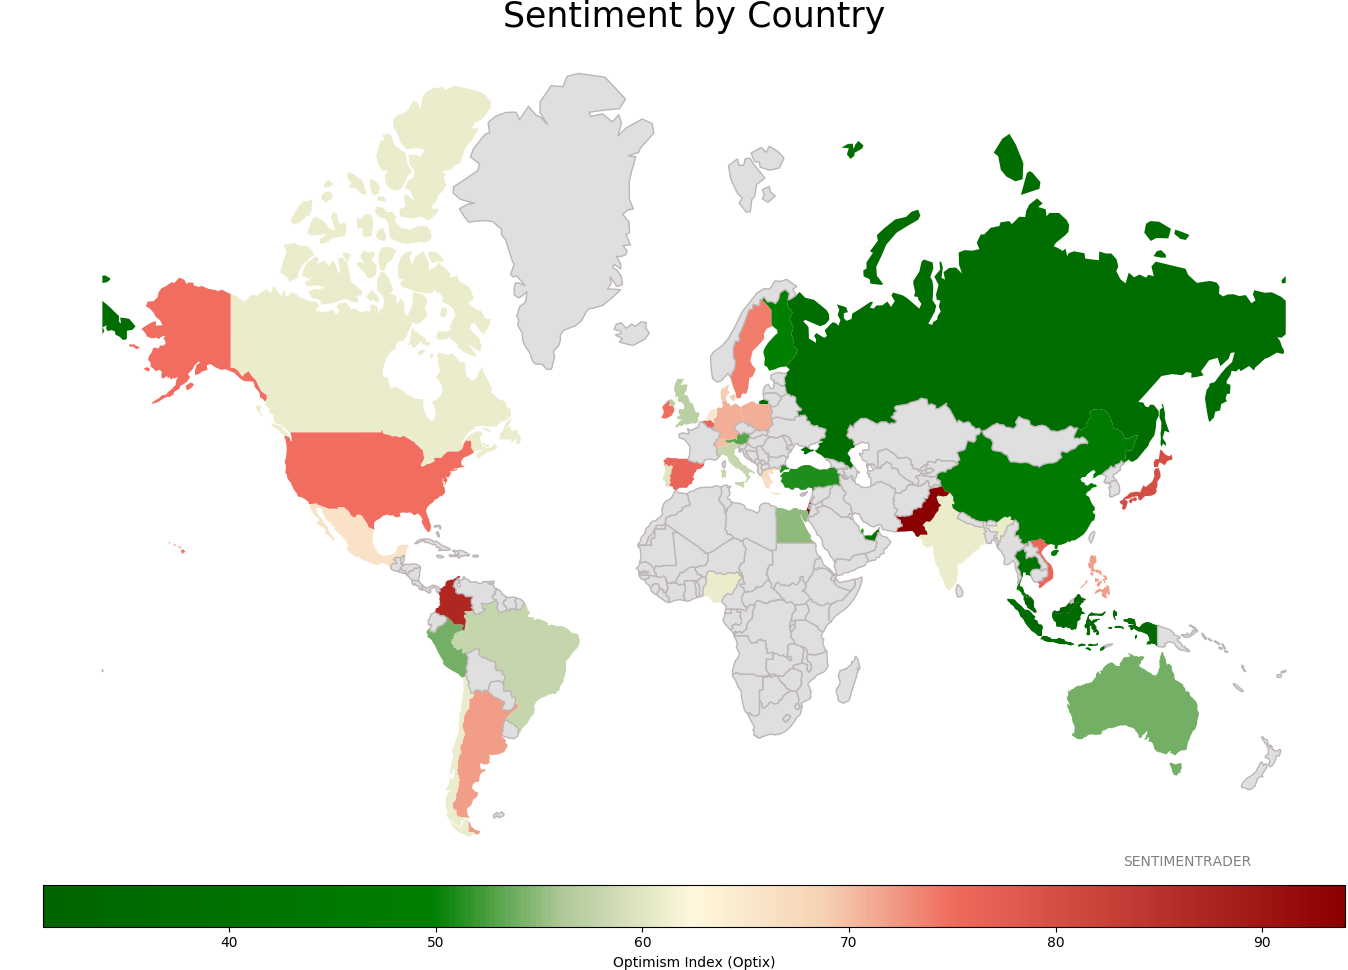
Sentiment Around The World
Optimism Index Thumbnails
|
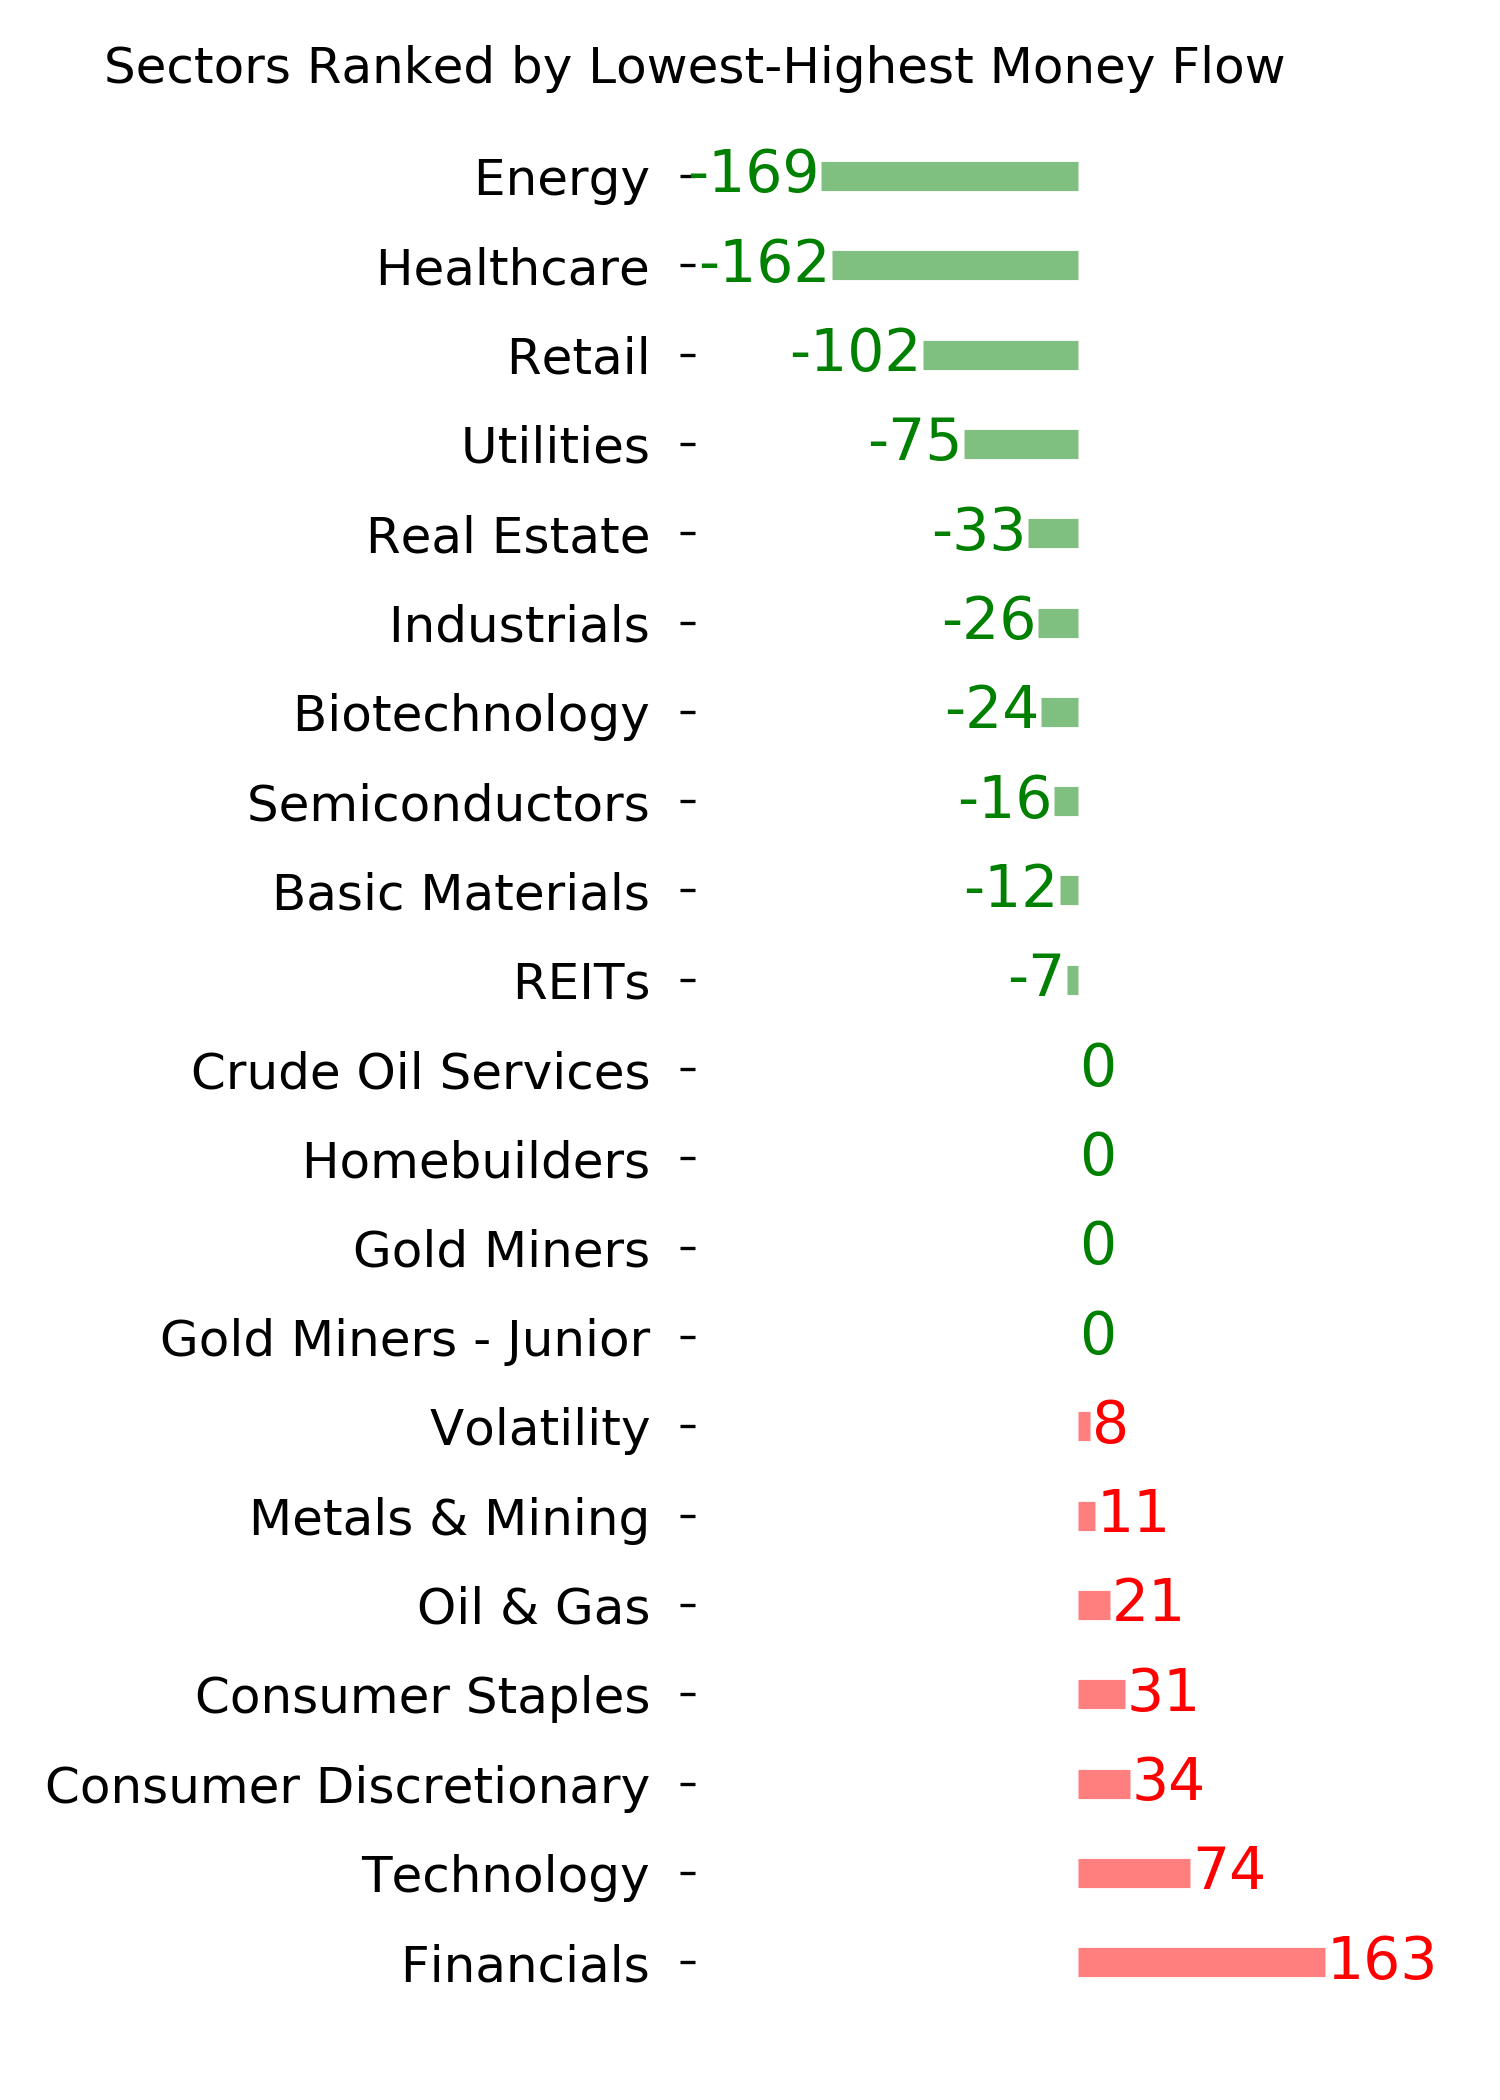
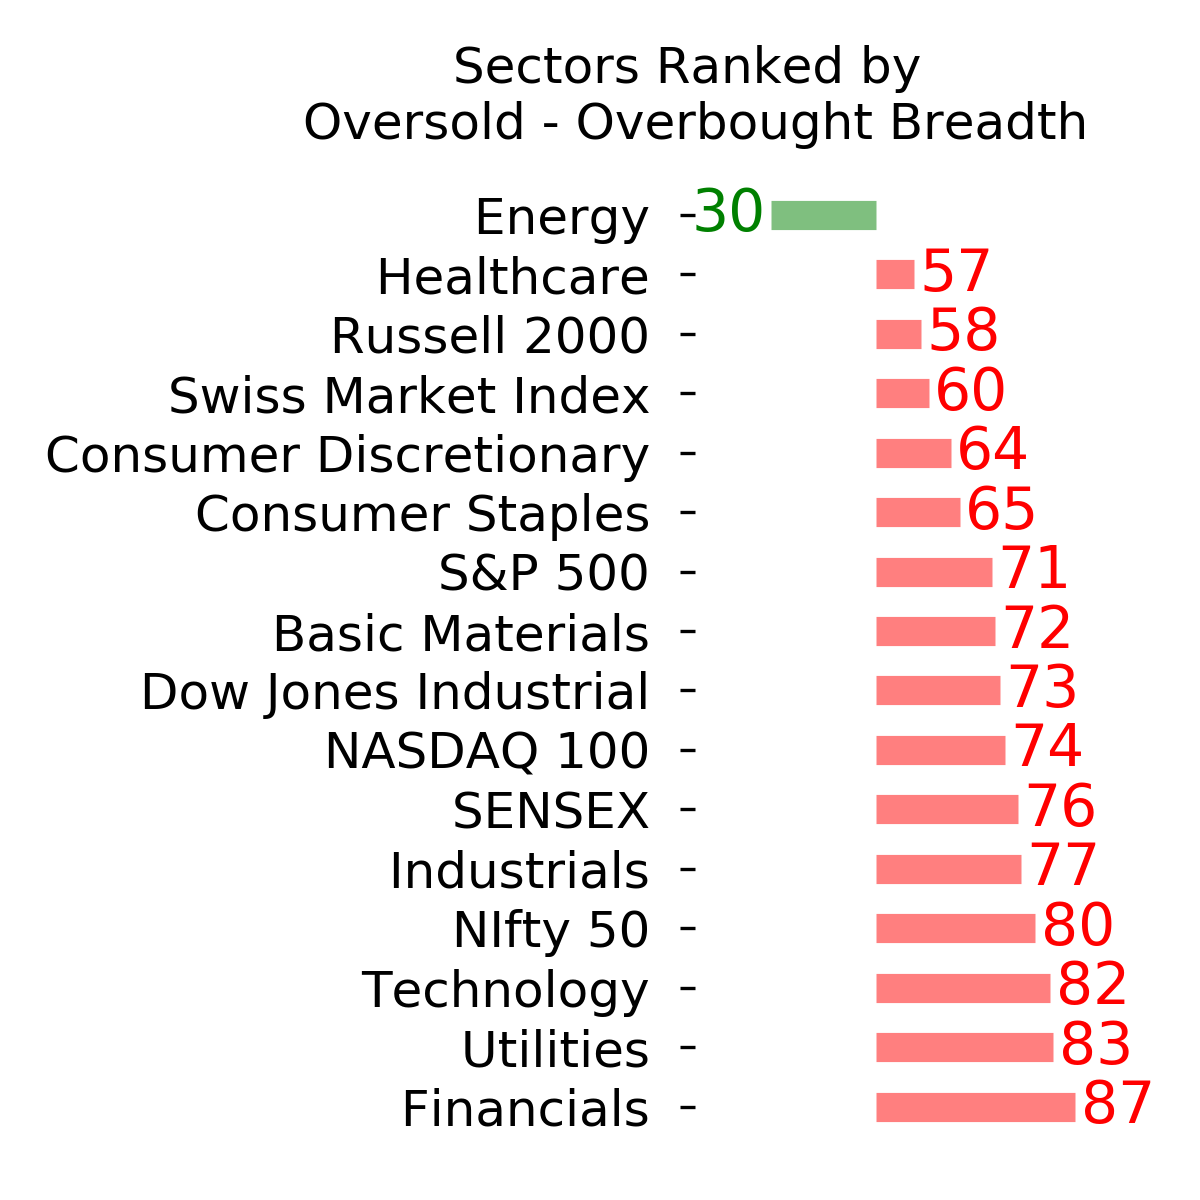
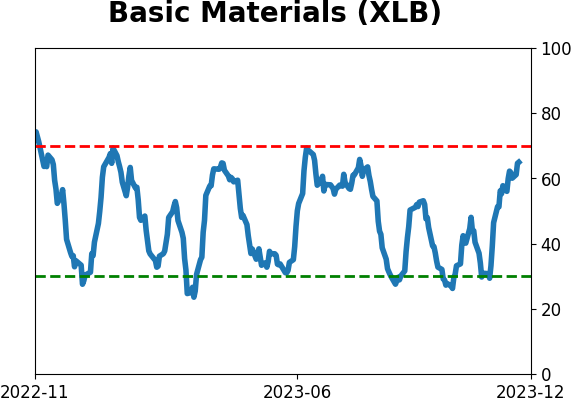
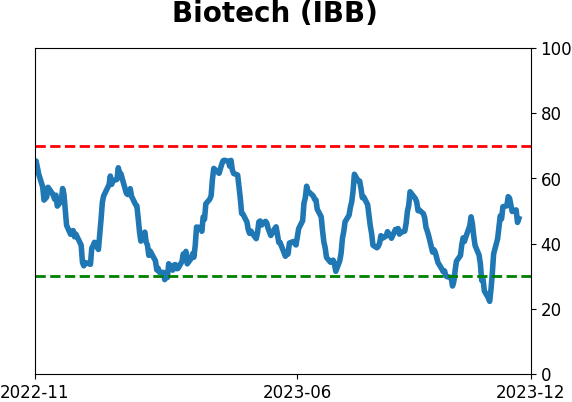
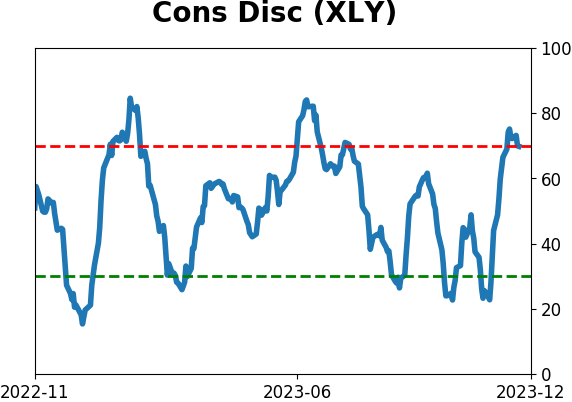
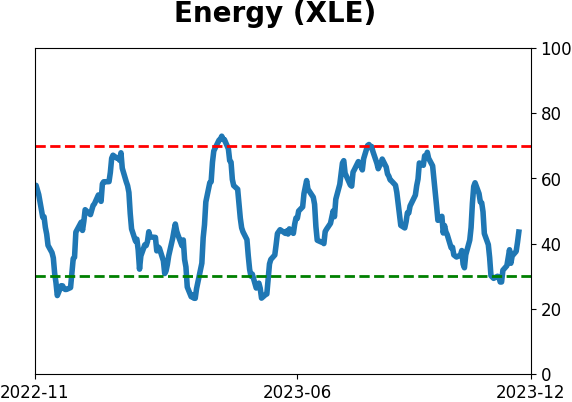
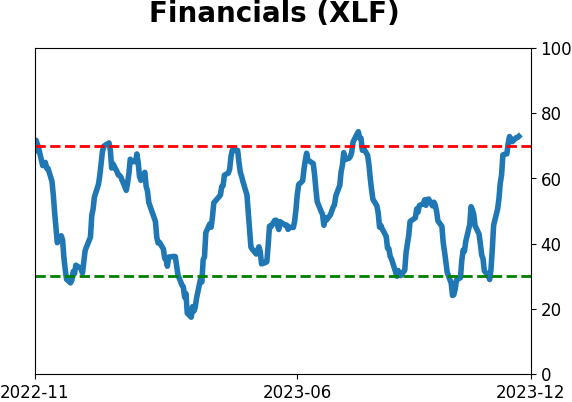
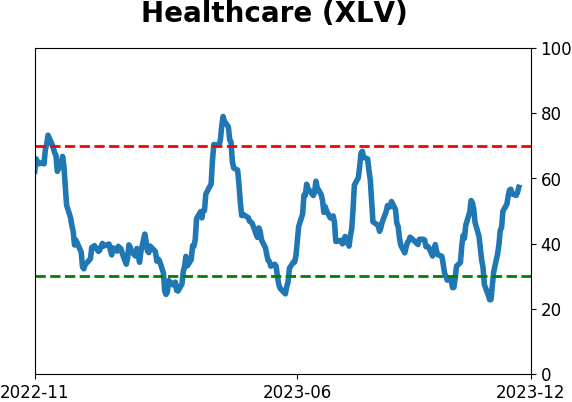
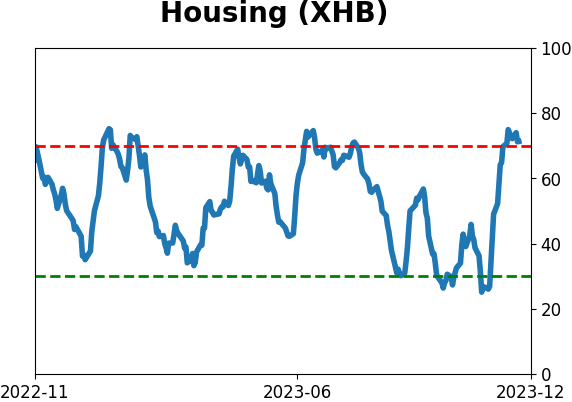
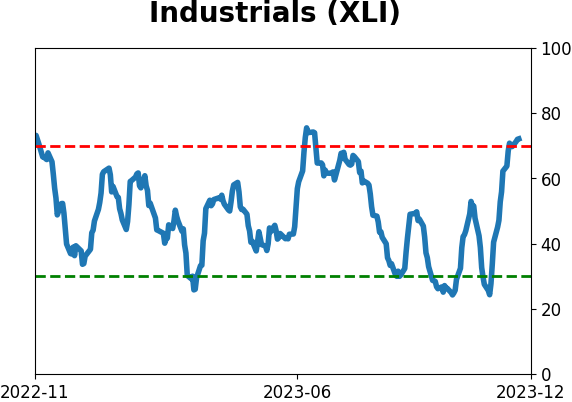
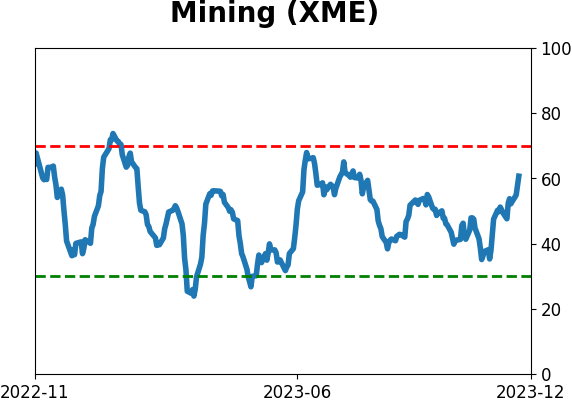
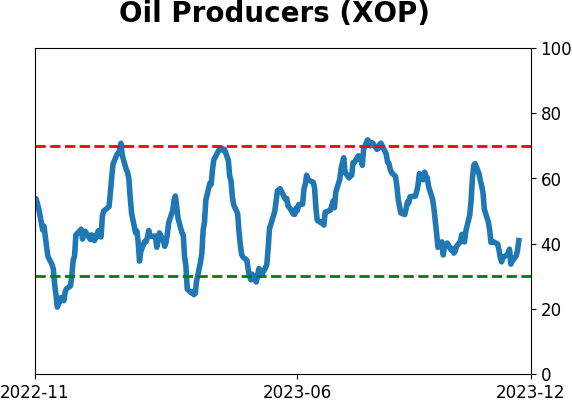
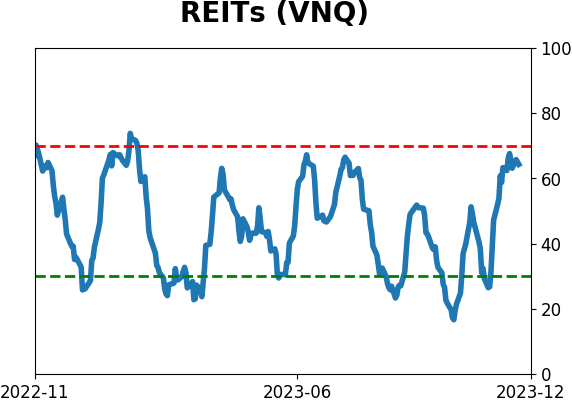
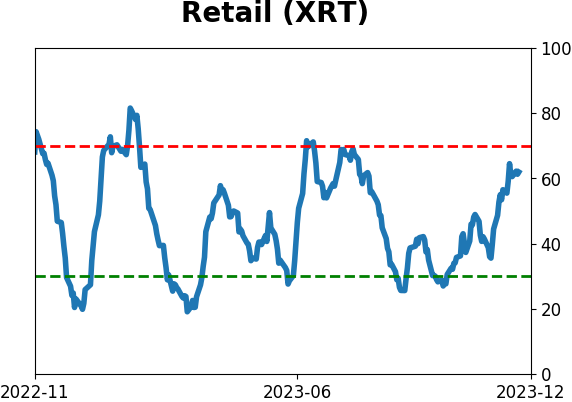
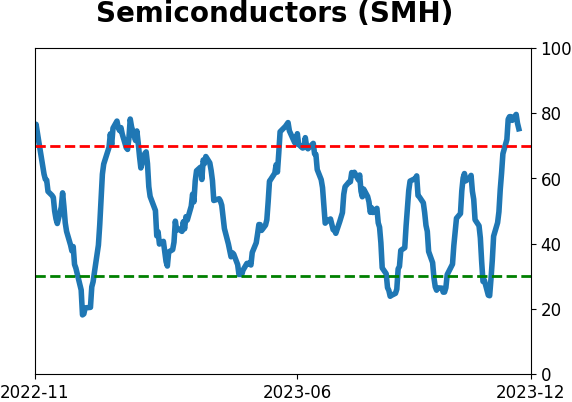
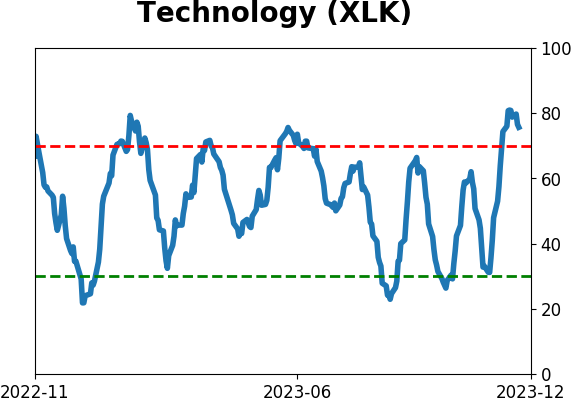
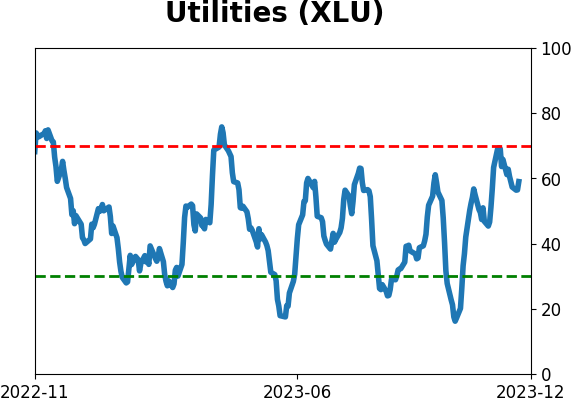
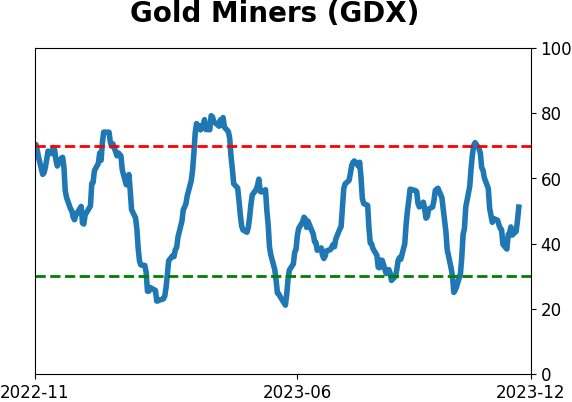
Sector ETF's - 10-Day Moving Average
|
|
|
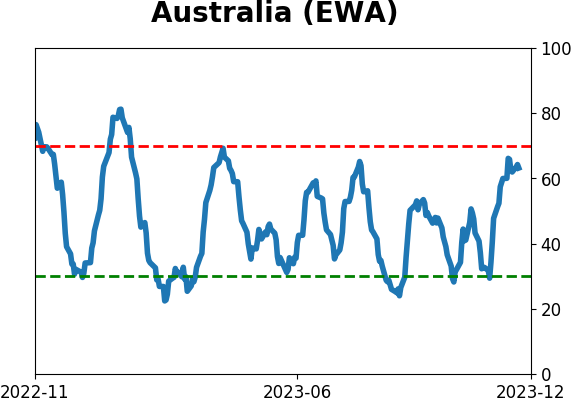
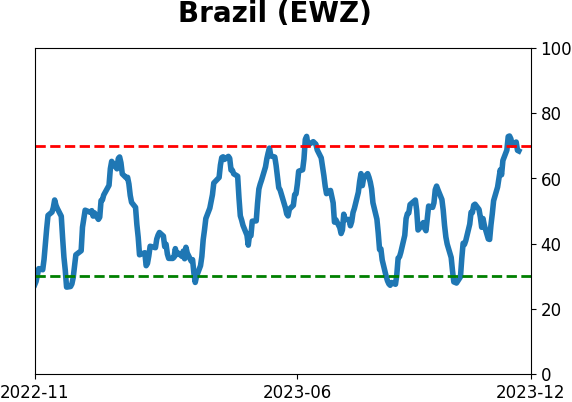
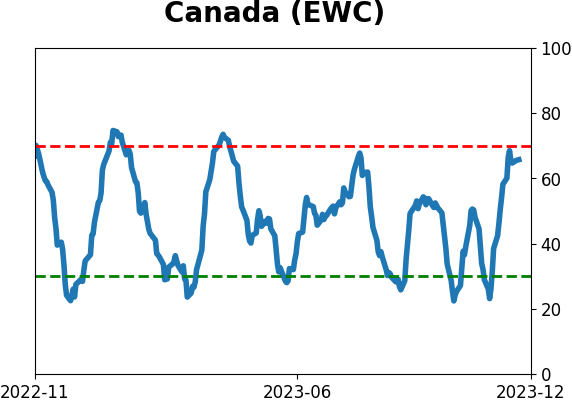
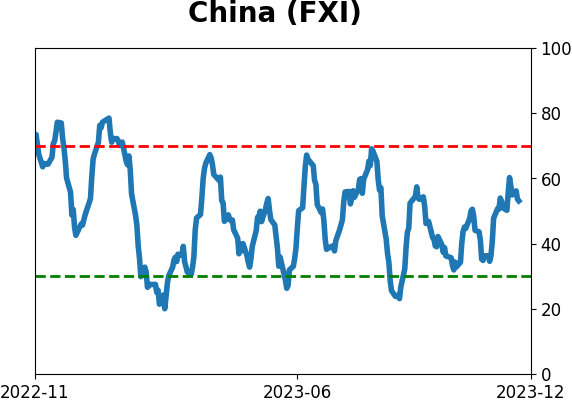
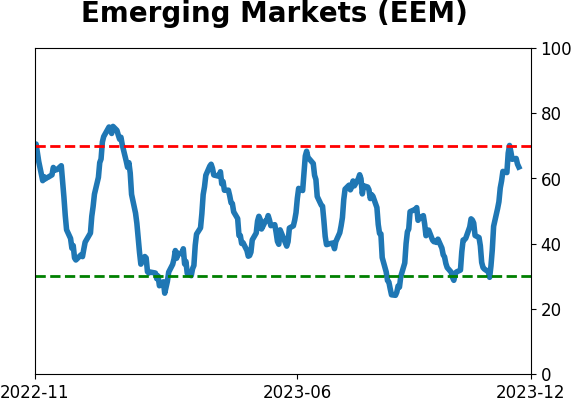
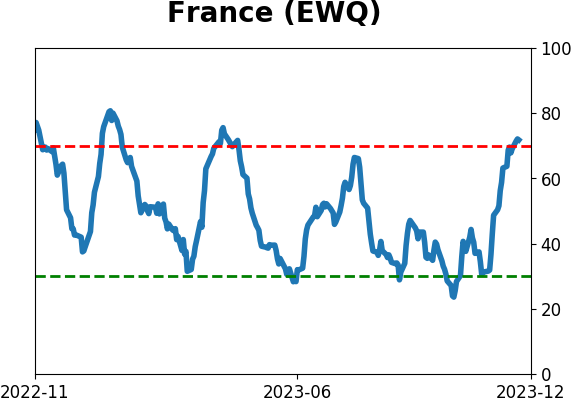
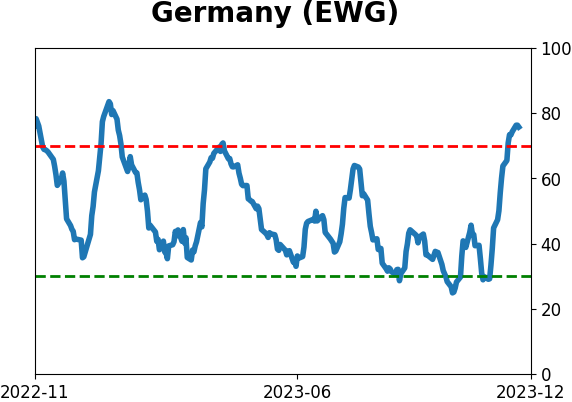
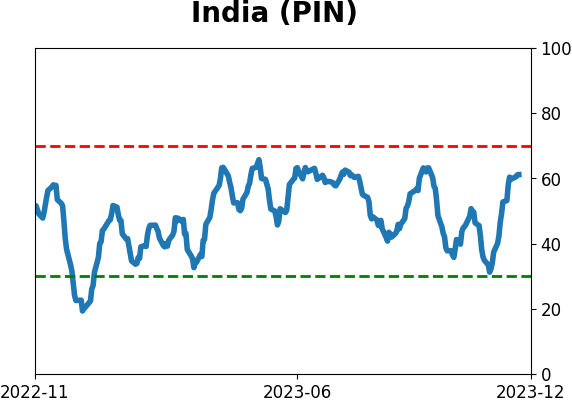
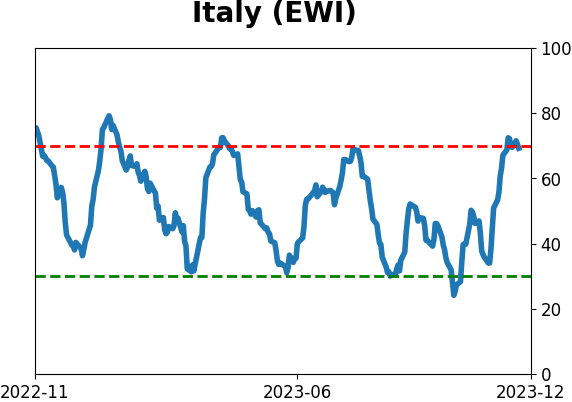
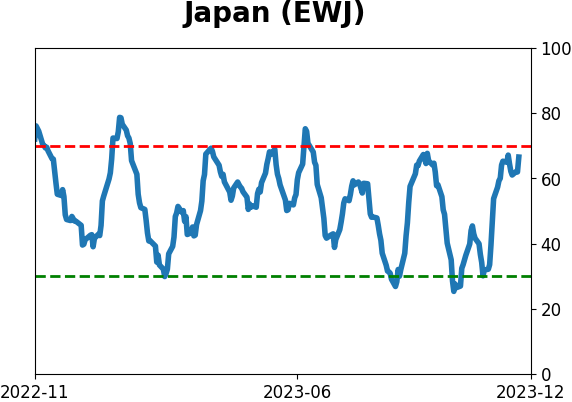
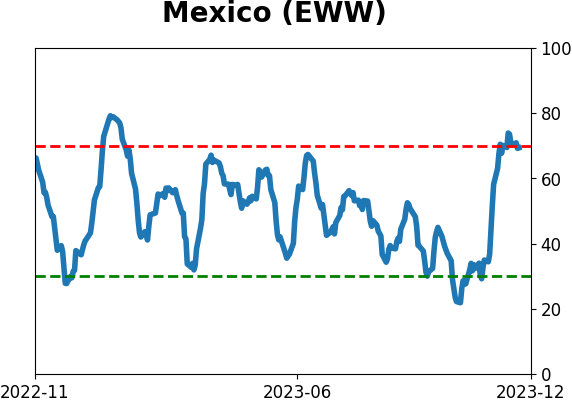
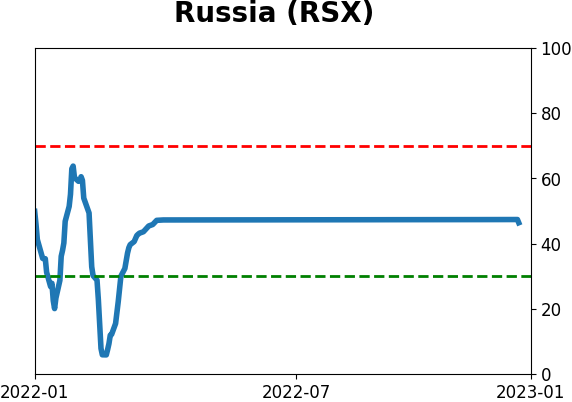
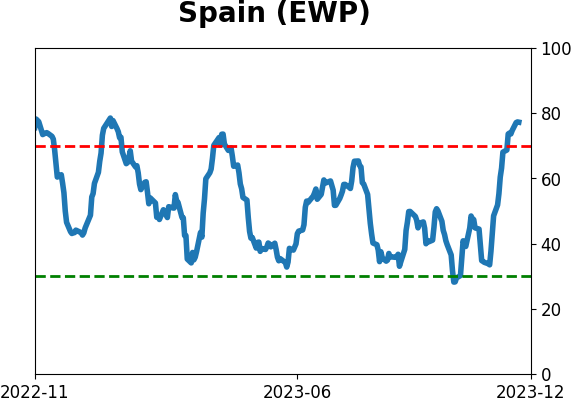
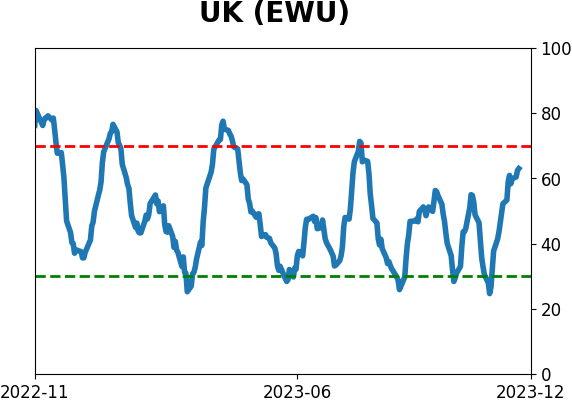
Country ETF's - 10-Day Moving Average
|
|
|
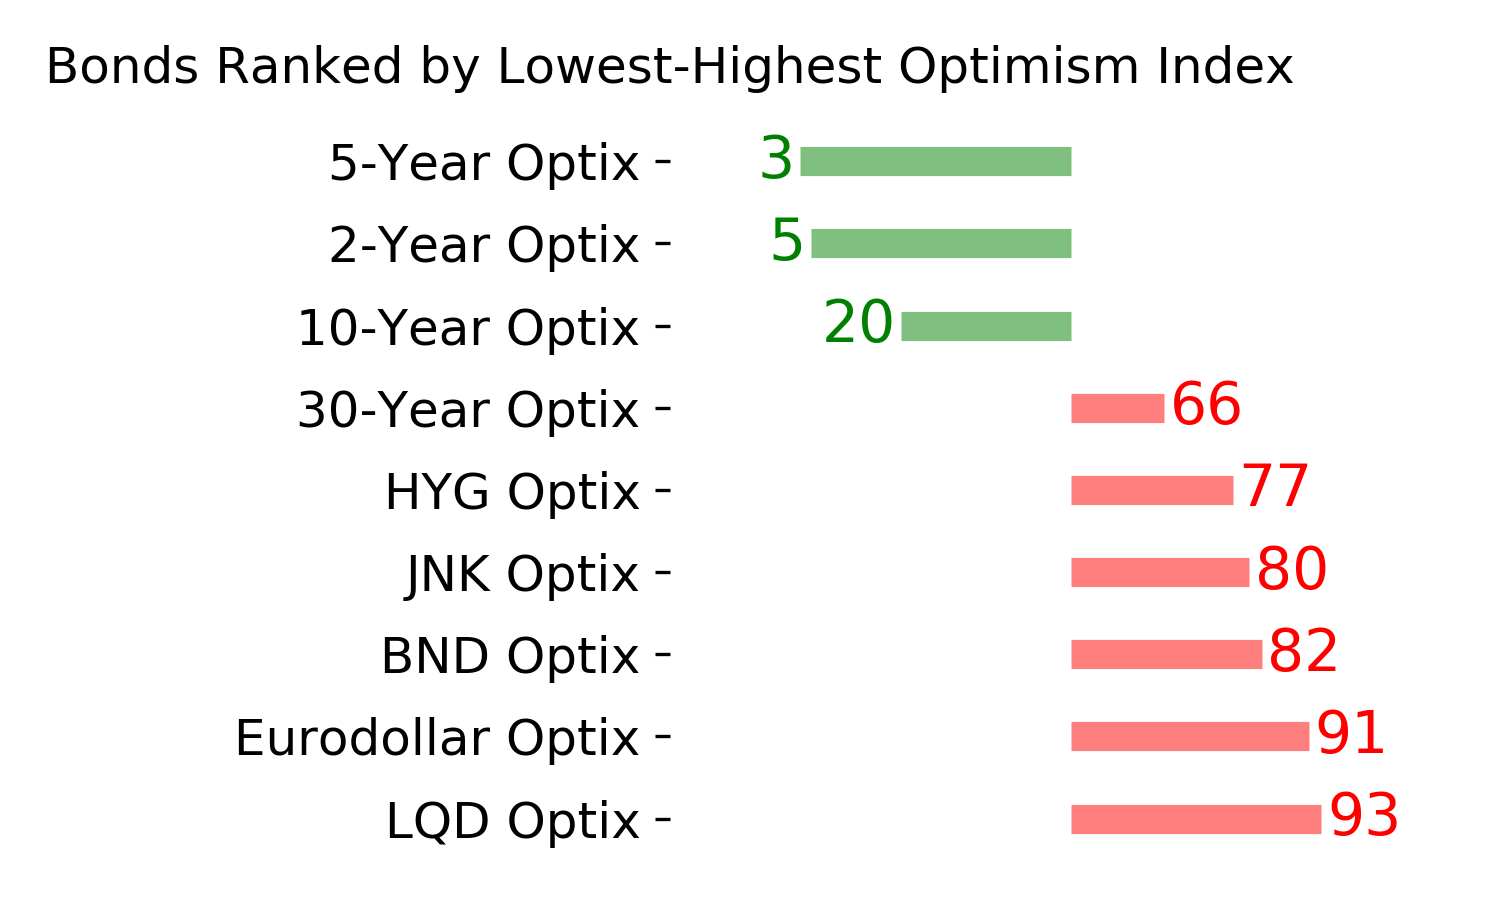
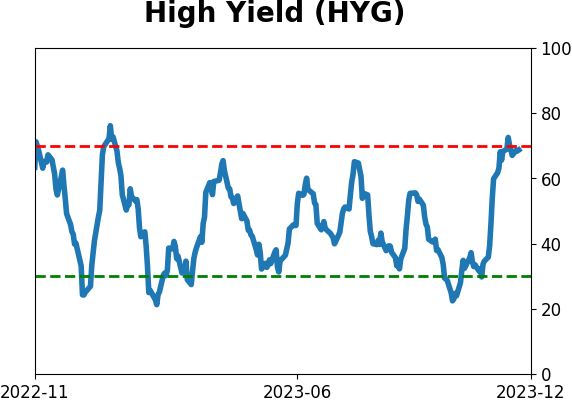
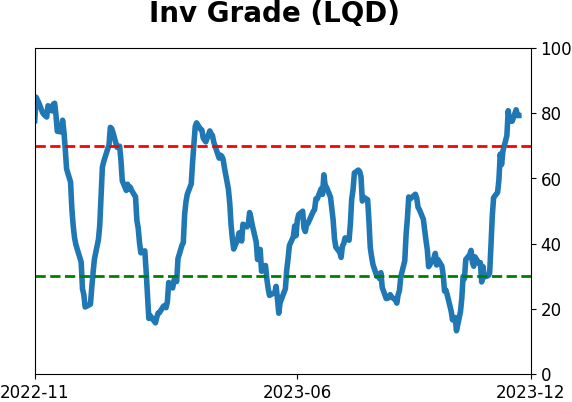
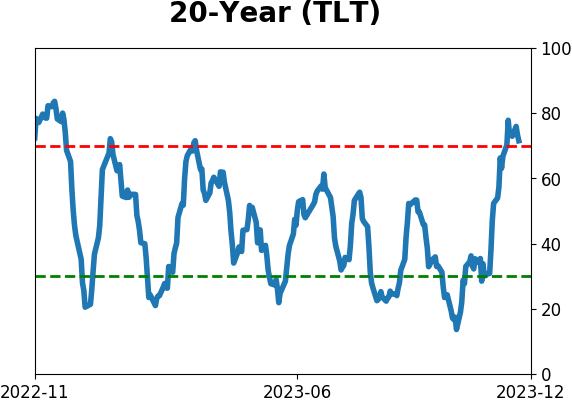
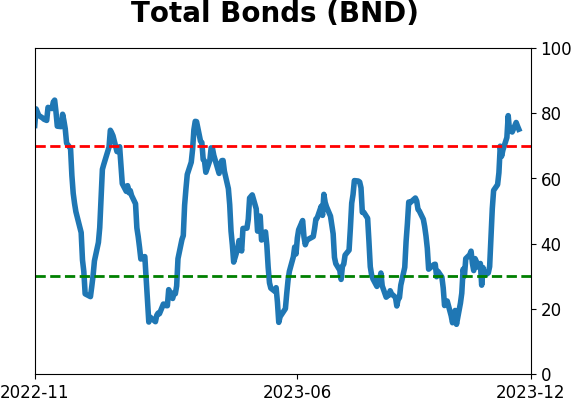
Bond ETF's - 10-Day Moving Average
|
|
|
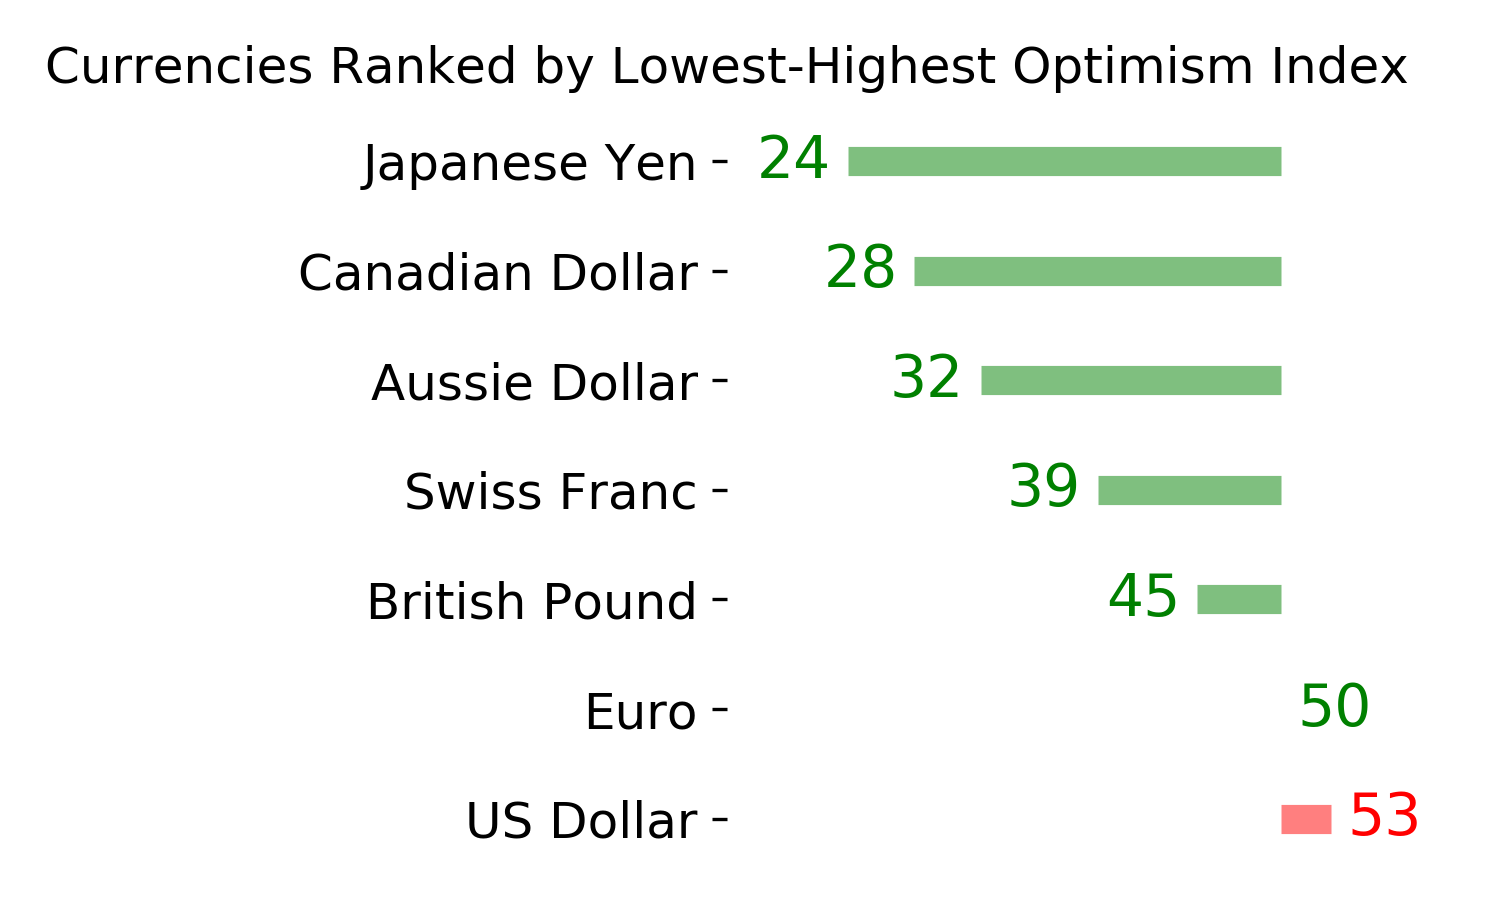
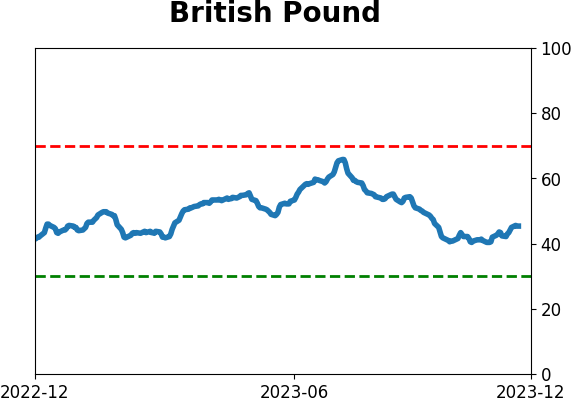
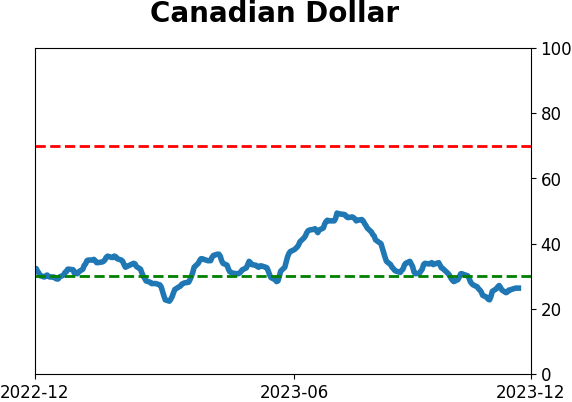
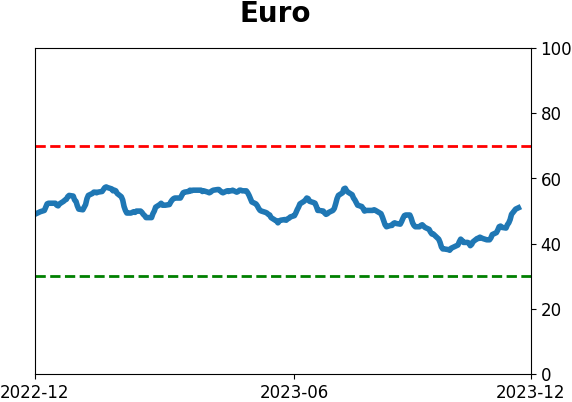
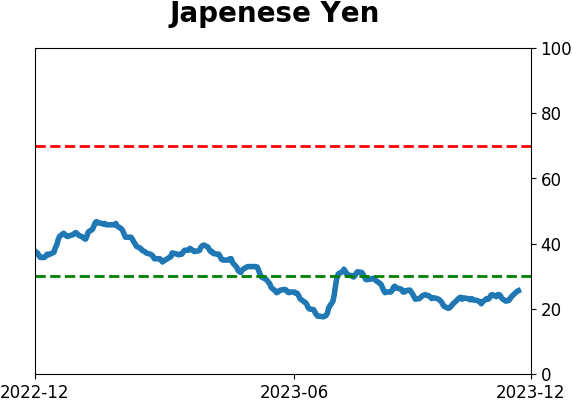
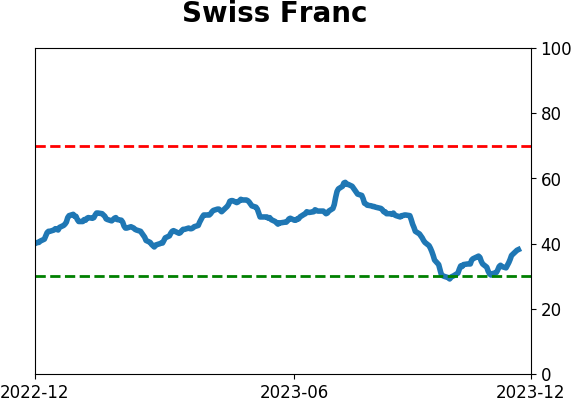
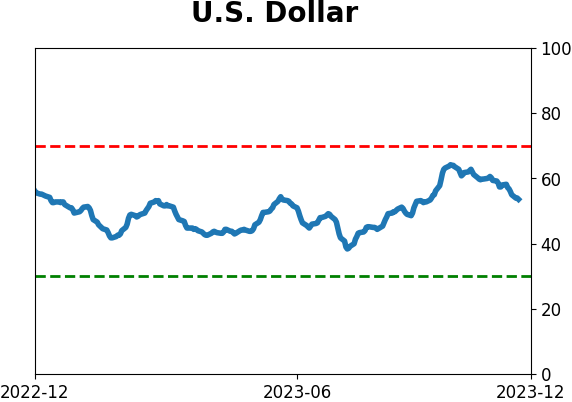
Currency ETF's - 5-Day Moving Average
|
|
|
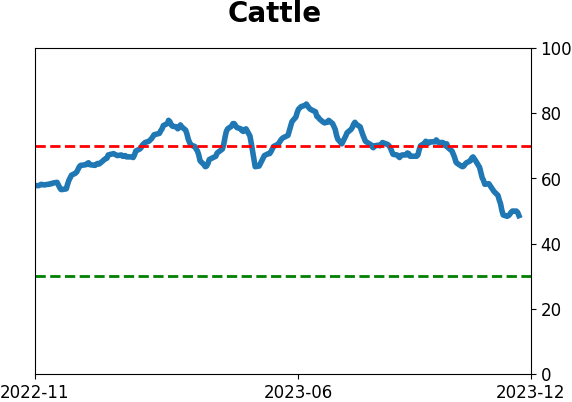
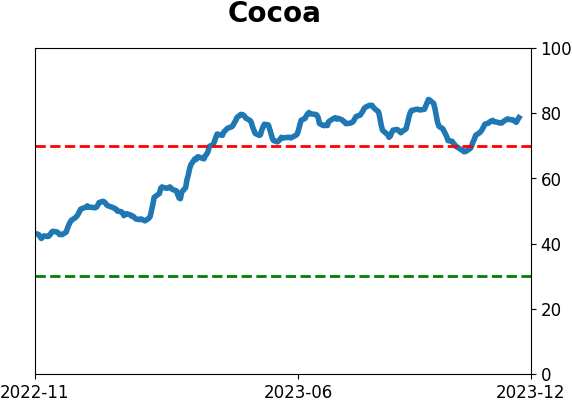
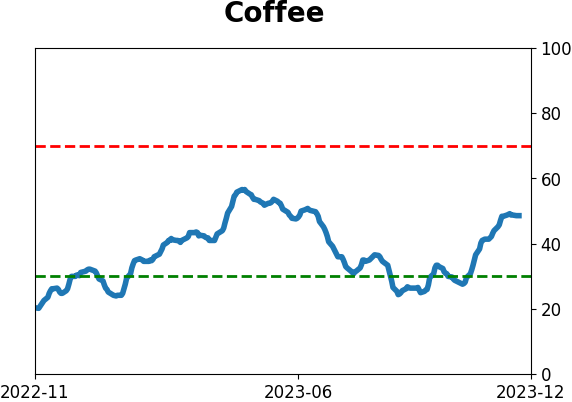
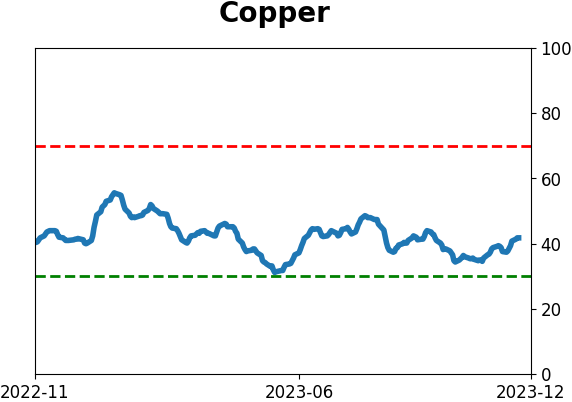
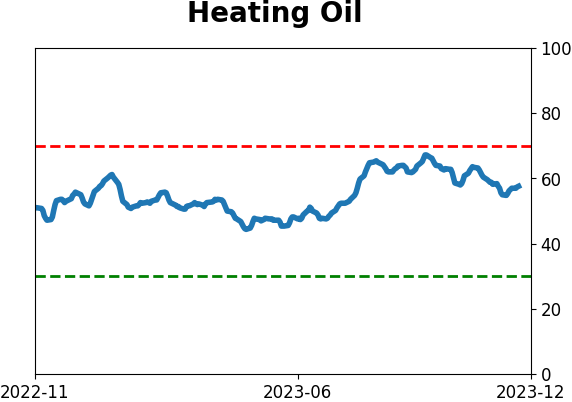
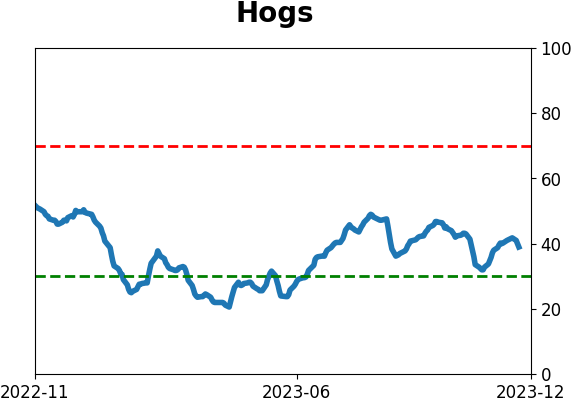
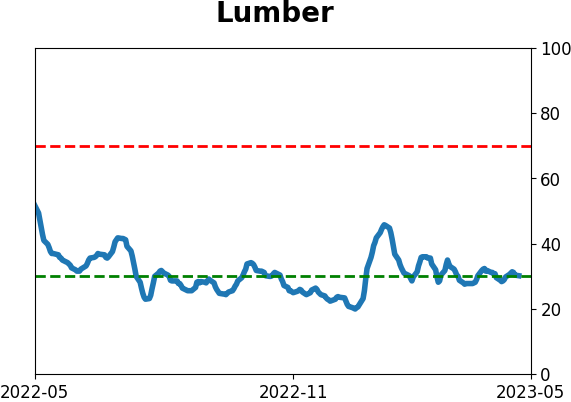
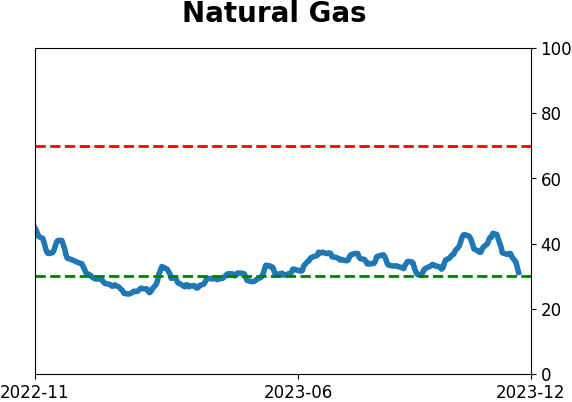
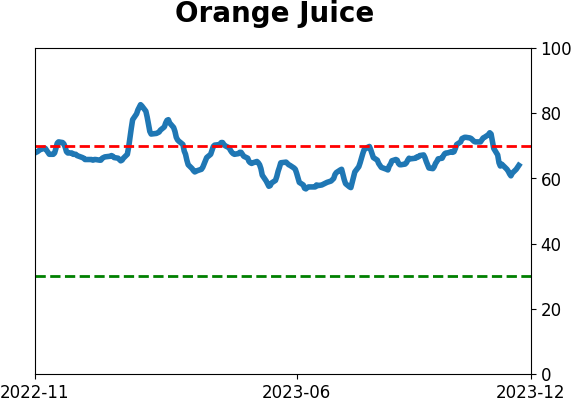
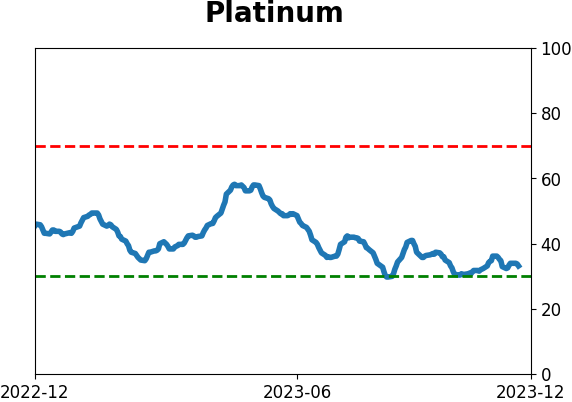
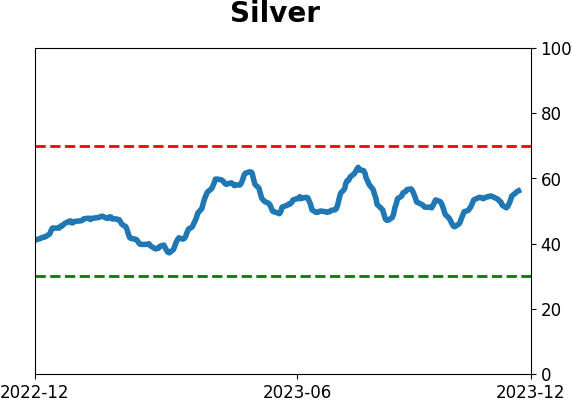
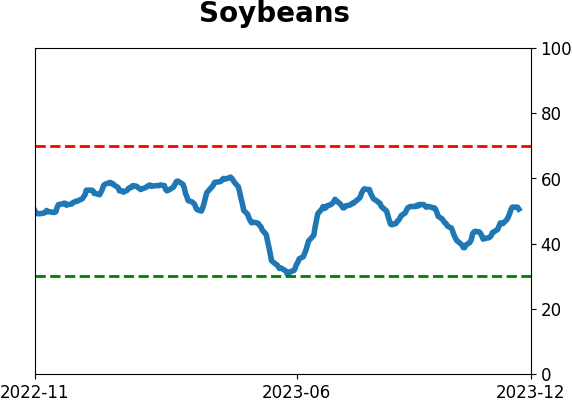
Commodity ETF's - 5-Day Moving Average
|
|