Headlines
|
|
Trend indicators for the S&P 500 shift to a bullish status:
A composite that contains ten trend-following indicators cycled from a bearish to a bullish status, triggering a buy signal with a 90% win rate over the subsequent six months for the world's most benchmarked index.
|
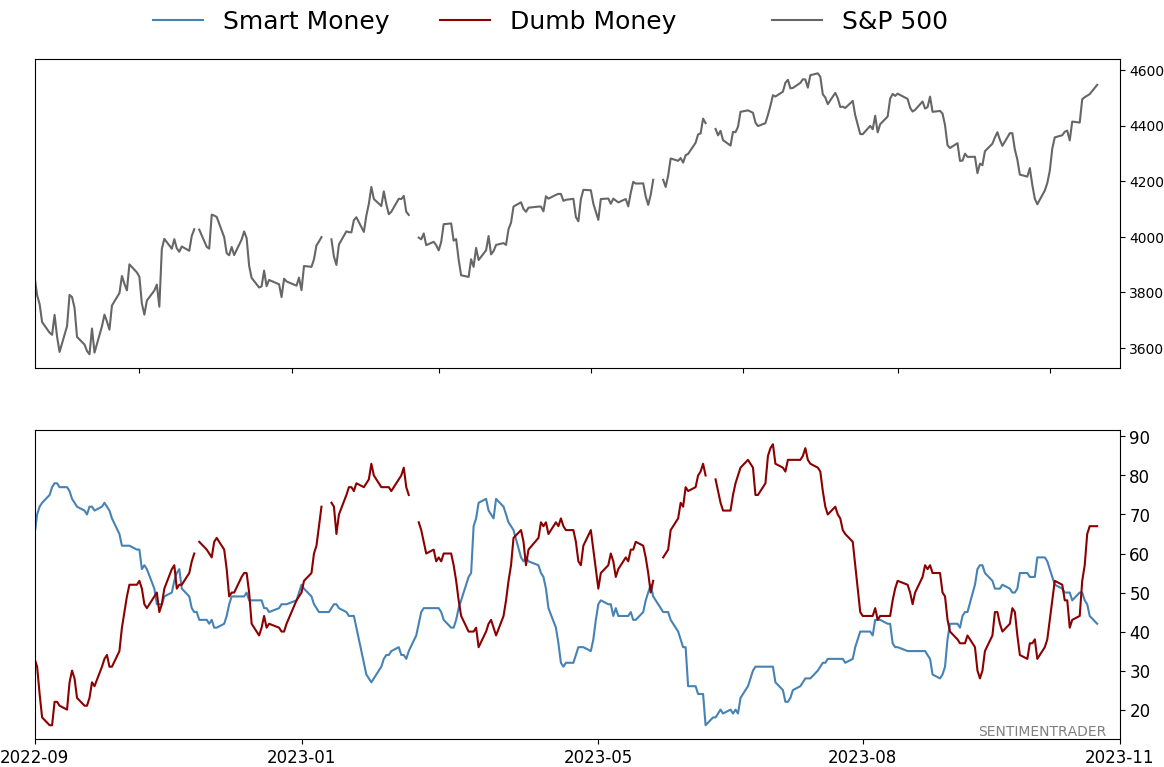
Smart / Dumb Money Confidence
|
Smart Money Confidence: 42%
Dumb Money Confidence: 67%
|
|
Risk Levels
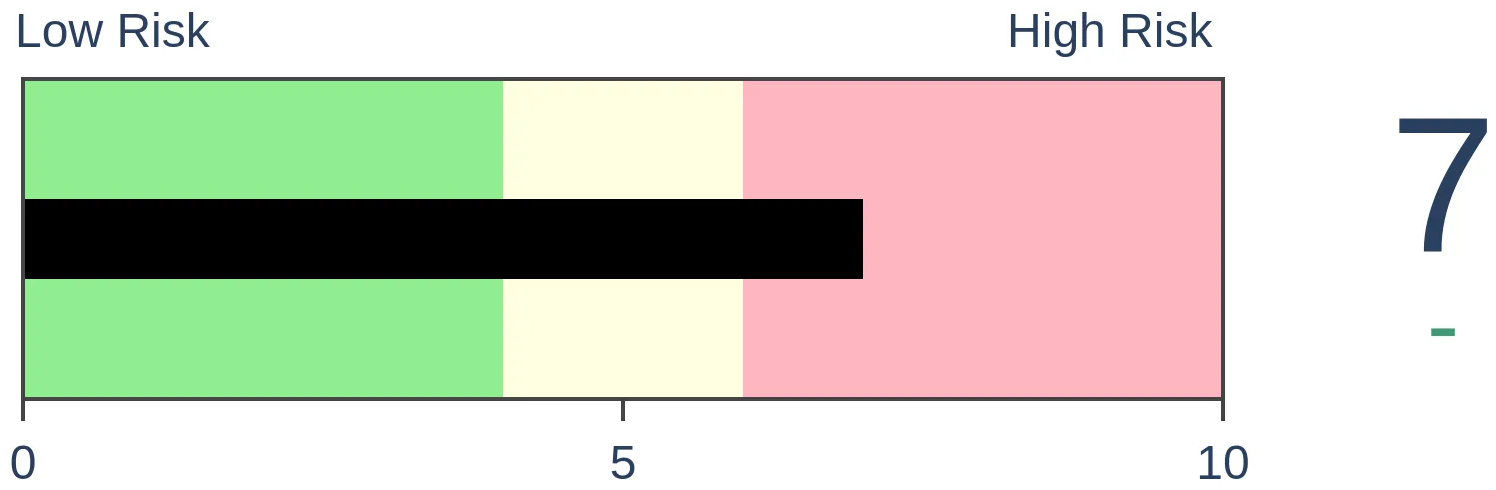
Stocks Short-Term
|
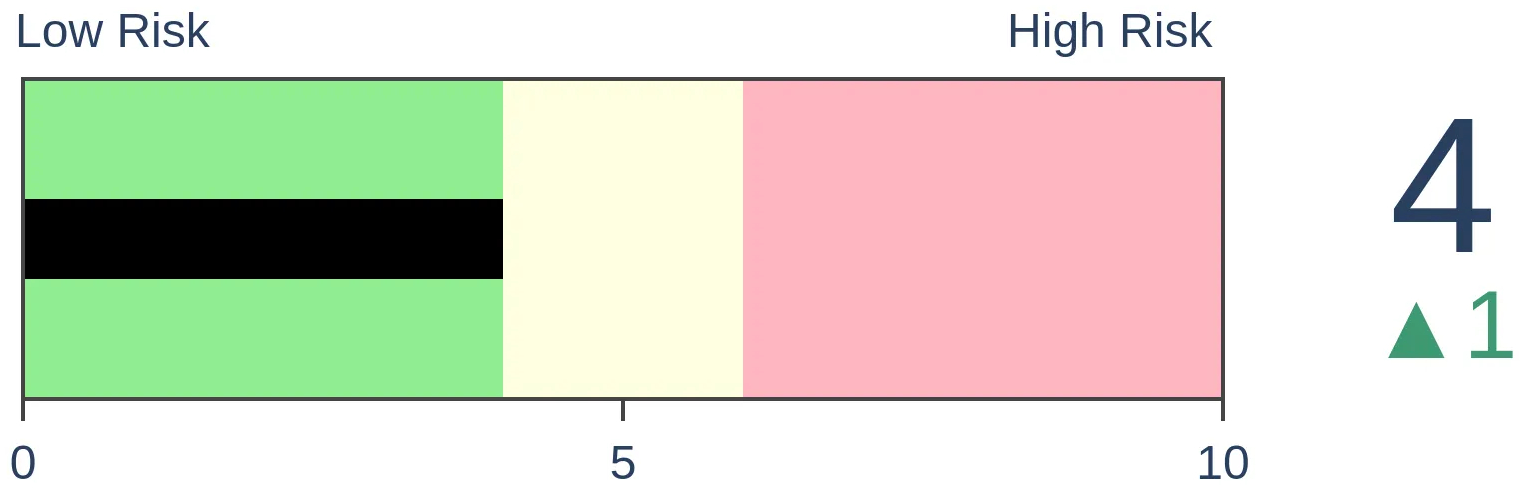
Stocks Medium-Term
|
|
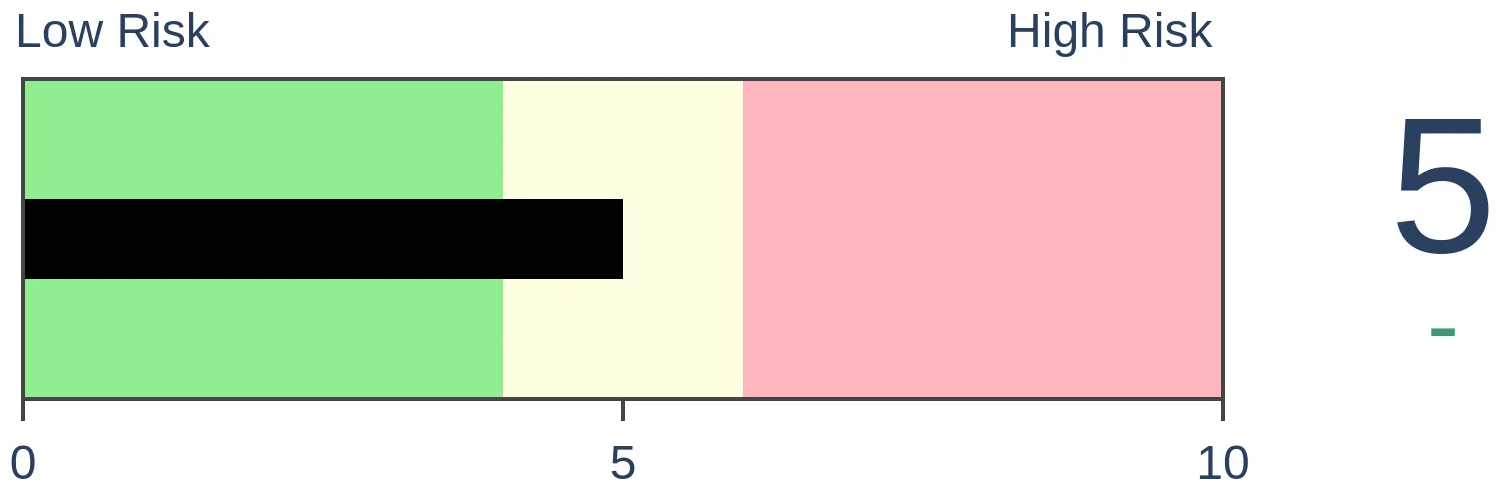
Bonds
|
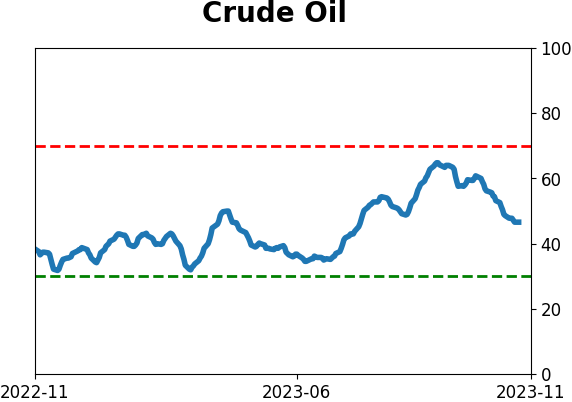
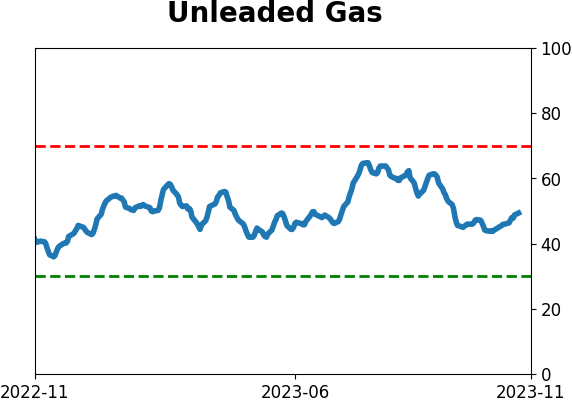
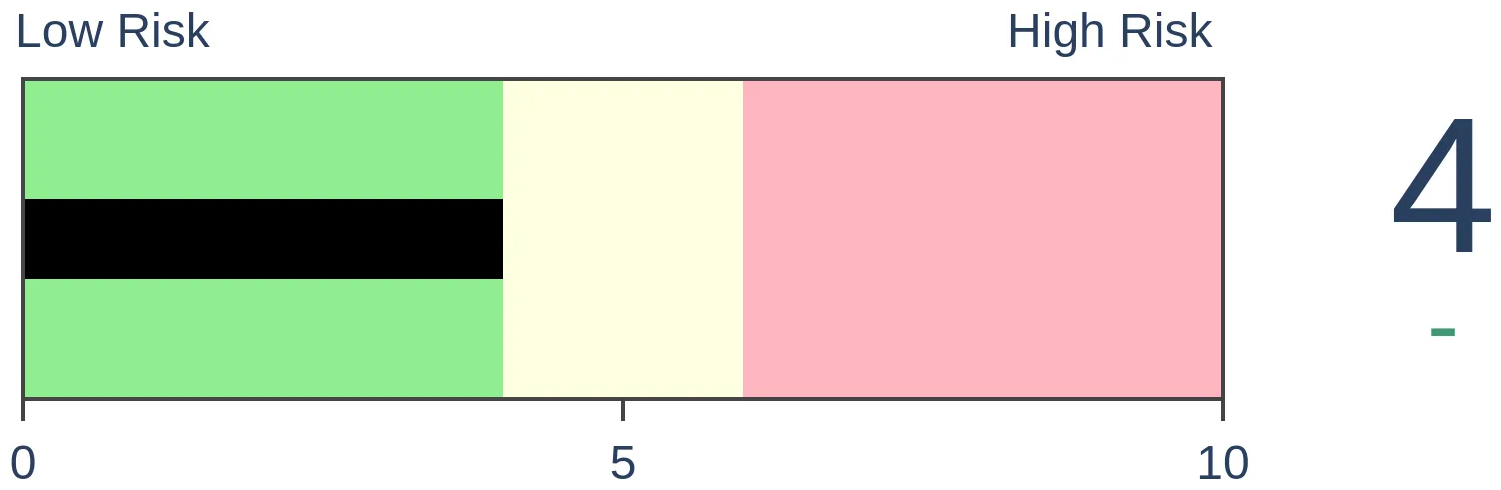
Crude Oil
|
|
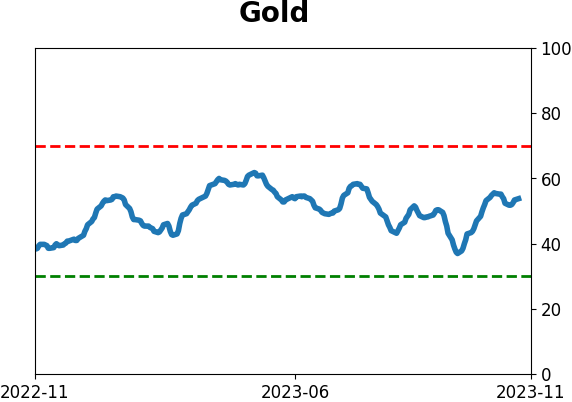
Gold
|
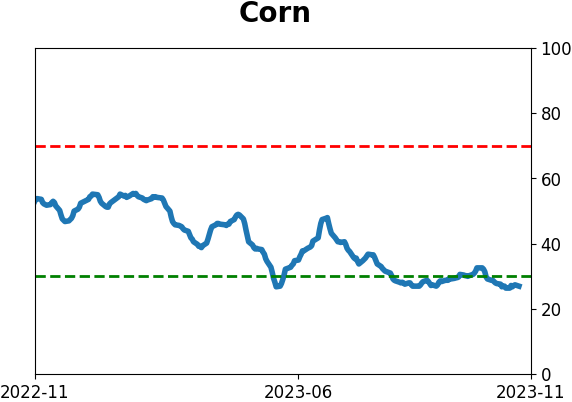
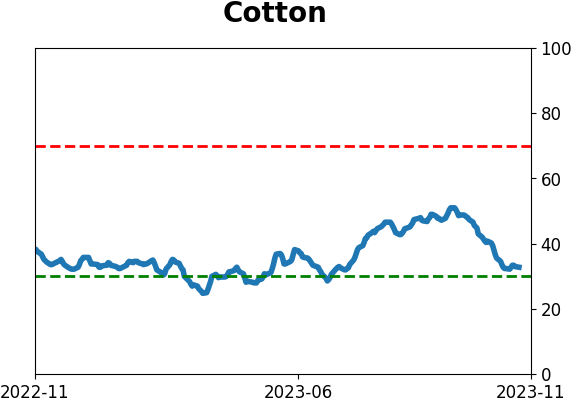
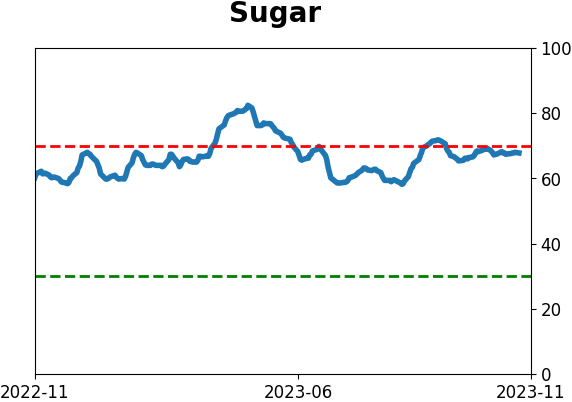
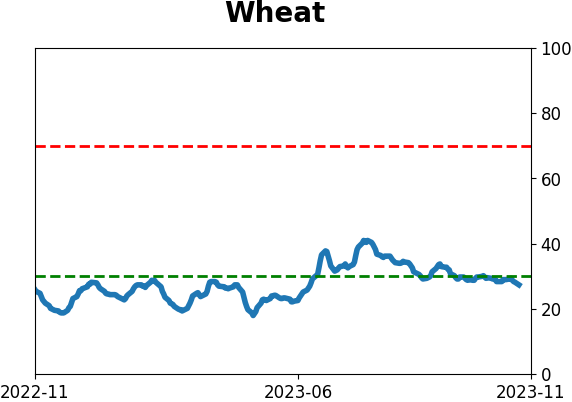
Agriculture

|
|
Research
By Dean Christians
BOTTOM LINE
A composite that contains ten trend-following indicators cycled from a bearish to a bullish status, triggering a buy signal with a 90% win rate over the subsequent six months for the world's most benchmarked index.
FORECAST / TIMEFRAME
None
|
Key points:
- A composite that contains ten trend-following indicators cycled from negative to positive
- Comparable reversals over the past 90 years preceded robust returns for the S&P 500
- Growth-oriented sectors consistently exhibit the highest composite trend scores
Trend-following indicators point toward a resumption of the uptrend
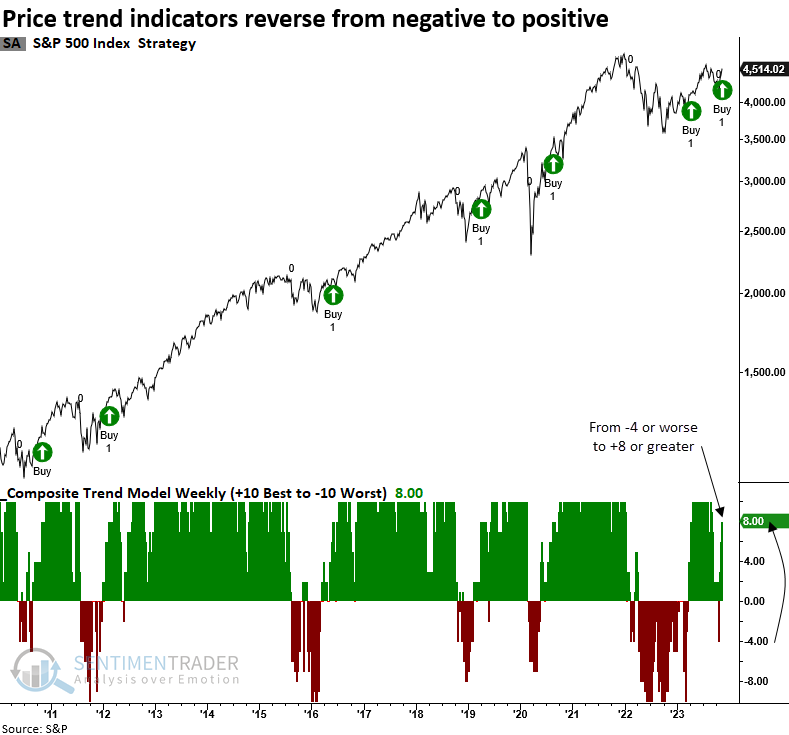
In April, I published a research note highlighting a bullish reversal for a composite that contains ten trend-following indicators. The shift in price trends provided a timely alert as the S&P 500 steadily rose over the following three months.
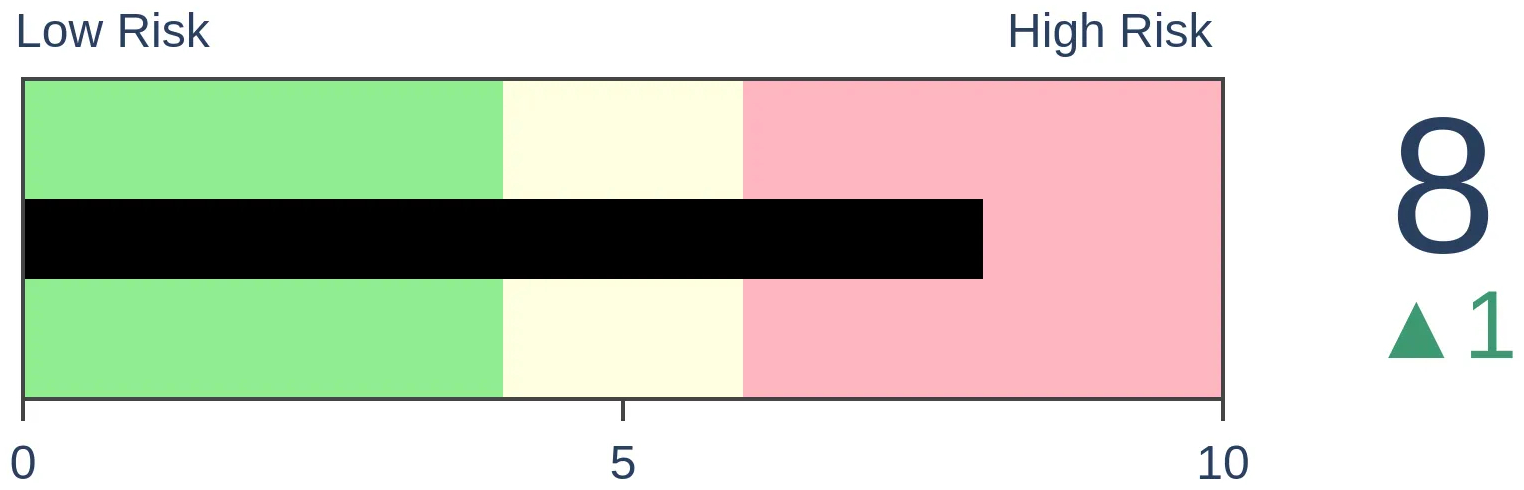
As the July to October drawdown persisted, the composite score steadily dropped, hitting the reset threshold at -4. However, since late October, the subsequent rebound in price trends propelled the trend score to +8, triggering a new buy signal.
The recent alignment of internal and external price trends paints an encouraging picture for the seasonally strong months of November and December.
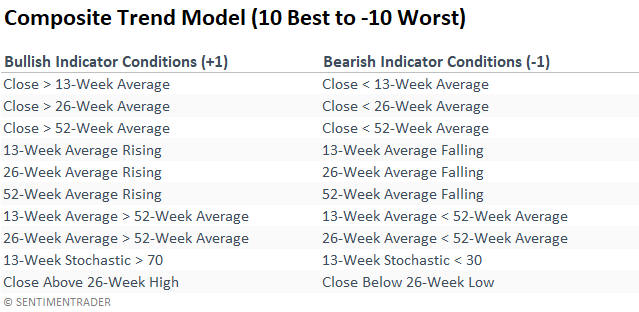
How I construct the weekly composite trend model
The composite assigns an individual score of +1 or -1 to each component in the model based on the following conditions.
Similar reversals preceded outstanding results
When the composite trend model cycled from -4 or worse to +8 or better, the S&P 500 rose 90% of the time over the subsequent six months.
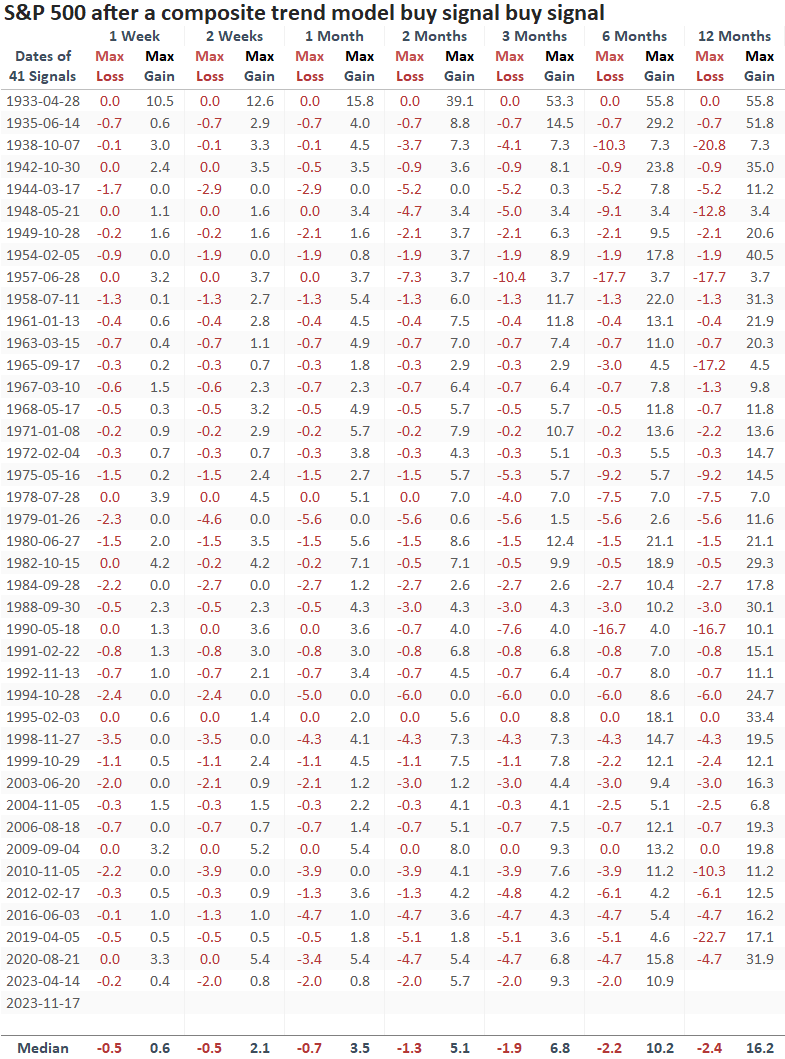
The previous signal in April saw the S&P 500 struggle in the first month, with a max loss of -2%. Sometimes, a trend change shift leads to a short-term pause. However, that precedent recovered nicely, with a max gain of 10.9% over the following six months.
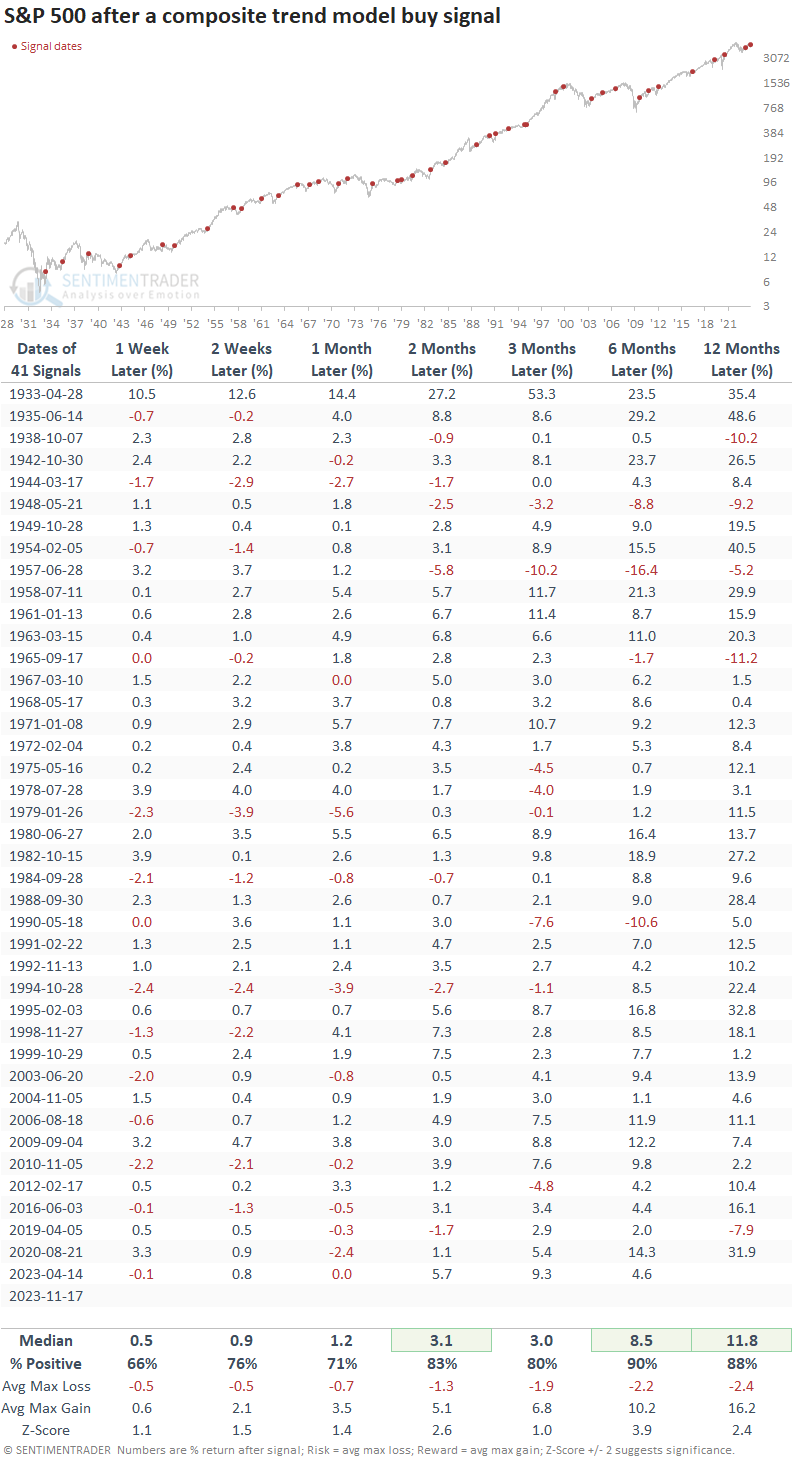
The skew between the median max gain and loss overwhelmingly favors the bullish case across all time frames, and the number of 10%+ drawdowns over the subsequent six and twelve months was minimal, with only three and seven precedents.
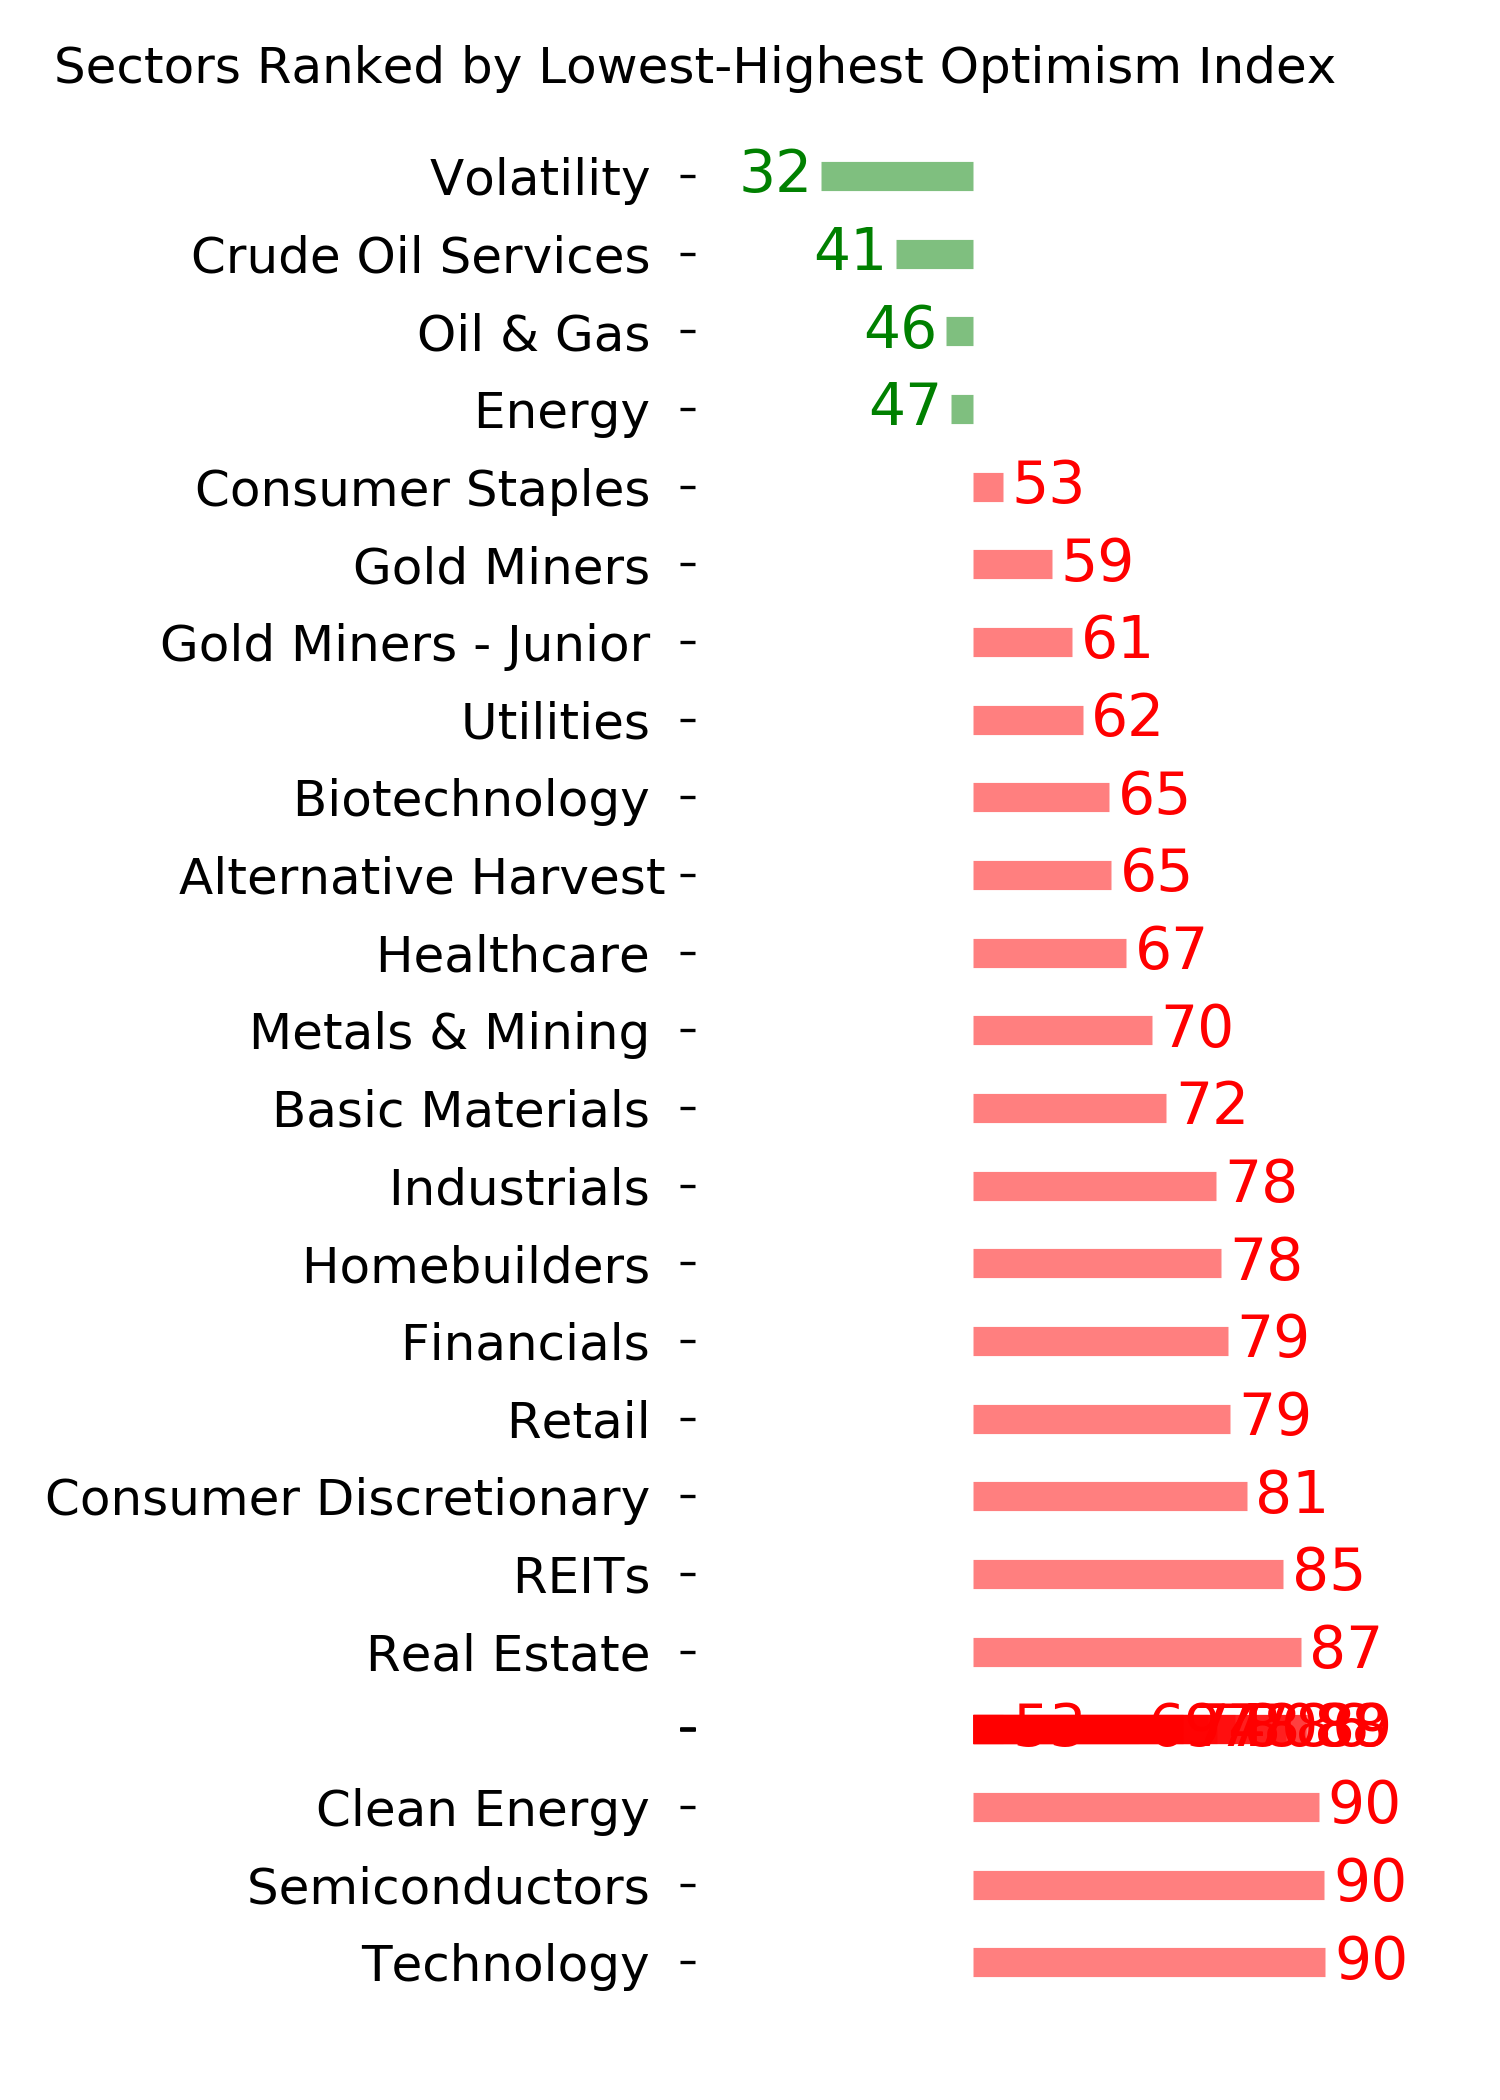
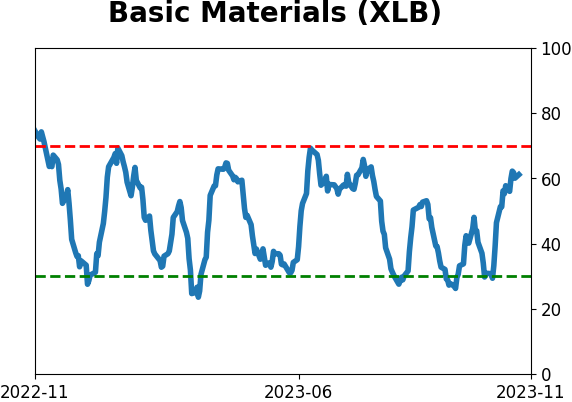
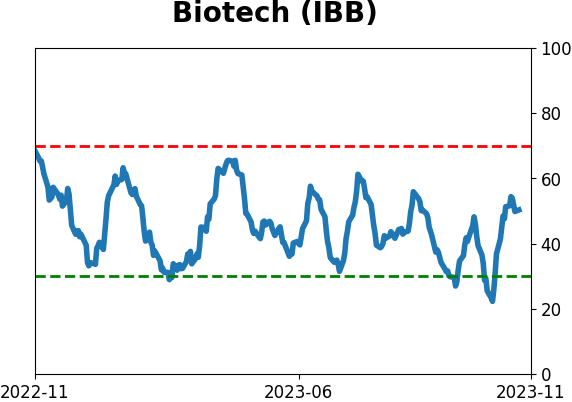
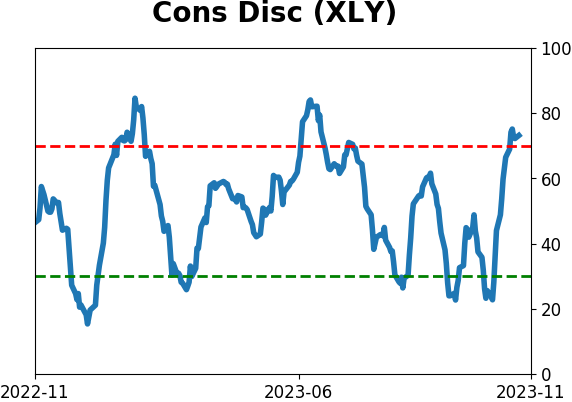
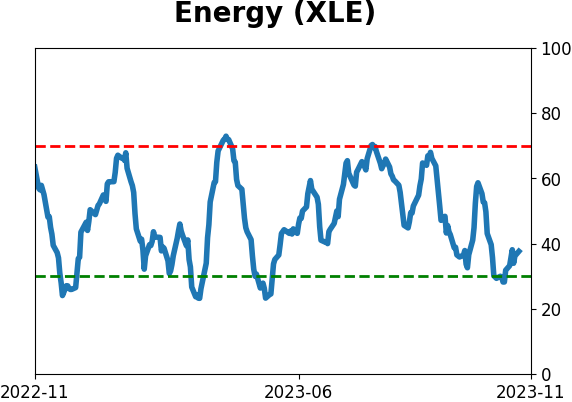
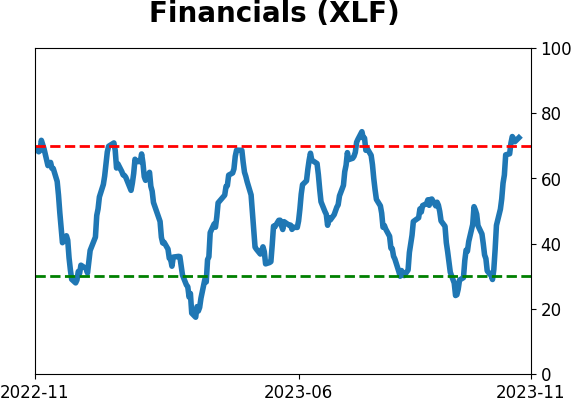
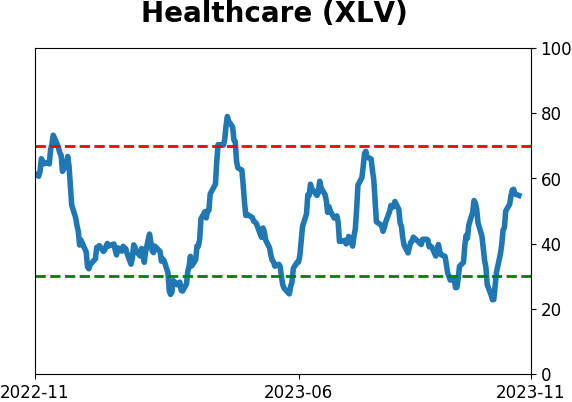
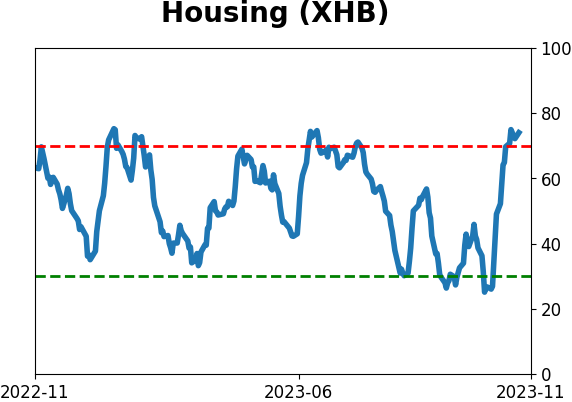
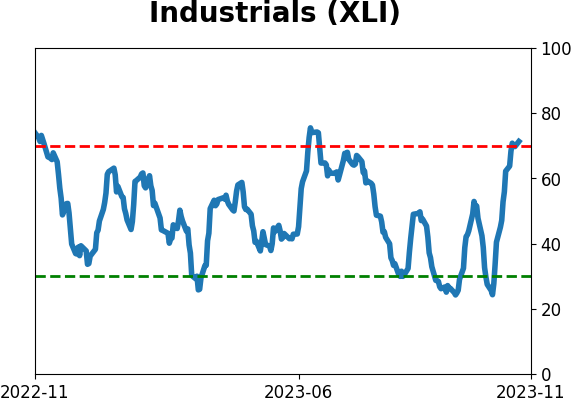
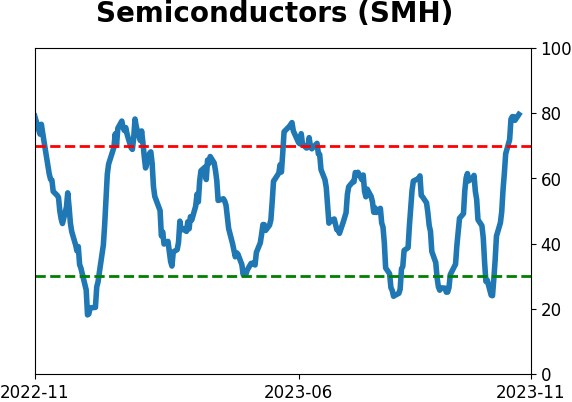
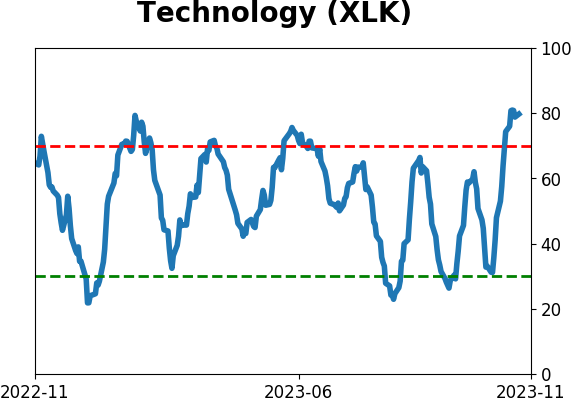
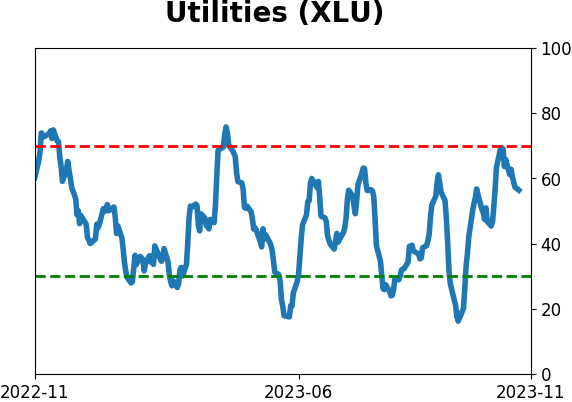
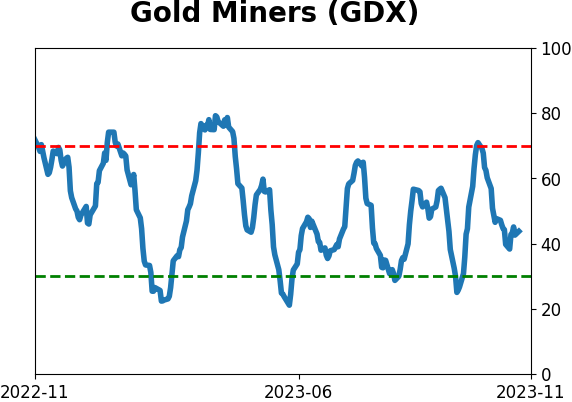
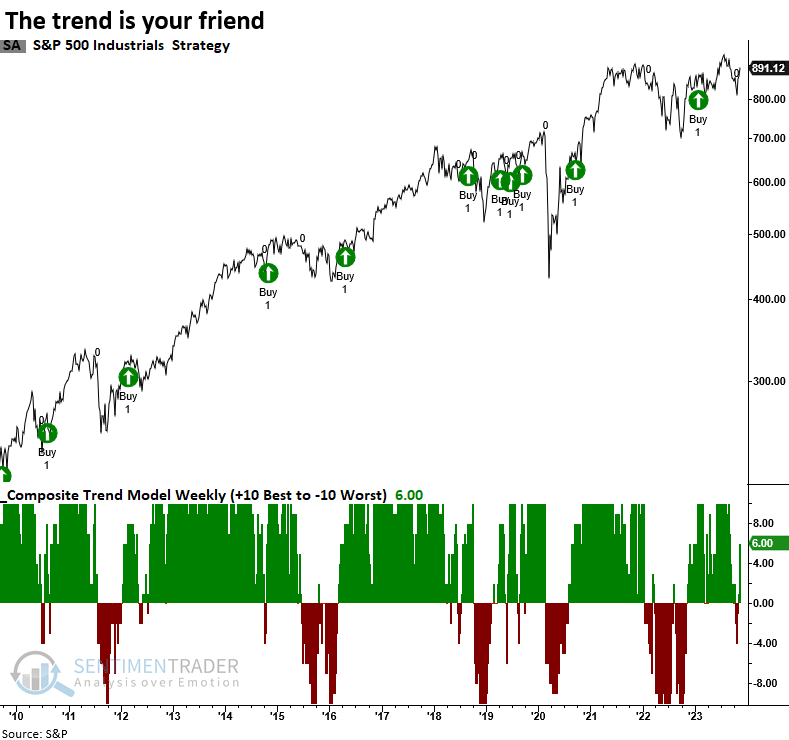
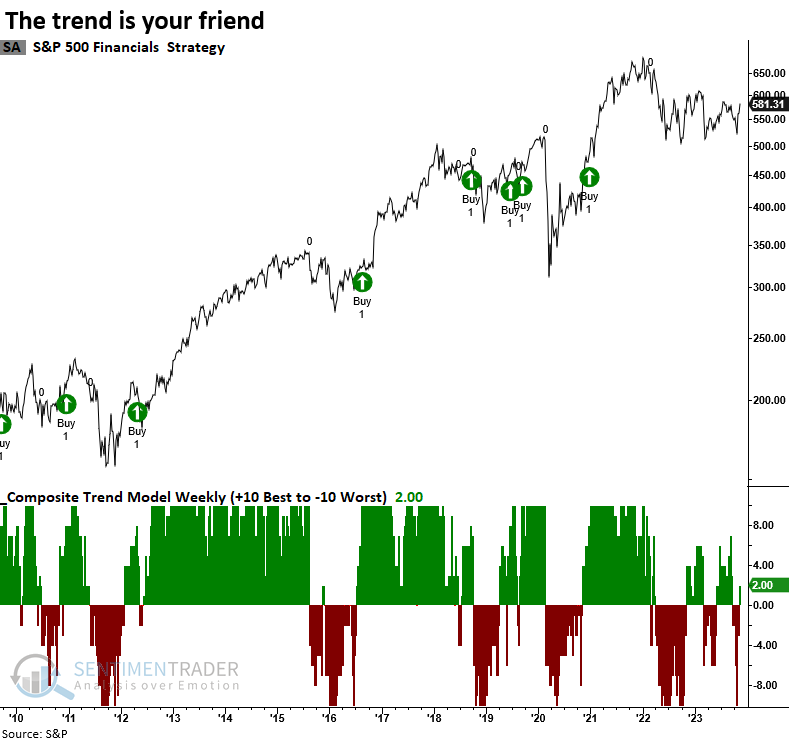
Sector trend scores
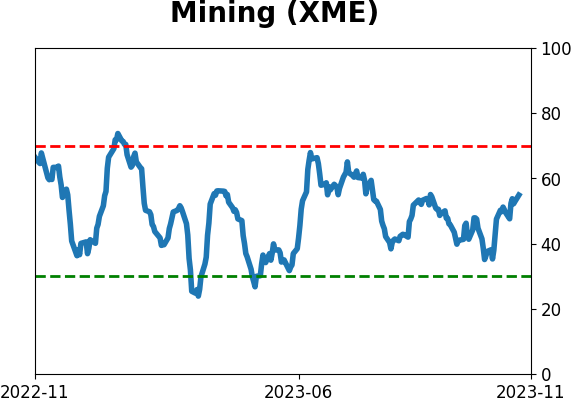
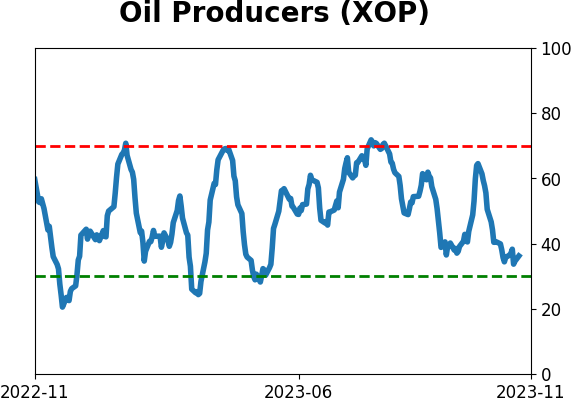
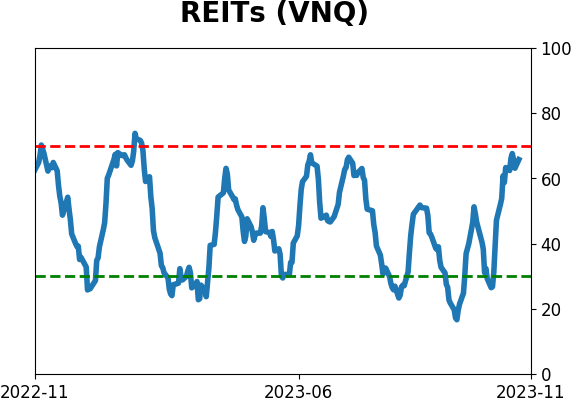
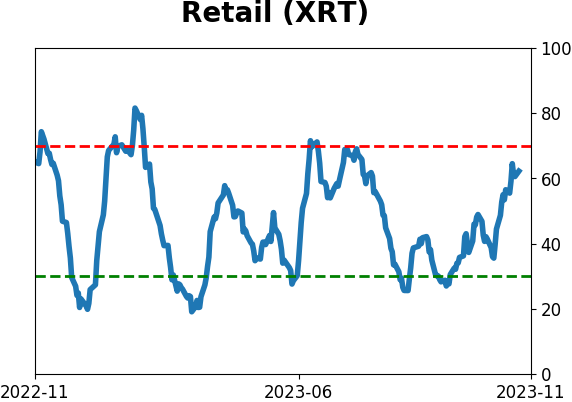
Trend scores for S&P 500 sectors overwhelming favor growth-oriented groups. In contrast, defensive and commodity-related sectors suggest a less favorable trend backdrop.
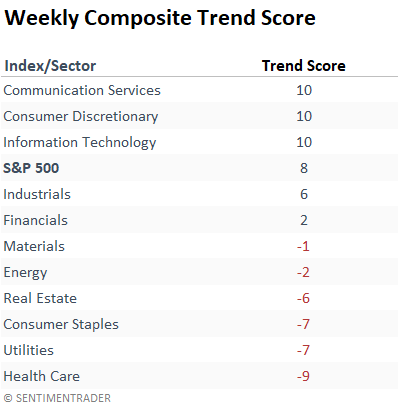
Charts for sectors with positive trend scores
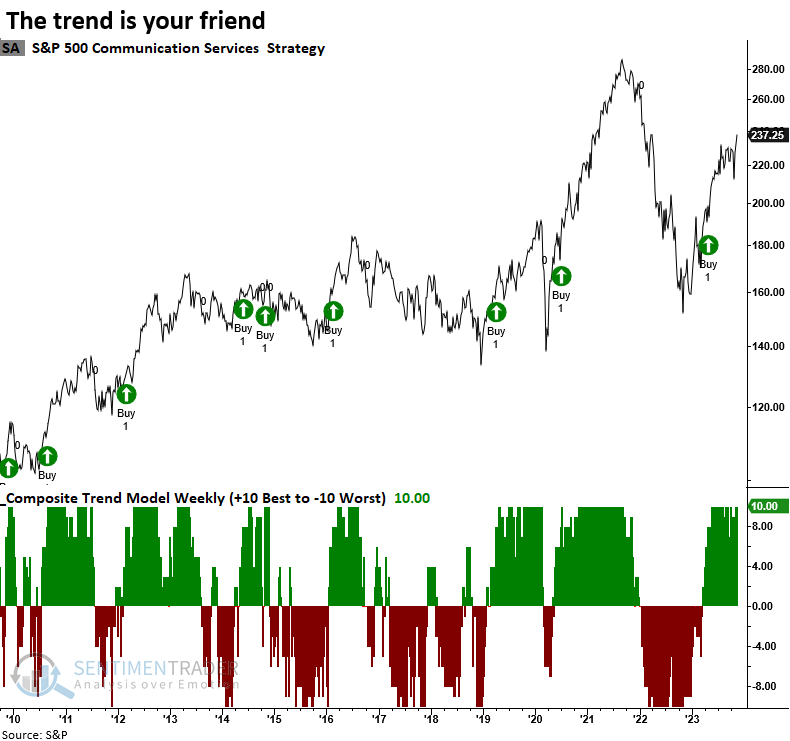
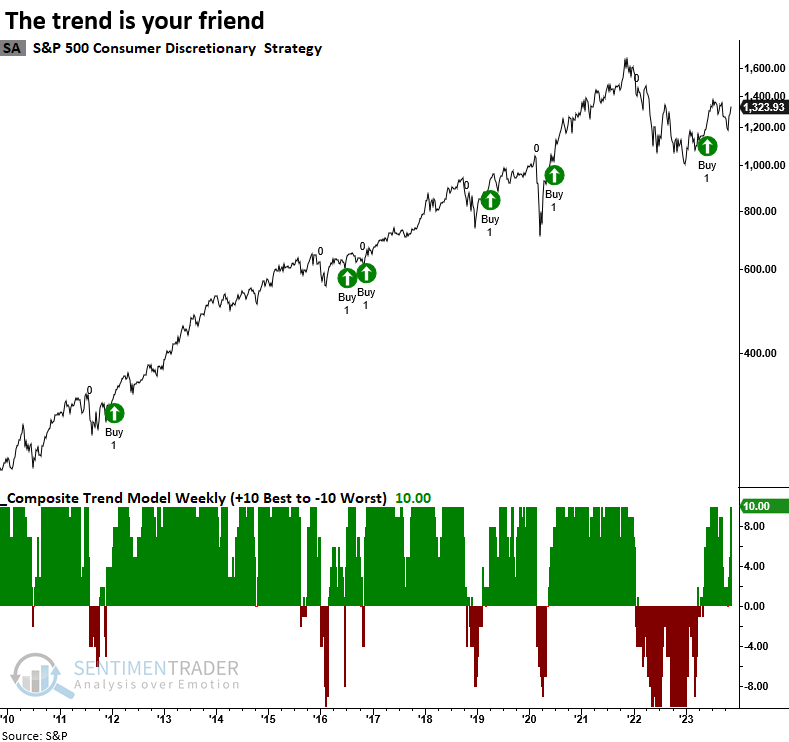
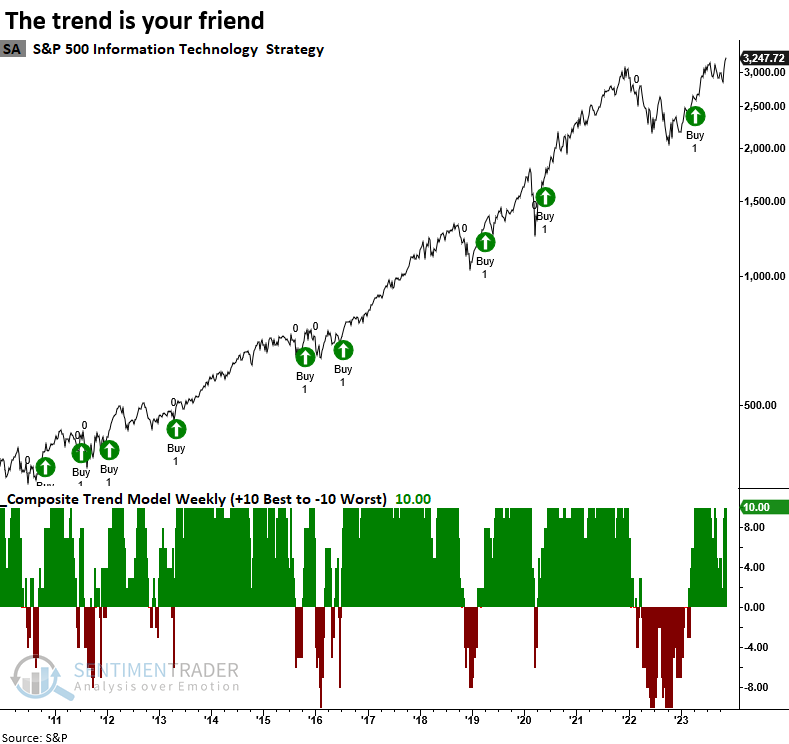
What the research tells us...
A composite trend model for the S&P 500 reversed from negative to positive, triggering a buy signal for the world's most benchmarked index. Similar signals saw the S&P 500 rise 90% of the time over the following six months, including the most recent alert from April. Analyzing trend scores for sectors suggests a more favorable environment for growth-oriented groups.
Indicators at Extremes
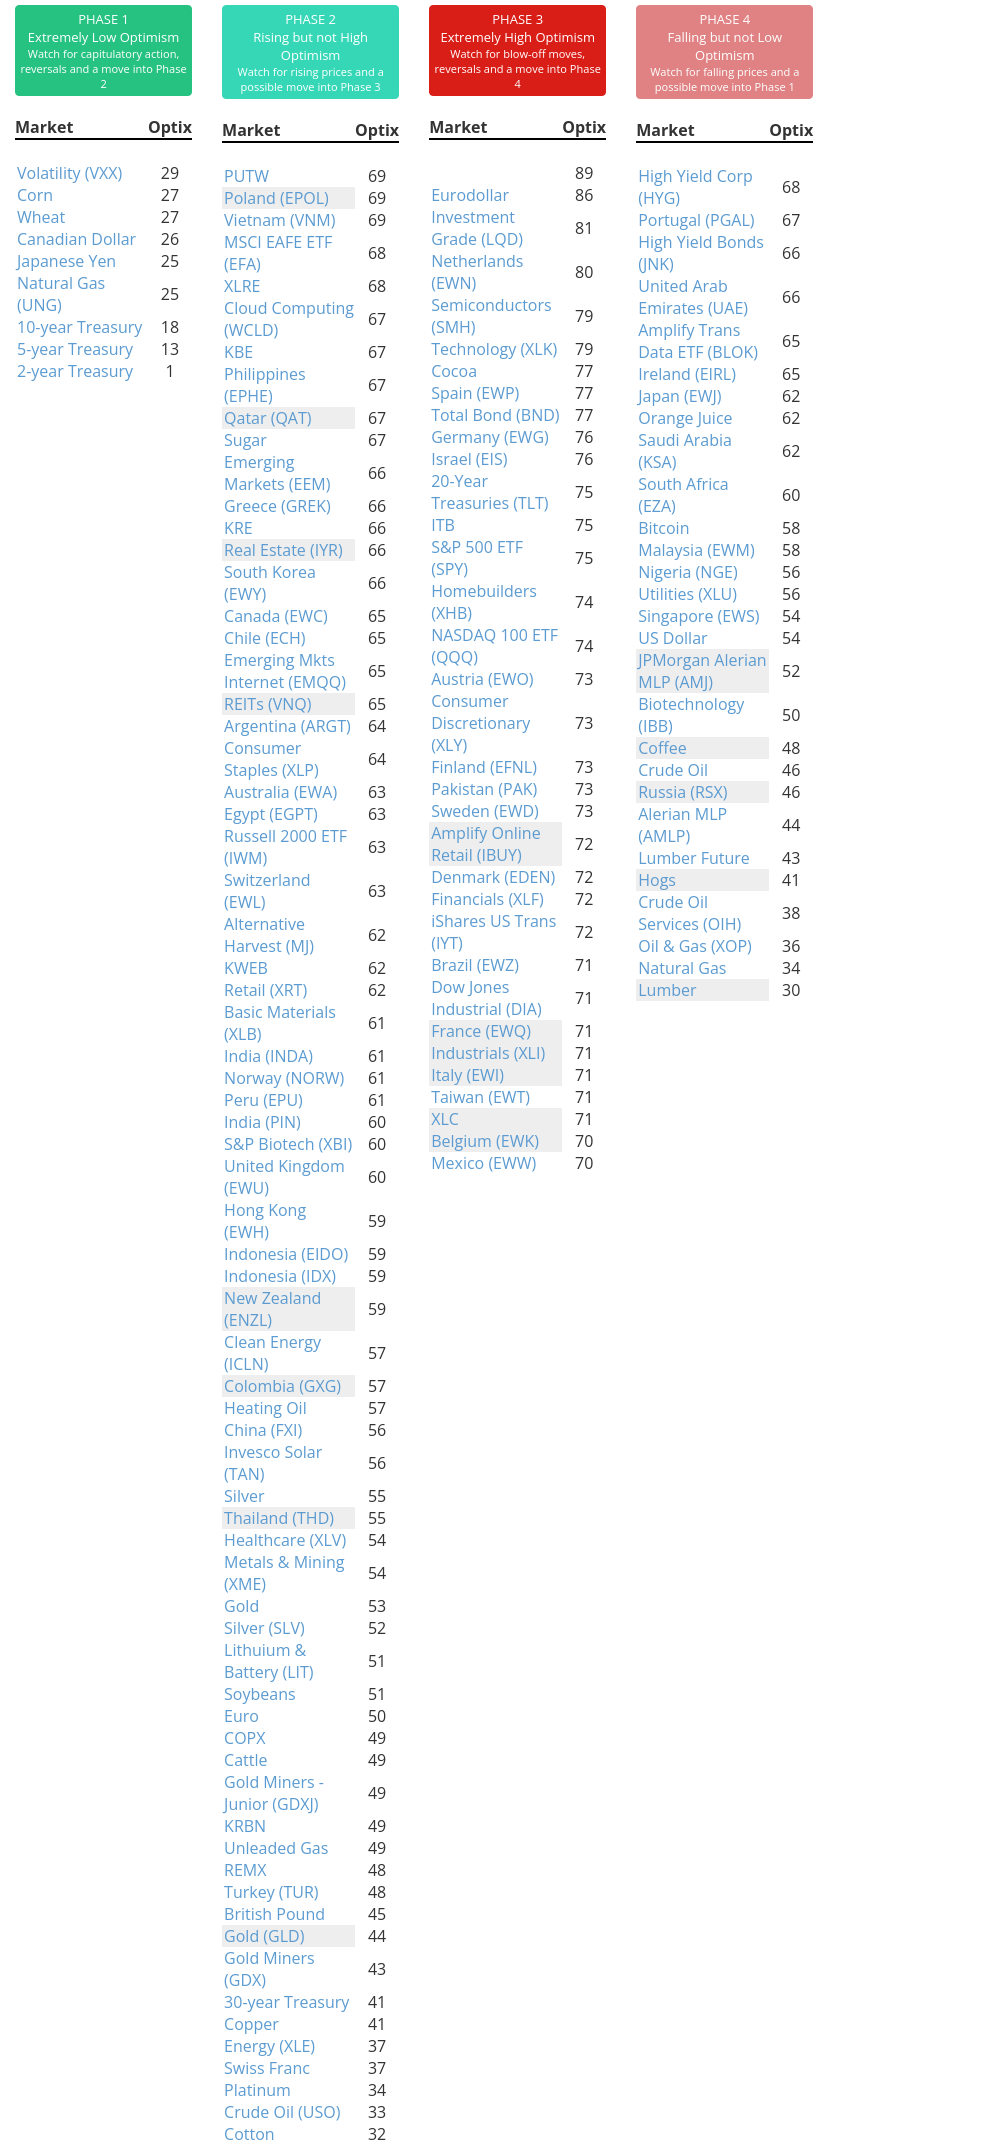
Phase Table
Ranks
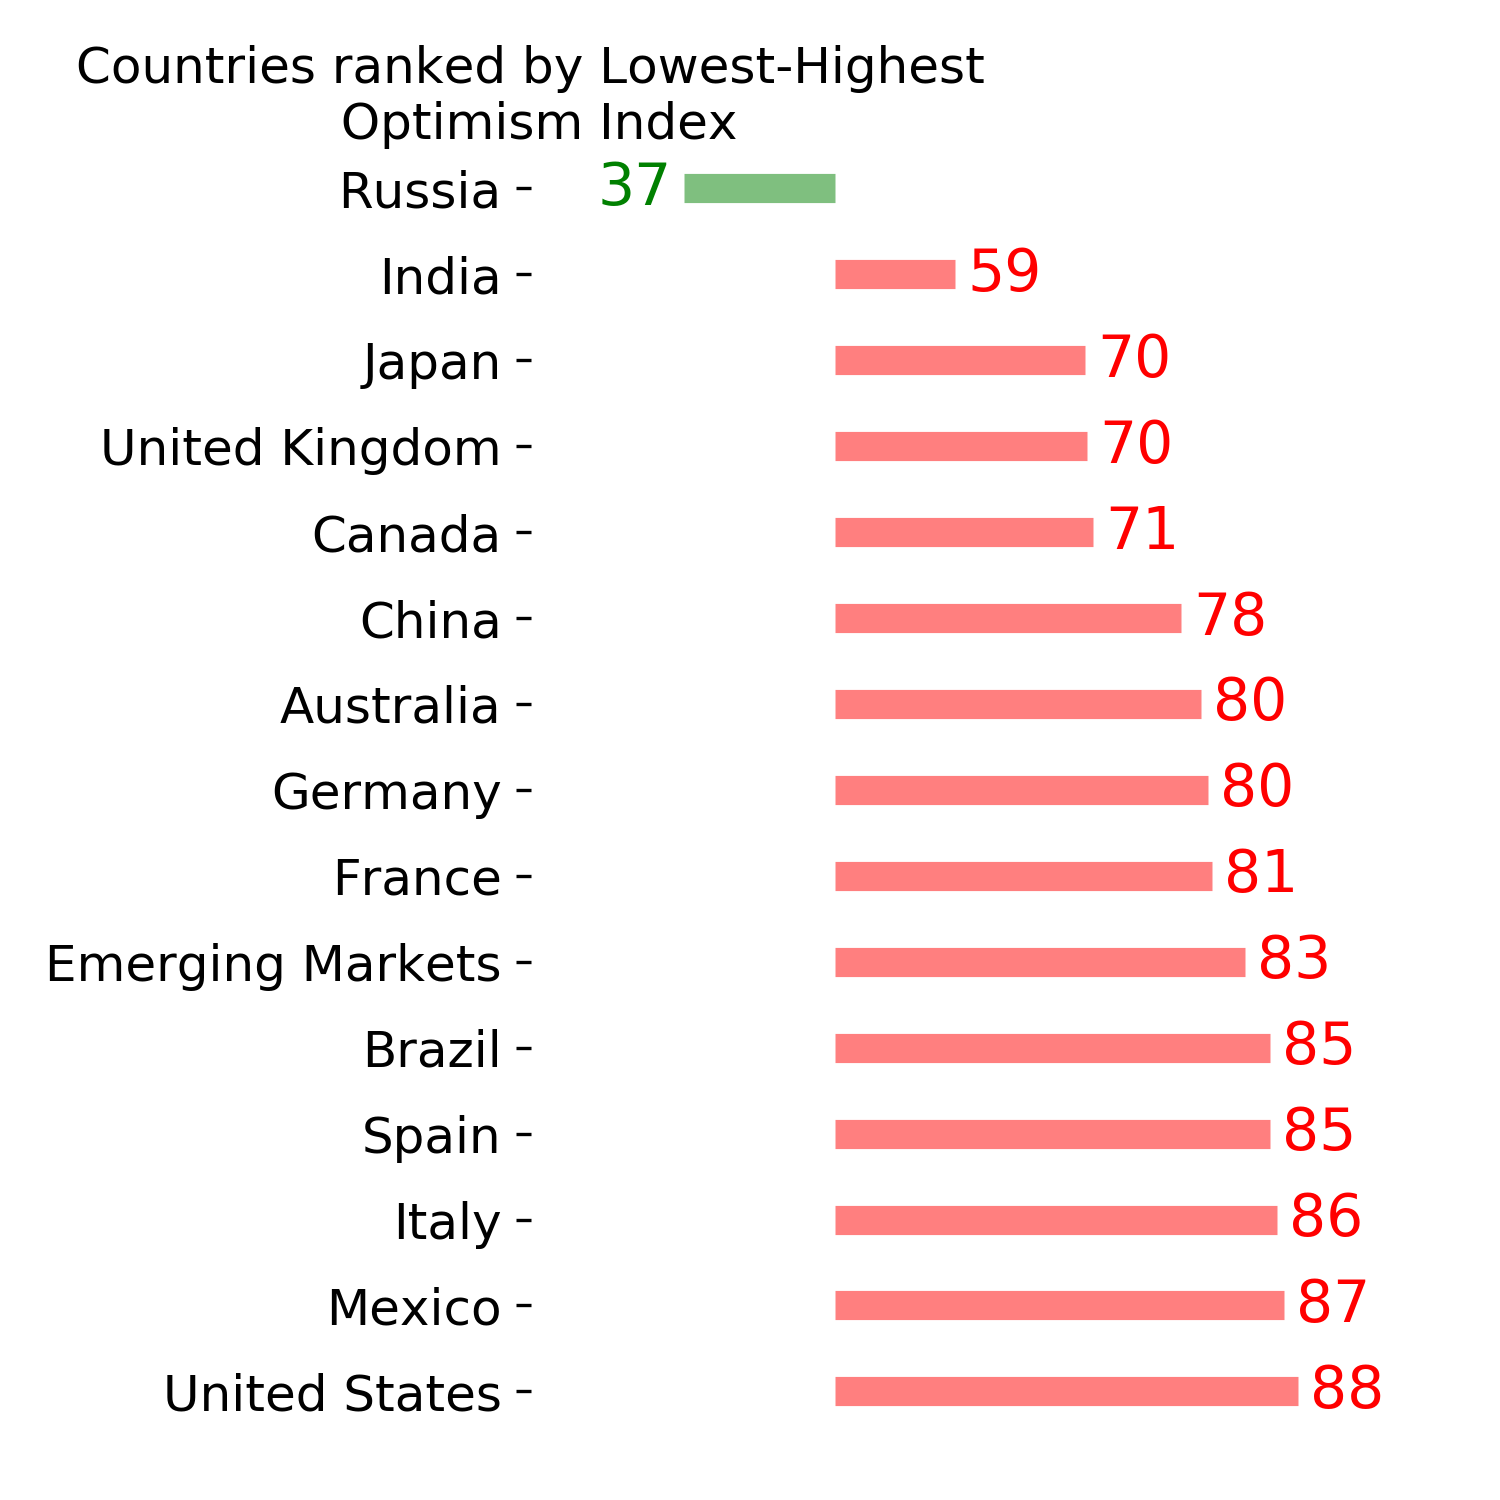
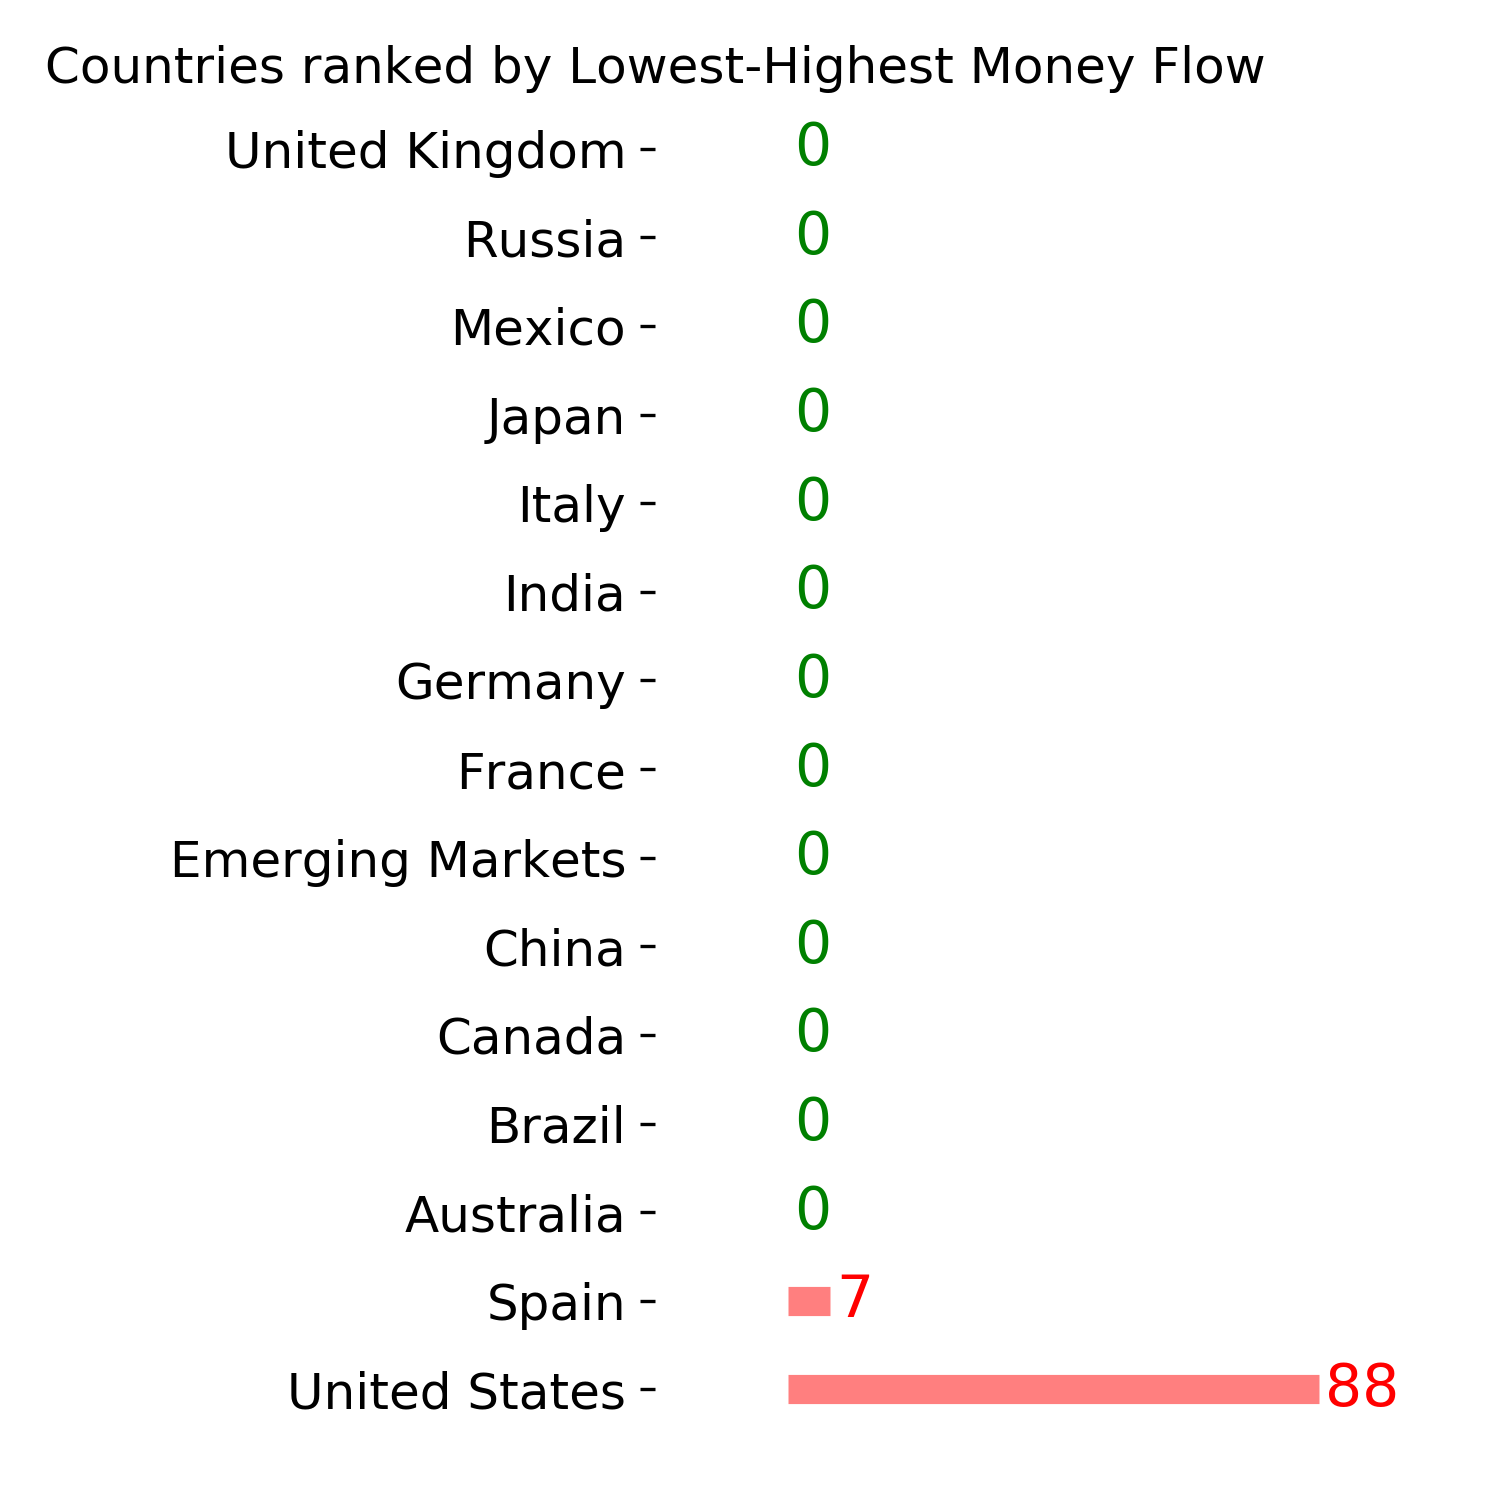
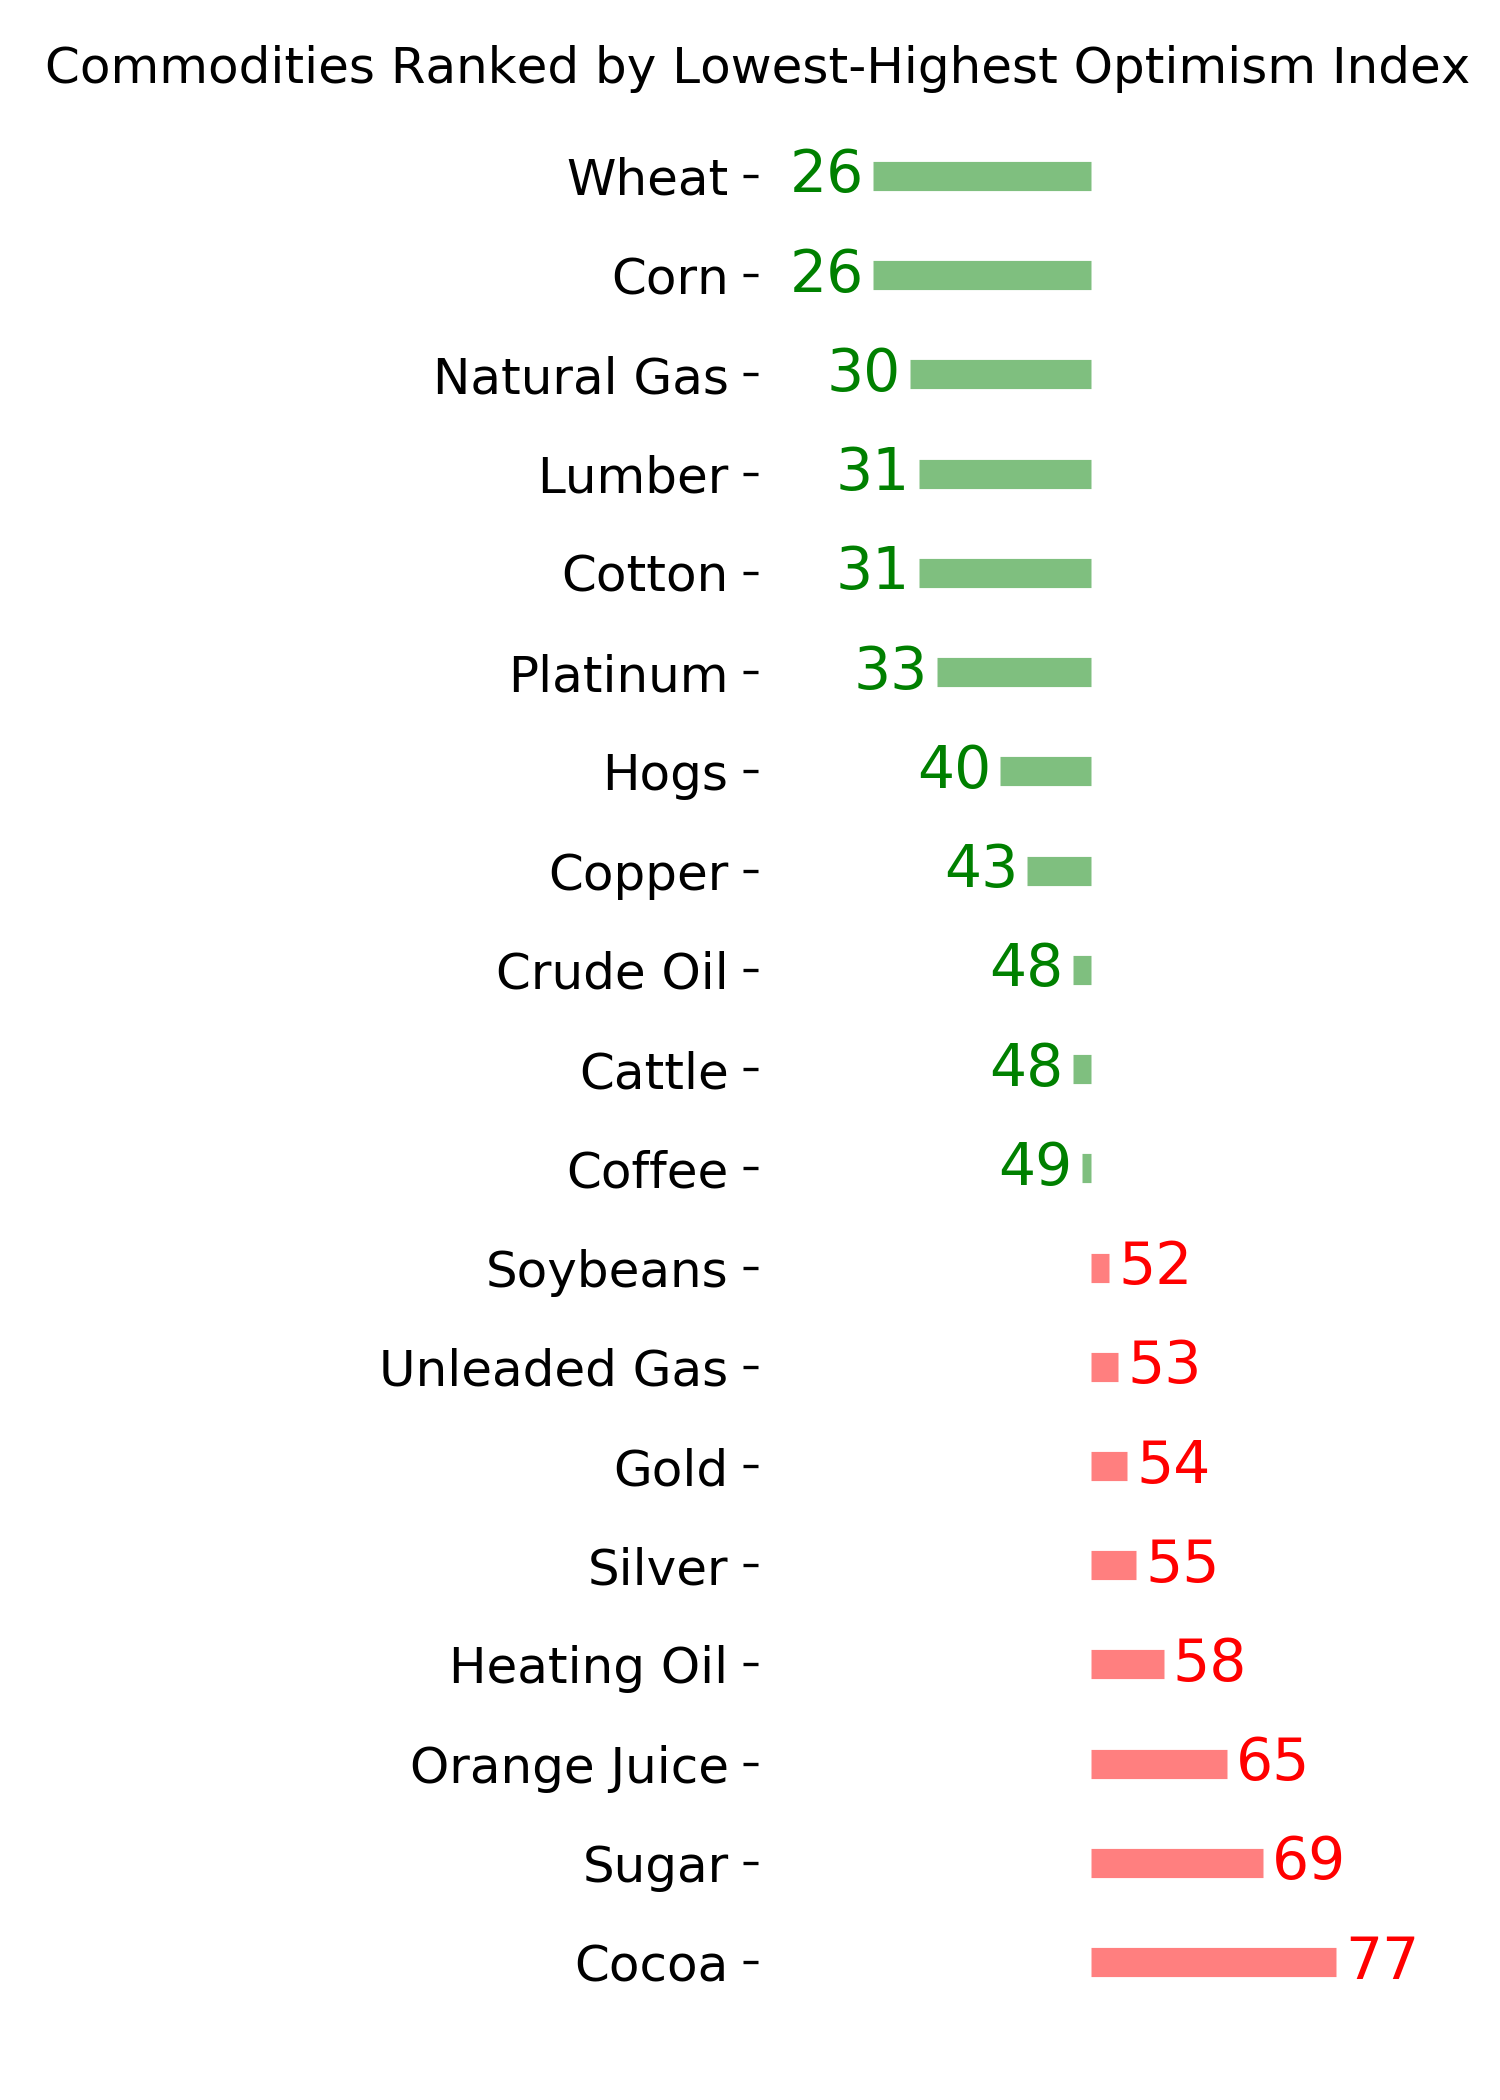
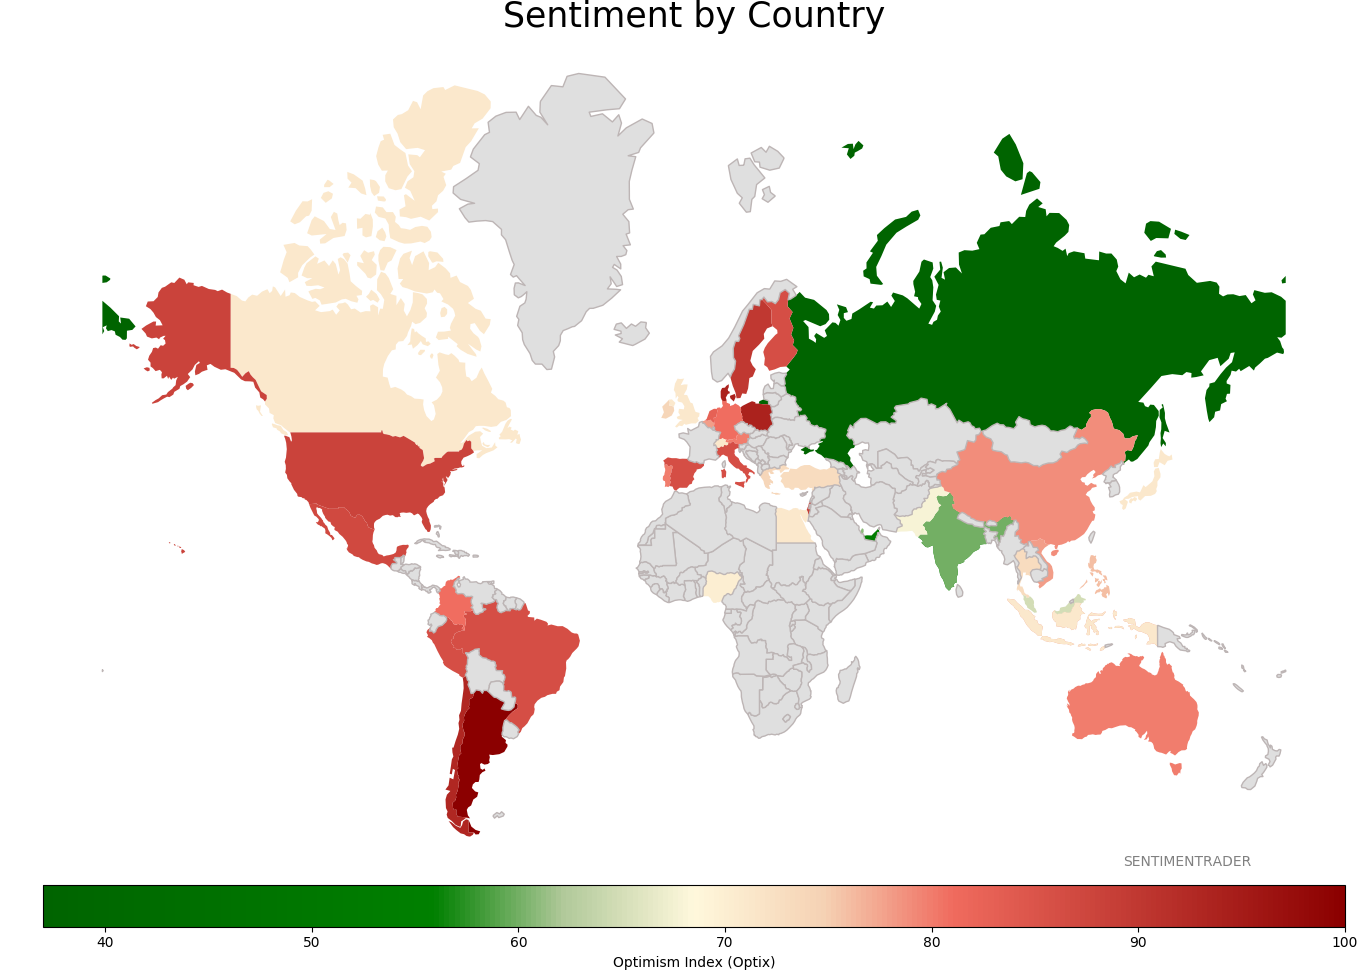
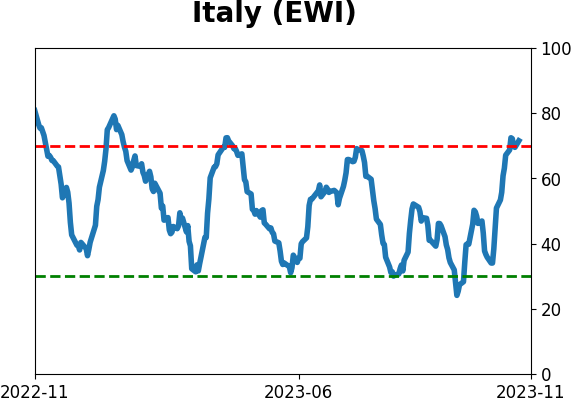
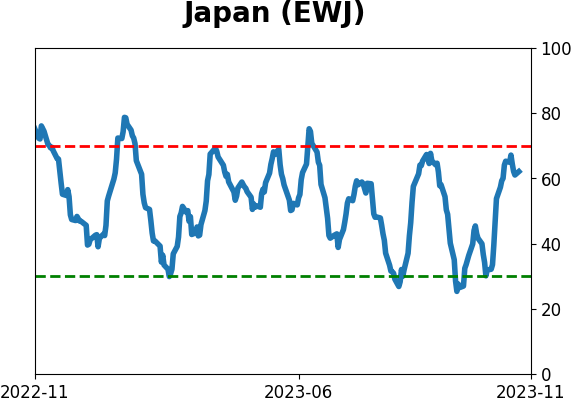
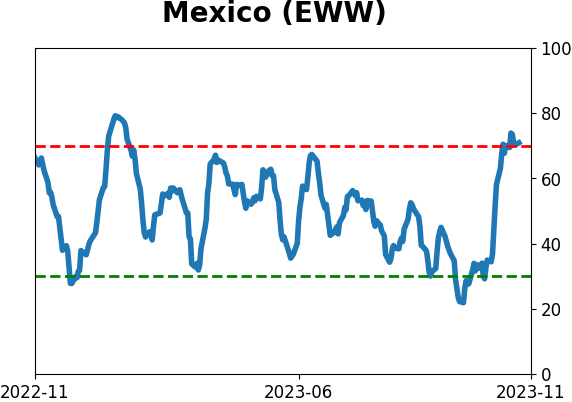
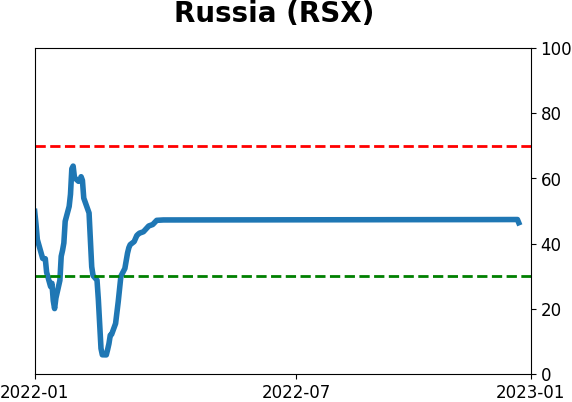
Sentiment Around The World
Optimism Index Thumbnails
|
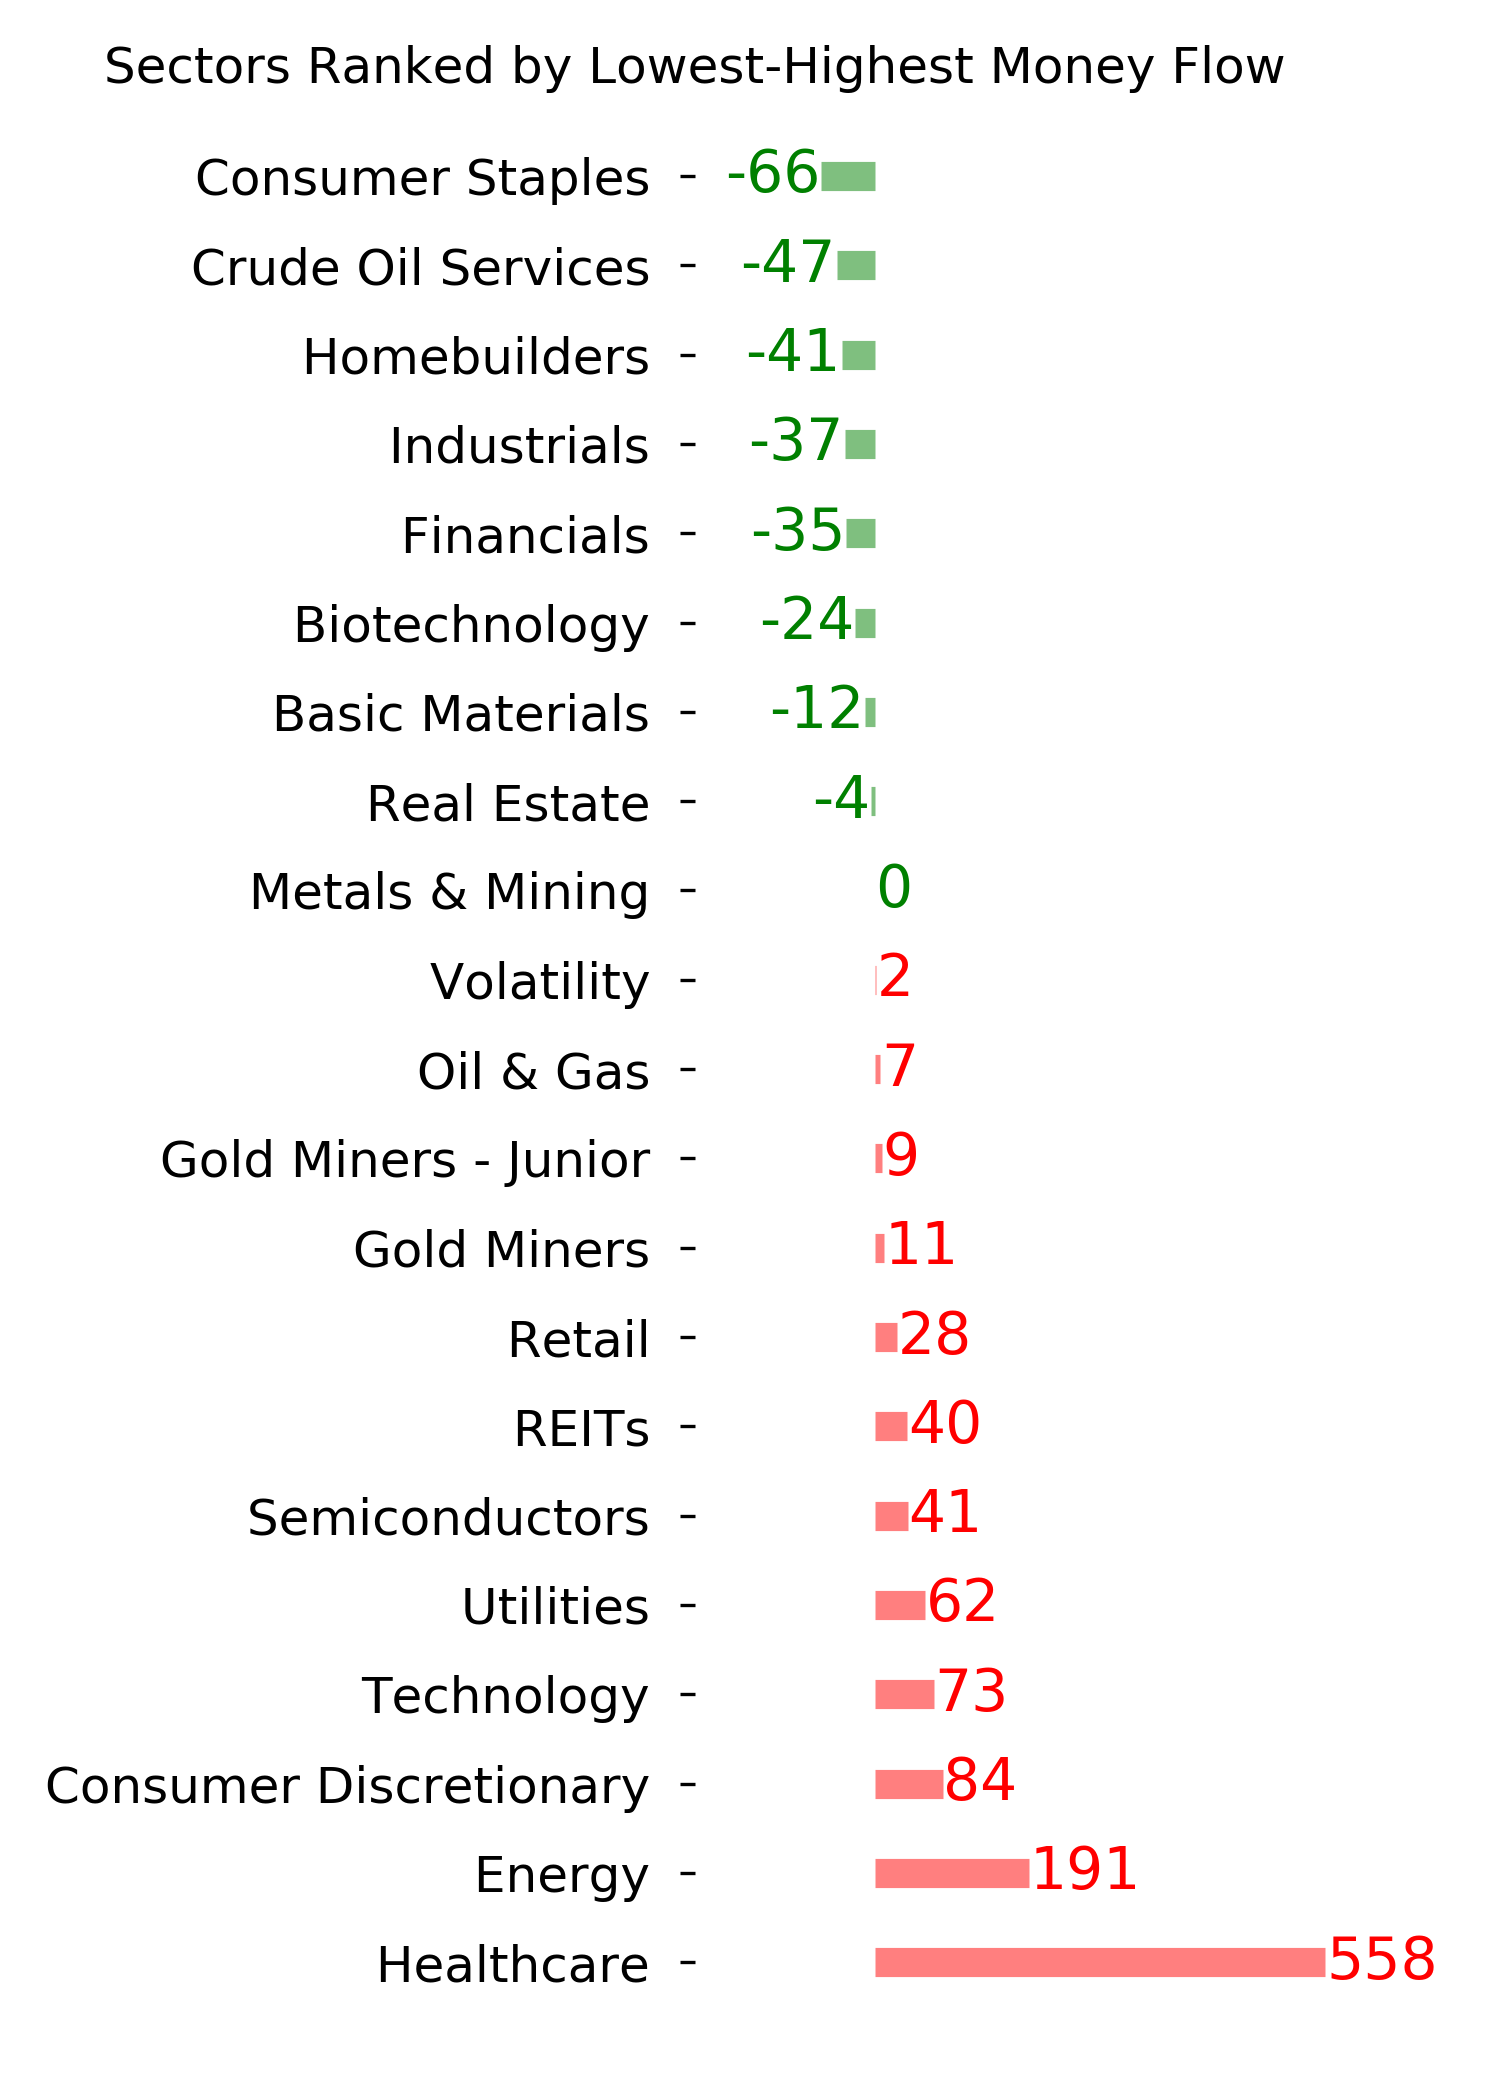
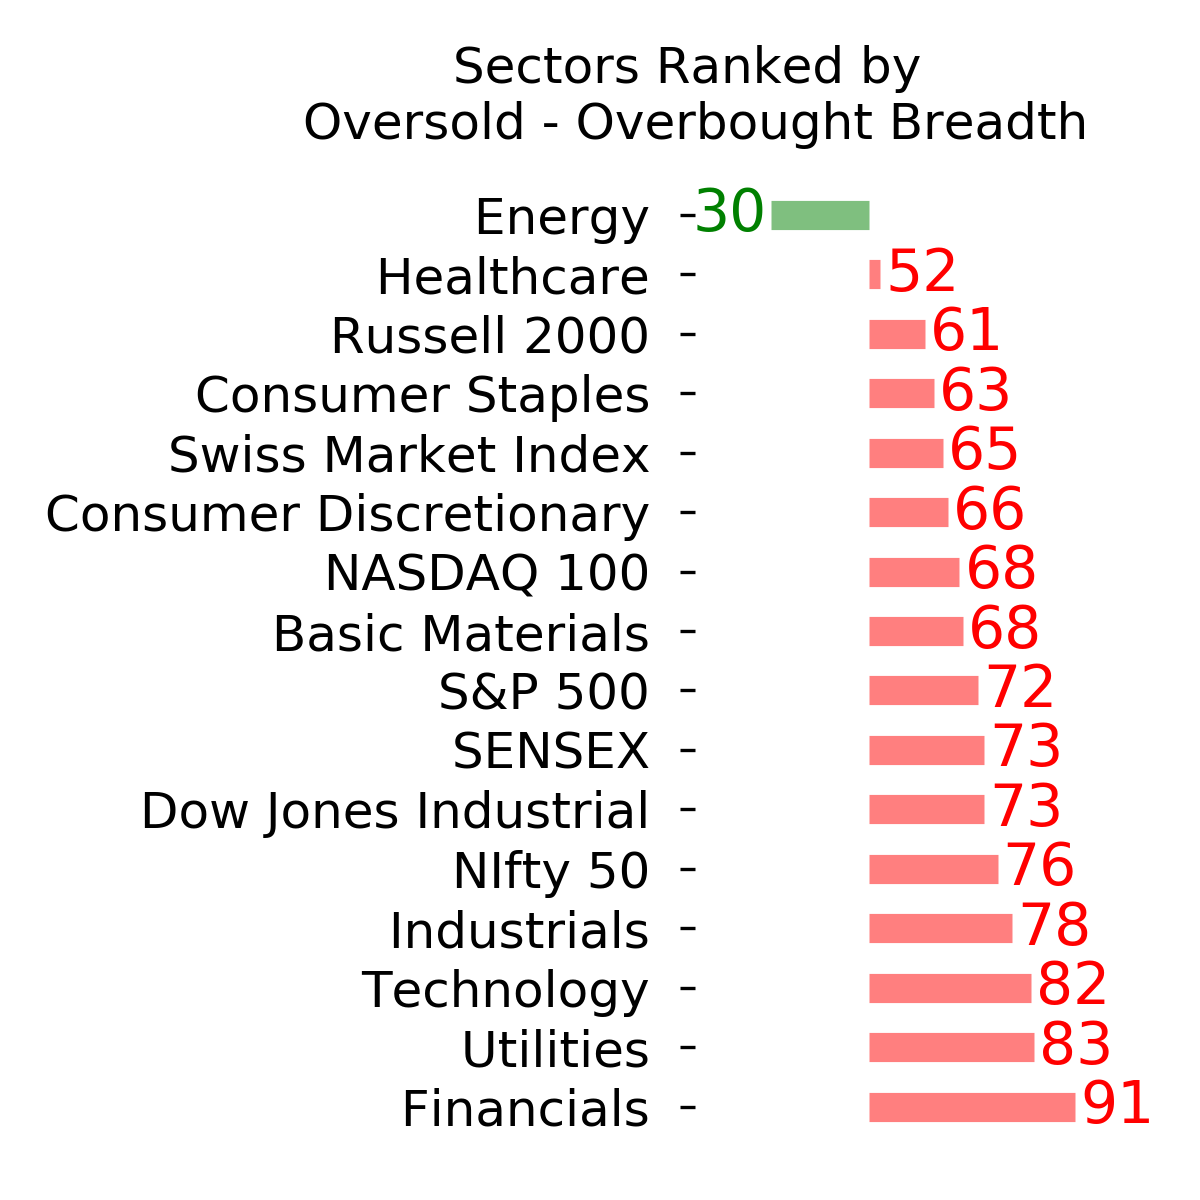
Sector ETF's - 10-Day Moving Average
|
|
|
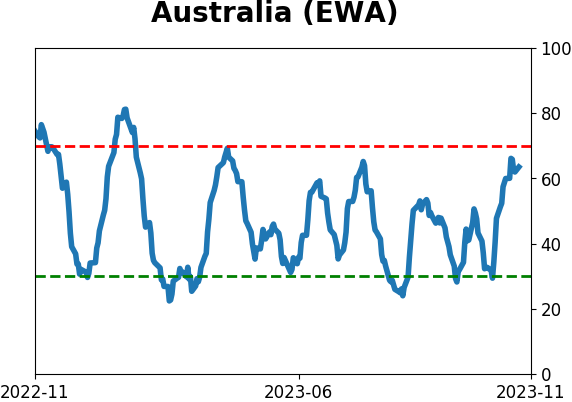
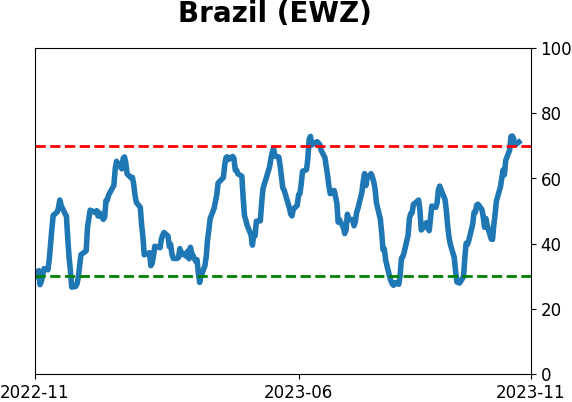
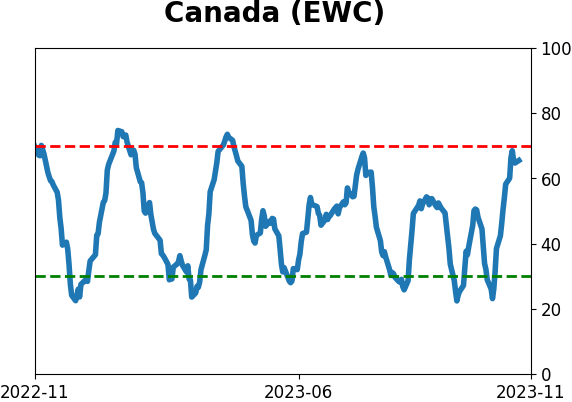
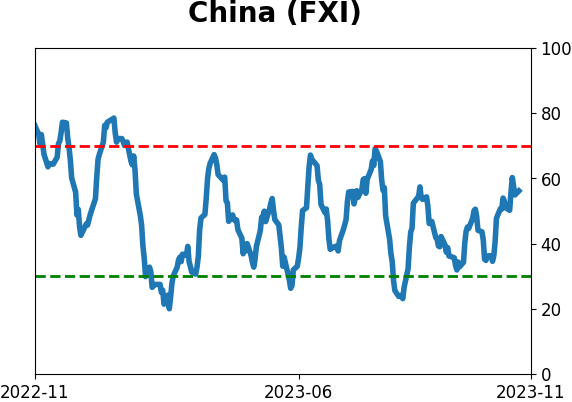
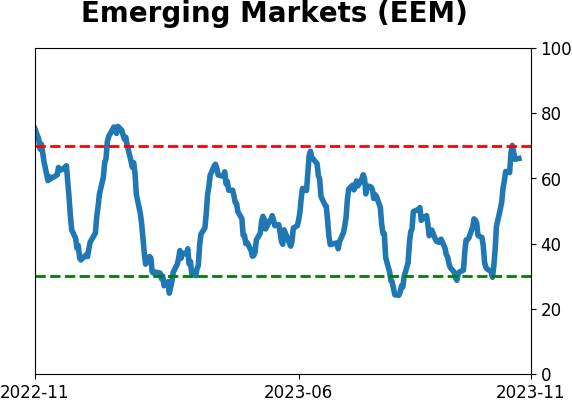
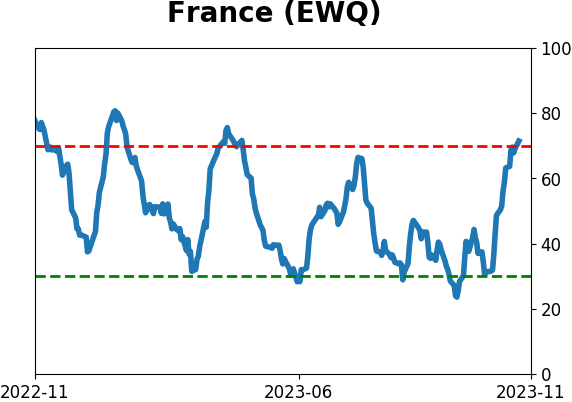
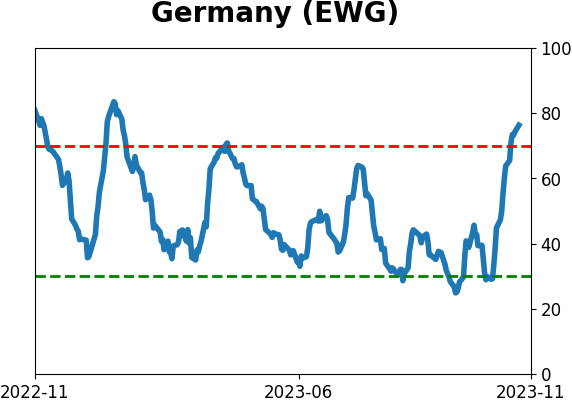
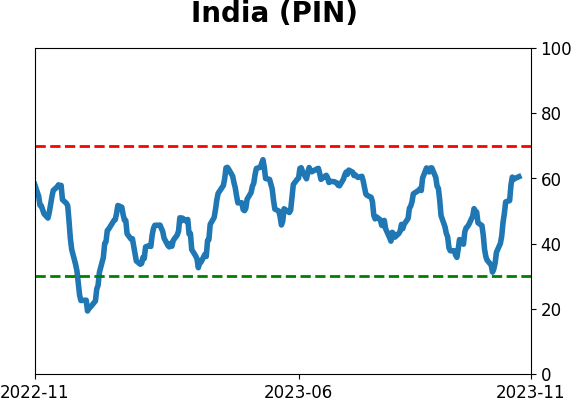
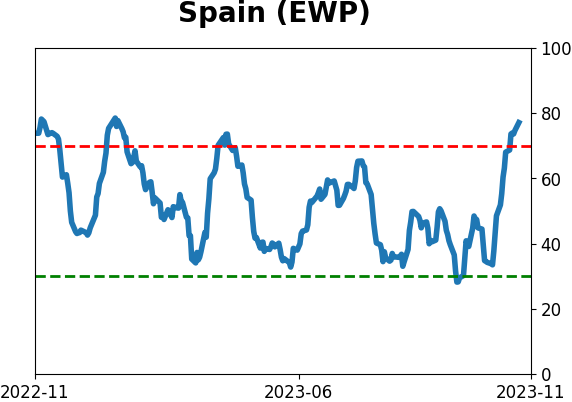
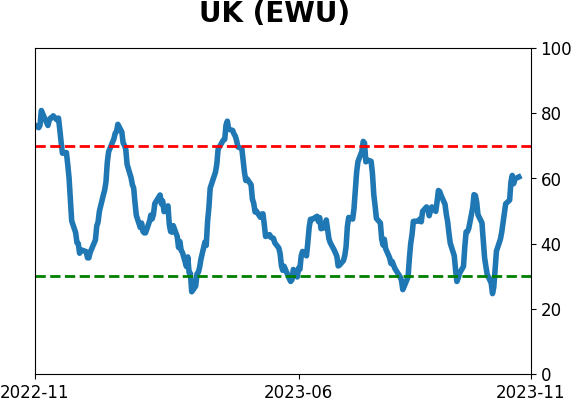
Country ETF's - 10-Day Moving Average
|
|
|
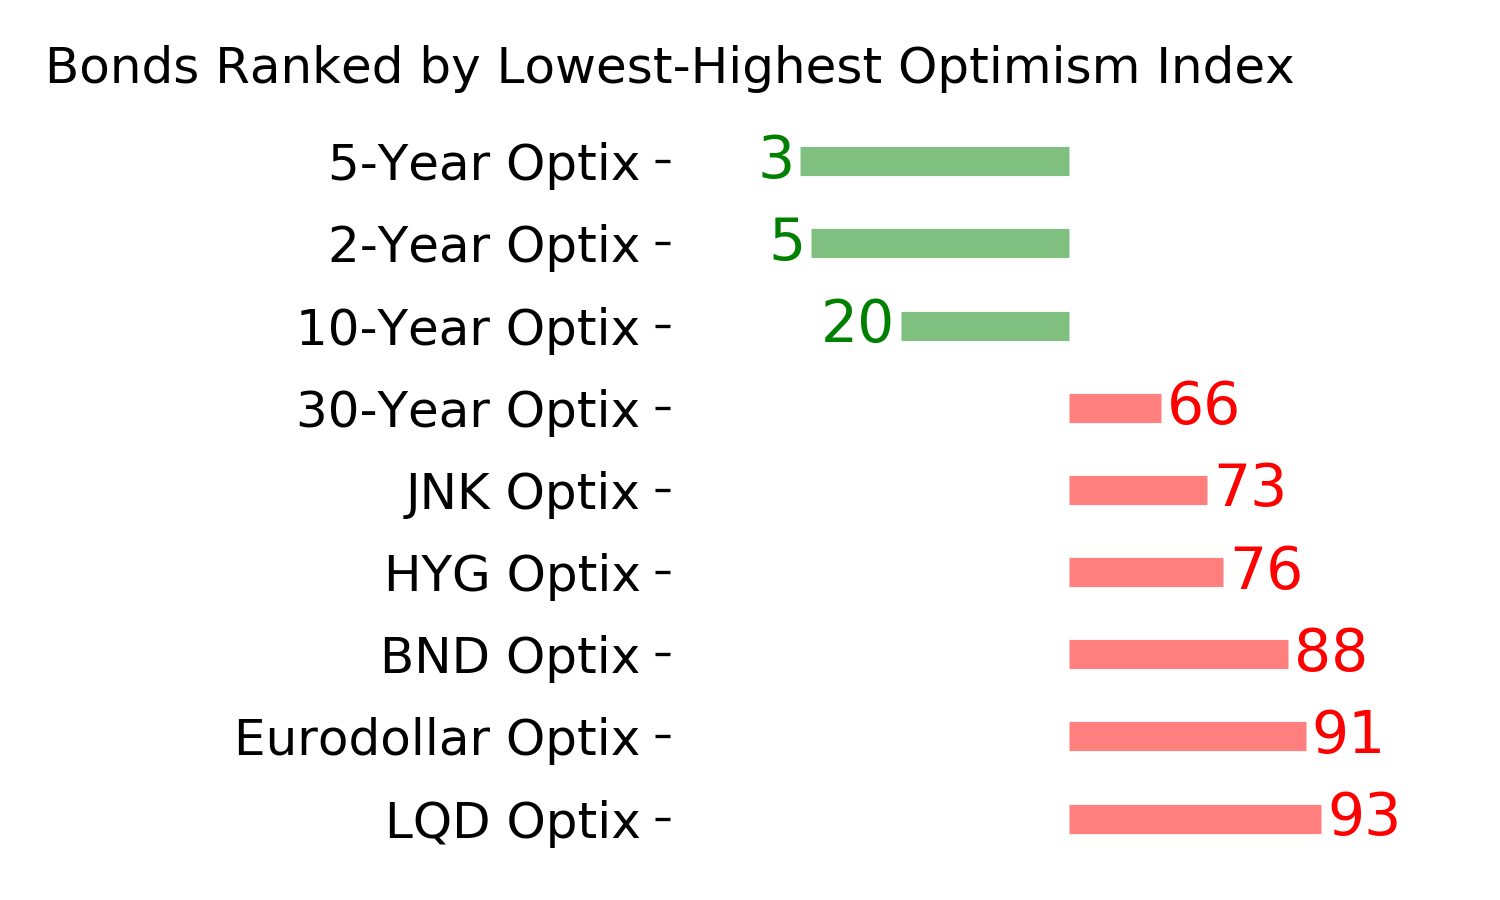
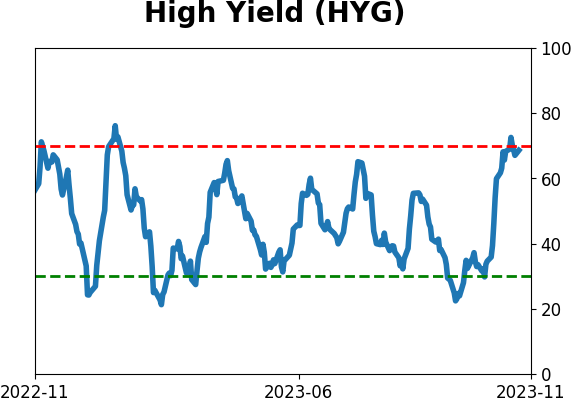
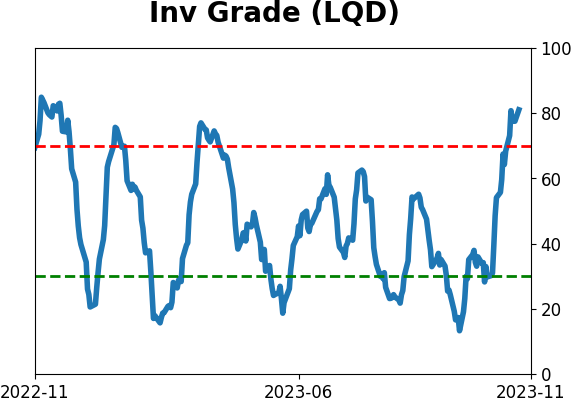
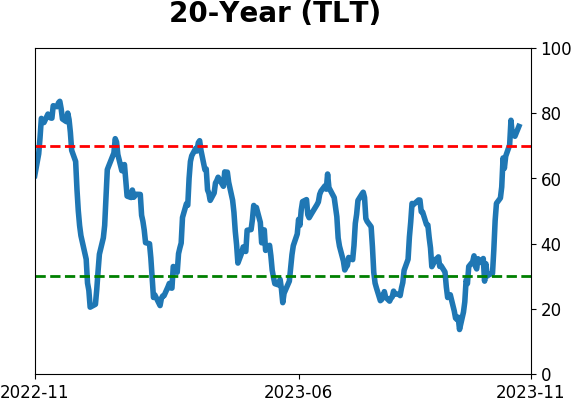
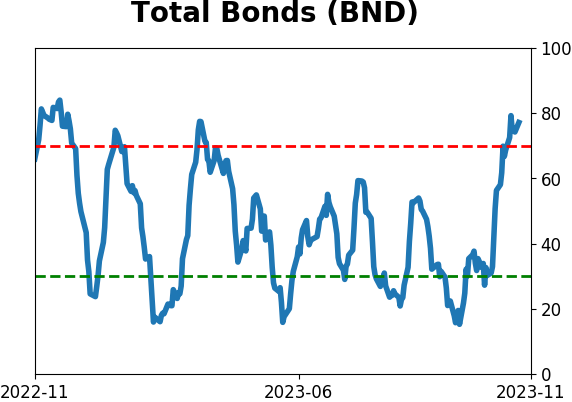
Bond ETF's - 10-Day Moving Average
|
|
|
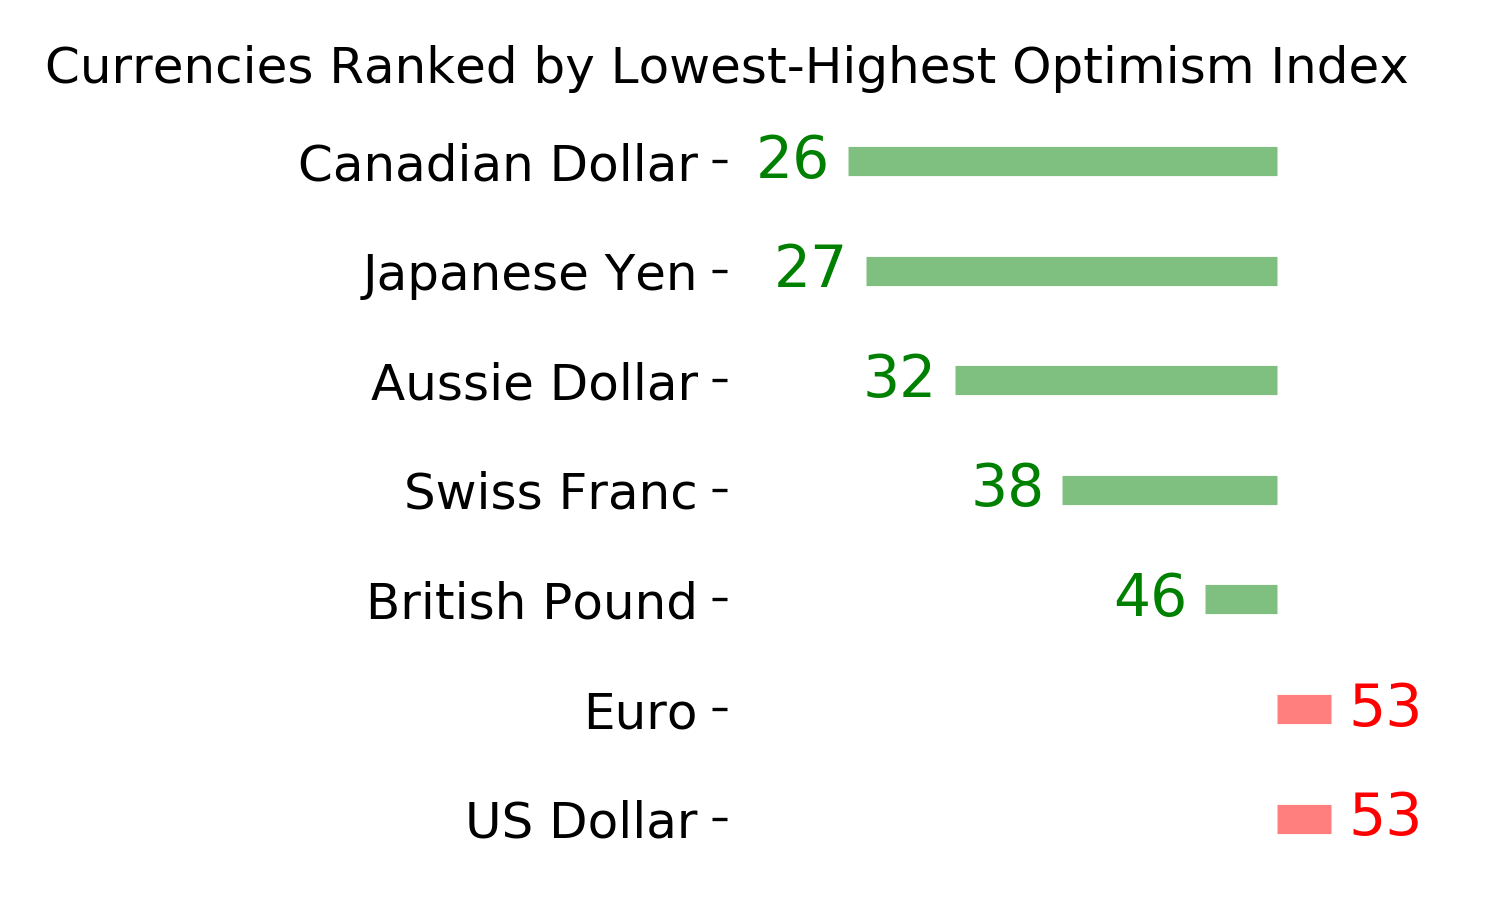
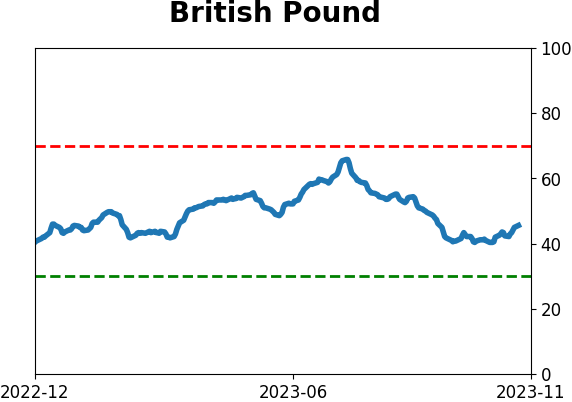
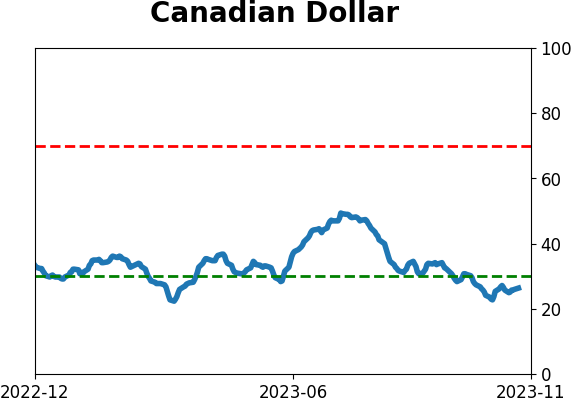
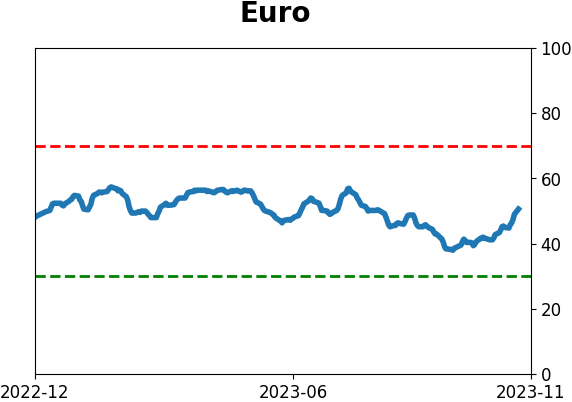
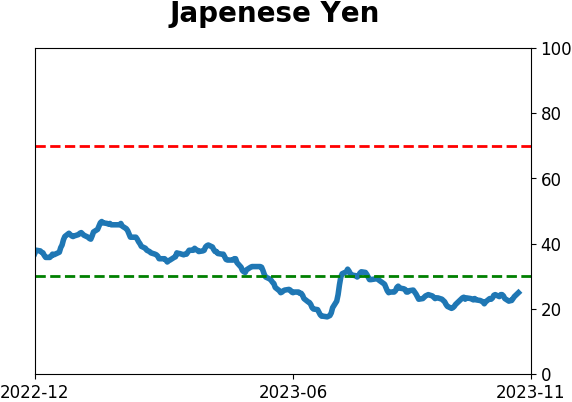
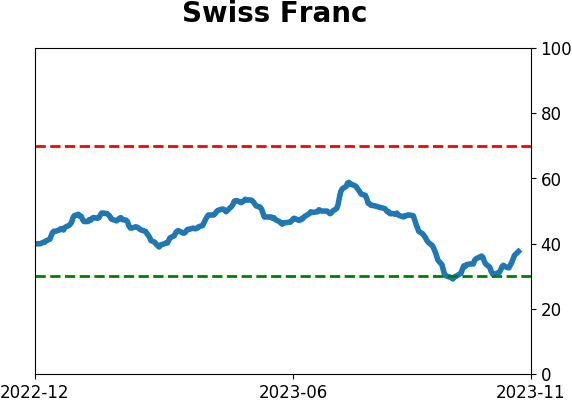
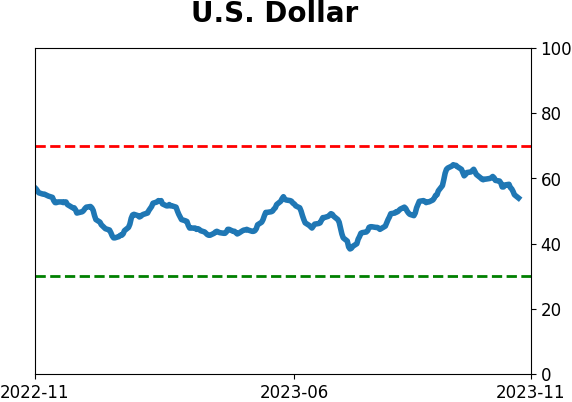
Currency ETF's - 5-Day Moving Average
|
|
|
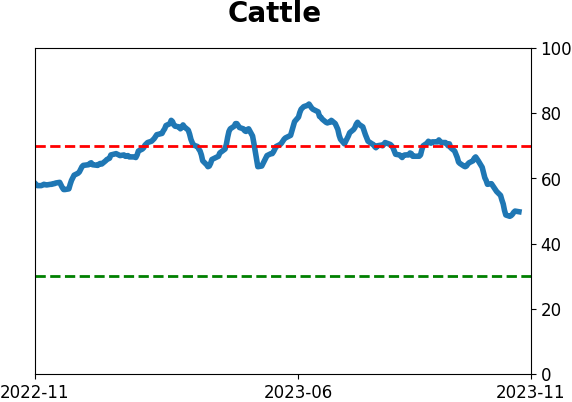
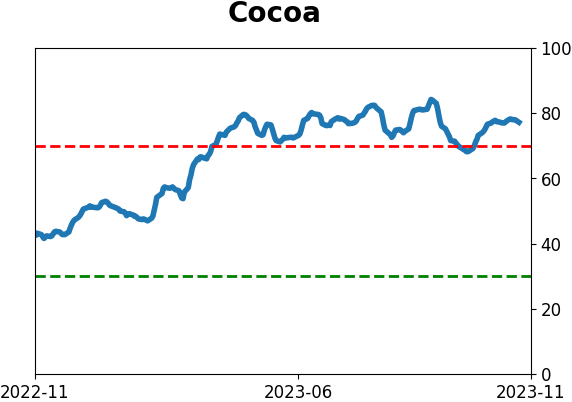
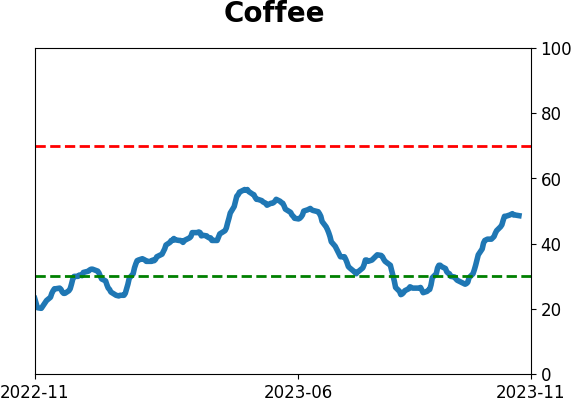
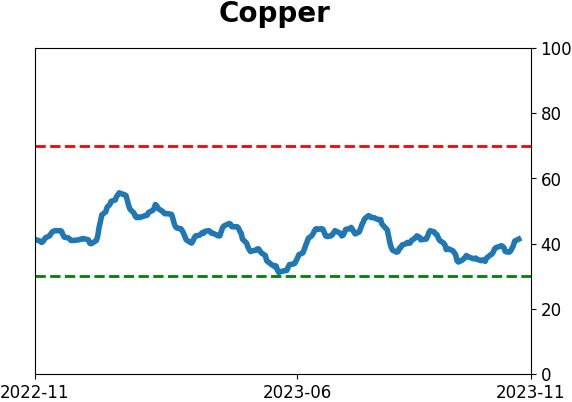
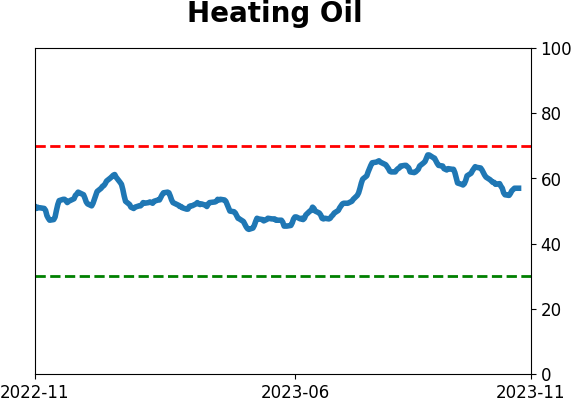
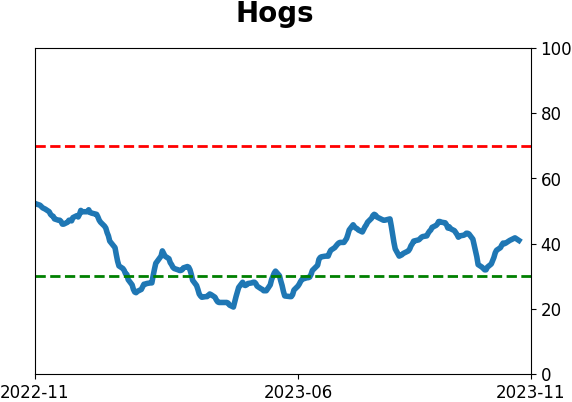
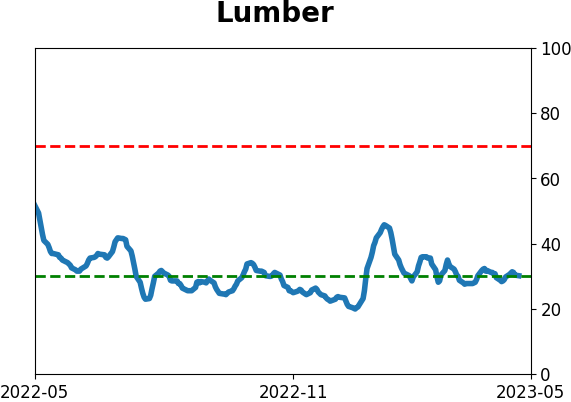
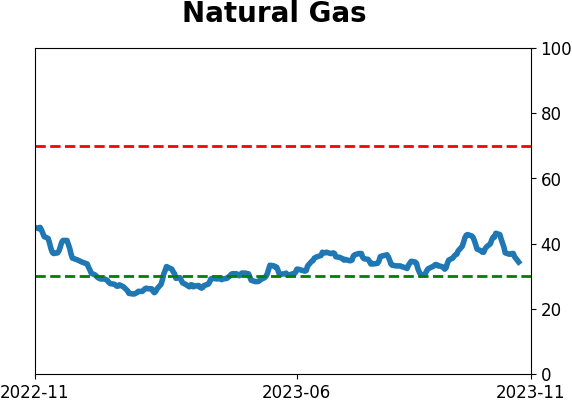
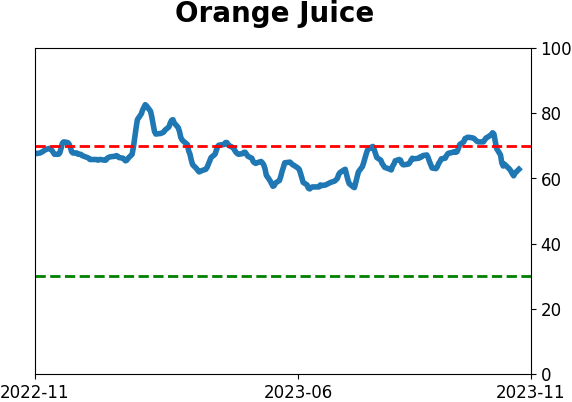
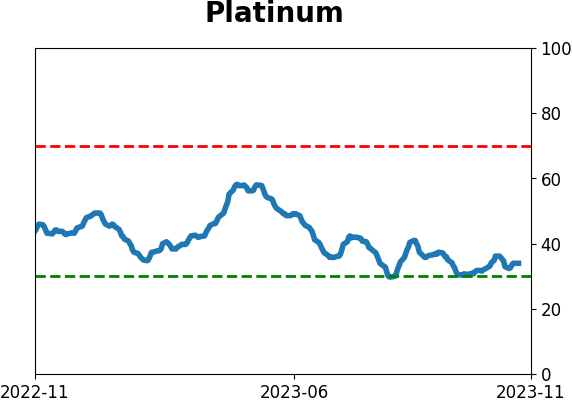
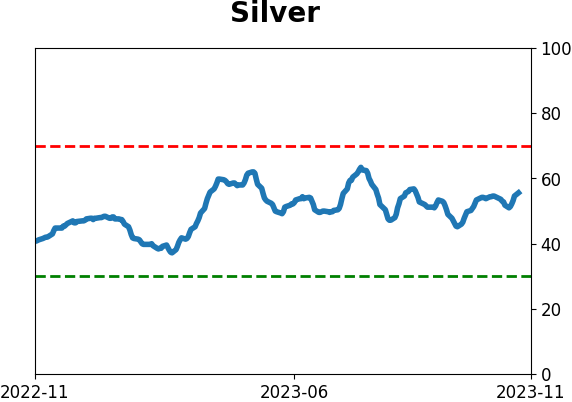
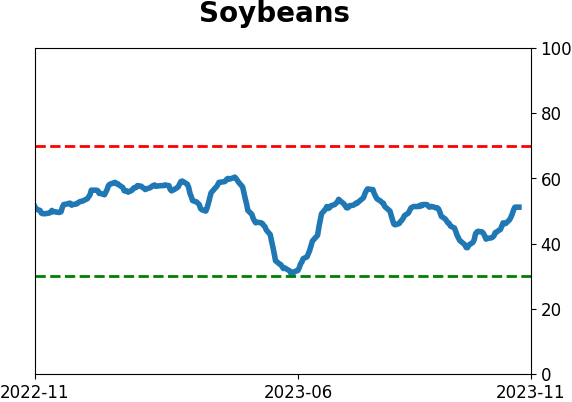
Commodity ETF's - 5-Day Moving Average
|
|