Daily Report : TradingEdge Weekly for Nov 17 - A rare cluster of thrusts, subdued sentiment, resurgent sectors

| View/Print a PDF version of this Report |
Headlines
|
TradingEdge Weekly for Nov 17 - A rare cluster of thrusts, subdued sentiment, resurgent sectors: This week, we saw that despite positive price action and more than a 4% gain in many stocks, sentiment models are subdued. Some specific sectors are seeing aggressive buying interest, including Technology, Utilities, and Brazilian equities. We take a look at a unique economic model with a good record of forecasting future conditions. |
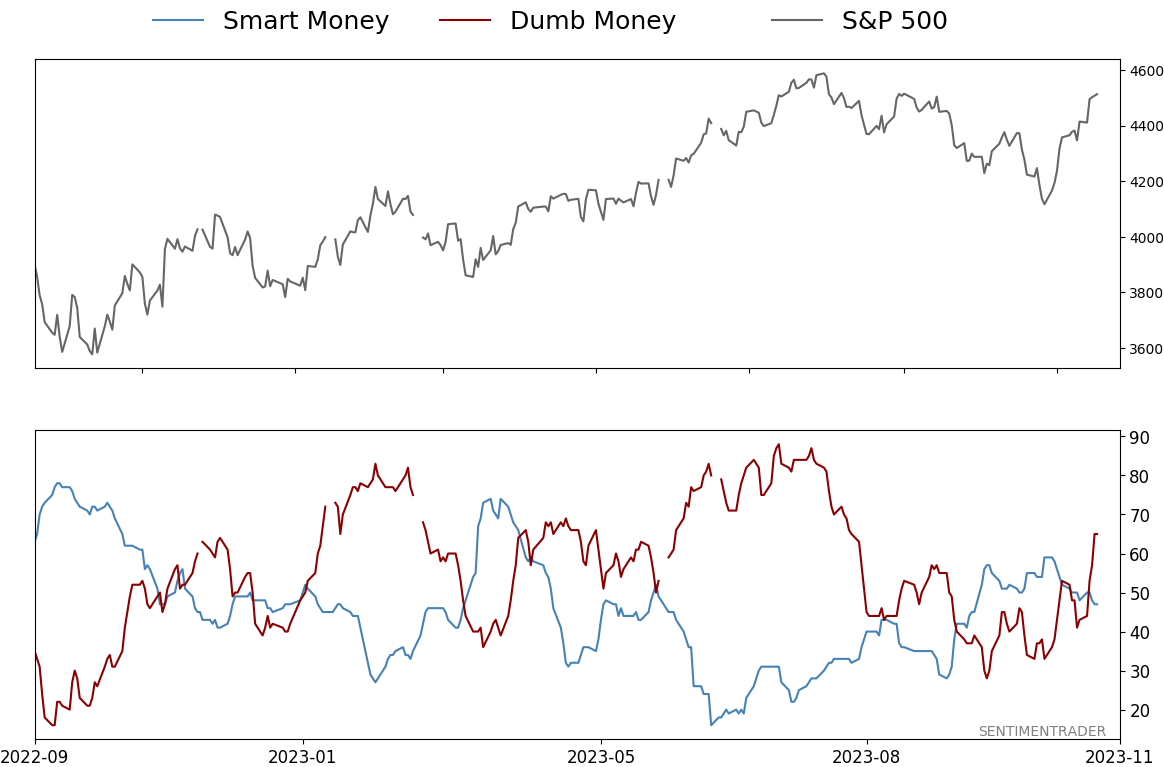
Smart / Dumb Money Confidence
|
|
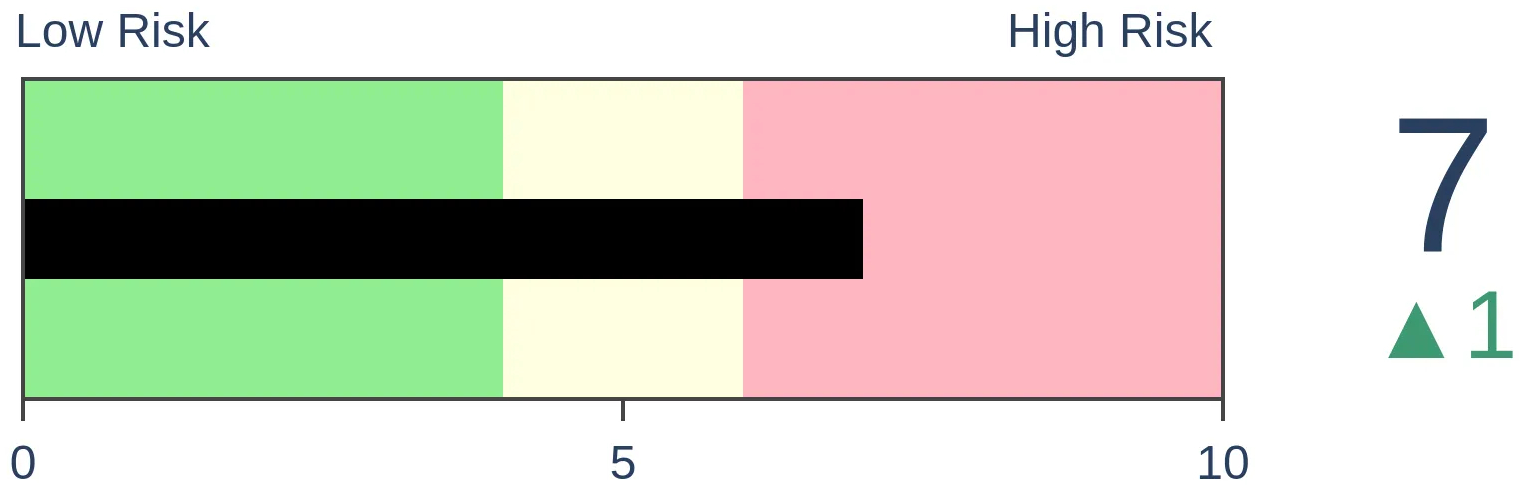
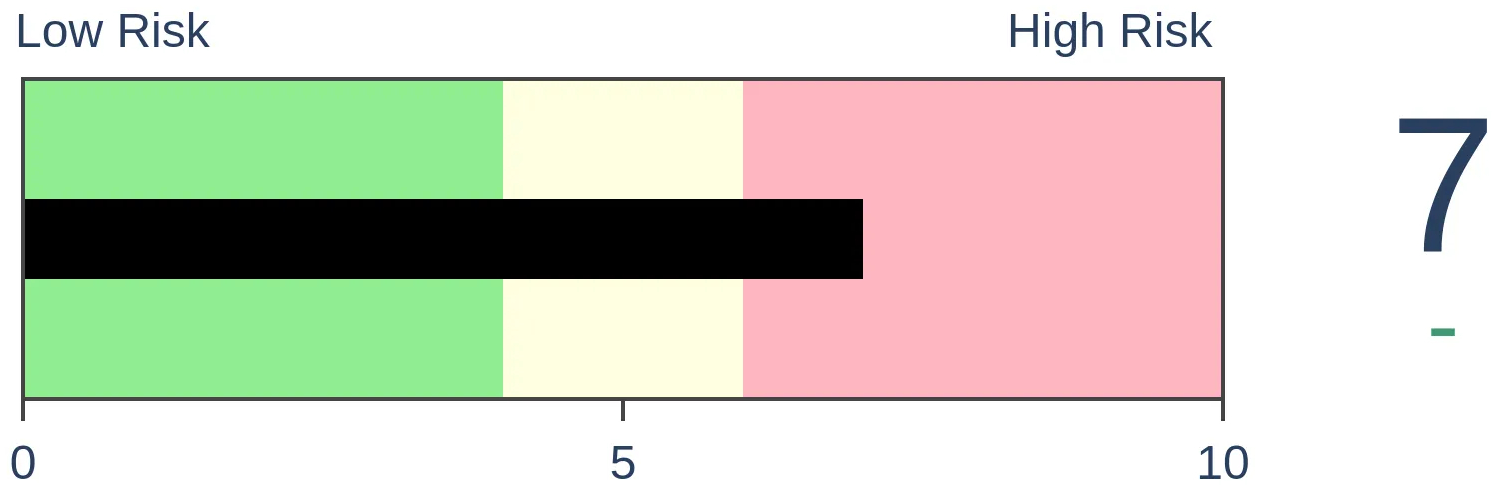
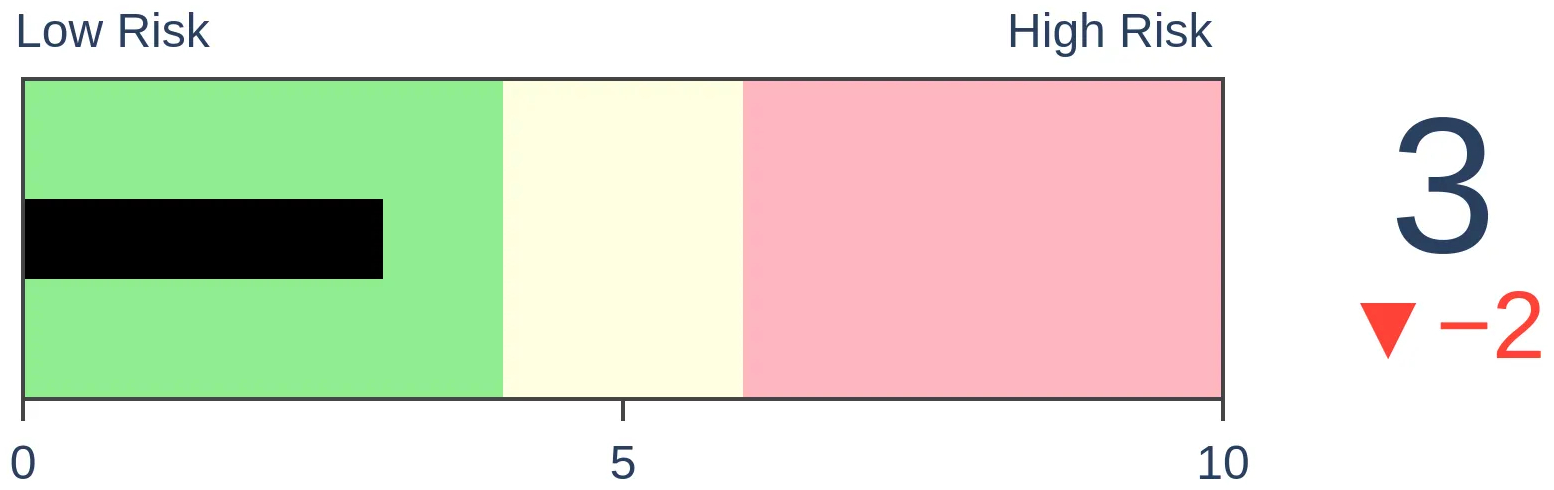
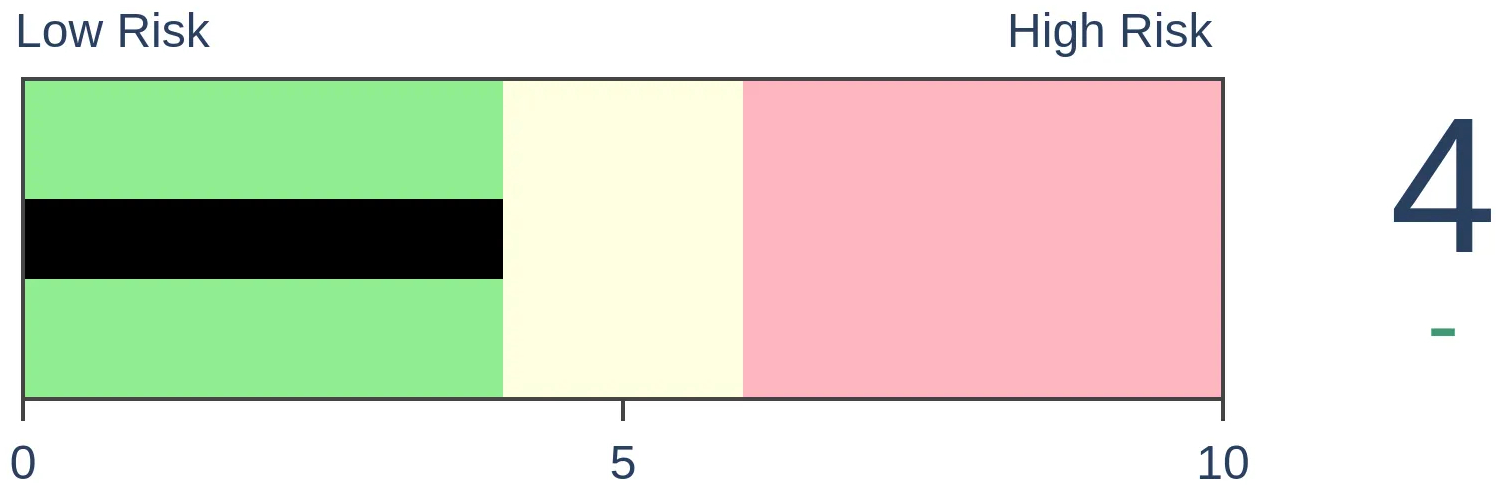
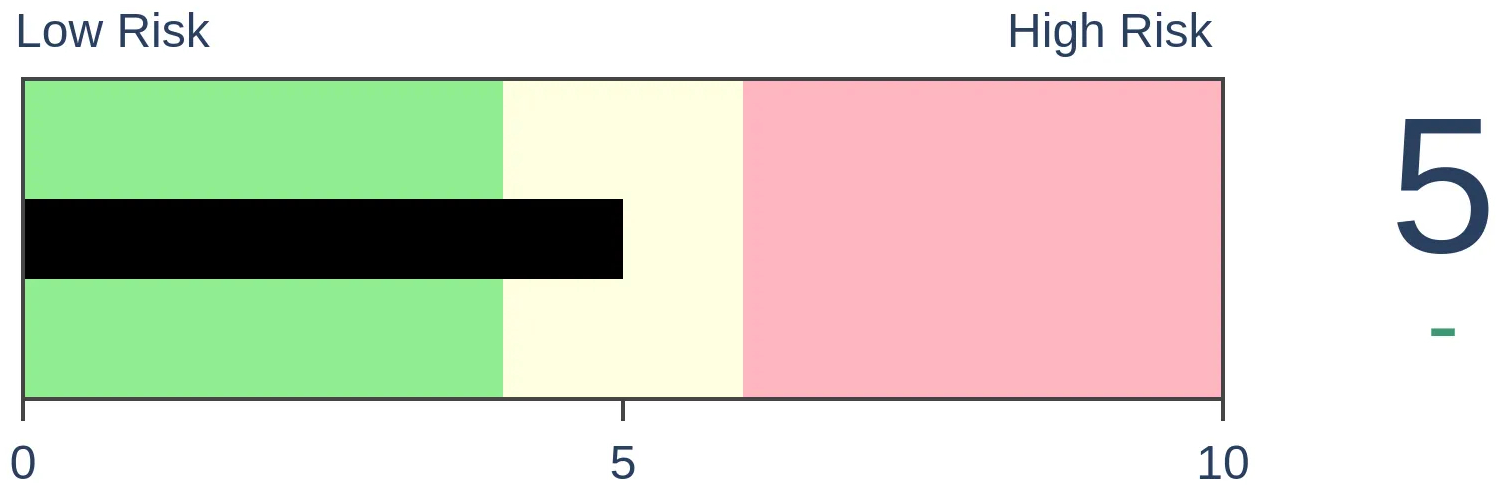
Risk Levels
|
|

|
Research
TradingEdge Weekly for Nov 17 - A rare cluster of thrusts, subdued sentiment, resurgent sectorsBy Jason GoepfertBOTTOM LINEThis week, we saw that despite positive price action and more than a 4% gain in many stocks, sentiment models are subdued. Some specific sectors are seeing aggressive buying interest, including Technology, Utilities, and Brazilian equities. We take a look at a unique economic model with a good record of forecasting future conditions. FORECAST / TIMEFRAME |
Key points:
- There was a gigantic one-day relief rally in many stocks this week
- Sentiment models are subdued even though price action has been good
- Using a new economic model to forecast conditions
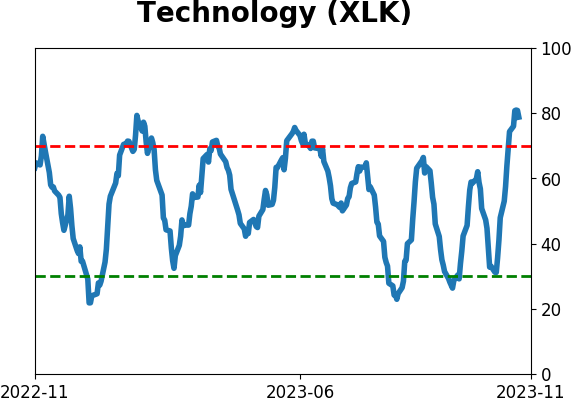
- Technology stocks see more signs of a surge
- The Nasdaq has enjoyed a rare cluster of thrusts
- Is it too late to jump on the semiconductor rally?
- Speaking of resurgent technology...updating an MSFT options trade
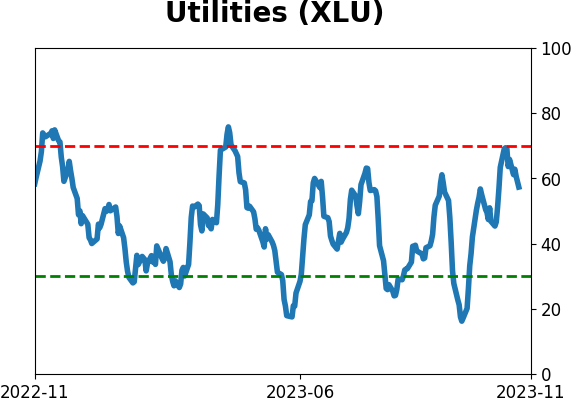
- Utilities finally see some buying interest after prolonged selling pressure
- A surging Utilities sector is a good sign for the broader market
- There has been a potential washout and recovery in Transports
- Stocks in Brazil's Ibovespa index are also seeing renewed interest
NOTE: TradingEdge Weekly will not be published for the week ending November 24
A gigantic relief rally
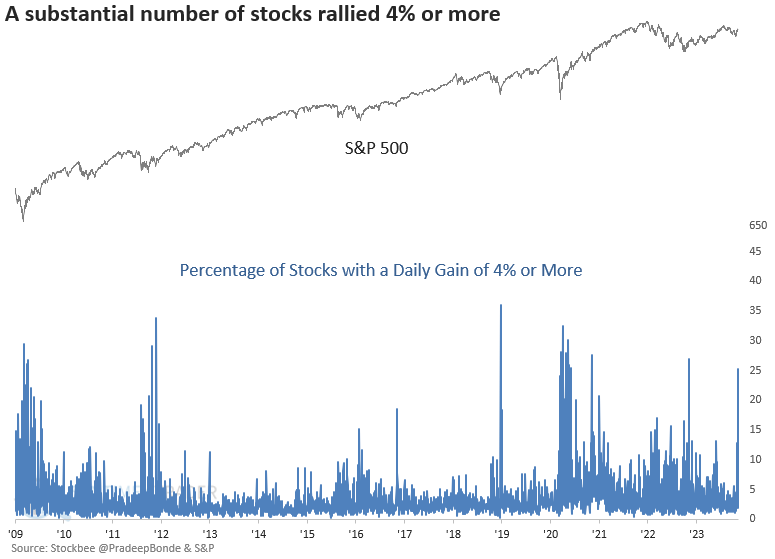
Over 25% of stocks and 32% of sub-industry groups closed with a daily gain of 4% or more on Tuesday. Dean showed that similar one-day surges tended to mark an inflection point with bullish implications for the S&P 500, especially when it was in a long-term uptrend.
On Tuesday, the percentage of stocks with a daily gain of 4% or more surged to 25%, reaching the highest level since the stock market low in the fall of 2022.
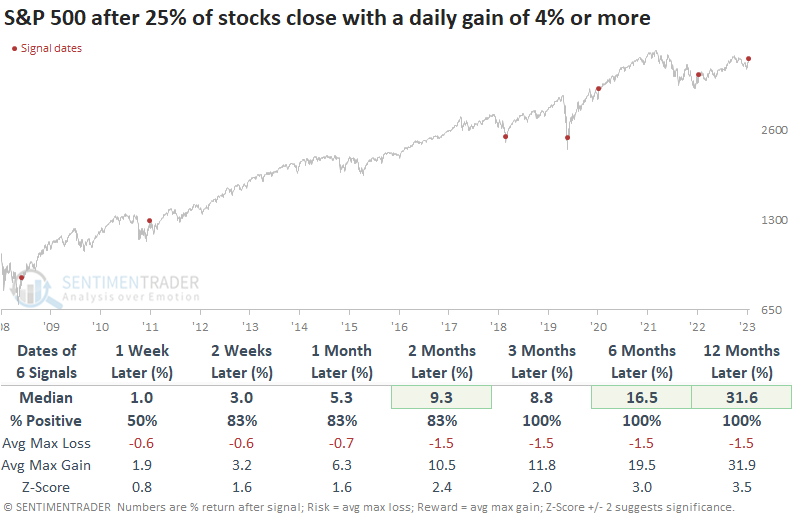
While the sample size is small, whenever 25% of stocks closed up 4% or more in a single session, the S&P 500 rallied 100% of the time over the subsequent three, six, and twelve months. The 2011 instance is the only precedent that saw a significant drawdown in the first two months, with a max loss of -9.8%.
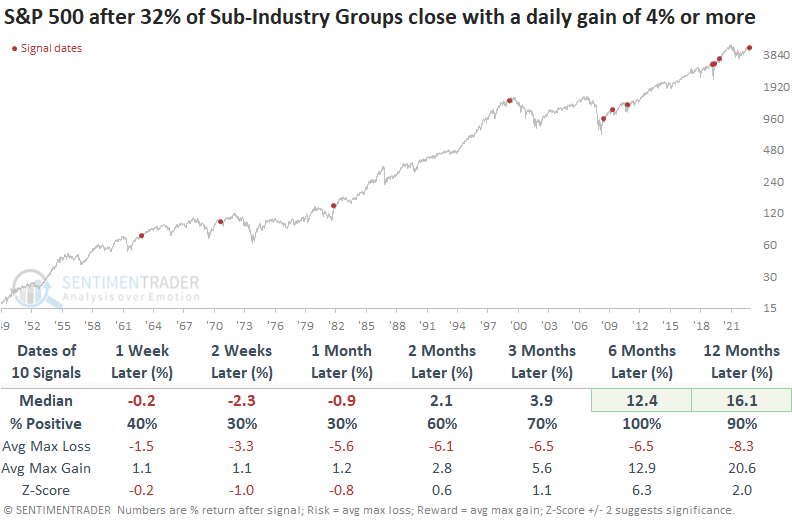
Employing sub-industry data to broaden the sample size reveals that on Tuesday, more than 32% of sub-industry groups experienced a gain of 4% or more, marking the 38th occurrence of such an event since 1957 when screening out repeats.
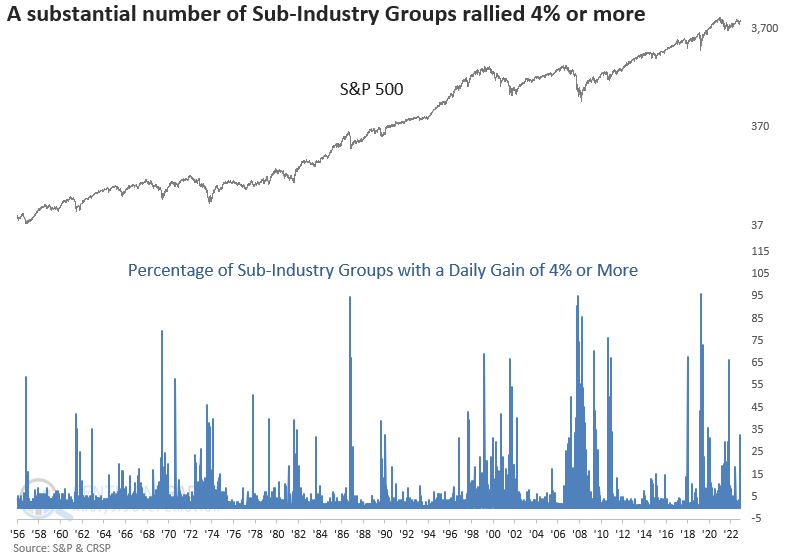
Whenever 32% of sub-industry groups registered a daily gain exceeding 4%, the S&P 500 showed a solid tendency to rally across all time horizons, with most of the bear market precedents occurring near the end of the drawdown phase.
If we isolate signals that occurred when the S&P 500 was trading above its 200-day average for context similar to now, the large-cap index struggled over the subsequent month. However, six months later, the S&P 500 was higher every time.
Subdued sentiment despite good price action
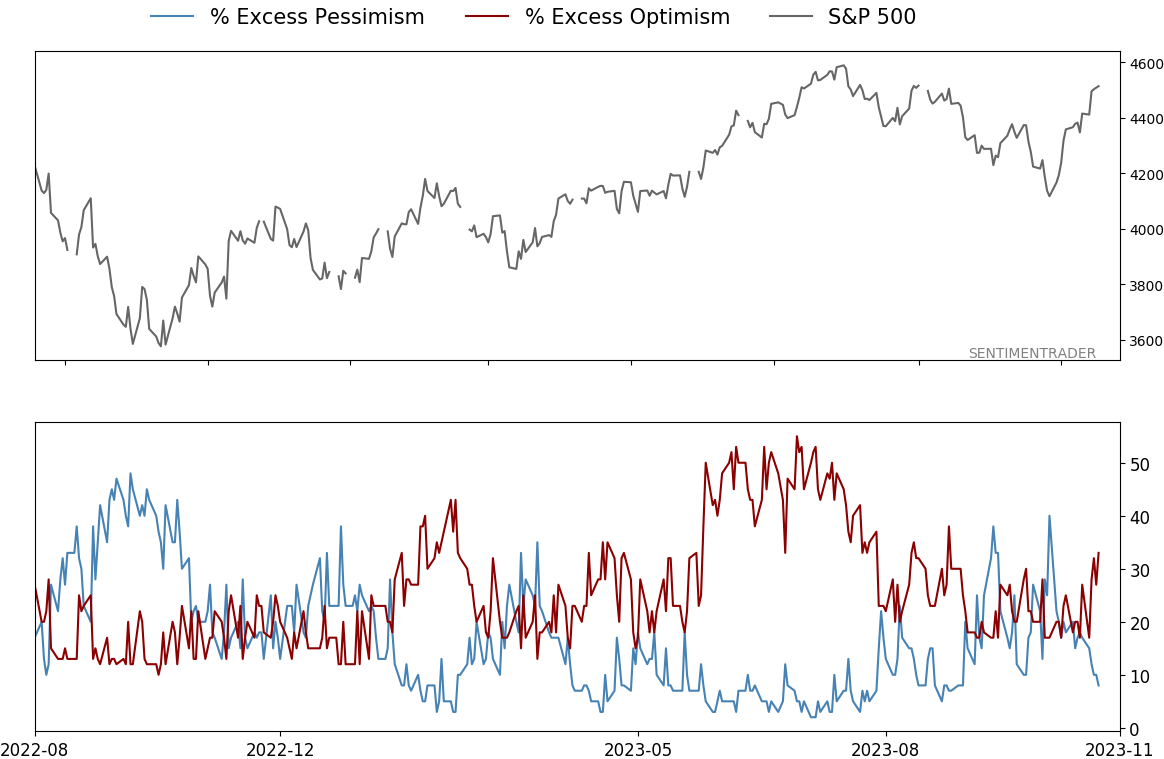
The S&P 500 has hit a 30-day high and sentiment models are still subdued with both Dumb Money Confidence and the Risk On/Risk Off Indicator below 50%. Similar behavior mostly preceded further gains, but we should watch for a quick failure.
We prefer to use broad models to approximate the current state of sentiment since there's always some indicator or other giving a weird reading. Despite the S&P 500 rising to more than a 30-day high, Dumb Money Confidence is still well below 50%.
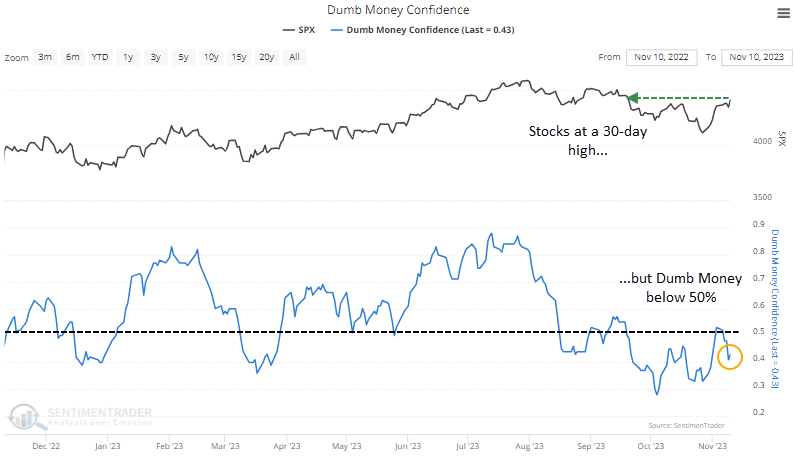
And the Risk On/Risk Off Indicator shows that fewer than 50% of indicators have climbed into risk-on territory. This is where a knee-jerk contrarian would scream, "Buy!" But it's not that simple - subdued sentiment isn't necessarily a good sign.
It can be, but it's not necessarily so. It happened several times since the 2022 peak, and the S&P 500 enjoyed minimal gains and concerning declines in the weeks afterward. If we zoom out and look at all similar behavior since the year 2000 (as far back as we can go), it was a mixed sign. The table below shows every time the S&P eked out at least a 30-day high, and both Dumb Money Confidence and the Risk On/Off Indicator were below 50%.
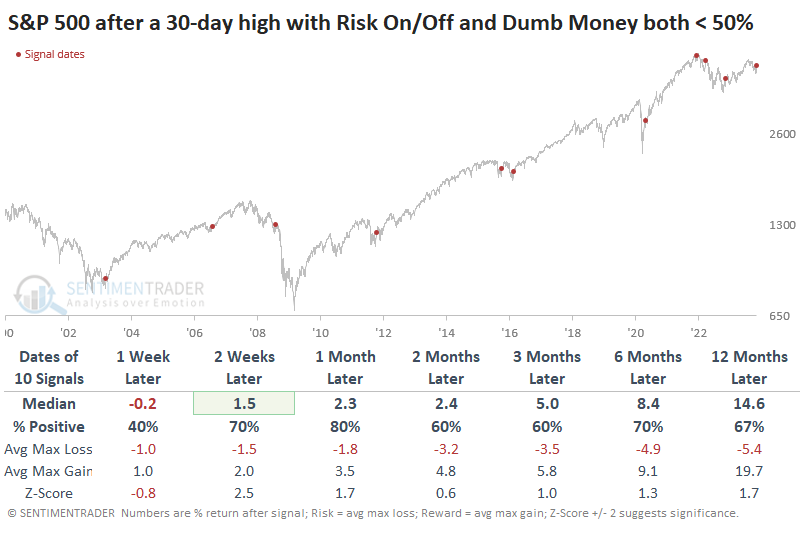
With such mixed results, the information isn't all that useful. However, it can be instructive to look at the maximum gains and losses across time frames after each signal. Doing so shows that the three times the signals failed miserably - in 2008, 2021, and 2022, the index lost more than -3% within the first month after the signal. None of the successful signals did so.
A new economic model
Employment is key for the health of the economy; The more people that are earning an income to spend on goods and services, the better. Jay showed that the Employment-Population Ratio provides a broad measure of economic health and he details a newly constructed model that may be helpful in highlighting economic recessions early on.
The model, based on a recent talk by Larry Williams, is pretty straightforward. The sum total of the model involves the 12-month rate-of-change in the Employment-Population Ratio and the one-month change in the Coincident Economic Indicators index.
The latest readings for both indicators are only evaluated once a month, after the close of trading on the last day of the month. The variables and calculations are listed below:
- A = Employment-Population Ratio
- B = Coincident Economic Indicators
- C = 12-month % change in Employment-Population Ratio
- D = One month % change in Coincident Economic Indicators
- E = If C >= 0, then +2 else 0
- F = If D >= 0, then +1 else 0
- The EPR Model monthly reading = E + F
The EMR Model simply adds Variables E and F above together and can range from 0 to +3.
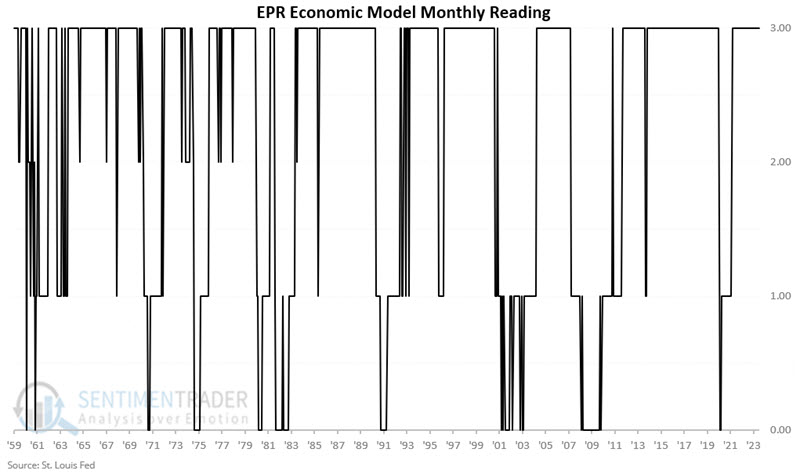
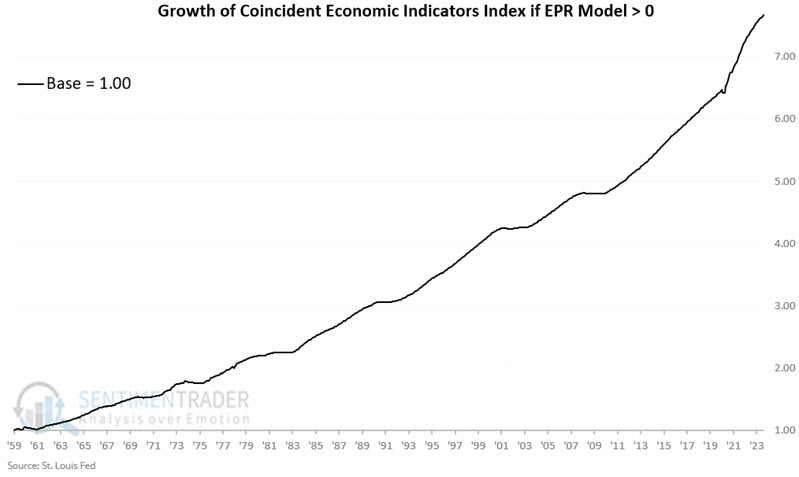
Readings above 0 are considered favorable for the economy (as measured using monthly changes in the Coincident Economic Indicators index). Readings of 0 are considered unfavorable.
The chart below displays the growth in the Coincident Economic Indicators index only for those months when the EPR Model is greater than 0 at the end of the previous month.
The chart below displays the growth in the Coincident Economic Indicators index only for those months when the EPR Model is equal to 0 at the end of the previous month.
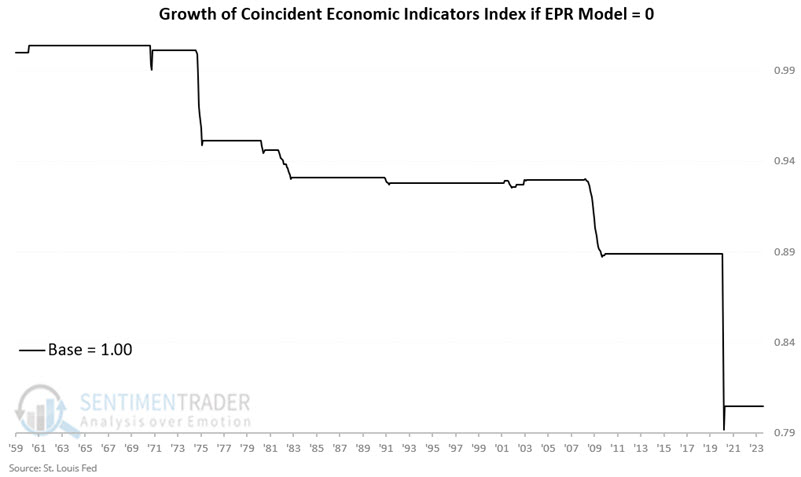
The bottom line: The risk of an economic recession appears to be significantly higher when the EPR Model = 0. On the other hand, the risk of recession appears to be quite low when the EPR Model is above 0.
At the end of October, the EPR Model = +3. Based on these calculations, the EPR Model is deemed "favorable" for the economy during the month of November, implying that the Coincident Economic Indicators index should likely not decline during the month of November 2023.
More signs of a resurgence in Technology
The Nasdaq 100 triggered a breadth thrust buy signal at the close of trading on Friday. Dean noted that in less than 15 sessions, the S&P 500 Technology sector and the Nasdaq 100 cycled from a low to a high.
In momentum investing, market participants monitor bullish price action in stocks or index ETFs with the premise that the trend will persist. Technology and Communication Services stocks undeniably exhibit bullish momentum. At the close of trading on Friday, a breadth thrust buy signal triggered an alert for the technology-heavy Nasdaq 100. The thrust system I use was made famous by Walter Deemer, a revered market analyst. It's known as Breakaway Momentum (BAM).
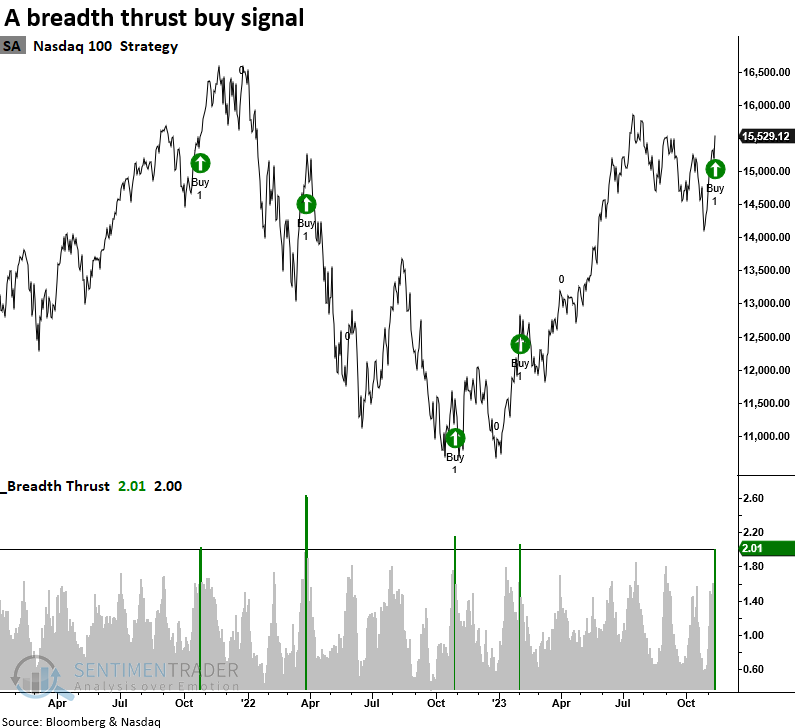
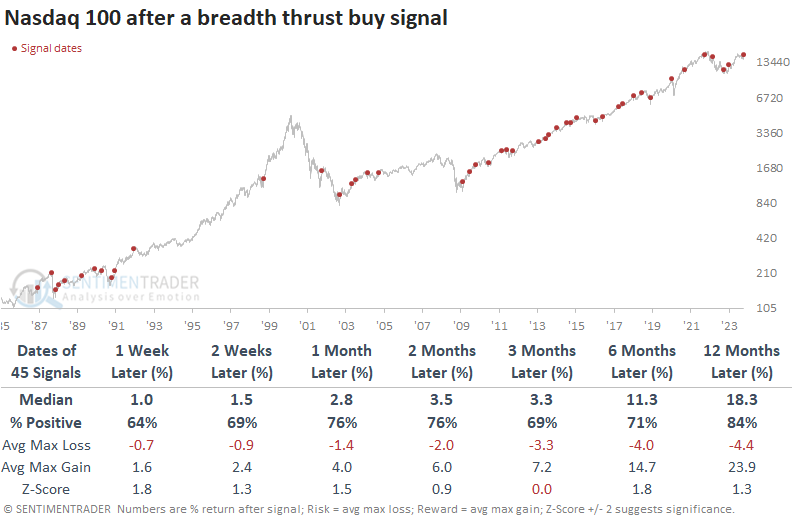
When the 10-day sum of advancing issues compared to the 10-day sum of declining issues exceeds a ratio of 2.0, positive price momentum for the Nasdaq 100 will likely continue over the foreseeable future. Over the following three months, the signal showed a gain at some point in 40 out of 45 precedents.
Also, for only the 5th time in history, the Nasdaq 100 cycled from a 3-month low to a 3-month high in 15 or fewer trading sessions. While the sample size is small, the Nasdaq 100 rallied every time over the subsequent two weeks whenever it cycled from a 3-month low to a 3-month high in 15 or fewer sessions.
While the Nasdaq 100 and the S&P 500 Technology are driven by several of the same mega-cap members, the large-cap technology index also triggered the exact reversal pattern for the only 11th time since 1971. That sector was higher 90% of the time over the subsequent two weeks with a median gain of 3.2% after similar behavior.
A rare thrust cluster in Tech
Dean further noted that Nasdaq advancing issues outpaced declining issues by a 3-to-1 ratio in three out of ten sessions. Similar advance-decline ratio skews led to outstanding returns for the Nasdaq Composite.
With New York Stock Exchange data triggering a Zweig Breadth Thrust and over 25% of stocks closing with a daily gain of 4% or more, a signal from the Nasdaq Exchange would provide a compelling case for a continuation of the rally.
As luck would have it, the Nasdaq generated a bullish signal this week when advancing issues outpaced declining issues by a 3-to-1 ratio in three out of ten sessions.
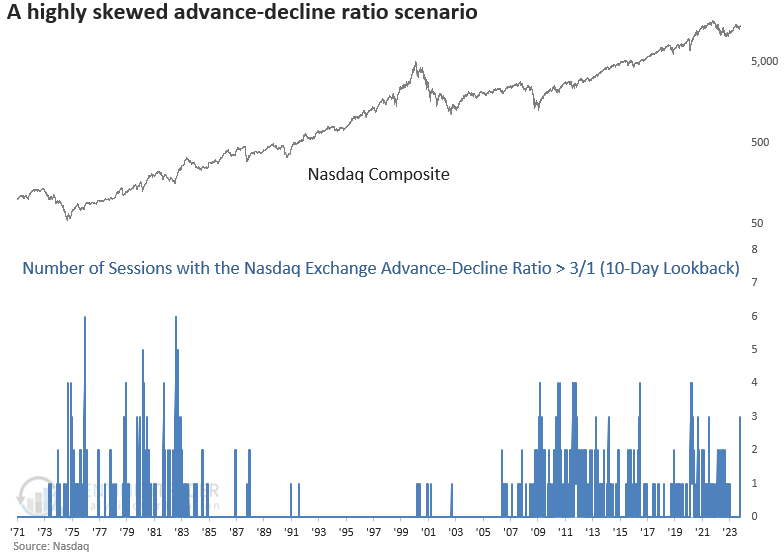
Whenever Nasdaq Exchange advancing issues outpaced declining issues by a 3-to-1 ratio in three out of ten sessions, returns, win rates, and z-scores for the Nasdaq Composite are outstanding. Over the subsequent three months, the composite rallied 100% of the time.
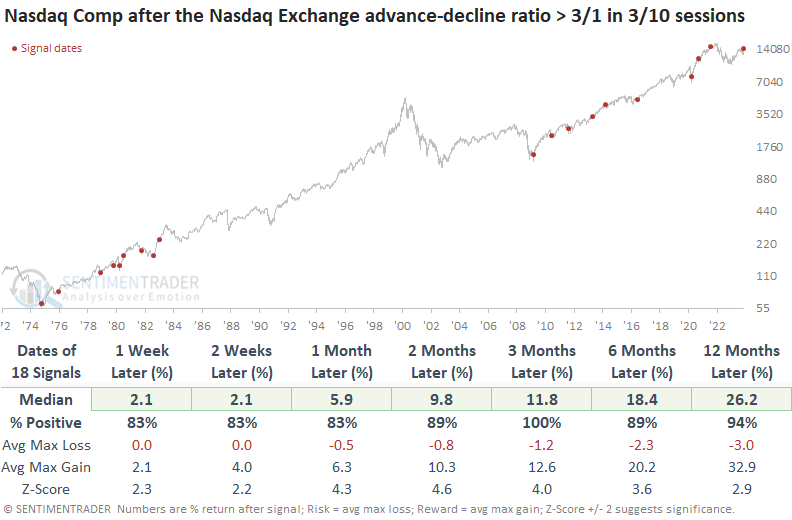
Over the subsequent two months, the max gain exceeded the max loss in 15 of 18 cases. Additionally, the Nasdaq Composite encountered only four precedents of losses surpassing 5% over that same period.
As one might expect, when advancing issues outnumber declining issues on the Nasdaq Exchange like now, the S&P 500 performed exceptionally well.
Too late to jump on the semiconductor rally?
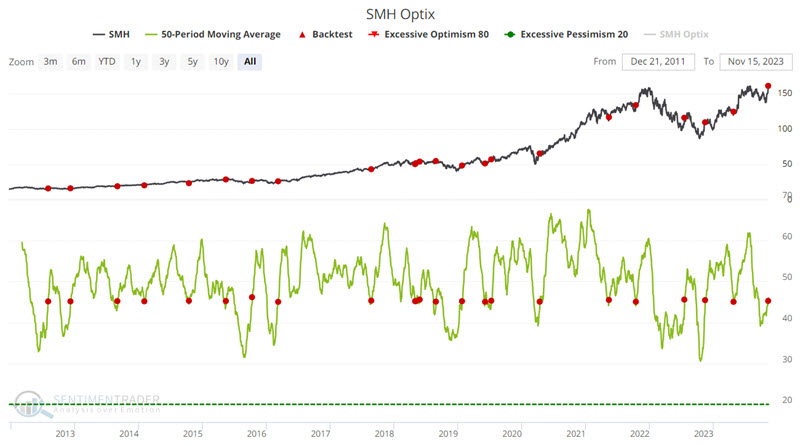
Semiconductor stocks have soared in the last year, and investors seem to remain wary of chasing the rally. Jay noted that trader sentiment for semiconductor stocks has recently reversed from a low level and then spiked higher.
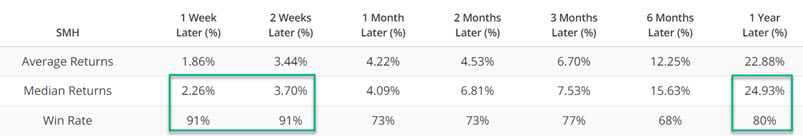
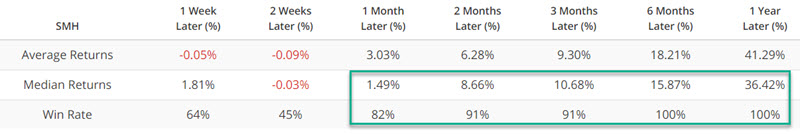
Trader sentiment regarding the VanEck Semiconductor ETF (ticker SMH) swings widely from high to low and back again. The chart below highlights all days when the 50-day average for SMH Optix crossed above 45%. The most interesting thing to note is the tendency for SMH to perform well in the short run (91% Win Rate for 1 and 2 weeks). Note there is a breakout to a new all-time high and some favorable holiday and 4th quarter seasonal factors also in play.
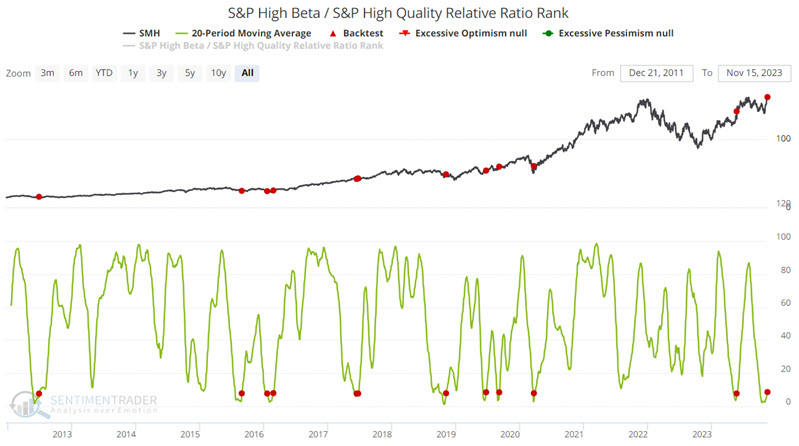
The semiconductor industry has long tended to be a valuable bellwether for the overall stock market (i.e., when the semiconductor sector is performing well, typically, so too is the overall stock market, and vice versa). As a result, indicators that work well for the broader market also tend to see outstanding results when applied to the semiconductor sector.
The S&P High Beta / S&P High Quality Relative Ratio Rank indicator often highlights when investor sentiment moves from a risk-off mentality to a risk-on mindset. The chart below highlights those times when the 20-day average for this indicator crossed above 7.5 (suggesting a reversal from risk off to risk on behavior), and the table summarizes SMH performance. The good news is that the results have been highly favorable. The potential bad news is that data for this indicator only goes back to 2011.
Jay also looked at a couple of broad-market indicators, including stocks that are short-term oversold and the Panic/Euphoria Model, which suggested higher prices for semis.
Speaking of resurgent technology...
Last week, Jay noted a potential trade-in Microsoft options. Ironically, one of the biggest potential conundrums can arise when "things go right," and a quick profit accumulates. Adjusting a profitable option position may eliminate the risk of loss while still allowing for more potential upside.
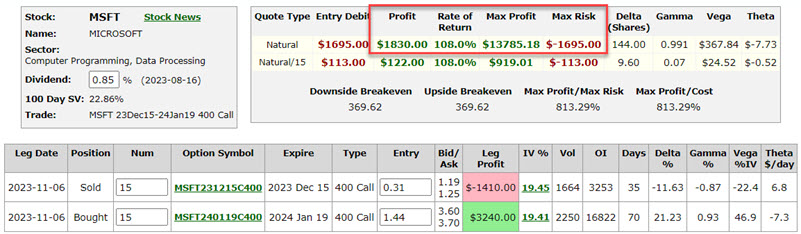
On 2023-11-07, Jay highlighted the following example of a "bull calendar spread" involving options on Microsoft (MSFT):
- Long 15 Jan19 2024 400 calls @ $1.44
- Short 15 Dec15 2023 400 calls @ $0.31
The purpose of this trade was to allow for decent profit potential if MSFT rallied in the month ahead while also costing only a fraction ($1,695) of what it would cost to buy 100 shares of MSFT stock ($35,653). In the last week, MSFT rallied 3.7% - breaking out to a new all-time high in the process - which was the hoped-for outcome when entering the trade initially. By way of comparison:
- A trader who bought 100 shares of MSFT stocks paid $35,653 and presently has an open profit of $1,314 (of +3.7%)
- The buyer of the bull calendar spread above paid $1,695 and presently has an open profit of $1,830 (+108.0%)
The status of the call calendar option position is shown below in the updated screenshots.
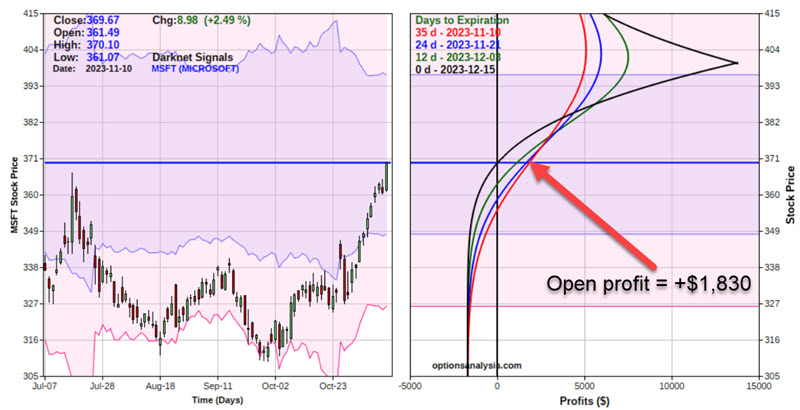
This is obviously a welcome turn of events - but it does raise something of a conundrum. Should a trader "let it ride," "take the money and run," or something in between? The thing to note about options trading is that substantial profits can disappear as quickly as they appeared.
So let's consider adjusting the position above to try to achieve both objectives - a) locking in a profit and b) leaving room for further profits to accumulate.
Let's assume we take the following action using closing prices for Friday 2023-11-10:
- Buy 15 MSFT Dec15 2023 400 calls @ $1.25 (completely closing short option portion of original trade)
- Sell 3 MSFT Dec15 2023 410 calls @ $0.58 (a new short position using three contracts instead of 10)
- Sell 10 MSFT Jan19 2024 400 calls @ $3.60 (closing 2/3rds of original long option portion of original trade)
Essentially, we are taking profits on 2/3rds of the original long call position and "rolling out" the short position at a smaller size. The net results of these actions - and the new risk/reward profile for the adjusted position - appear in the figures below.
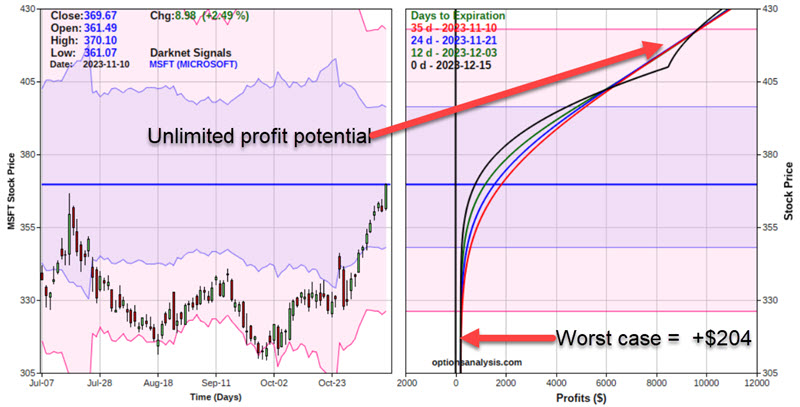
This newly adjusted position now has a worst-case scenario of a gain of $204, even if MSFT were to collapse from here. On the upside, this position now enjoys unlimited profit potential. To fully appreciate the effect of this adjustment, the chart below overlays the risk curves for the adjusted position over those of the original position. The "Left Trade" is the new adjusted position, and the "Right Trade" is the original trade.
Utilities are seeing buyers return after a long absence
For the first time in months, there was a surge in medium-term uptrends among Utilities. Even so, a majority of the stocks remain in persistent long-term uptrends. Similar behavior tended to precede buying interest, which corporate insiders seem to be anticipating.
Boring sectors have been anything but this year. At the start of October, about 60% of Utilities stocks hit a 52-week low at the same time. Since then, the sector has rebounded somewhat, but many stocks remain stuck in long-term downtrends.
It has been nearly two months since more than 20% of stocks in the sector climbed above their 200-day moving averages. That's the longest streak since 2008.
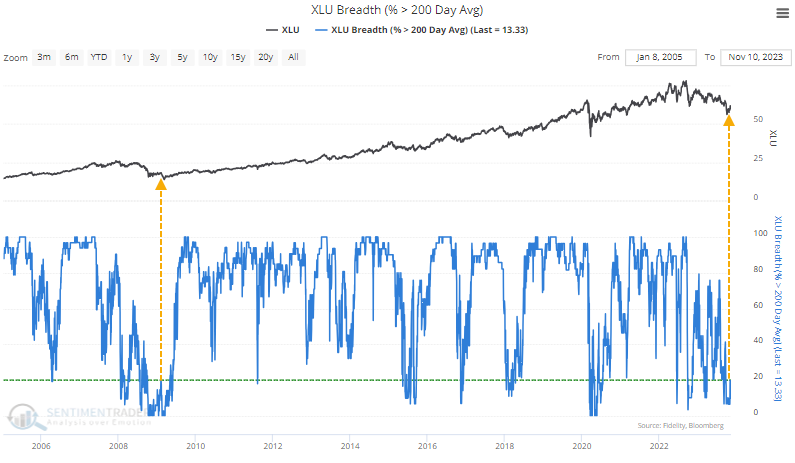
Over the past 70 years, there have been 17 other times when the sector went at least this many sessions with fewer than a fifth of its members in long-term uptrends. Most of them preceded medium-term bounces.
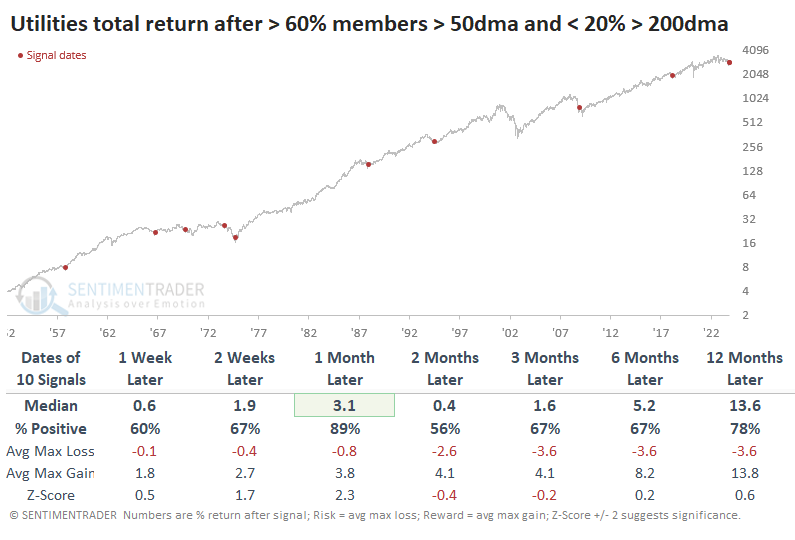
Until recently, fewer than 60% of members had even climbed above their 50-day moving averages. That was the longest streak since 2018. When the sector rebounded in early October, we finally saw more than 60% of Utilities climb above their medium-term averages. However, more than 80% of them had been stuck in long-term downtrends for at least the past 30 sessions. That has happened ten other times since 1952.
While the initial reaction to the shorter-term surge hasn't been encouraging this time, all but one of the others showed a positive return during the next month. There were two painful failures, in 1973 and 2008, though the latter eventually relented.
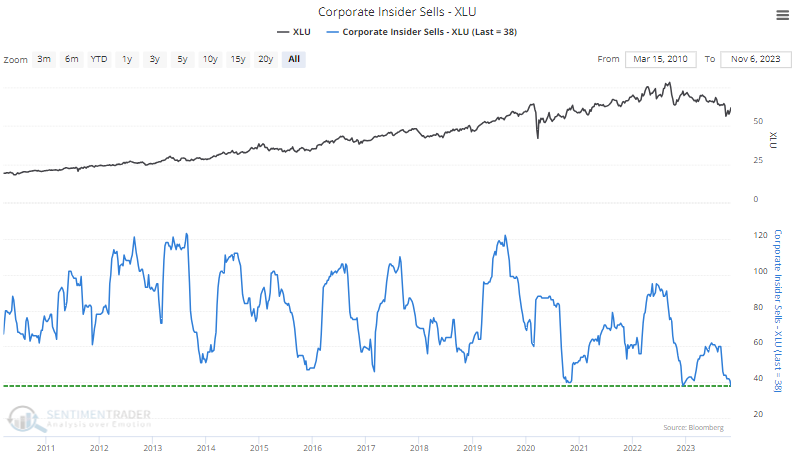
Corporate insiders don't see much point in selling their shares at such depressed levels. A six-month rolling sum of insider sales has dropped to its lowest level since 2010.
However, the market timers who use the Rydex family of mutual funds certainly have sold. Over the past 100 days, the average assets in the fund are now the lowest since 2004. Plus the seasonal window for the sector is positive, but that only lasts through year-end.
Outperforming Utilities is a good sign for stocks in general
Dean showed that utility stocks experienced a notable surge in outperformance, followed by a sudden and sharp collapse. Similar shifts in relative performance produced solid returns for the S&P 500 over most time horizons while the Utility sector struggled on an absolute and relative basis.
During market upheavals, investors often turn to utilities as a go-to sector, strategically allocating their portfolios defensively to mitigate potential losses. To capture this shift in investor sentiment, Dean calculates the difference between the percentage of Utility sector members outperforming the S&P 500 Index and the percentage of overall S&P 500 members outperforming the Index on a rolling one-month basis.
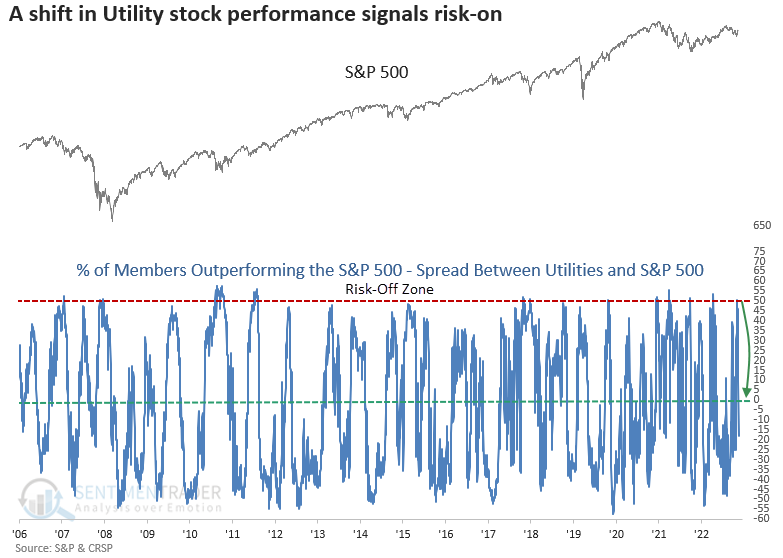
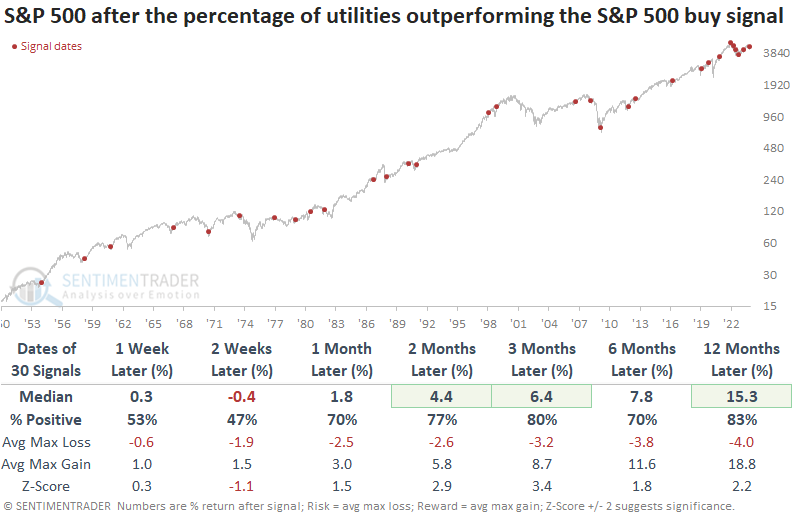
Whenever the spread between Utility sector stocks outperforming the S&P 500 and all S&P 500 stocks outperforming the benchmark cycled from greater than 48% to less than 0%, the S&P 500 showed a solid tendency to rally over medium and long-term horizons.
While the concept of measuring defensive utility stocks relative to the broad market to gauge investor sentiment has a solid long-term track record, the signal did struggle in 2022 as the FOMC embarked on an aggressive tightening cycle.
The S&P 500 Utility sector tended to struggle after relative performance trends between utilities and the S&P 500 shift in favor of the broad market, indicating an increased appetite for more offensive groups.
Potential washout and recovery in Transports
Jay noted that the transportation sector has essentially gone nowhere for five years. Investors have finally - and notably - thrown in the towel, possibly setting the stage for significantly better performance.
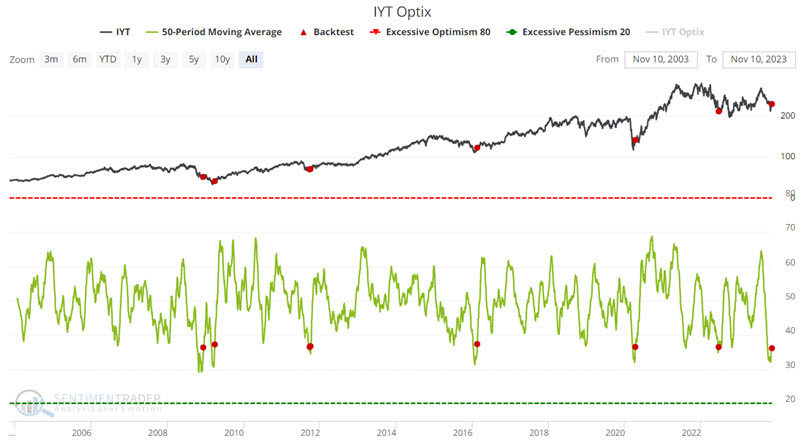
When a stock, index, sector, or market declines sharply in price or lags for an extended period, investors eventually throw in the towel. This overly bearish sentiment frequently indicates that a bottoming out may be at hand and is often reflected in readings from our Optix indicator.
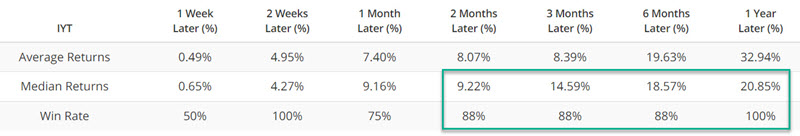
The chart below highlights when the 50-day average for IYT Optix crossed above 36%. The fund showed impressive returns across almost all time frames, with a 100% win rate a year later (small sample size, though).
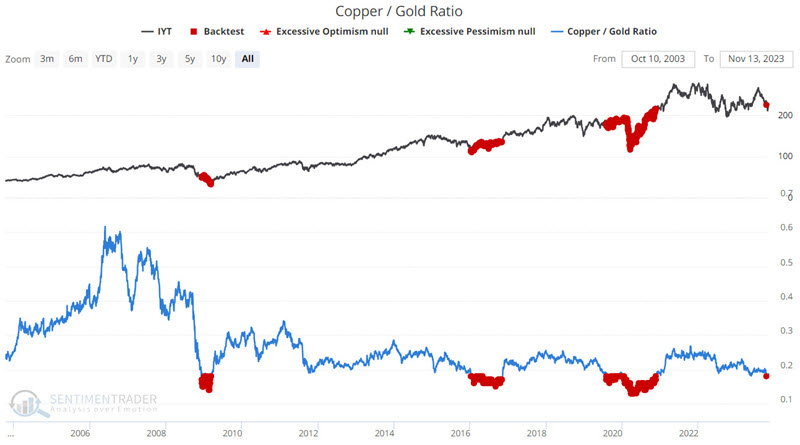
The Copper/Gold Ratio has an apparent impact on the economy - and, by extension, several commodities and commodity-related industries. Because of its heavy reliance on metals and energy-related commodities, the transportation sector often reacts strongly to extremes in the Copper/Gold Ratio.
The chart below highlights all days when the Copper/Gold Ratio stood below 0.18. IYT has been higher 12 months later 100% of the time with spectacular average and median gains of 34% and 25%, respectively.
We do not track corporate insider buying and selling for transports. That said, IYT historically trades with roughly a 90% correlation to the Industrial Select Sector SPDR Fund ETF (XLI). So, factors that affect XLI typically also affect IYT.
Corporate insider selling in XLI constituent stocks has recently plunged to a significantly low level. While insider buying is the best sign, an absence and/or sharp decline in insider selling can also signal an important level of bullishness among executives who know their companies and industries best.
The chart below highlights those dates when our Corporate Insider Sells - XLI indicator crossed below 240 for the first time in six months - but looks at the performance of ticker IYT instead of ticker XLI.
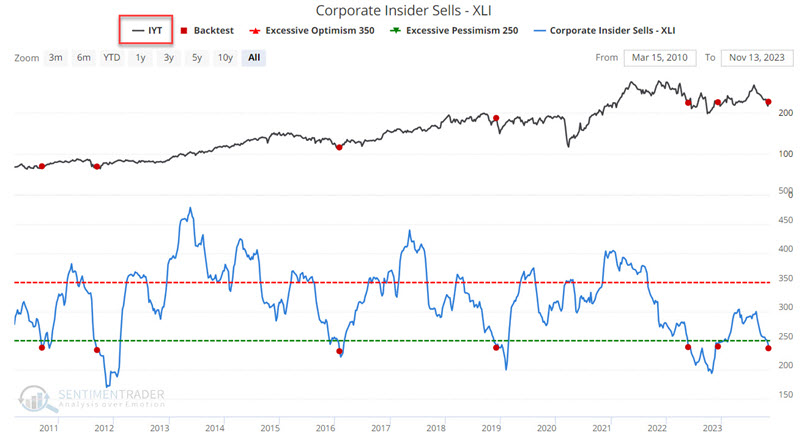
Continued weakness is not uncommon during the first month after a signal but is less common as time goes by. The good news is that IYT was higher 100% of the time twelve months later. This recent signal, therefore, should be considered as potential weight of the evidence and NOT as some automatic buy signal.
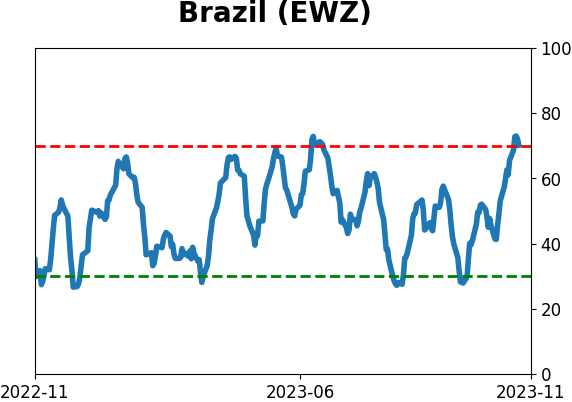
A South American surge
Stocks in Brazil's Ibovespa index have recovered strongly in recent weeks. The recovery has triggered extremes in some breadth indicators for the first time in months and similar surges tended to precede further gains, but non-local investors must consider currency risk.
The jump in stocks in the Ibovespa index triggered a surge in the McClellan Oscillator, which surged above +100. Investors must be willing to buy broadly, persistently, and aggressively for the McOsc to move above that threshold. When triggered for this index, it signaled that investors were willing to stick around for the medium term.
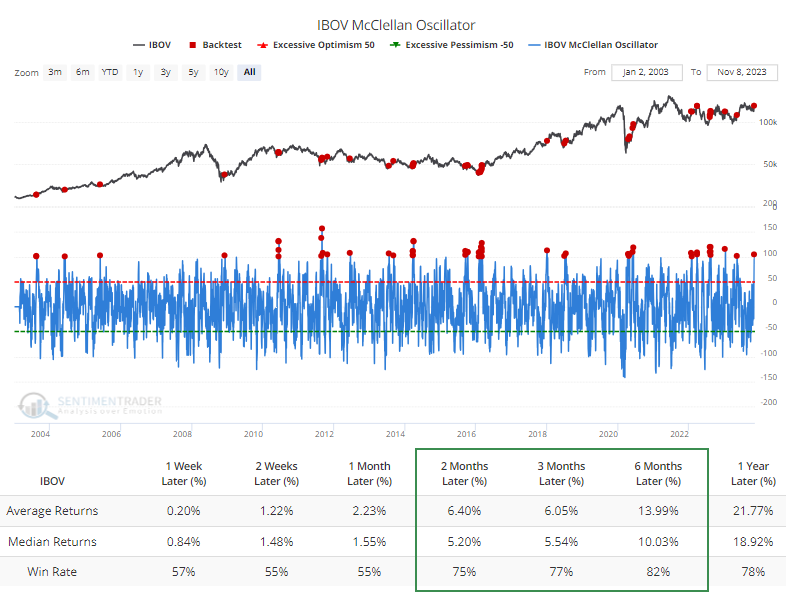
Thanks to a jump in the Oscillator, a 20-day average of the longer-term McClellan Summation Index has turned higher from a severely oversold condition. Two months after similar recoveries, the Ibovespa was higher 86% of the time.
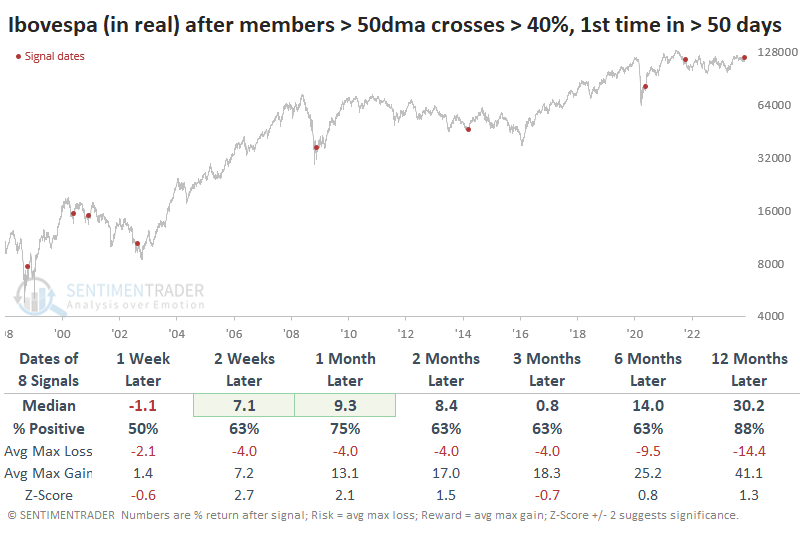
The percentage of member stocks in the index trading above their 50-day averages hadn't been able to rise above 40% for months before finally doing so recently. That streak of nearly three months without more than 40% of stocks trading above their 50-day average was tied for the 5th-longest streak in the past 25 years.
The table below shows returns in the Ibvospa after it finally saw more than 40% of stocks trade above their medium-term averages. It wasn't a perfect buy signal, with a couple of double-digit losses within a month. All but one of them preceded long-term recoveries, however.
For U.S.-based investors, currency swings have a significant impact on this index. The only currency-hedged ETF I could find has liquidated, and I'm unaware of another good option. In dollar terms, and for a popular fund like EWZ, these signals were not nearly as effective. Five of the eight signals showed a loss over the next three months, and 6-12 months later, three sported double-digit losses.
About TradingEdge Weekly...
The goal of TradingEdge Weekly is to summarize some of the research published to SentimenTrader over the past week. Sometimes there is a lot to digest, and this summary highlights the highest conviction or most compelling ideas we discussed. This is NOT the published research; rather, it pulls out some of the most relevant parts. It includes links to the published research for convenience, and if you don't subscribe to those products, it will present the options for access.
Indicators at Extremes
|
|
|
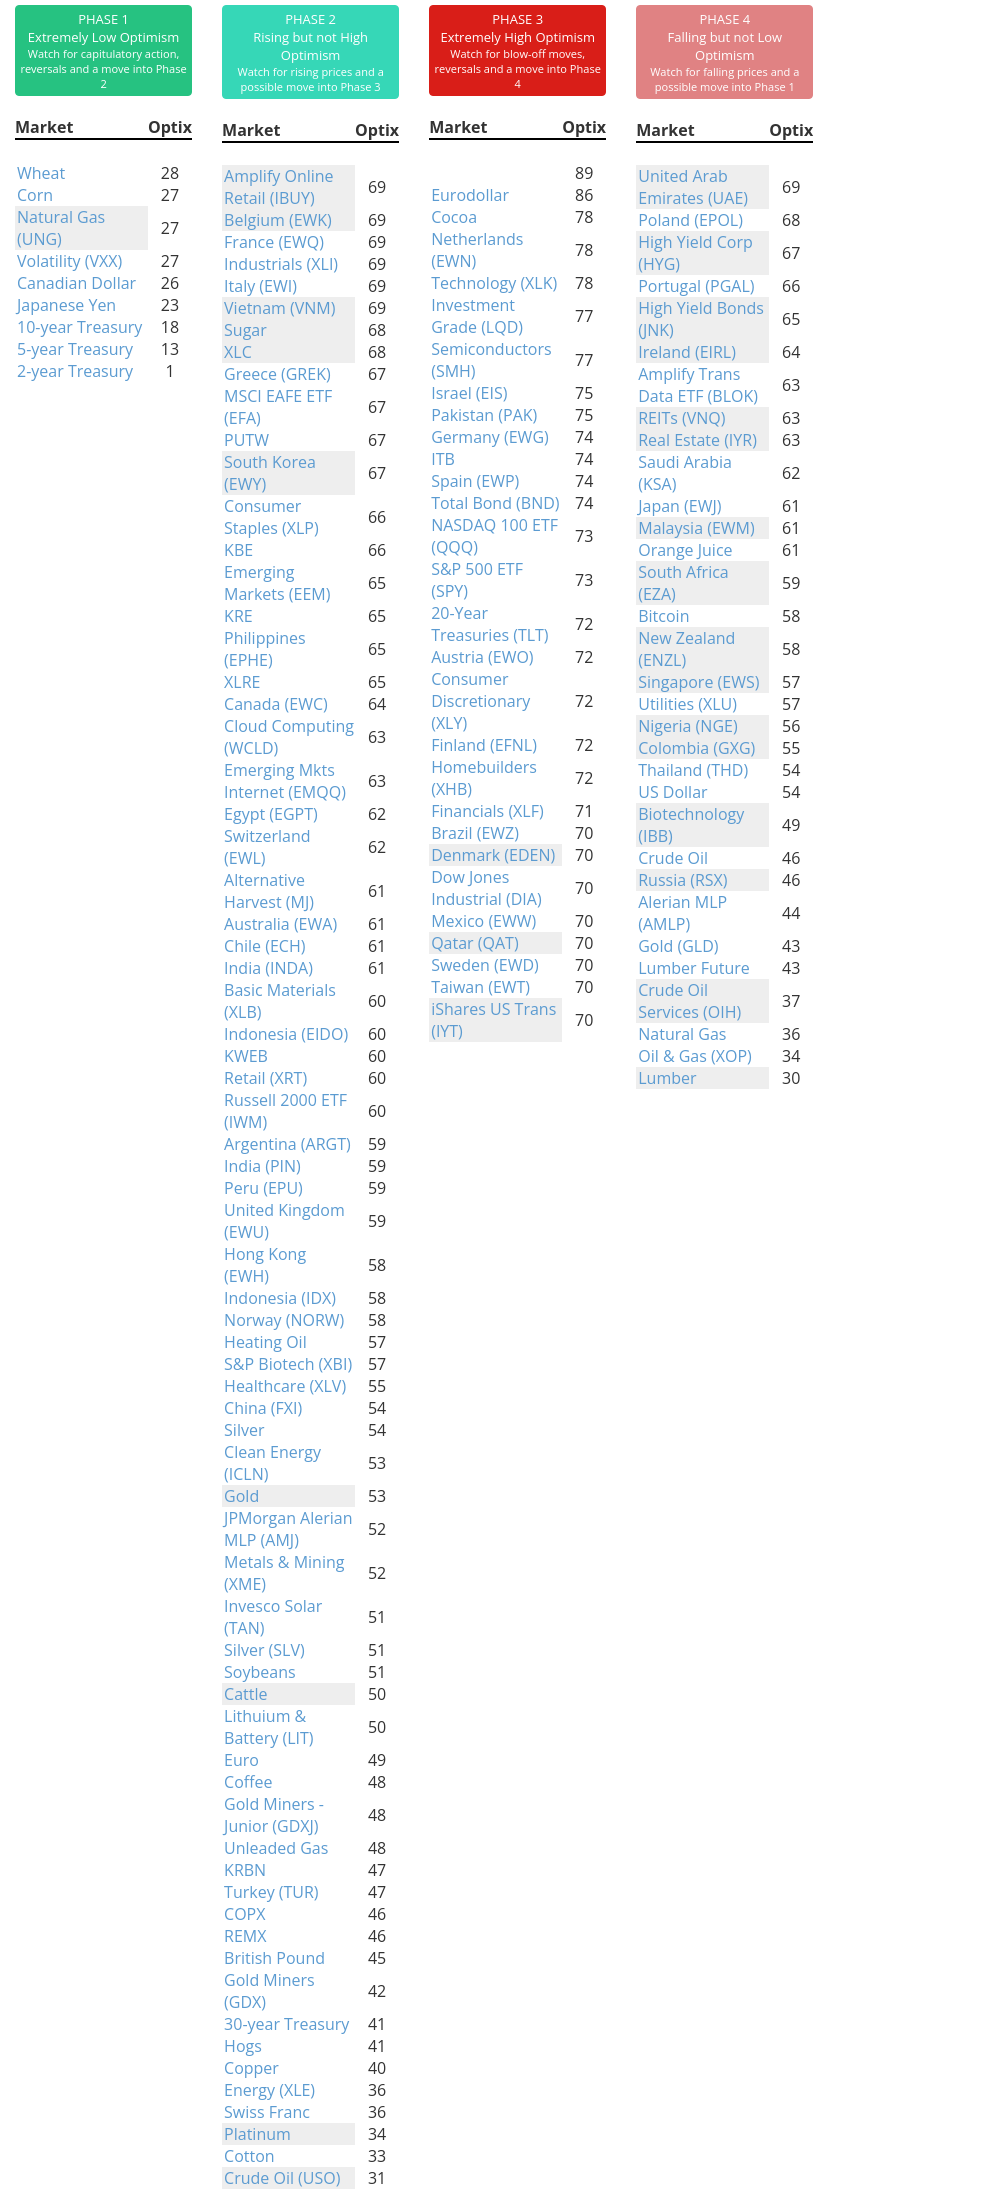
Phase Table
|
|
|
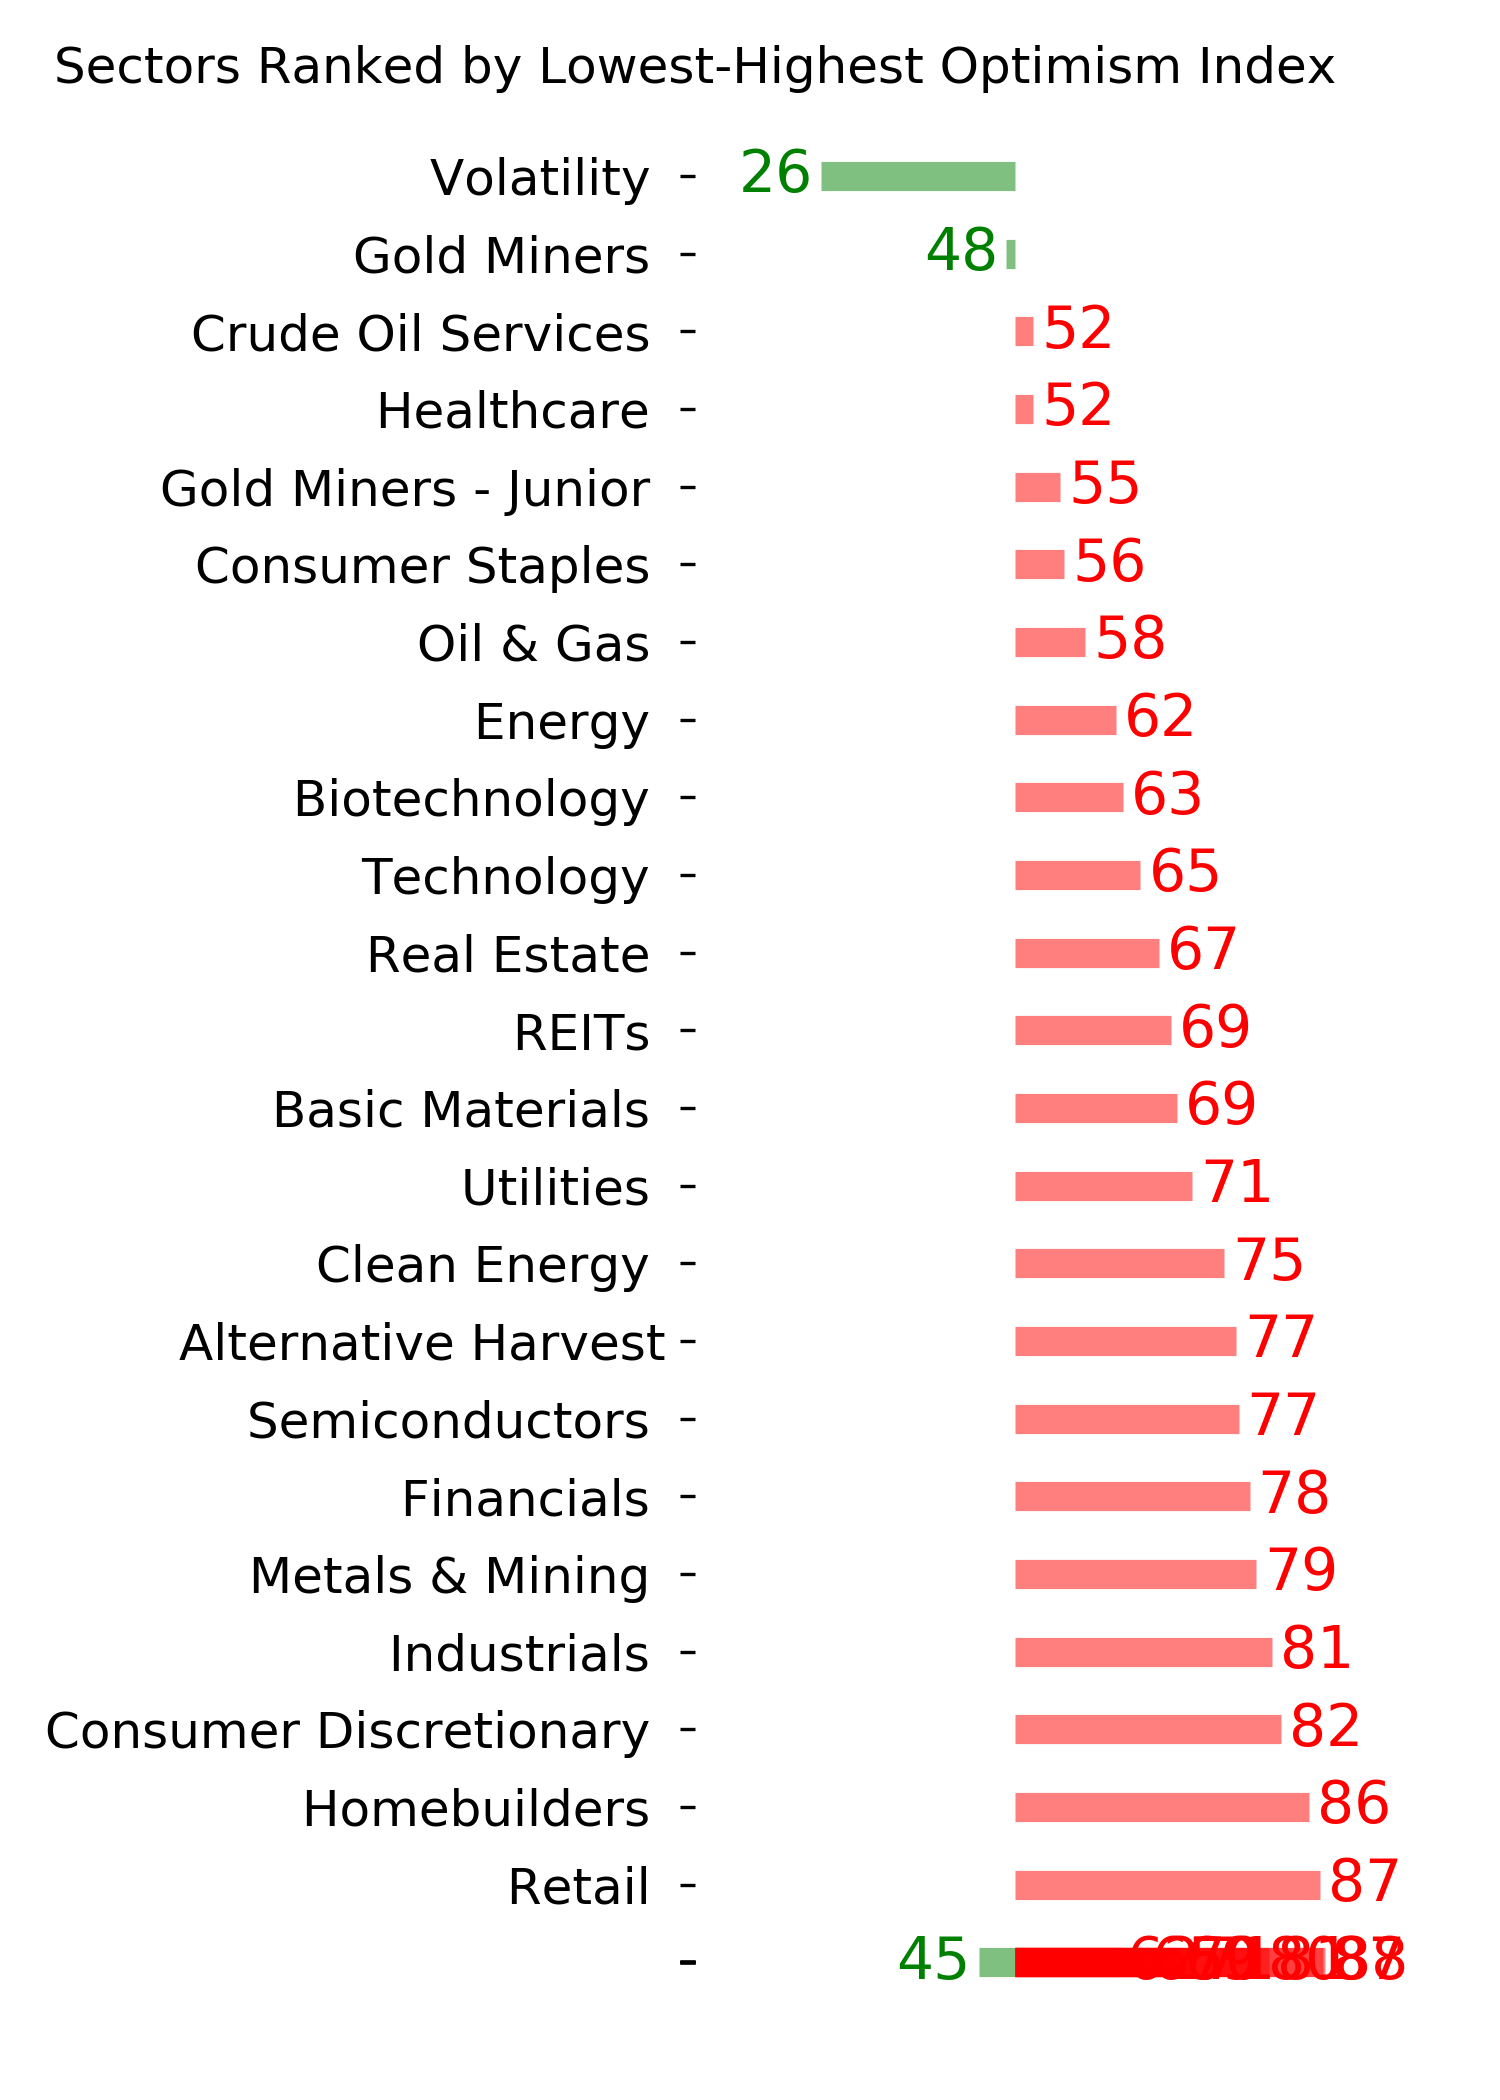
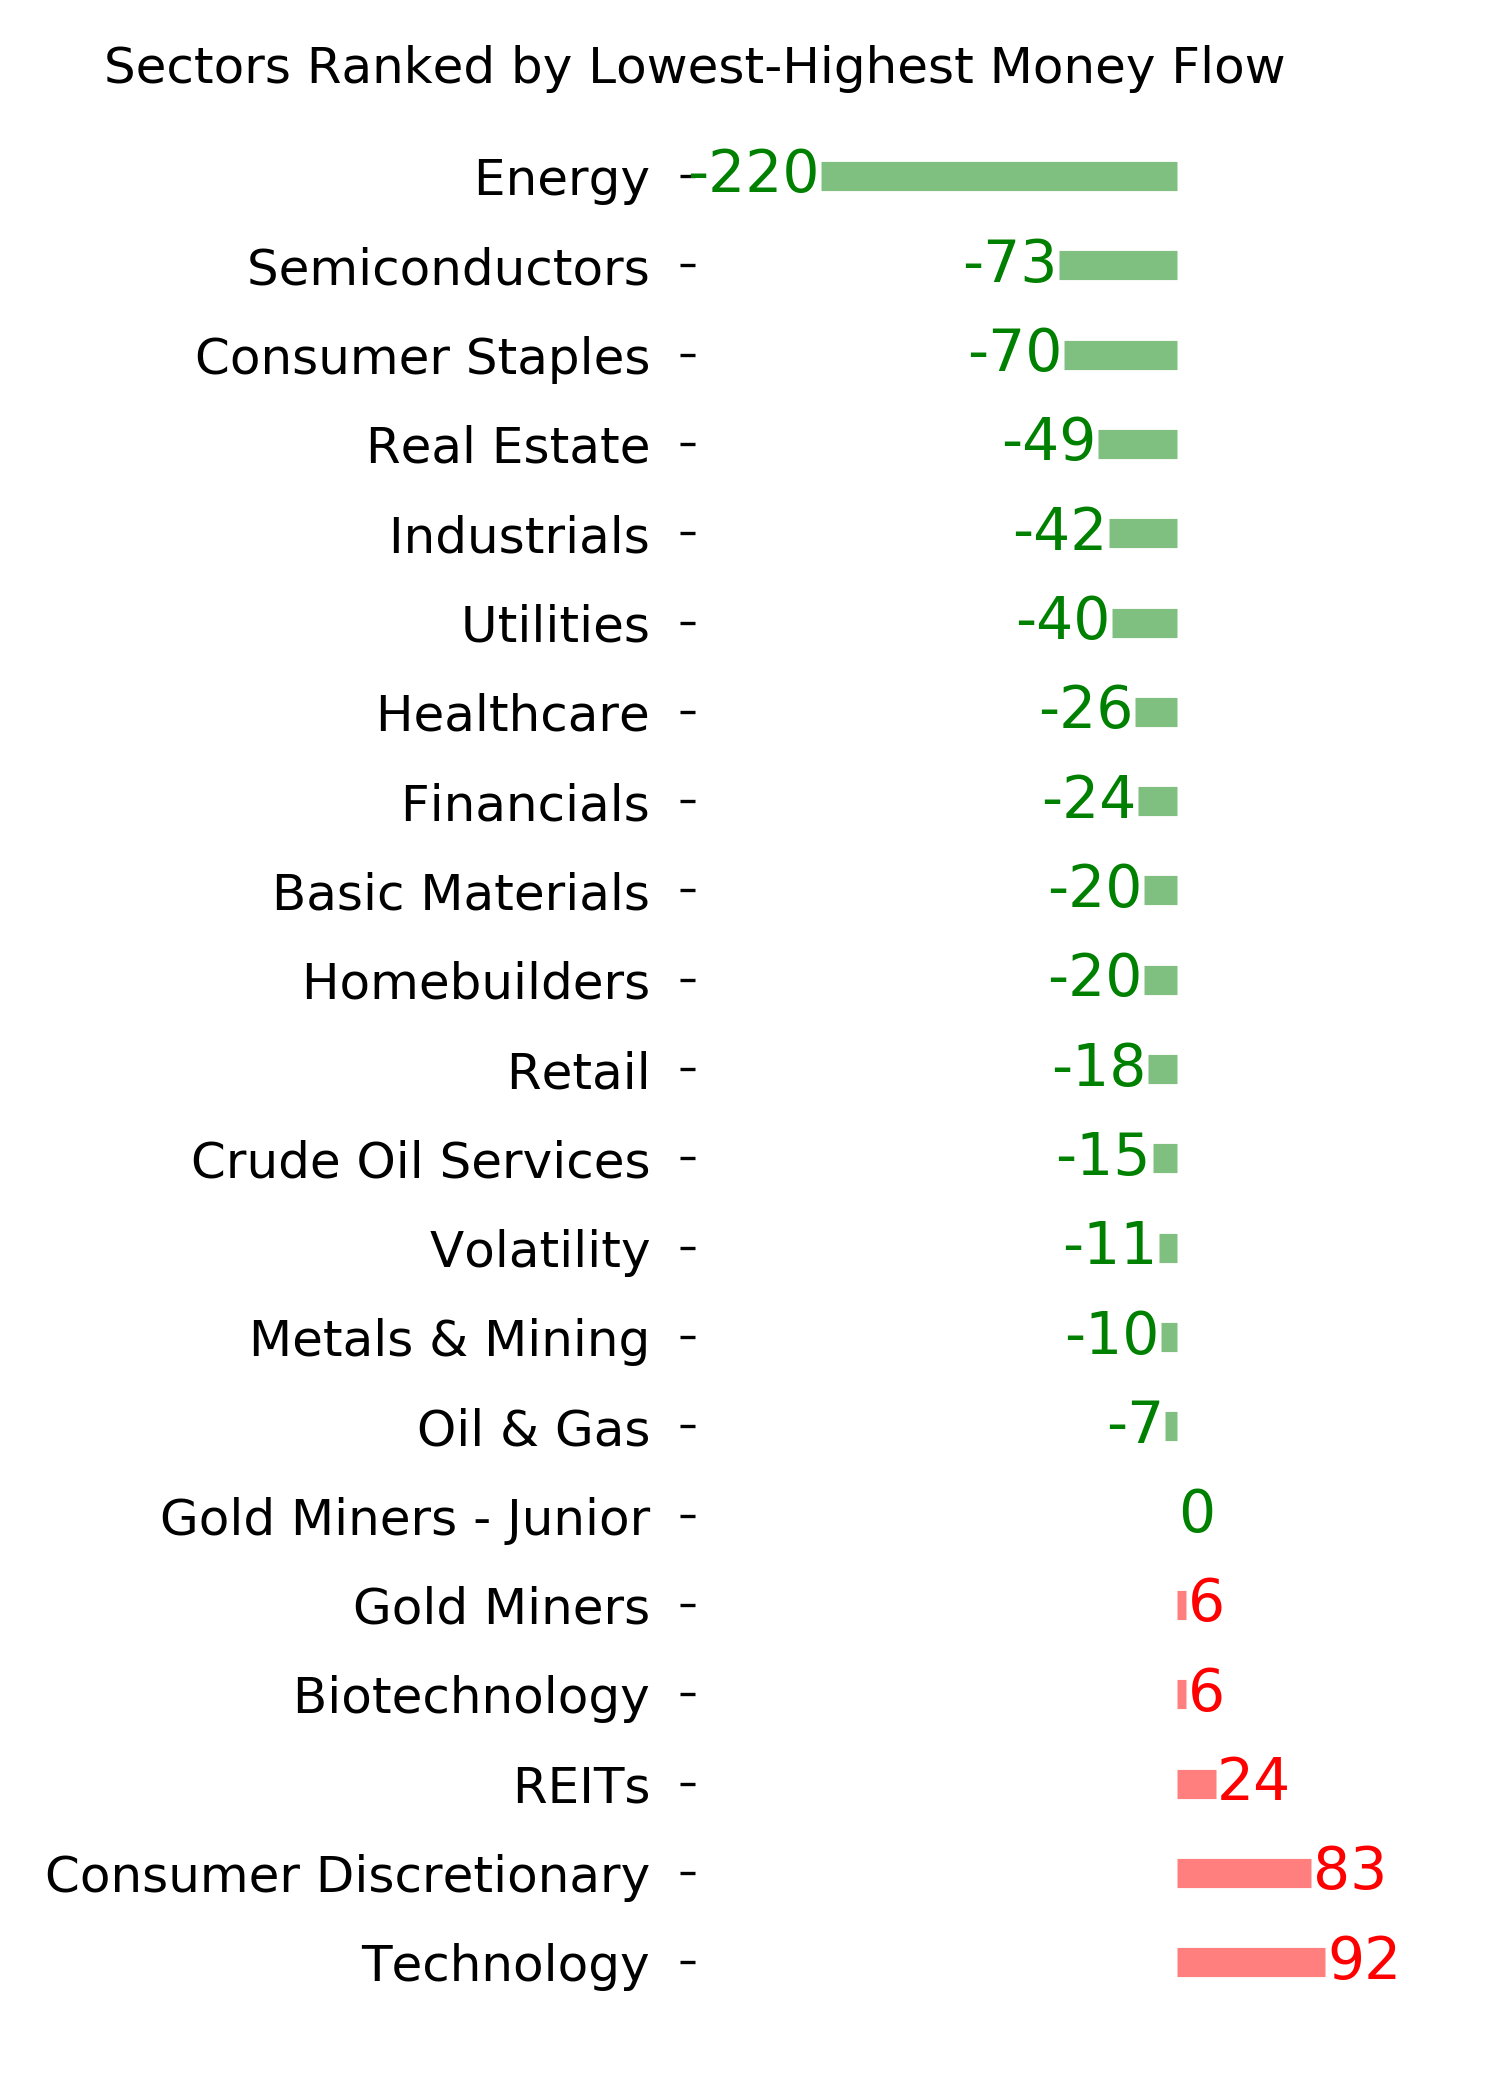
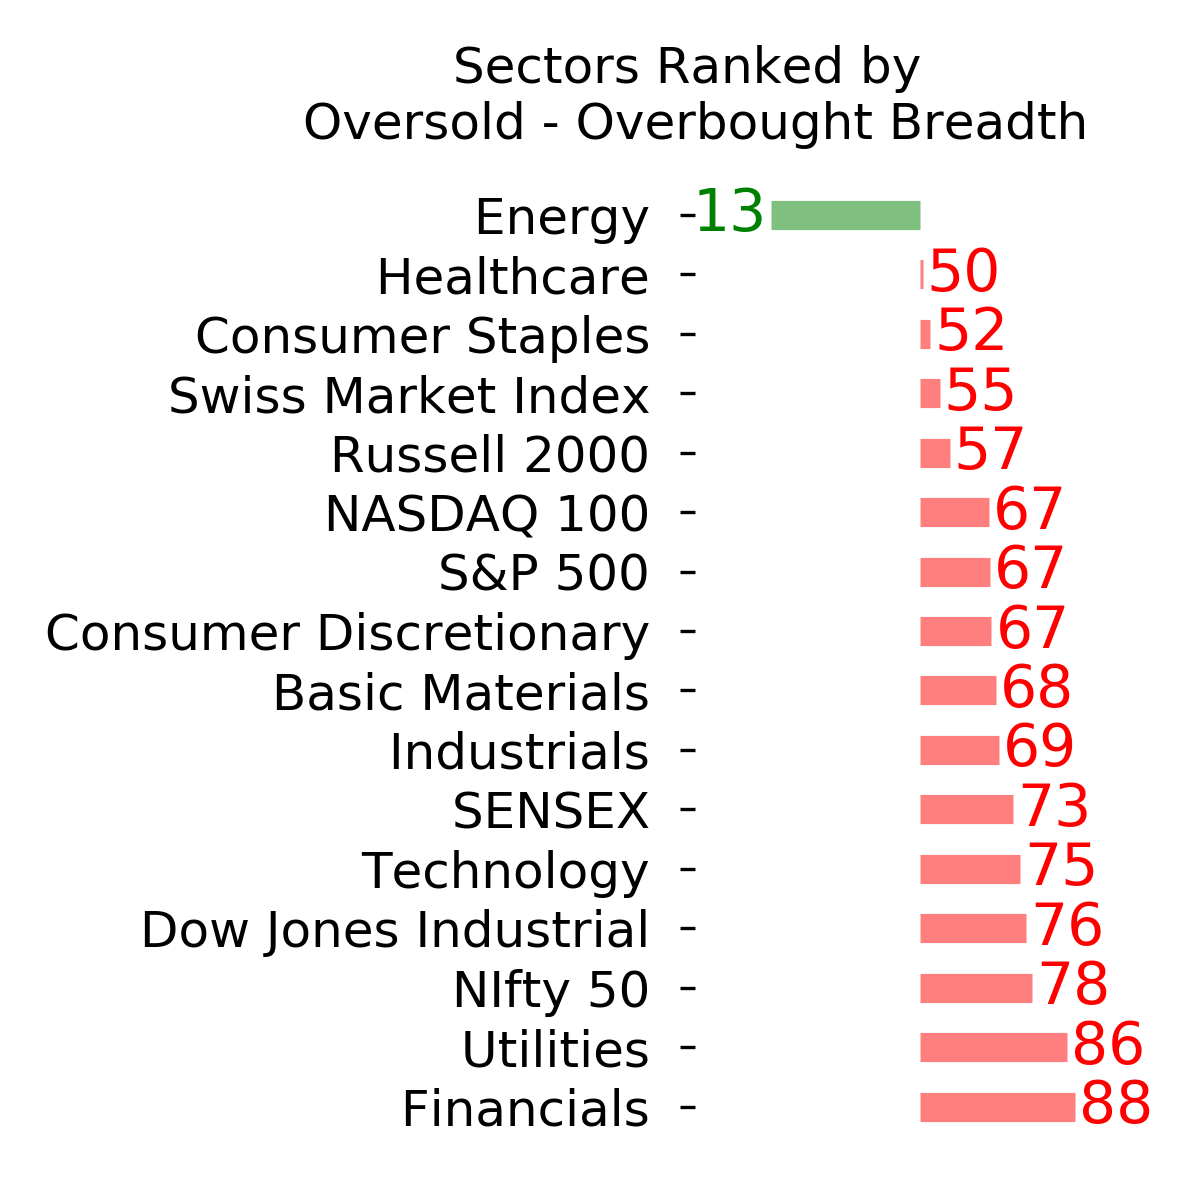
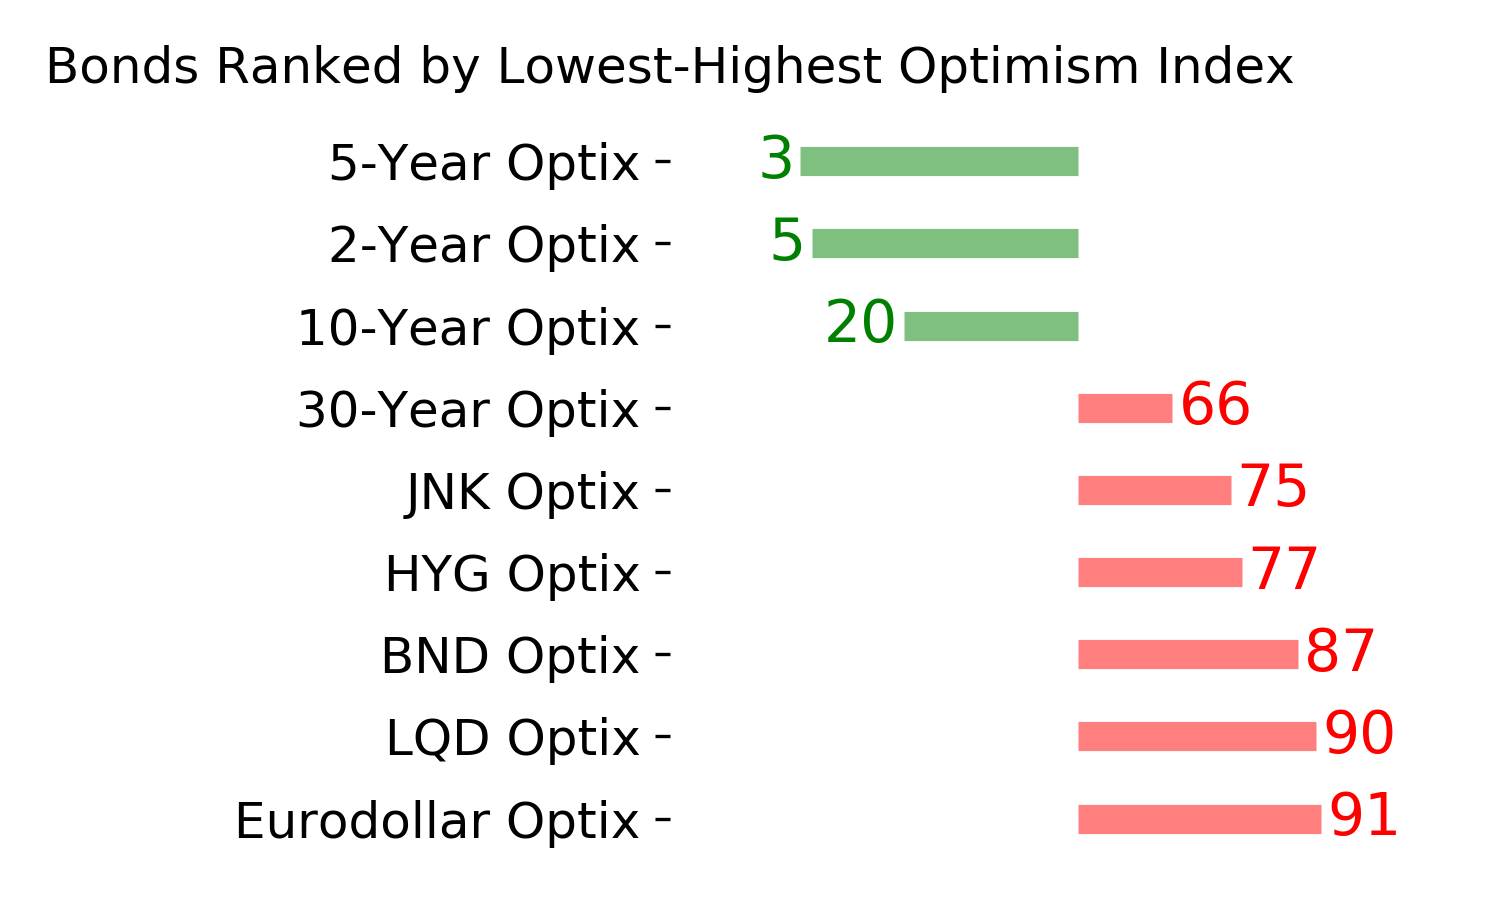
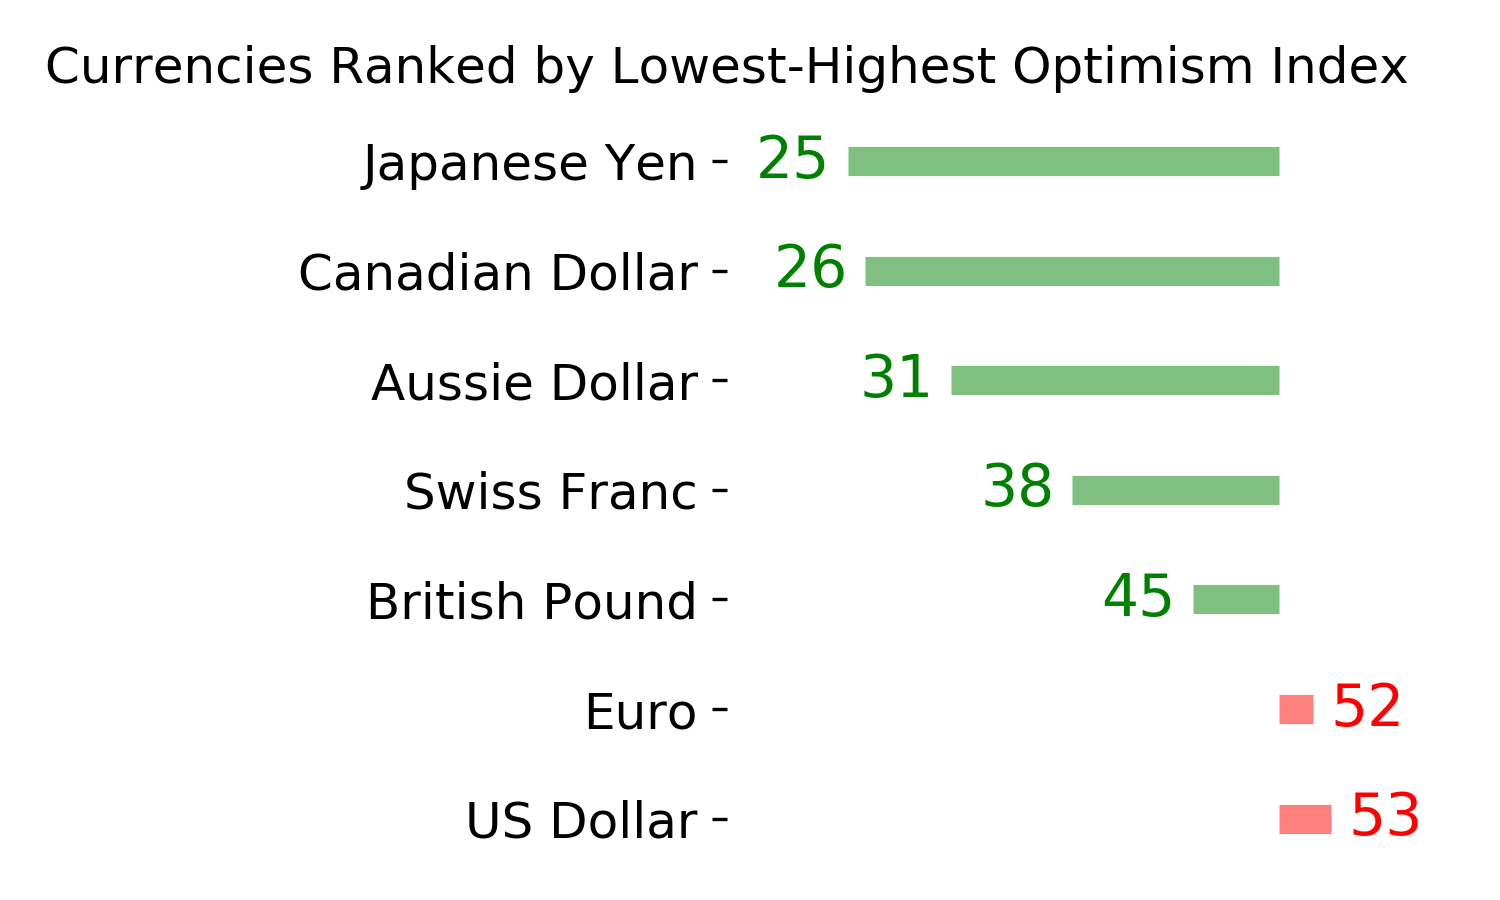
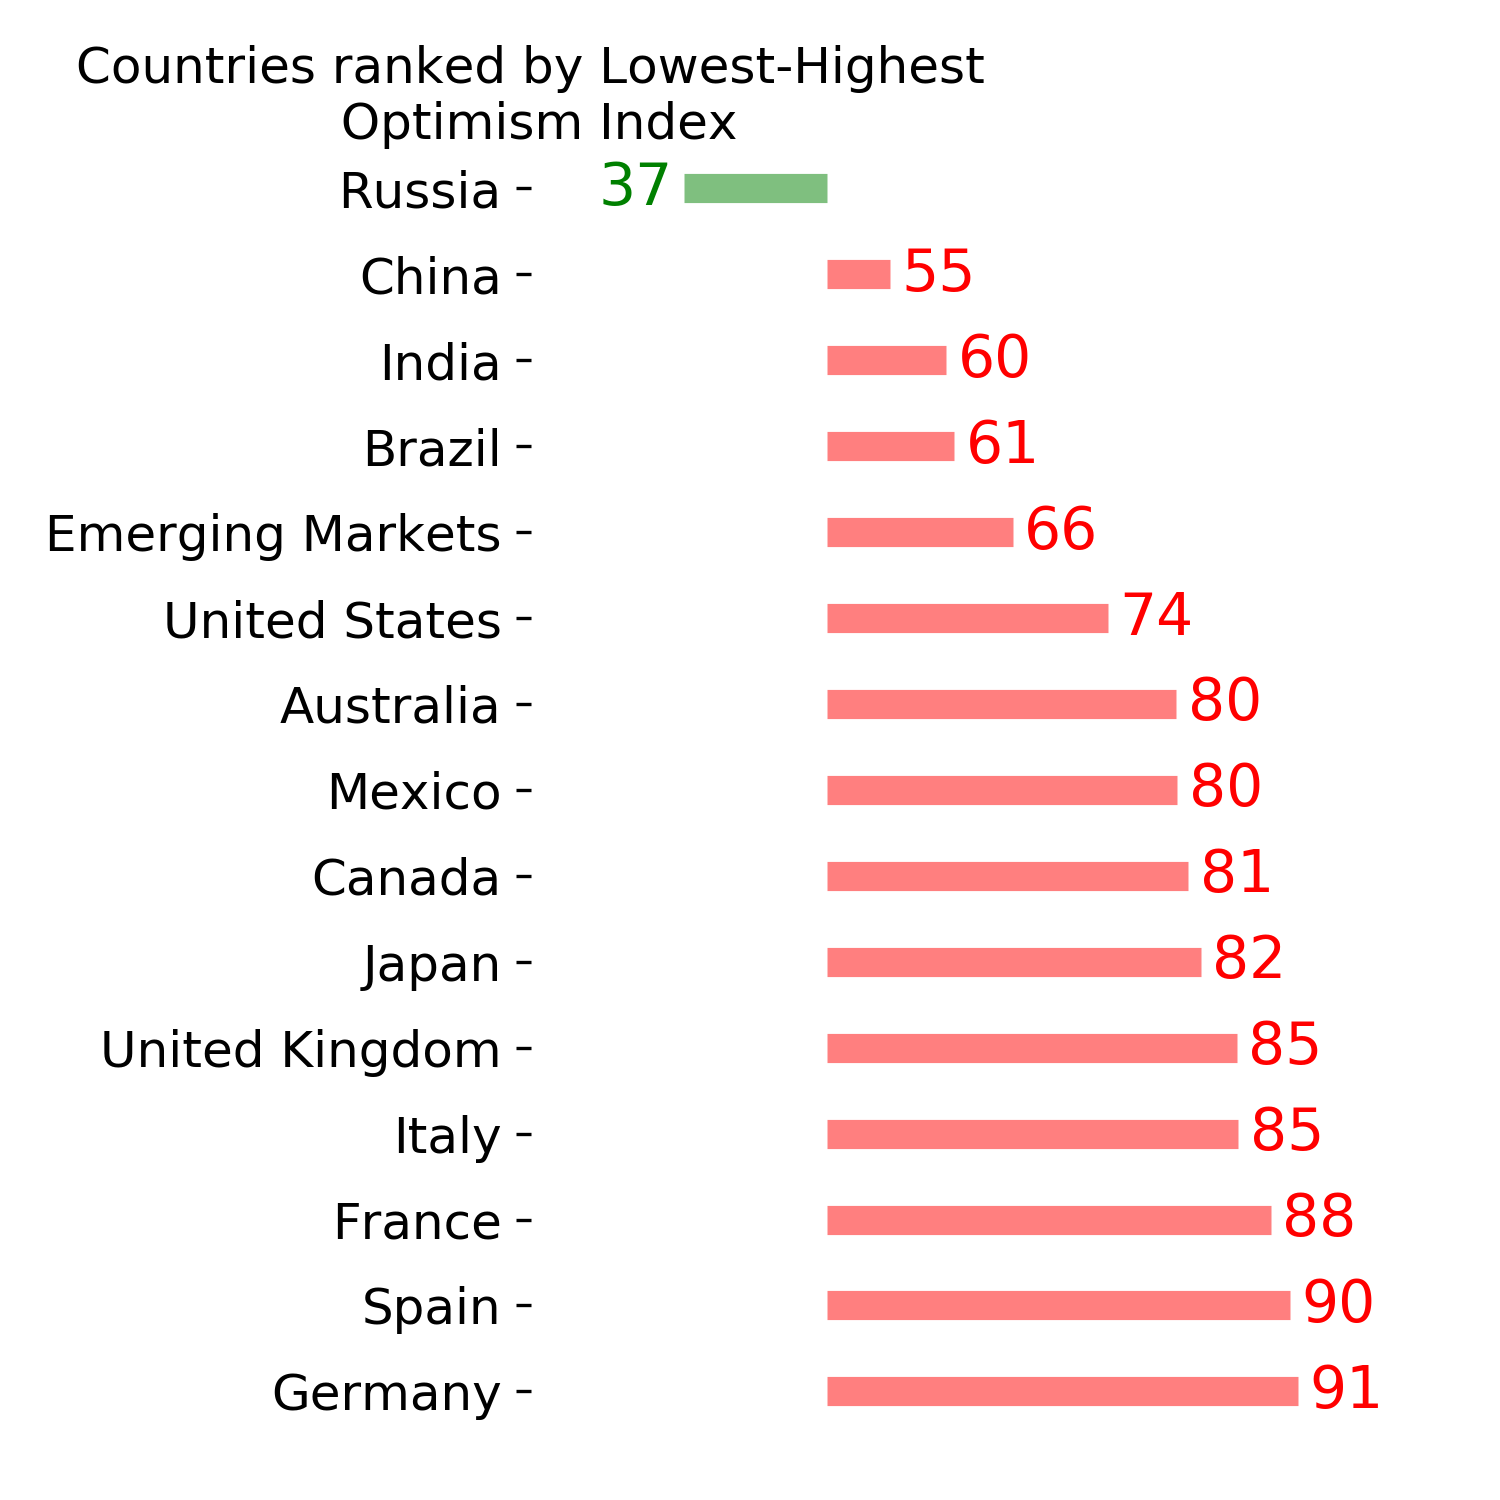
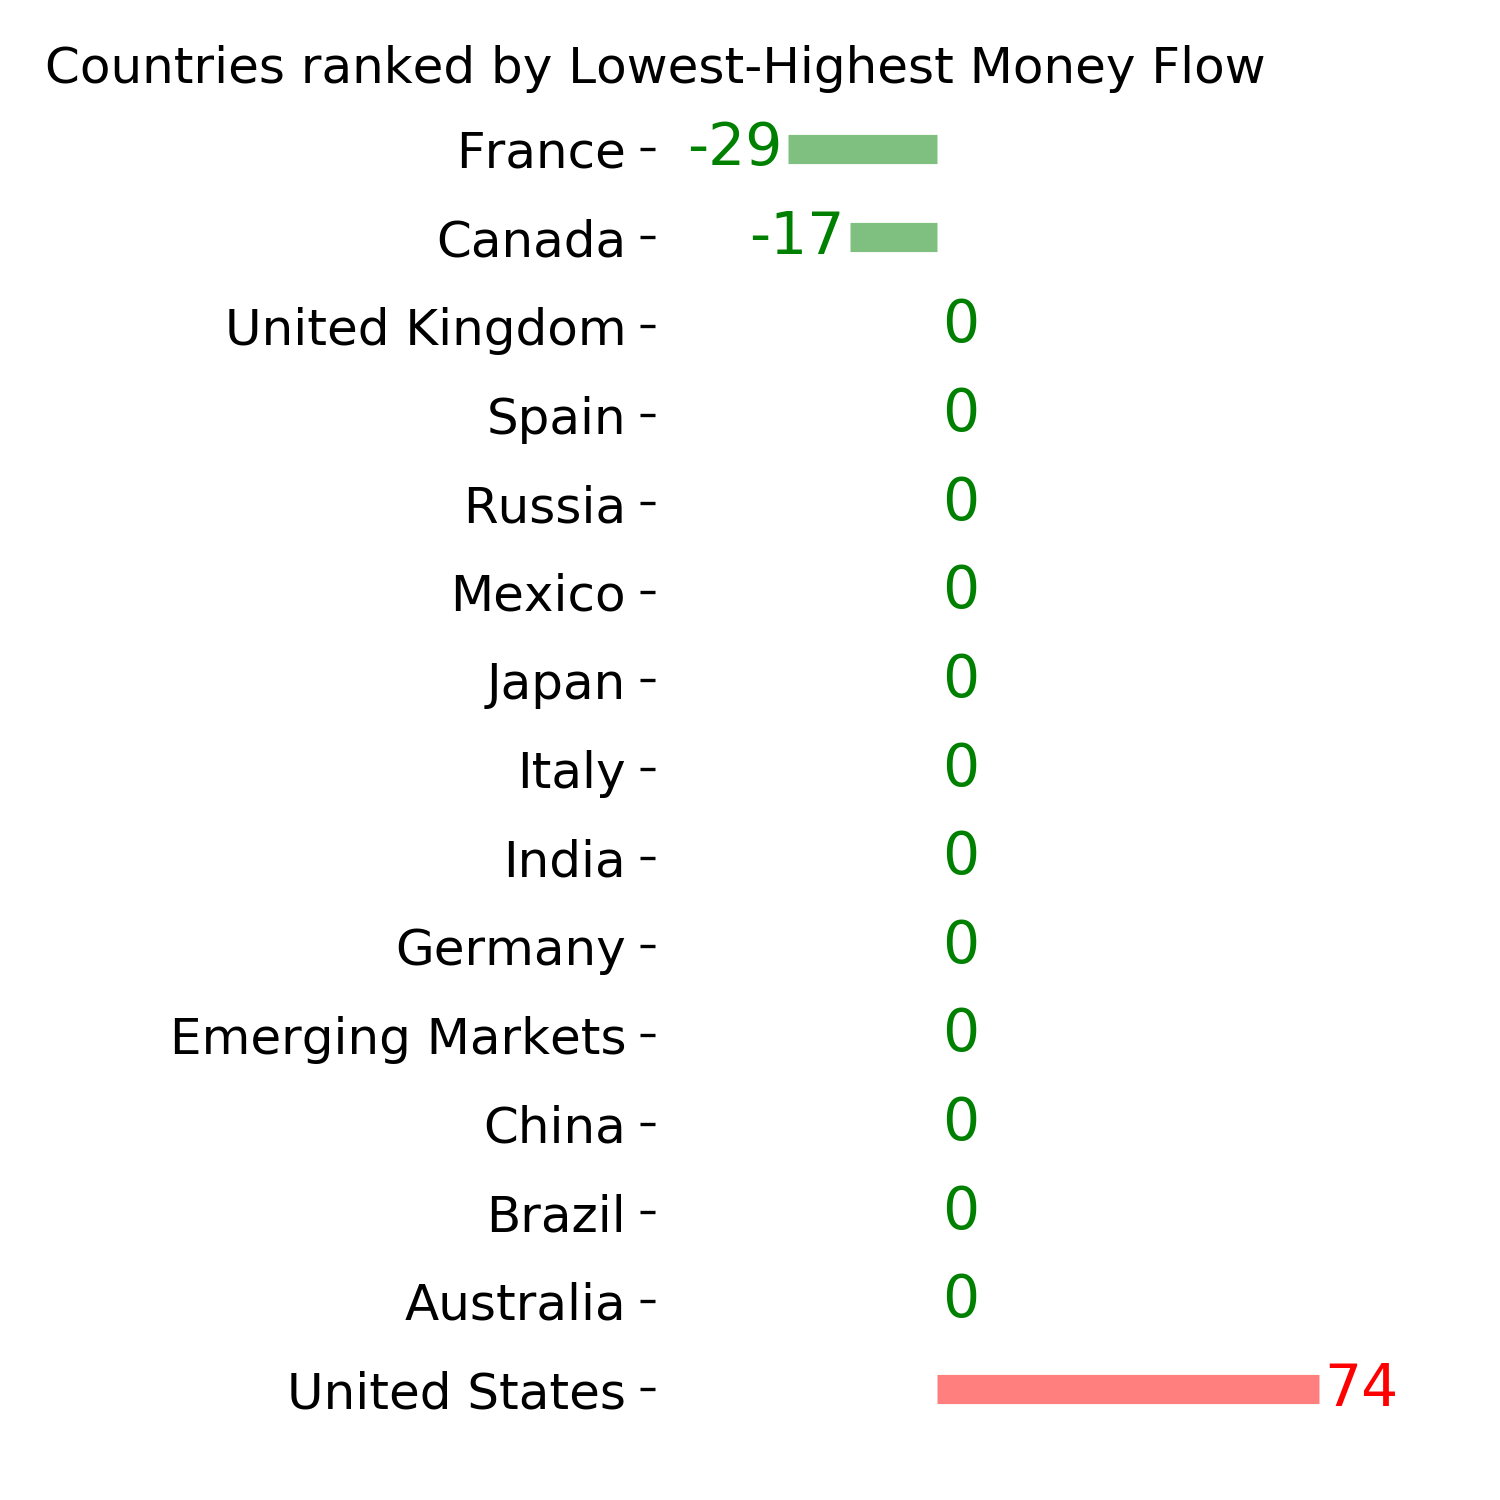
Ranks
|
|
|
|
|
|
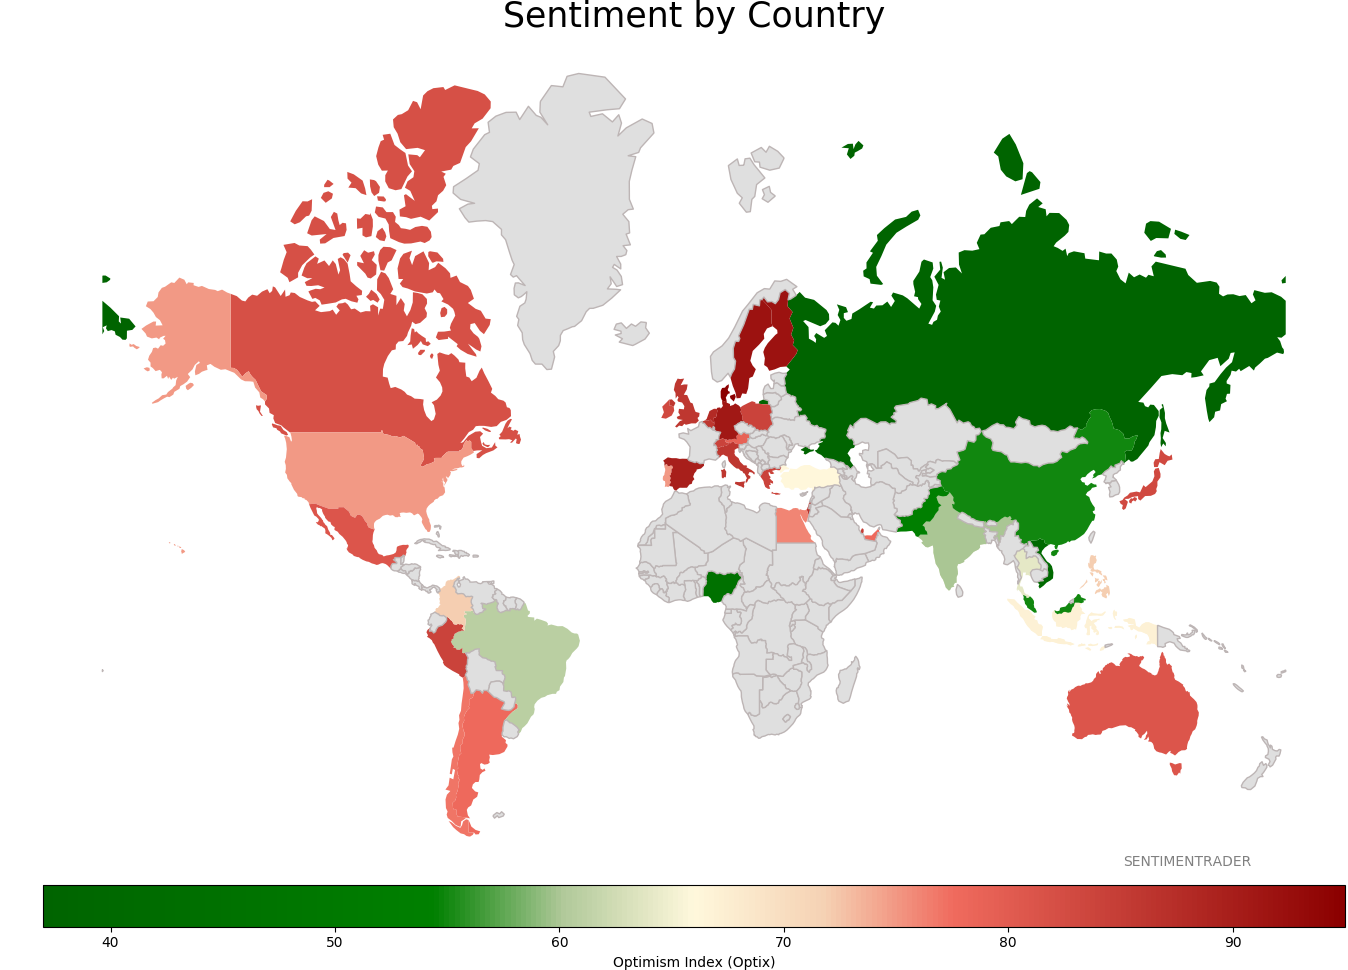
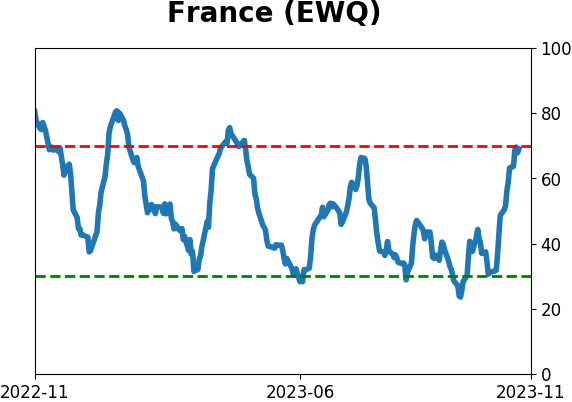
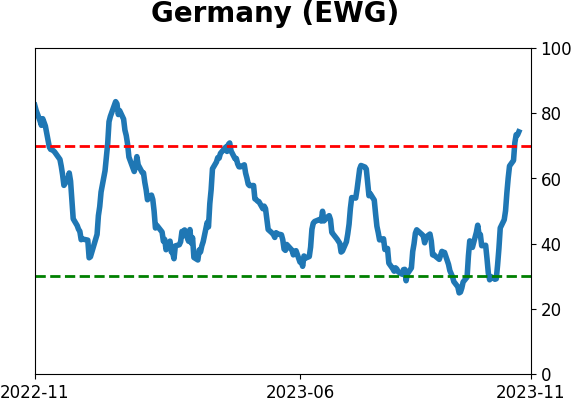
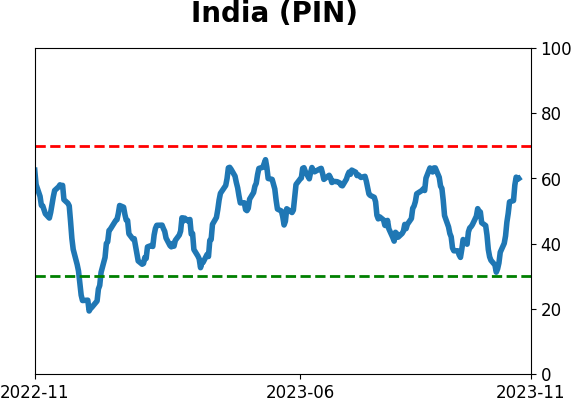
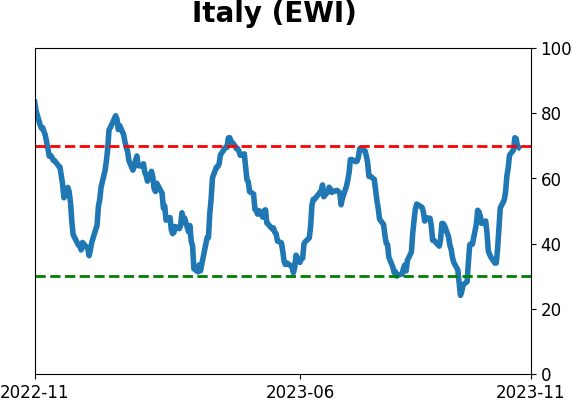
Sentiment Around The World
|
|
|
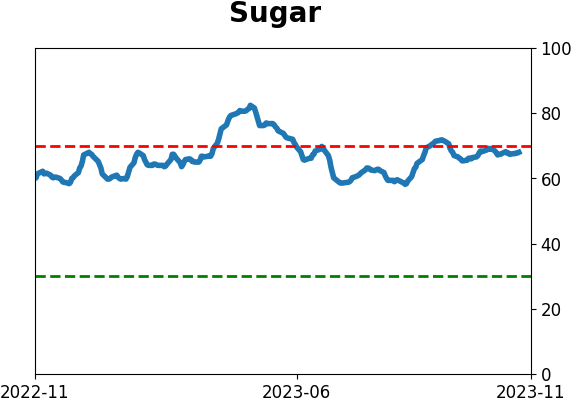
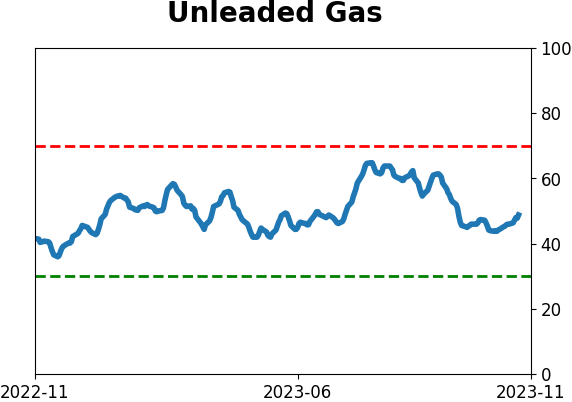
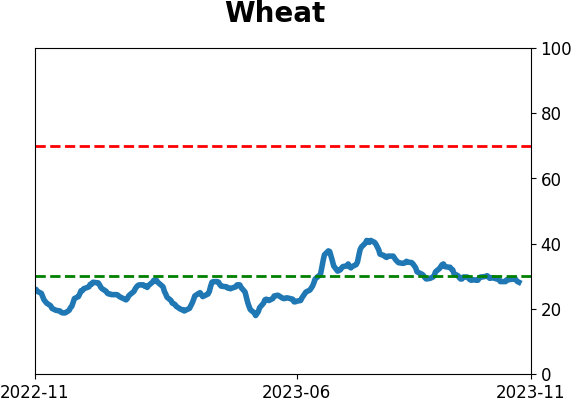
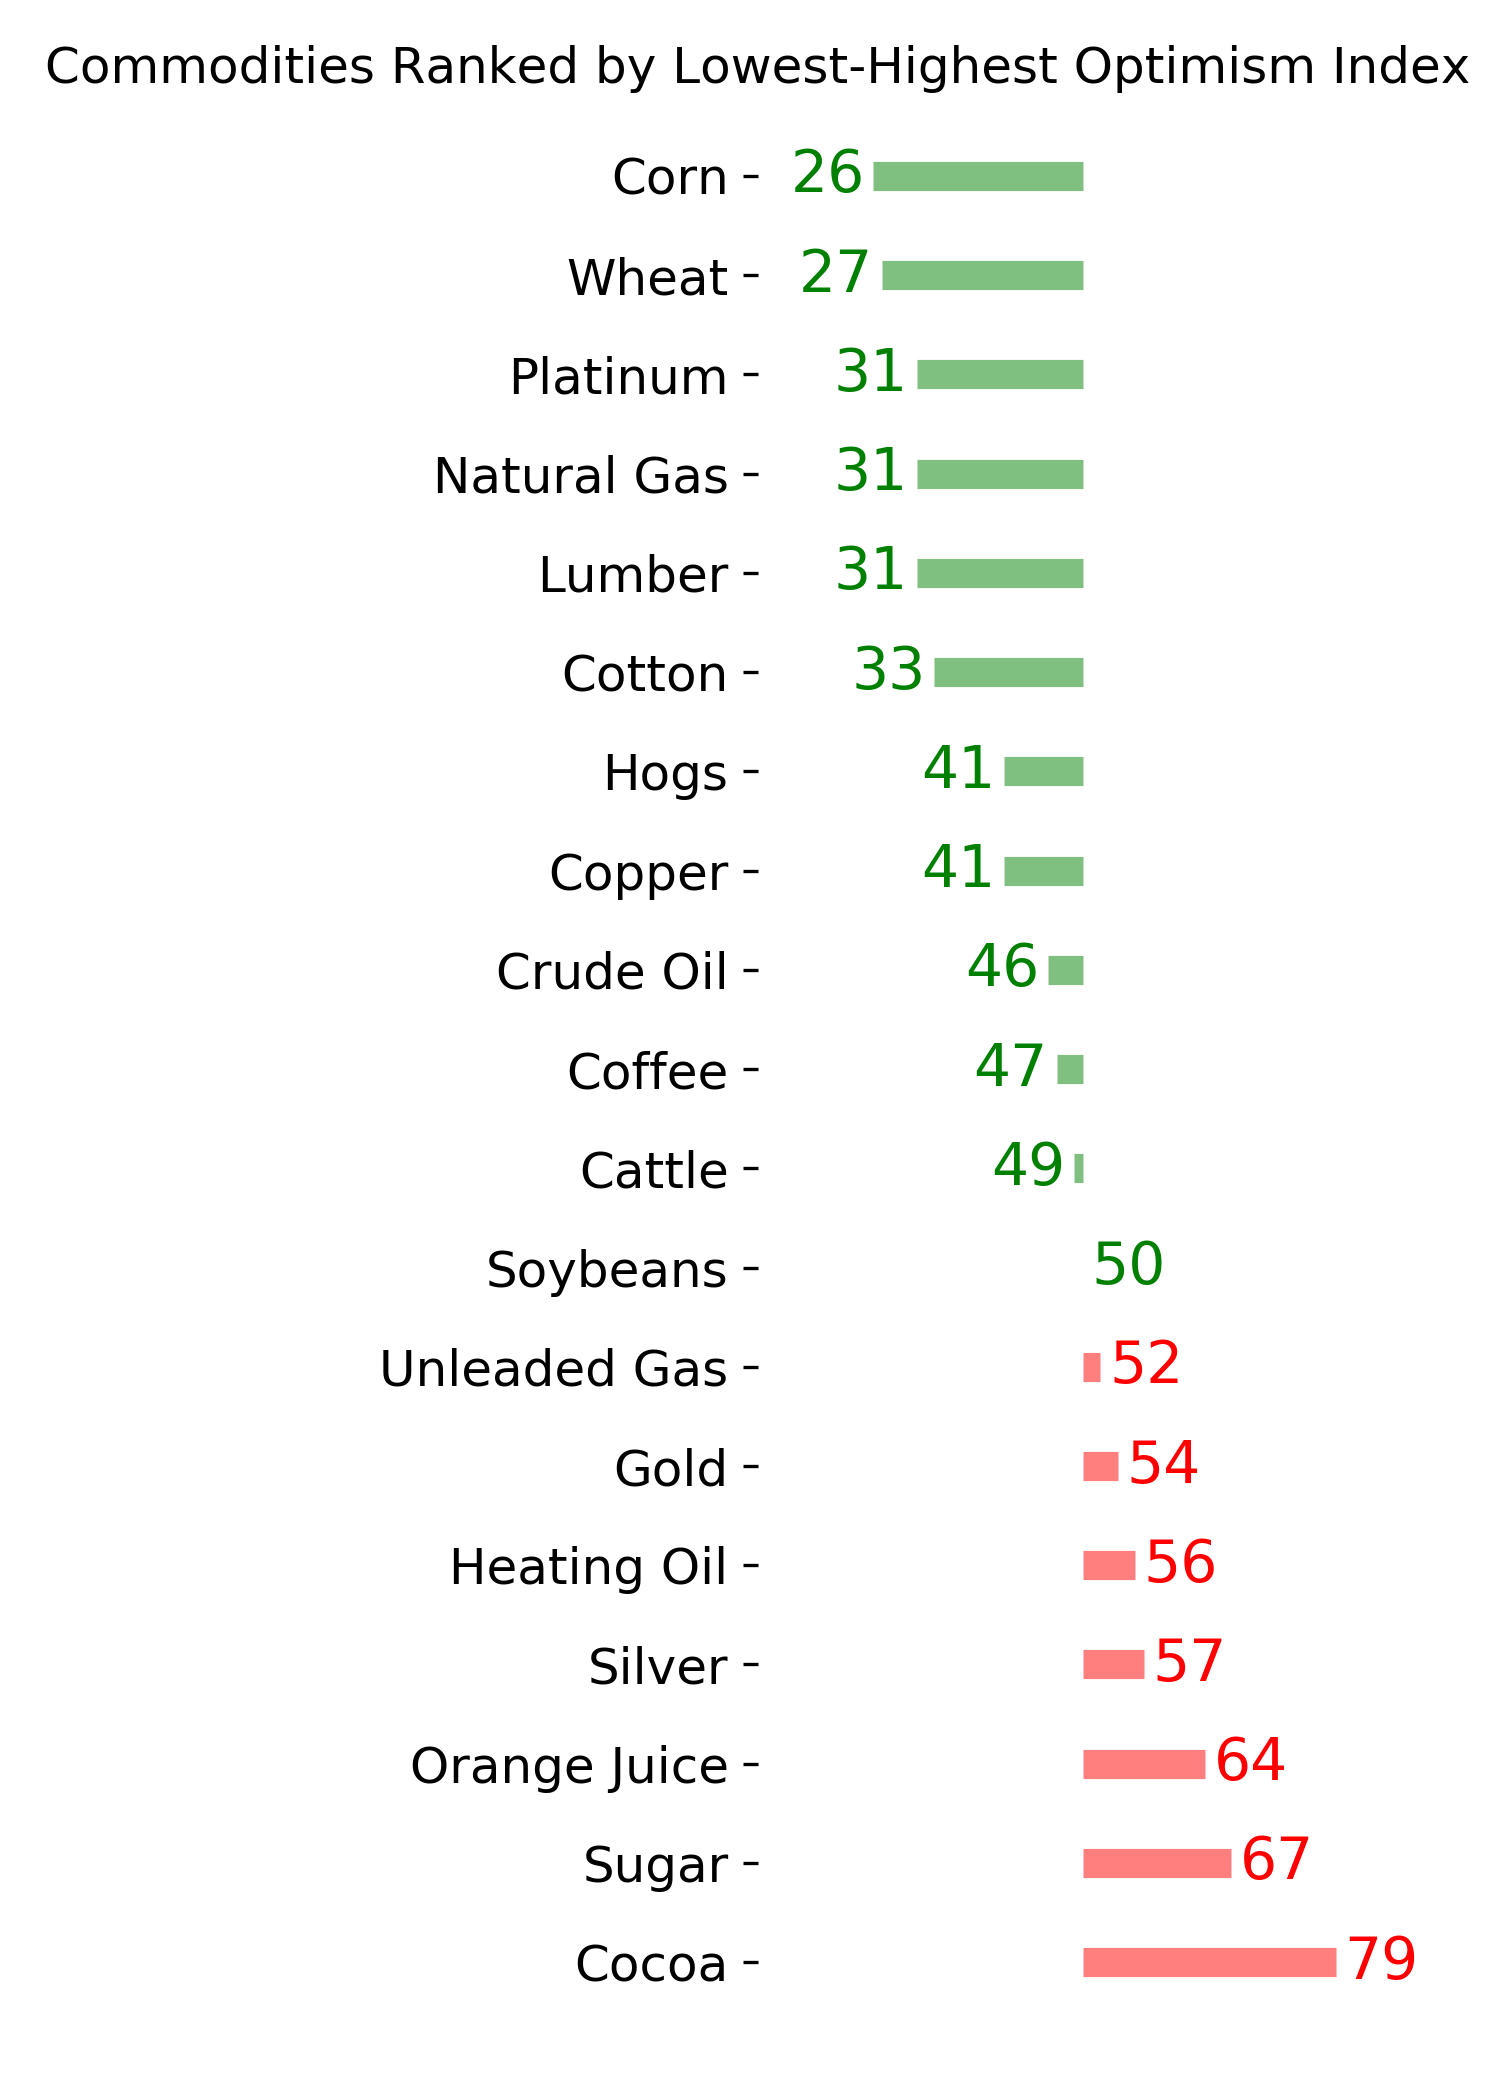
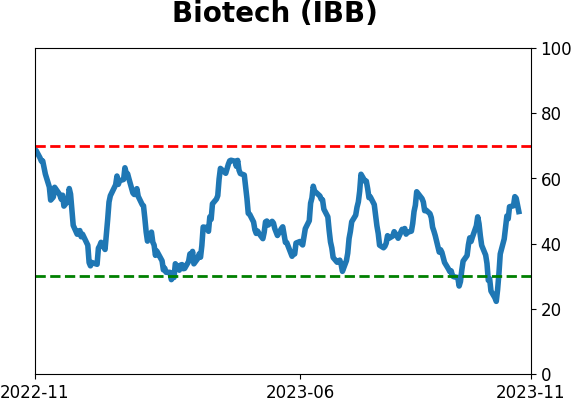
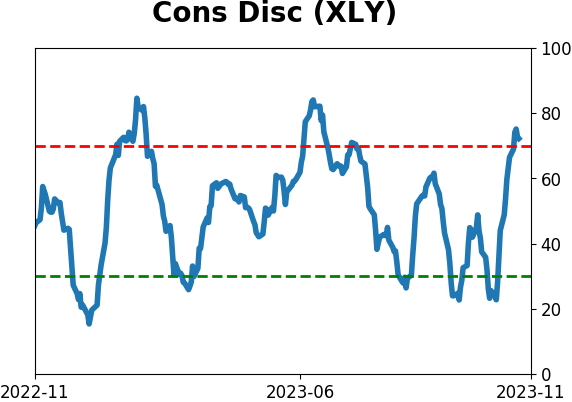
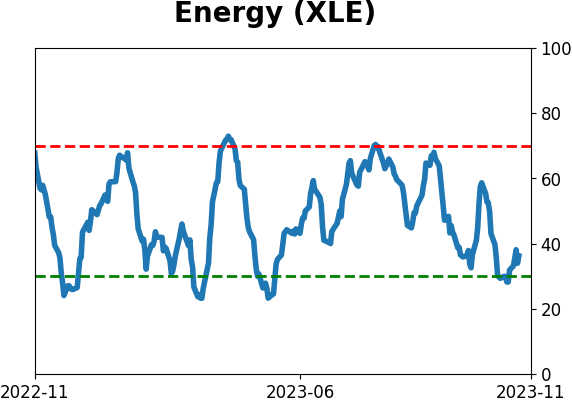
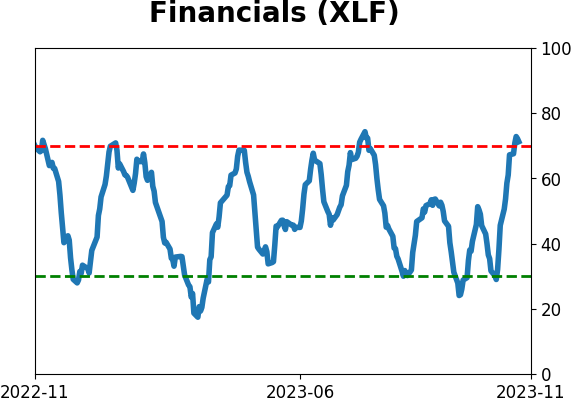
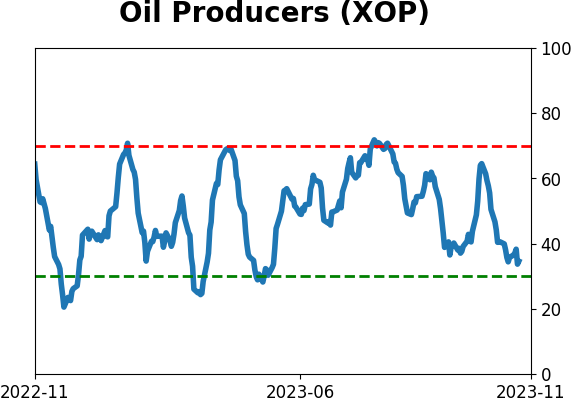
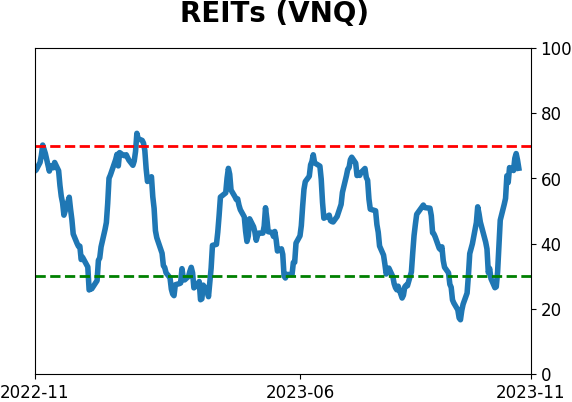
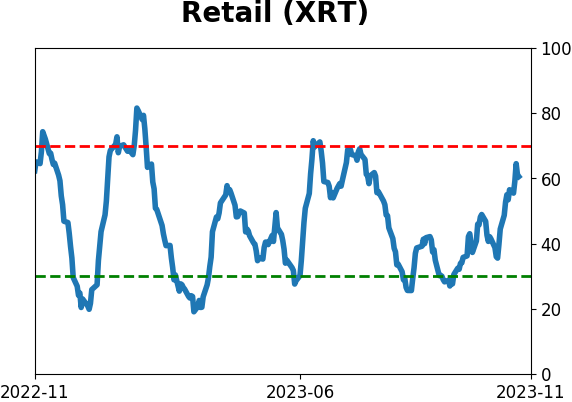
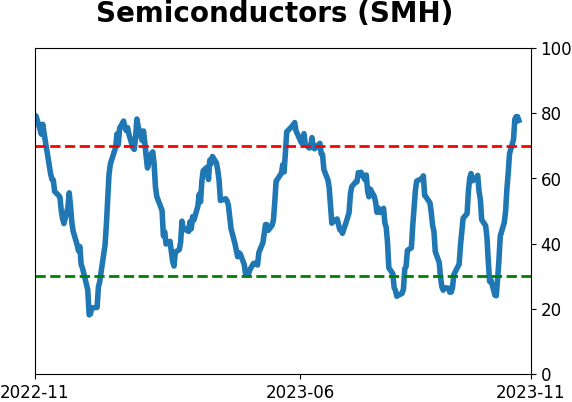
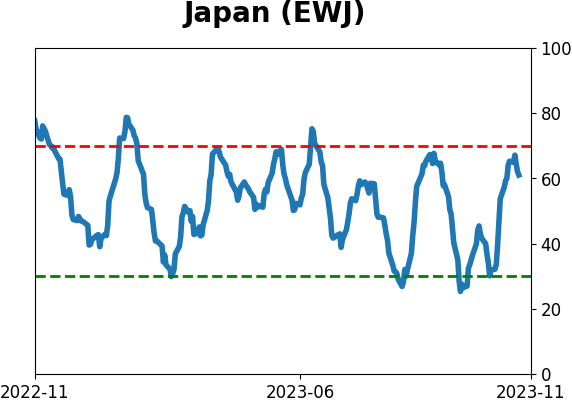
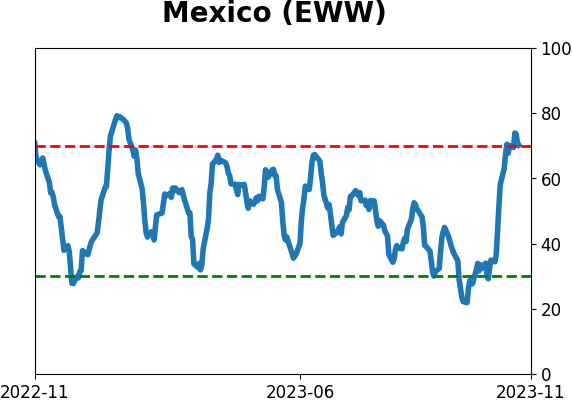
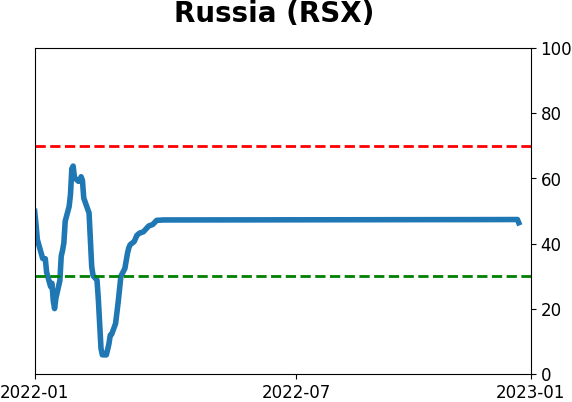
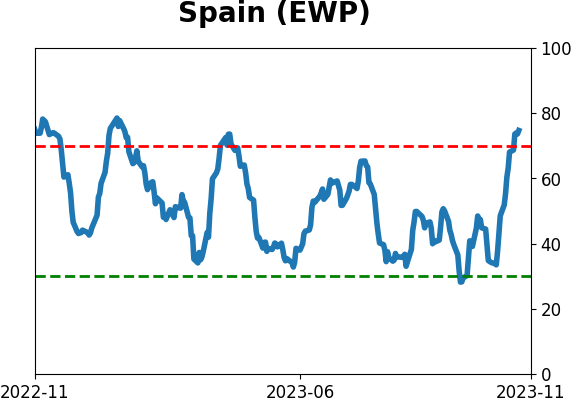
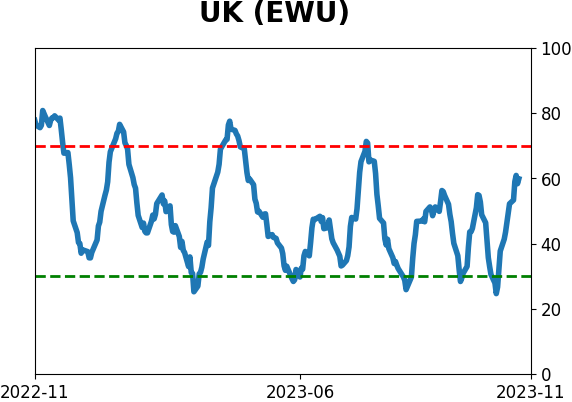
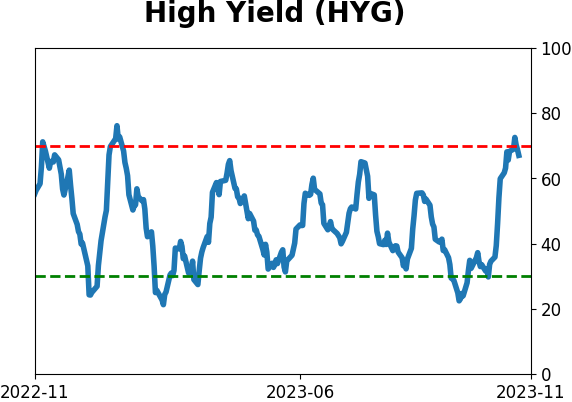
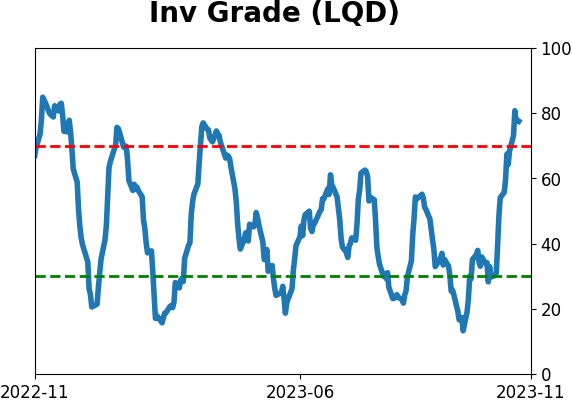
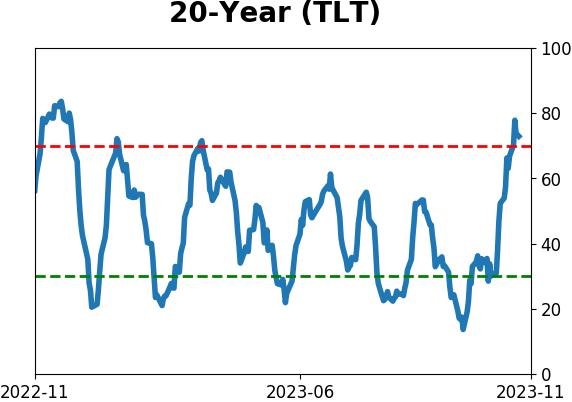
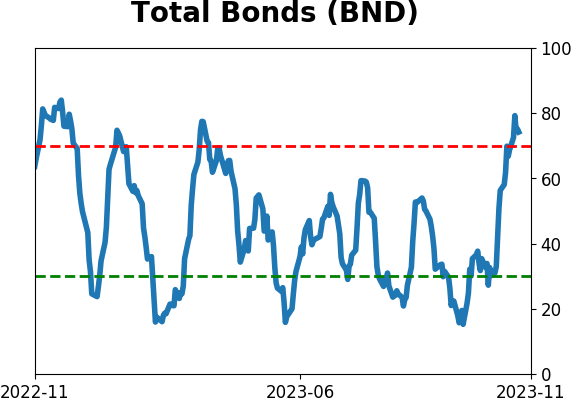
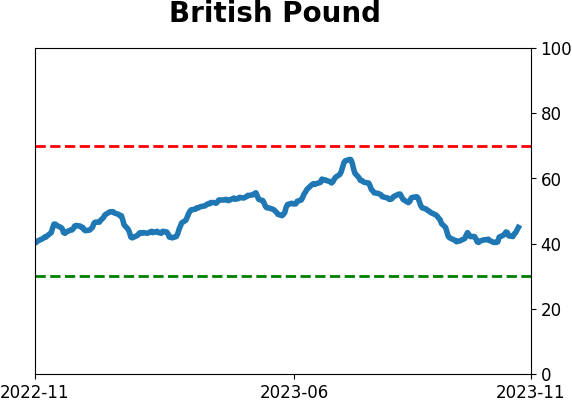
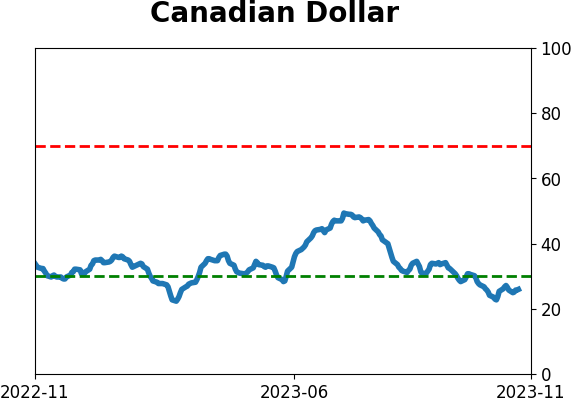
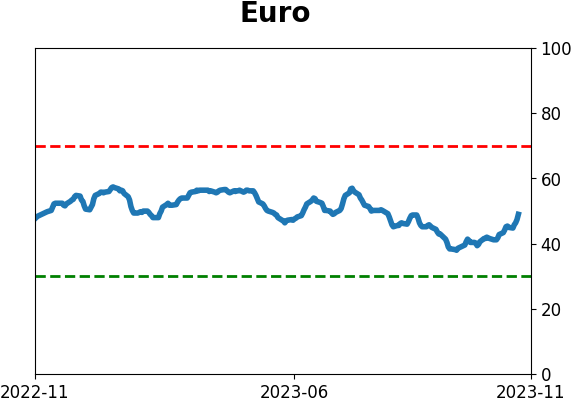
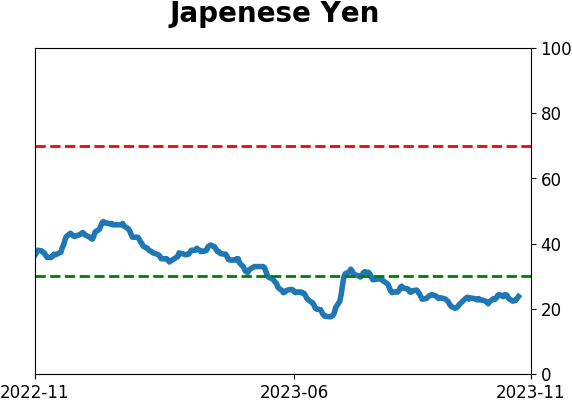
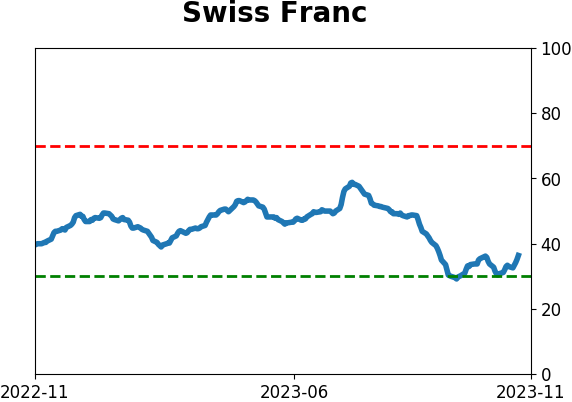
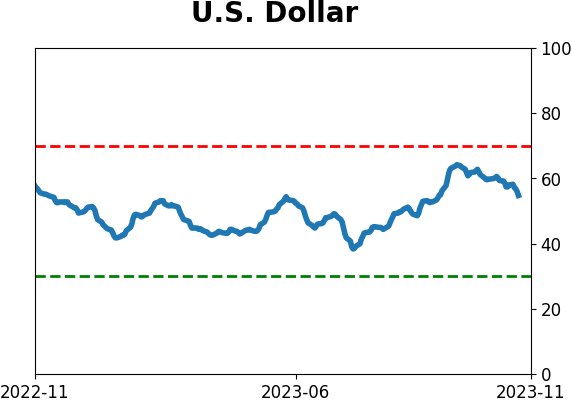
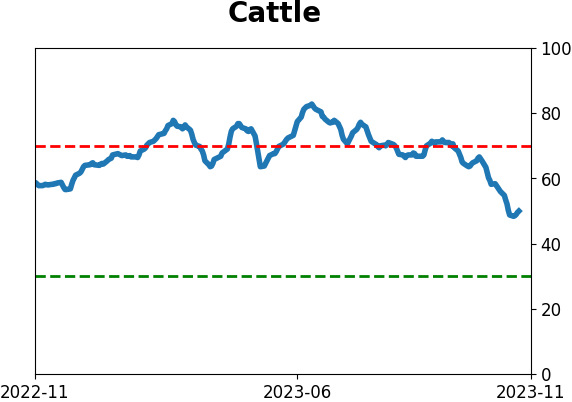
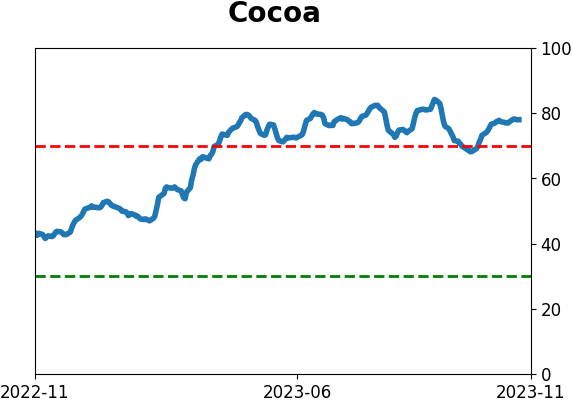
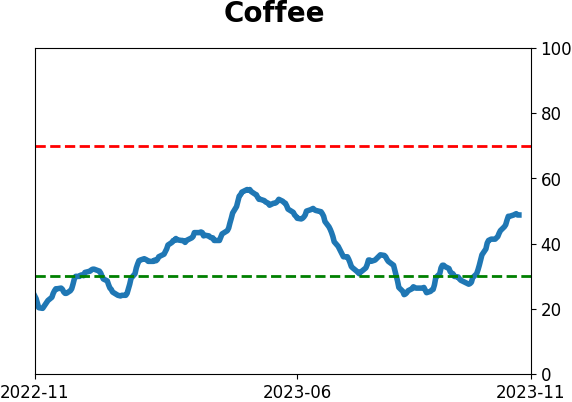
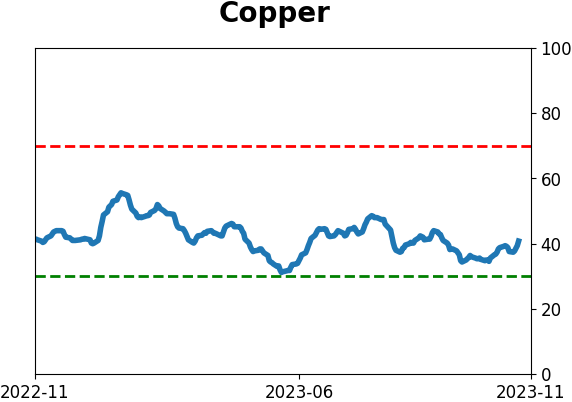
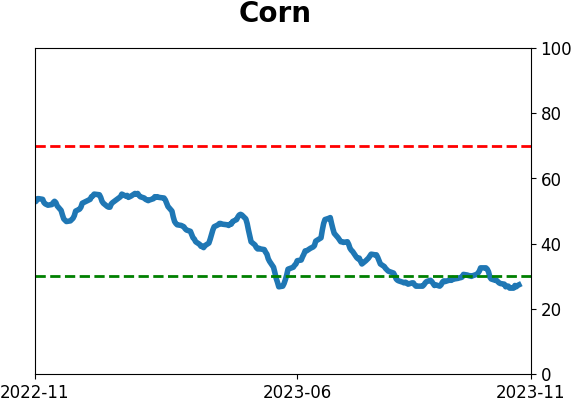
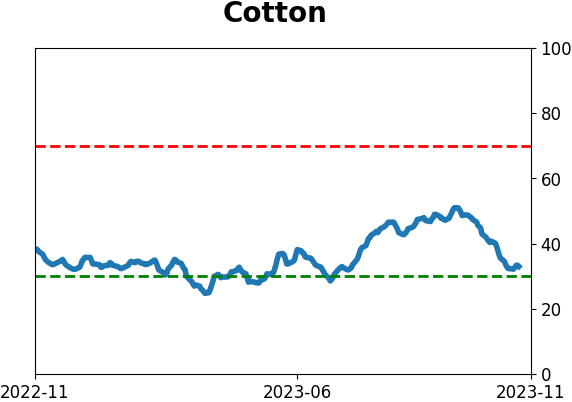
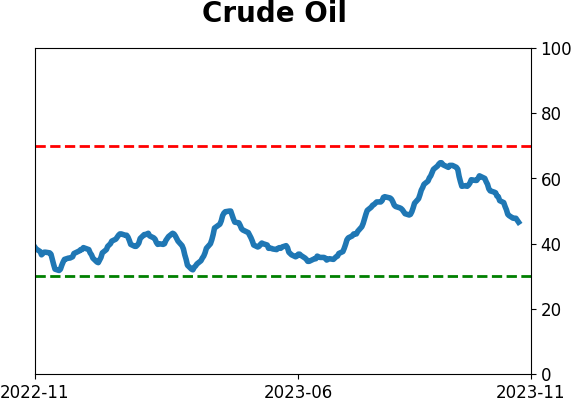
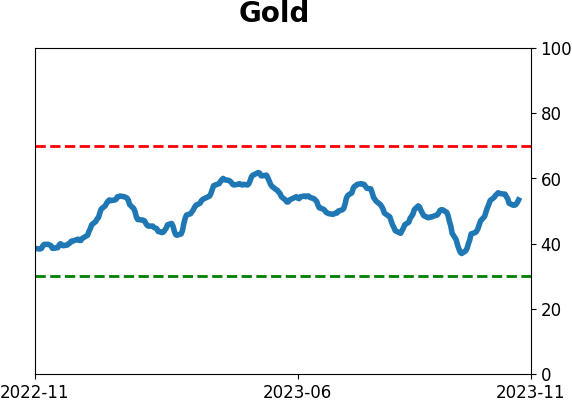
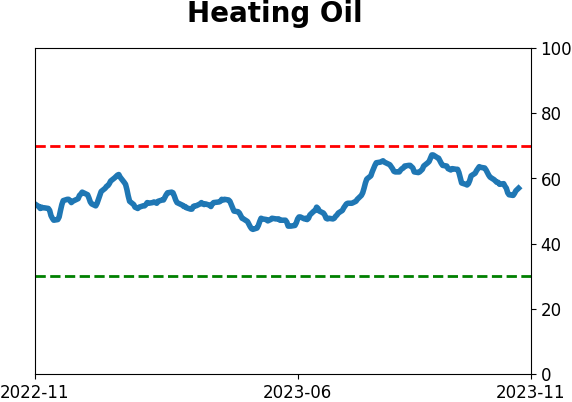
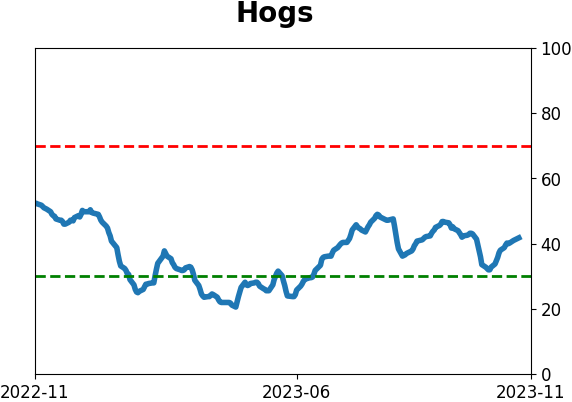
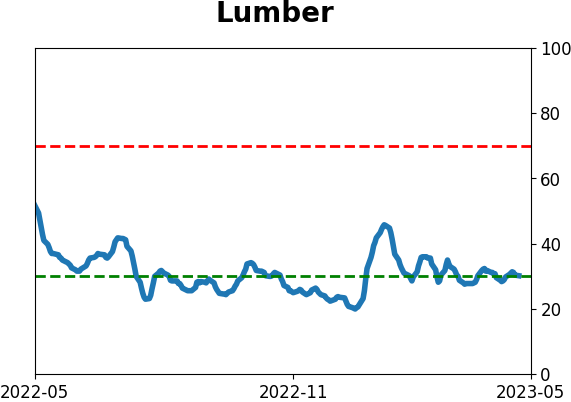
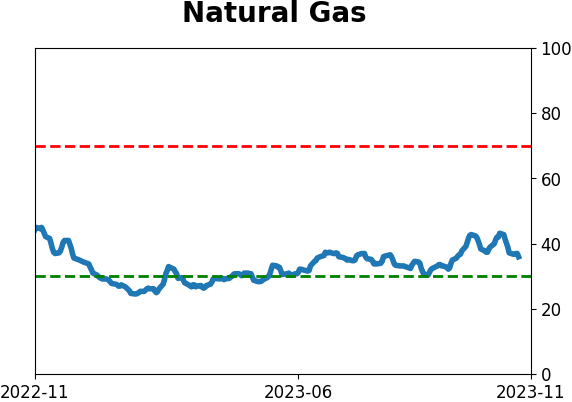
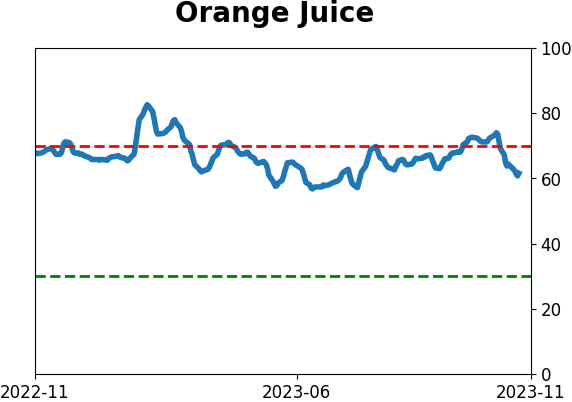
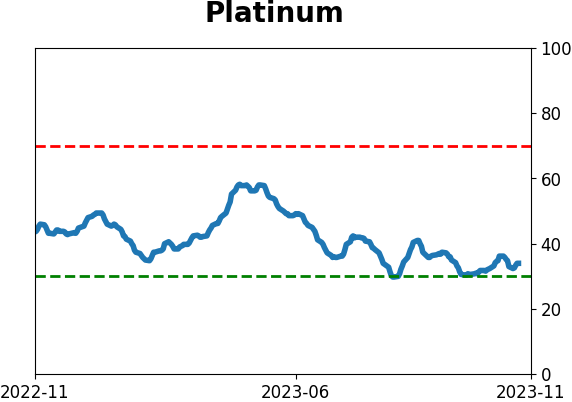
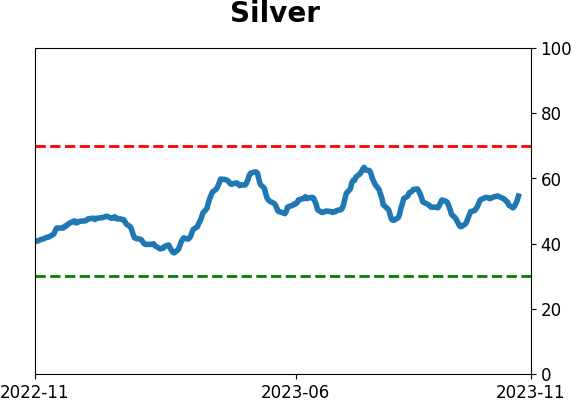
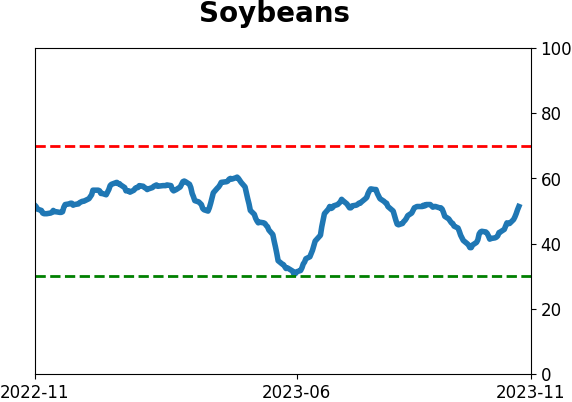
Optimism Index Thumbnails
|
|
|
|
|
|
|
|
|
|
|
|
|
|
|
|
|
|
|
|
|