Headlines
|
|
Hedge funds haven't been embracing the rally:
Across four different strategies, hedge funds appear to have historically low exposure to stocks. The rolling 50-day beta of hedge fund indexes to the S&P 500 is now net short for one of the very few times over the past 20 years.
|
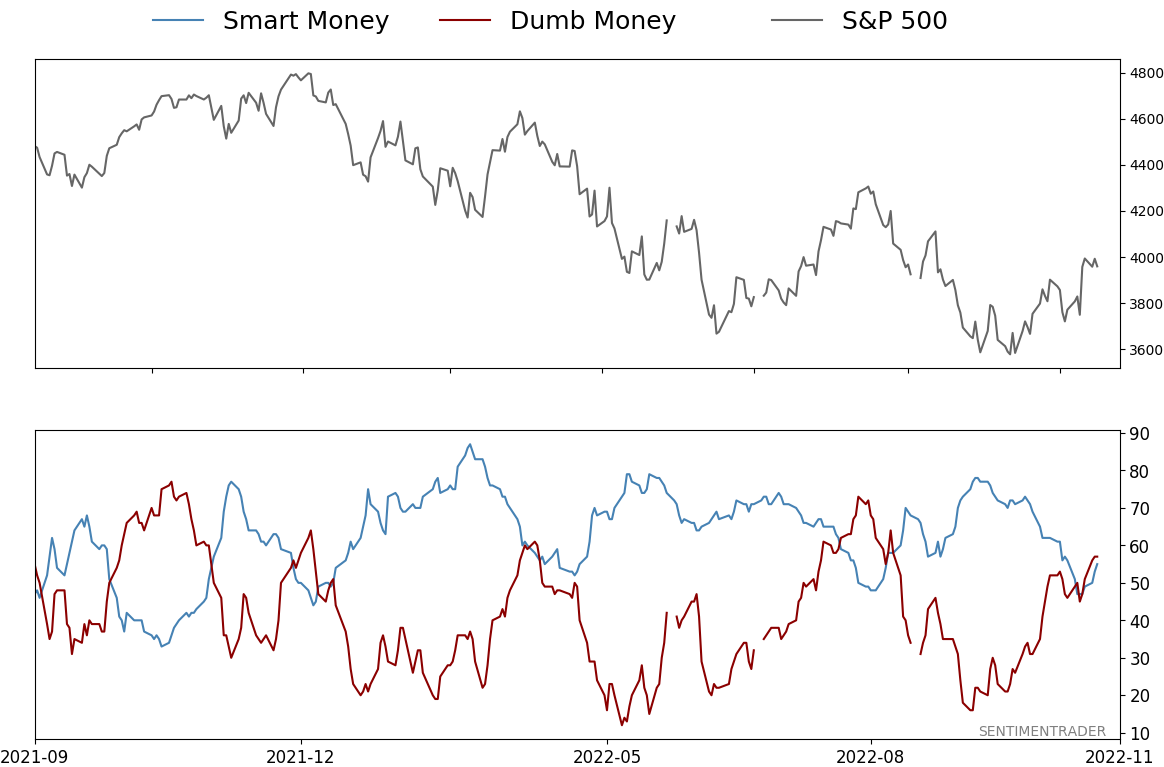
Smart / Dumb Money Confidence
|
Smart Money Confidence: 55%
Dumb Money Confidence: 57%
|
|
Risk Levels
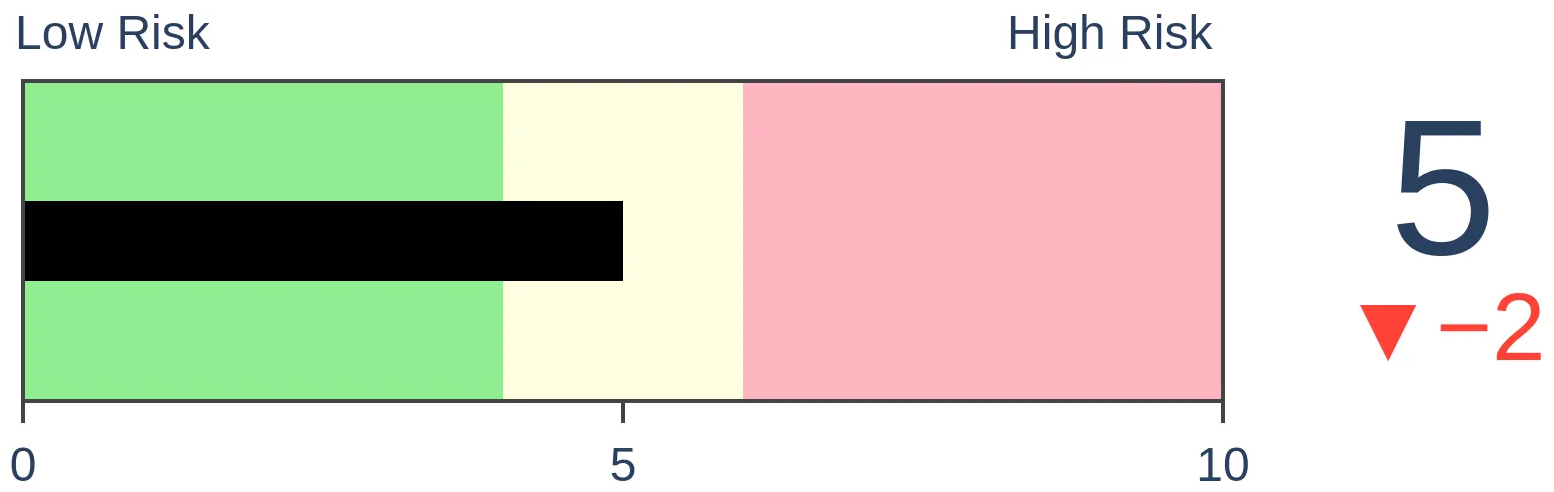
Stocks Short-Term
|
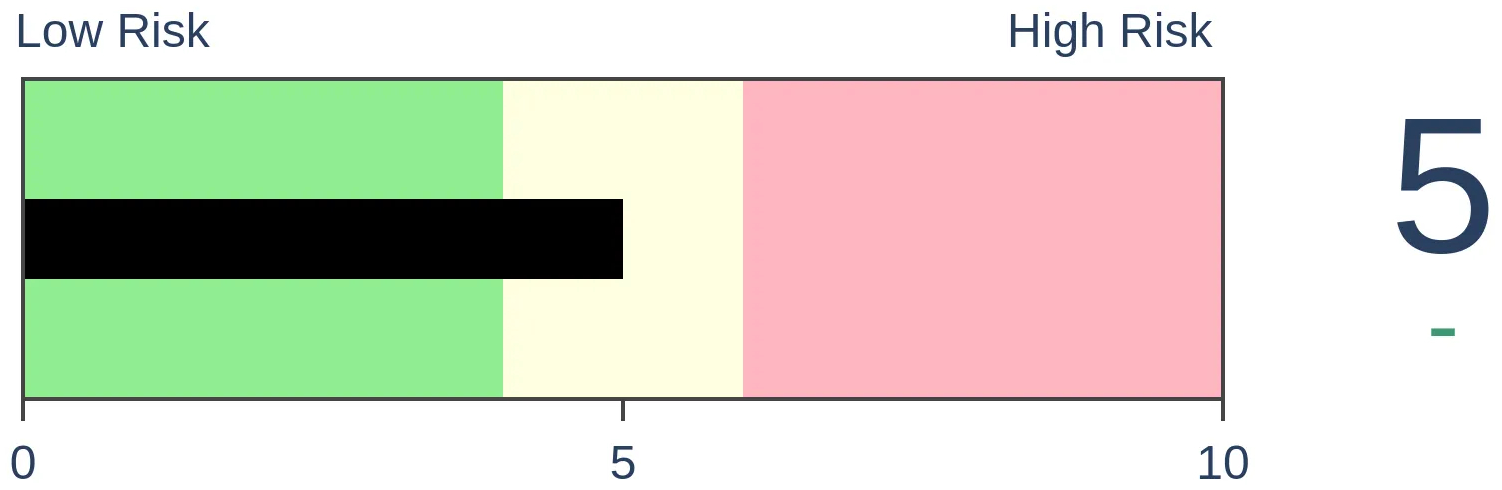
Stocks Medium-Term
|
|
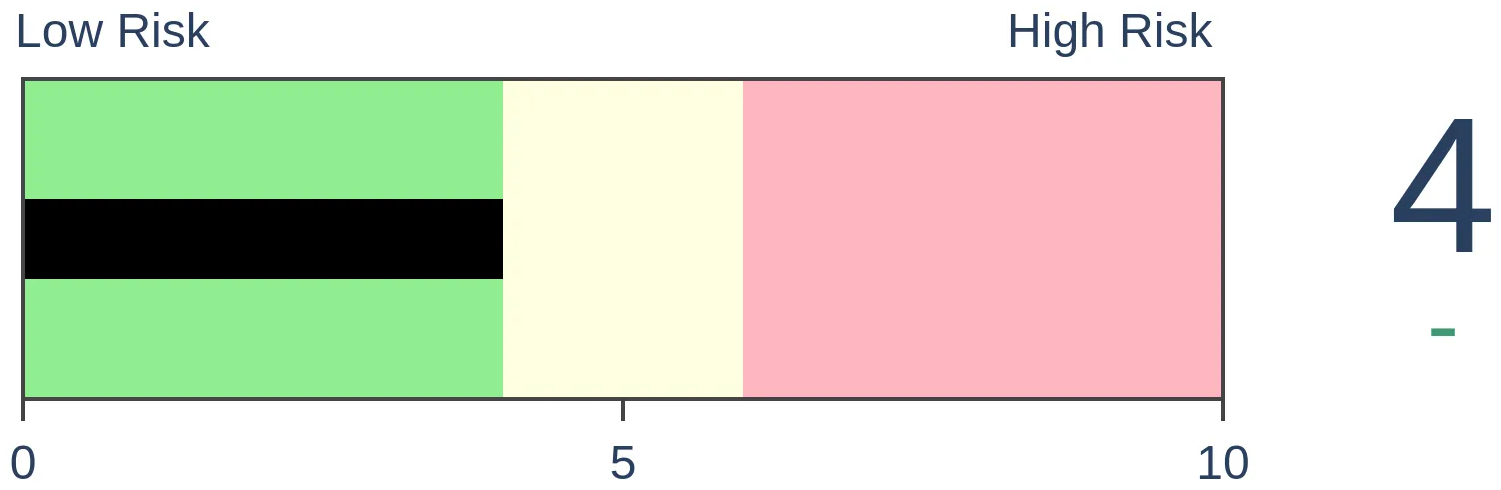
Bonds

|
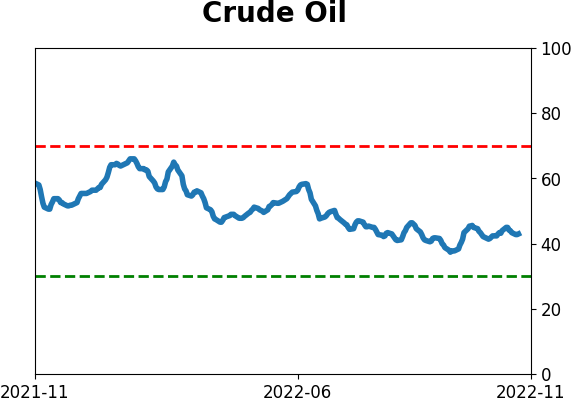
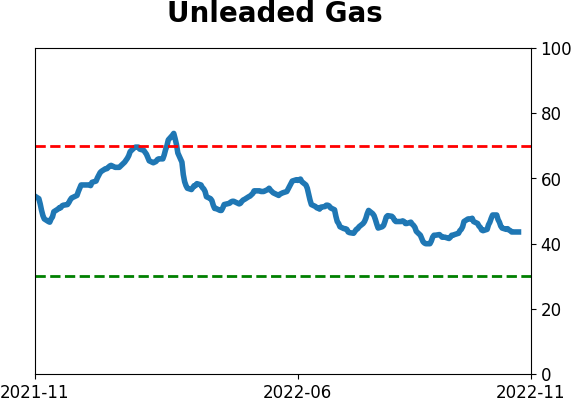
Crude Oil

|
|
Gold

|
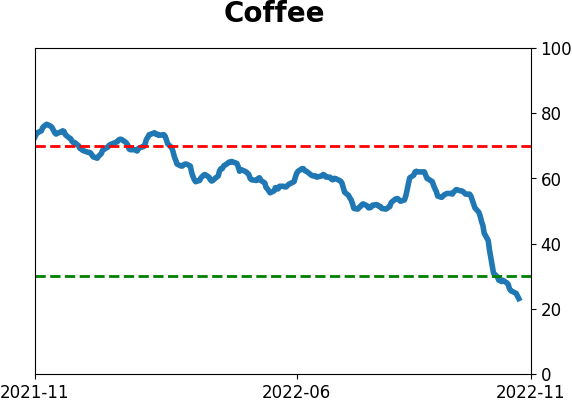
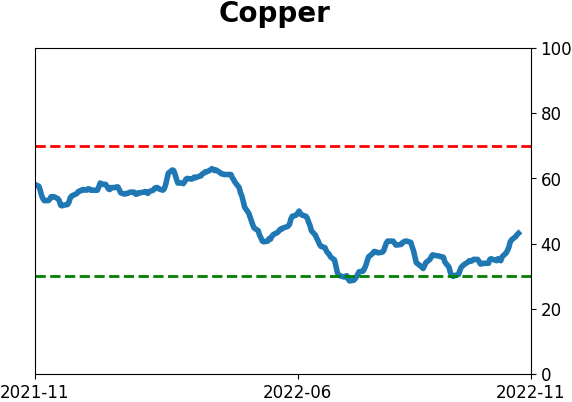
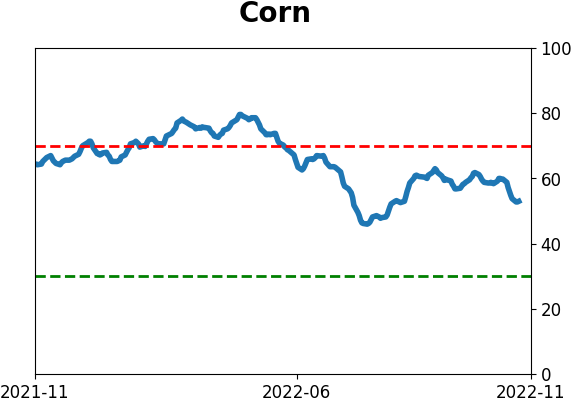
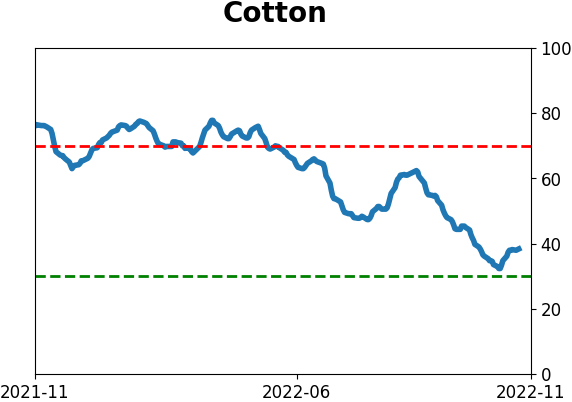
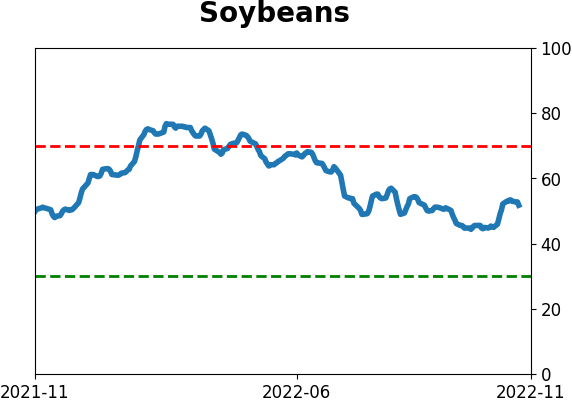
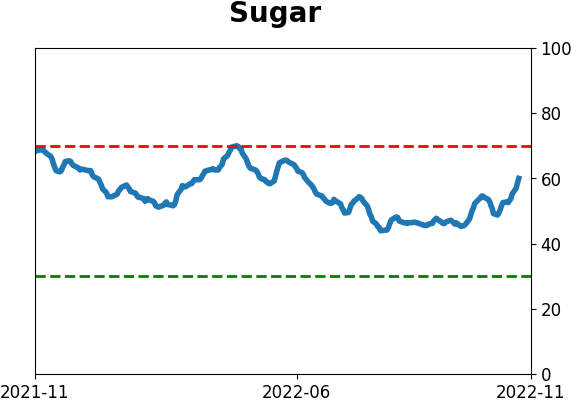
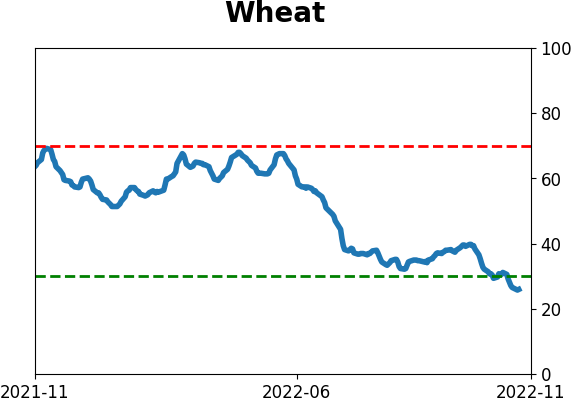
Agriculture
|
|
Research
By Jason Goepfert
BOTTOM LINE
Across four different strategies, hedge funds appear to have historically low exposure to stocks. The rolling 50-day beta of hedge fund indexes to the S&P 500 is now net short for one of the very few times over the past 20 years.
FORECAST / TIMEFRAME
None
|
Key points:
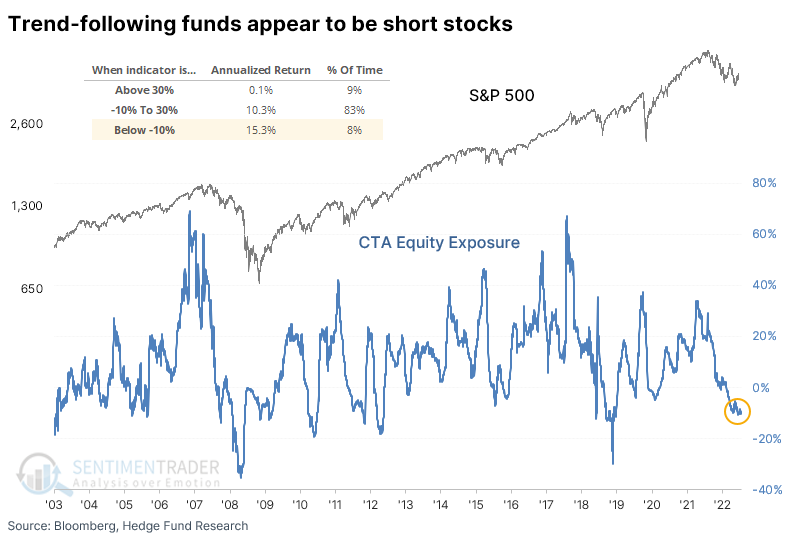
- Trend-following hedge funds appear to be net short the stock market
- Across other strategies, funds also appear to have low exposure to stocks
- When average exposure has been this low, annualized returns in the S&P 500 were exceptional
It's hard to find a bullish hedge fund
We saw on Tuesday that consumers are depressed about the economy and markets. They're not the only ones - hedge funds have been slow to embrace the rally and appear to carry low exposure to stocks across strategies.
On the website, we track the rolling one-month beta of returns of trend-following Commodity Trading Advisors (CTAs) to the S&P 500 and other assets. Taking a slightly longer-term view, 50 days instead of 21, fund exposure is historically low at 10% net short.
The S&P 500 has returned an annualized 15.3% when exposure was 10% net short or below, compared to a return of only 0.1% when exposure was on the opposite end of the extreme.
It's not just trend followers. Global macro, equity long-only, and market-neutral funds also have low exposure using this method. The average rolling 50-day beta across these four strategies is now negative, suggesting a net short position.
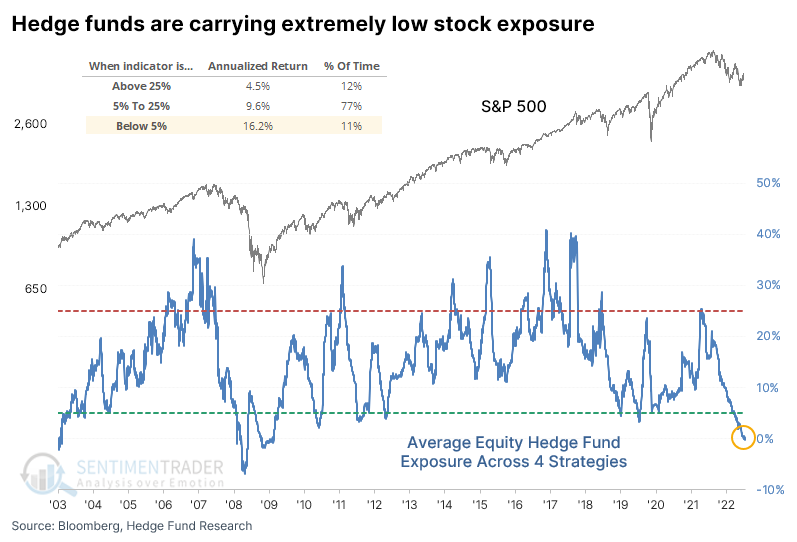
While funds were short during the worst of the financial crisis, their pessimism didn't pay off most of the time. The S&P 500's annualized return when their exposure was 5% or lower was 16.2%, compared to 4.5% when exposure was 25% or higher.
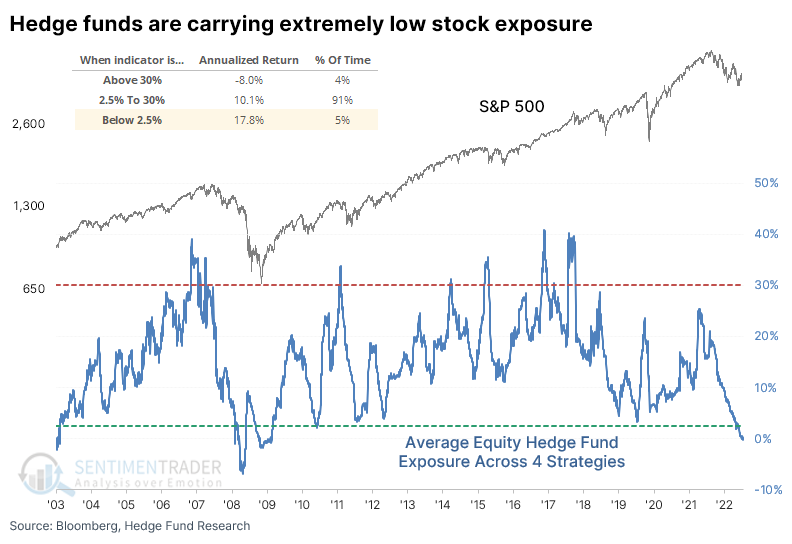
There was an even greater dispersion between returns when exposure was about in the bottom and top 5% of readings. During the bottom 5% of readings, the S&P's annualized return climbed to 17.8% versus -8.0% when it was 30% or higher.
What the research tells us...
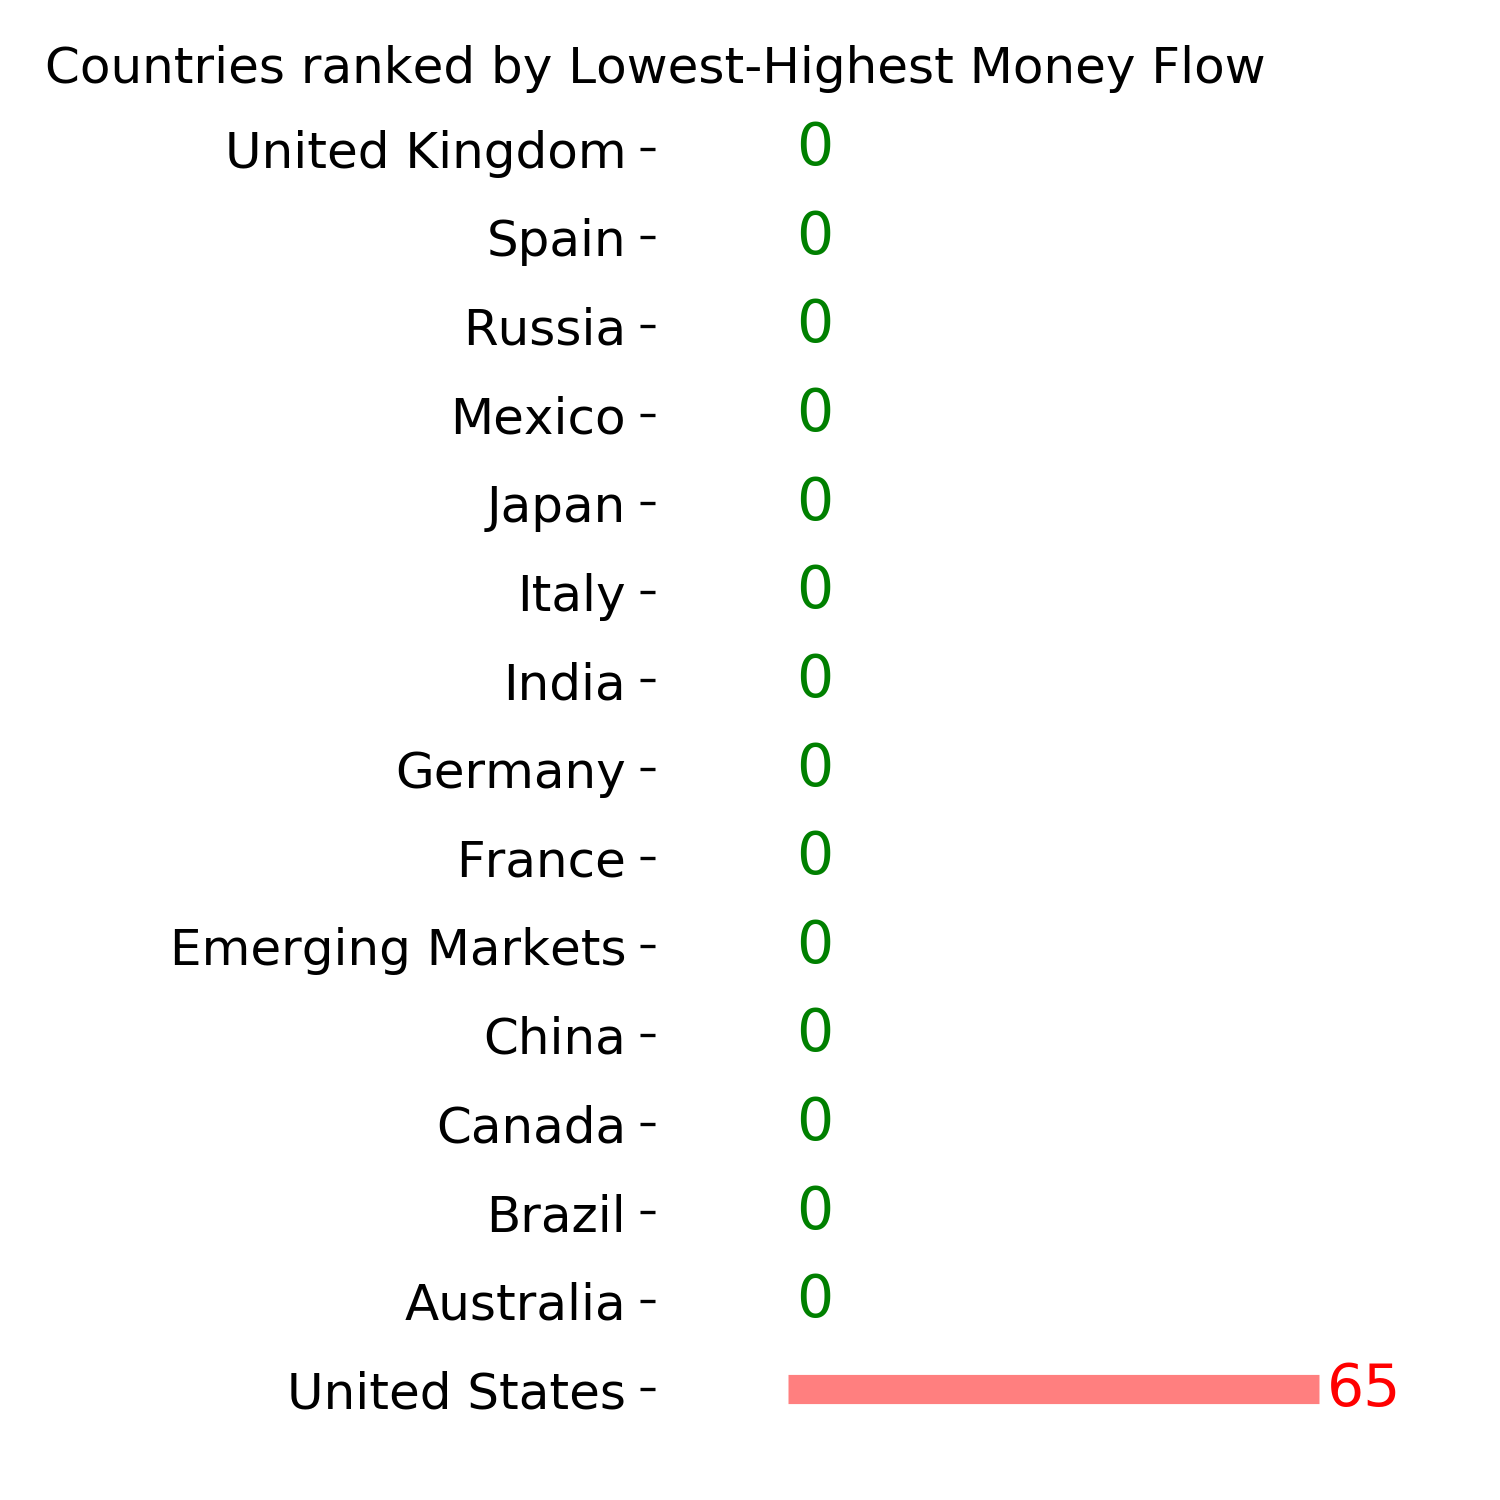
There is never total agreement when looking at a broad swath of indicators, and sentiment is no different. Some of them, like fund flows, are not showing any particular extreme. But most of them are, as detailed in our research over the past couple of months. There hasn't been too much of a change in recent weeks among longer-term series. And a major player, hedge funds, appears to be hesitant to embrace this rally, a bullish tailwind as we head into year-end and the necessity of these funds to report results to investors.
Indicators at Extremes
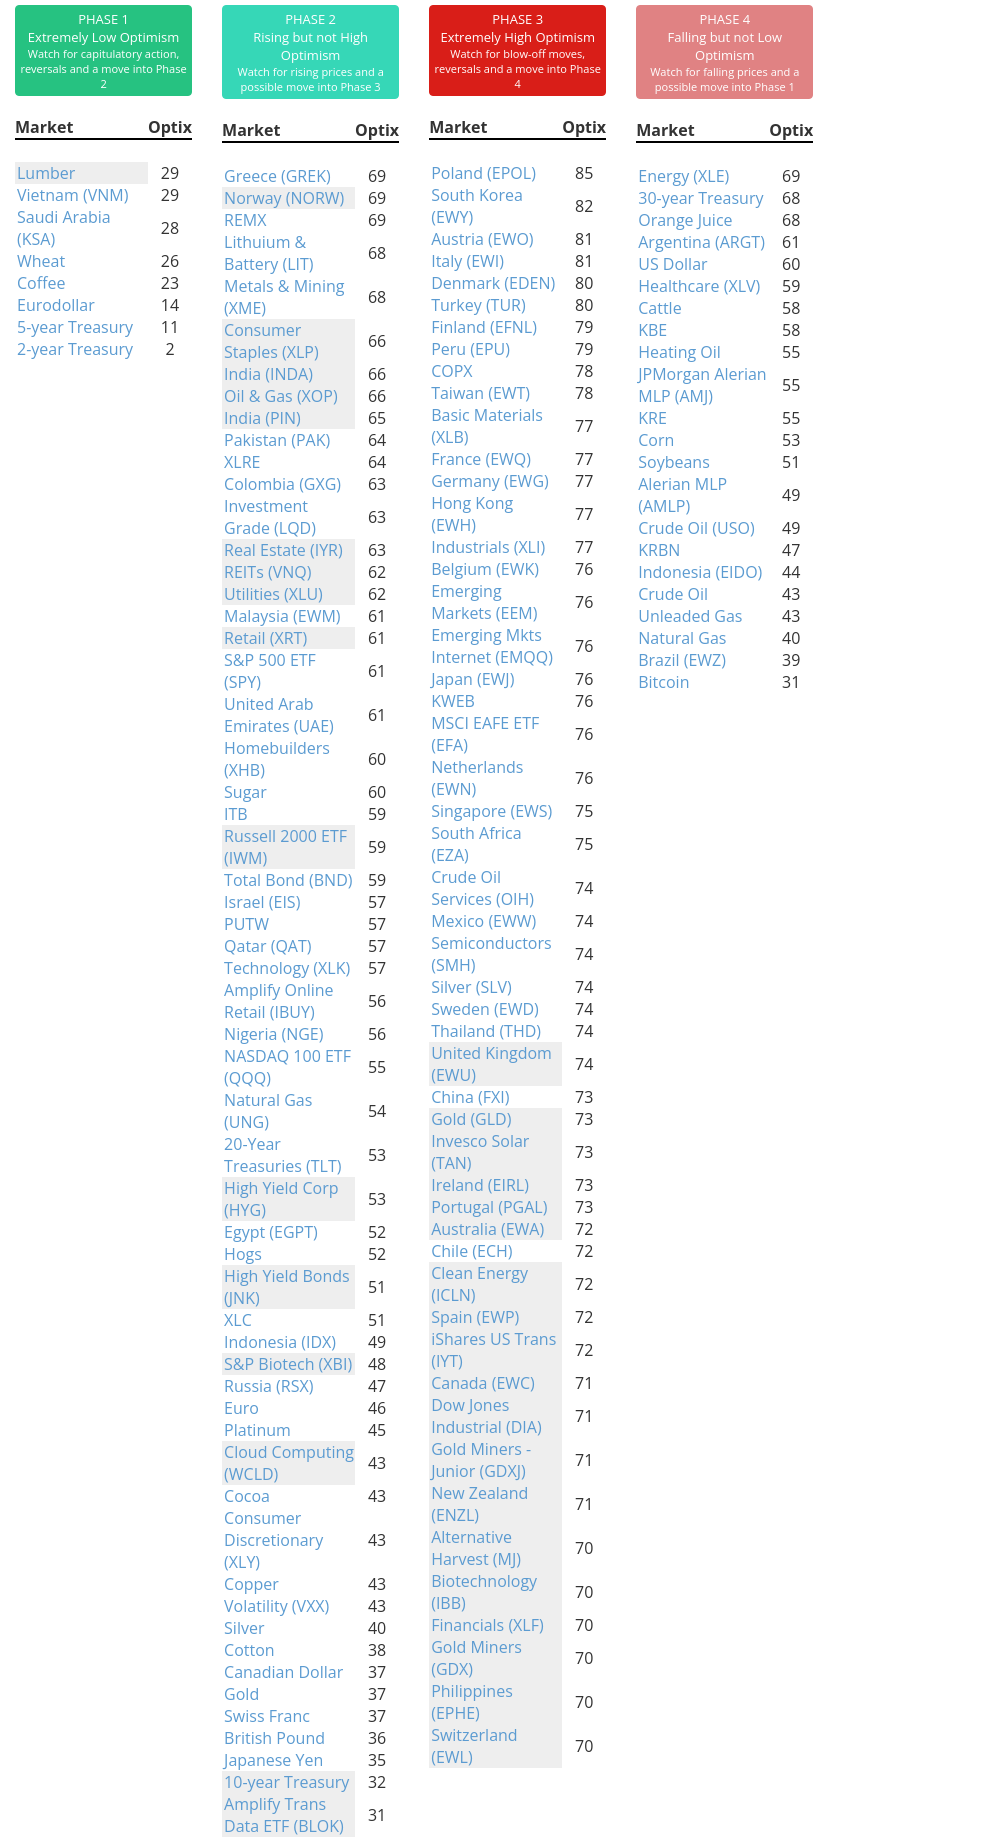
Phase Table
Ranks
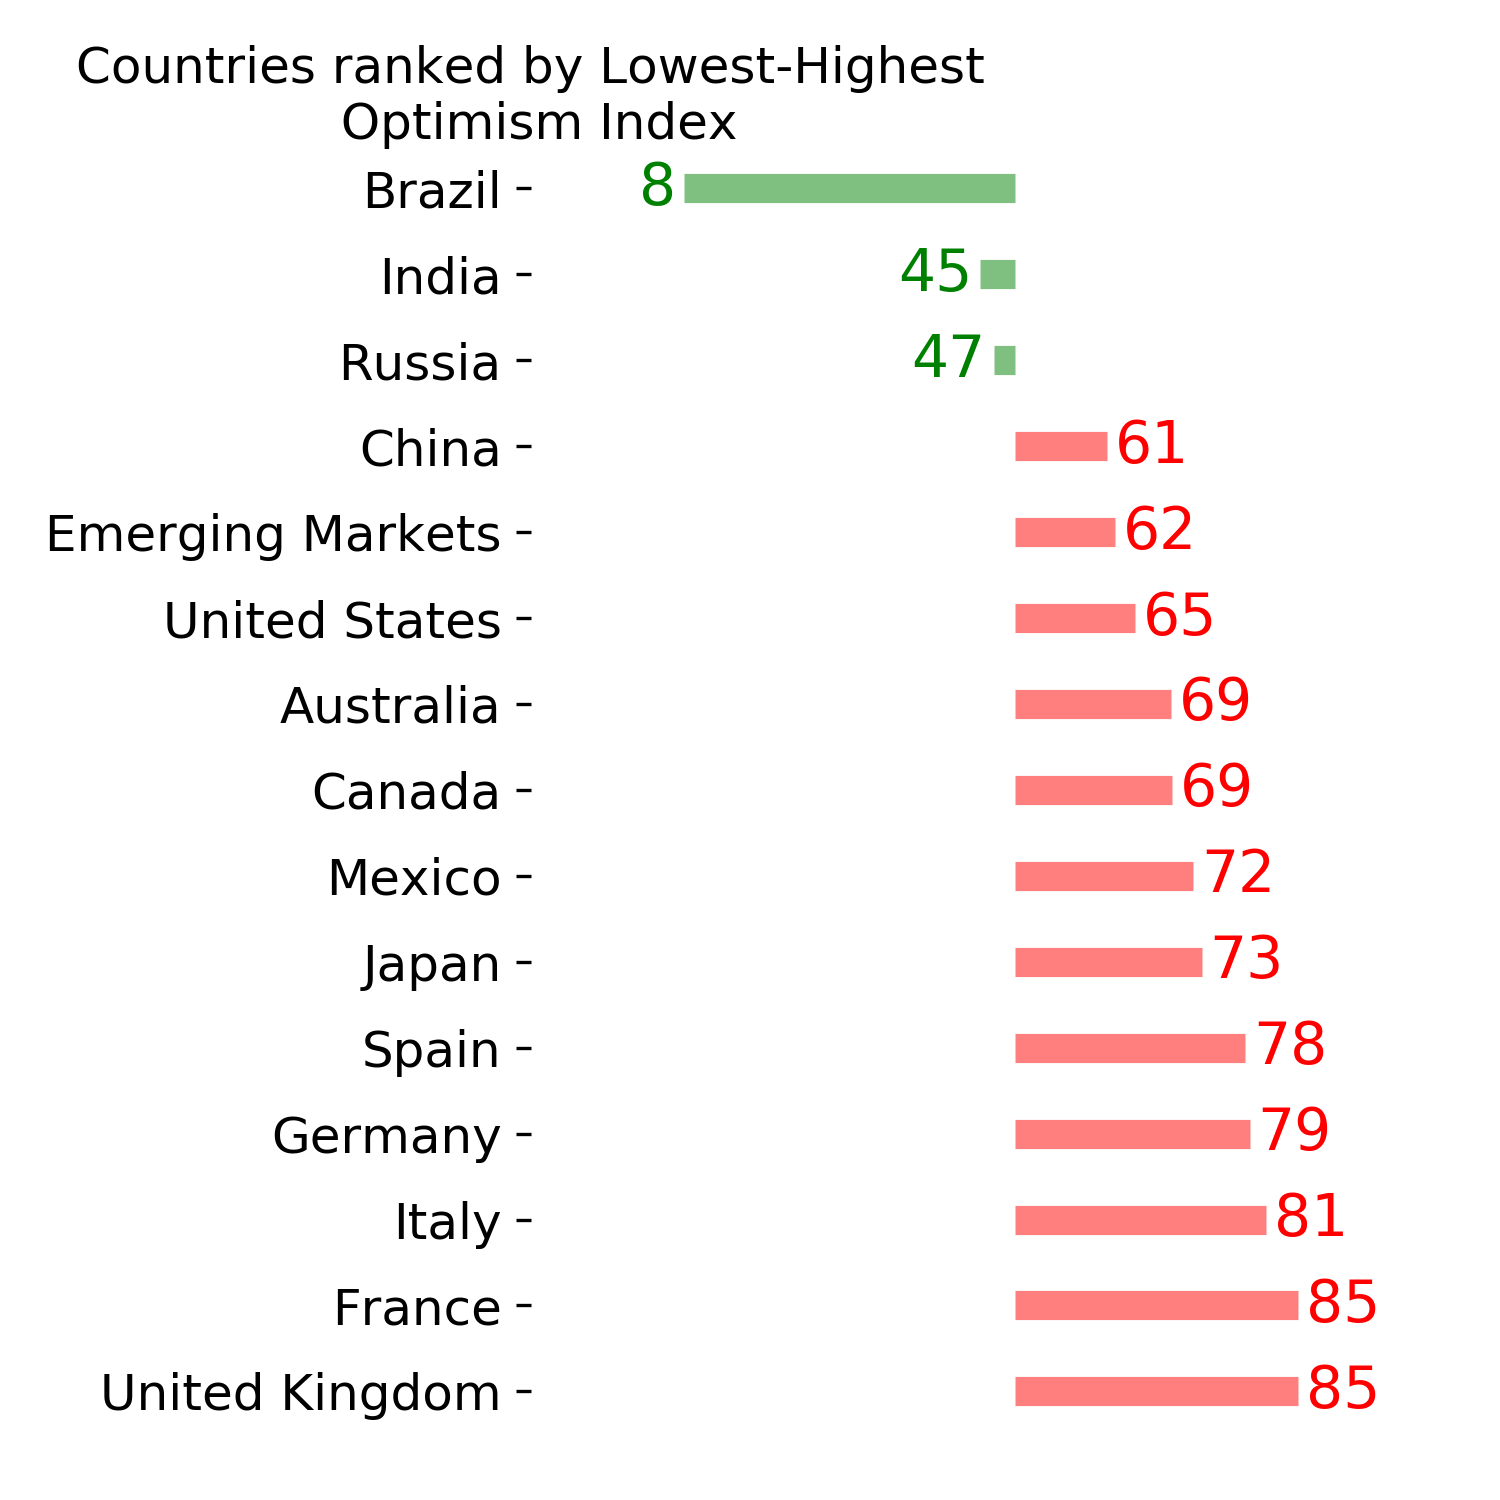
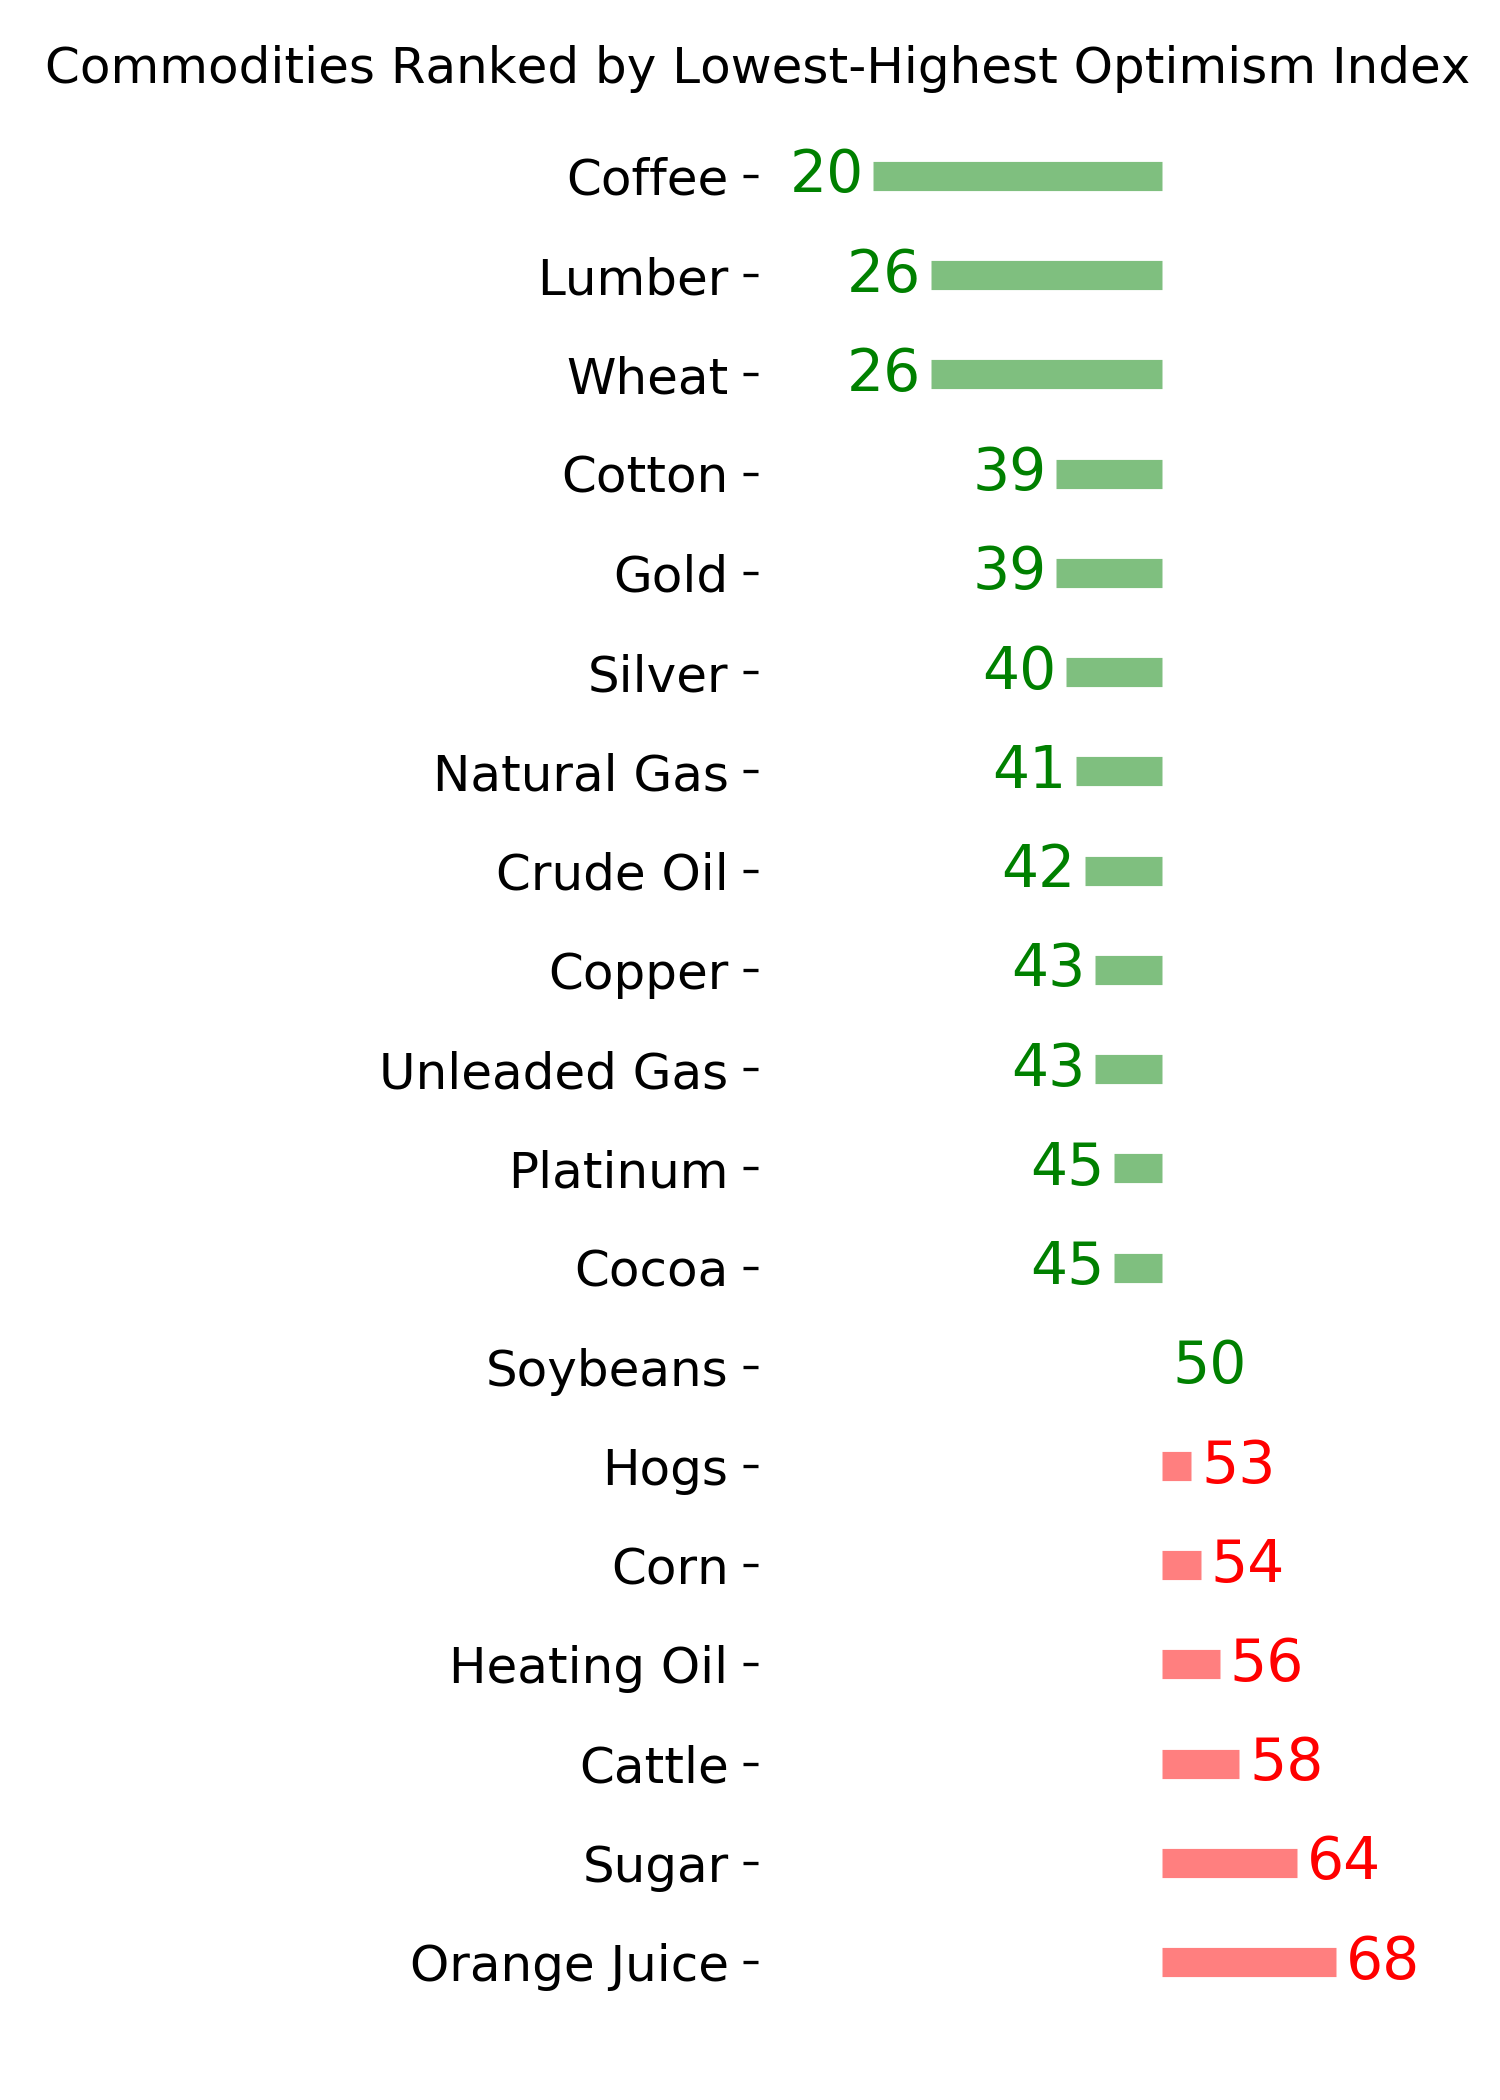
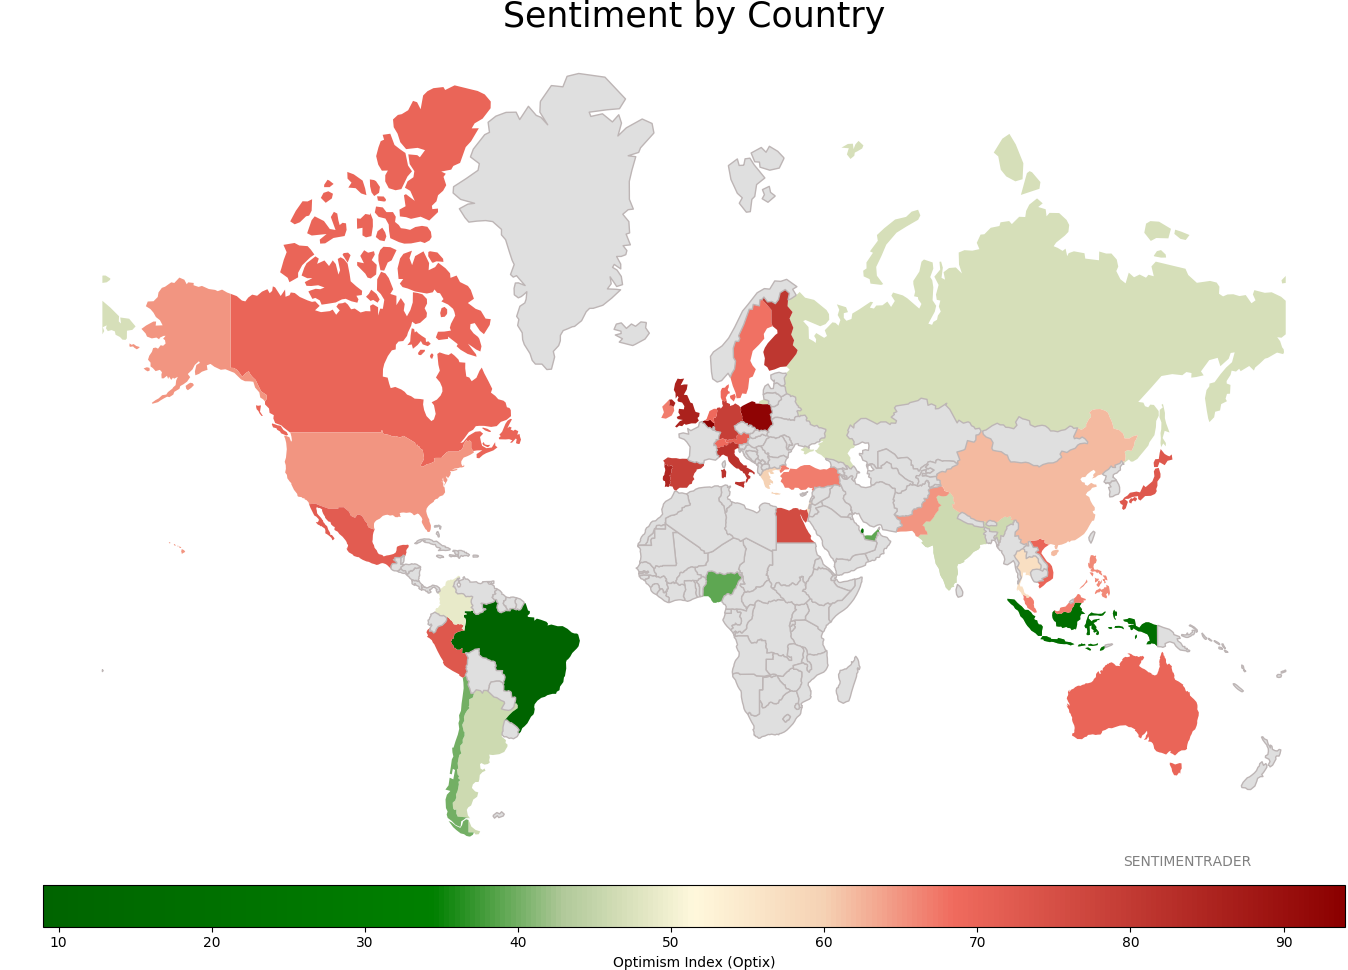
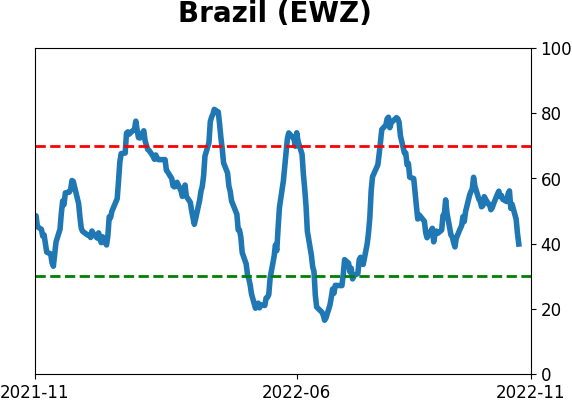
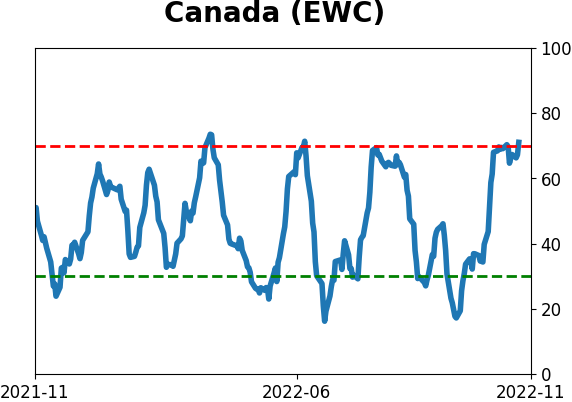
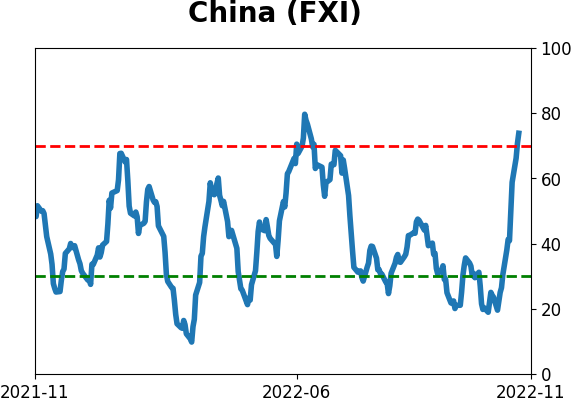
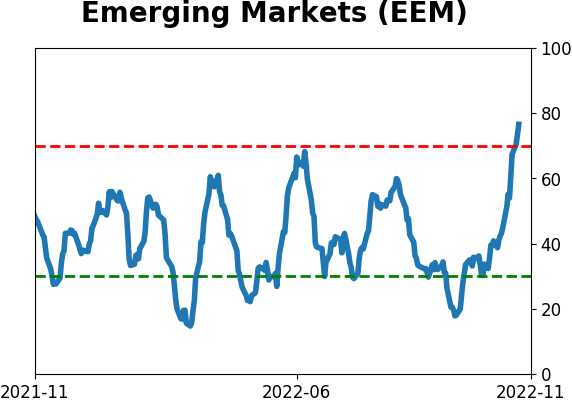
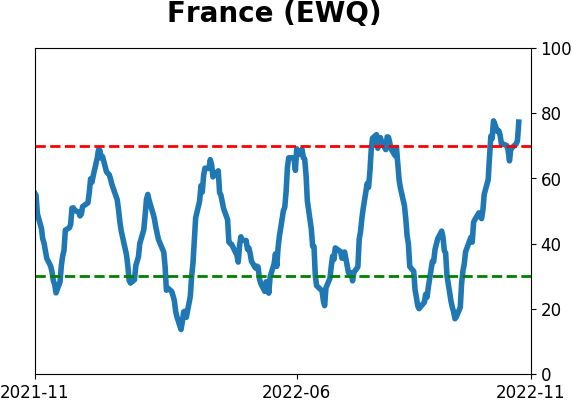
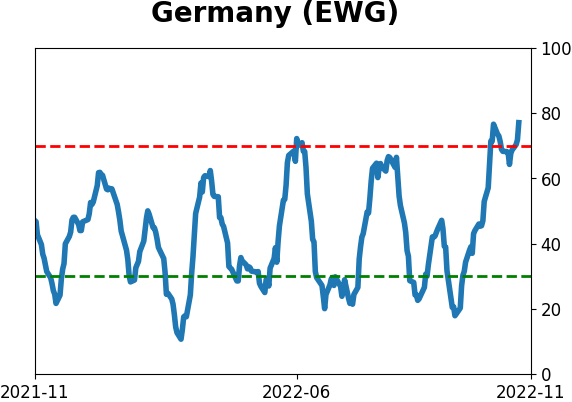
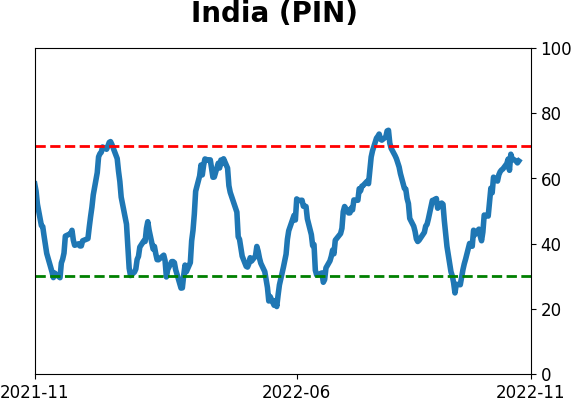
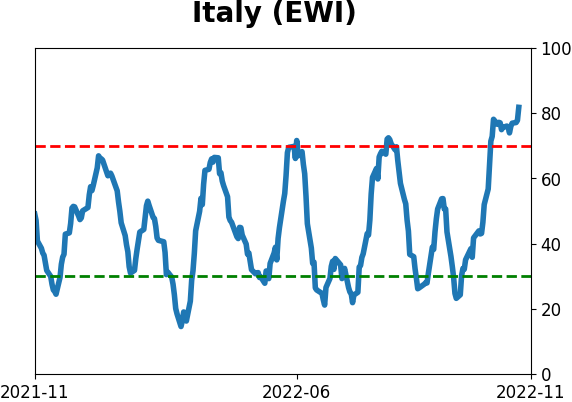
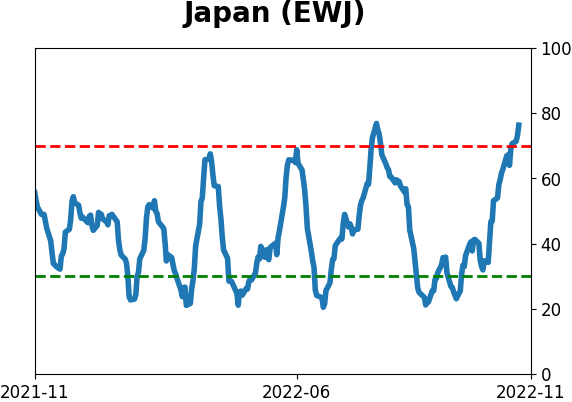
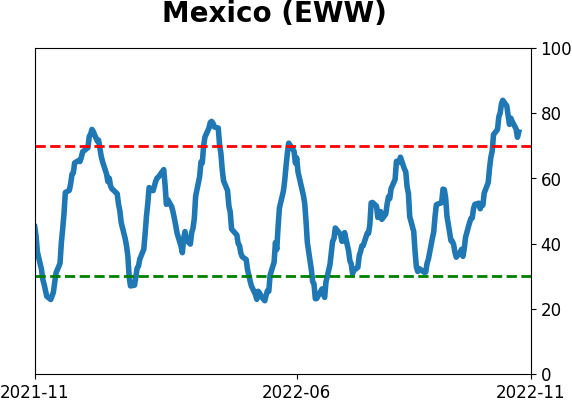
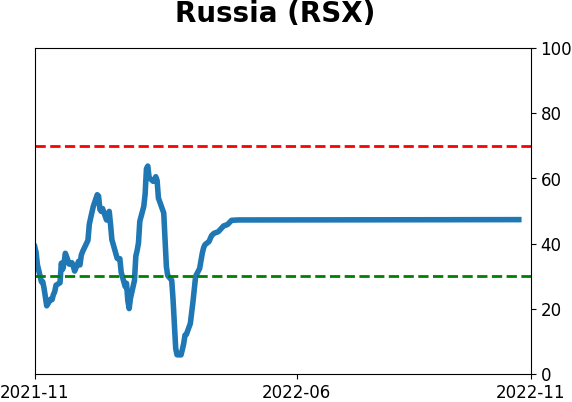
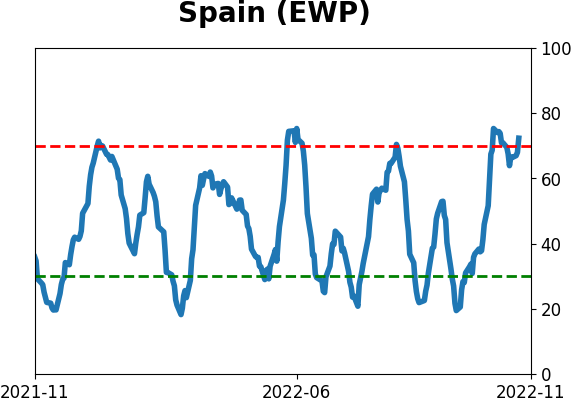
Sentiment Around The World
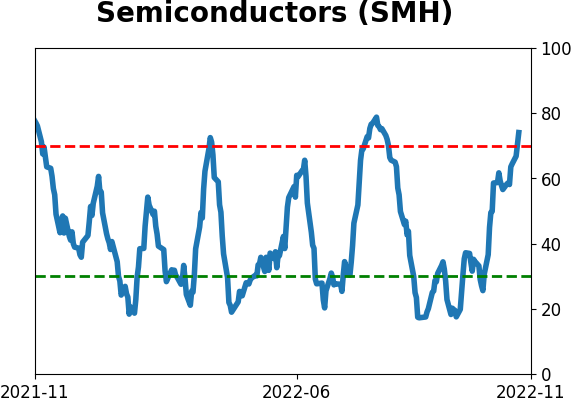
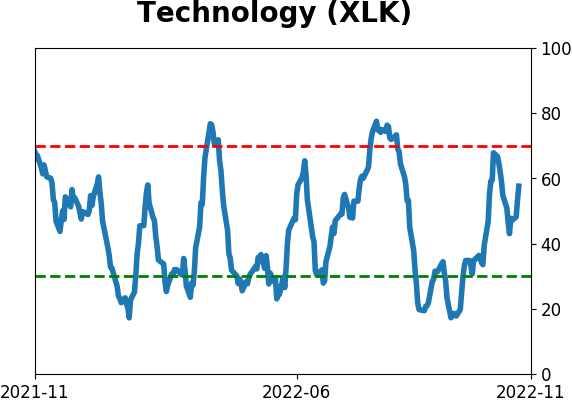
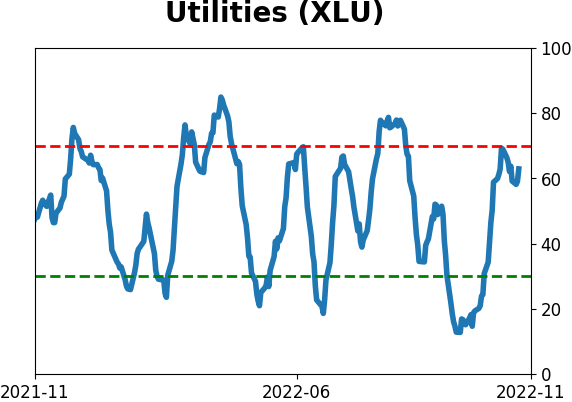
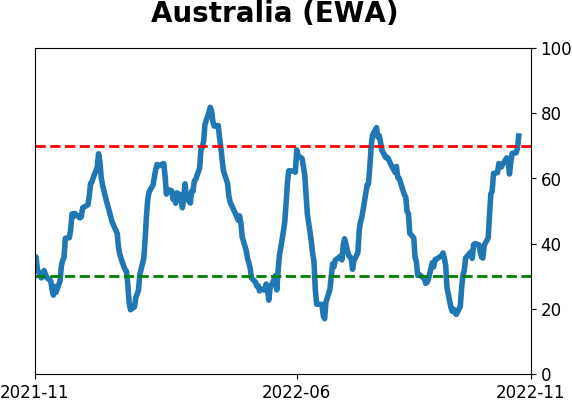
Optimism Index Thumbnails
|
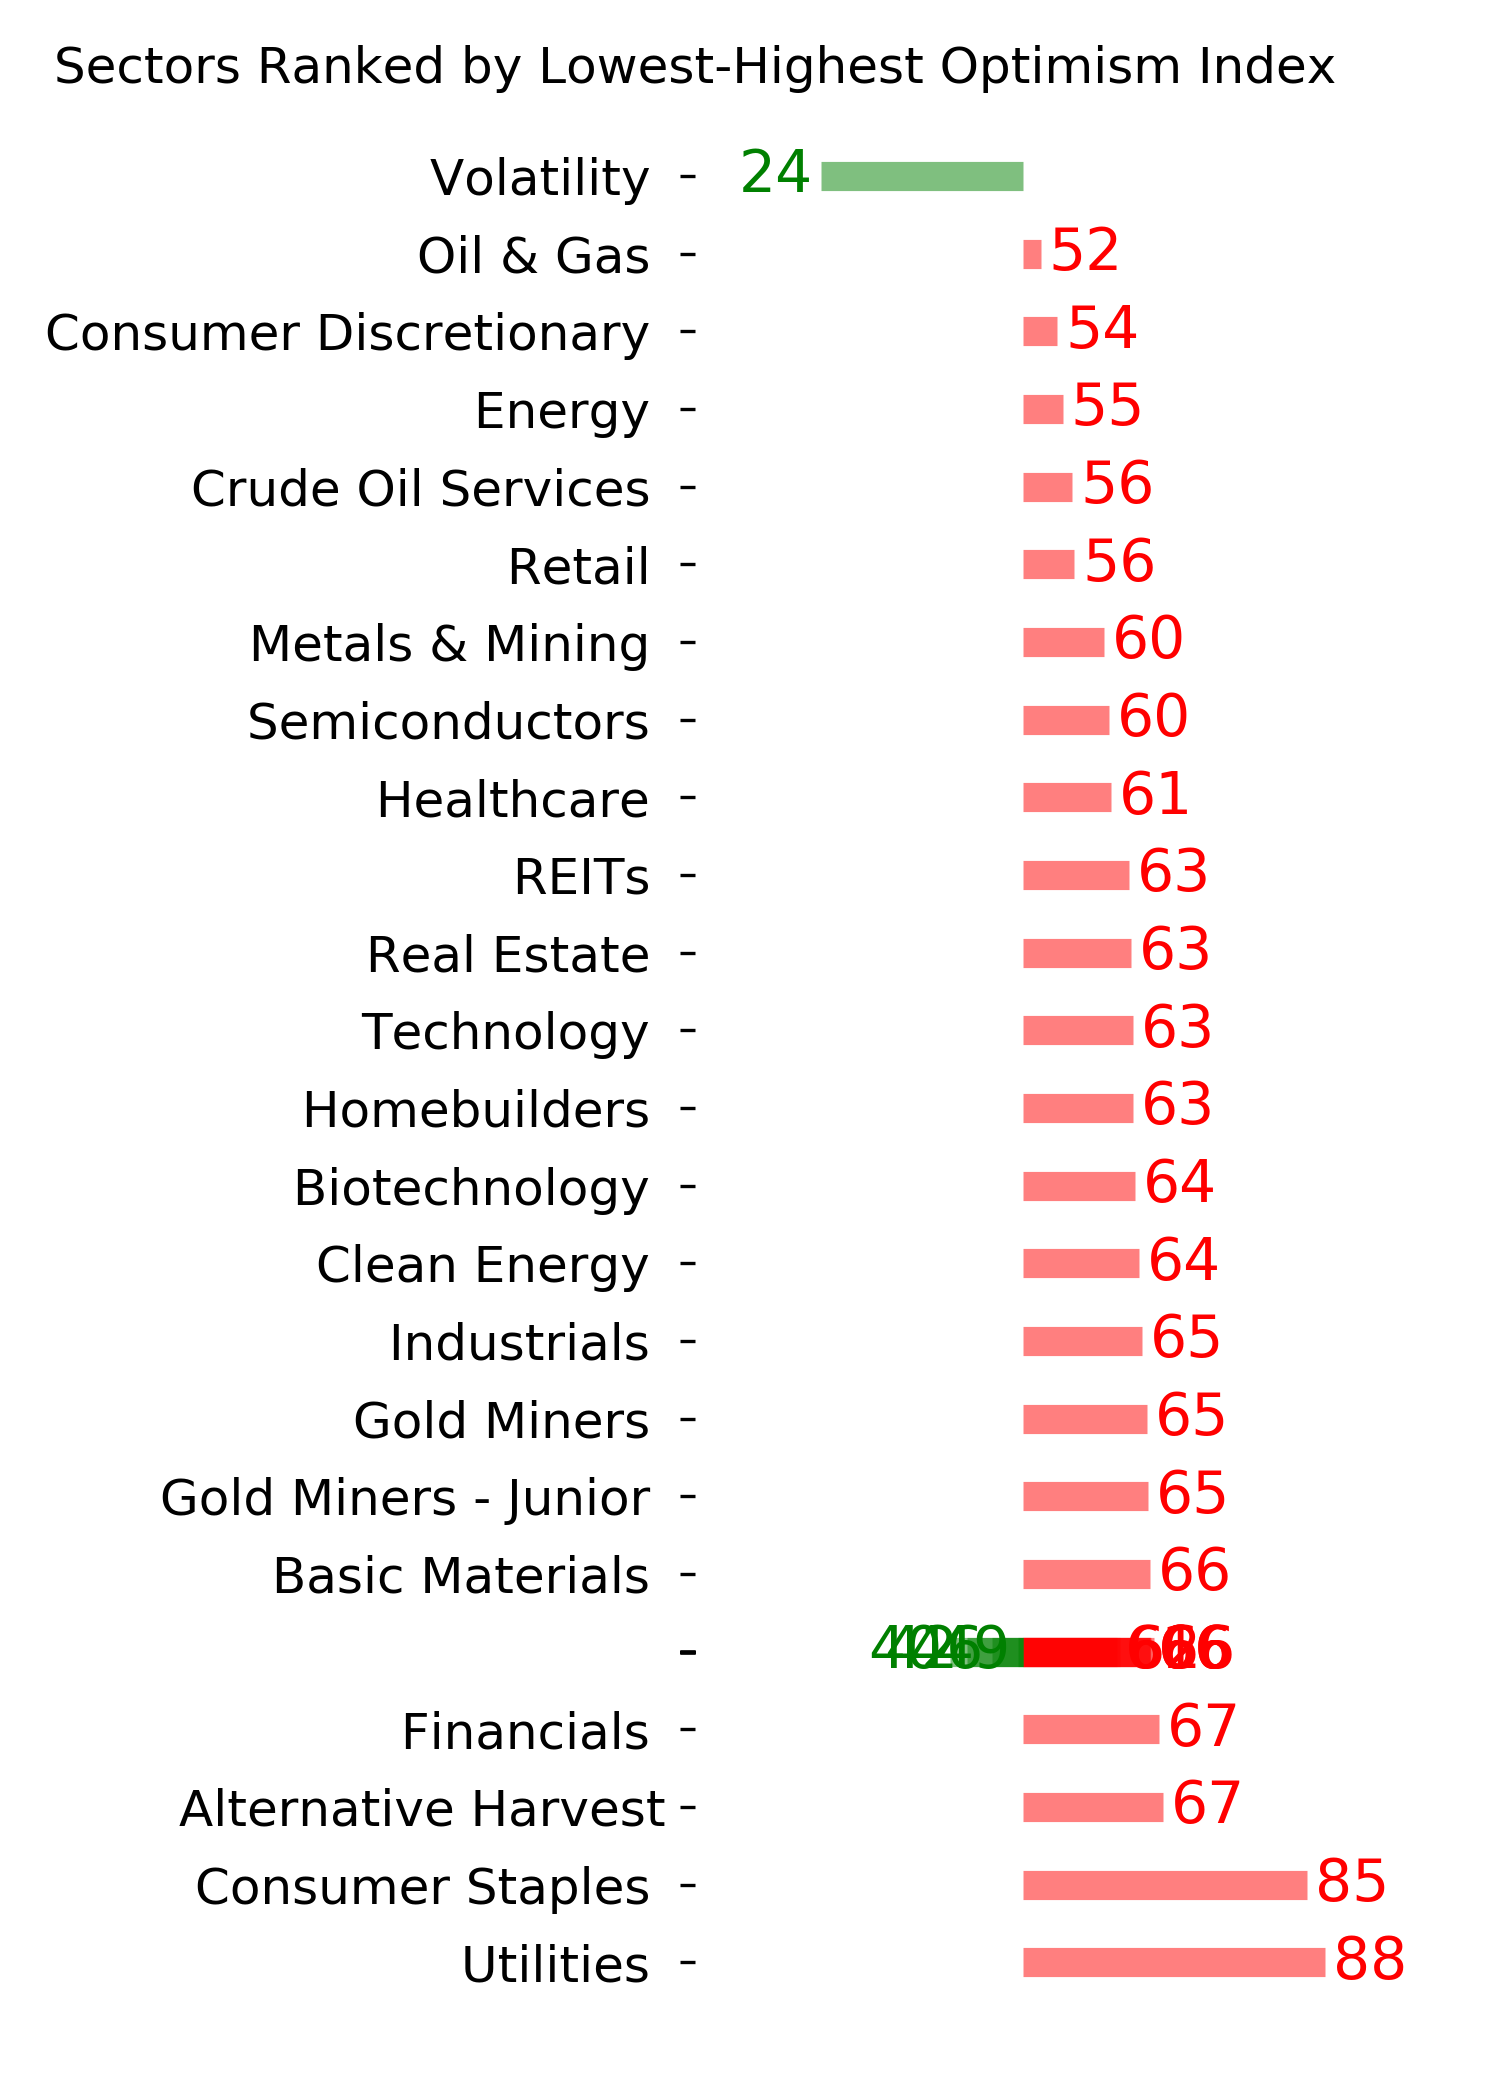
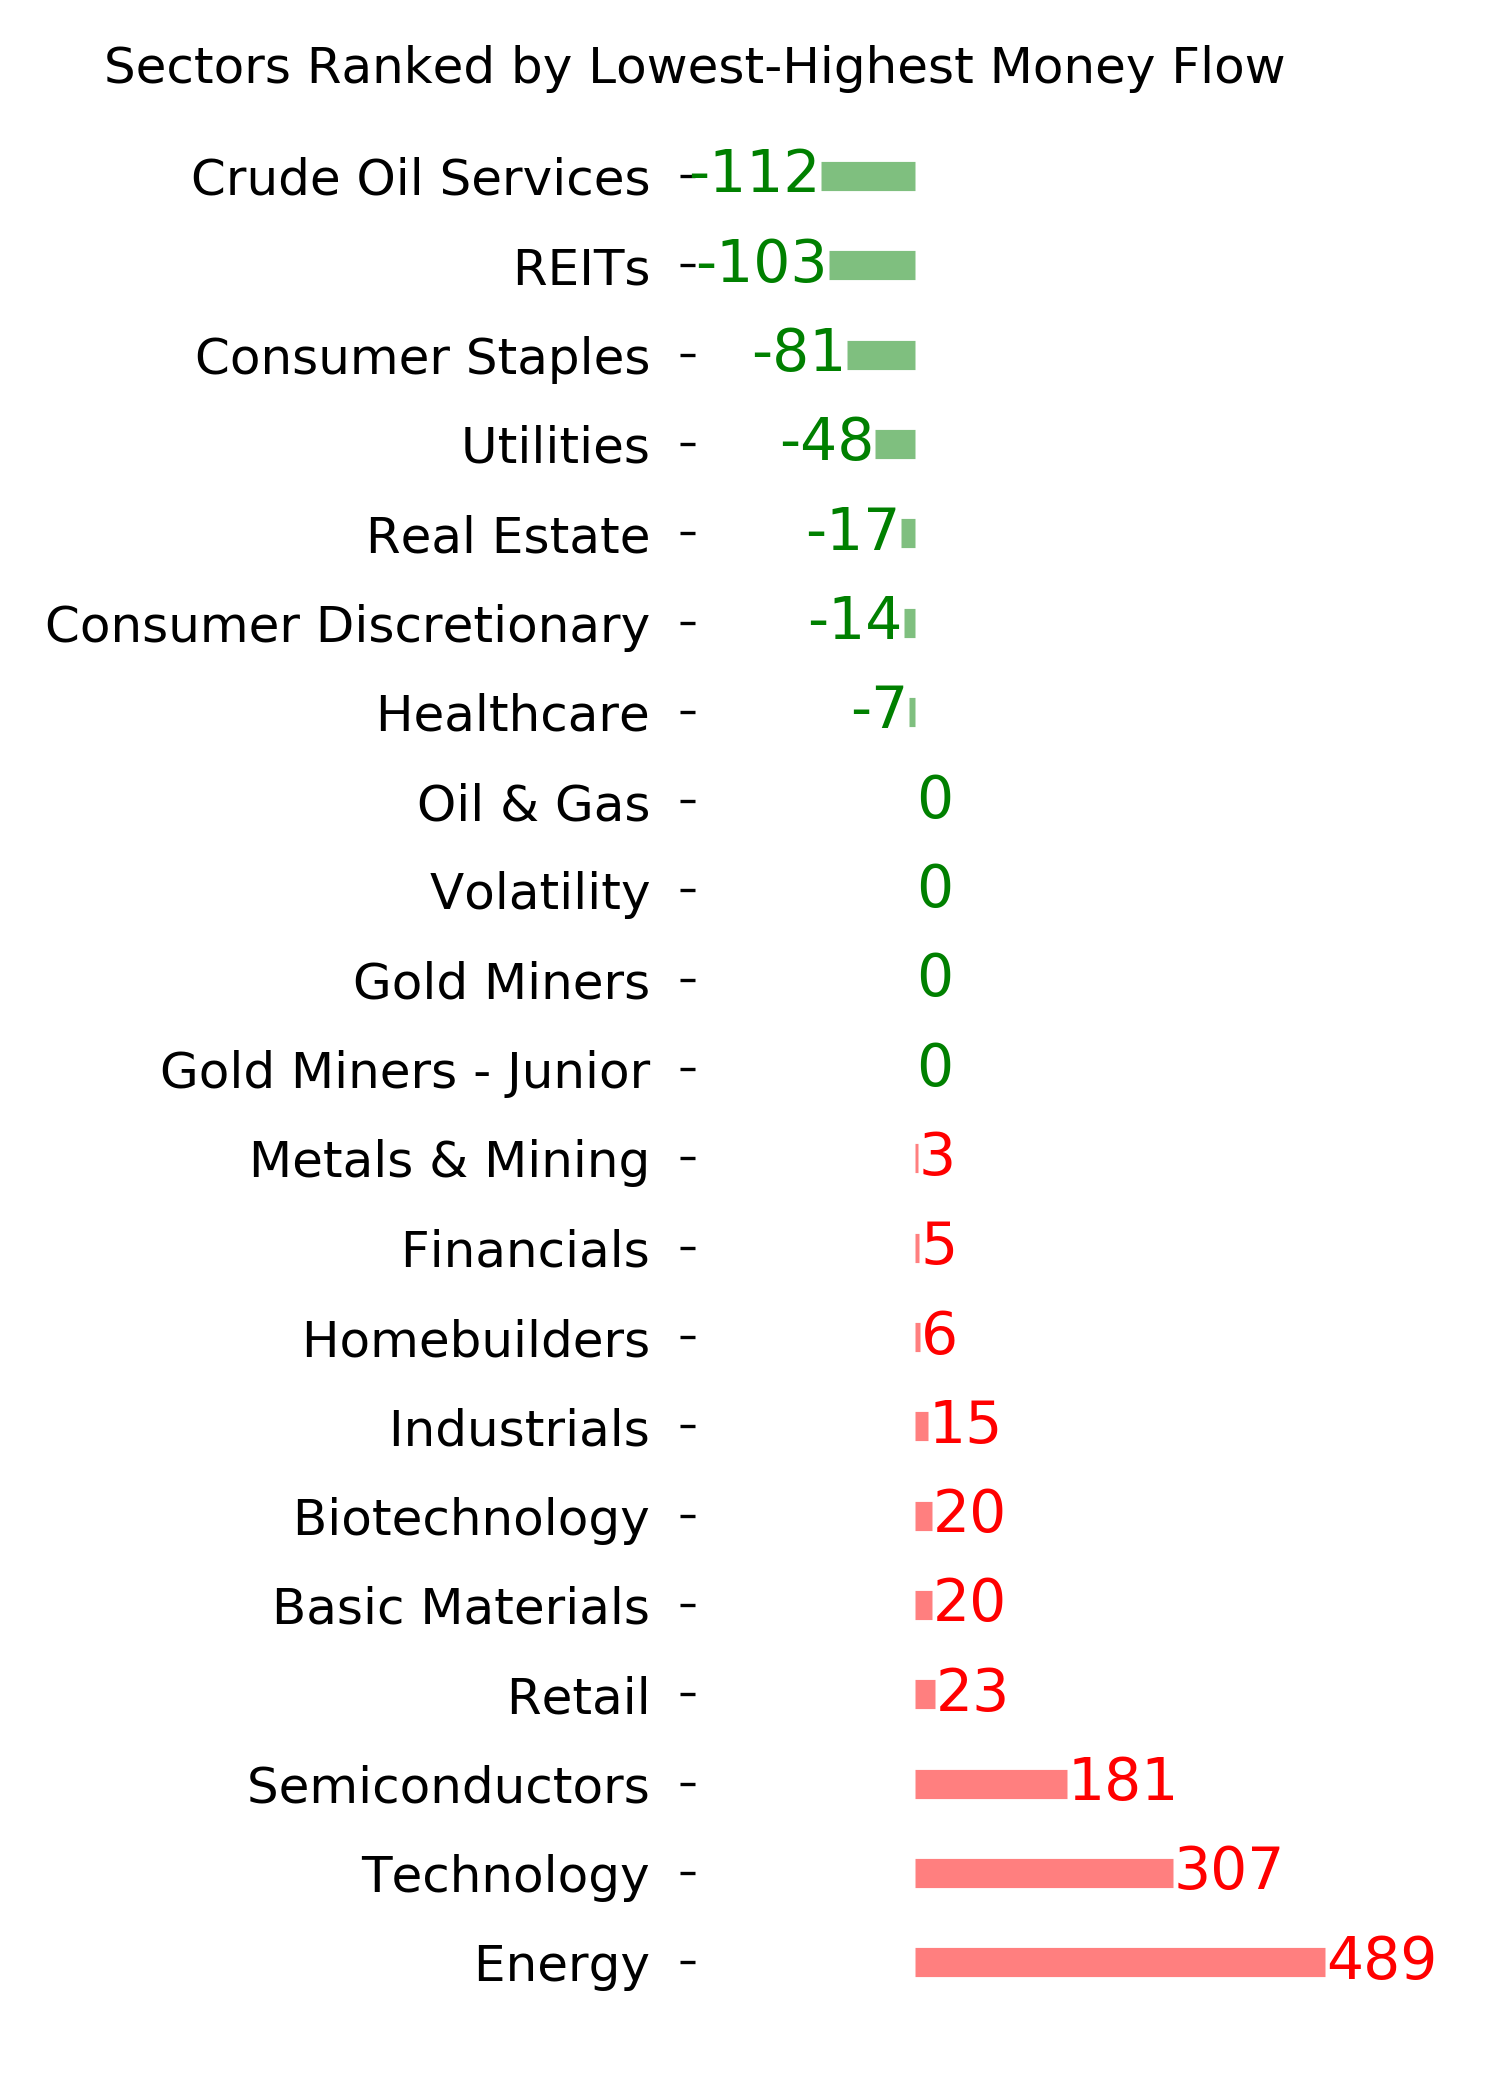
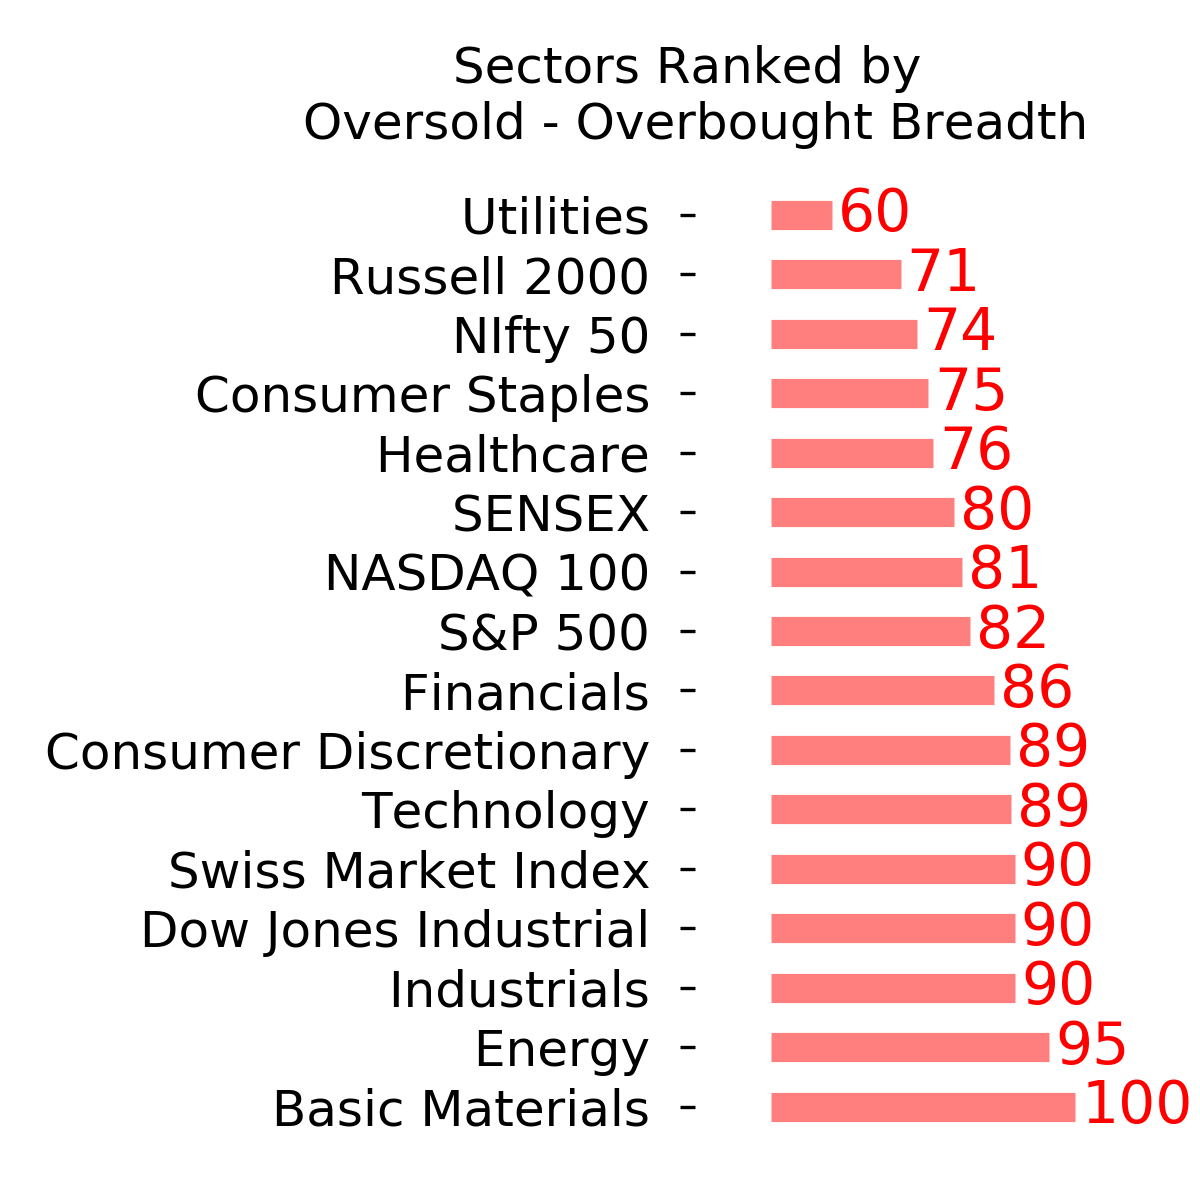
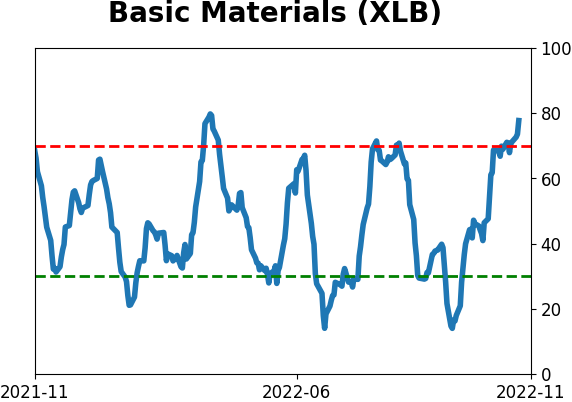
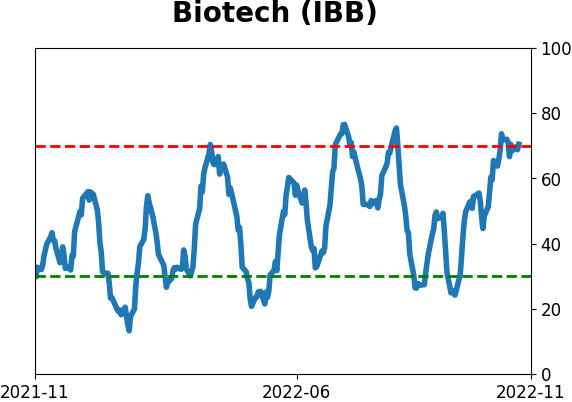
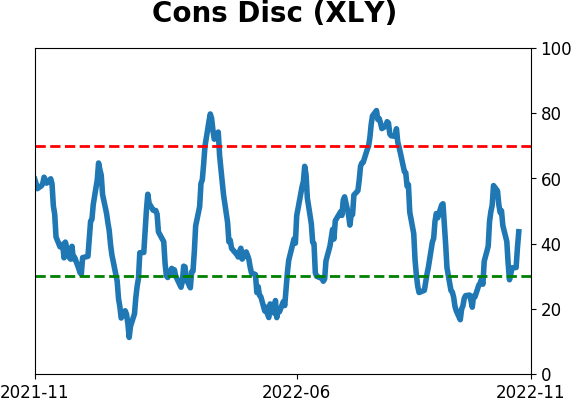
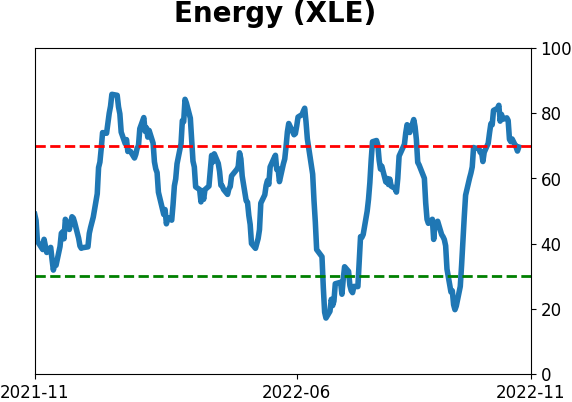
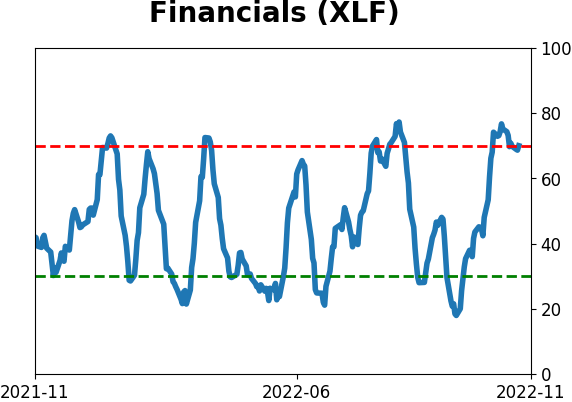
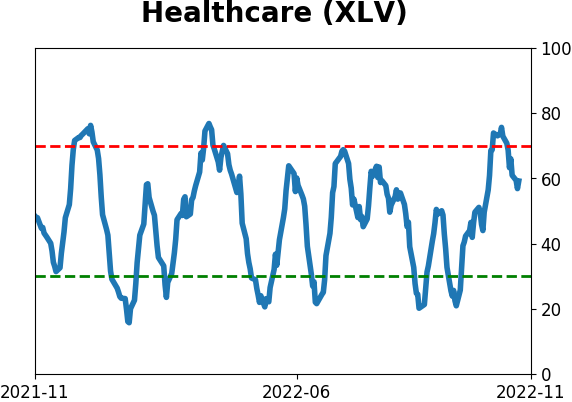
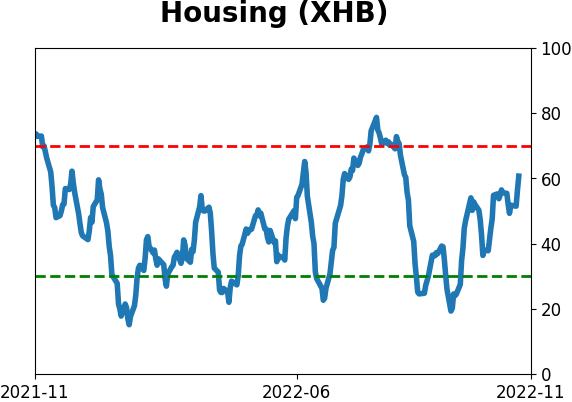
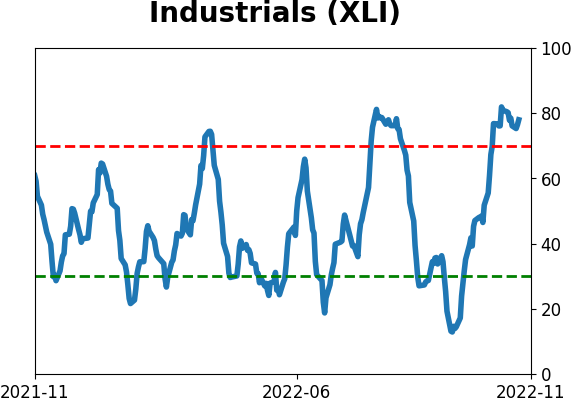
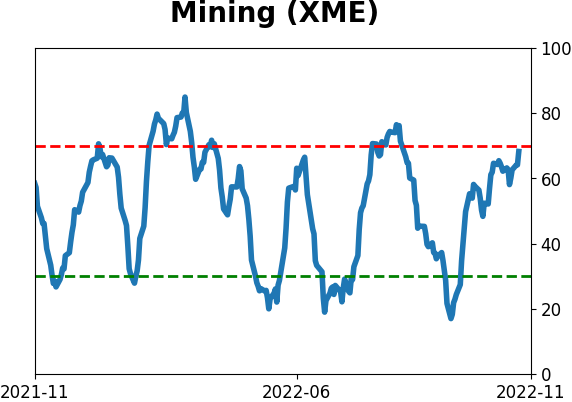
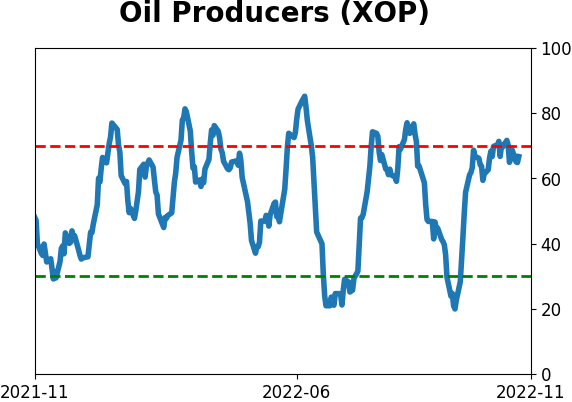
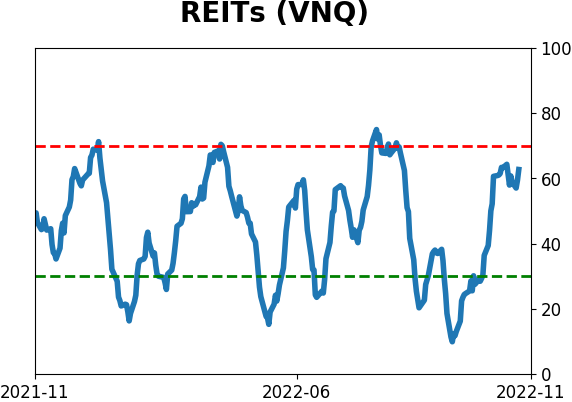
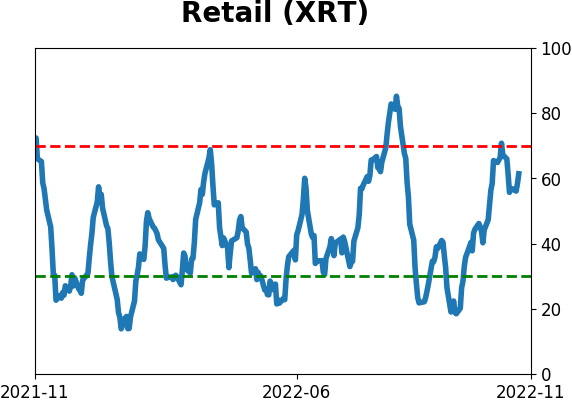
Sector ETF's - 10-Day Moving Average
|
|
|
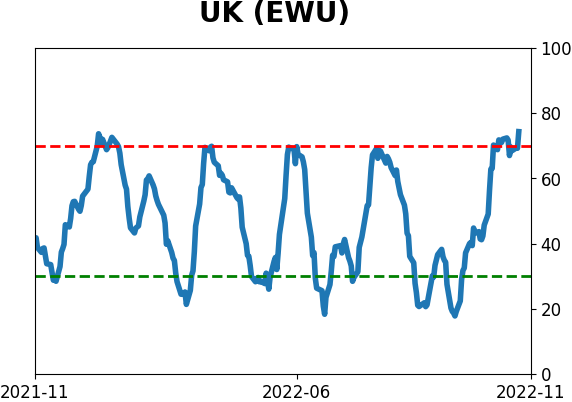
Country ETF's - 10-Day Moving Average
|
|
|
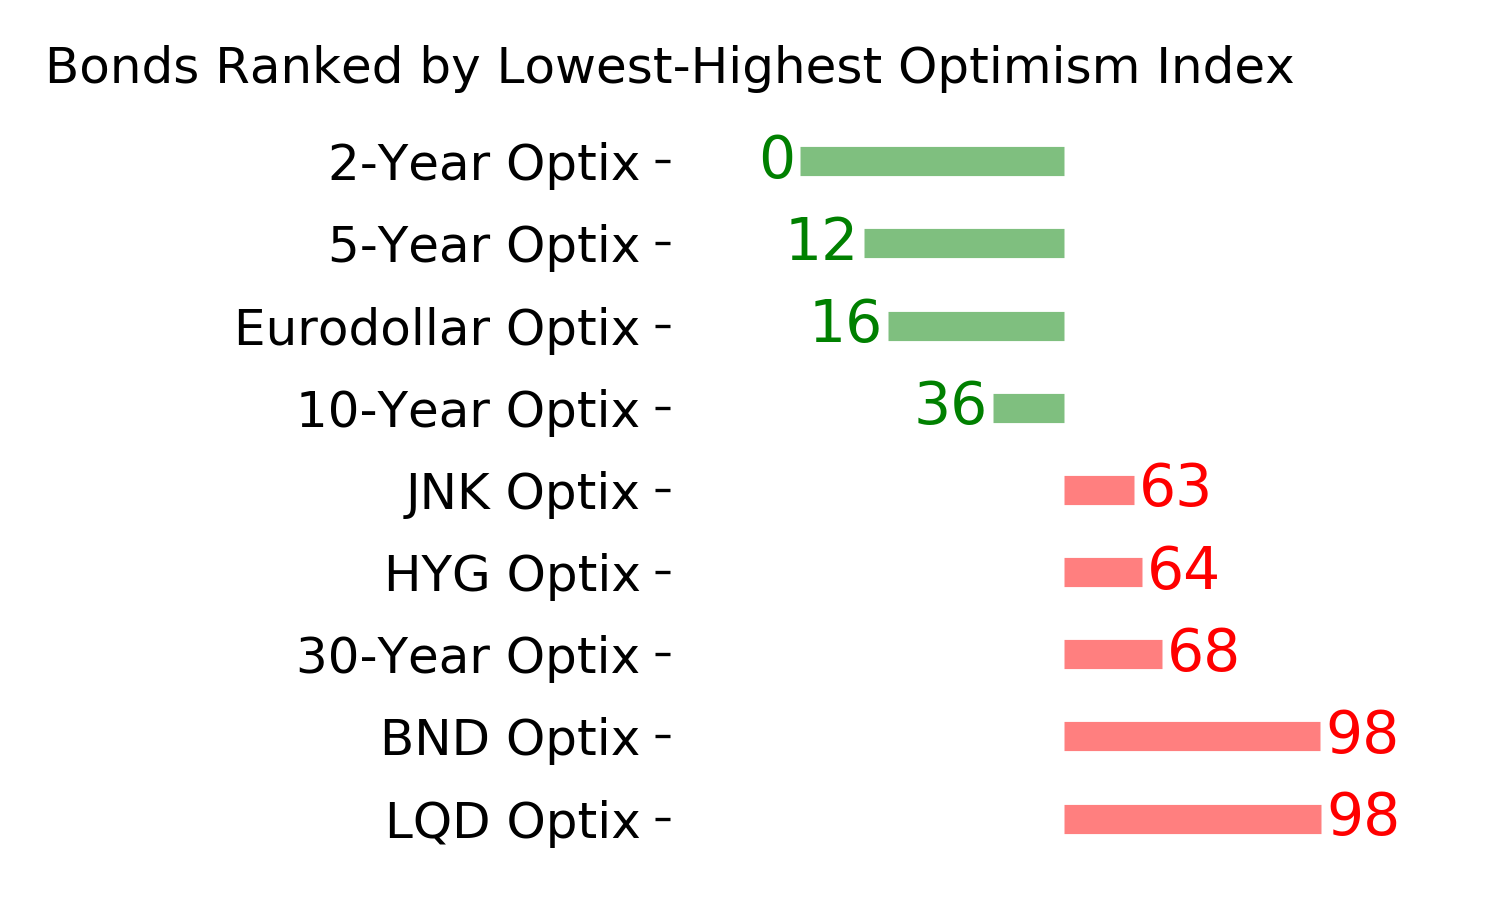
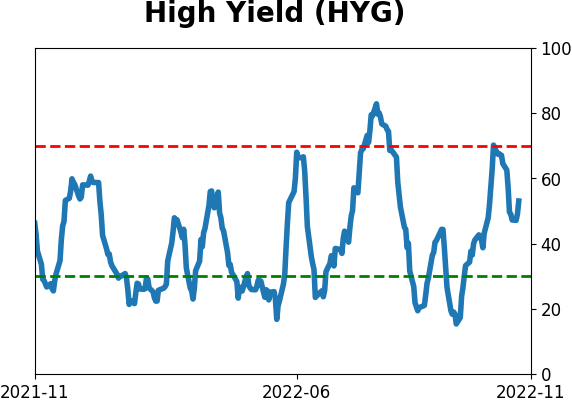
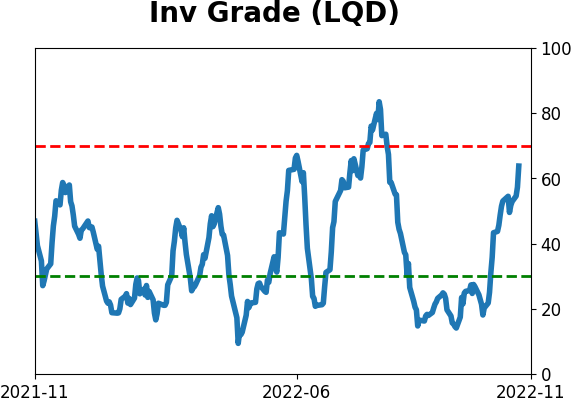
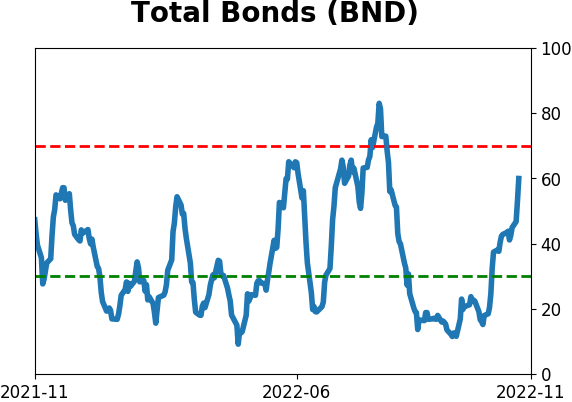
Bond ETF's - 10-Day Moving Average
|
|
|
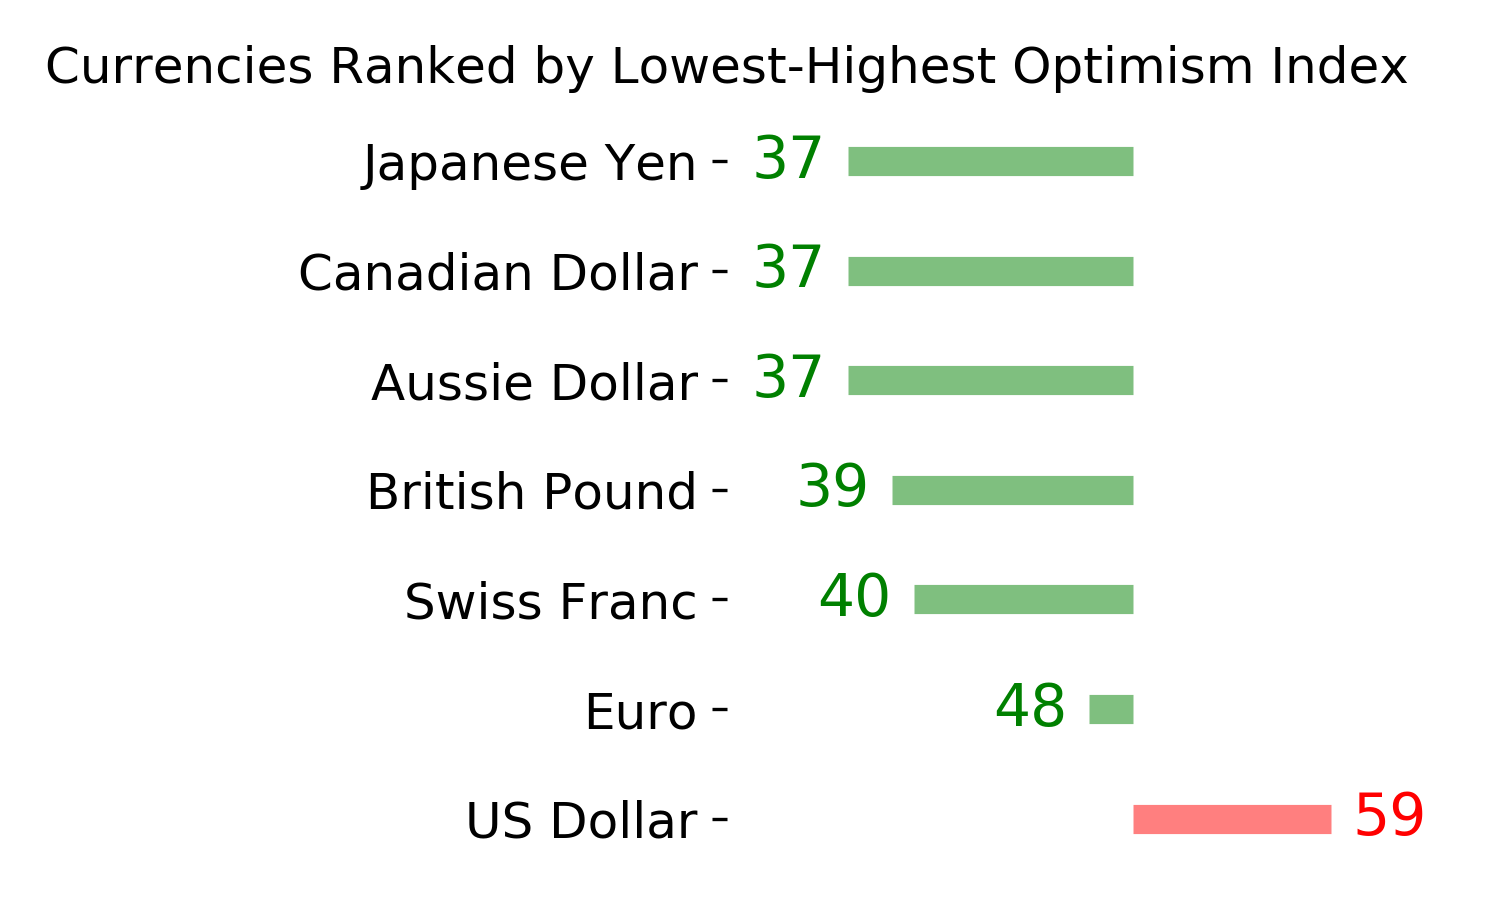
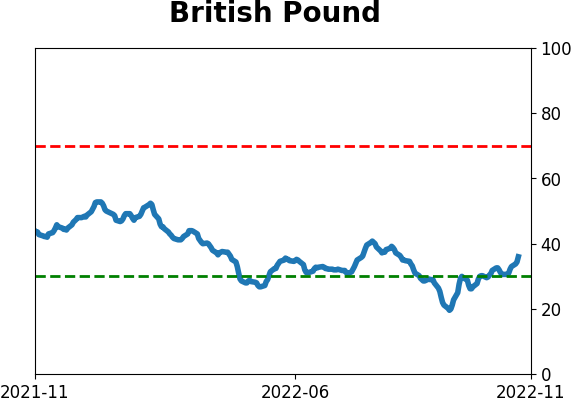
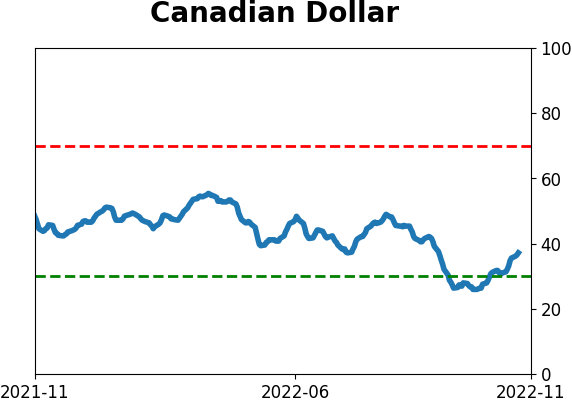
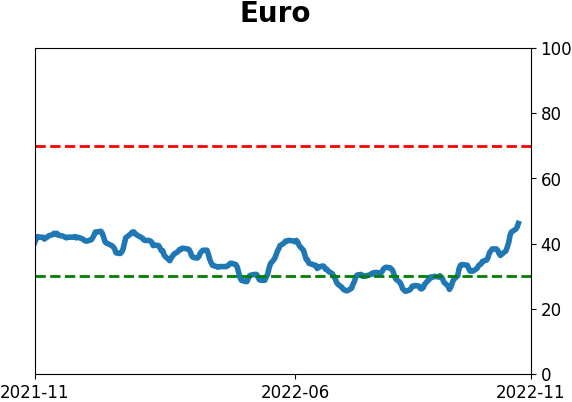
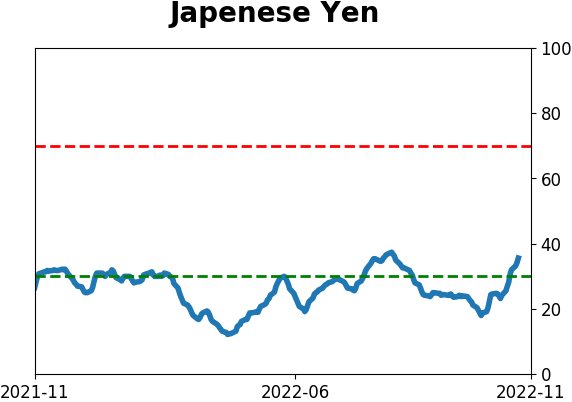
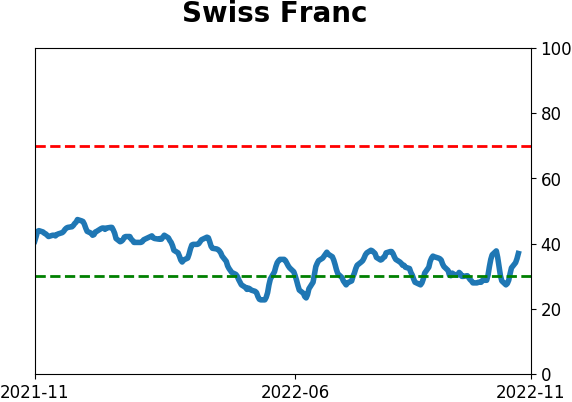
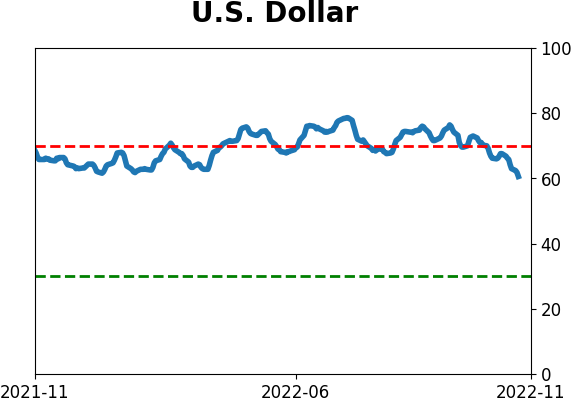
Currency ETF's - 5-Day Moving Average
|
|
|
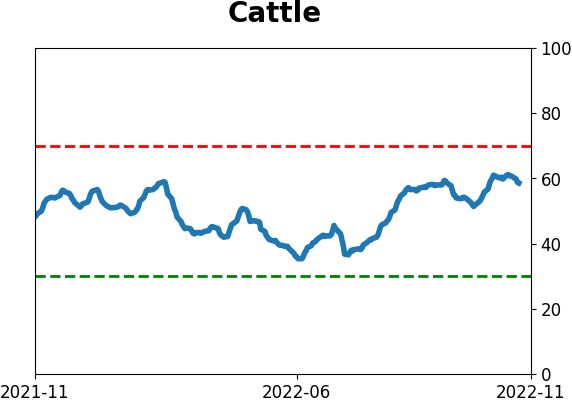
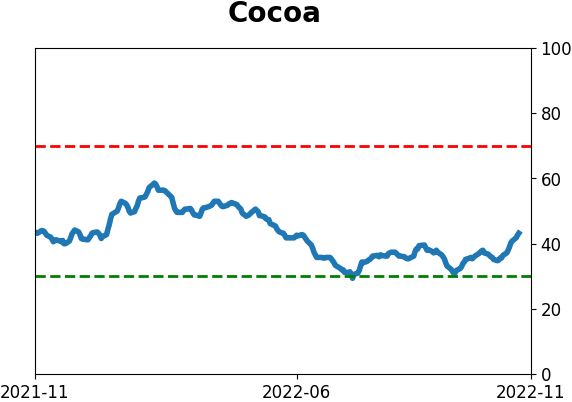
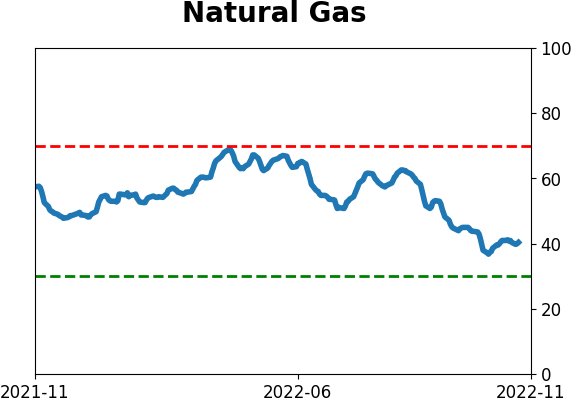
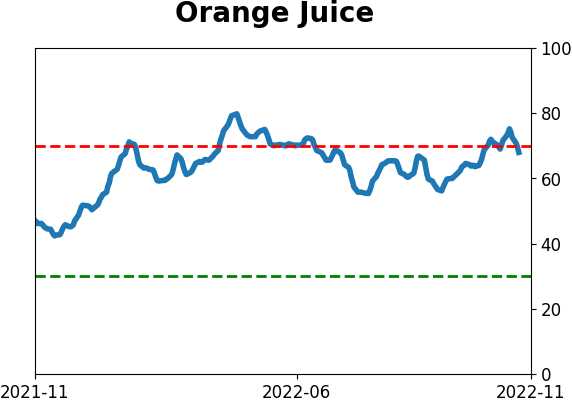
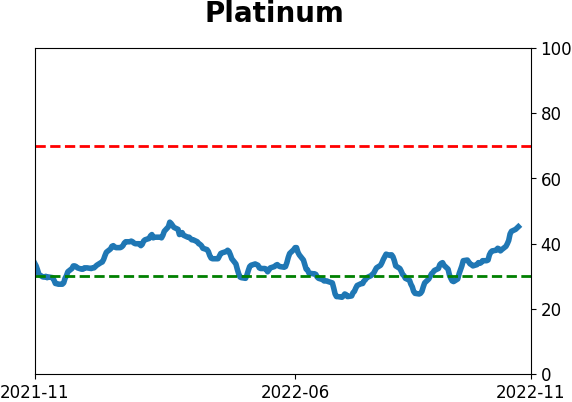
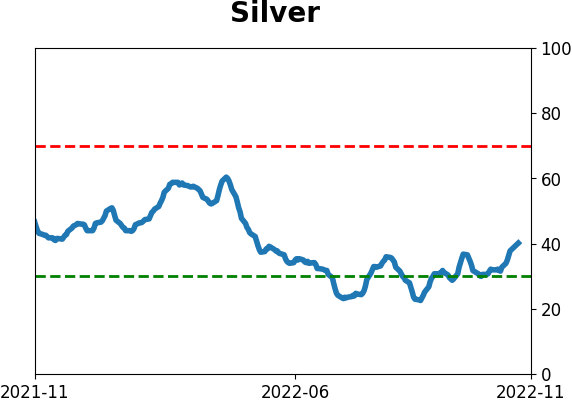
Commodity ETF's - 5-Day Moving Average
|
|