Headlines
|
|
Gold shrugs off rising dollar and breaks out with favorable indicators:
Gold has broken above its upper Bollinger Band after they showed a tight range. It has also bucked a rising dollar. Other indicators mostly support rising gold prices.
Bottom Line:
STOCKS: Hold By early October, sentiment had reset. Several important momentum streaks ended, which has brought in buyers in the past, and seasonality turned positive. We're now seeing signs that sentiment has quickly shifted, especially among options traders. It's gotten to an extreme that has preceded weaker-than-average returns.
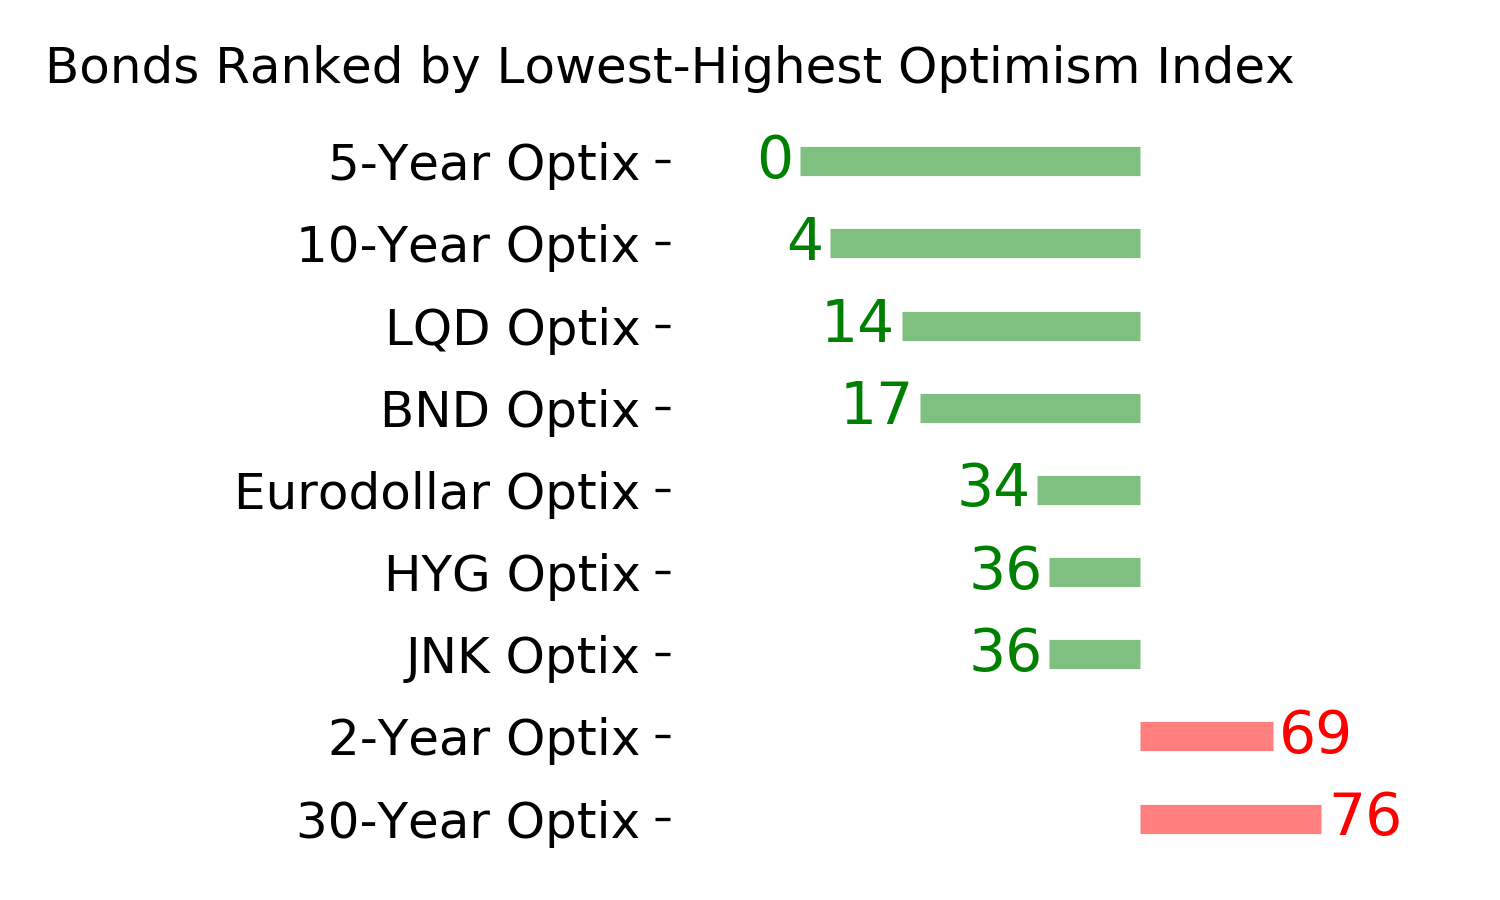
BONDS: Hold In late October, sentiment on bonds - from Treasuries to corporates - entered pessimistic territory. It's now starting to recover, with some quick moves in corporate bonds. We'll see if those bonds, in particular, can hold recent gains.
GOLD: Hold
Gold and miners were rejected after trying to recover above their 200-day averages in May. Some oversold extremes in breadth measures among miners triggered in late September, and they've recovered a bit since then. The group still has some proving to do.
|
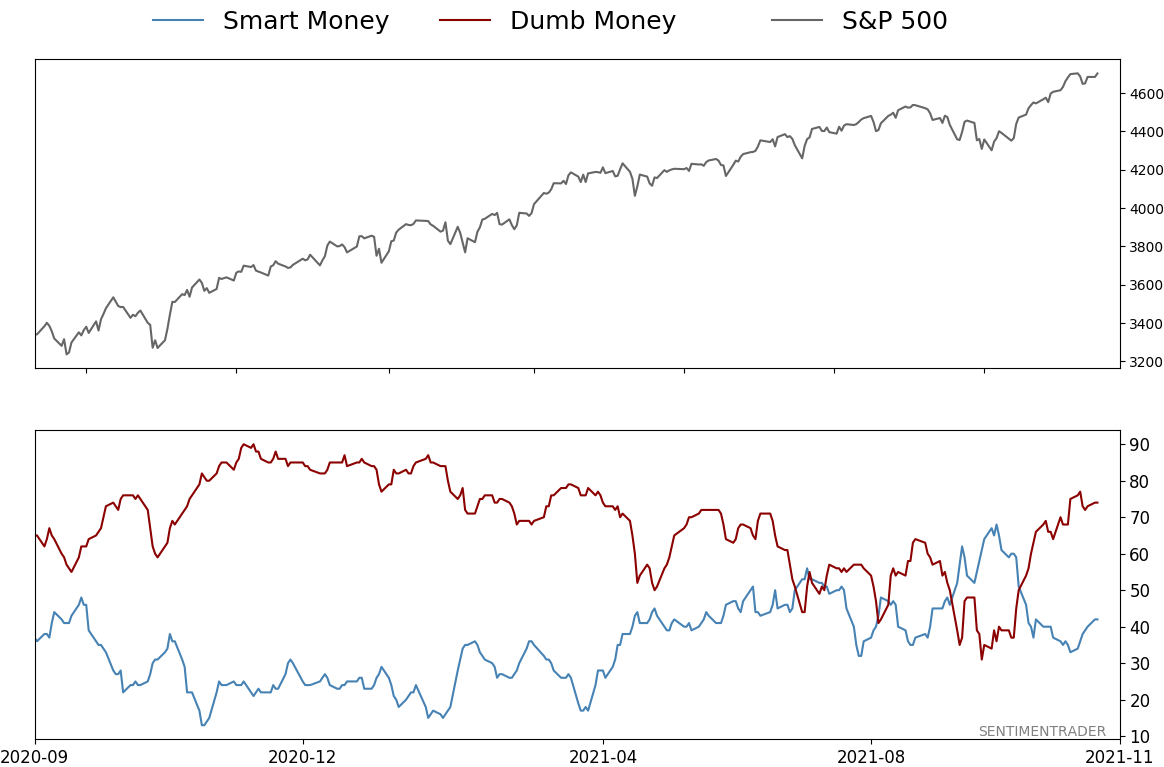
Smart / Dumb Money Confidence
|
Smart Money Confidence: 42%
Dumb Money Confidence: 74%
|
|
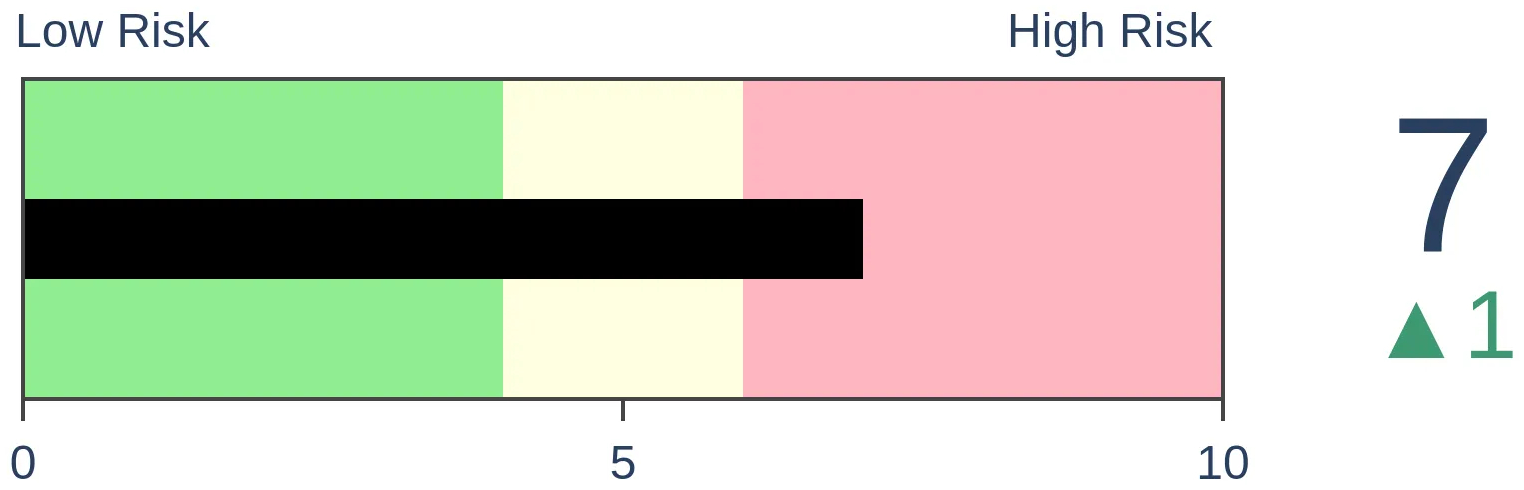
Risk Levels
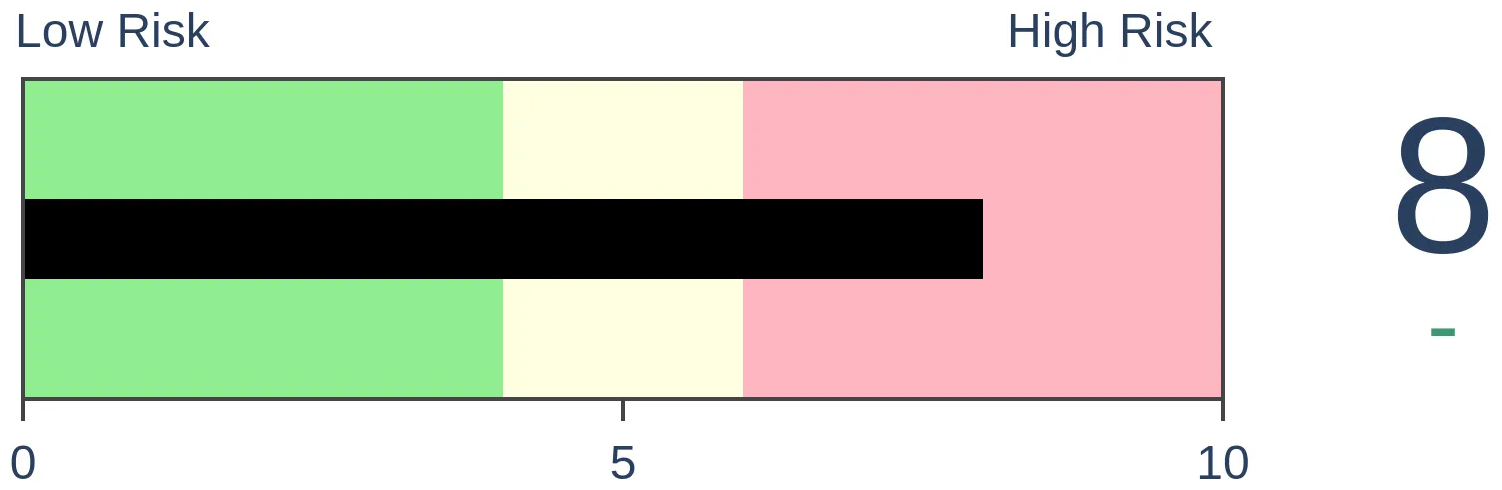
Stocks Short-Term
|
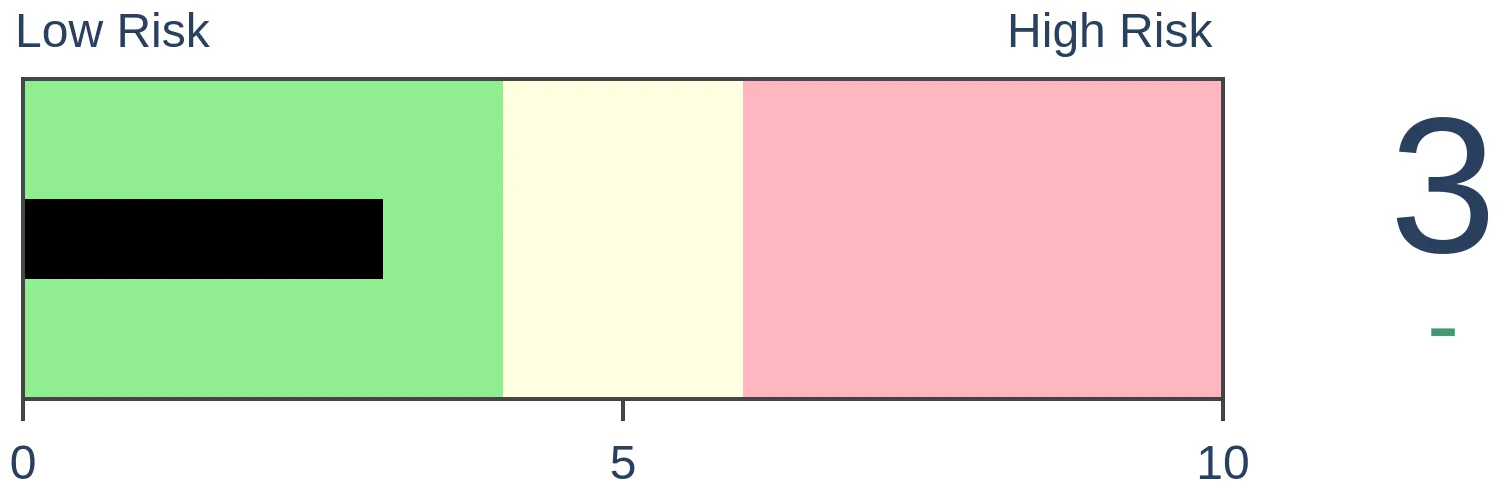
Stocks Medium-Term
|
|
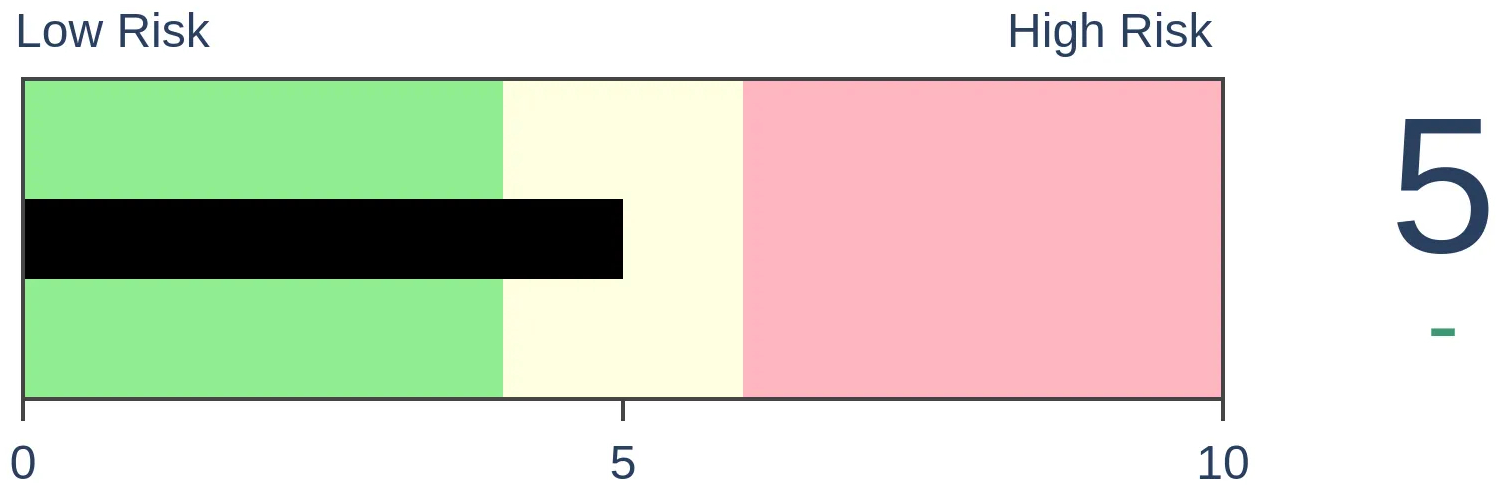
Bonds
|
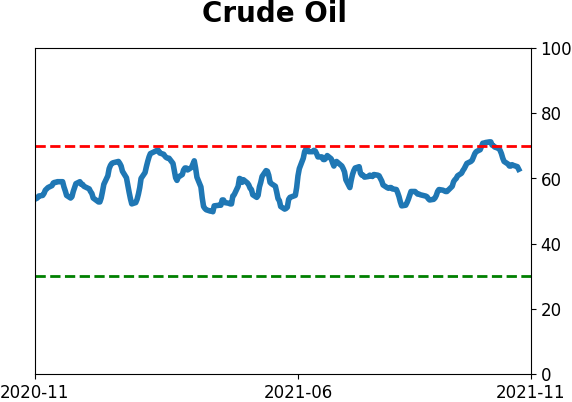
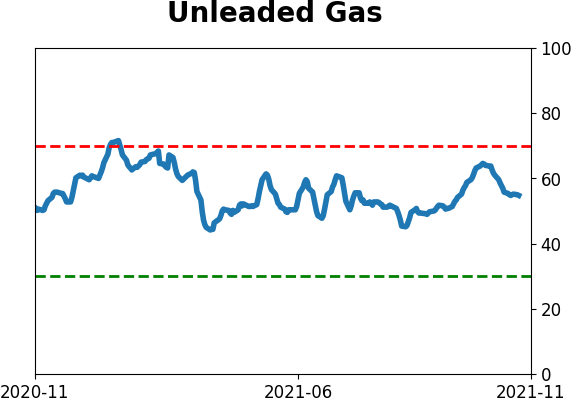
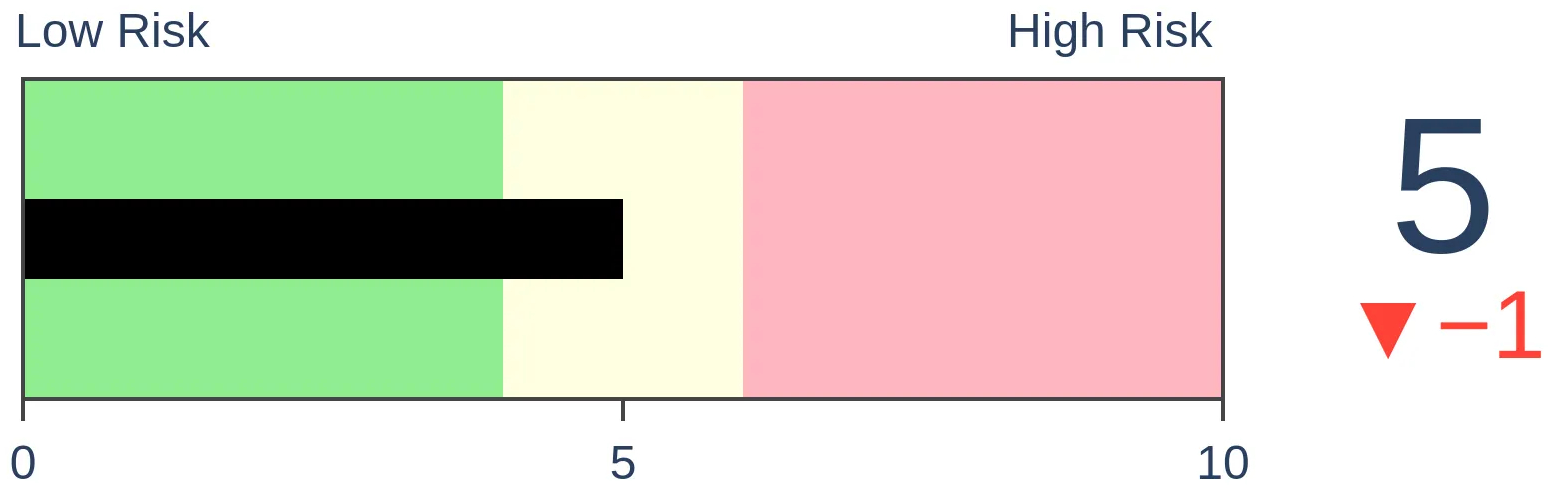
Crude Oil
|
|
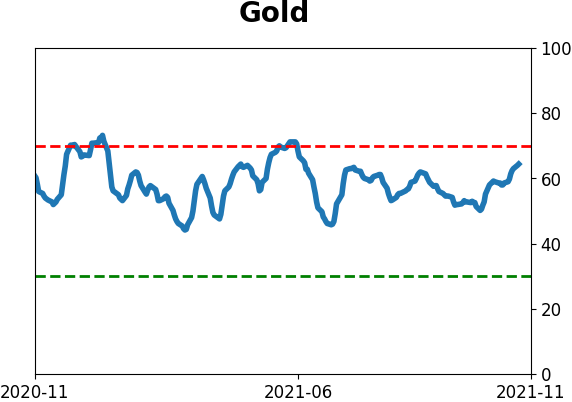
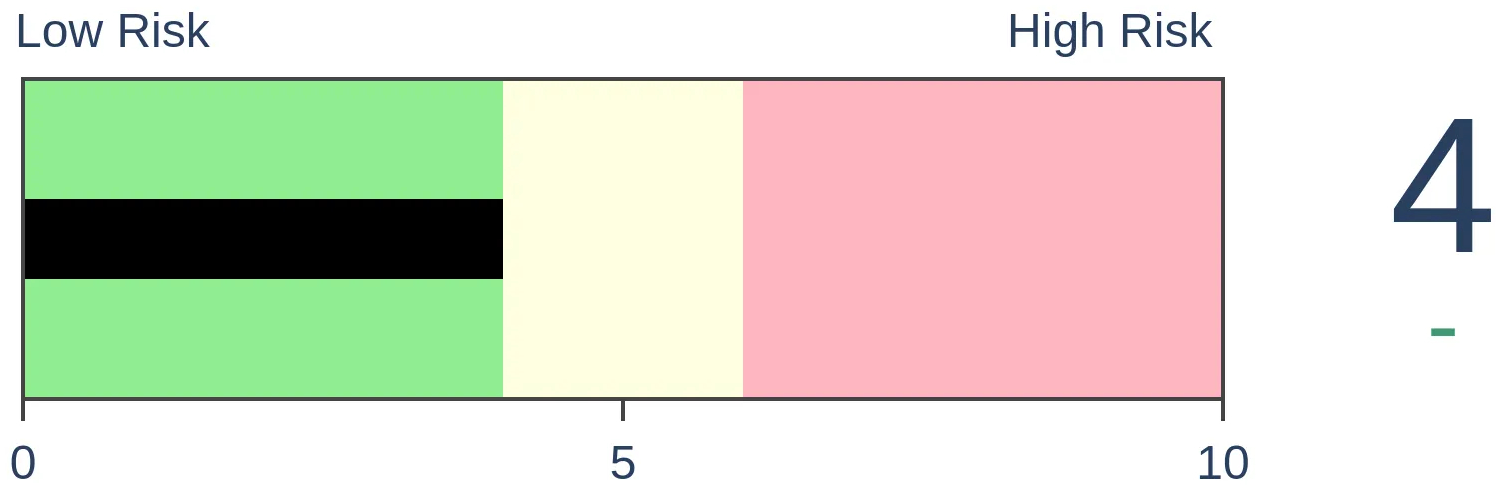
Gold
|
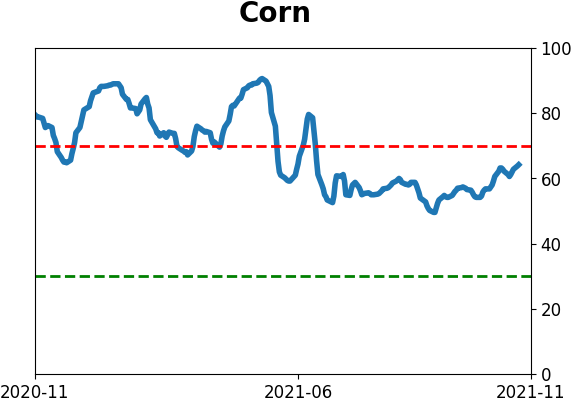
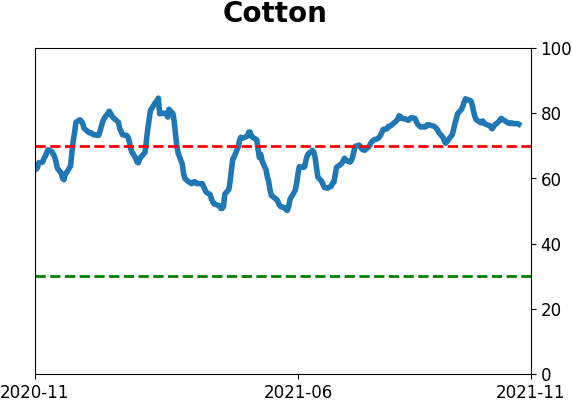
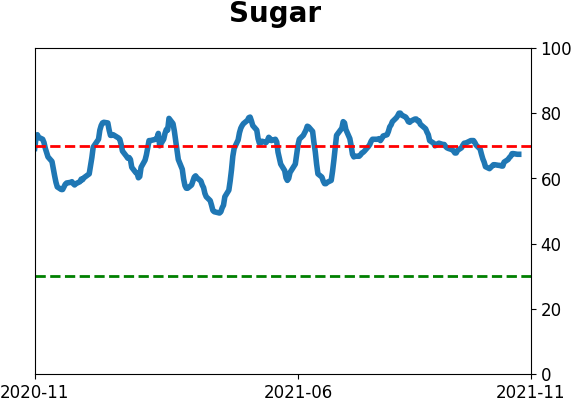
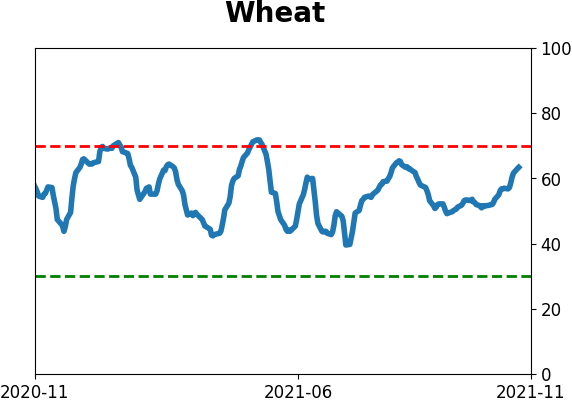
Agriculture
|
|
Research
By Jason Goepfert
BOTTOM LINE
Gold has broken above its upper Bollinger Band after they showed a tight range. It has also bucked a rising dollar. Other indicators mostly support rising gold prices.
FORECAST / TIMEFRAME
None
|
Key points:
- Gold has broken out of a tight consolidation as it shrugs off a rising dollar
- Similar breakouts led to mostly positive returns
- Other indicators support a longer-term rally
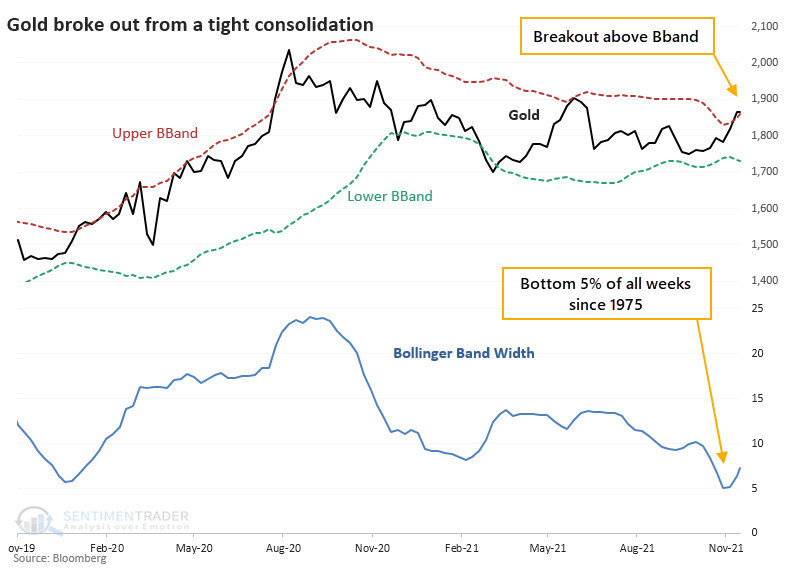
Gold breaks out from a consolidation
For over a year, gold hasn't gone anywhere. It peaked on a flurry of optimism last August and has struggled to hold any short-term rallies ever since. There is a sense of hope among gold bugs because after consolidating in a tight range, gold broke out above its weekly volatility bands.
Bloomberg tested a gold breakout system that looked for times when gold jumped higher after its weekly Bollinger Band tightened. Gold's Bands were within 6% of each other, ranking in the bottom 5% of all weekly readings since 1975. Now, it has shot above its upper Band.
These breakouts were mostly good for gold prices going forward. Its worst returns tended to be after it had rallied significantly; signals that triggered near a low generally continued higher. All of the signals in the past 20 years preceded higher prices from one month and beyond.
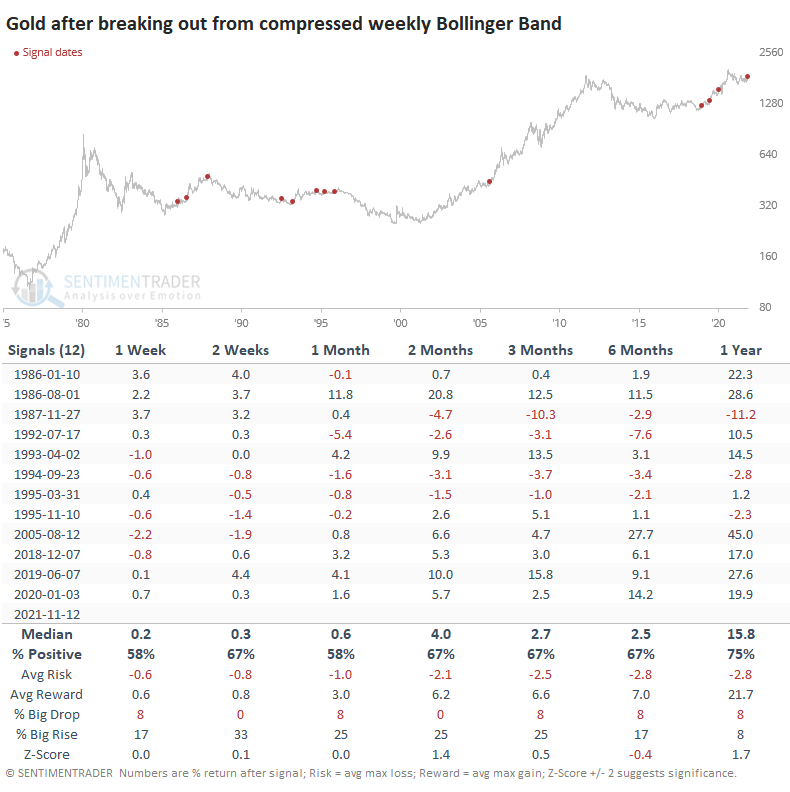
The biggest question about whether the current signal will be successful is the market environment. The signals led to poor medium-term returns from 1985 through 1995 and strong ones since then. Trends in the U.S. dollar might have some say about that.
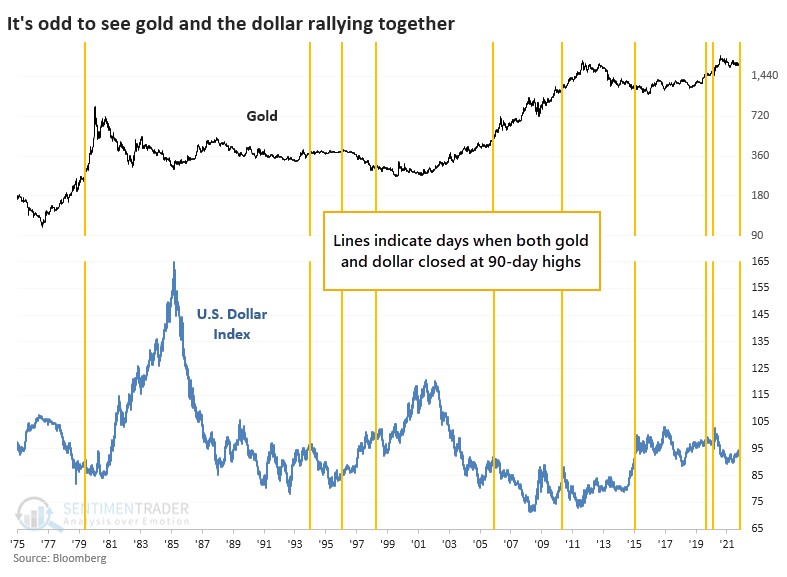
Shrugging off the dollar
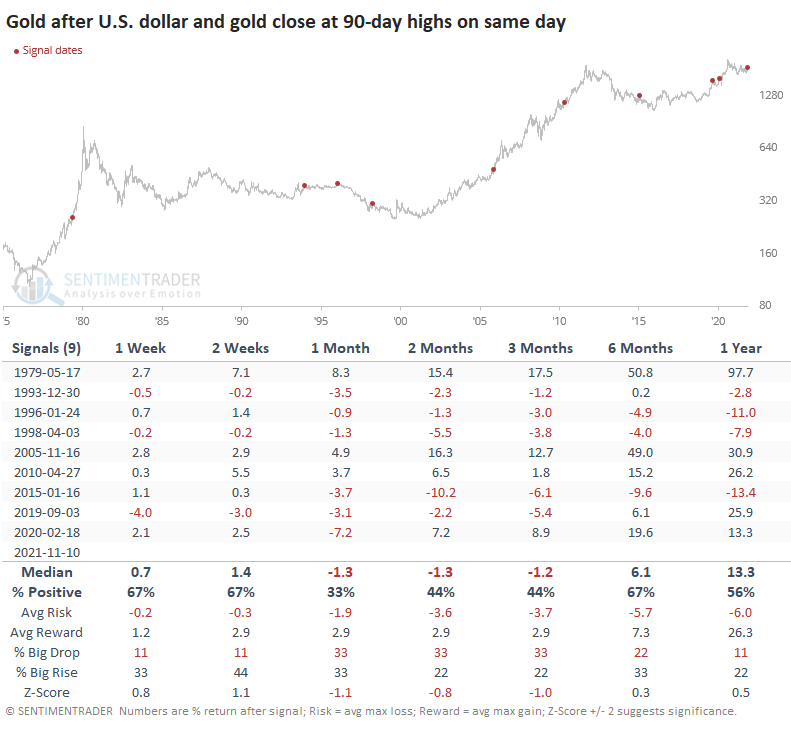
A highly unusual circumstance we're seeing now is that gold is breaking out along with the dollar. In recent days, both markets have been hitting their highest levels in at least 90 days.
Since 1975, there has been a correlation of -0.31 (on a scale of -1.0 to +1.0) between daily changes in gold and the dollar. The correlation generally gets more negative as you expand the time frame. There have only been 9 other times when both markets hit a 90-day high at the same time.
One might think that this would be wildly bullish for gold because it's shrugging off a historical relationship; one would be wrong. While gold's returns over the next 6-12 months were positive, better than random, and with a decent risk/reward profile (over the next year, anyway), it struggled to hold gains during the next 1-3 months.
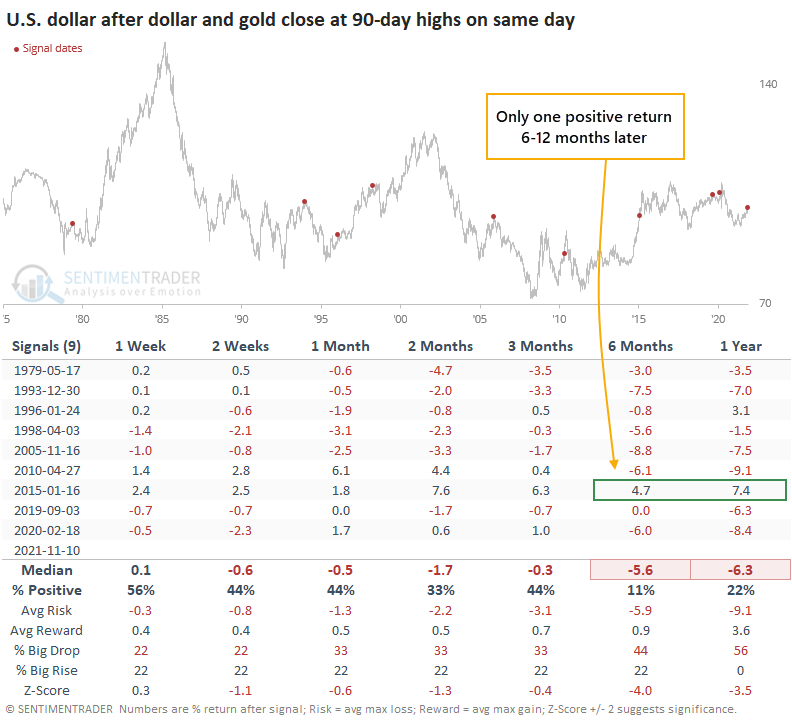
It was even worse for the dollar as the buck lost ground on most time frames. Only one signal, from 2015, showed a positive return across all of them. The dollar's horrid performance over the next 6-12 months helps explain gold's mostly positive returns.
Other indicators show mostly good signs
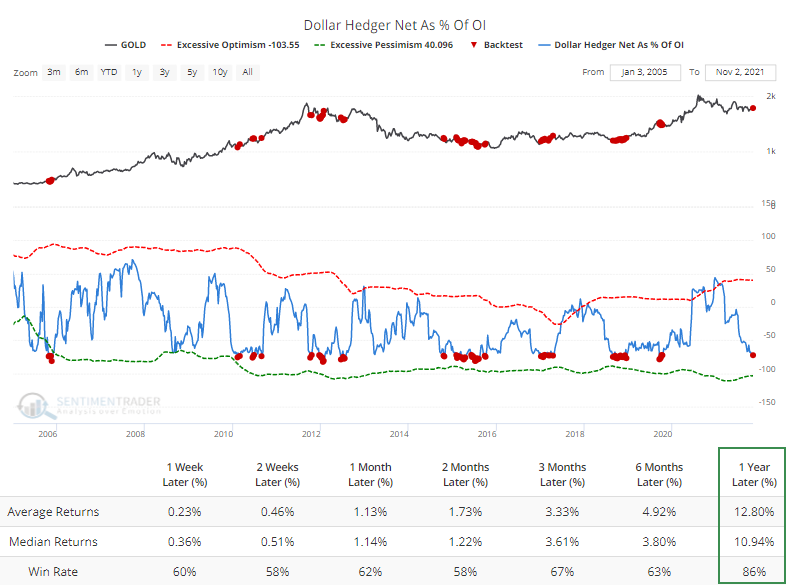
During the recent rally, "smart money" commercial hedgers have built up a sizeable short position against the dollar, accounting for more than 70% of open interest. The Backtest Engine shows that when hedgers were betting heavily against the dollar, gold did pretty well. Not perfect, but a double-digit annual return and 86% win rate is notable.
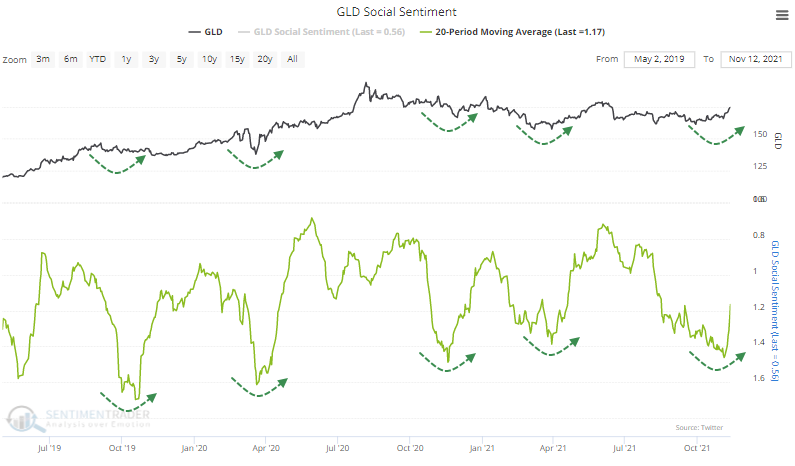
Other indicators also mostly support a rise in gold prices. Social Sentiment has been quite negative, showing about 1.5 negative messages for every positive one over the past month. The chart shows an inverse scale to better show periods of optimism and pessimism.
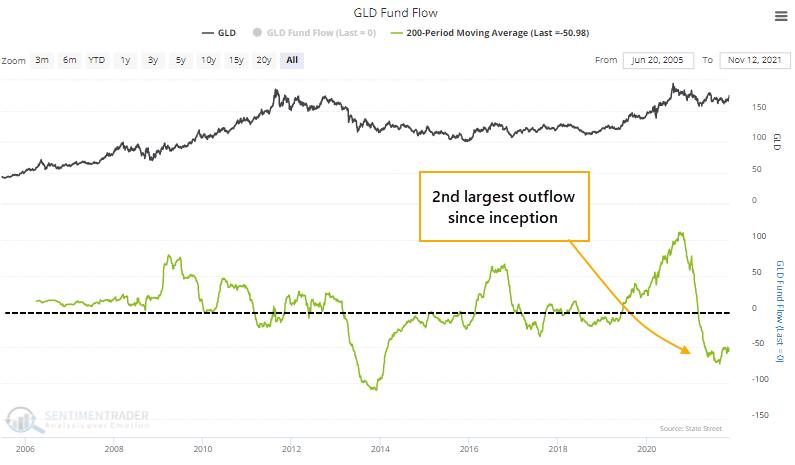
The GLD fund has witnessed an outflow of more than $50 million on an average day over the past 200 sessions. Since the fund's inception, only late 2013 - early 2014 can compare.
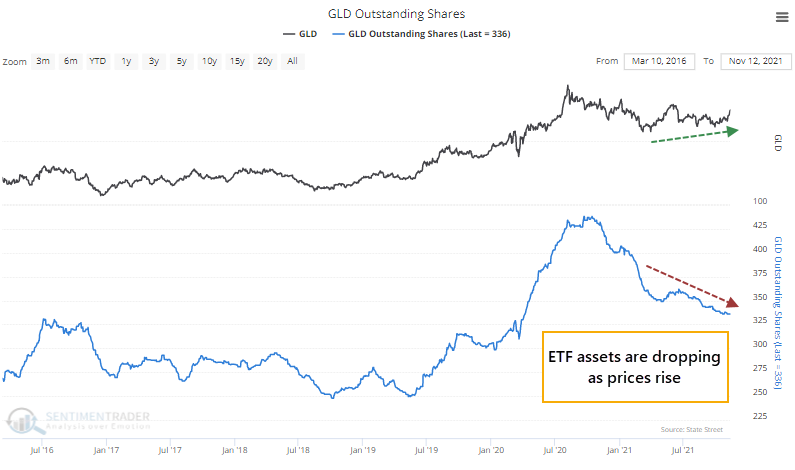
Because of the steady outflow, ETF assets aren't rising along with prices. This isn't just a GLD phenomenon; total gold ounces held by ETFs continue to bleed lower and are about where they were in May 2020. While not a perfect proxy, this suggests that trend following traders aren't yet buying the idea of a new bull market in gold.
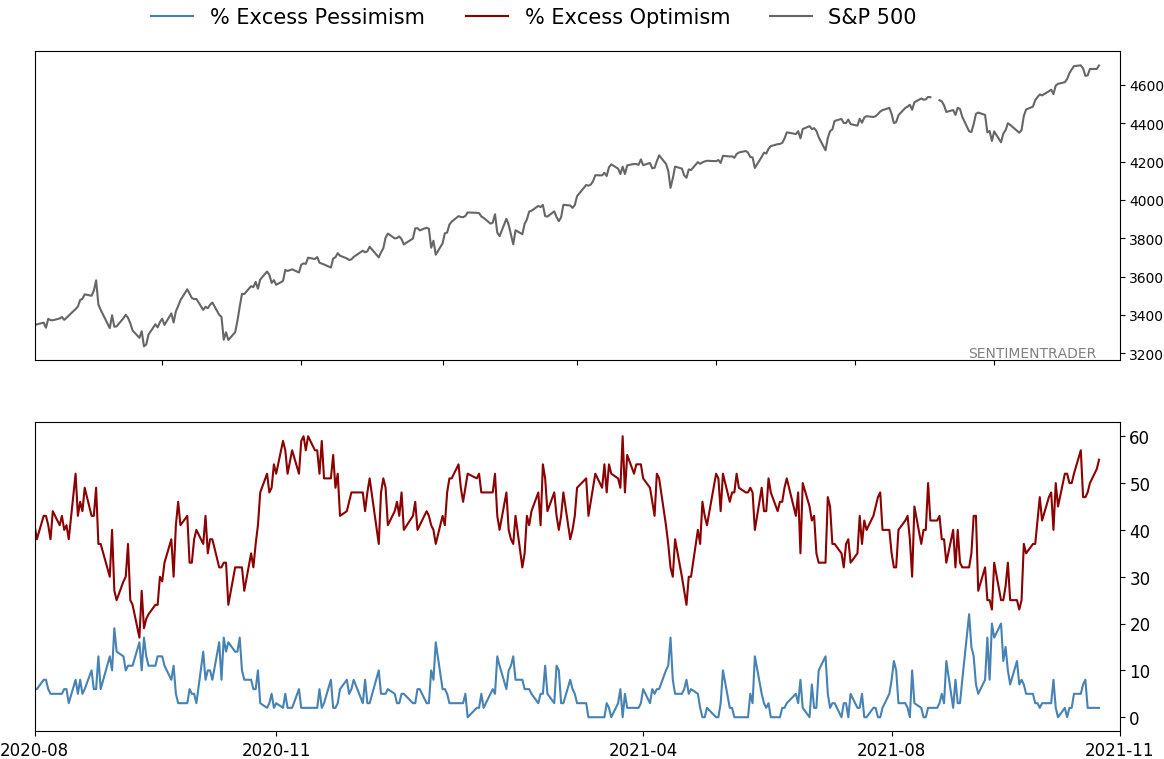
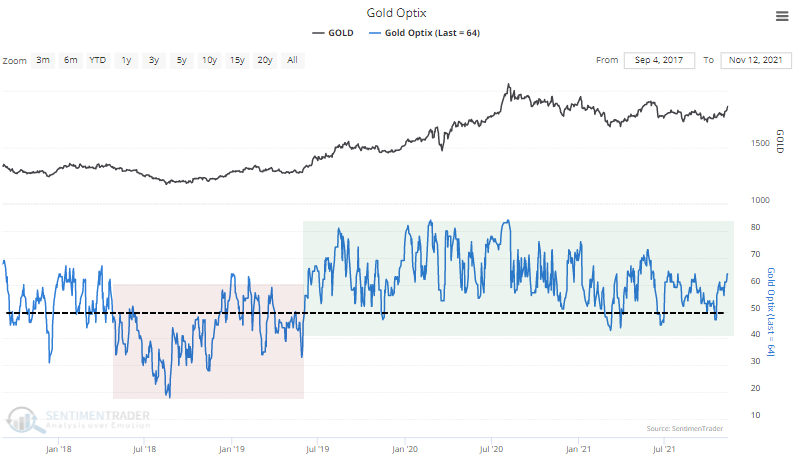
Despite the poor sentiment, gold's Optimism Index has held mostly above 50 over the past year, which is what bull markets do. During healthy environments, sentiment typically holds above 50, with dips below 40 normally triggering buying interest, and readings above 60 not leading to major declines. Unhealthy environments see the opposite.
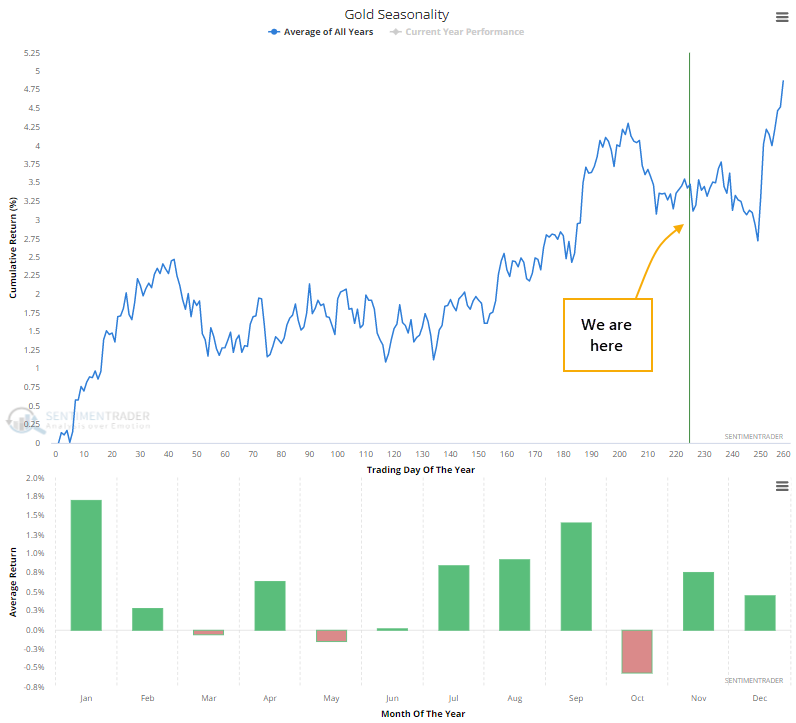
Gold's seasonal window is still suspect for a while but turns very positive in a few weeks and lasts through February.
What the research tells us...
Gold has had difficulty holding buying interest over the past year, and other times it shrugged off a rising dollar didn't help matters much. It can be dangerous to get too cute about how prices should behave, but since this market tends to settle back a bit after a surge and within an unfavorable seasonal window until mid-December, it would make sense if it pulled back. But most signs point to that potential as being a wiggle within what should be a longer uptrend.
Active Studies
| Time Frame | Bullish | Bearish | | Short-Term | 2 | 0 | | Medium-Term | 11 | 0 | | Long-Term | 13 | 5 |
|
Indicators at Extremes
Portfolio
| Position | Description | Weight % | Added / Reduced | Date | | Stocks | RSP | 10.7 | Added 6.4% | 2021-10-01 | | Bonds | 32.7% BND, 7.1% SCHP | 39.8 | Added 8.3% | 2021-10-26 | | Commodities | GCC | 2.4 | Reduced 2.1%
| 2020-09-04 | | Precious Metals | GDX | 4.6 | Reduced 4.2% | 2021-05-19 | | Special Situations | 9.8% KWEB, 4.7% XLE, 2.9% PSCE | 17.3 | Added 9.78% | 2021-10-01 | | Cash | | 24.1 | | |
|
Updates (Changes made today are underlined)
Much of our momentum and trend work has remained positive for several months, with some scattered exceptions. Almost all sentiment-related work has shown a poor risk/reward ratio for stocks, especially as speculation drove to record highs in exuberance in February. Much of that has worn off, and most of our models are back toward neutral levels. There isn't much to be excited about here. The same goes for bonds and even gold. Gold has been performing well lately and is back above long-term trend lines. The issue is that it has a poor record of holding onto gains when attempting a long-term trend change like this, so we'll take a wait-and-see approach. Momentum has ebbed quickly in recent weeks, and nearing oversold levels in some indicators. This can be a dangerous area, with a lot of short-term volatility, but we'd be more inclined to add medium- to long-term exposure rather than sell on much more of a decline, thanks to already rock-bottom exposure. Other areas look more attractive, including some overseas markets. RETURN YTD: 12.0% 2020: 8.1%, 2019: 12.6%, 2018: 0.6%, 2017: 3.8%, 2016: 17.1%, 2015: 9.2%, 2014: 14.5%, 2013: 2.2%, 2012: 10.8%, 2011: 16.5%, 2010: 15.3%, 2009: 23.9%, 2008: 16.2%, 2007: 7.8%
|
|
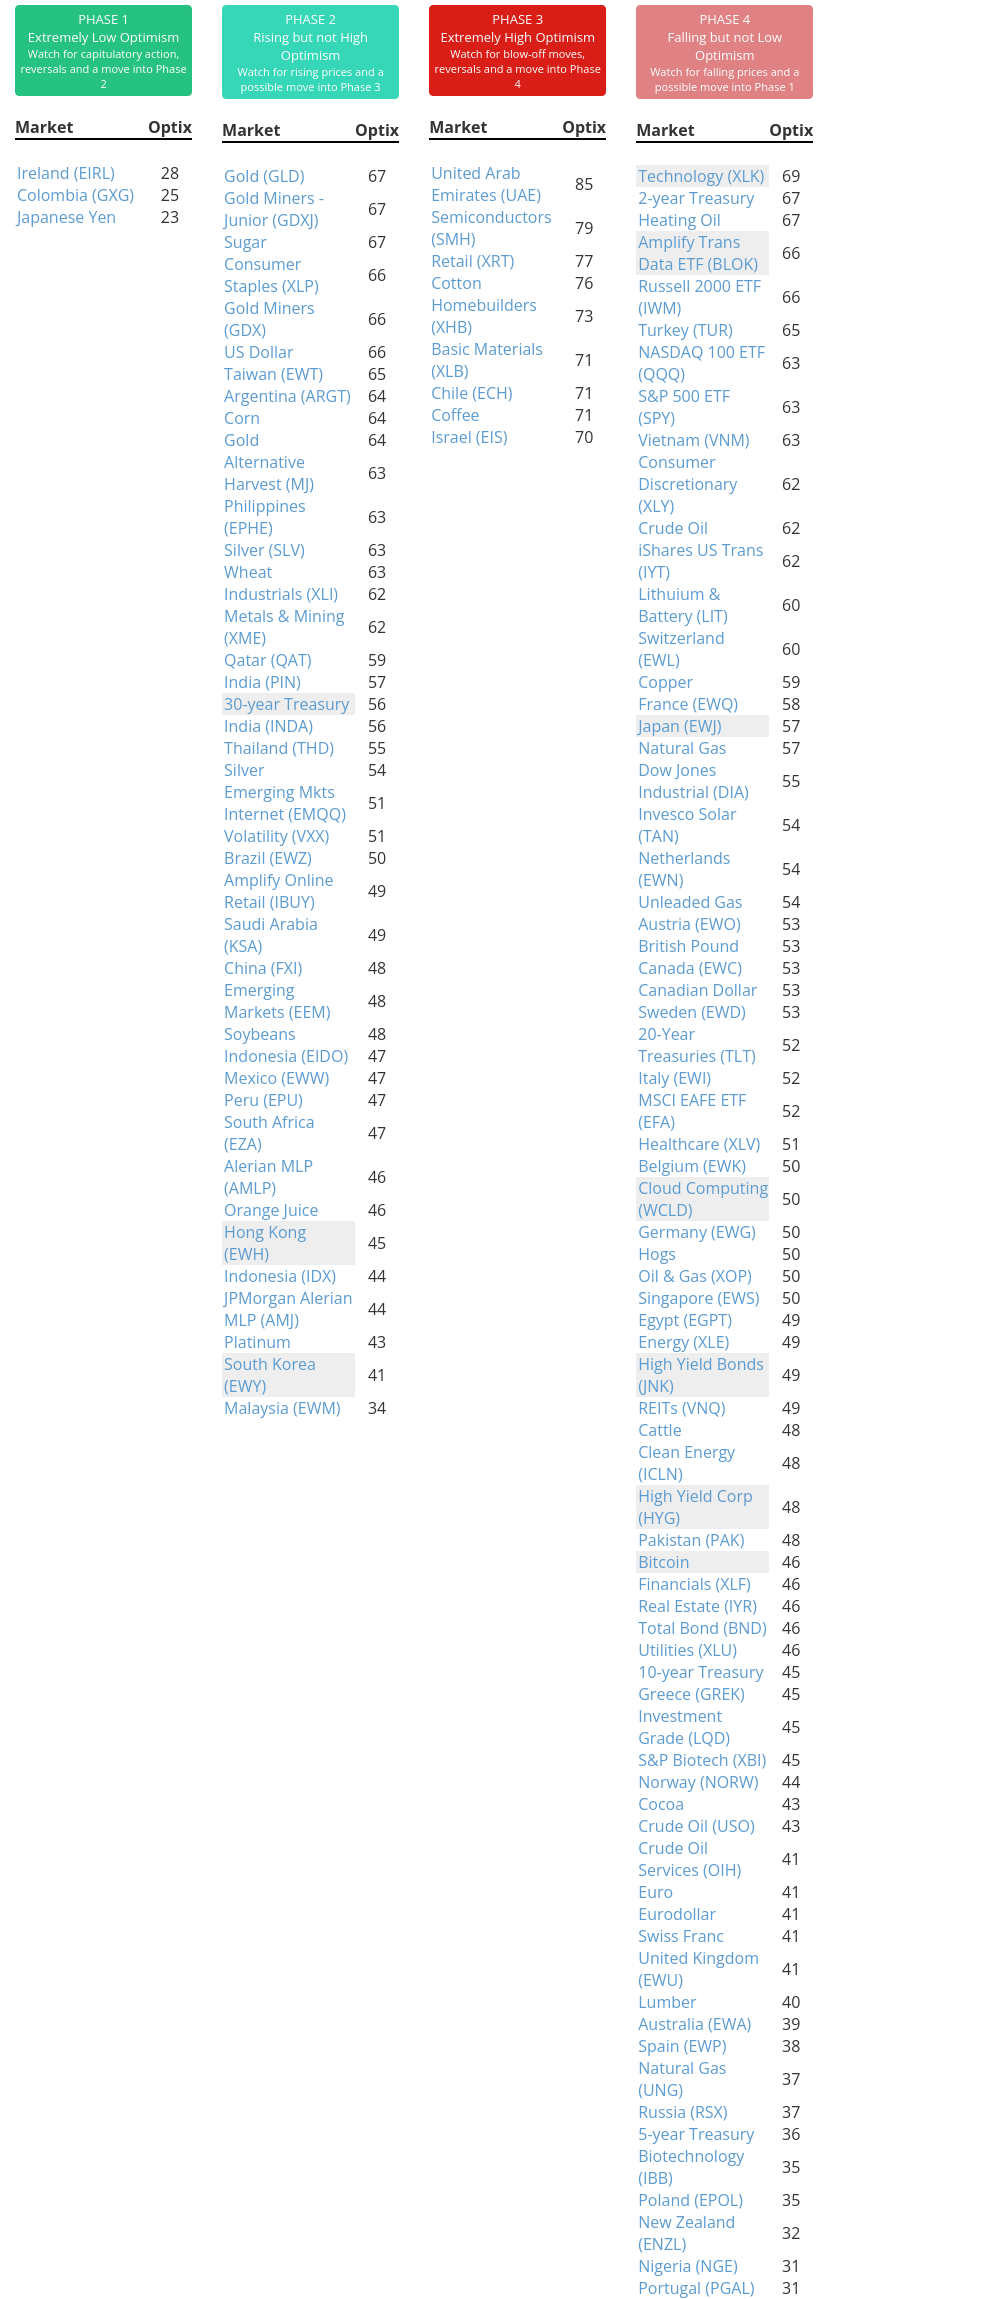
Phase Table
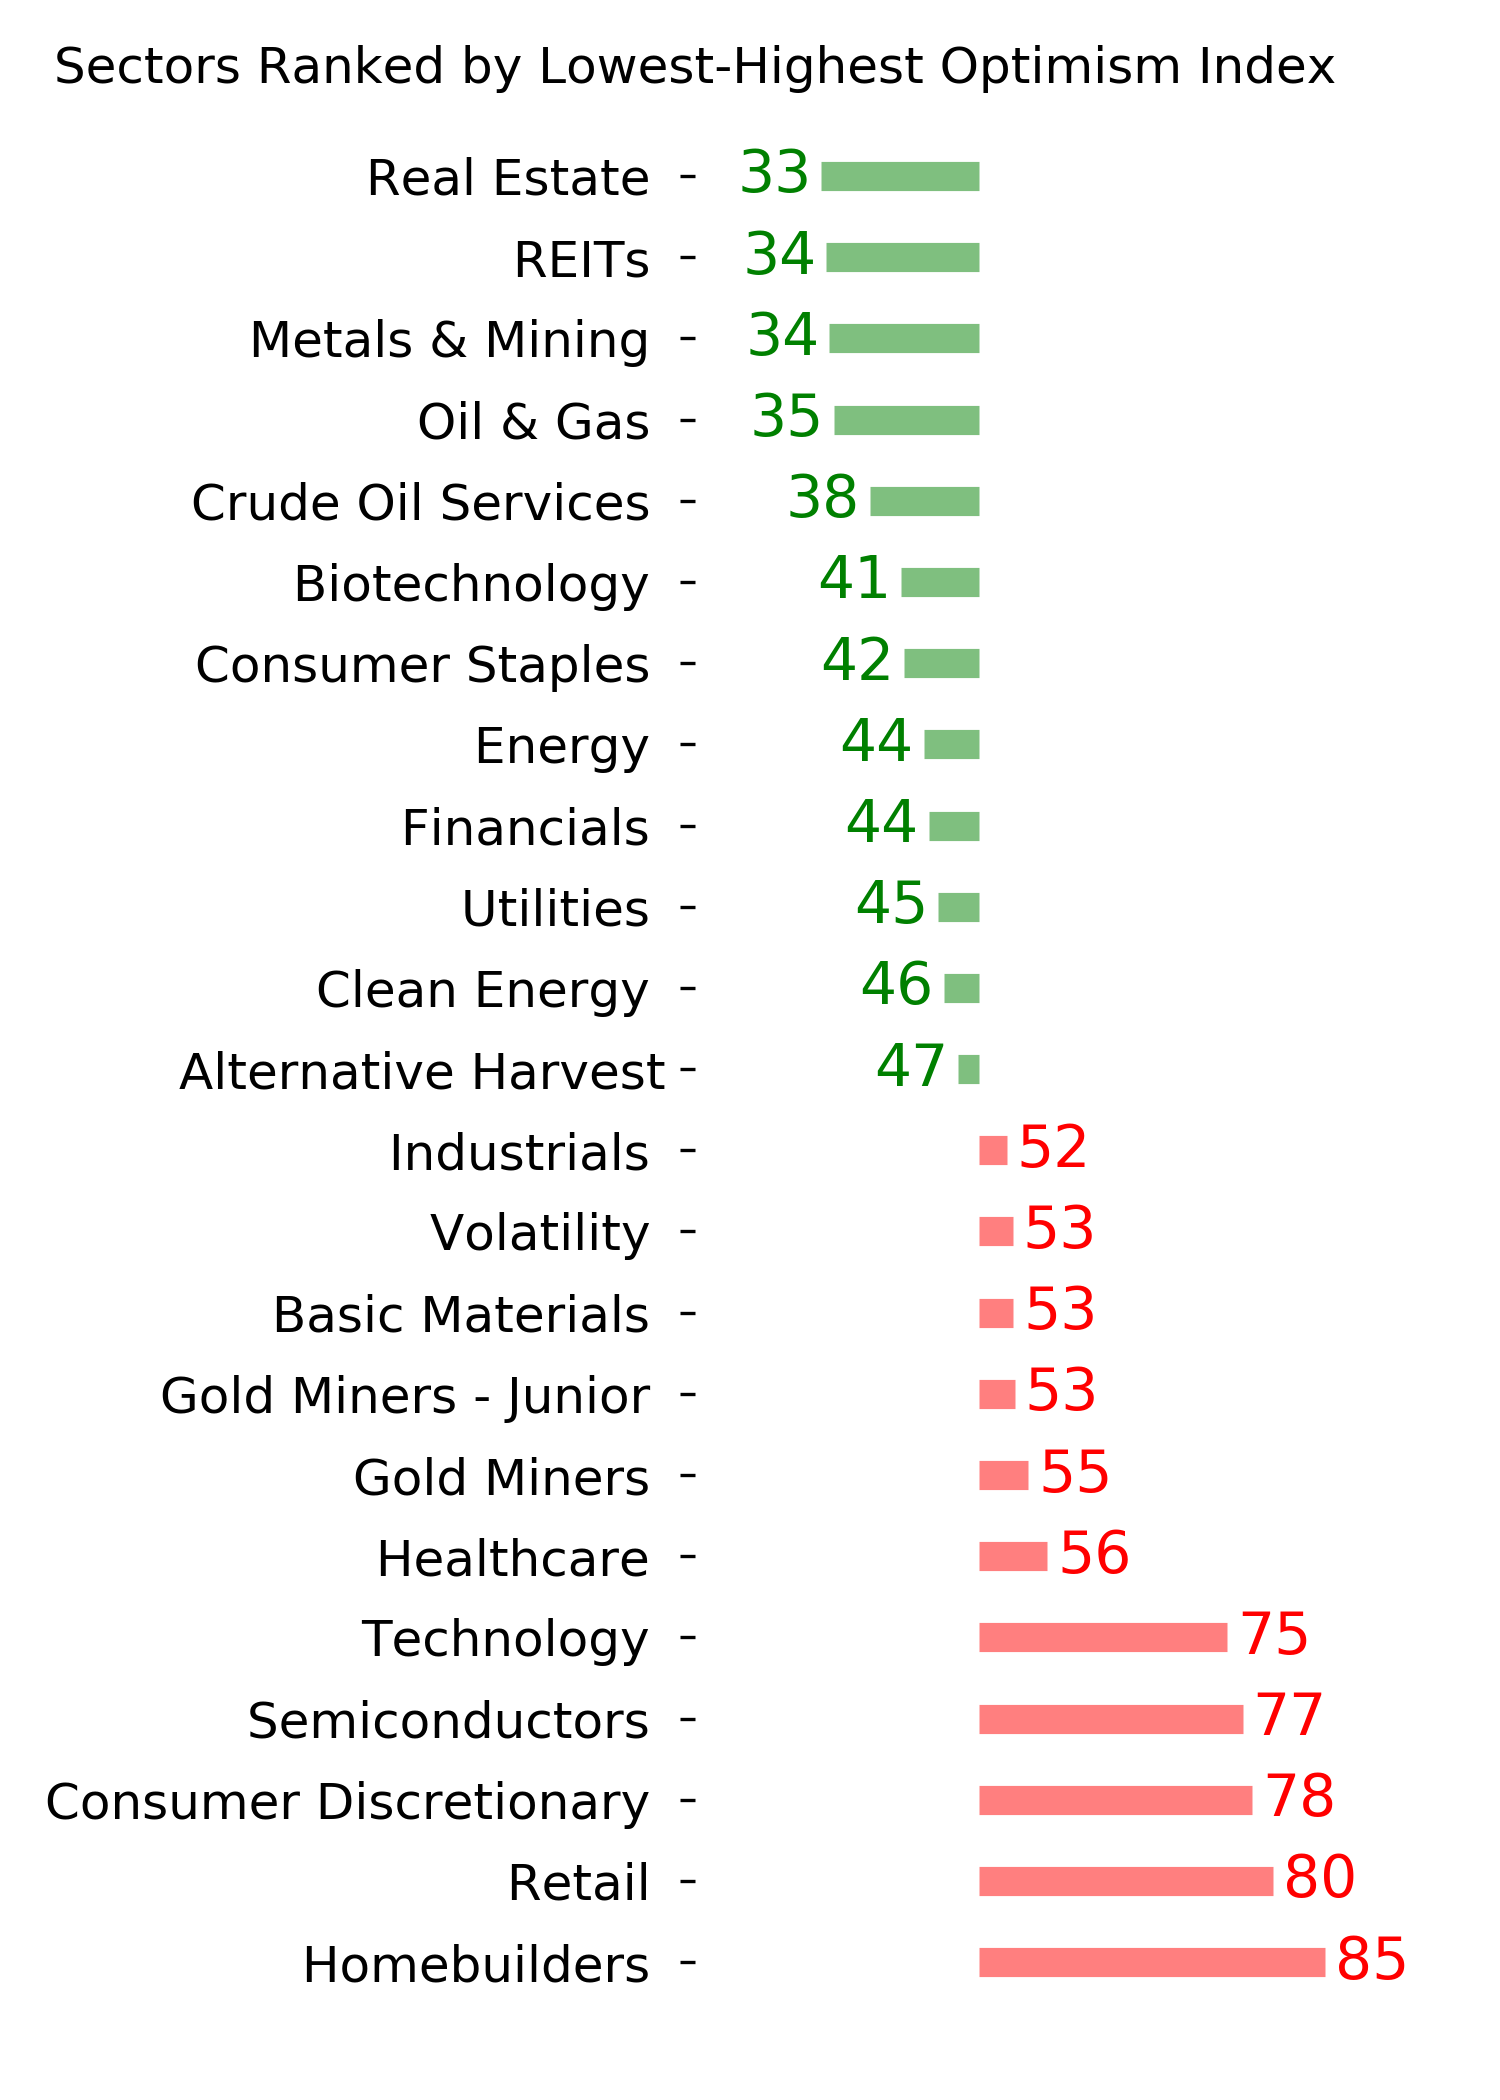
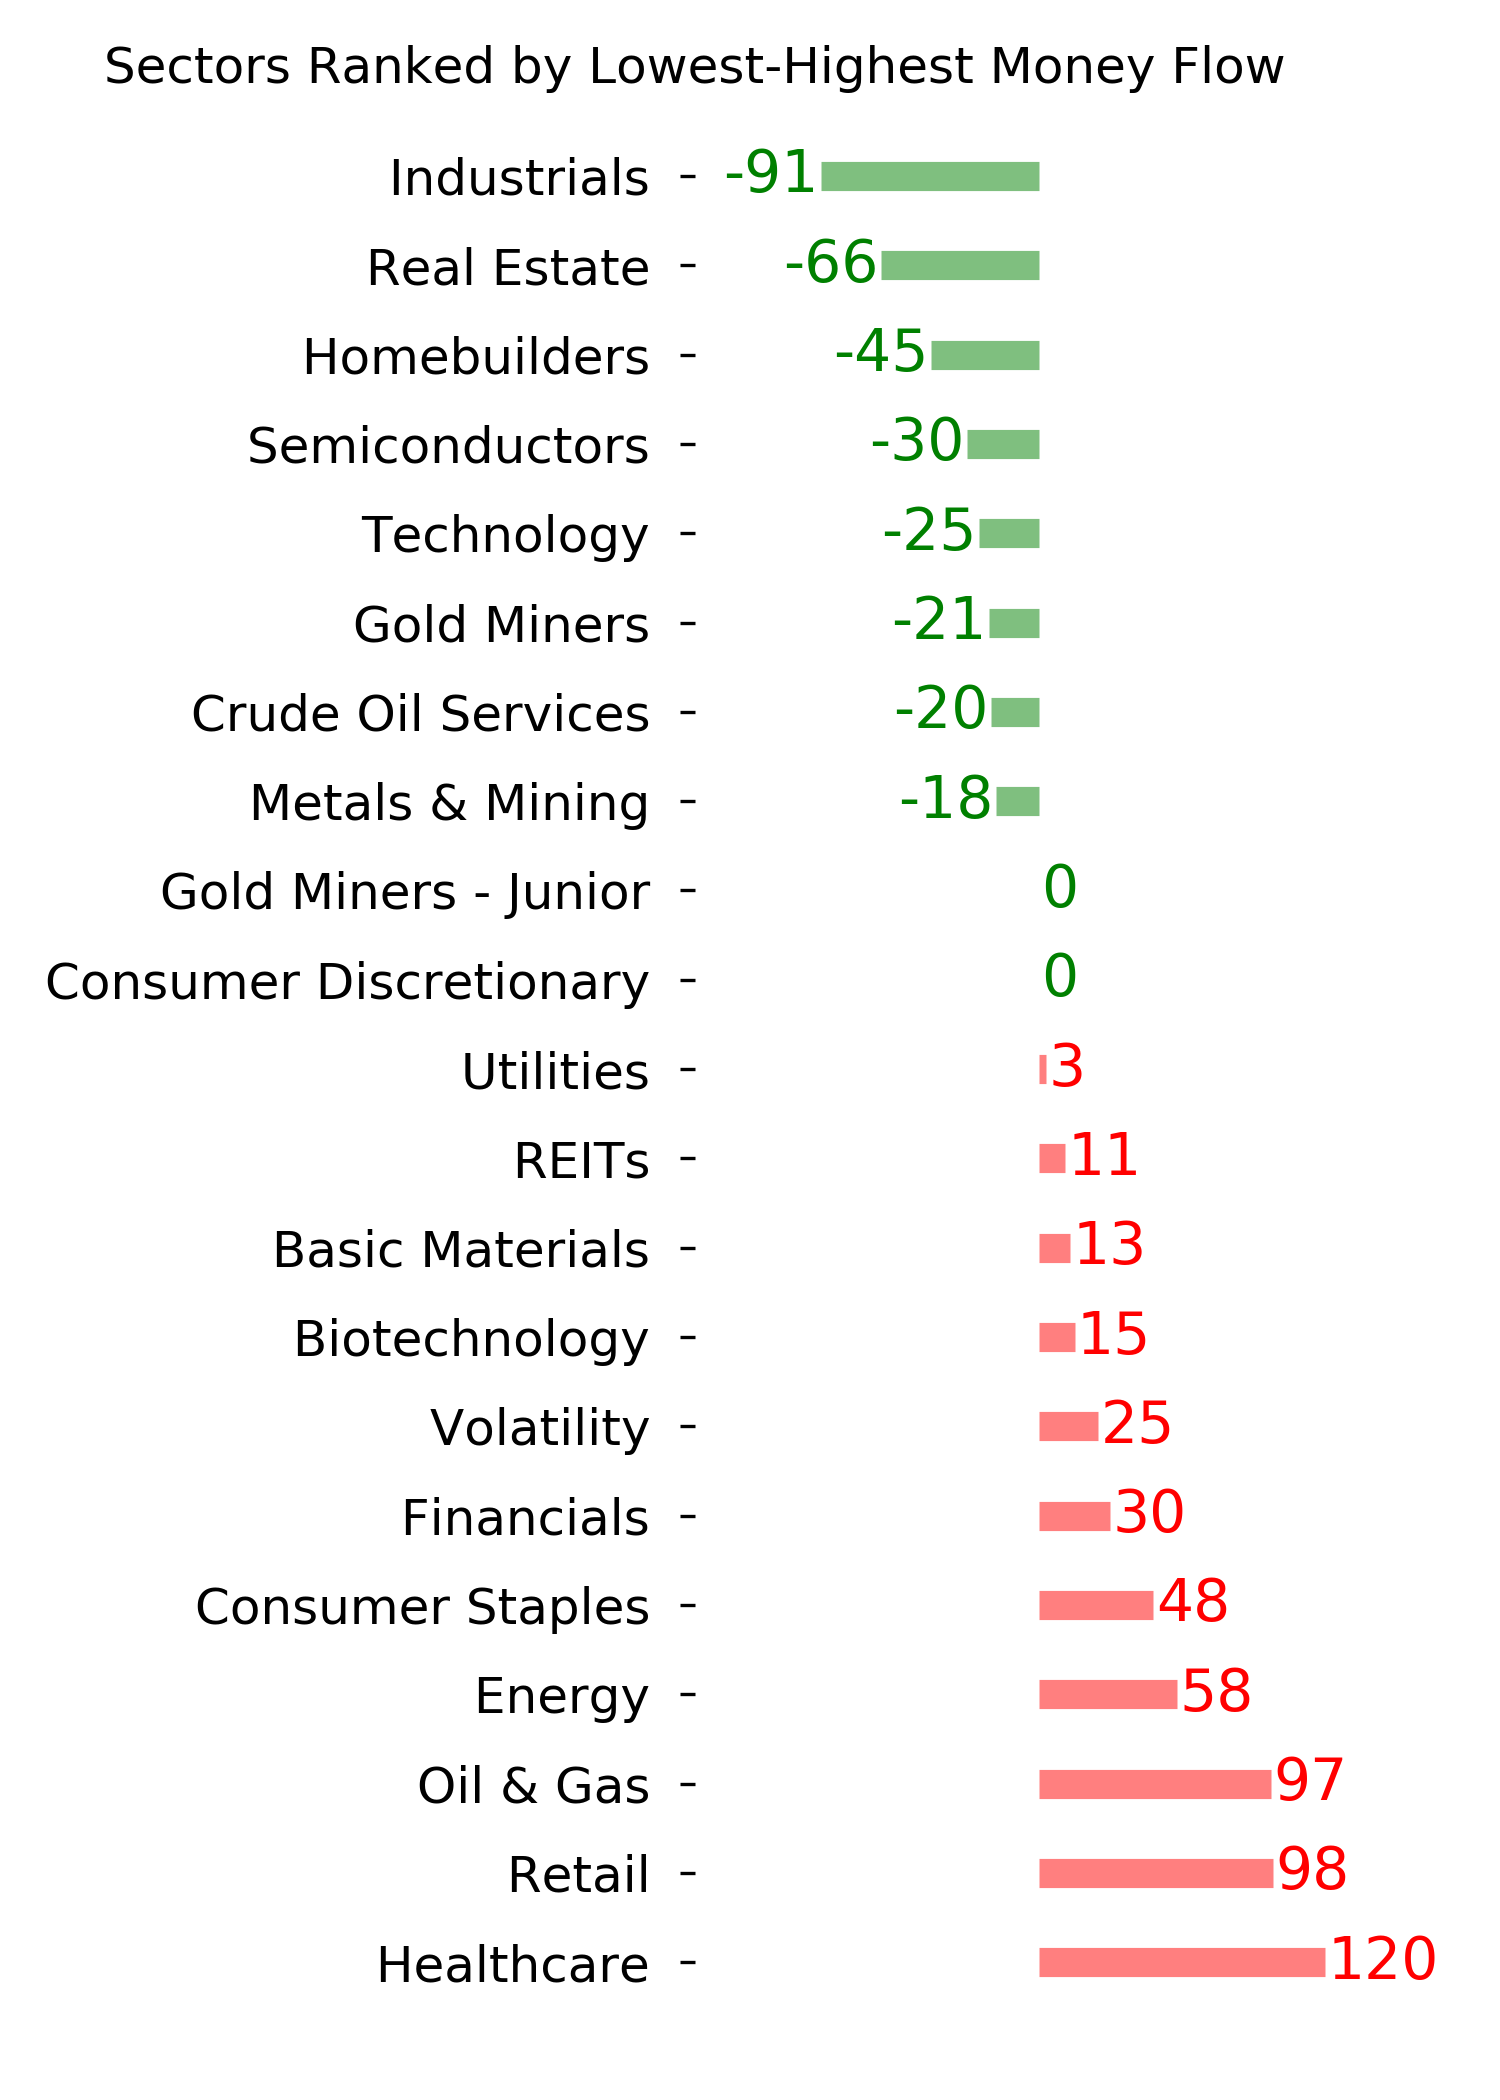
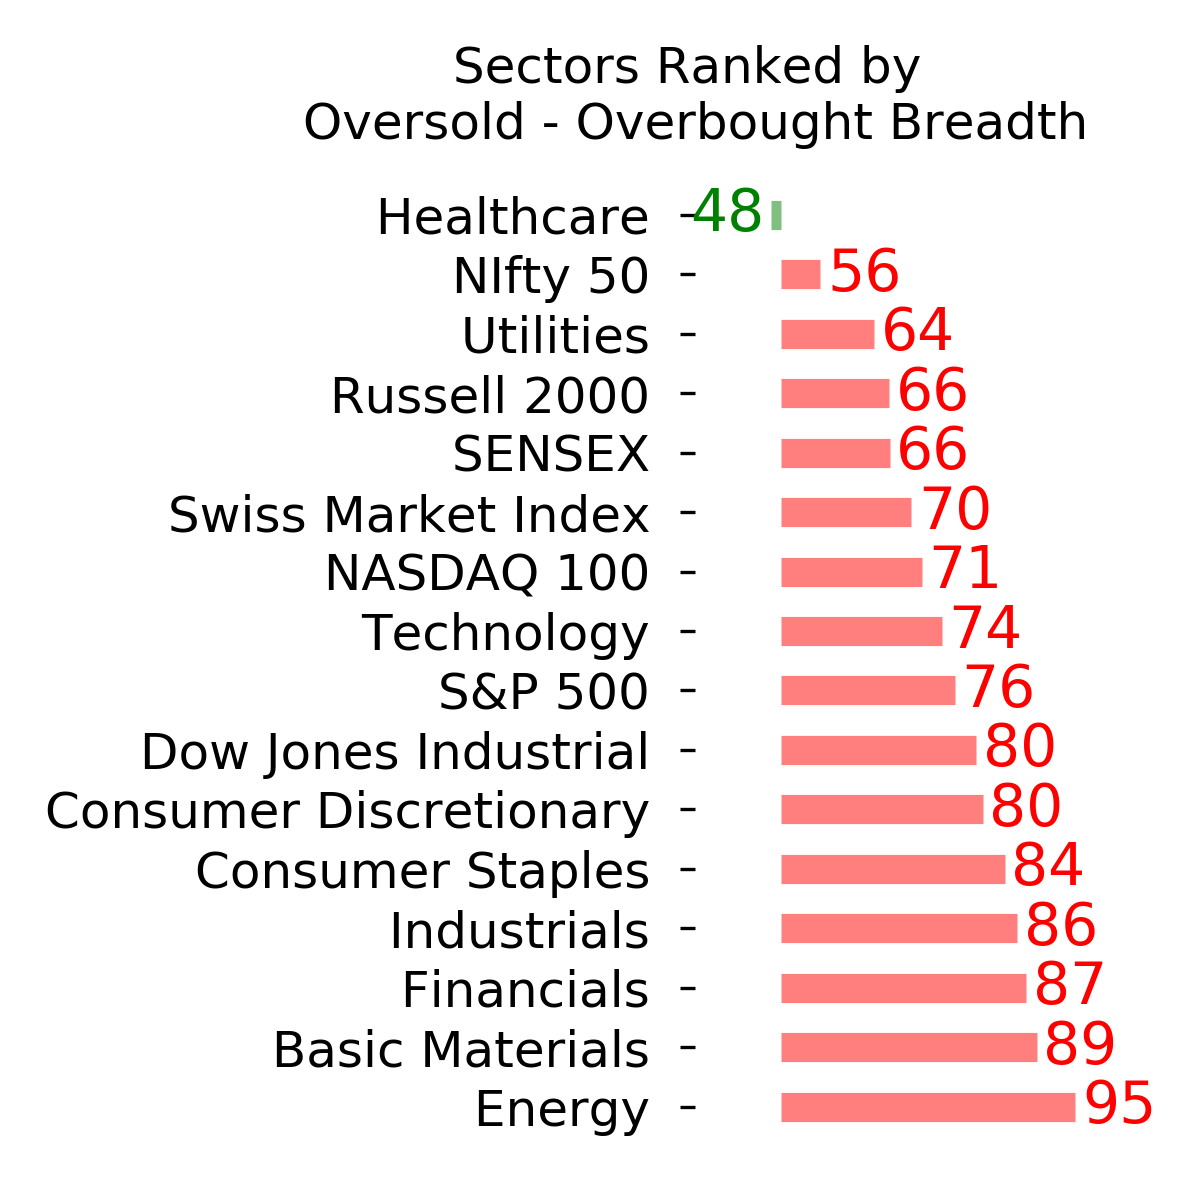
Ranks
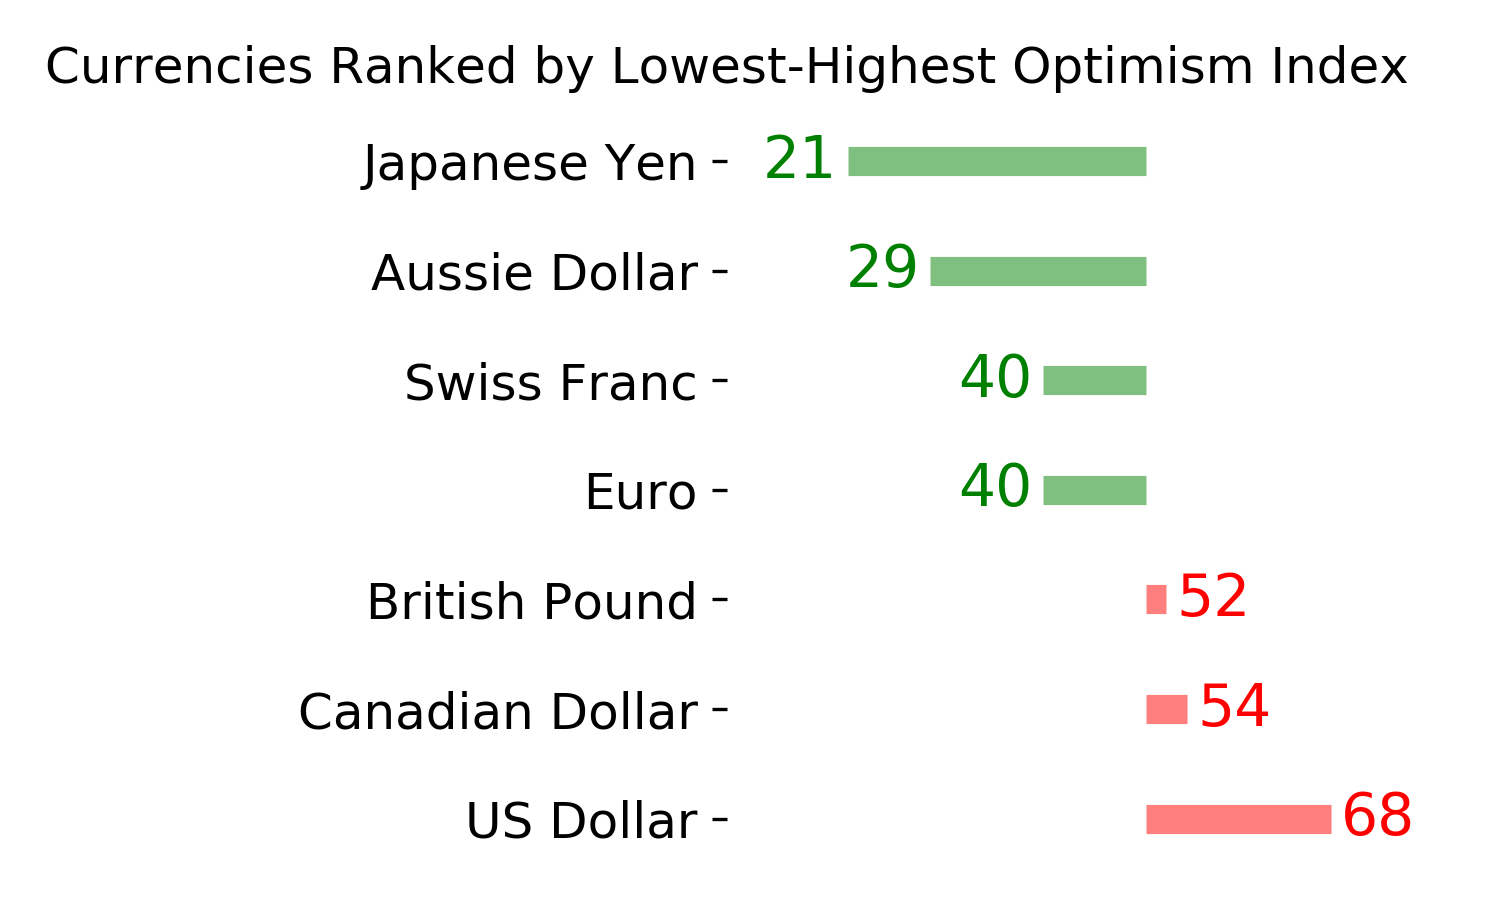
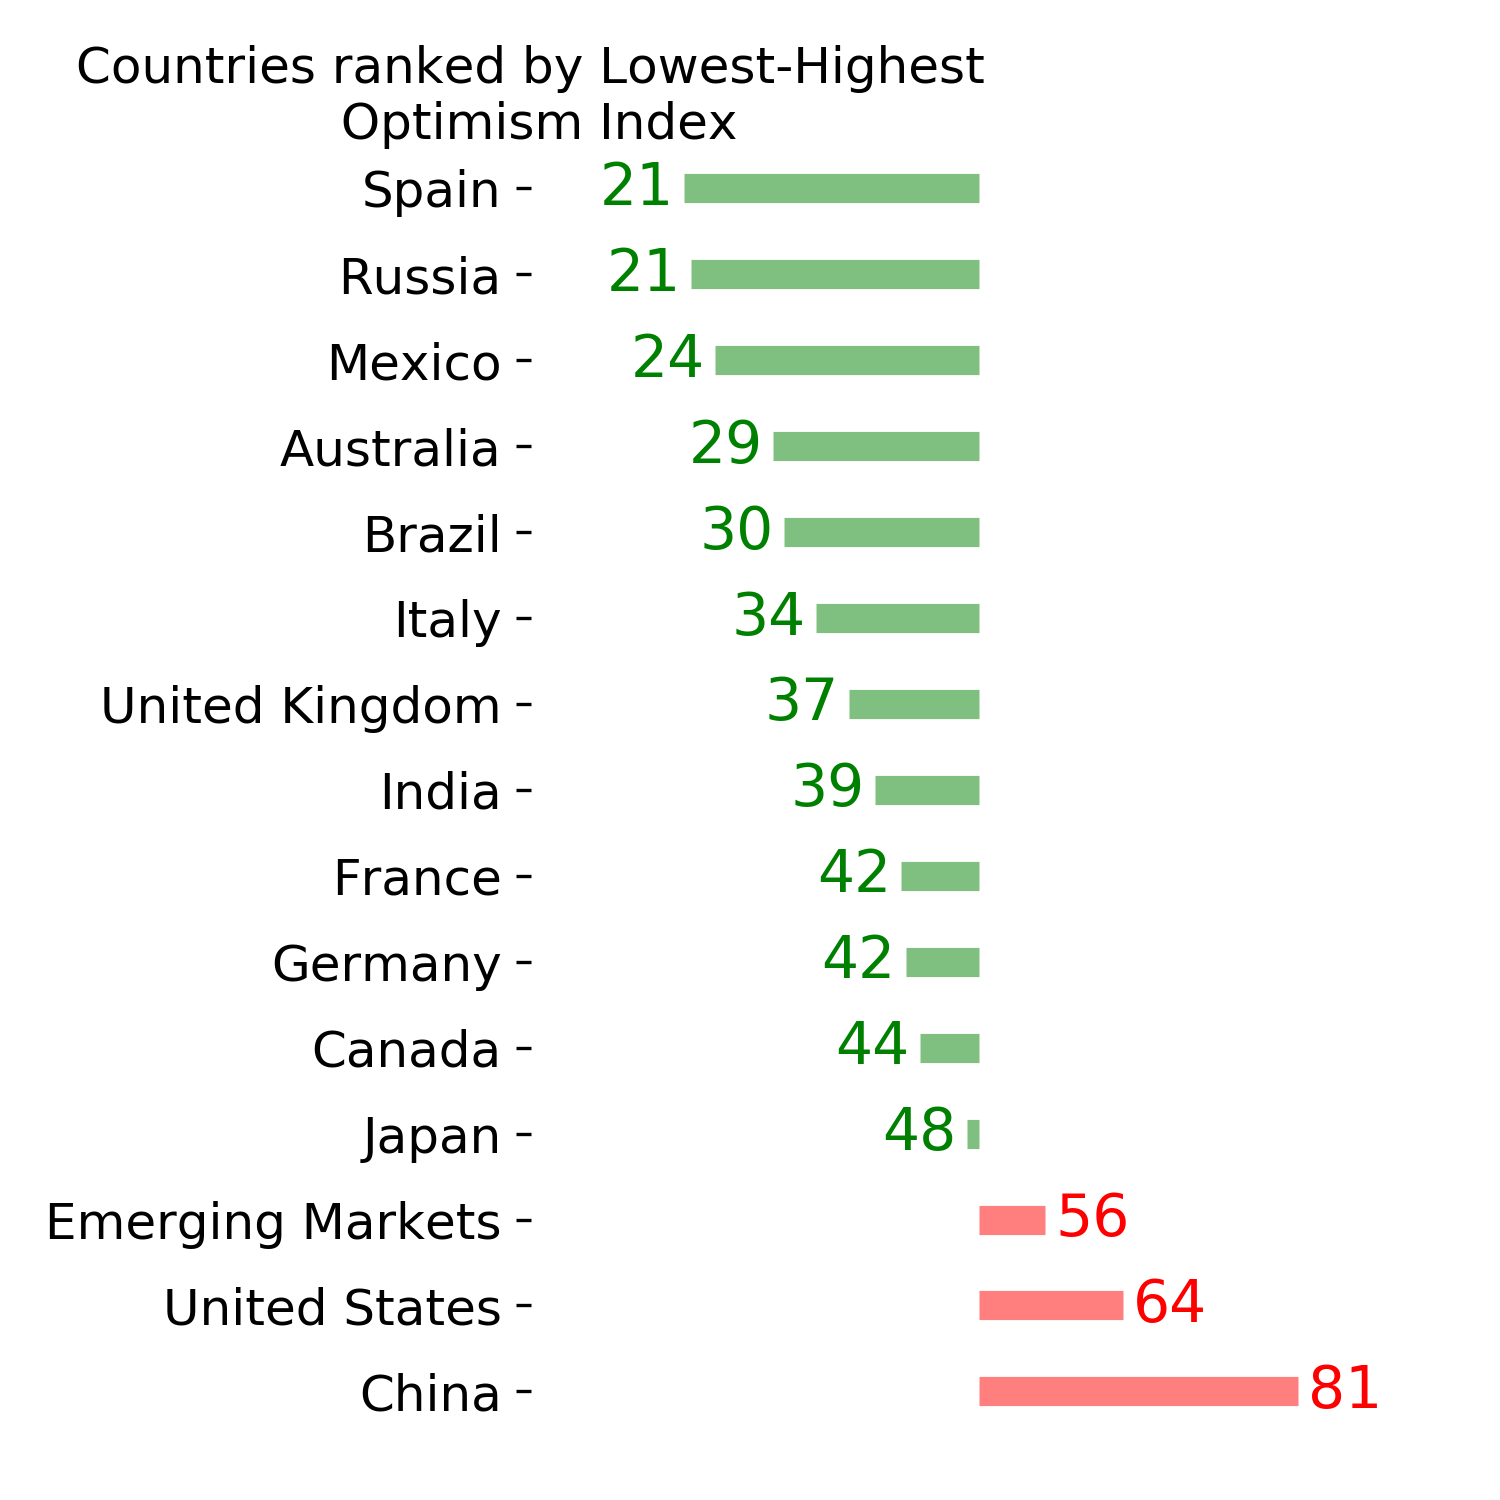
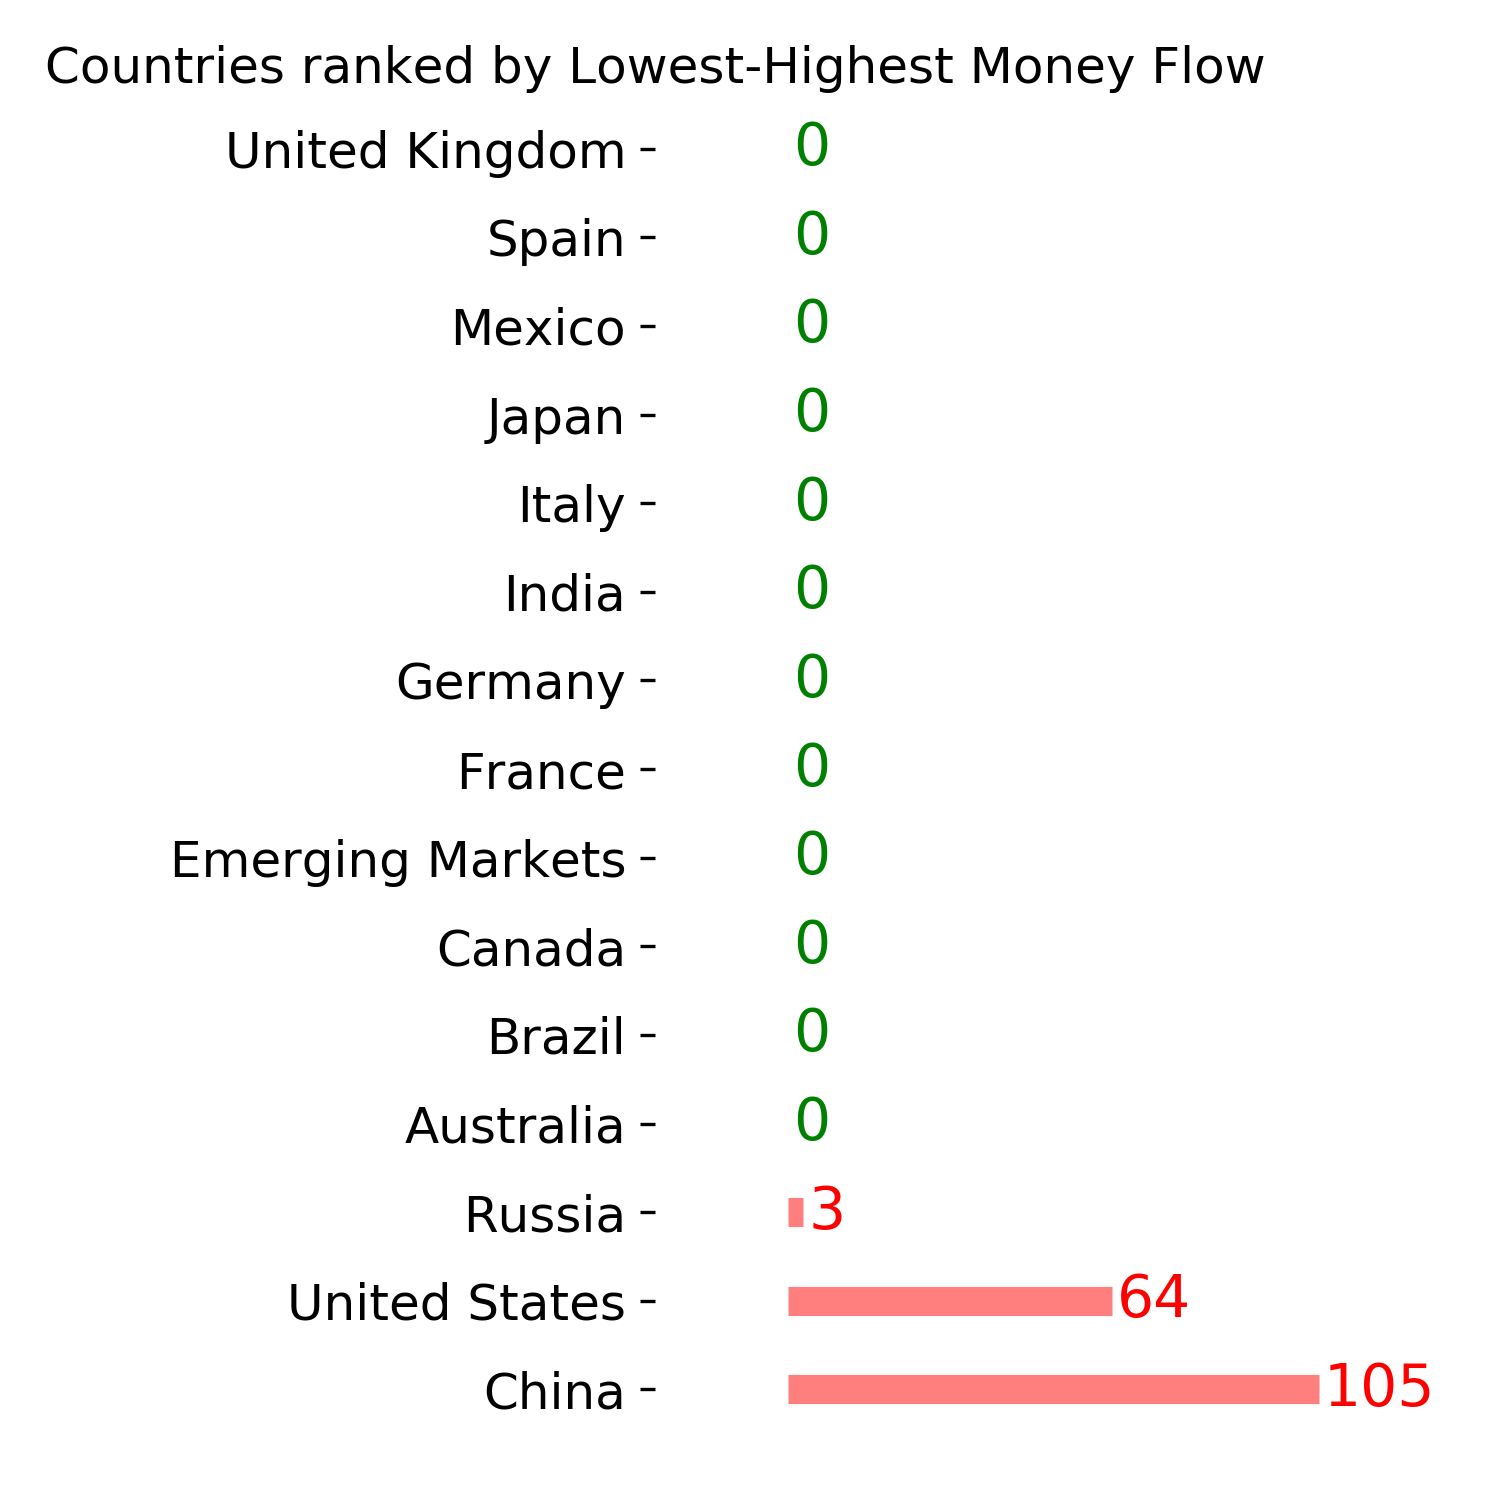
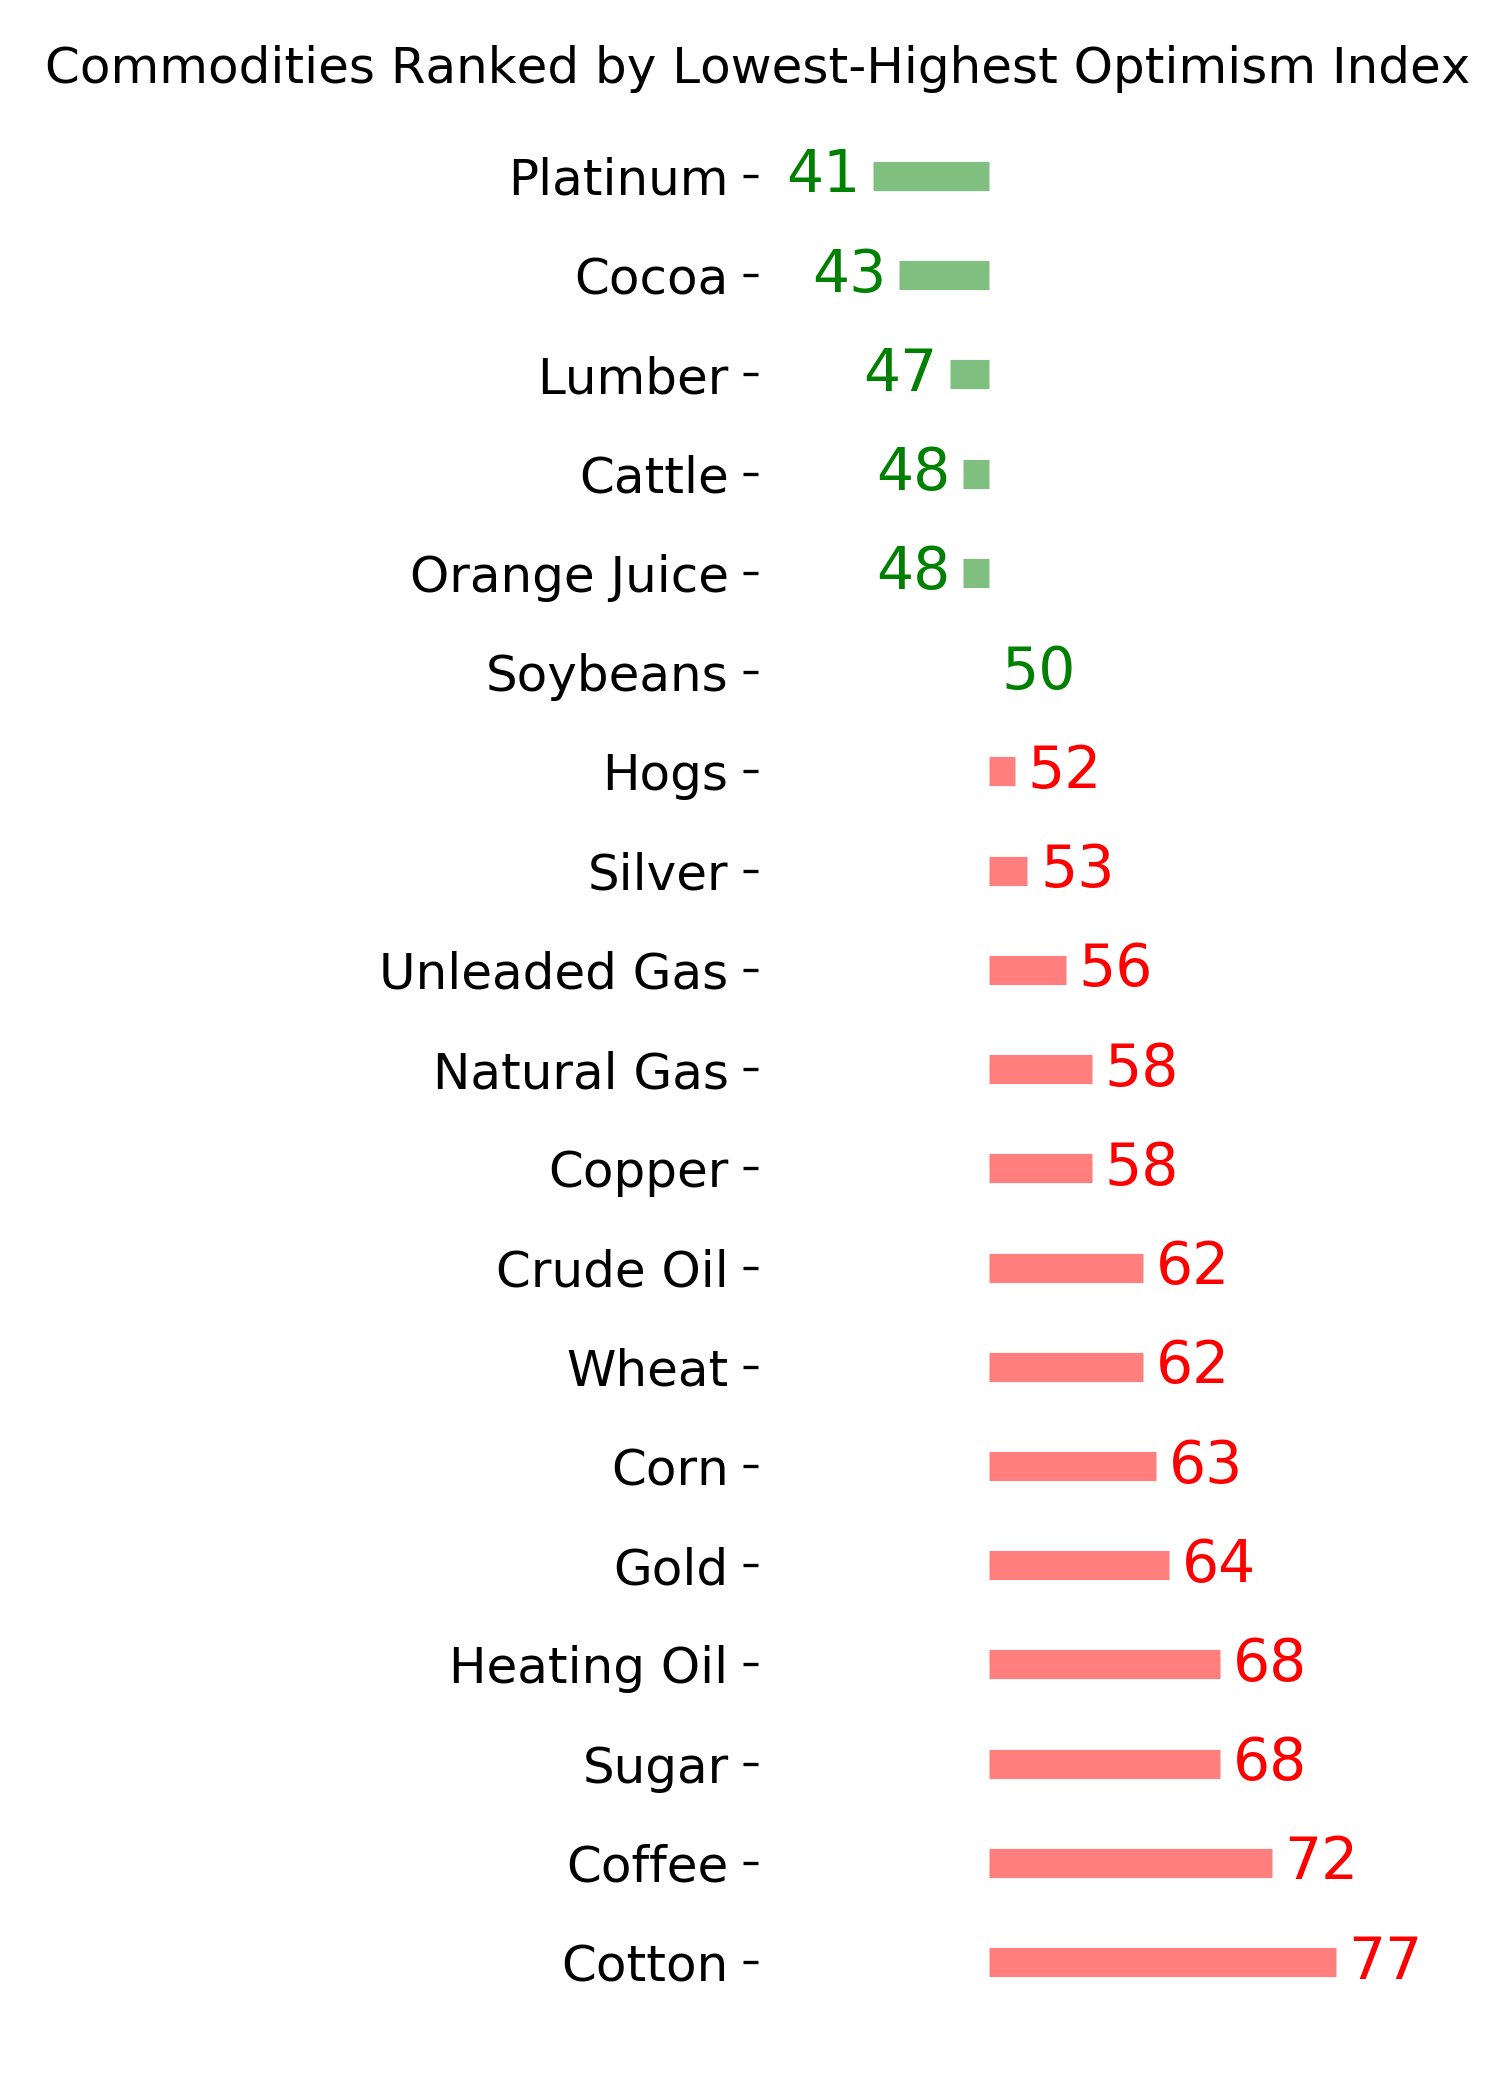
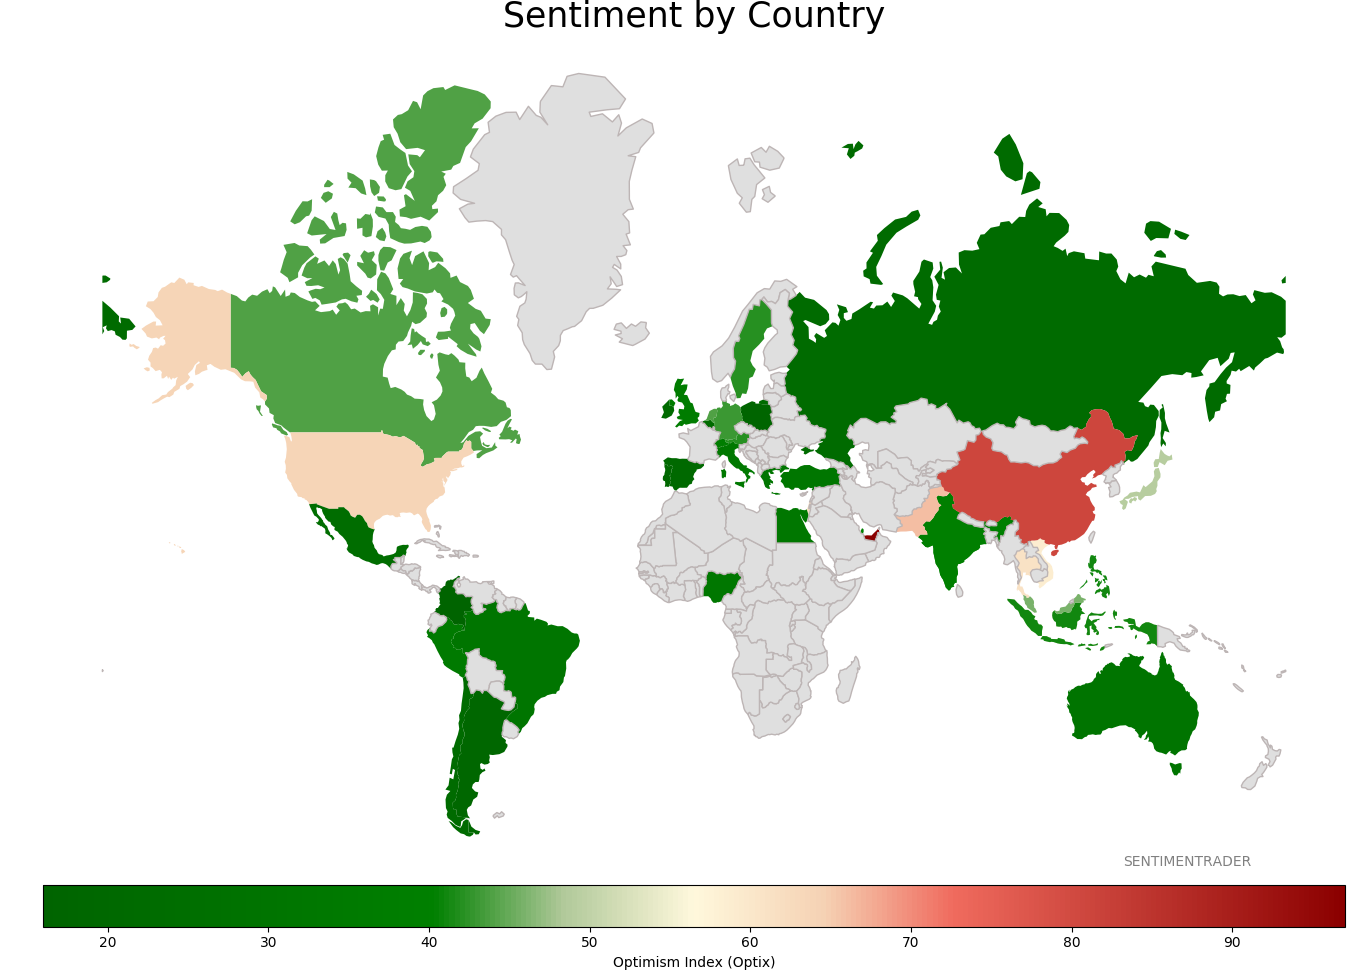
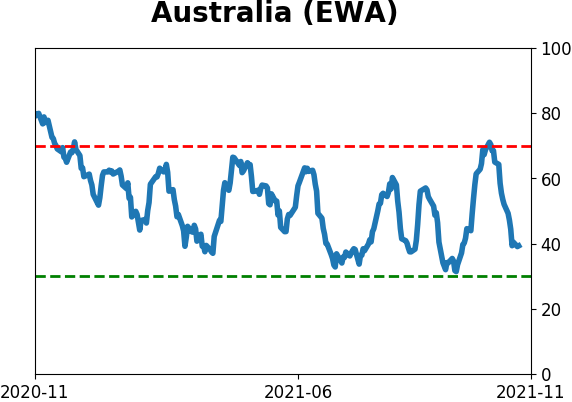
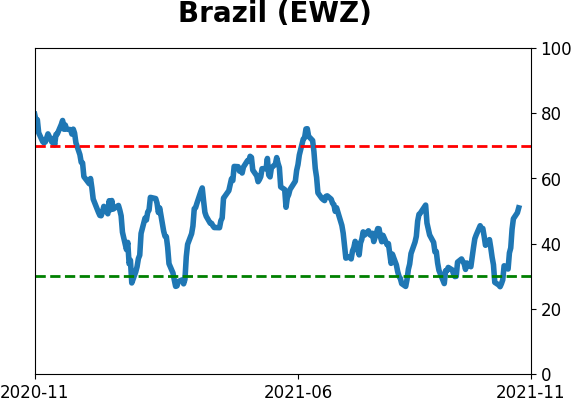
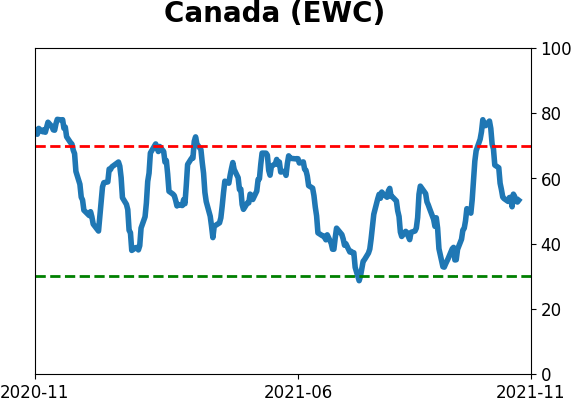
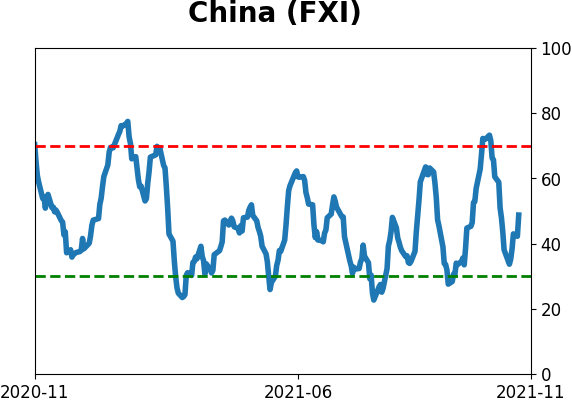
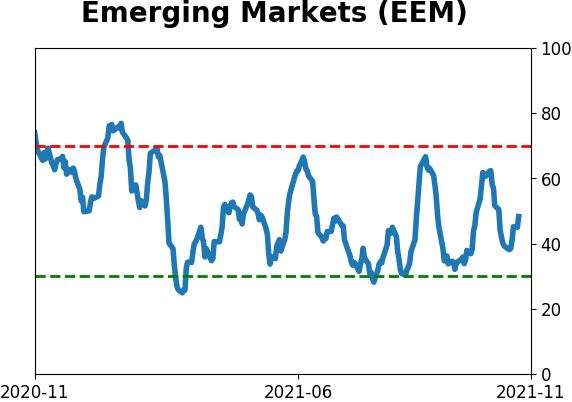
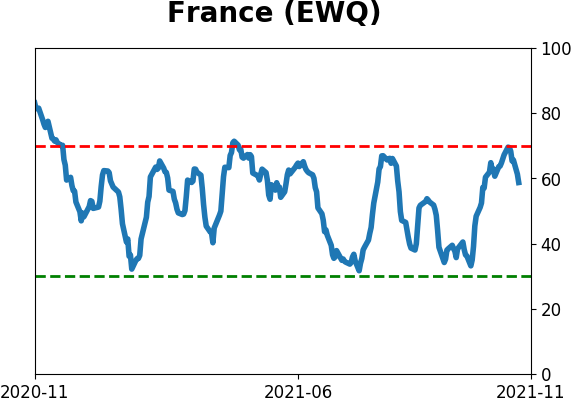
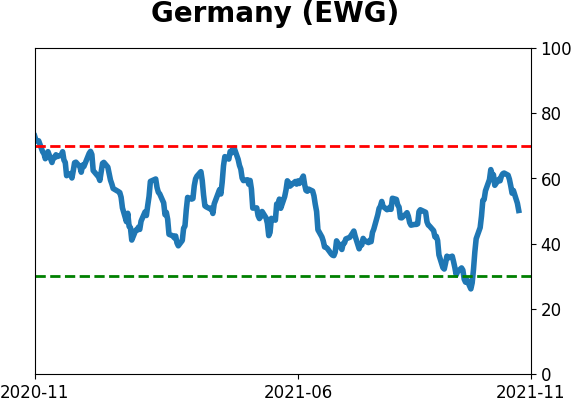
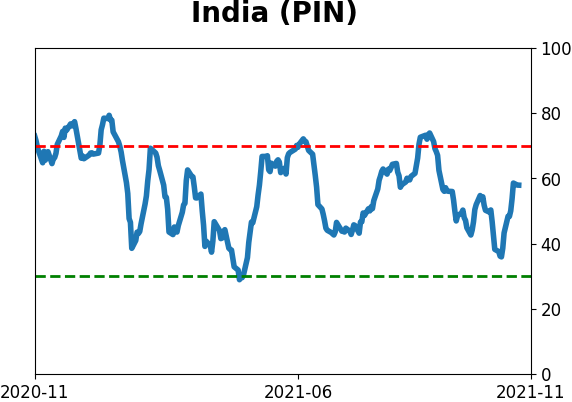
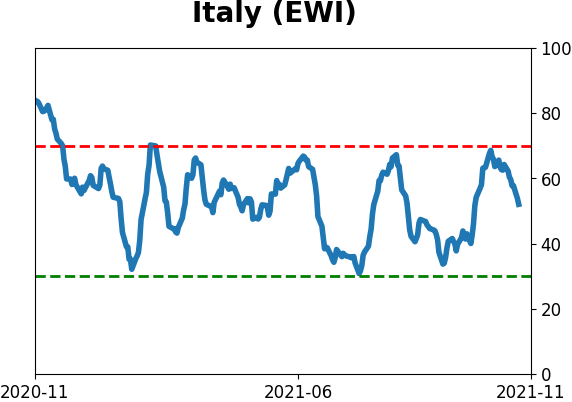
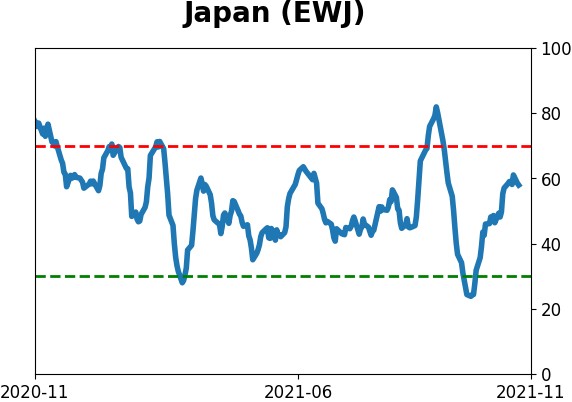
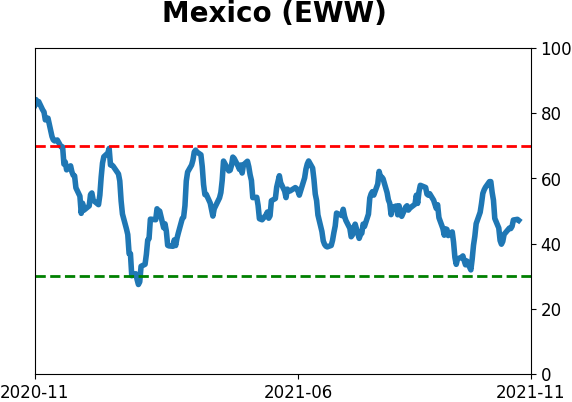
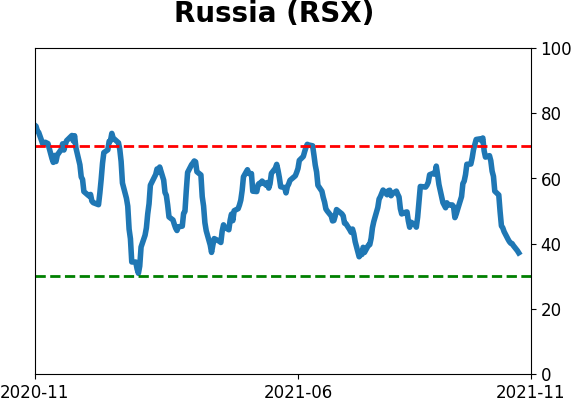
Sentiment Around The World
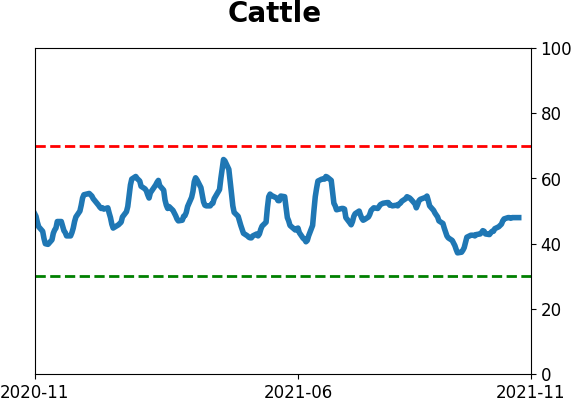
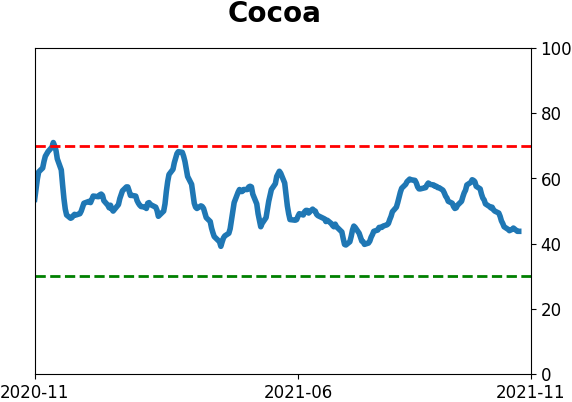
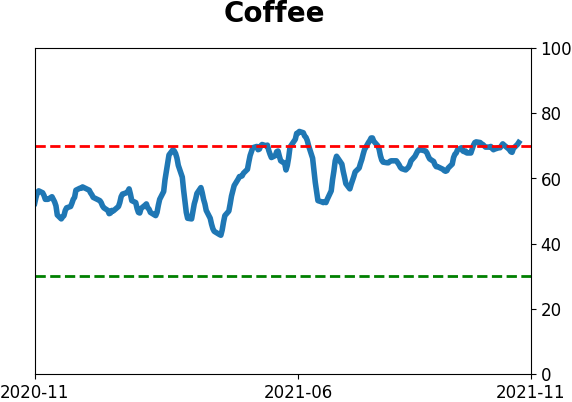
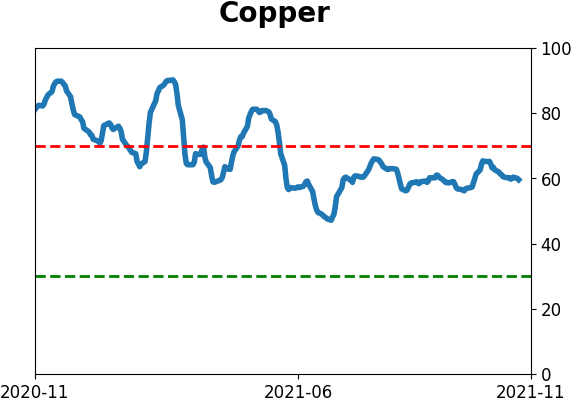
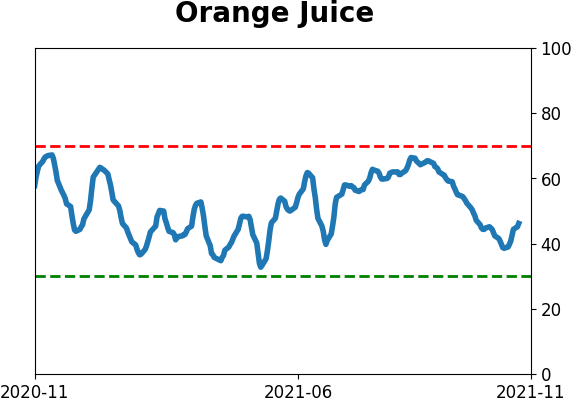
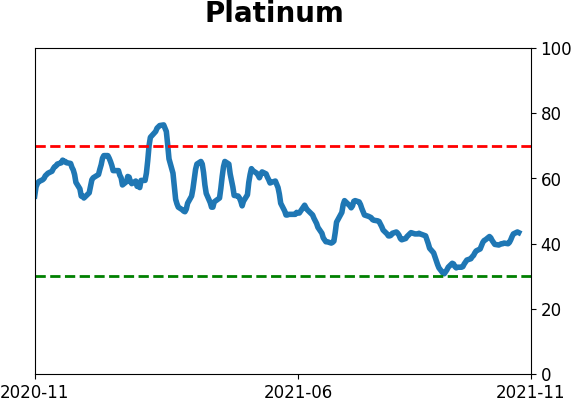
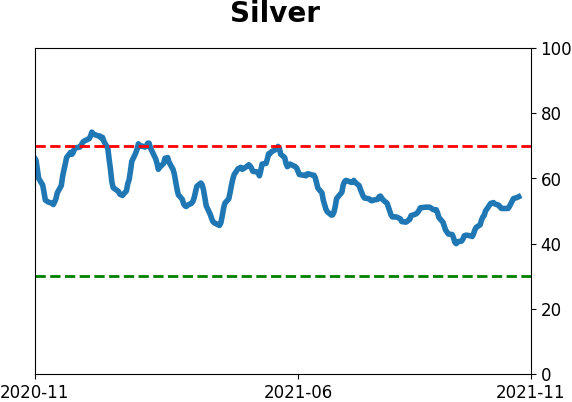
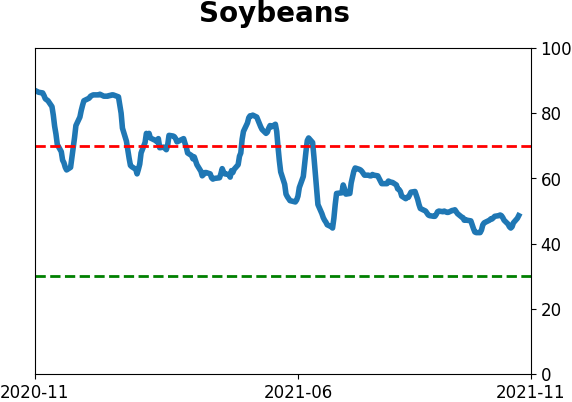
Optimism Index Thumbnails
|
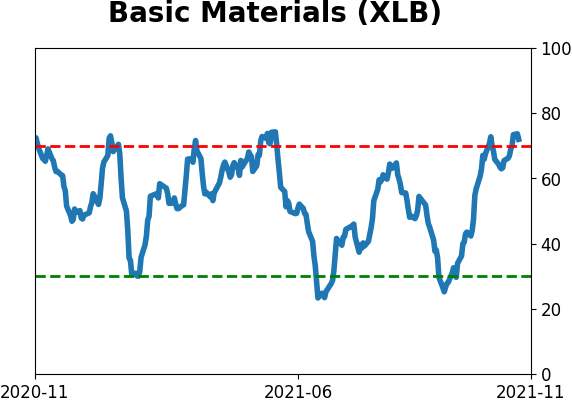
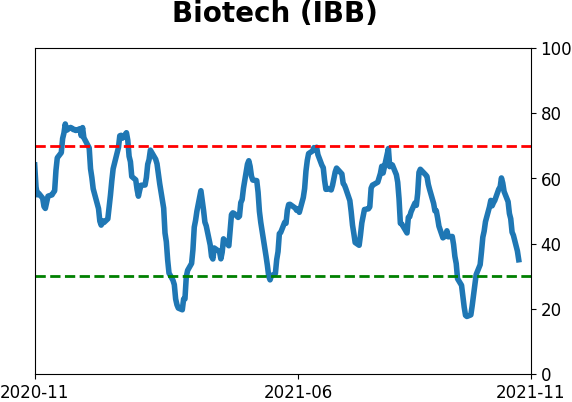
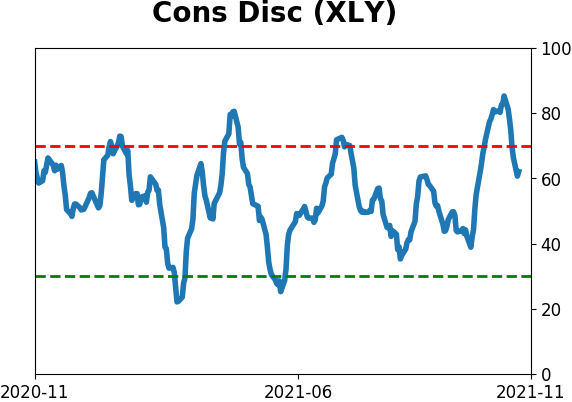
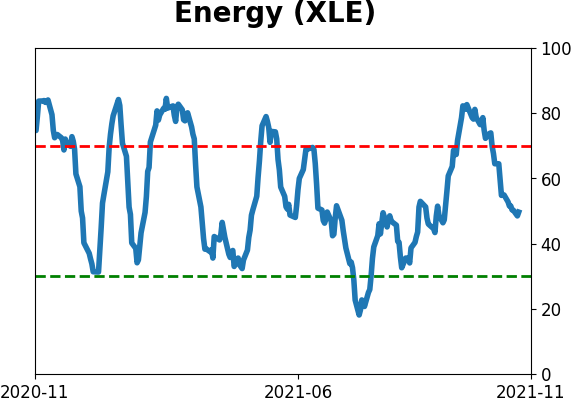
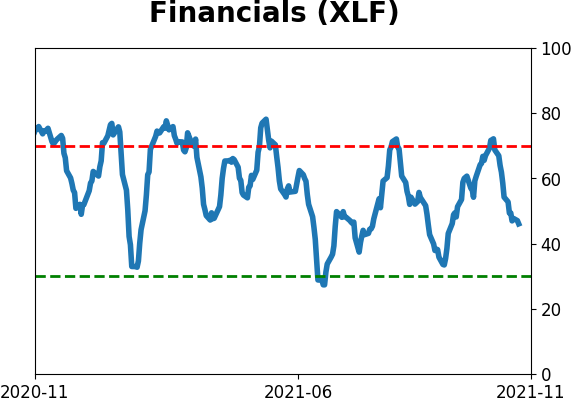
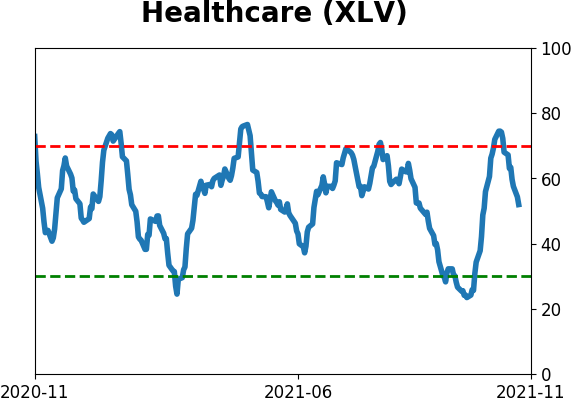
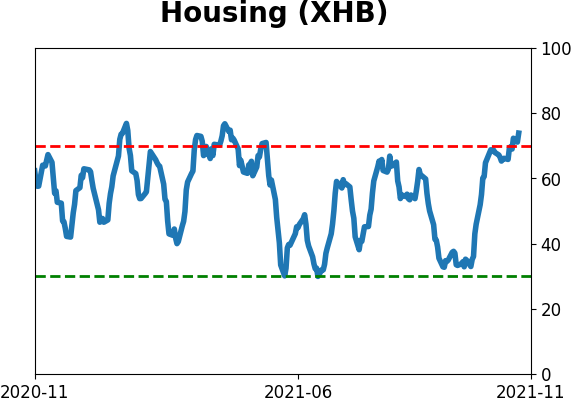
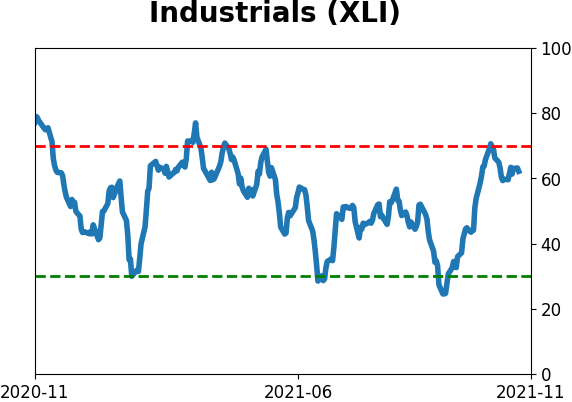
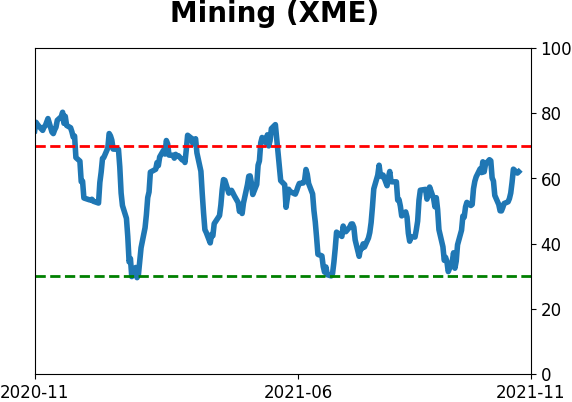
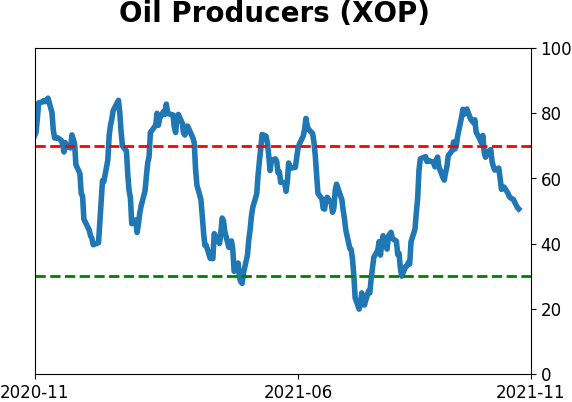
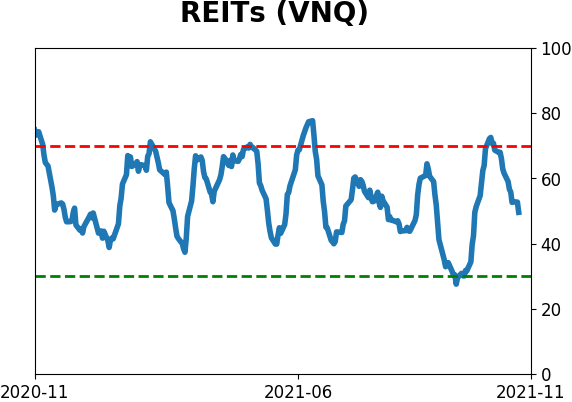
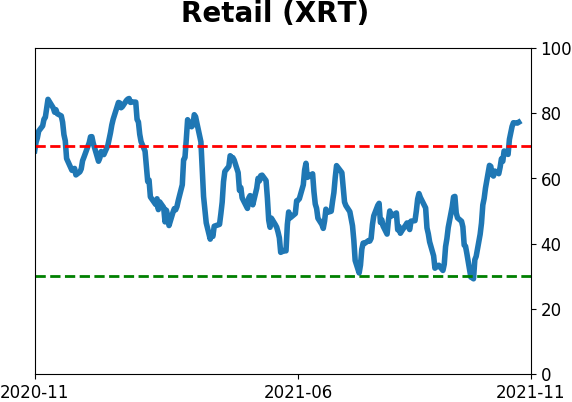
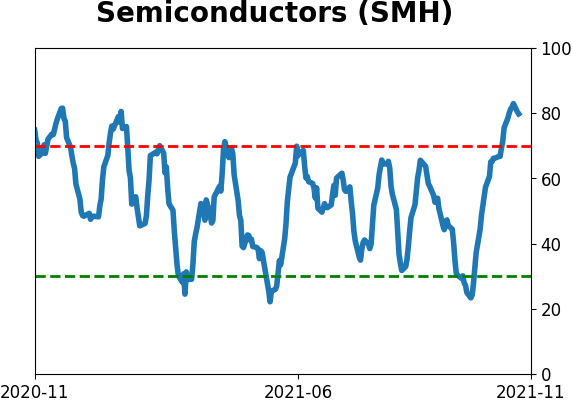
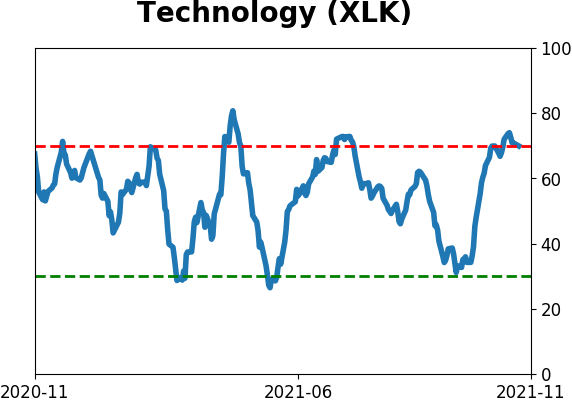
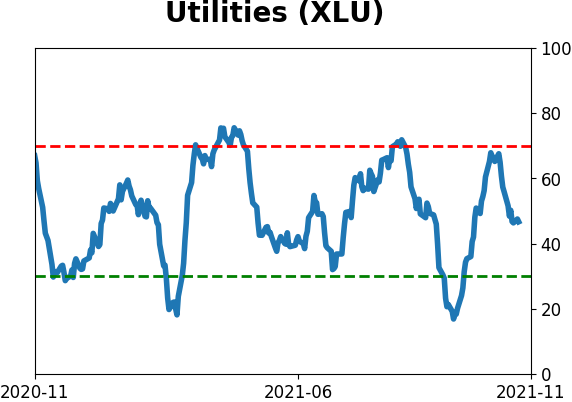
Sector ETF's - 10-Day Moving Average
|
|
|
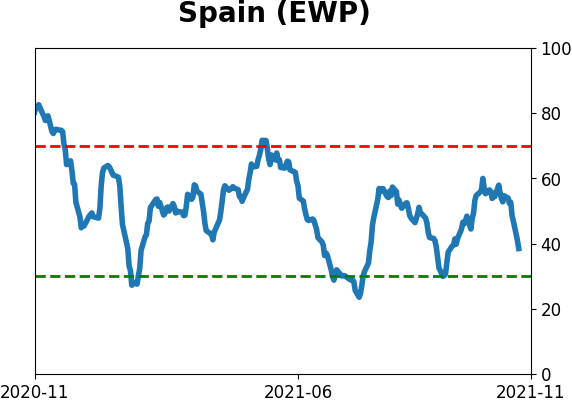
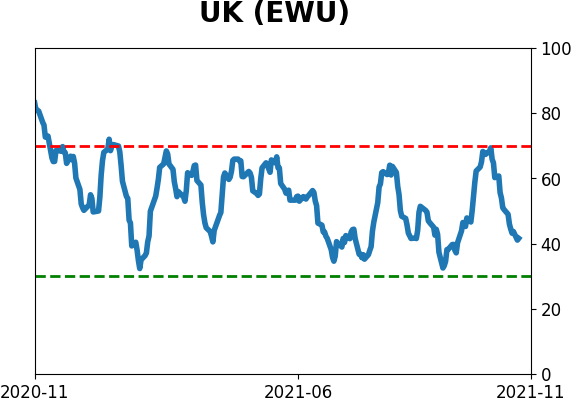
Country ETF's - 10-Day Moving Average
|
|
|
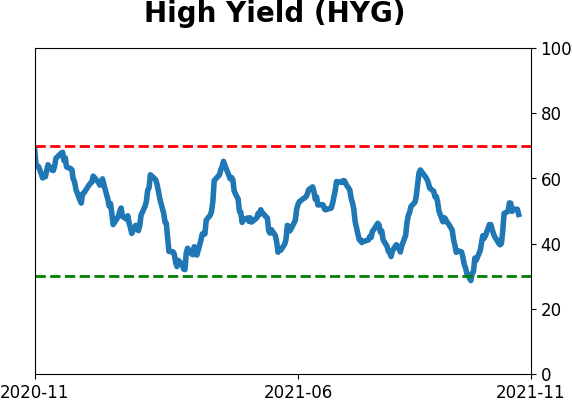
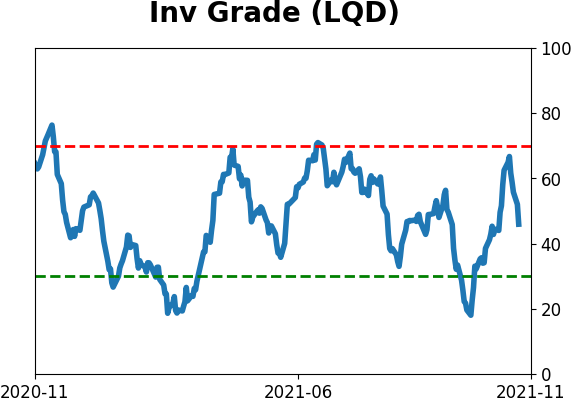
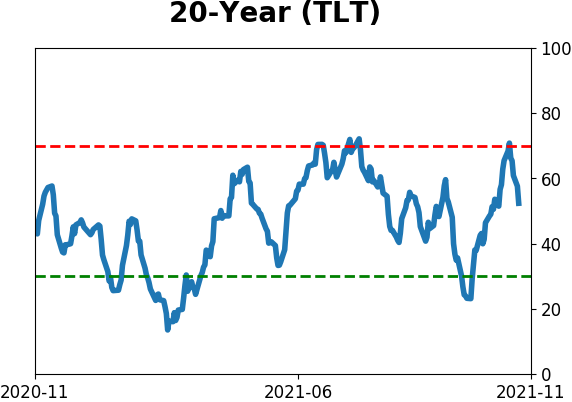
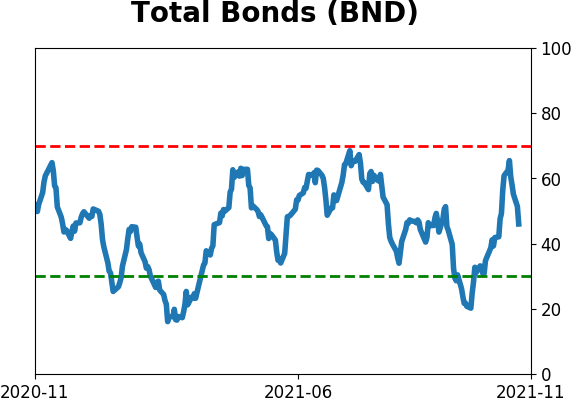
Bond ETF's - 10-Day Moving Average
|
|
|
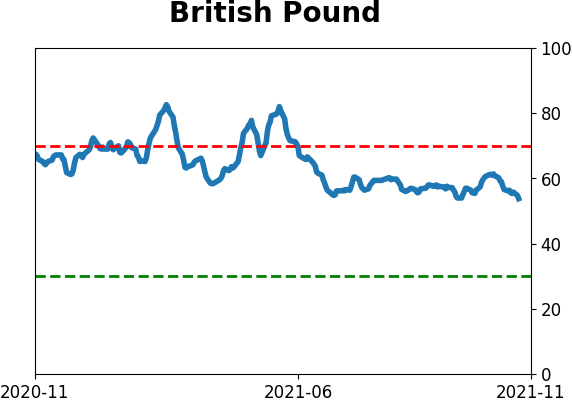
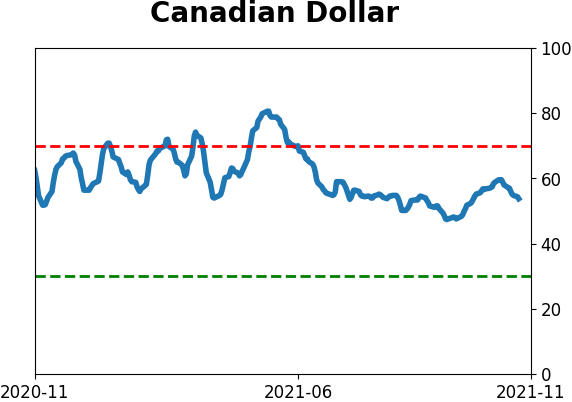
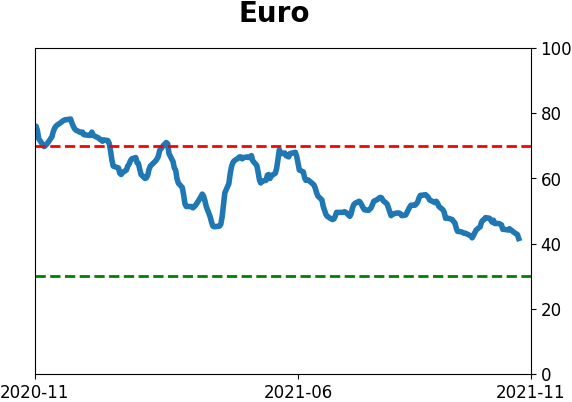
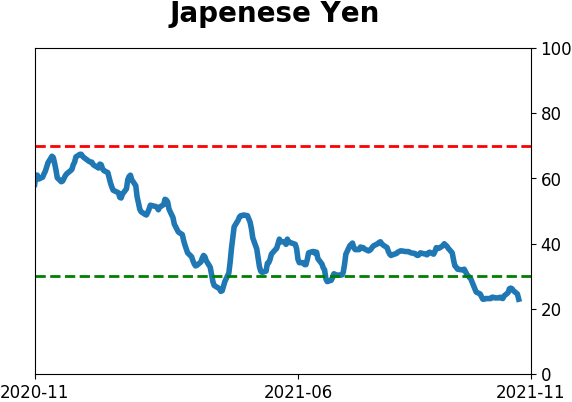
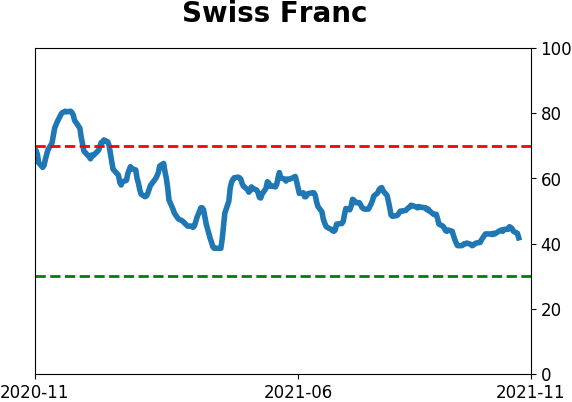
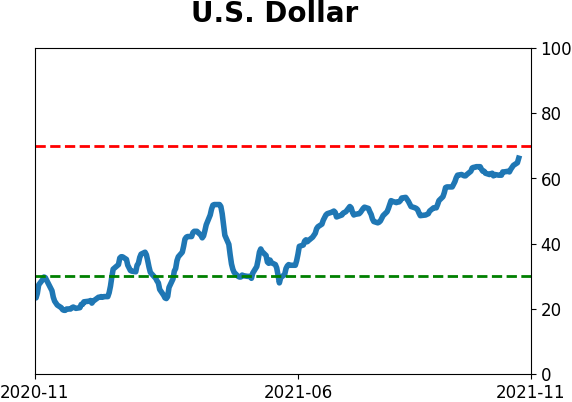
Currency ETF's - 5-Day Moving Average
|
|
|
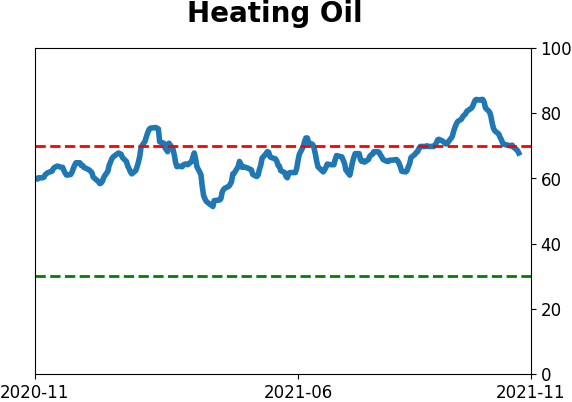
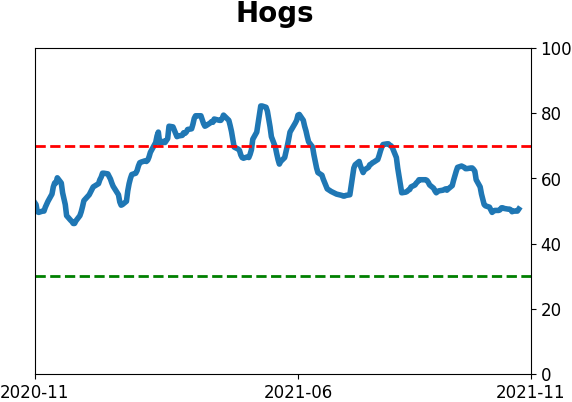
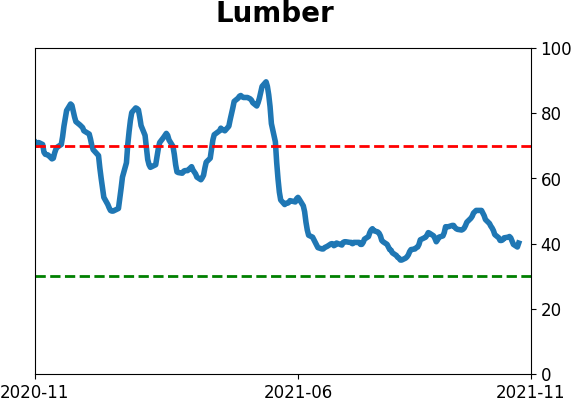
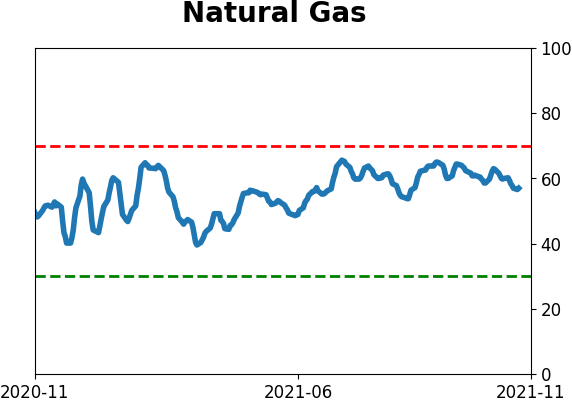
Commodity ETF's - 5-Day Moving Average
|
|