Headlines
|
|
A massive number of stocks rallied 4% or more:
On Tuesday, the stock market experienced a notable shift as more than 25% of stocks and 32% of sub-industry groups closed with gains exceeding 4%. After similar surges, the S&P 500 was higher over the following six months every time.
|
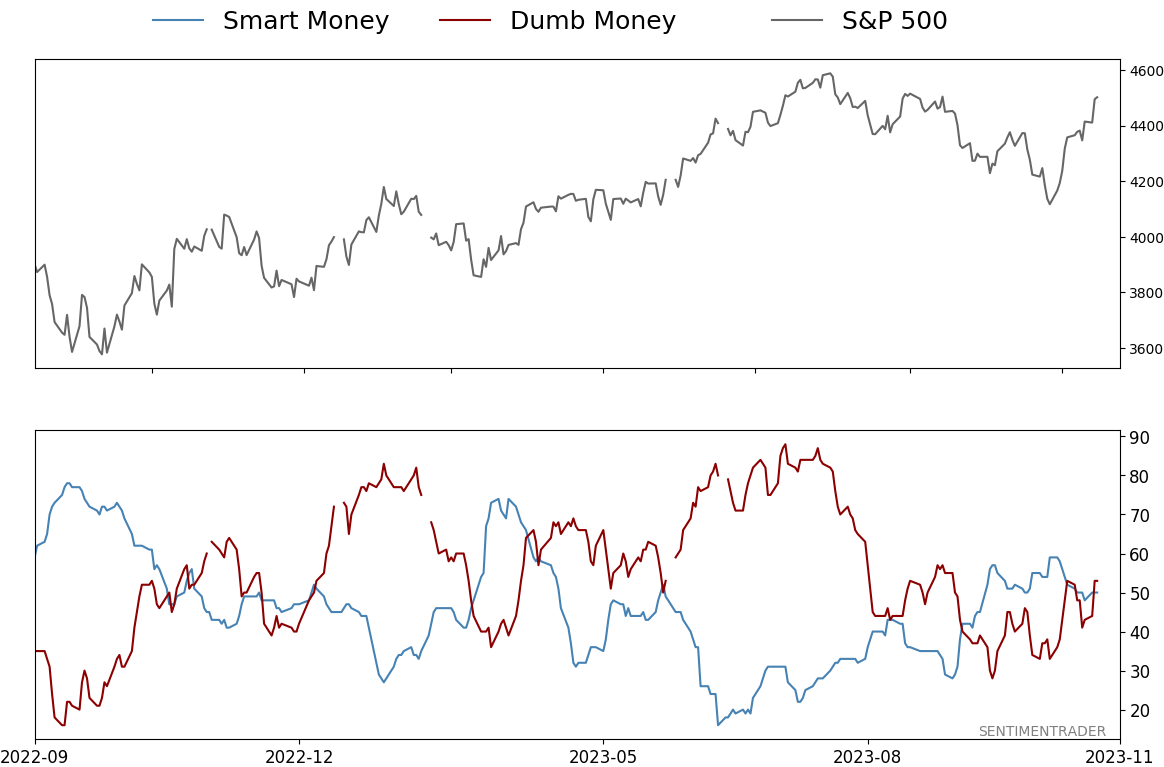
Smart / Dumb Money Confidence
|
Smart Money Confidence: 50%
Dumb Money Confidence: 53%
|
|
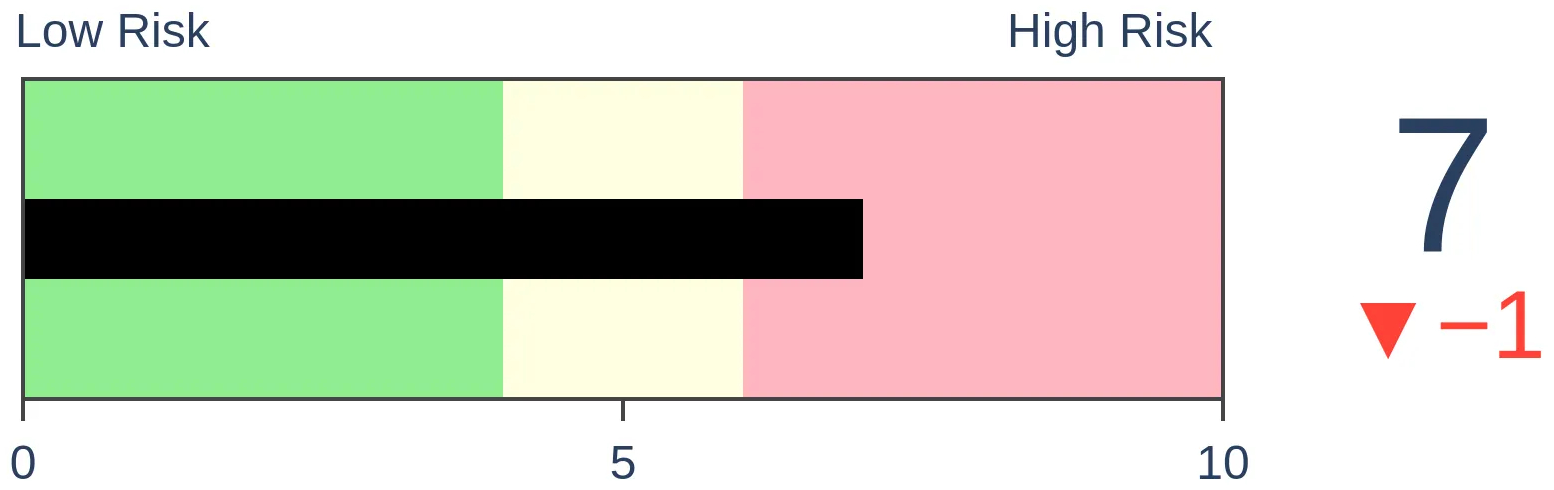
Risk Levels
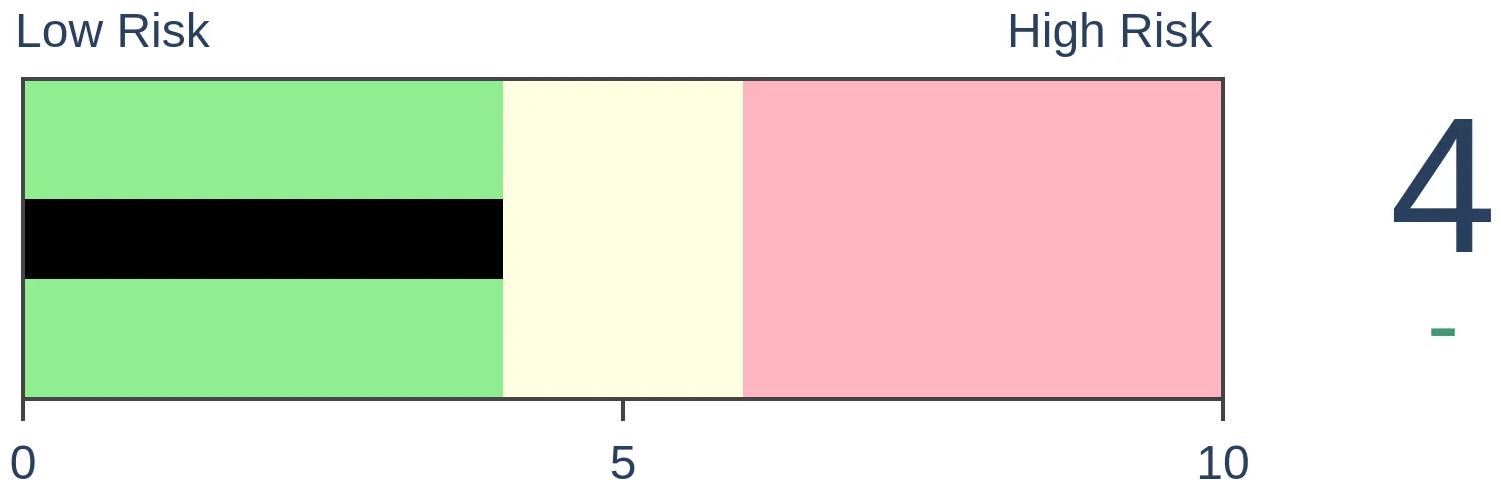
Stocks Short-Term
|
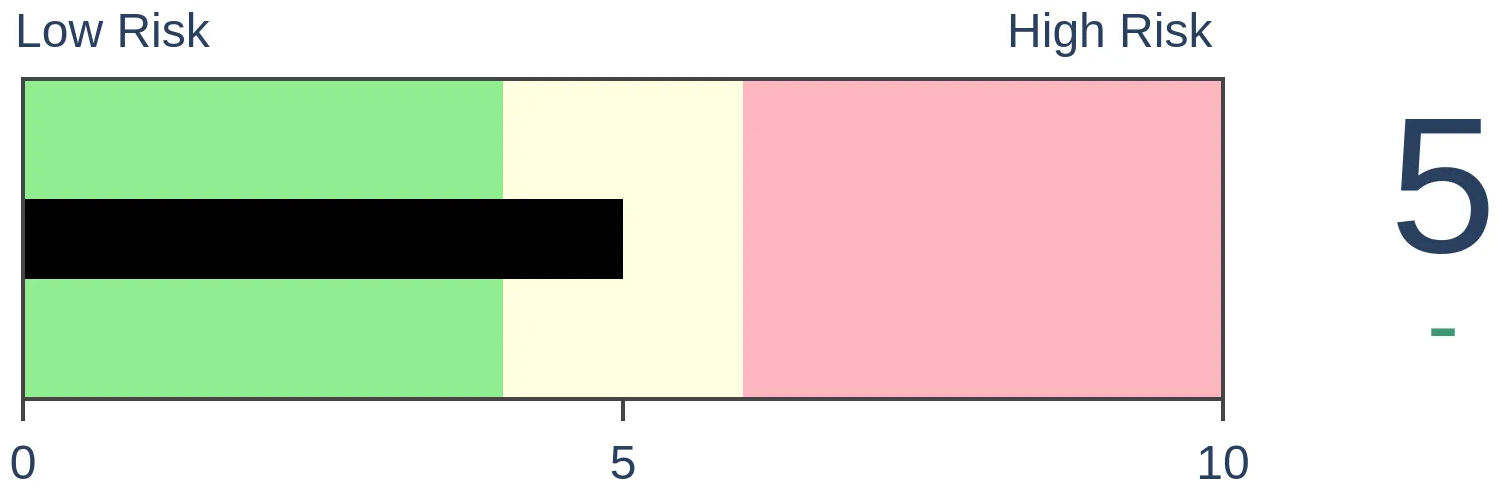
Stocks Medium-Term

|
|
Bonds

|
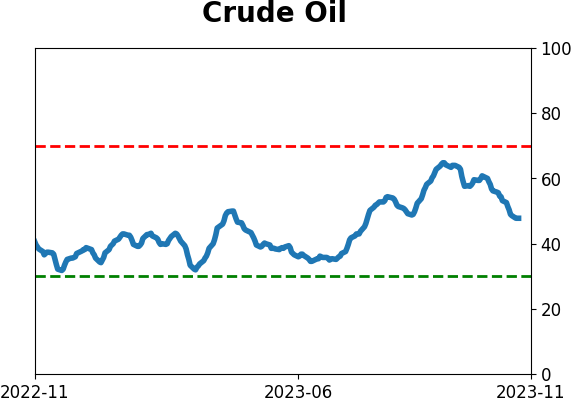
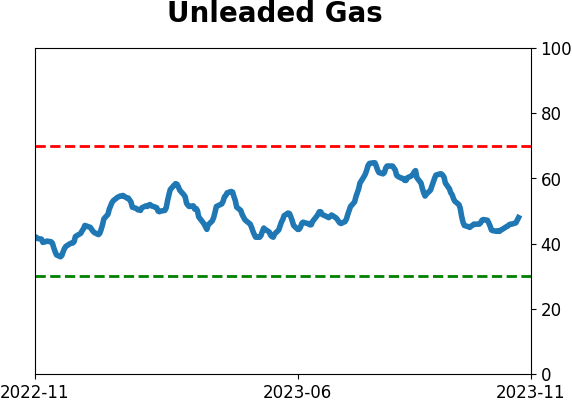
Crude Oil

|
|
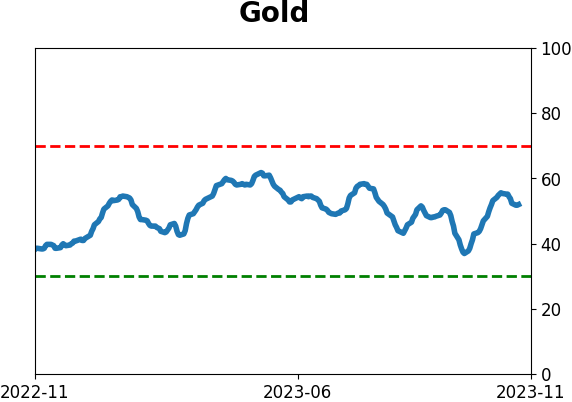
Gold
|
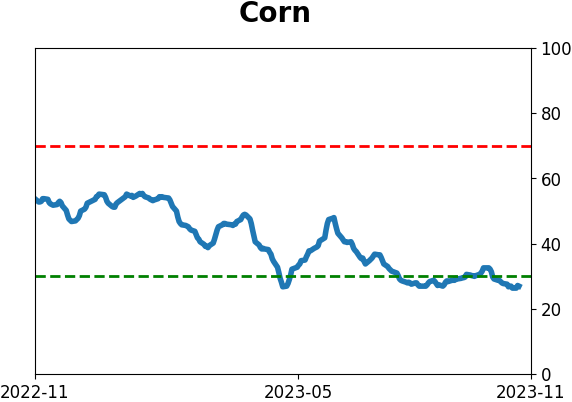
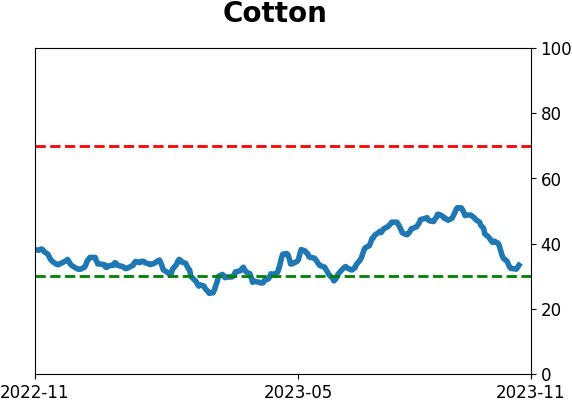
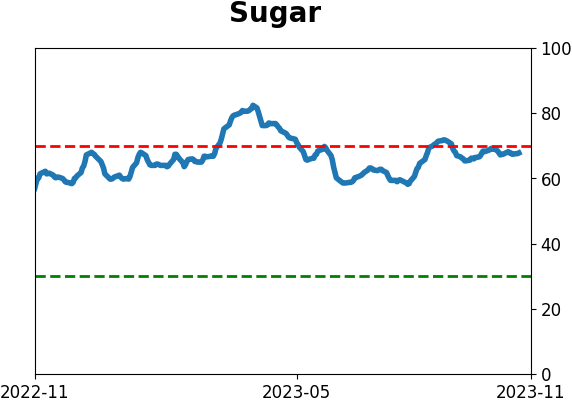
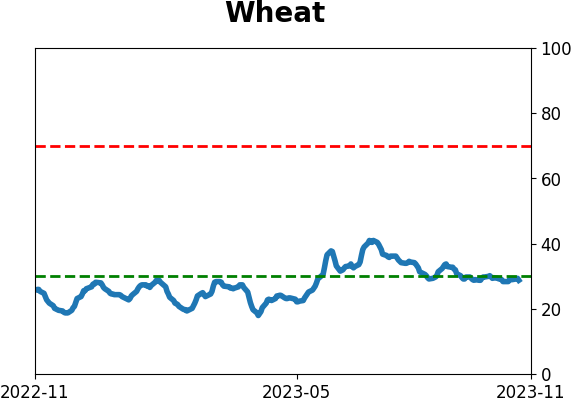
Agriculture
|
|
Research
By Dean Christians
BOTTOM LINE
On Tuesday, the stock market experienced a notable shift as more than 25% of stocks and 32% of sub-industry groups closed with gains exceeding 4%. After similar surges, the S&P 500 was higher over the following six months every time.
FORECAST / TIMEFRAME
None
|
Key points:
- Over 25% of stocks and 32% of sub-industry groups closed with a daily gain of 4% or more on Tuesday
- Similar one-day surges tended to mark an inflection point with bullish implications for the S&P 500
- Precedents above the 200-day struggled initially but were higher over the following six months every time
One day does not make a trend, but this is compelling
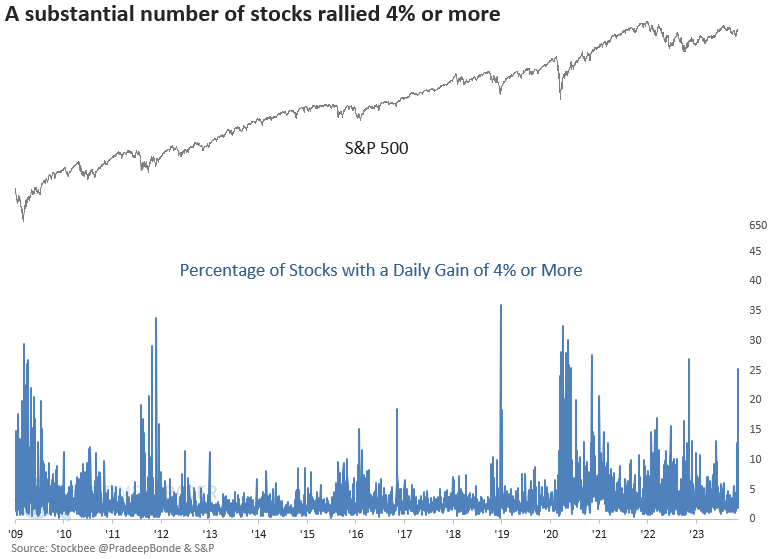
The stock trading service Stockbee, operated by Pradeep Bonde, provides some interesting and unusual market breadth data on his website for free. You can also find Pradeep on Twitter/X under the following name. @pradeepbonde
One breadth series measures the number of stocks with a daily gain of 4% or more. The scan currently contains over 6300 stocks.
On Tuesday, the percentage of stocks with a daily gain of 4% or more surged to 25%, reaching the highest level since the stock market low in the fall of 2022.
Significant one-day upside explosions in stocks are bullish
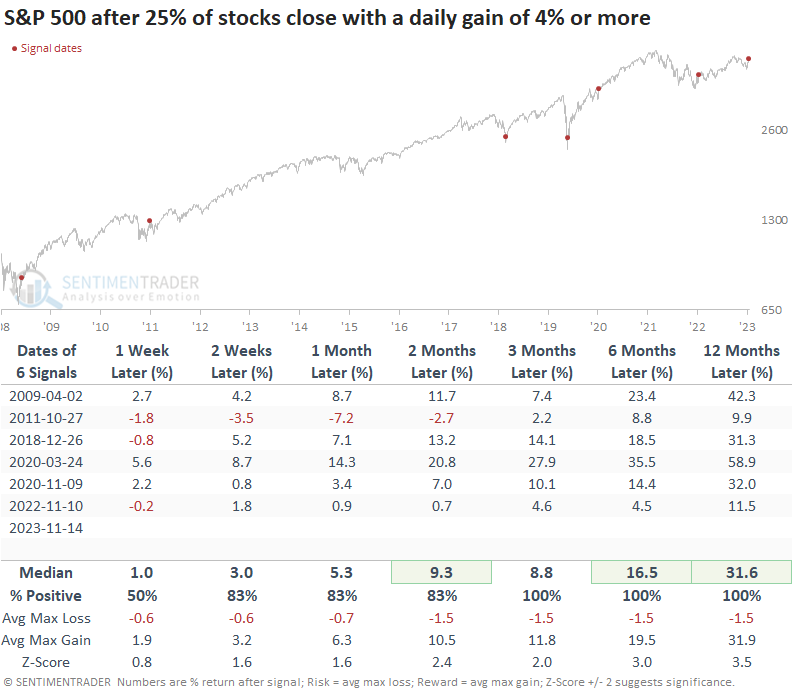
While the sample size is small, whenever 25% of stocks close up 4% or more in a single session, the S&P 500 rallied 100% of the time over the subsequent three, six, and twelve months.
The 2011 instance is the only precedent that saw a significant drawdown in the first two months, with a max loss of -9.8%.
A larger sample size
Employing sub-industry data to broaden the sample size reveals that on Tuesday, more than 32% of sub-industry groups experienced a gain of 4% or more, marking the 38th occurrence of such an event since 1957 when screening out repeats.
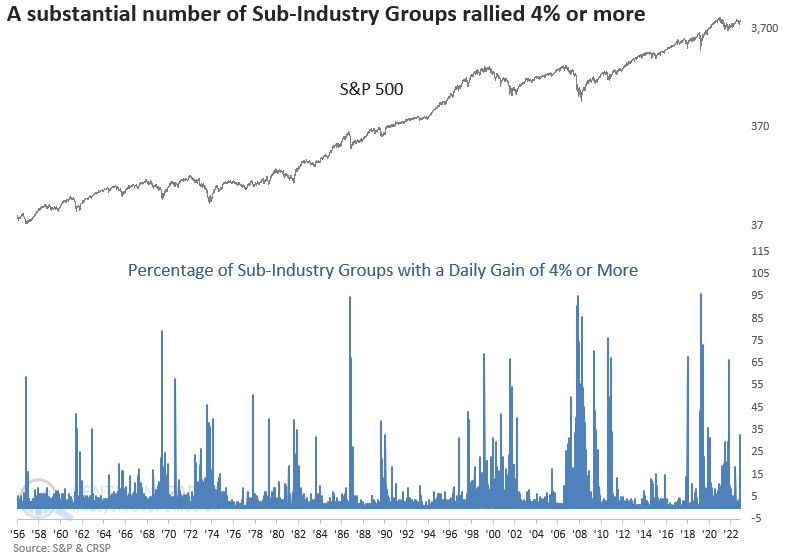
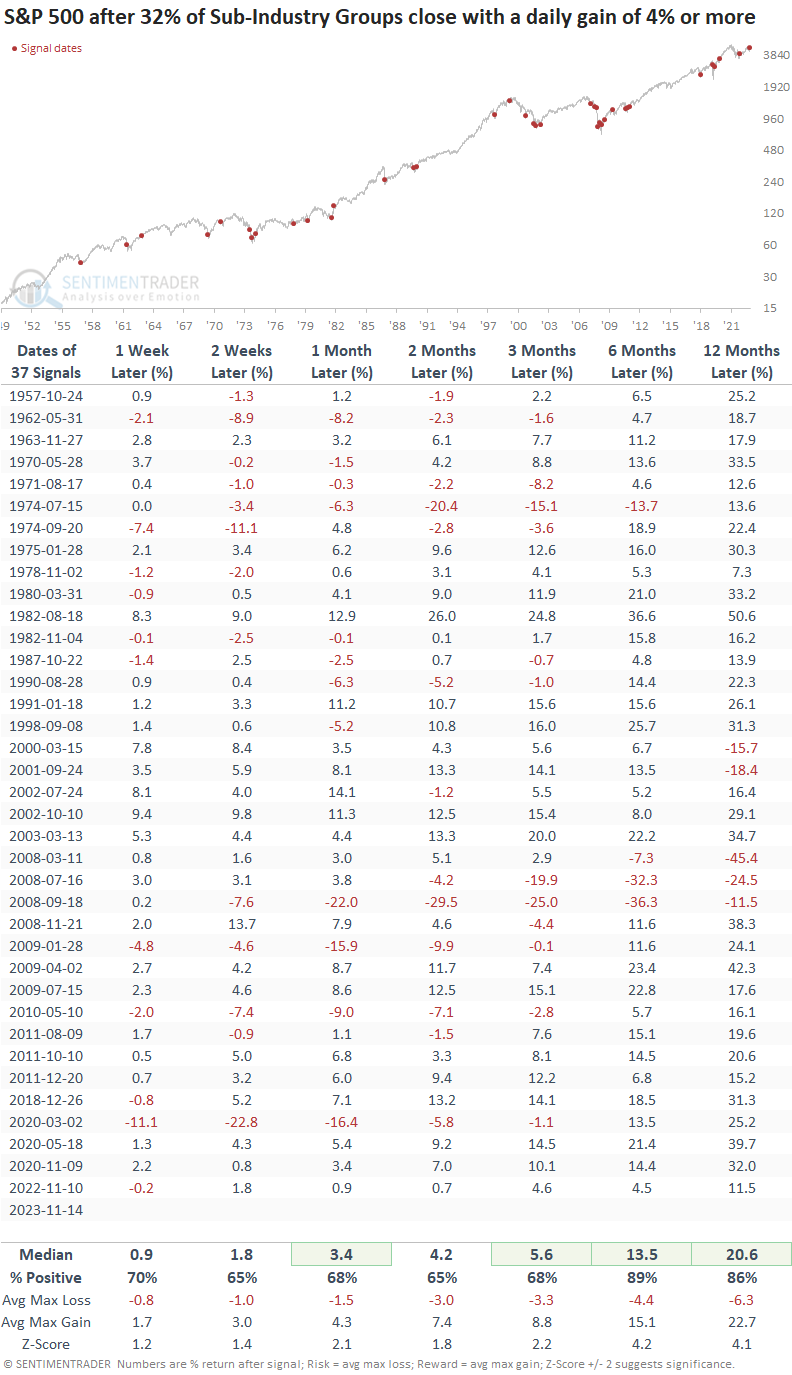
Whenever 32% of sub-industry groups registered a daily gain exceeding 4%, the S&P 500 showed a solid tendency to rally across all time horizons.
Except for 2008, most of the bear market precedents occurred near the end of the drawdown phase. And, every instance in the 2000-02 drawdown was profitable three months later.
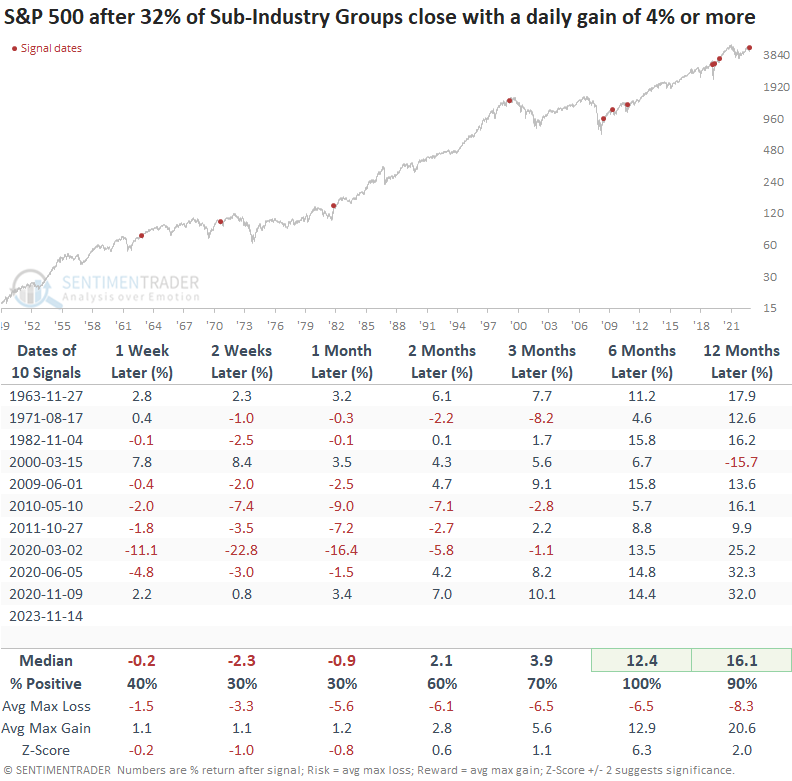
Signals in a long-term uptrend
If I isolate signals that occurred when the S&P 500 was trading above its 200-day average for context similar to now, the large-cap index struggled over the subsequent month. However, history suggests the near-term weakness is a buying opportunity. Six months later, the S&P 500 was higher every time.
What the research tells us...
Stocks exploded higher on Tuesday after a relatively benign CPI report. The surge saw over 25% of stocks rise by 4% or more, a level historically associated with a positive turning point for equity markets. Comparable upswings presaged a 100% win rate for the S&P 500 over the subsequent three, six, and twelve months. An analysis using sub-industry data over a significantly extended period confirms the bullish outlook, especially when the S&P 500 is in an uptrend like now. If history rhymes, traders should use any short-term weakness to add market exposure.
Indicators at Extremes
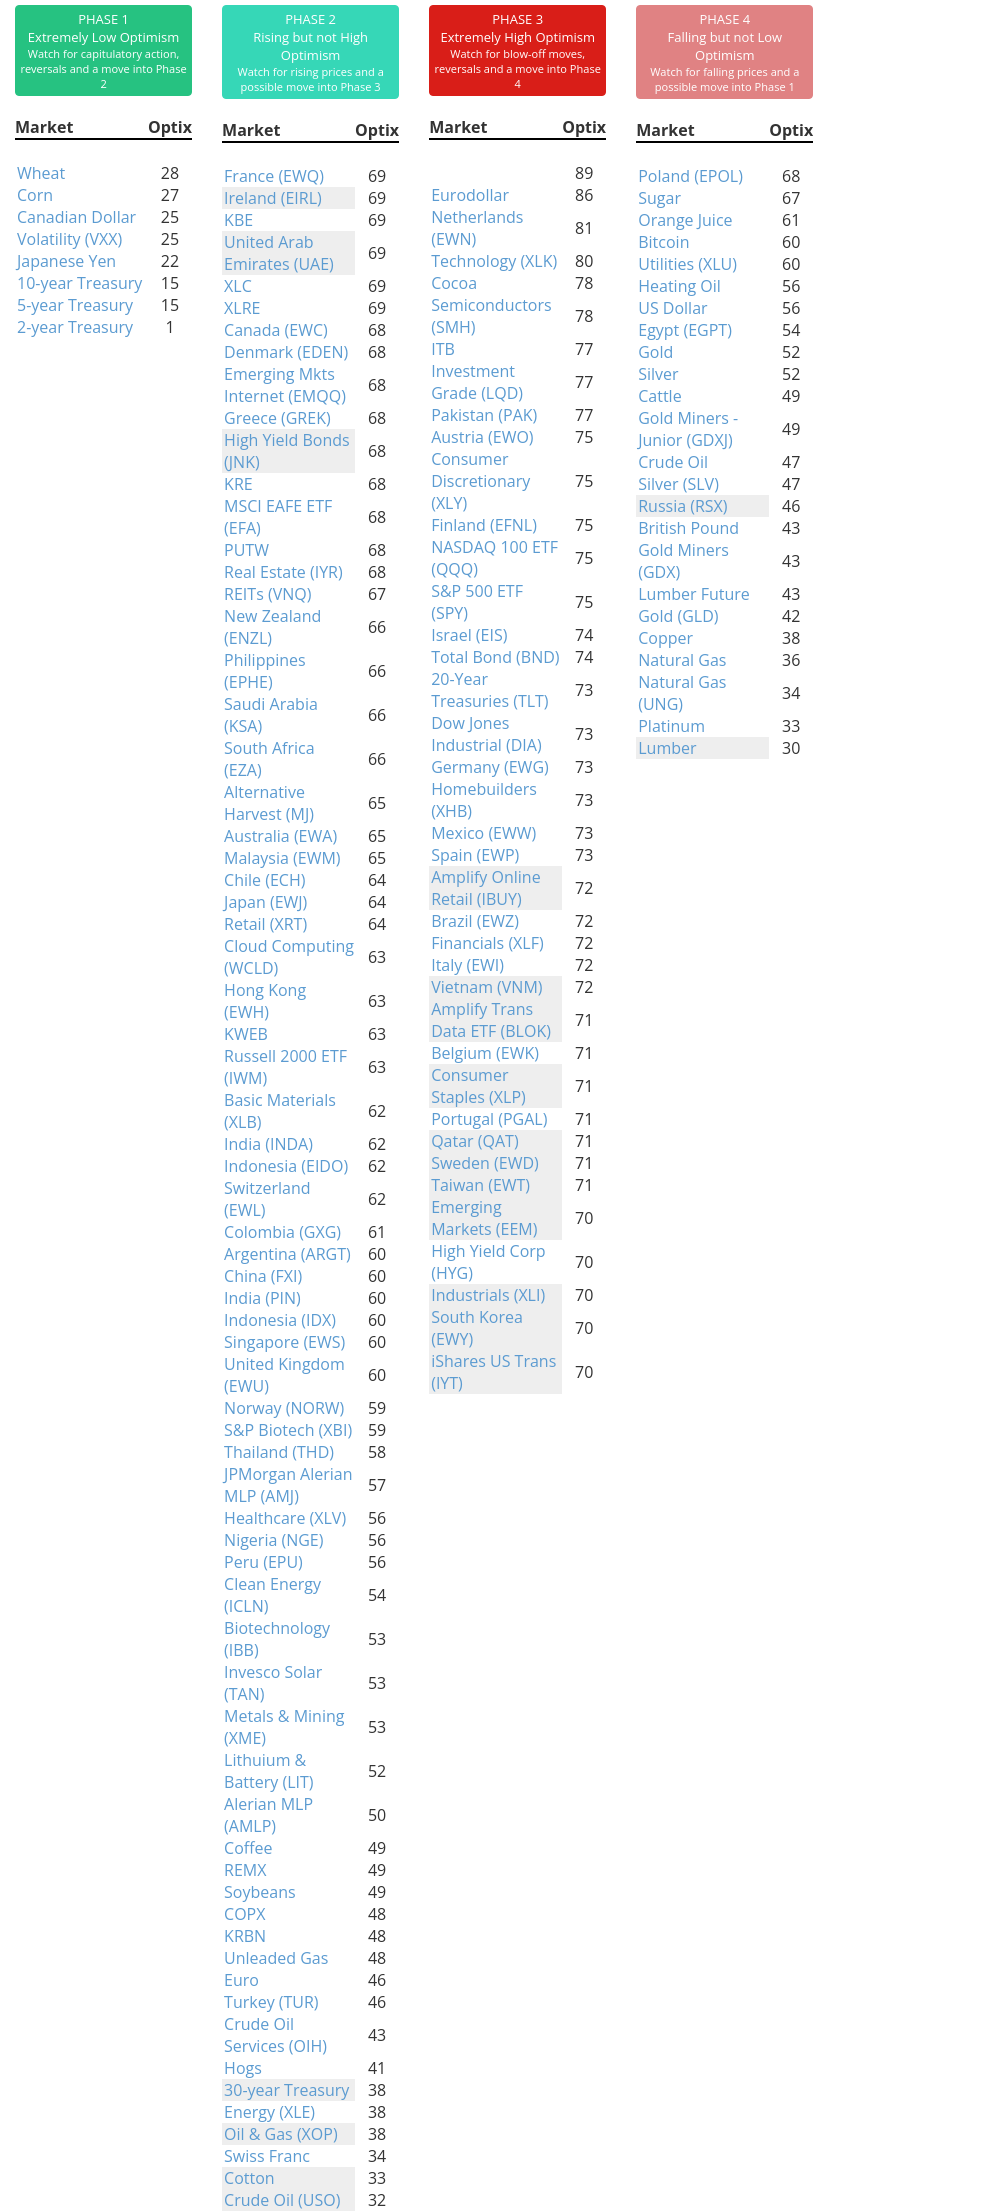
Phase Table
Ranks
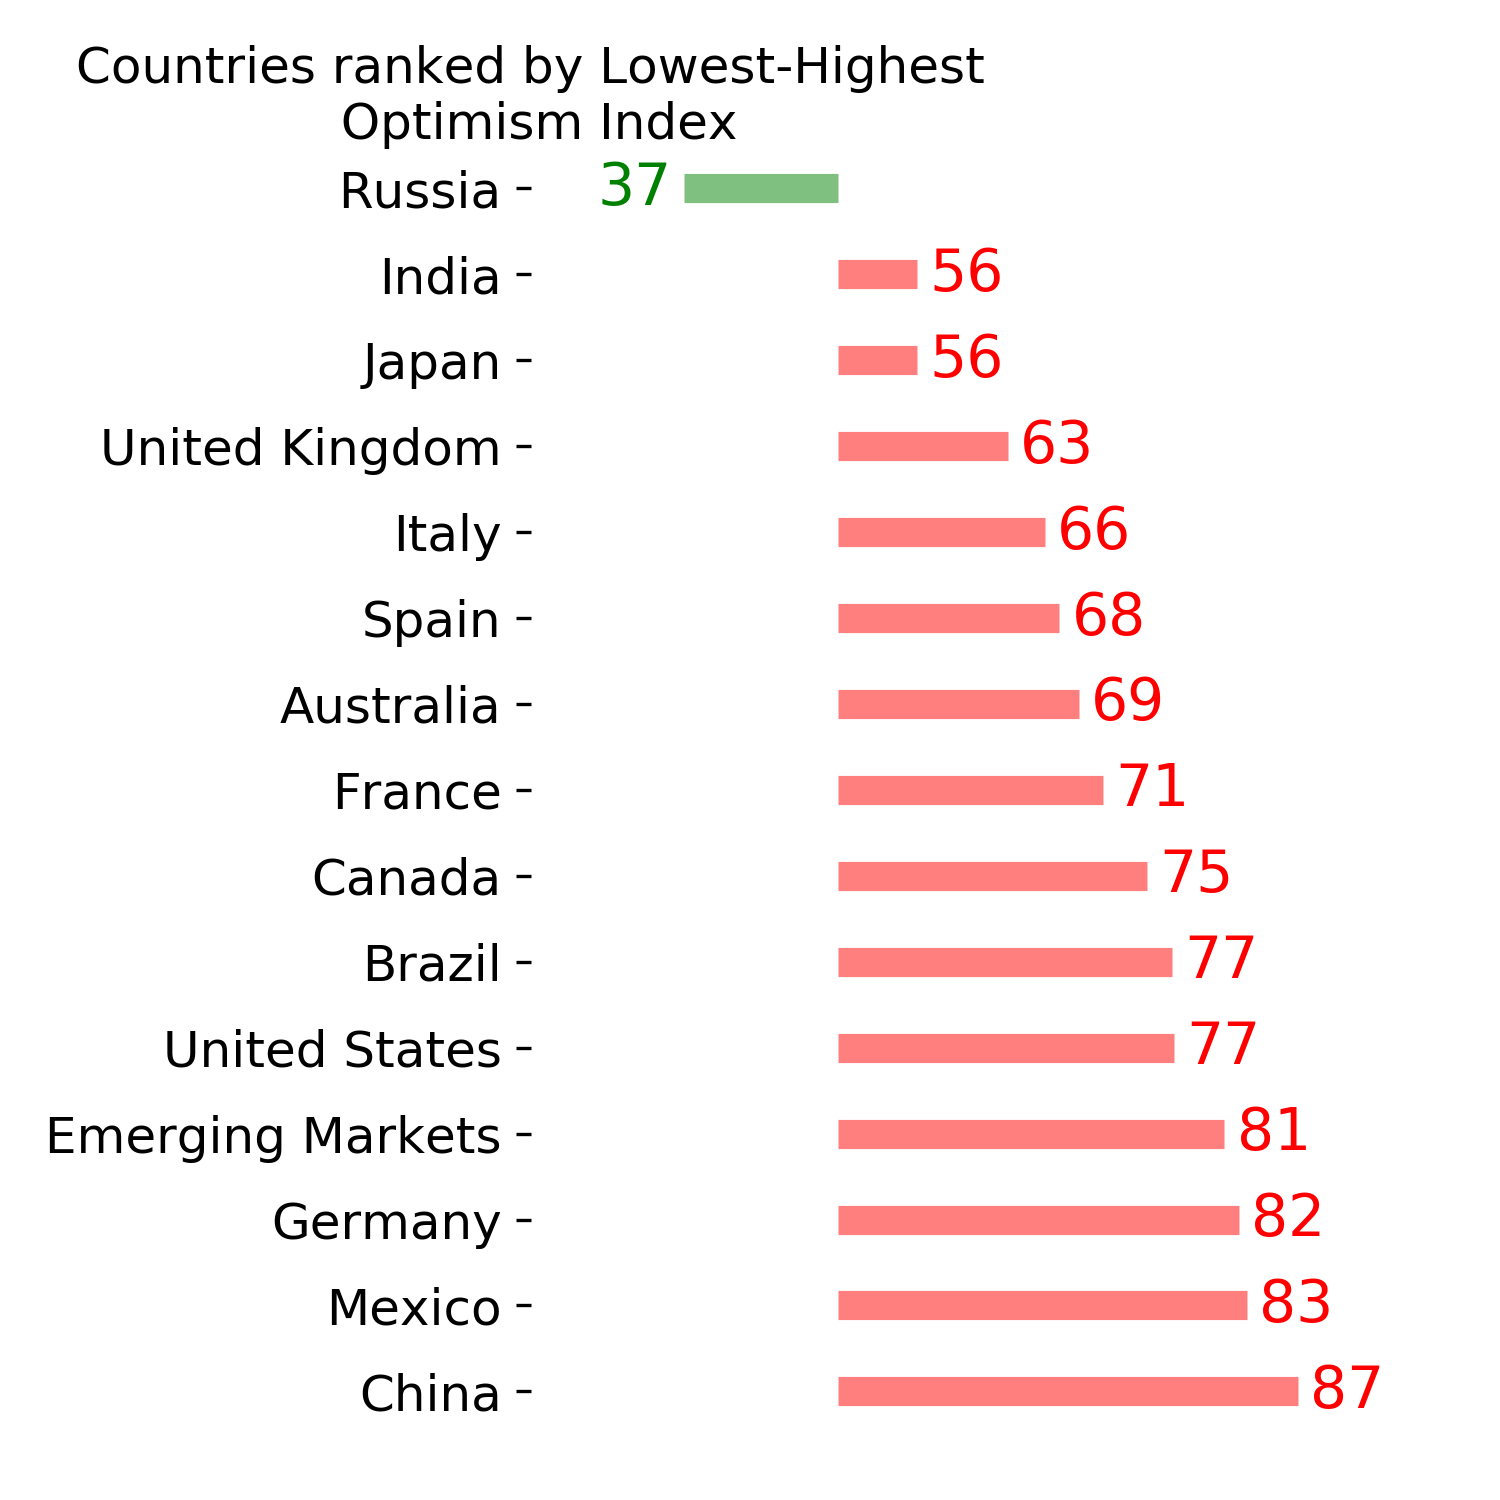
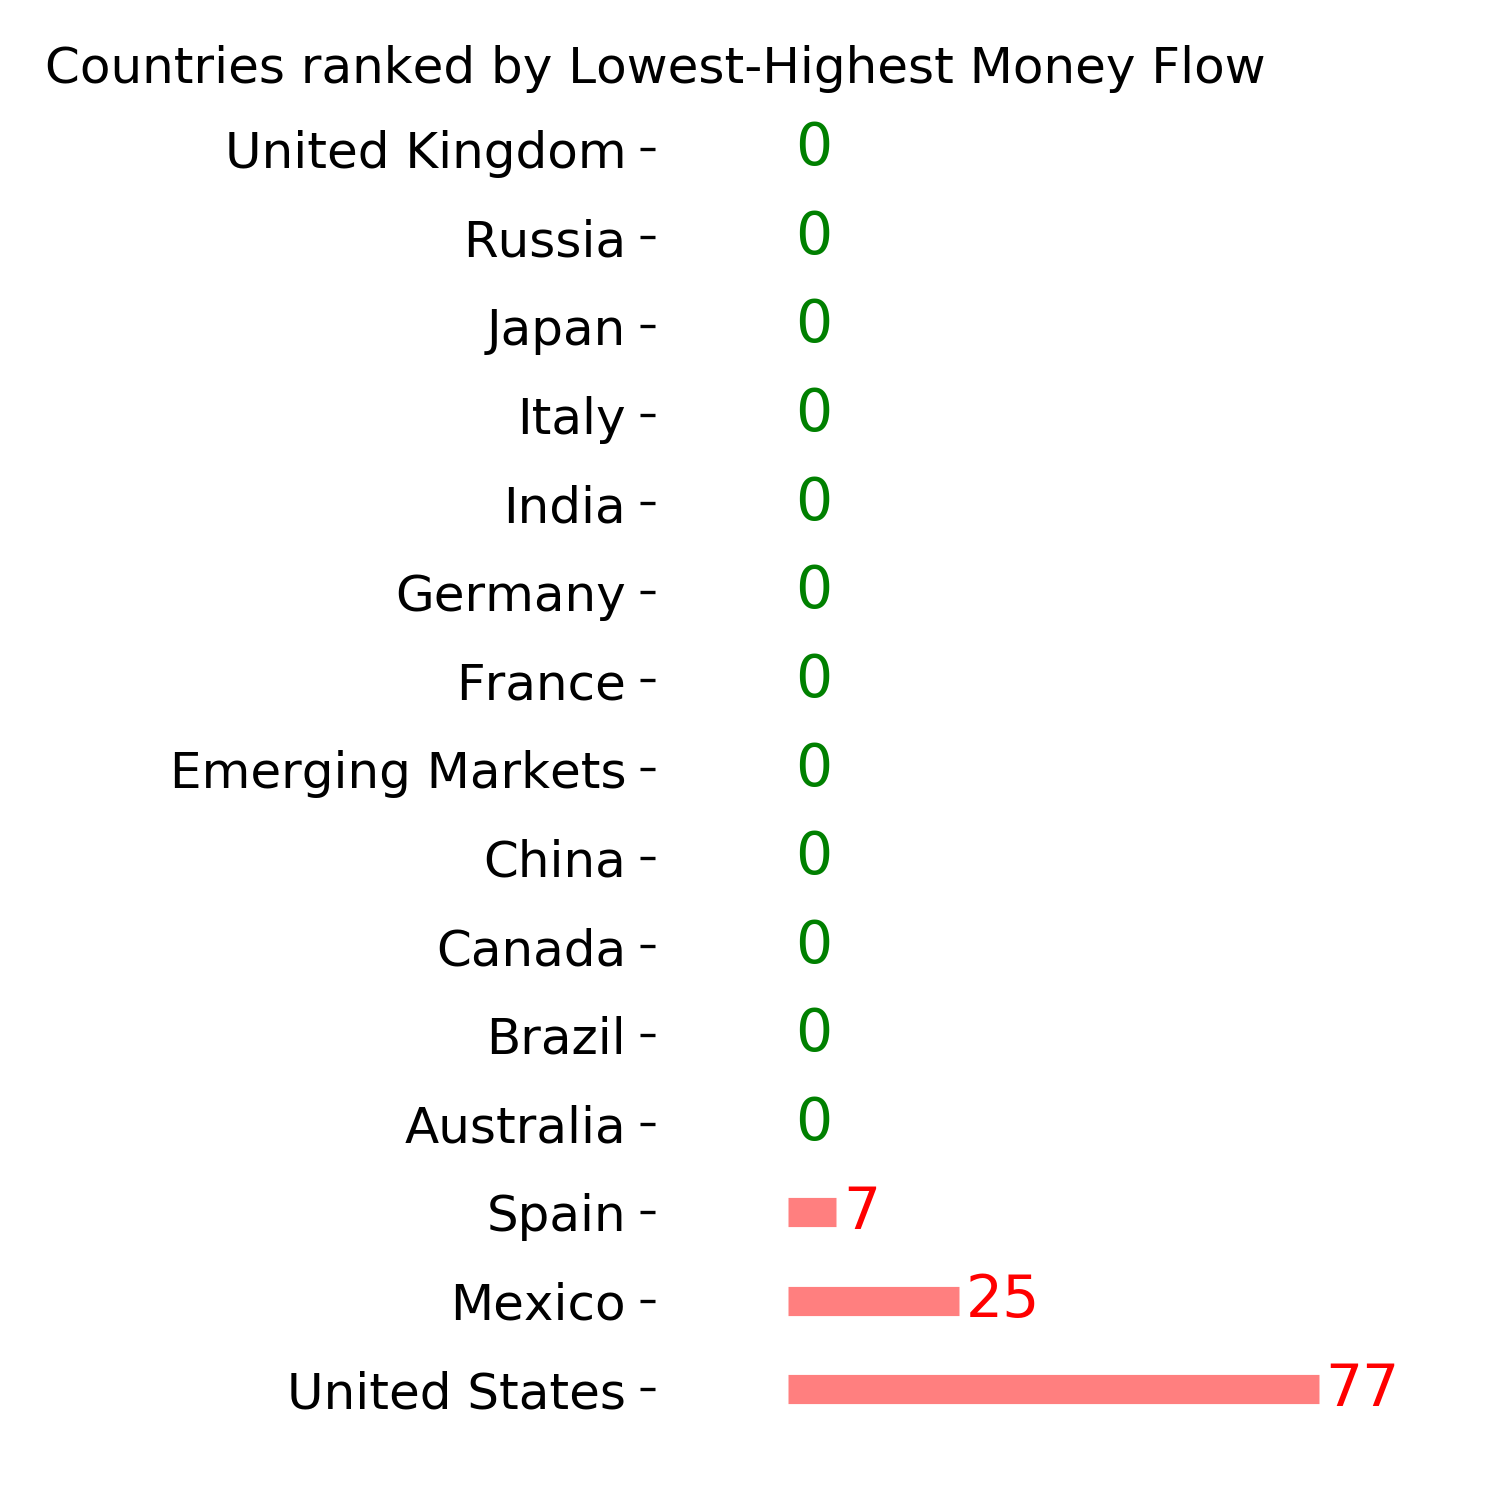
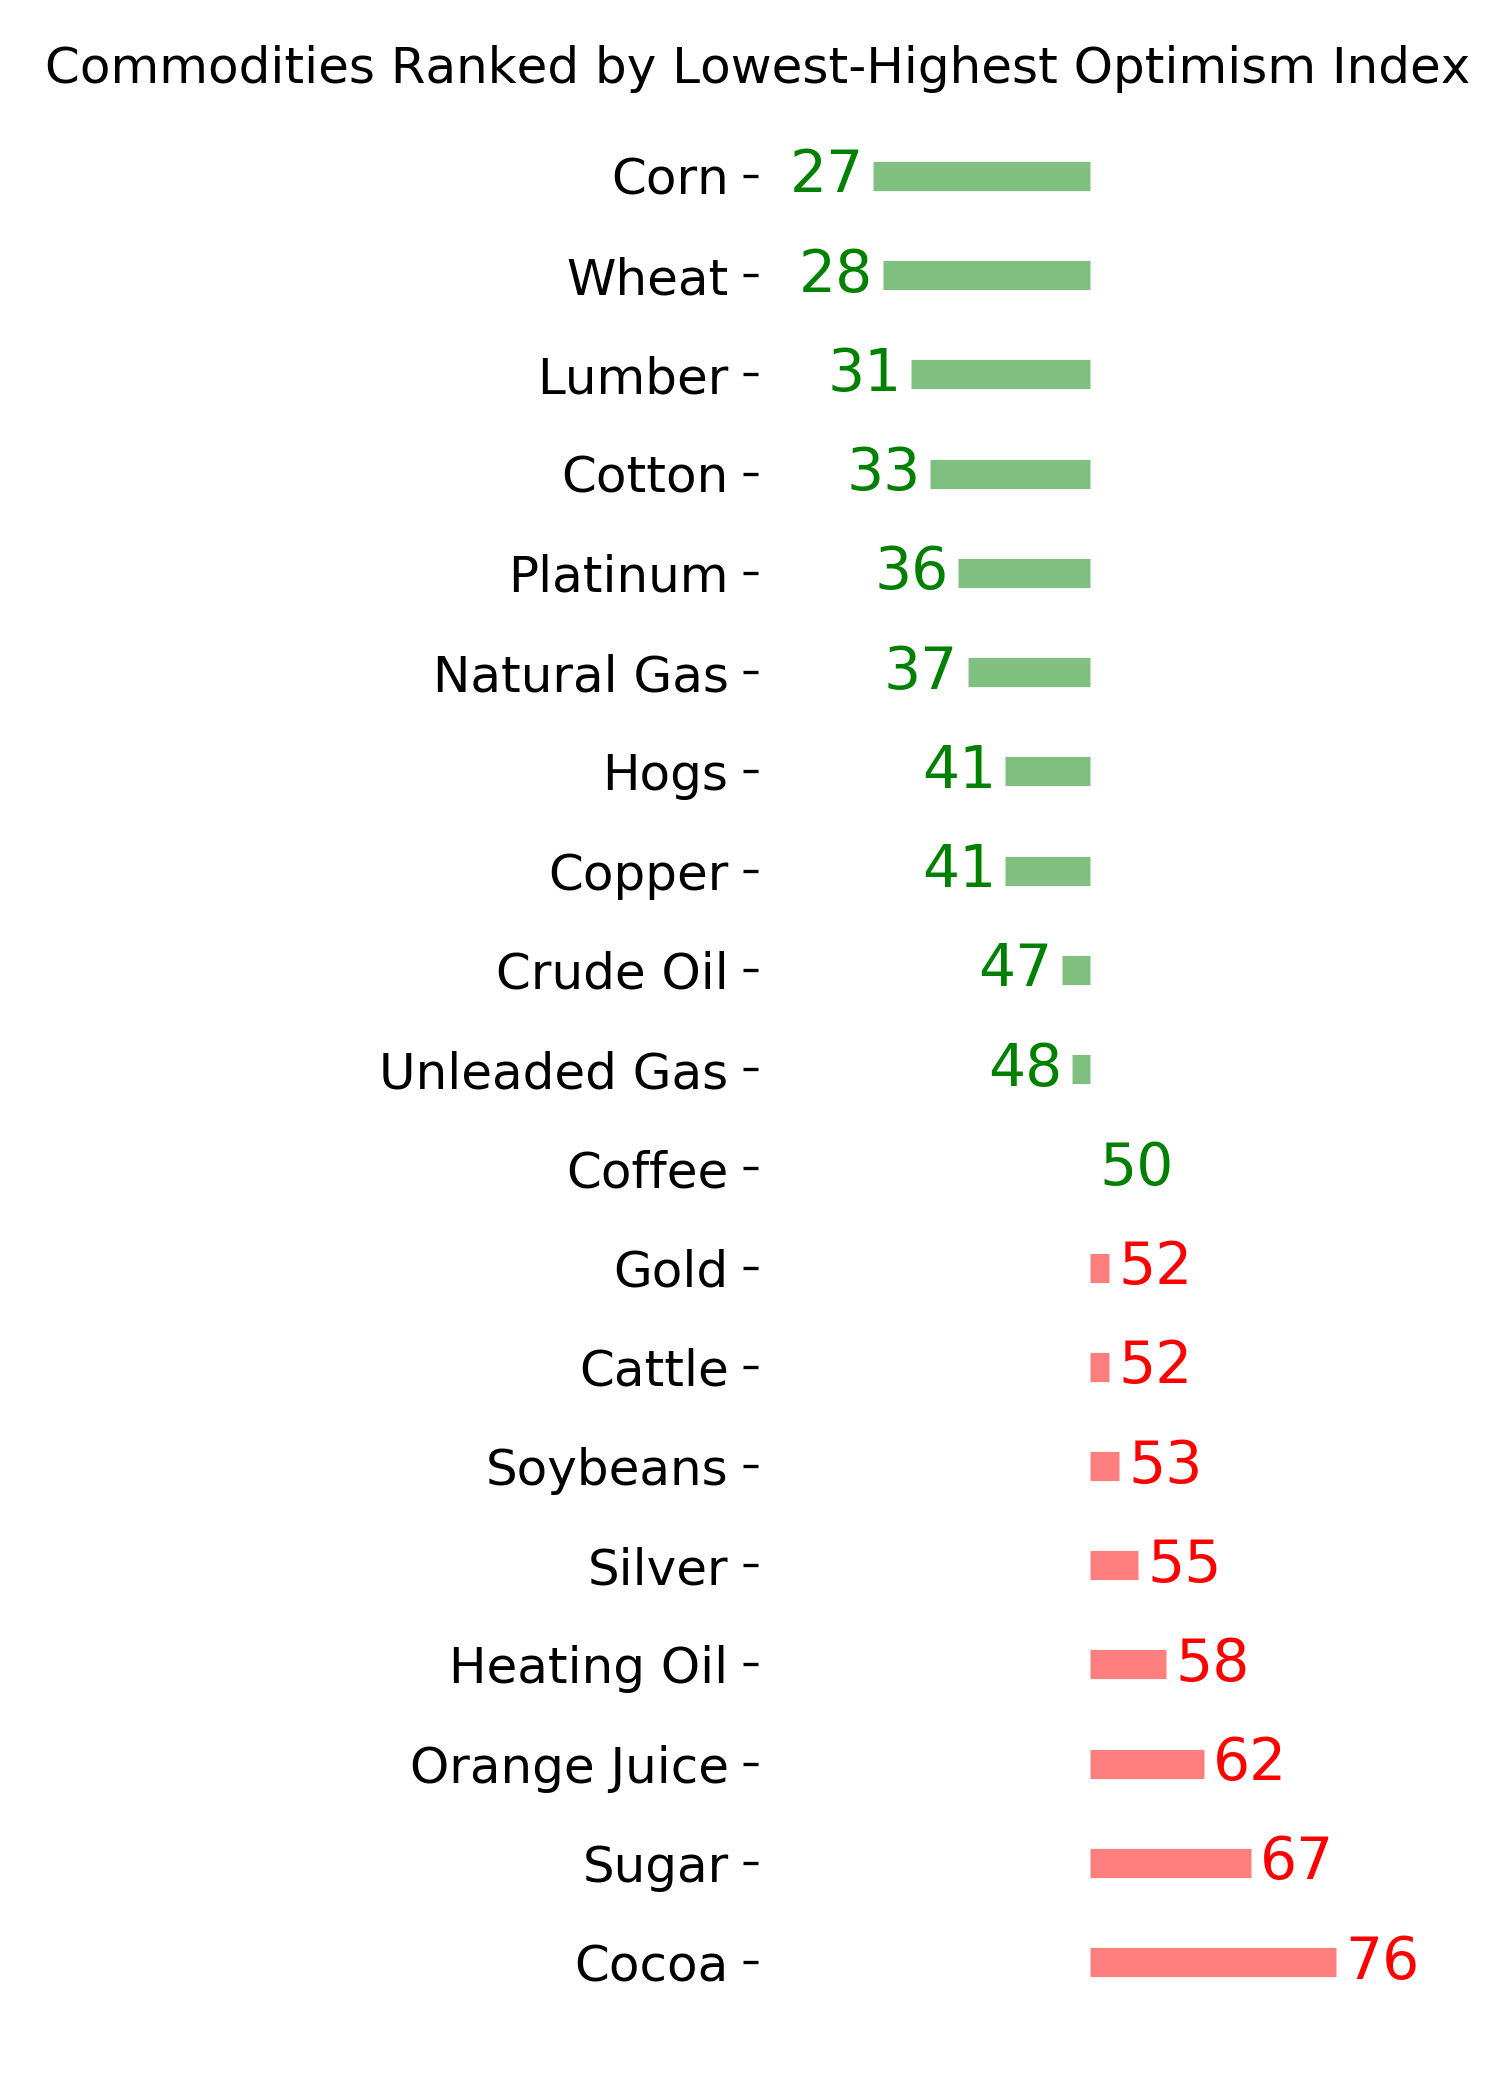
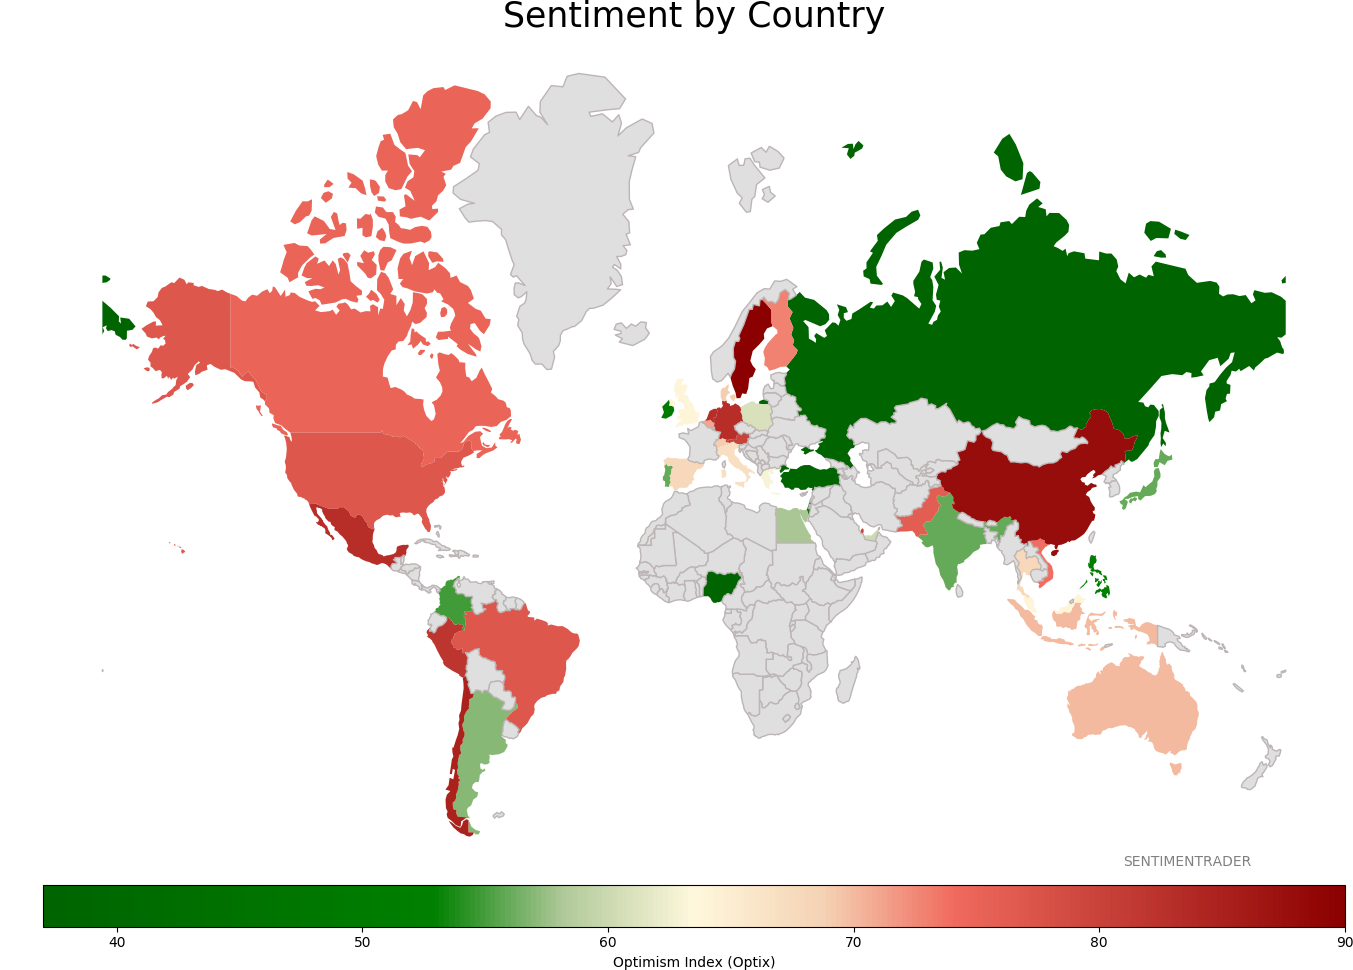
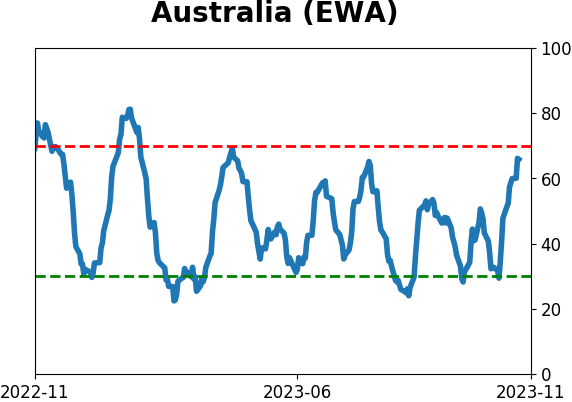
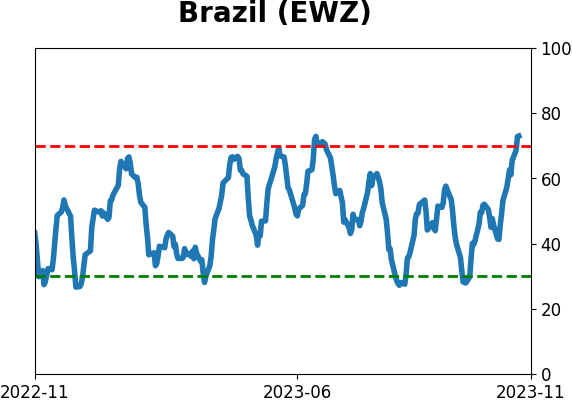
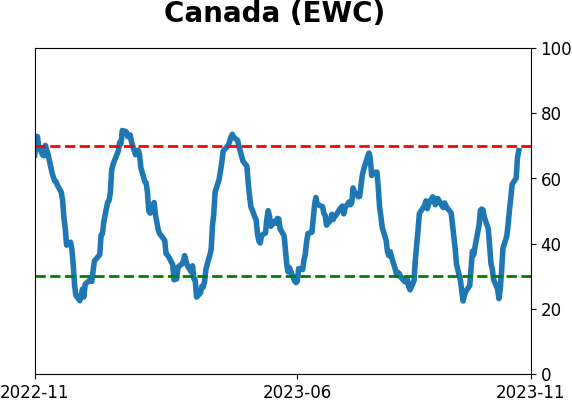
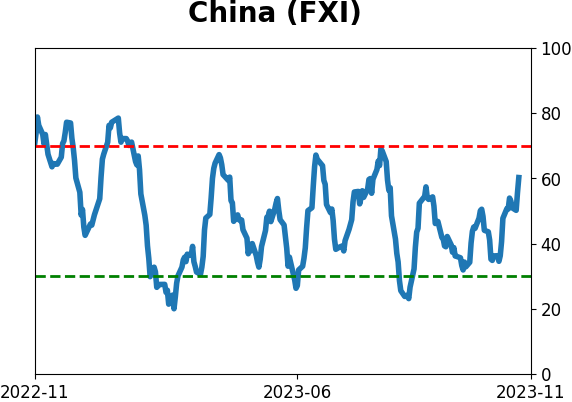
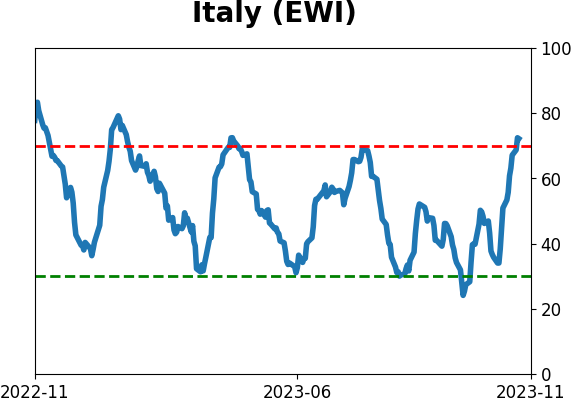
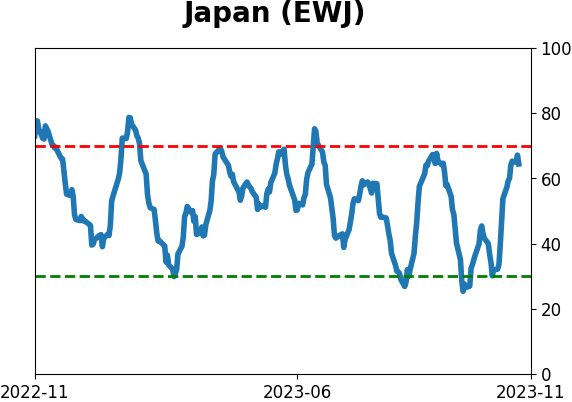
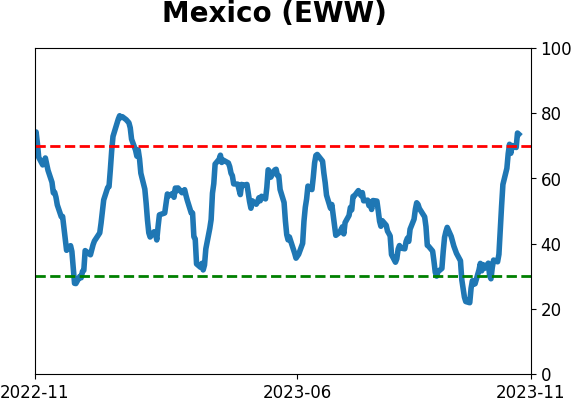
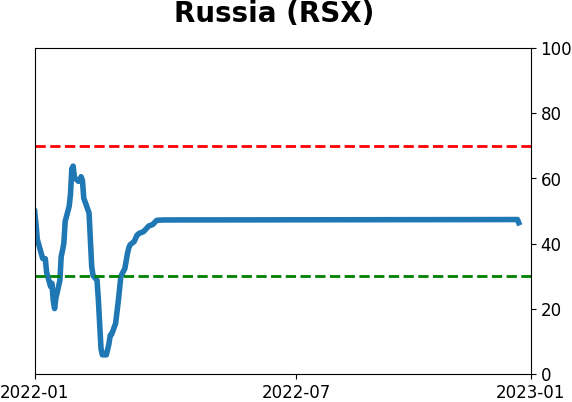
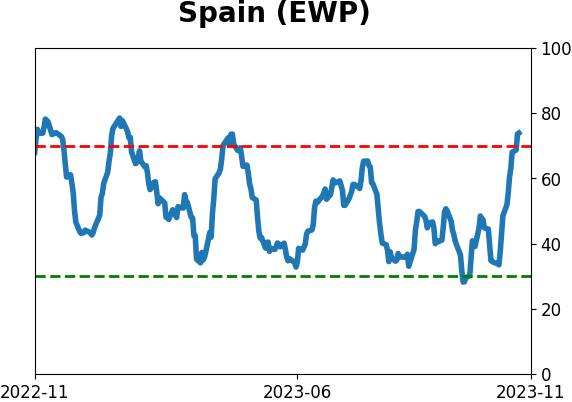
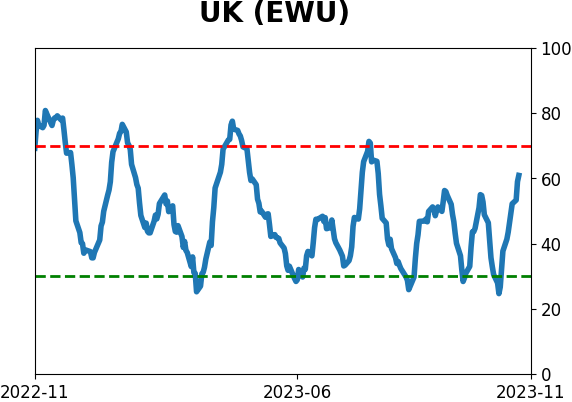
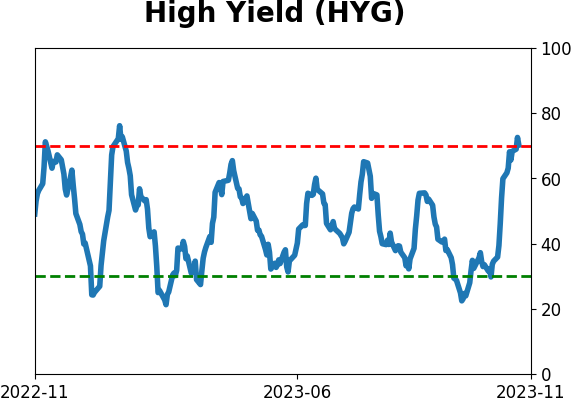
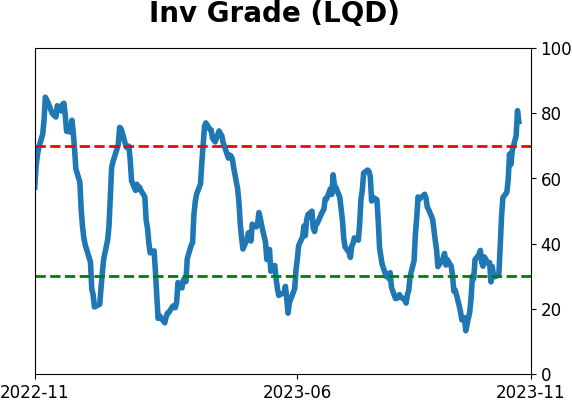
Sentiment Around The World
Optimism Index Thumbnails
|
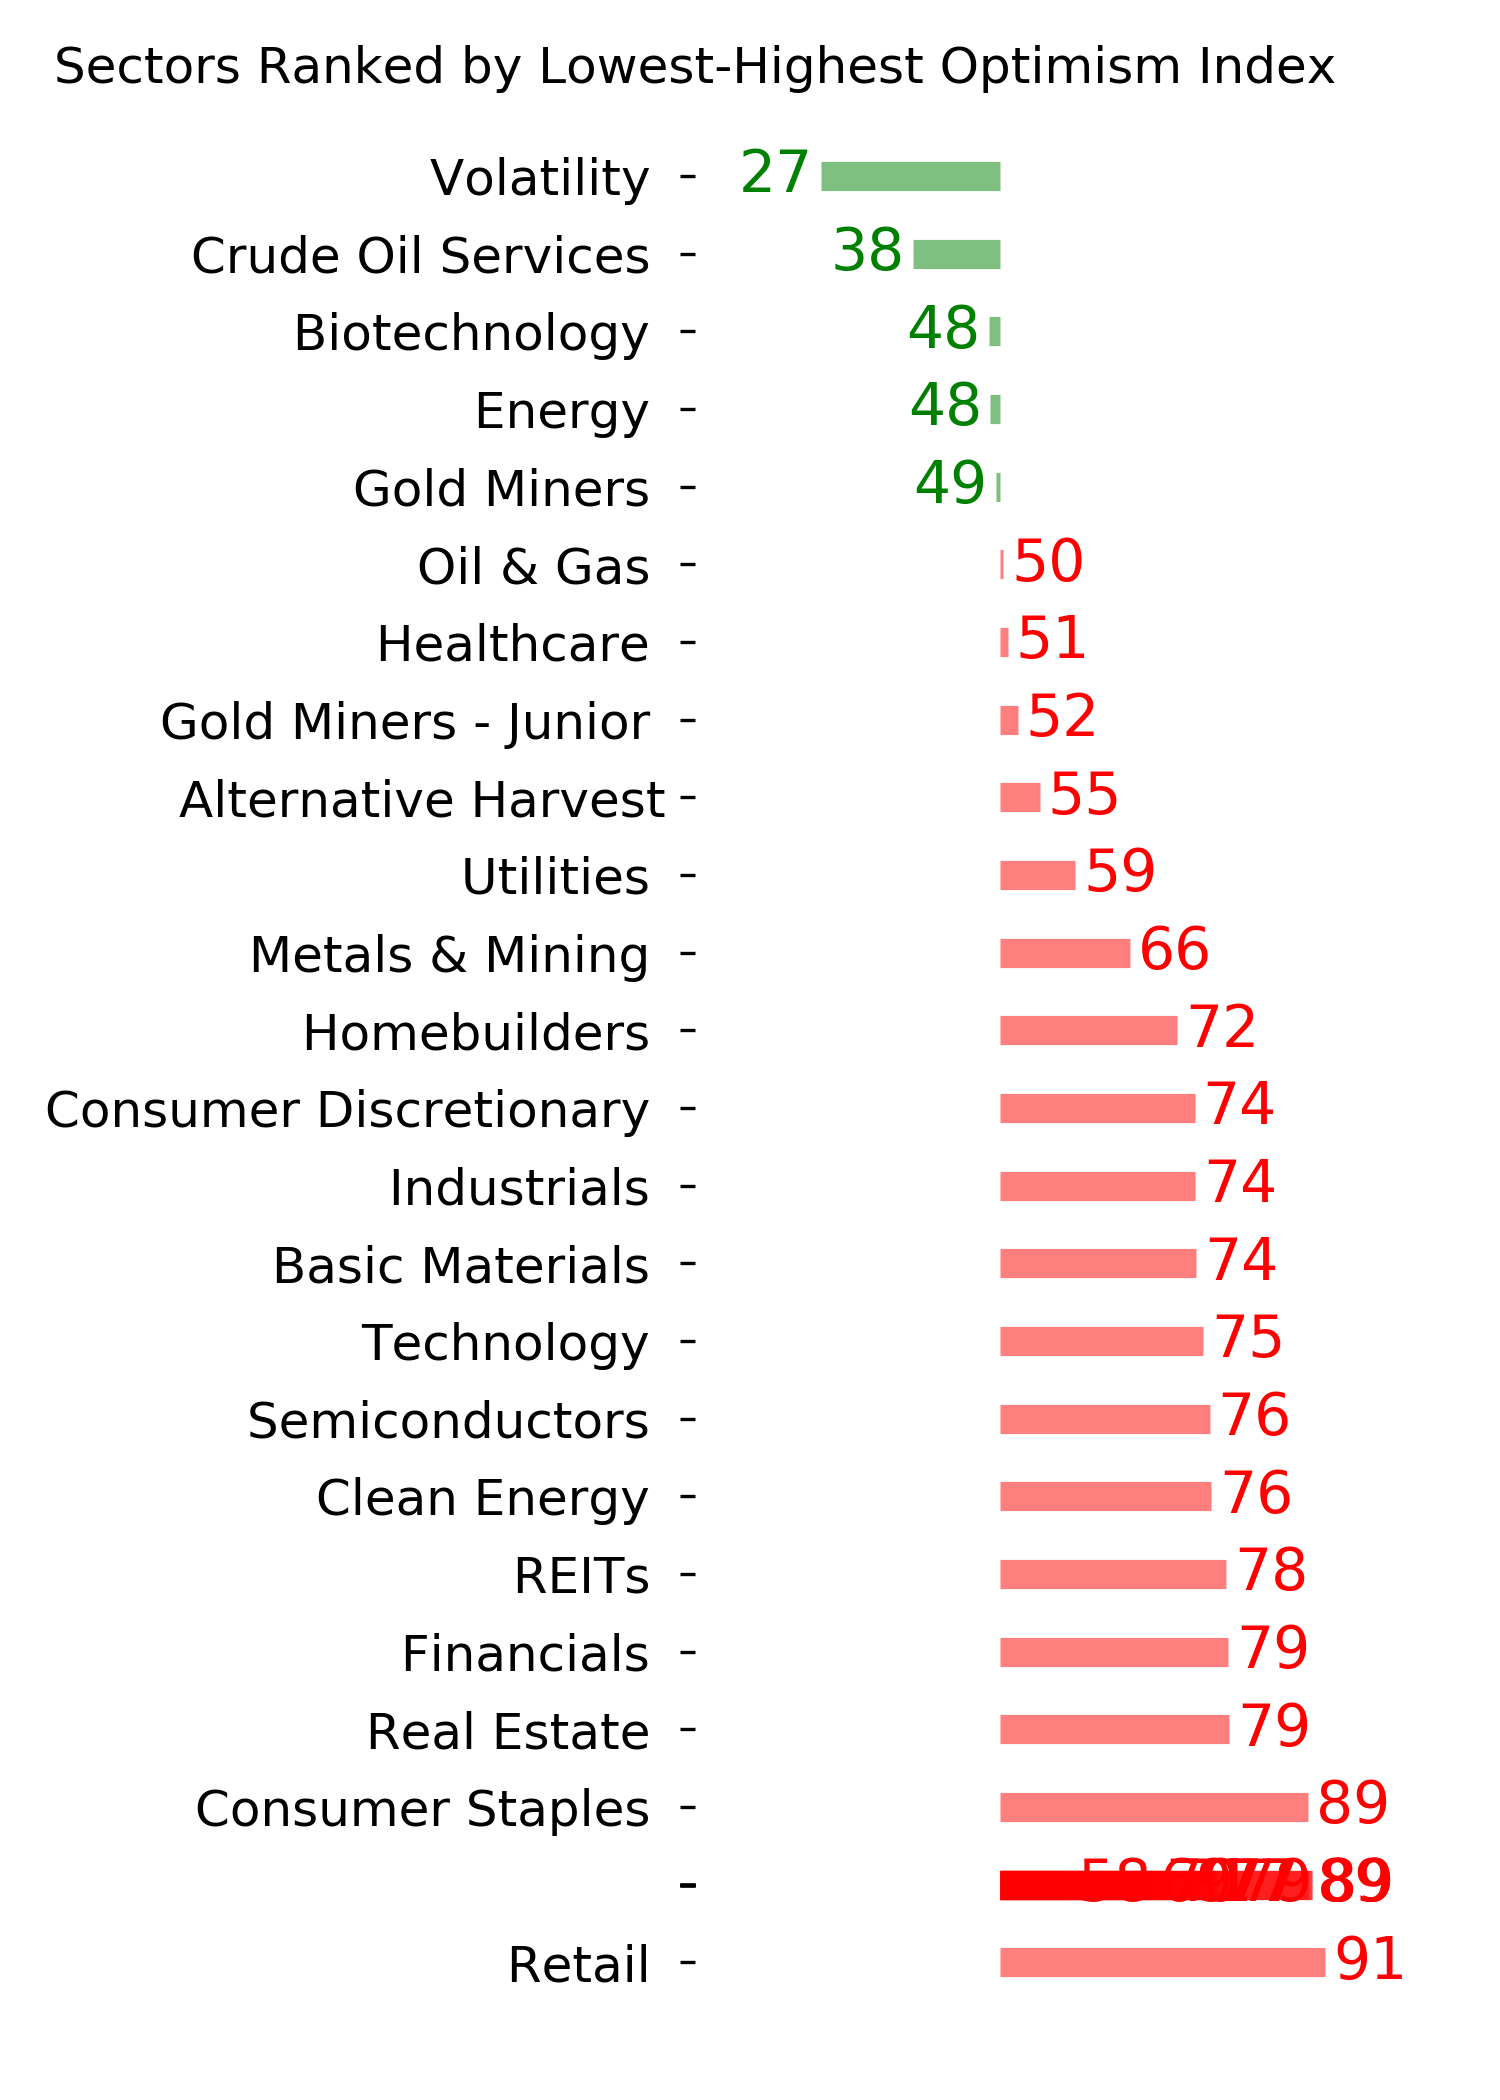
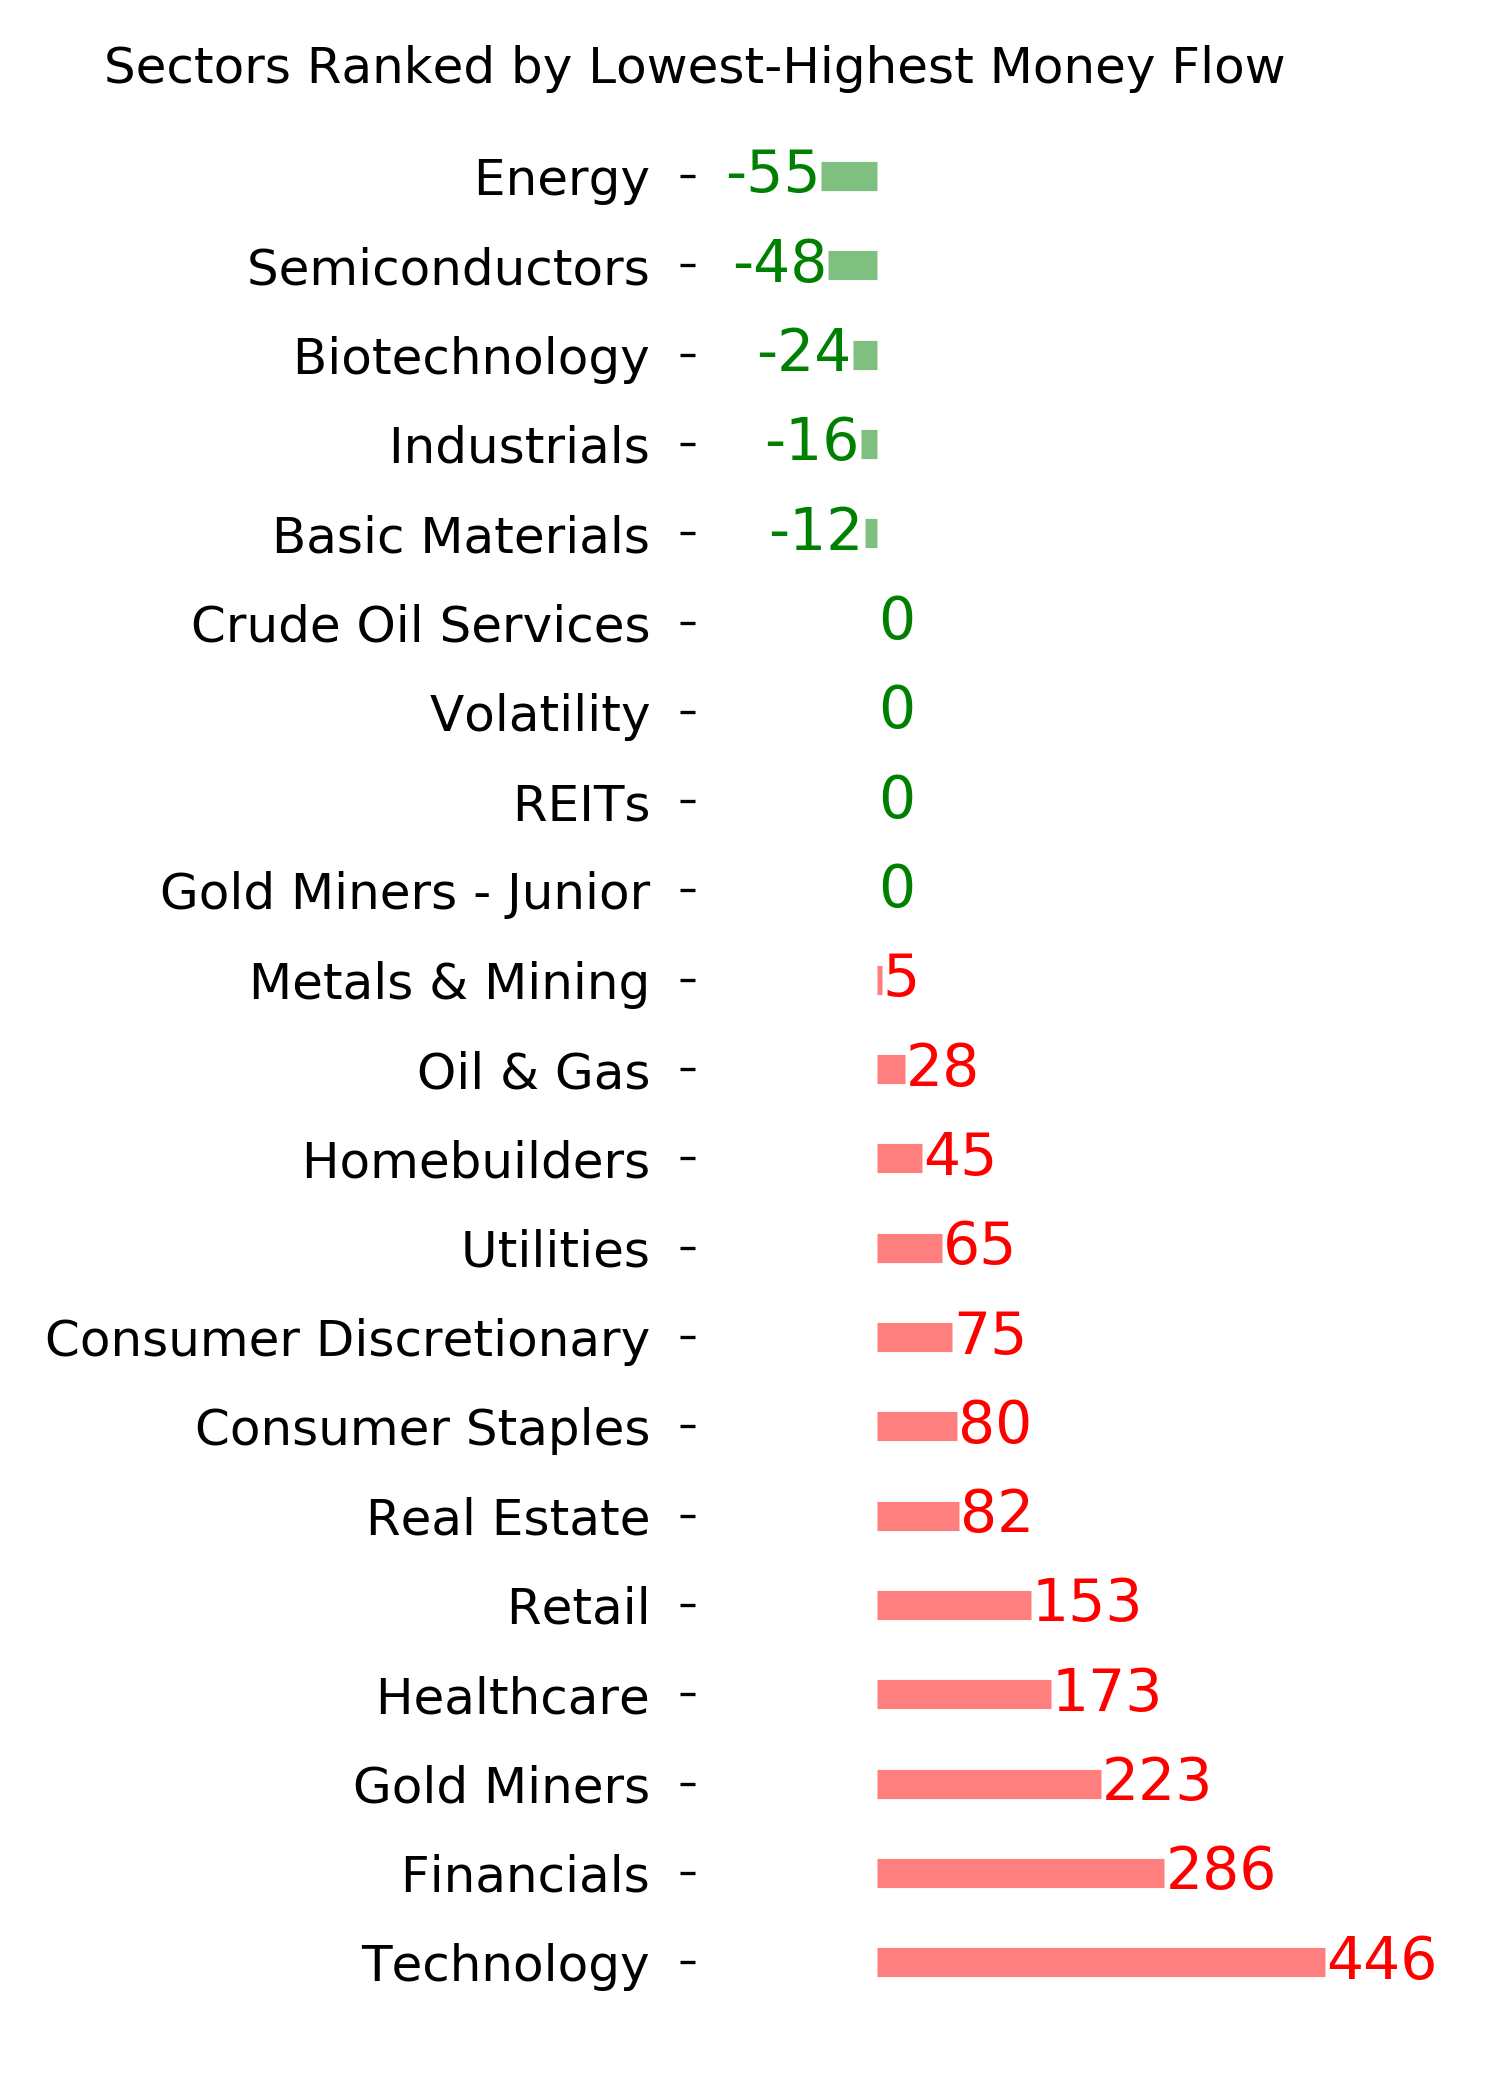
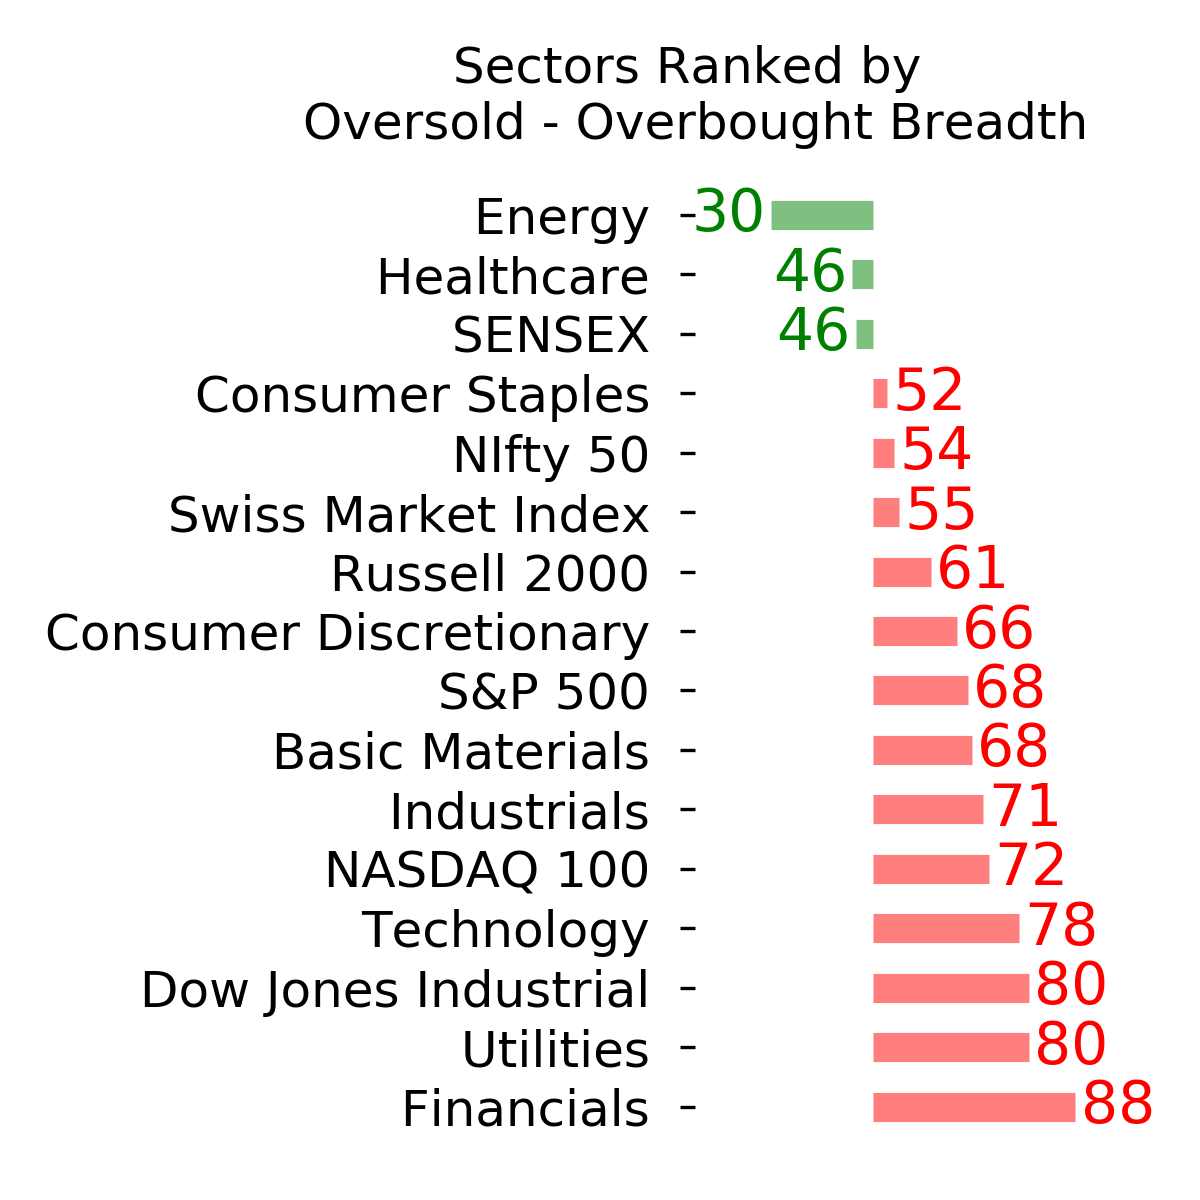
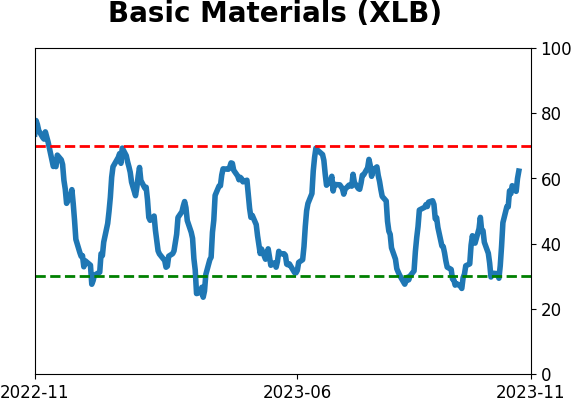
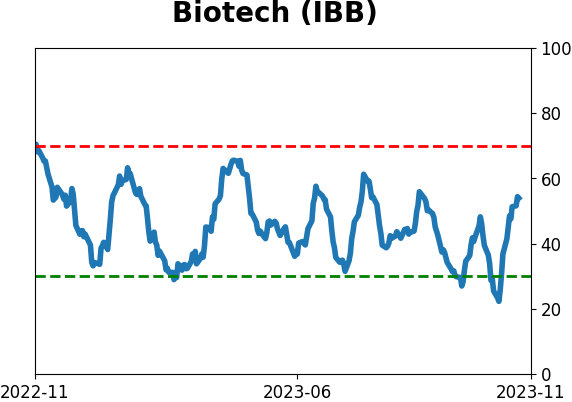
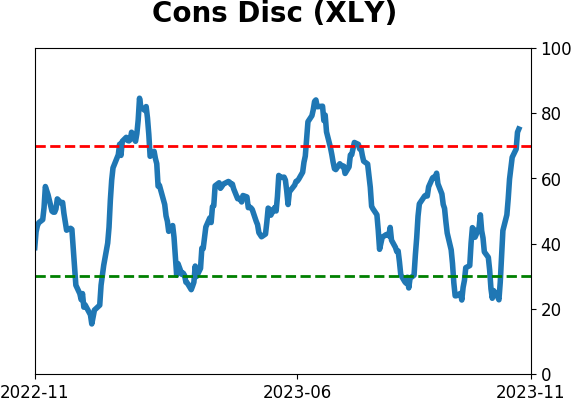
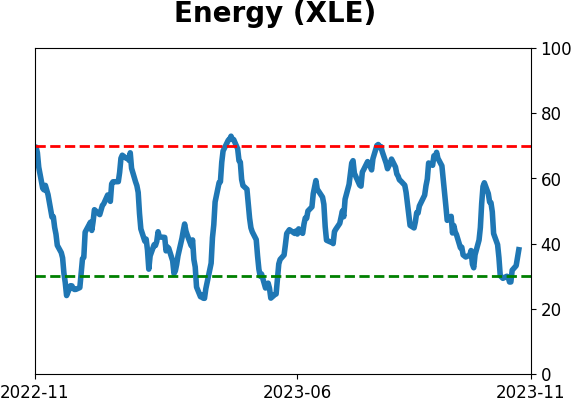
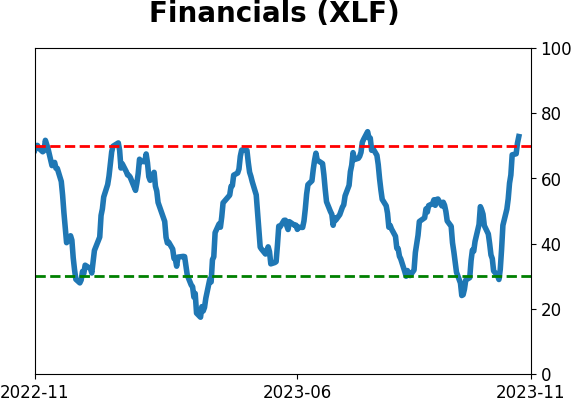
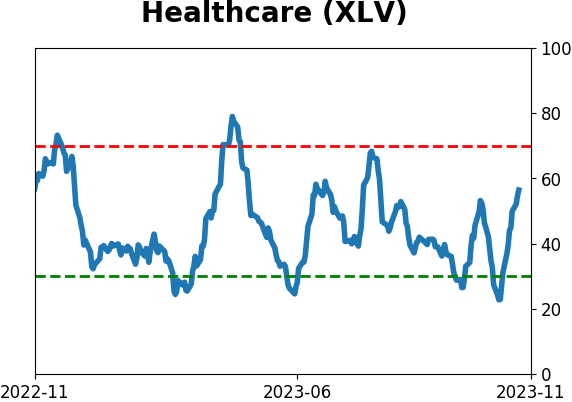
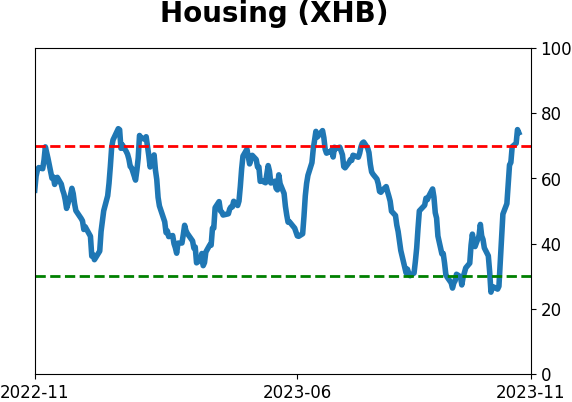
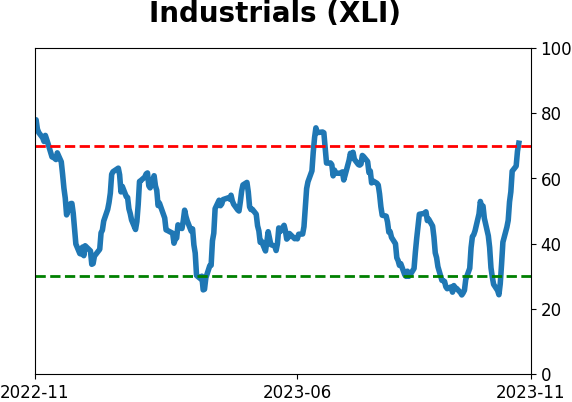
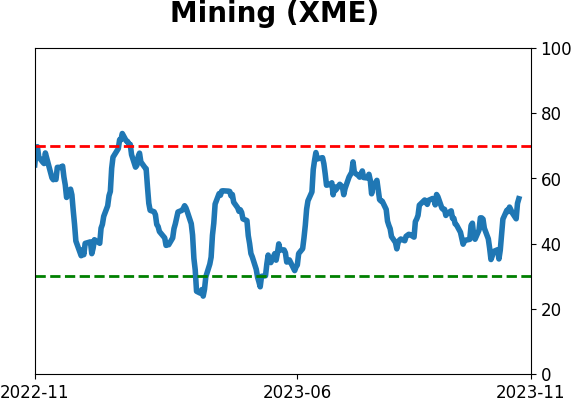
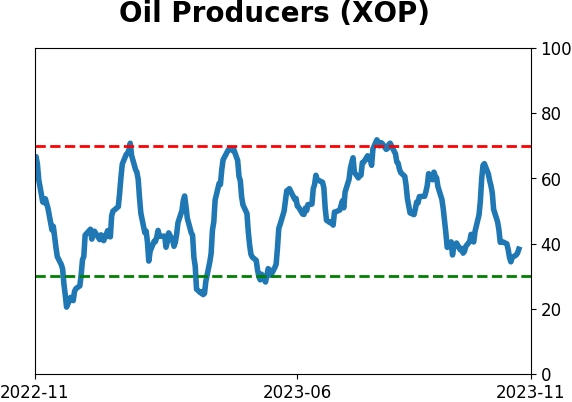
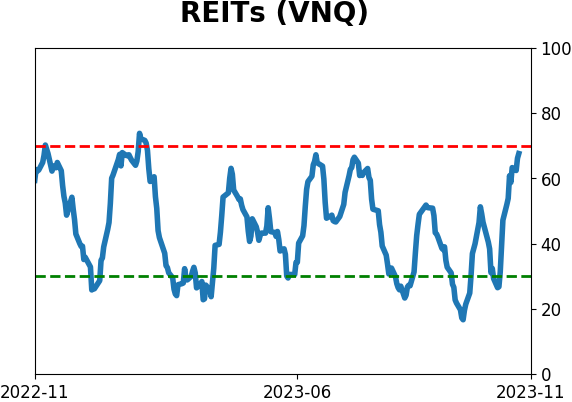
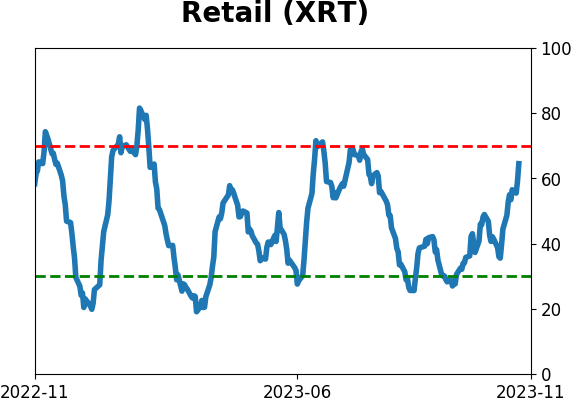
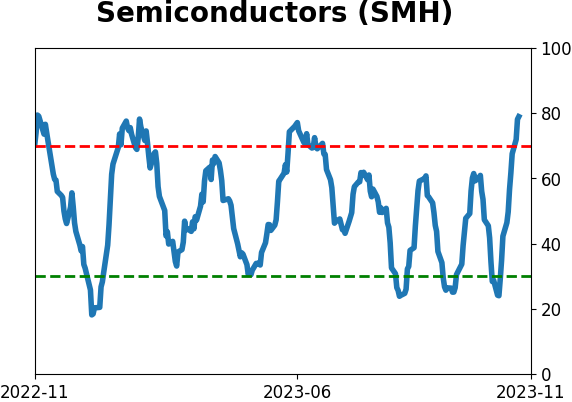
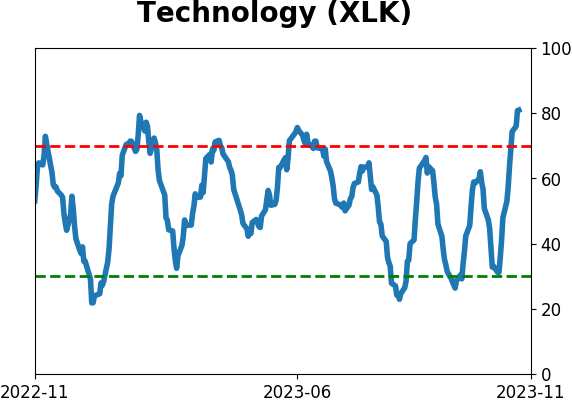
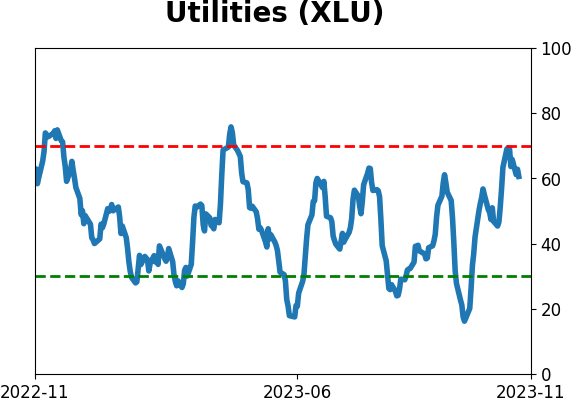
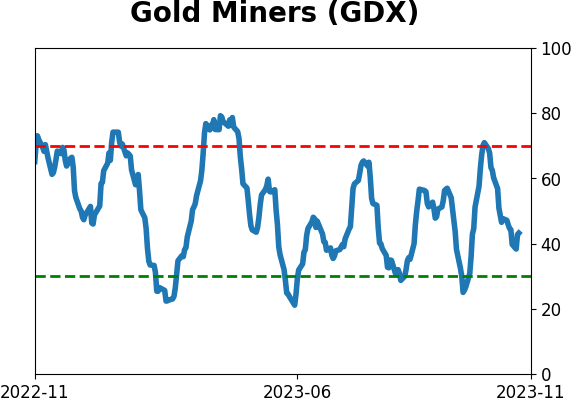
Sector ETF's - 10-Day Moving Average
|
|
|
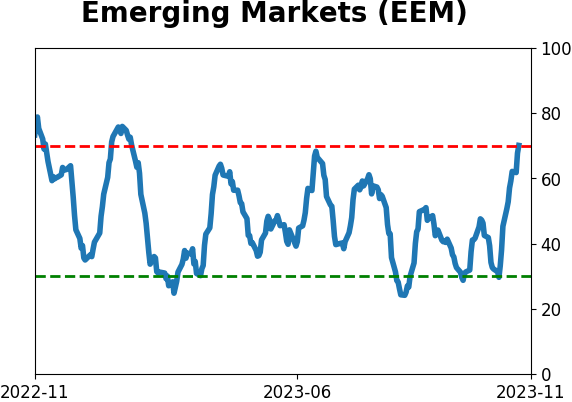
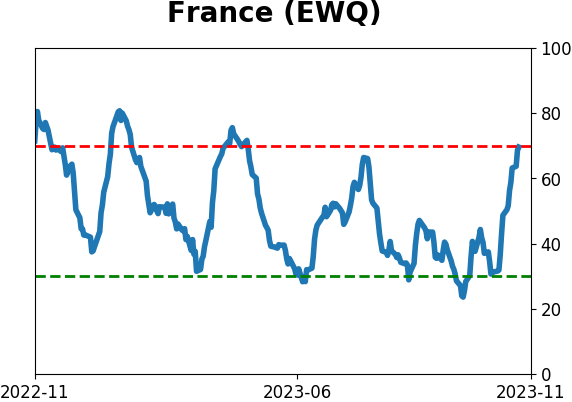
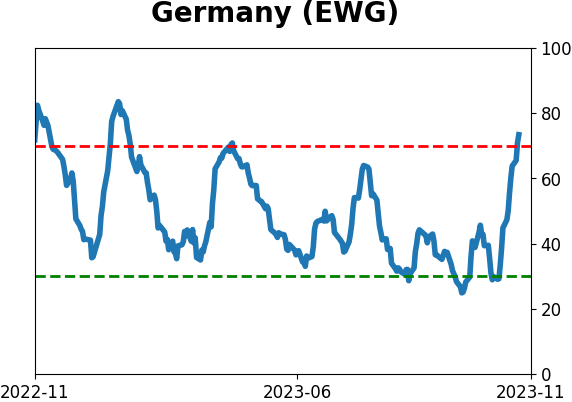
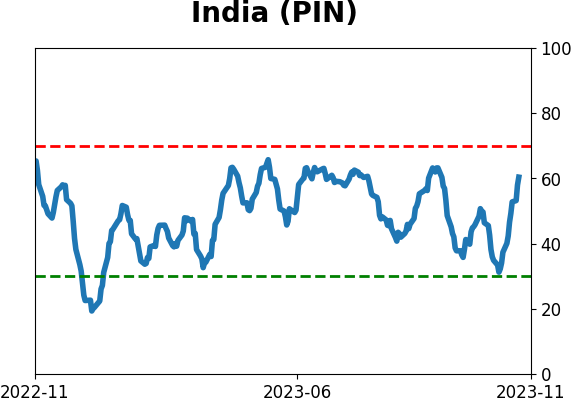
Country ETF's - 10-Day Moving Average
|
|
|
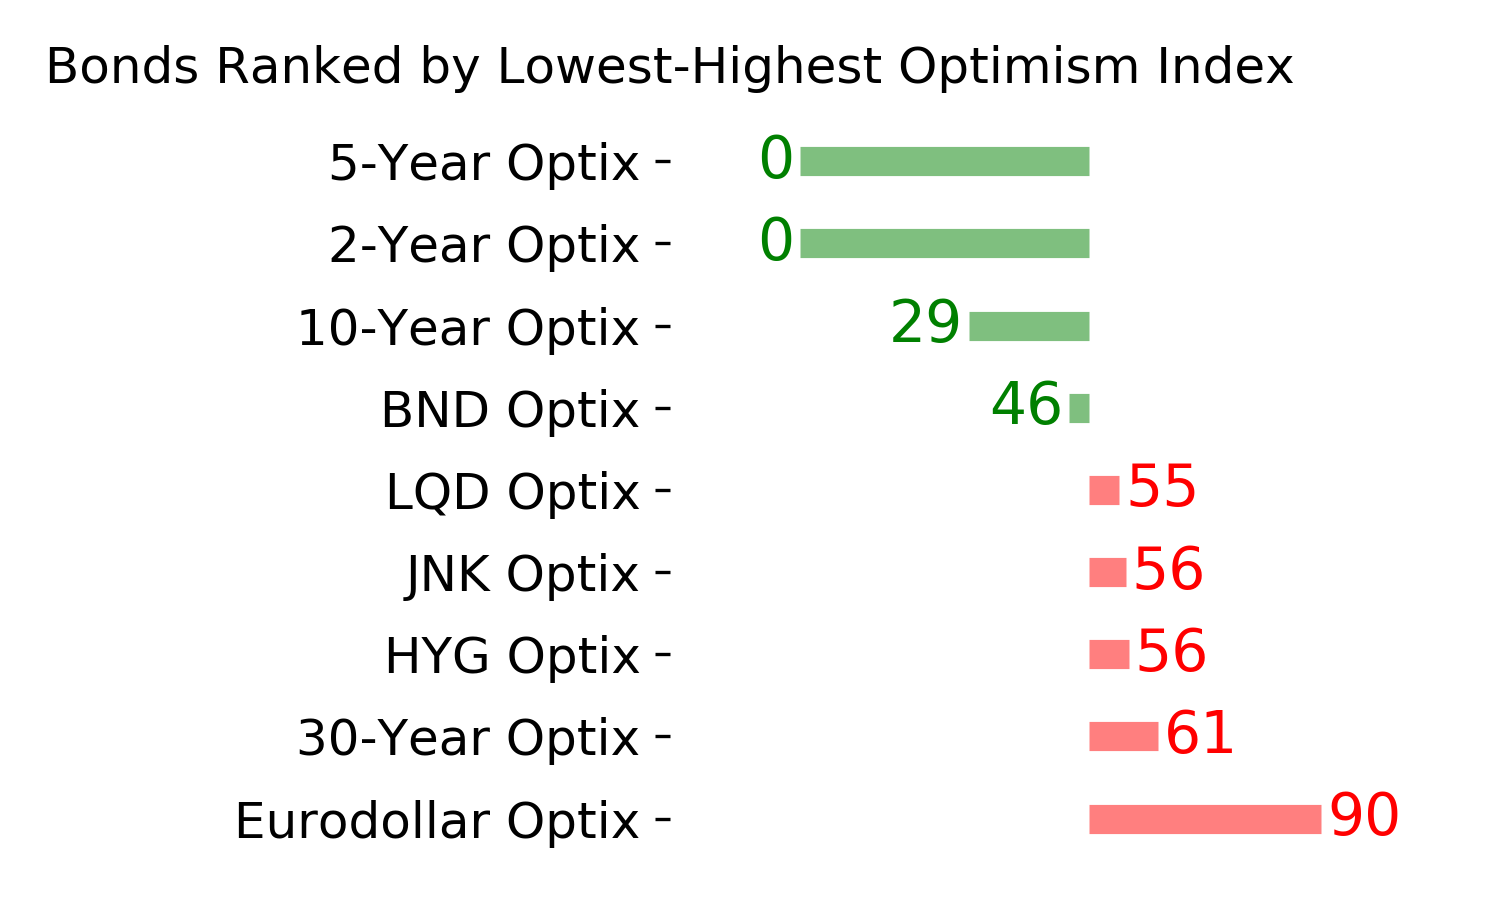
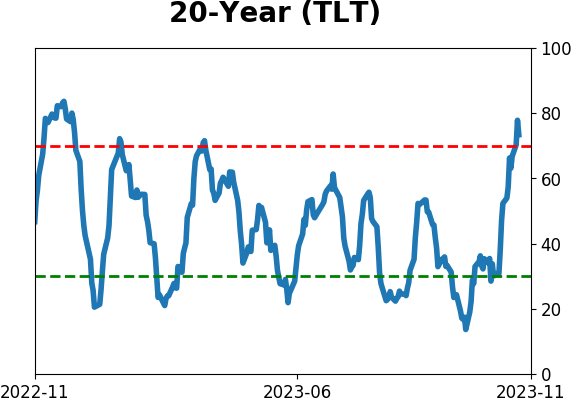
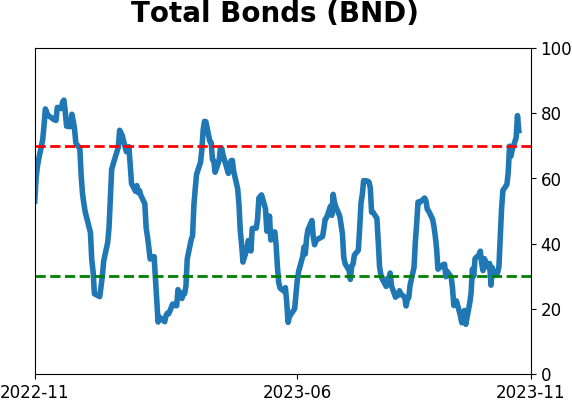
Bond ETF's - 10-Day Moving Average
|
|
|
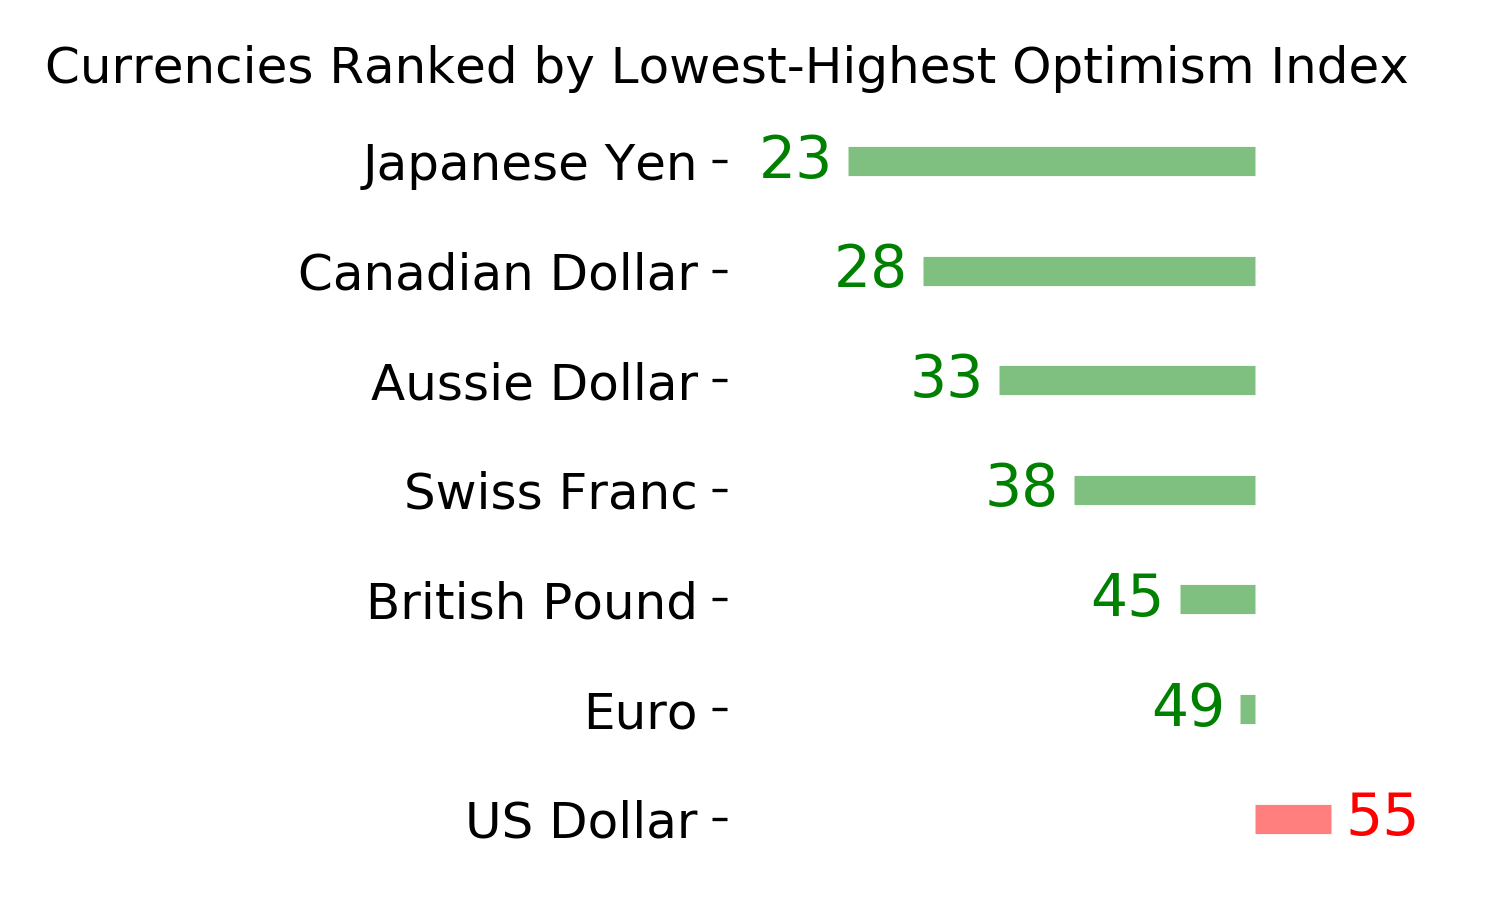
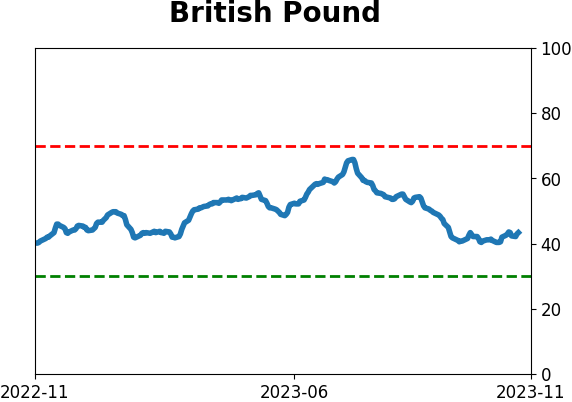
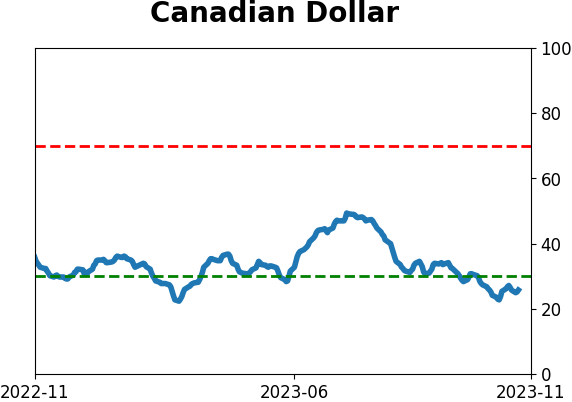
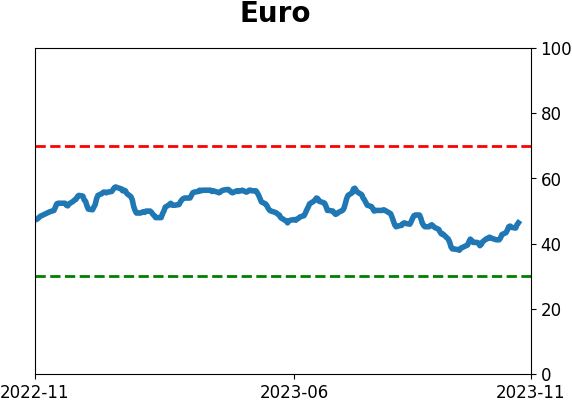
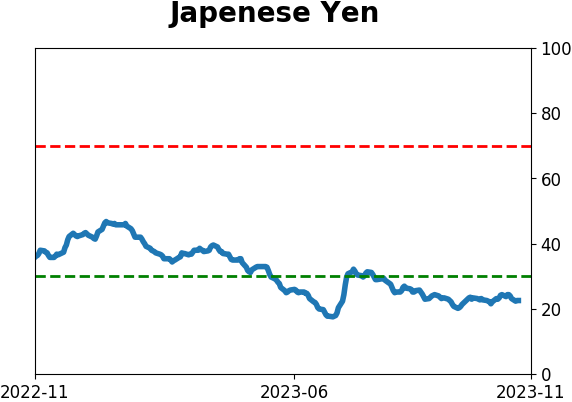
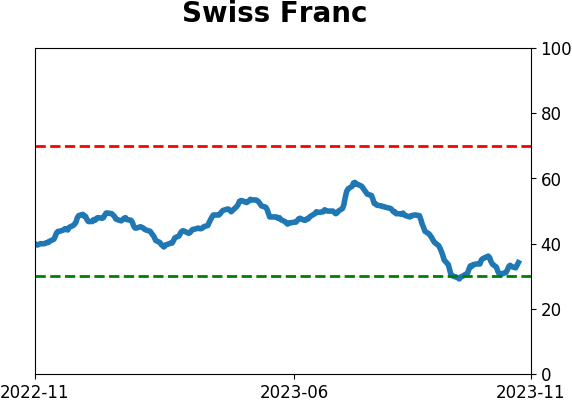
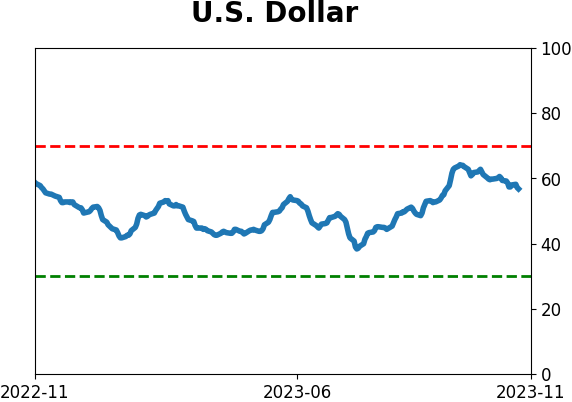
Currency ETF's - 5-Day Moving Average
|
|
|
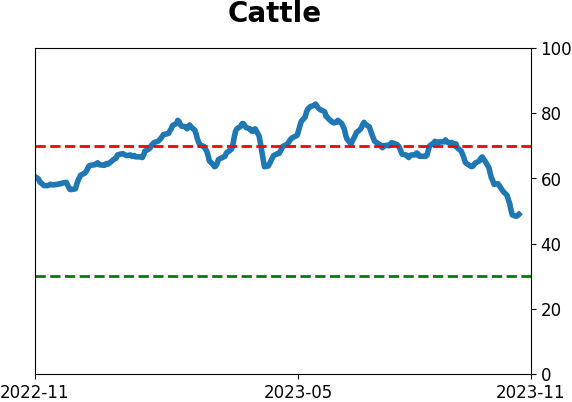
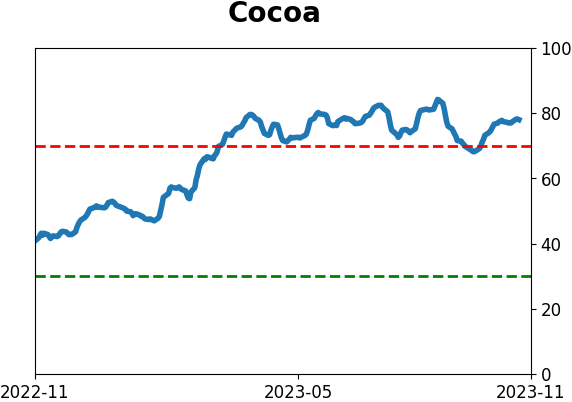
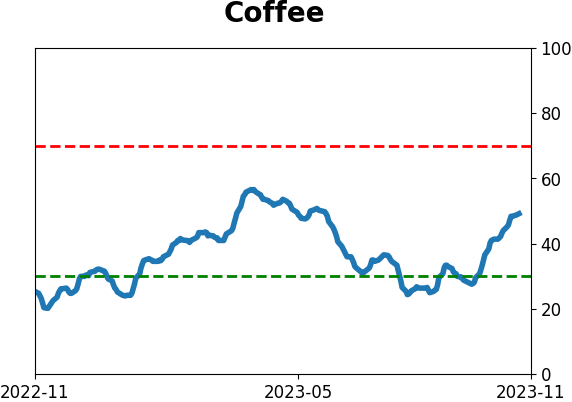
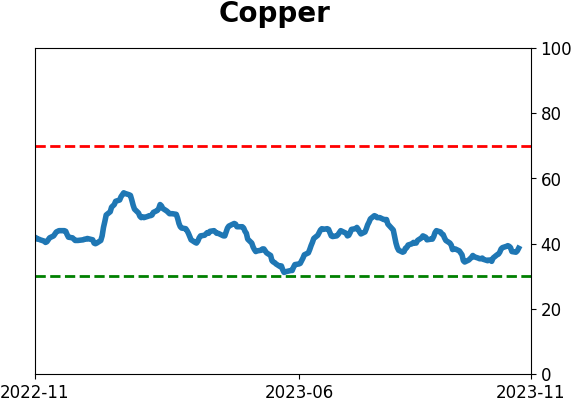
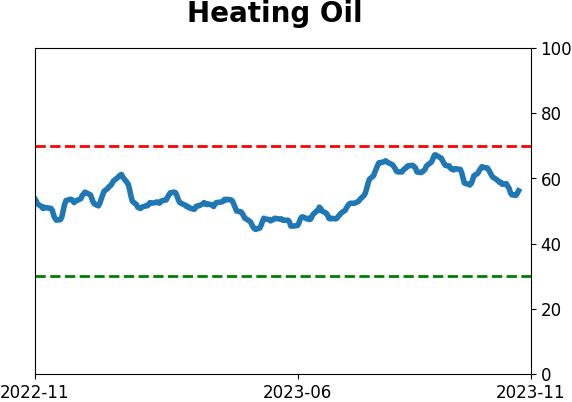
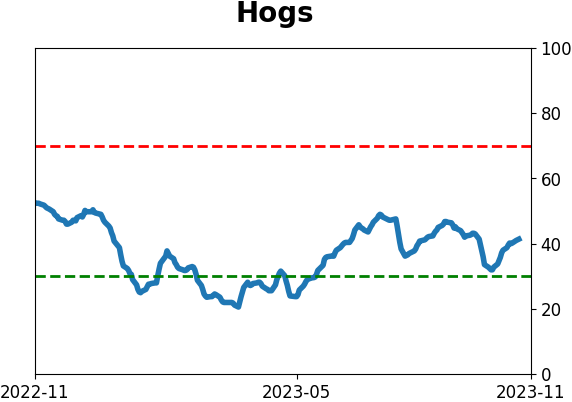
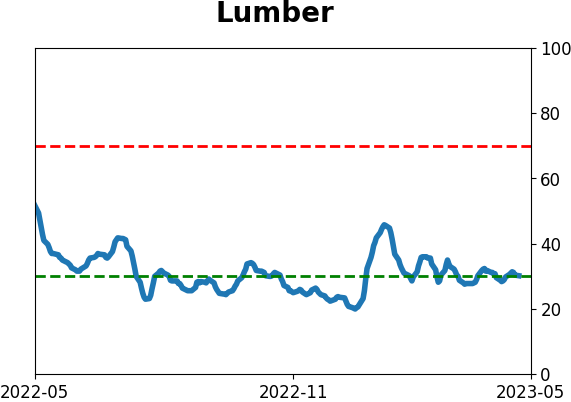
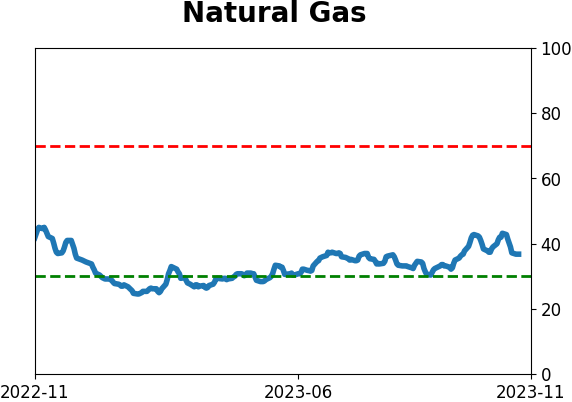
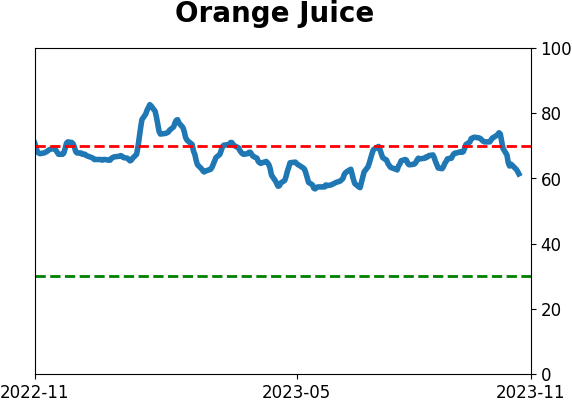
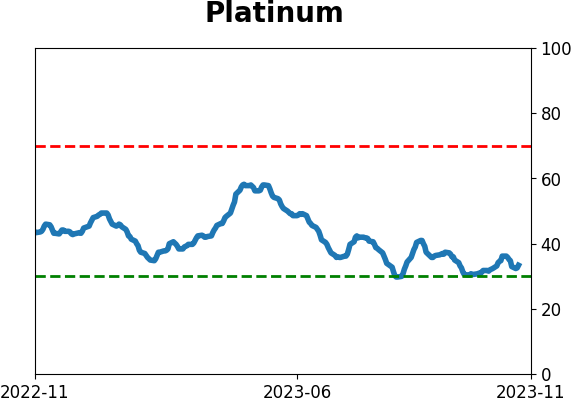
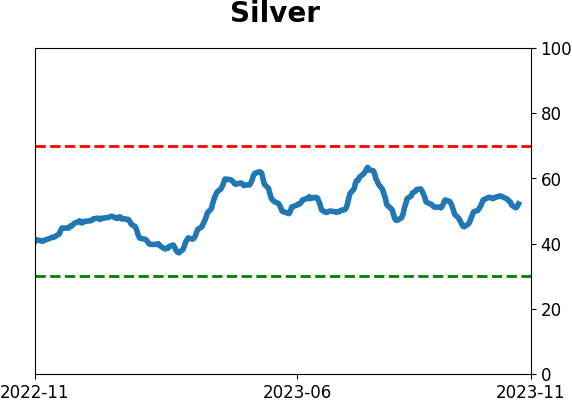
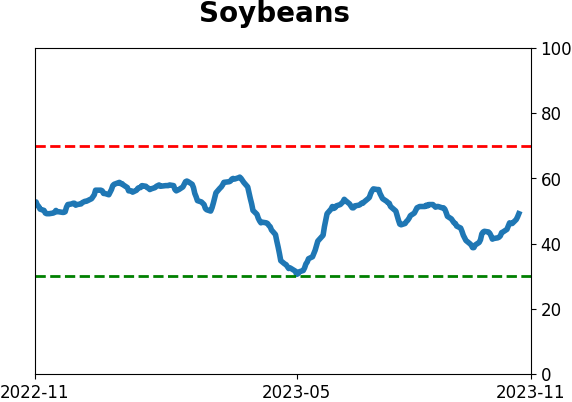
Commodity ETF's - 5-Day Moving Average
|
|