Headlines
|
|
More evidence of consumer depression:
Over the past 6 months, U.S. consumers have become depressed about the current and future prospects of the economy. An average of four major parts of the University of Michigan survey is now the lowest in history. Other low readings preceded (mostly) excellent returns in stocks, especially Small-cap and Value stocks.
|
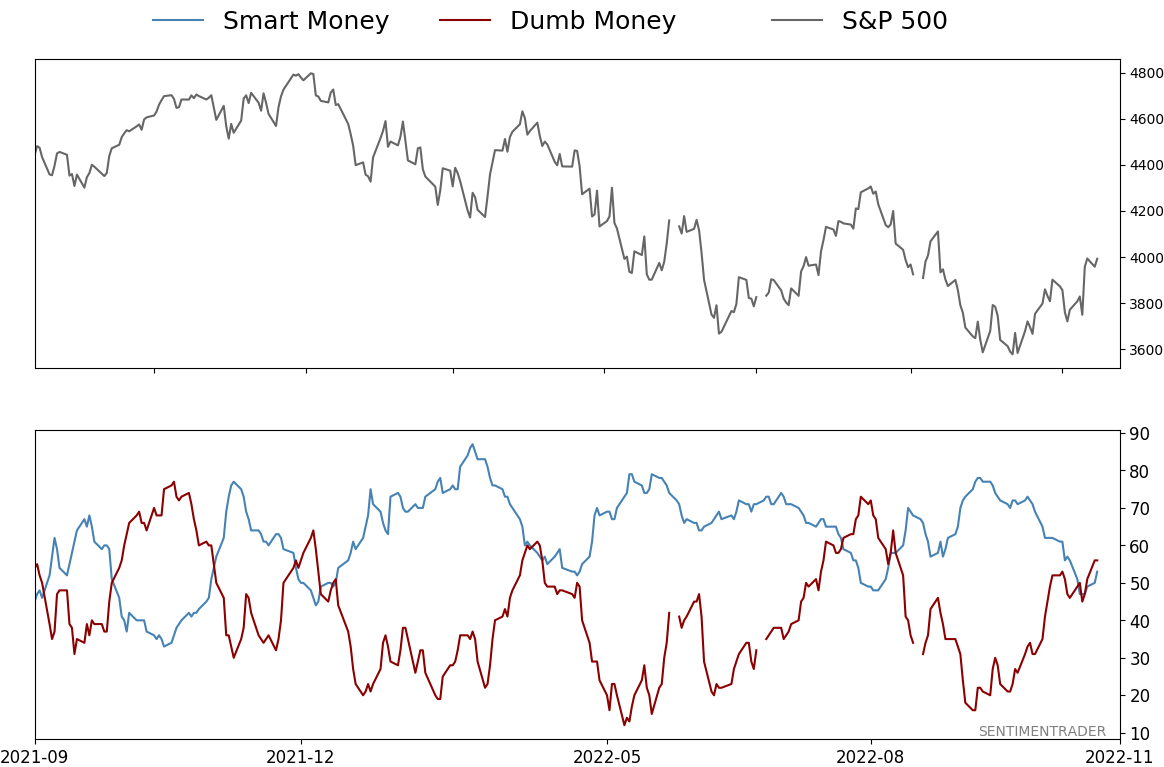
Smart / Dumb Money Confidence
|
Smart Money Confidence: 53%
Dumb Money Confidence: 56%
|
|
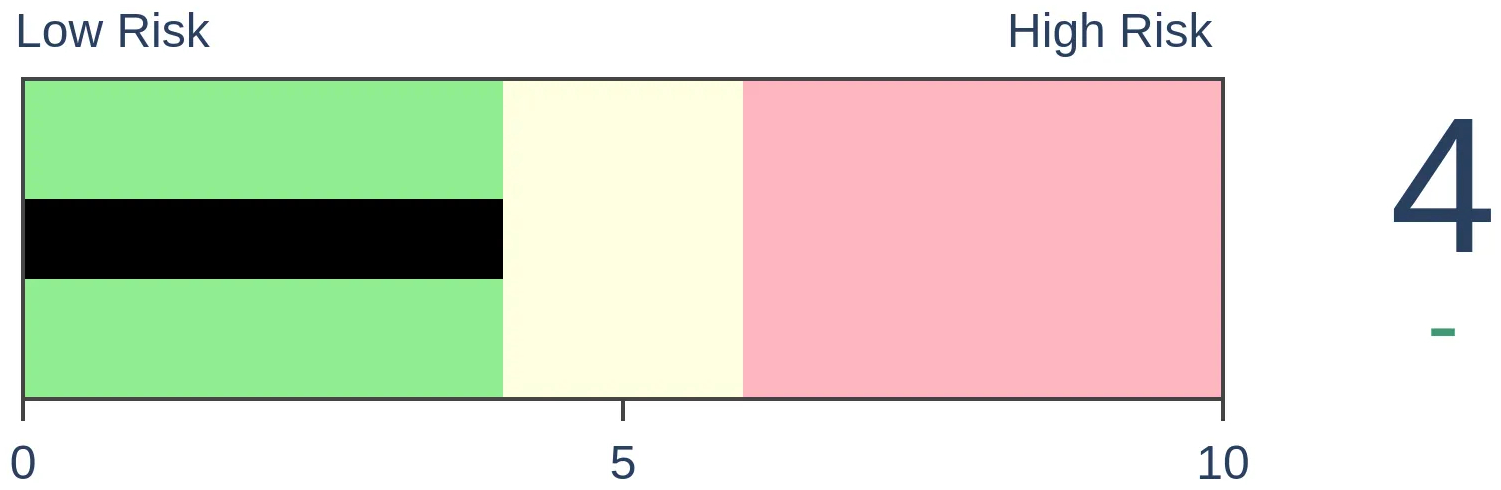
Risk Levels
Stocks Short-Term
|
Stocks Medium-Term

|
|
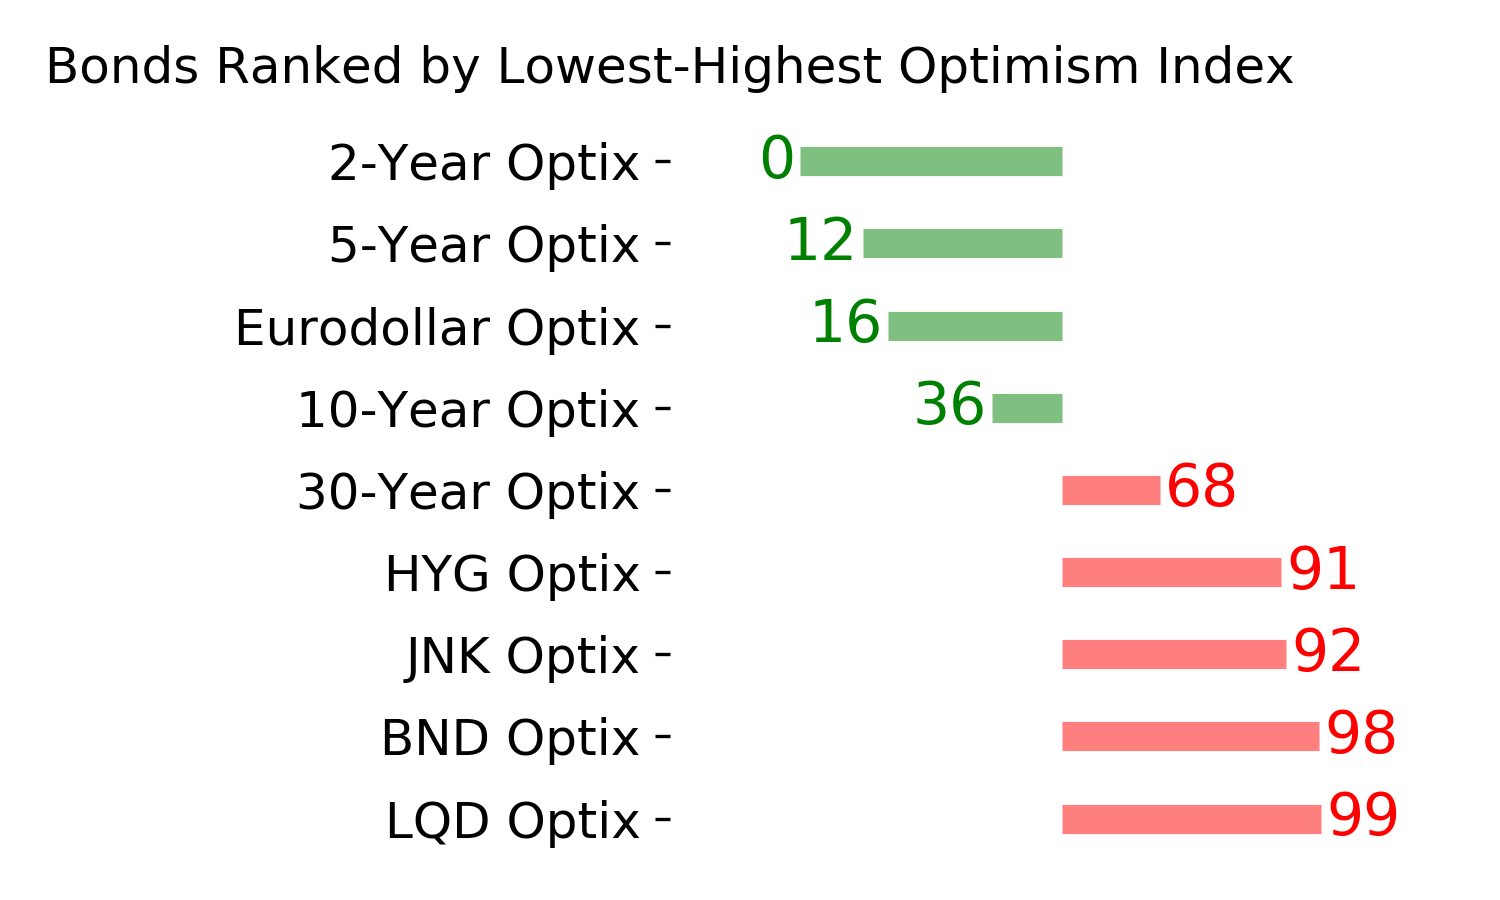
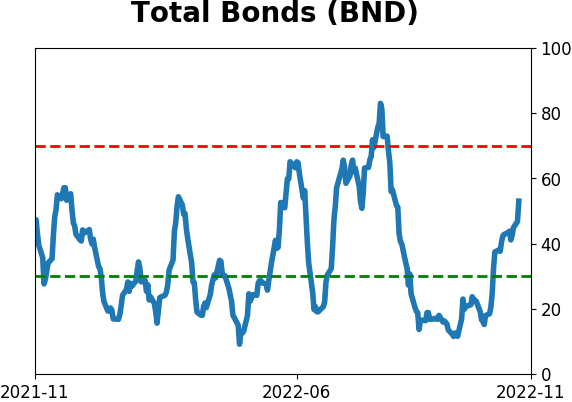
Bonds
|
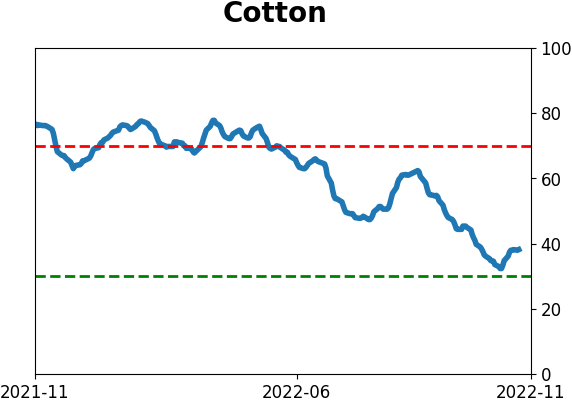
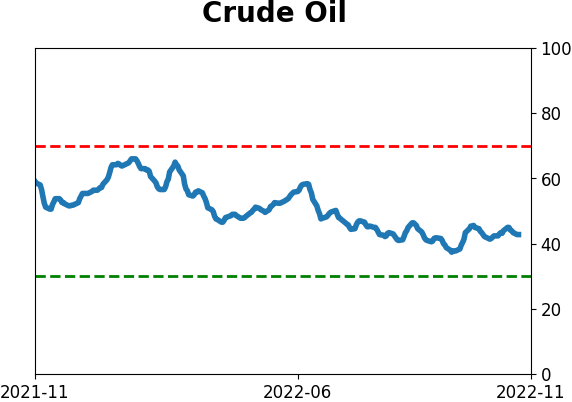
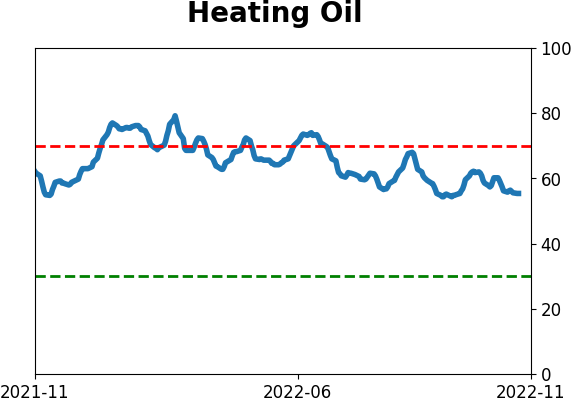
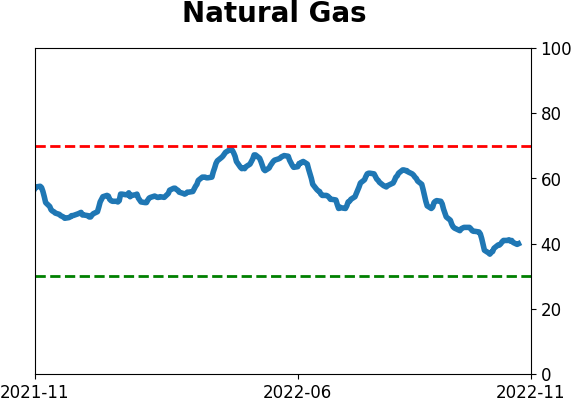
Crude Oil

|
|
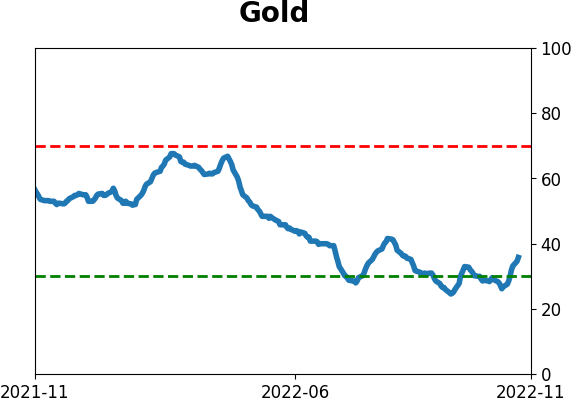
Gold

|
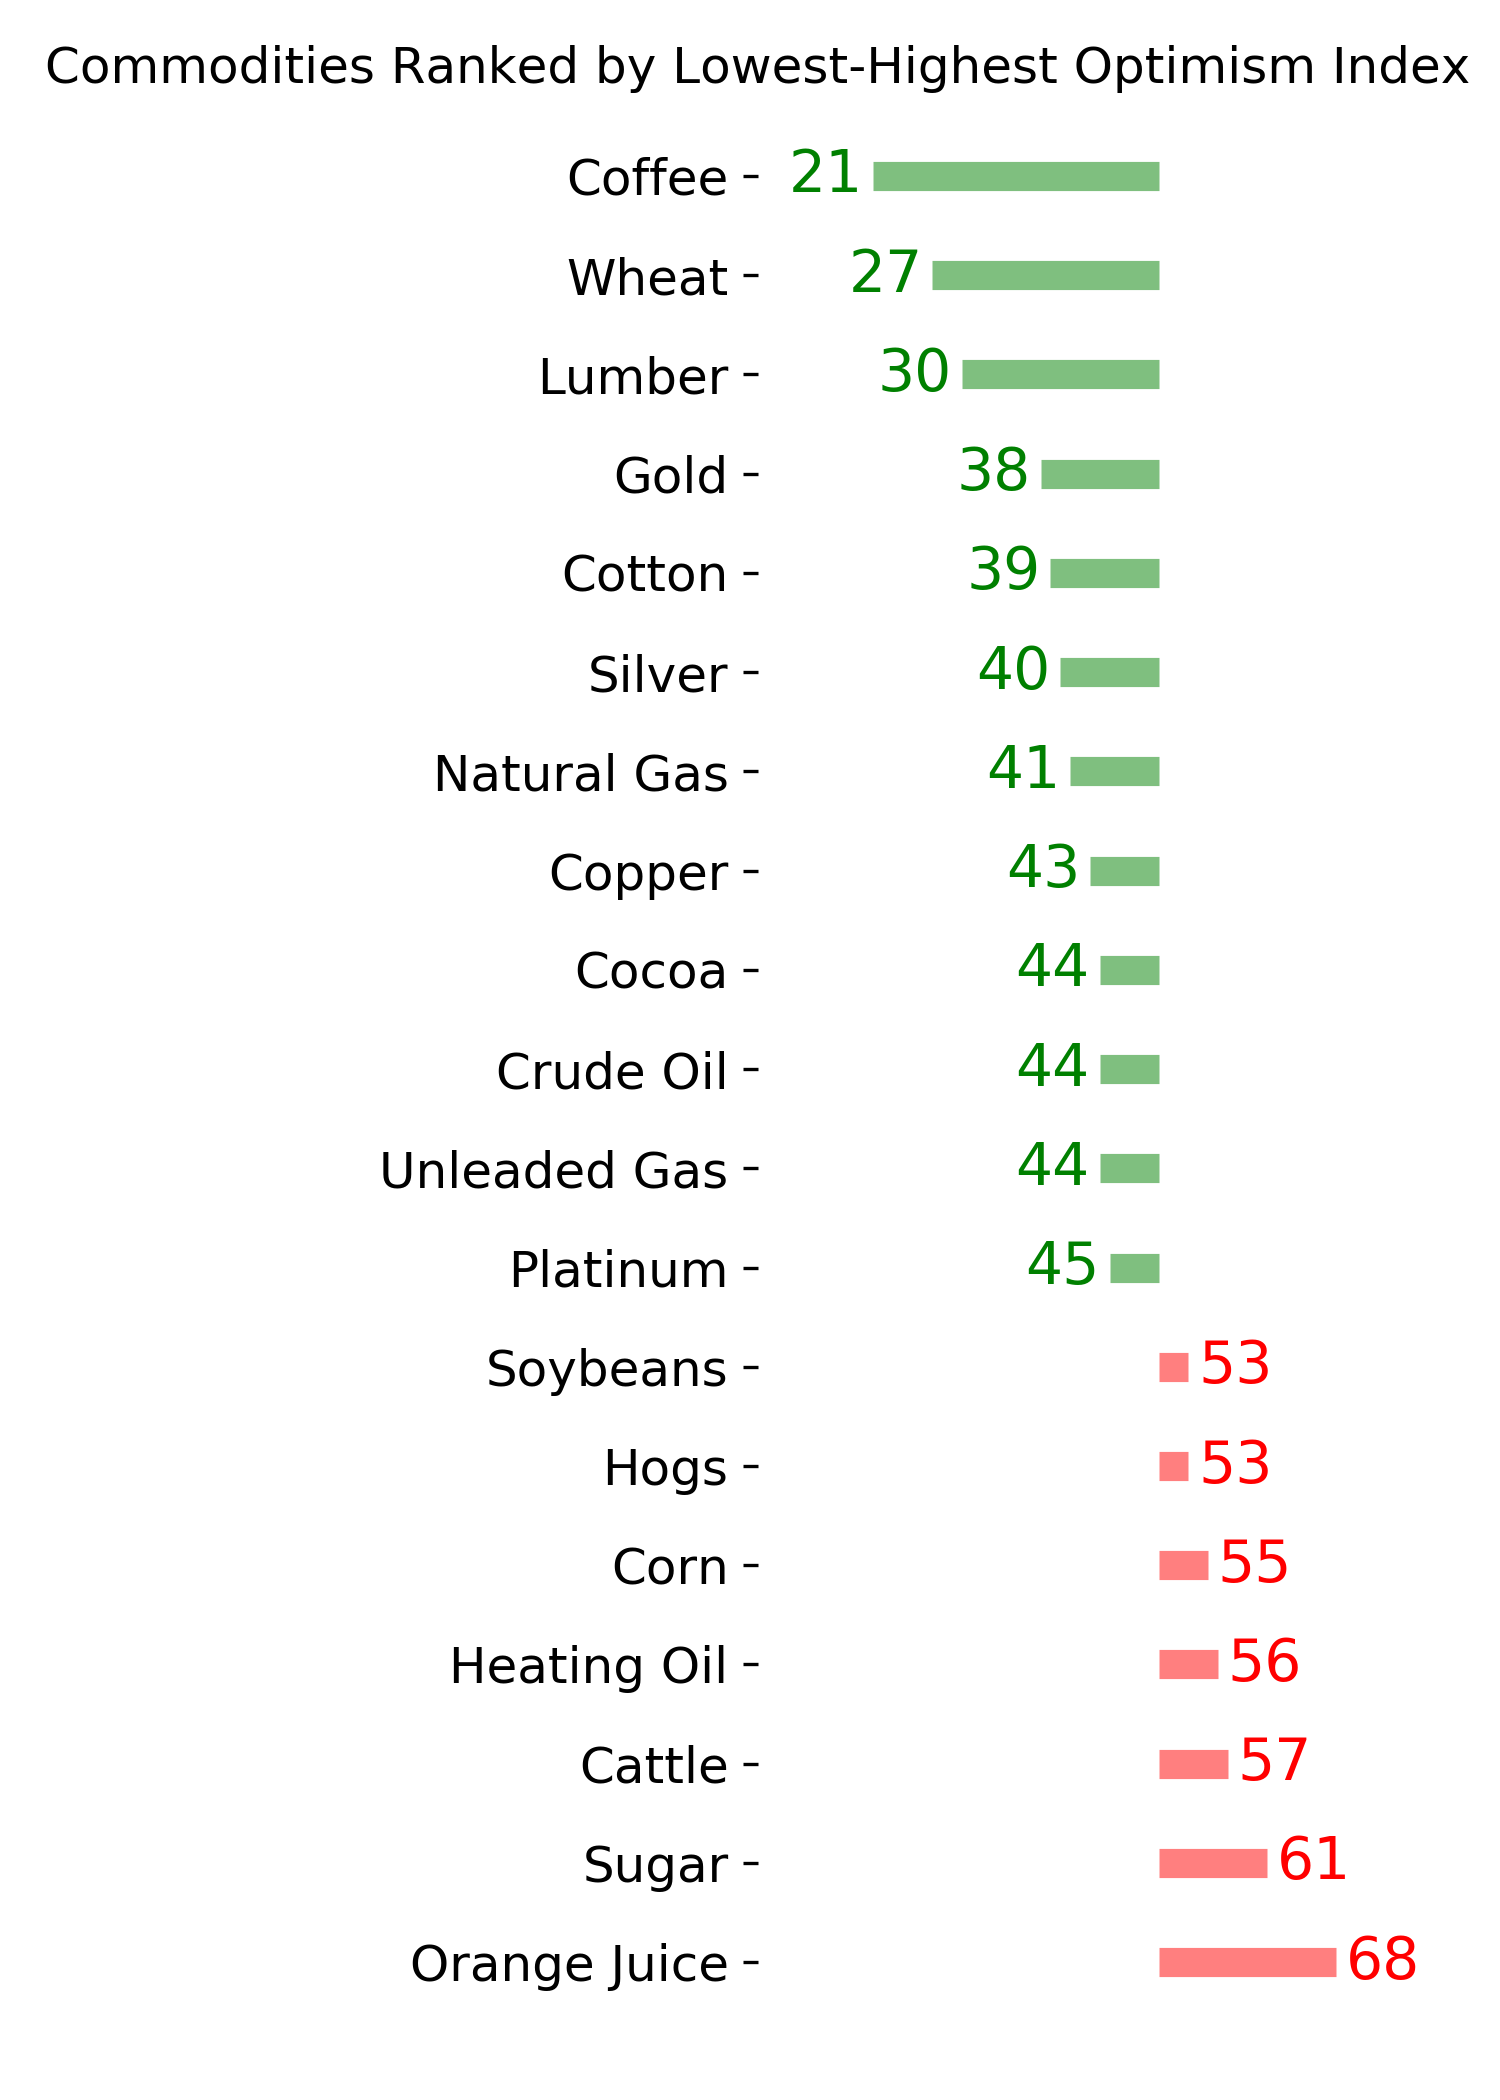
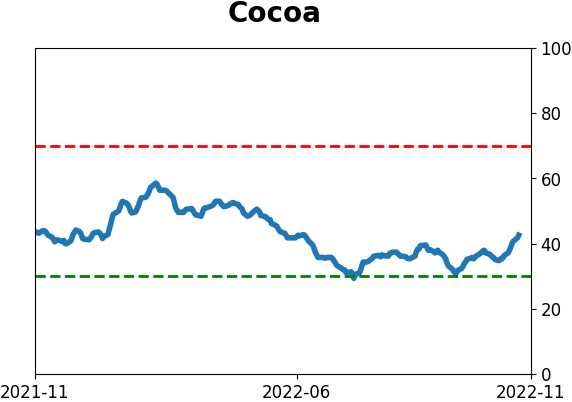
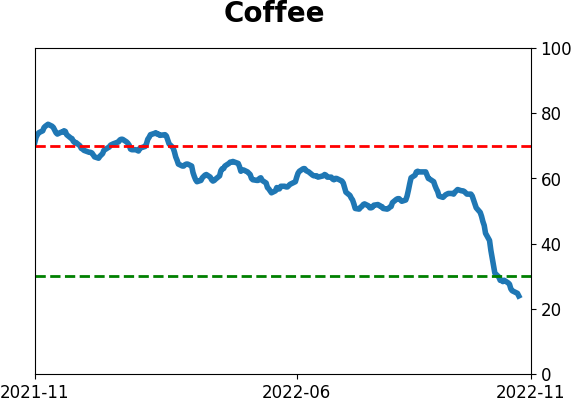
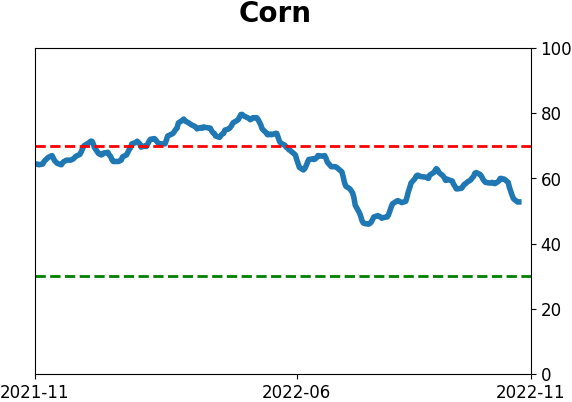
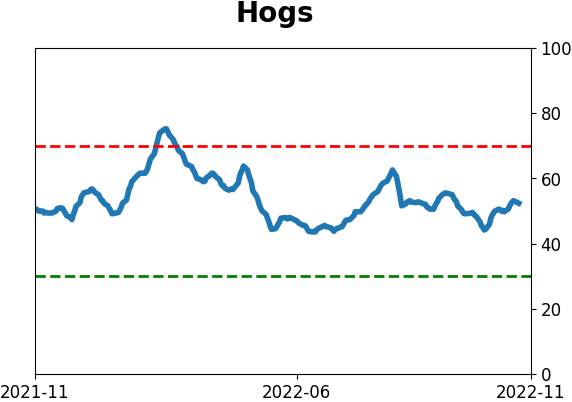
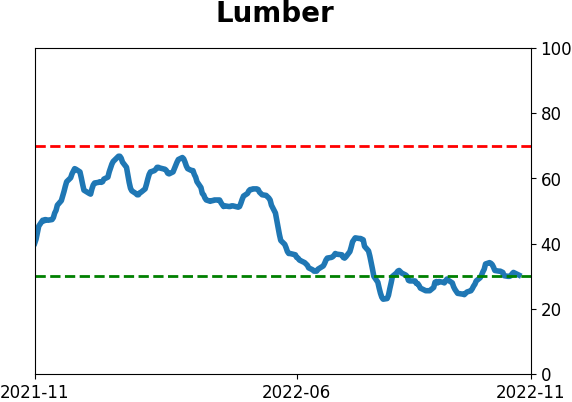
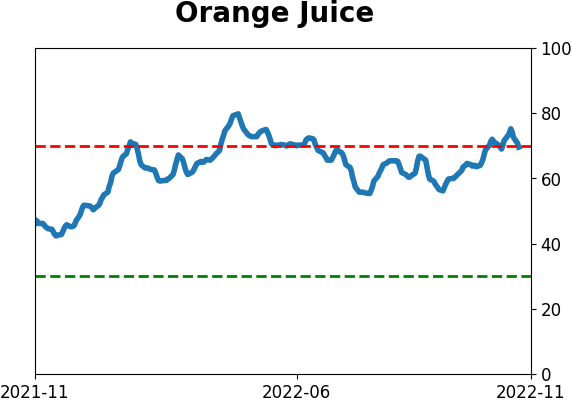
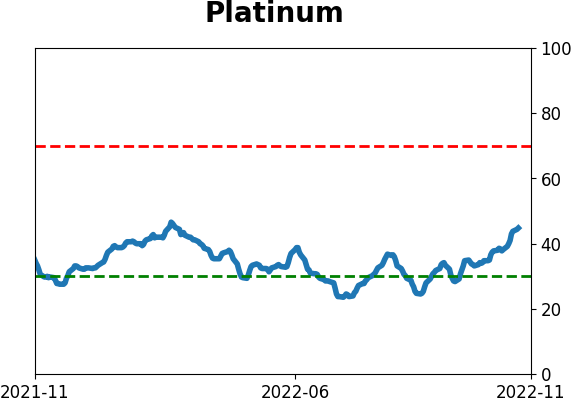
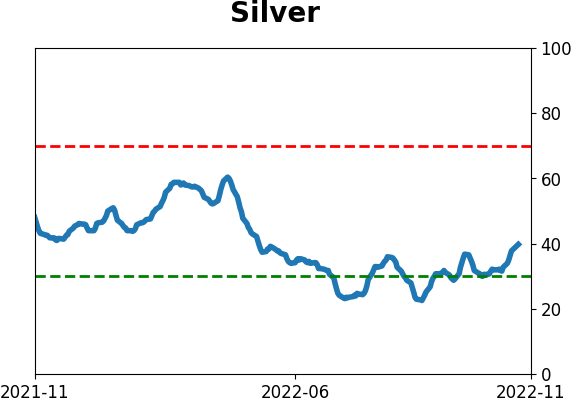
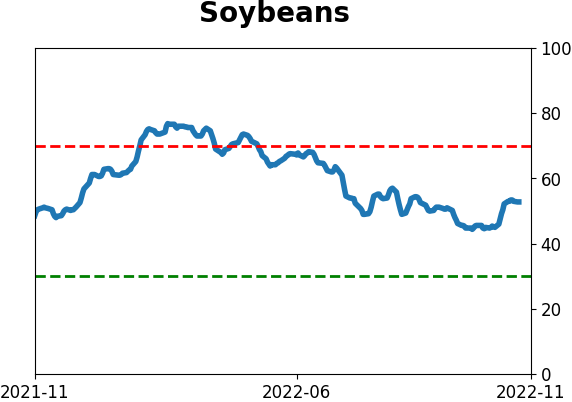
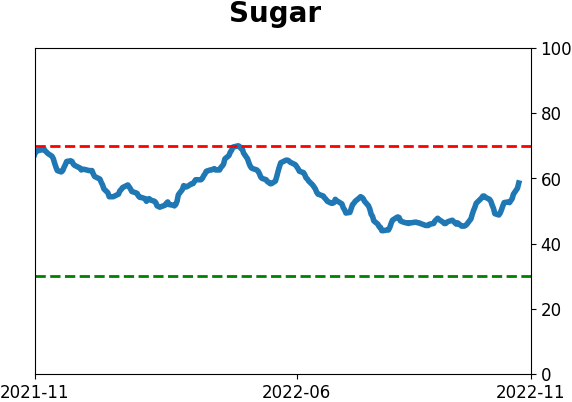
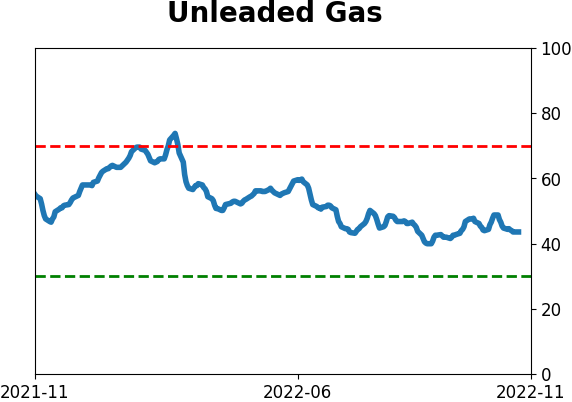
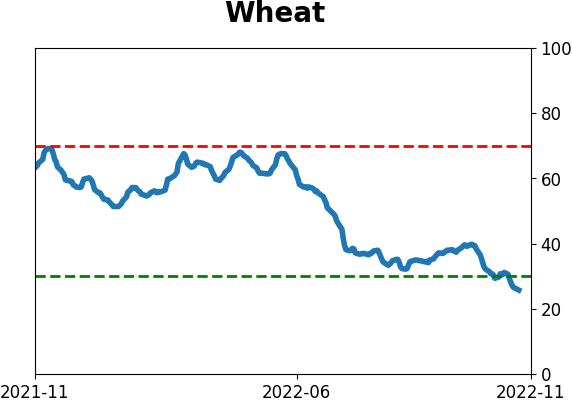
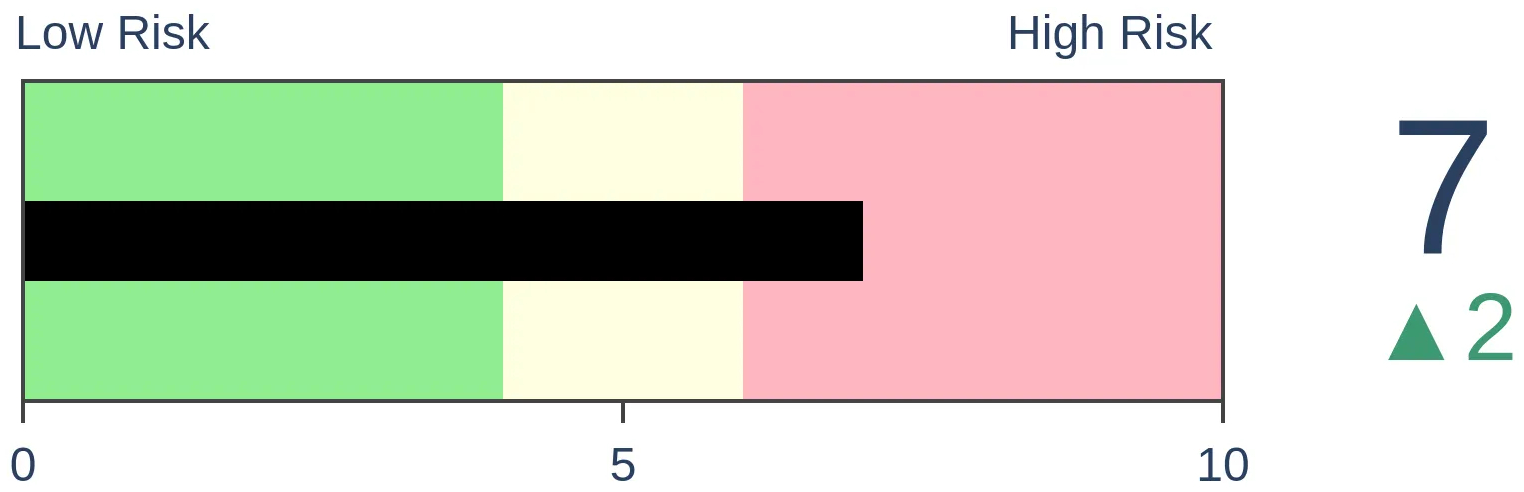
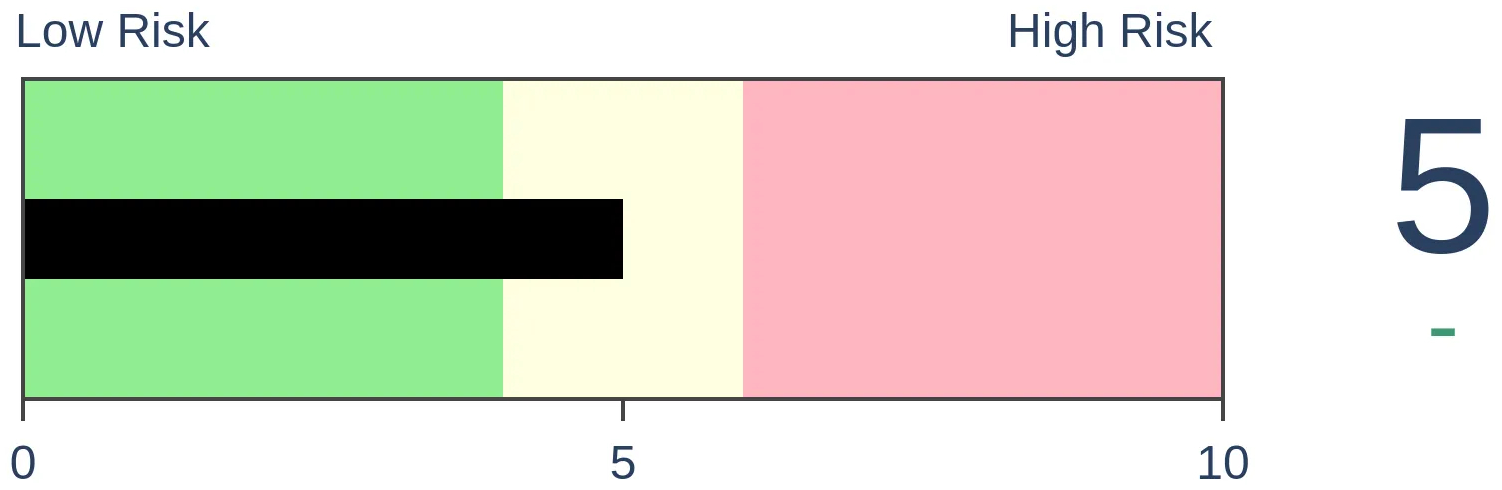
Agriculture
|
|
Research
By Jason Goepfert
BOTTOM LINE
Over the past 6 months, U.S. consumers have become depressed about the current and future prospects of the economy. An average of four major parts of the University of Michigan survey is now the lowest in history. Other low readings preceded (mostly) excellent returns in stocks, especially Small-cap and Value stocks.
FORECAST / TIMEFRAME
None
|
Key points:
- The latest University of Michigan survey on consumer sentiment showed depressed readings on present conditions
- The survey also showed deep pessimism about future conditions
- When an average of the survey questions got about this low, stocks tended to show excellent gains
Consumers are depressed about the present...and the future
The latest round of surveys on the American consumer by the University of Michigan showed more deterioration. These are not the official month-end readings, but there usually isn't too much of a change.
One of the notable aspects of the poll is that on pretty much all the questions, consumers are discouraged, including about their current condition and outlook for the future.
There are four main parts of the survey that we've focused on, shown in the chart below. Two (Sentiment and Current Conditions) are focused on the here and now, while two (Expectations and Business Conditions) are more forward-looking. Across the board, they're near the lowest levels in more than 40 years.
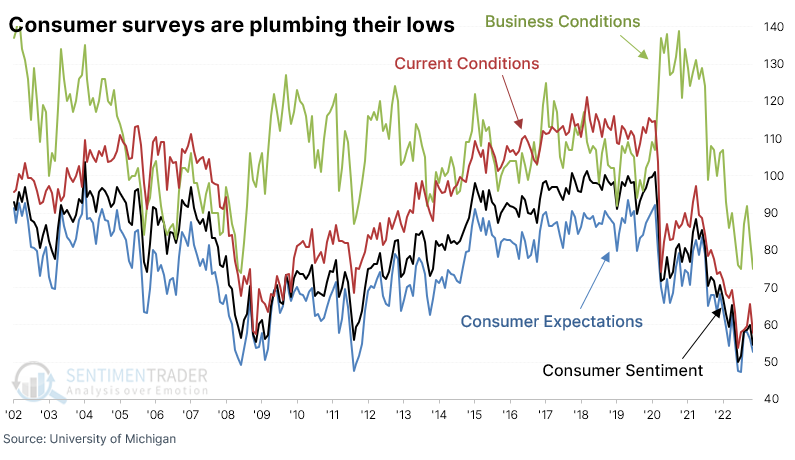
A six-month average of the four surveys has now dropped to the lowest on record. It exceeds the worst pessimism during the financial crisis, the early 1990s savings-and-loan debacle, and the late '70s period of general malaise. All were associated with recessions.
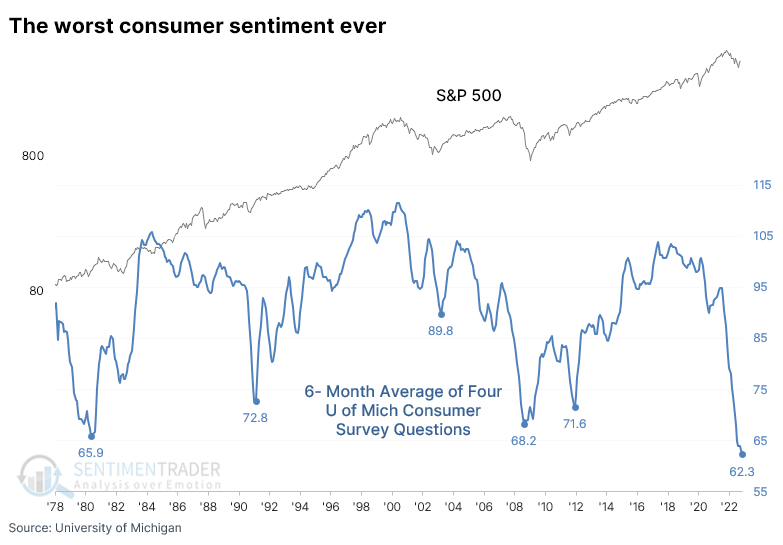
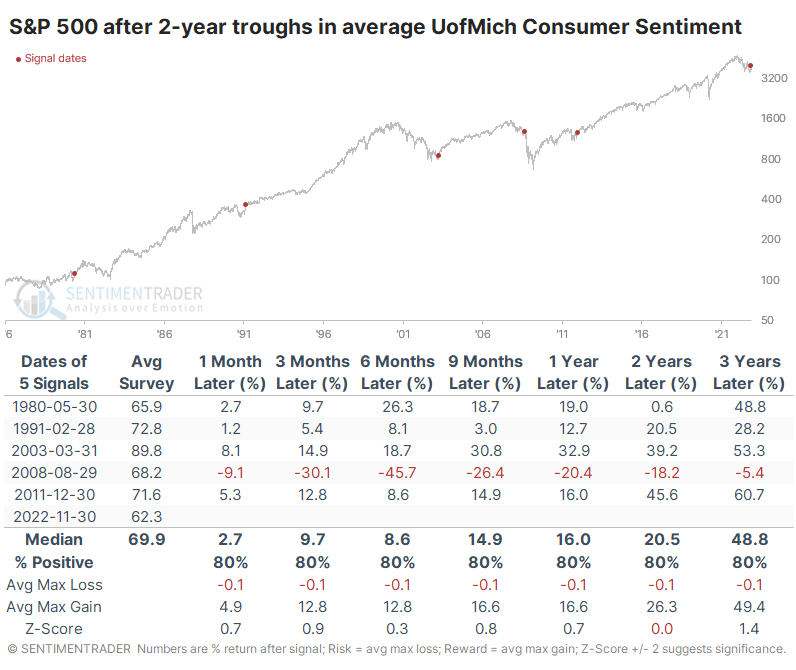
When the 6-month average of these surveys got this low, it was early during the financial crisis, and investors in the S&P 500 were still nursing losses three years later not including dividends. The others, however, coincided with the ends of bear markets or just after. Given that the 6-month average will now be dropping off low readings from June, it's almost certain to have formed a trough in November.
Depressed sentiment preceded good gains in Tech, Small-Caps, and Value
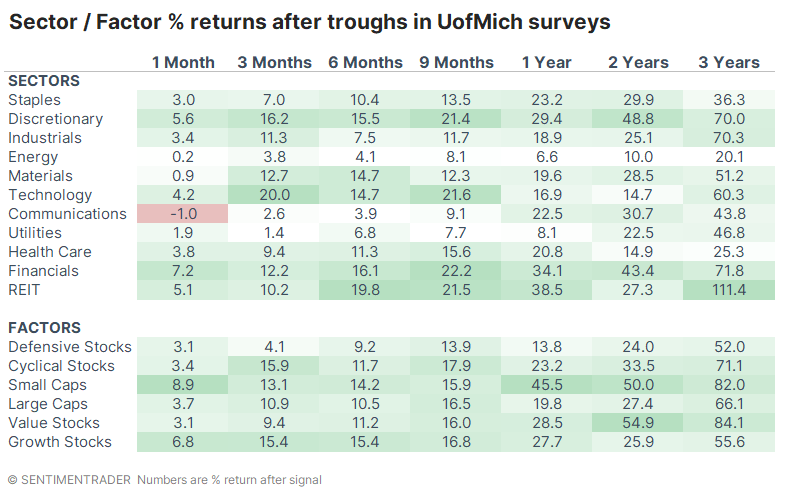
Among other indexes after these signals, the Nasdaq Composite enjoyed the highest average returns, followed by the small-cap Russell 2000. Other assets were mixed, but commodities generally fared poorly.
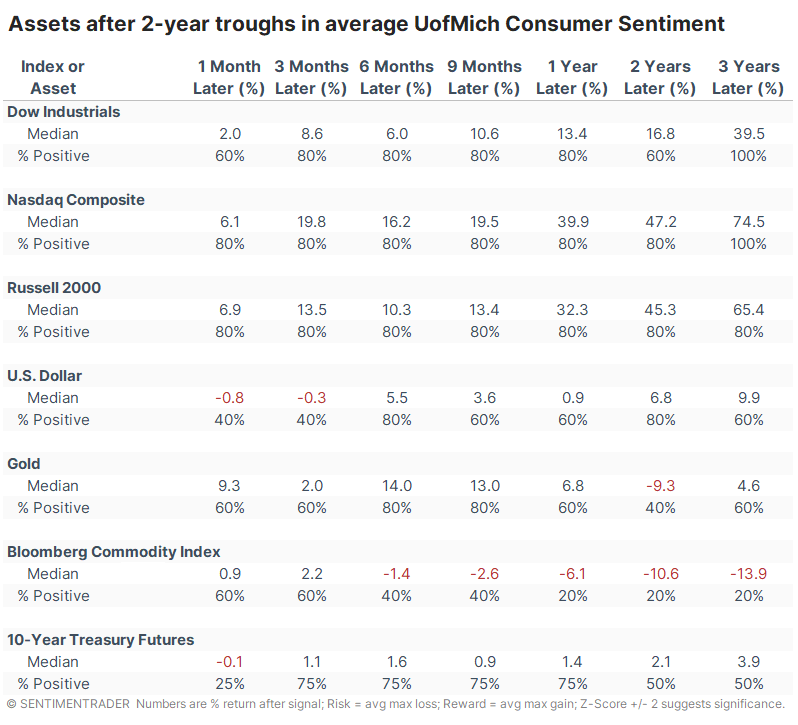
The best sector performers were Discretionary, Financials, Real Estate, and Technology. Small-caps showed the best average return a year later, at more than 45%. Value stocks enjoyed the best two-year return, nearly 55%.
What the research tells us...
Surveys of consumer sentiment in the U.S. and pretty much everywhere else are in the toilet. They've plunged to some of the lowest levels on record, if not the lowest. Issues other than stock prices drive these surveys, and they're not necessarily good timing mechanisms for the stock market - we can look at 2008 for evidence of that. But the wealth effect is real and a significant factor in how consumers feel about their finances. By the time it has gotten as depressed as it is now, lasting as long as it has now, the long-term returns of stocks have been consistently and strongly positive.
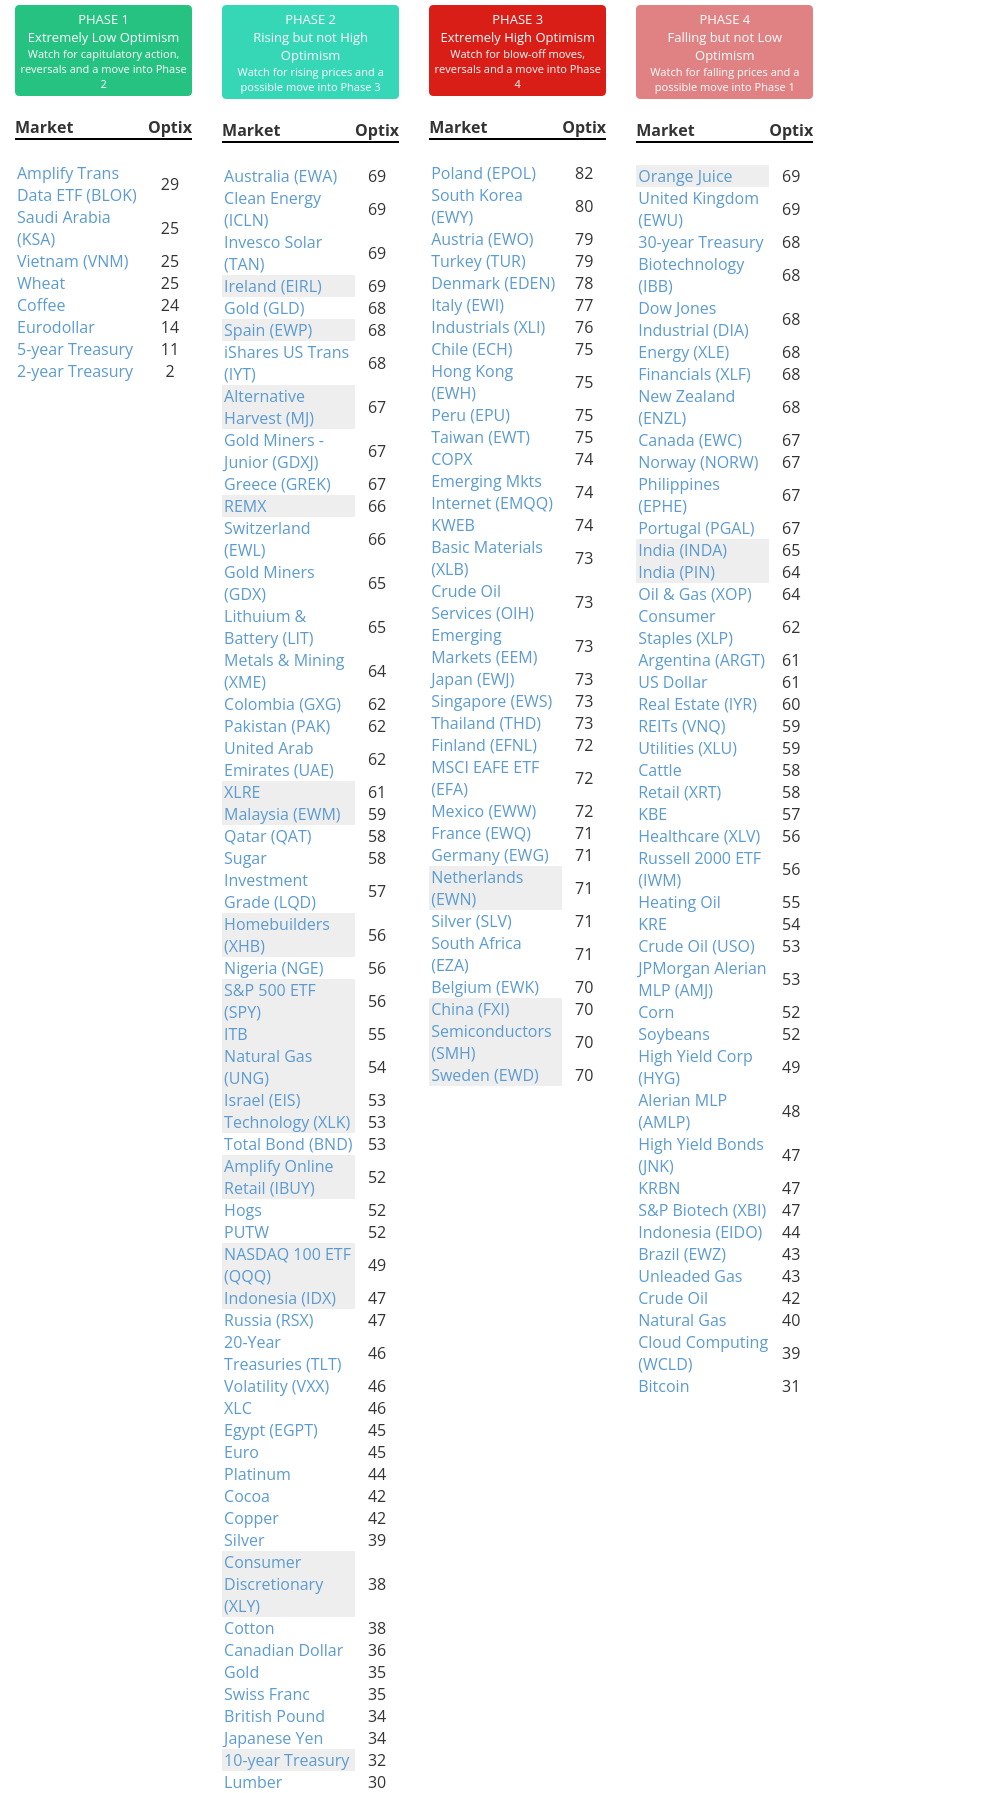
Indicators at Extremes
Phase Table
Ranks
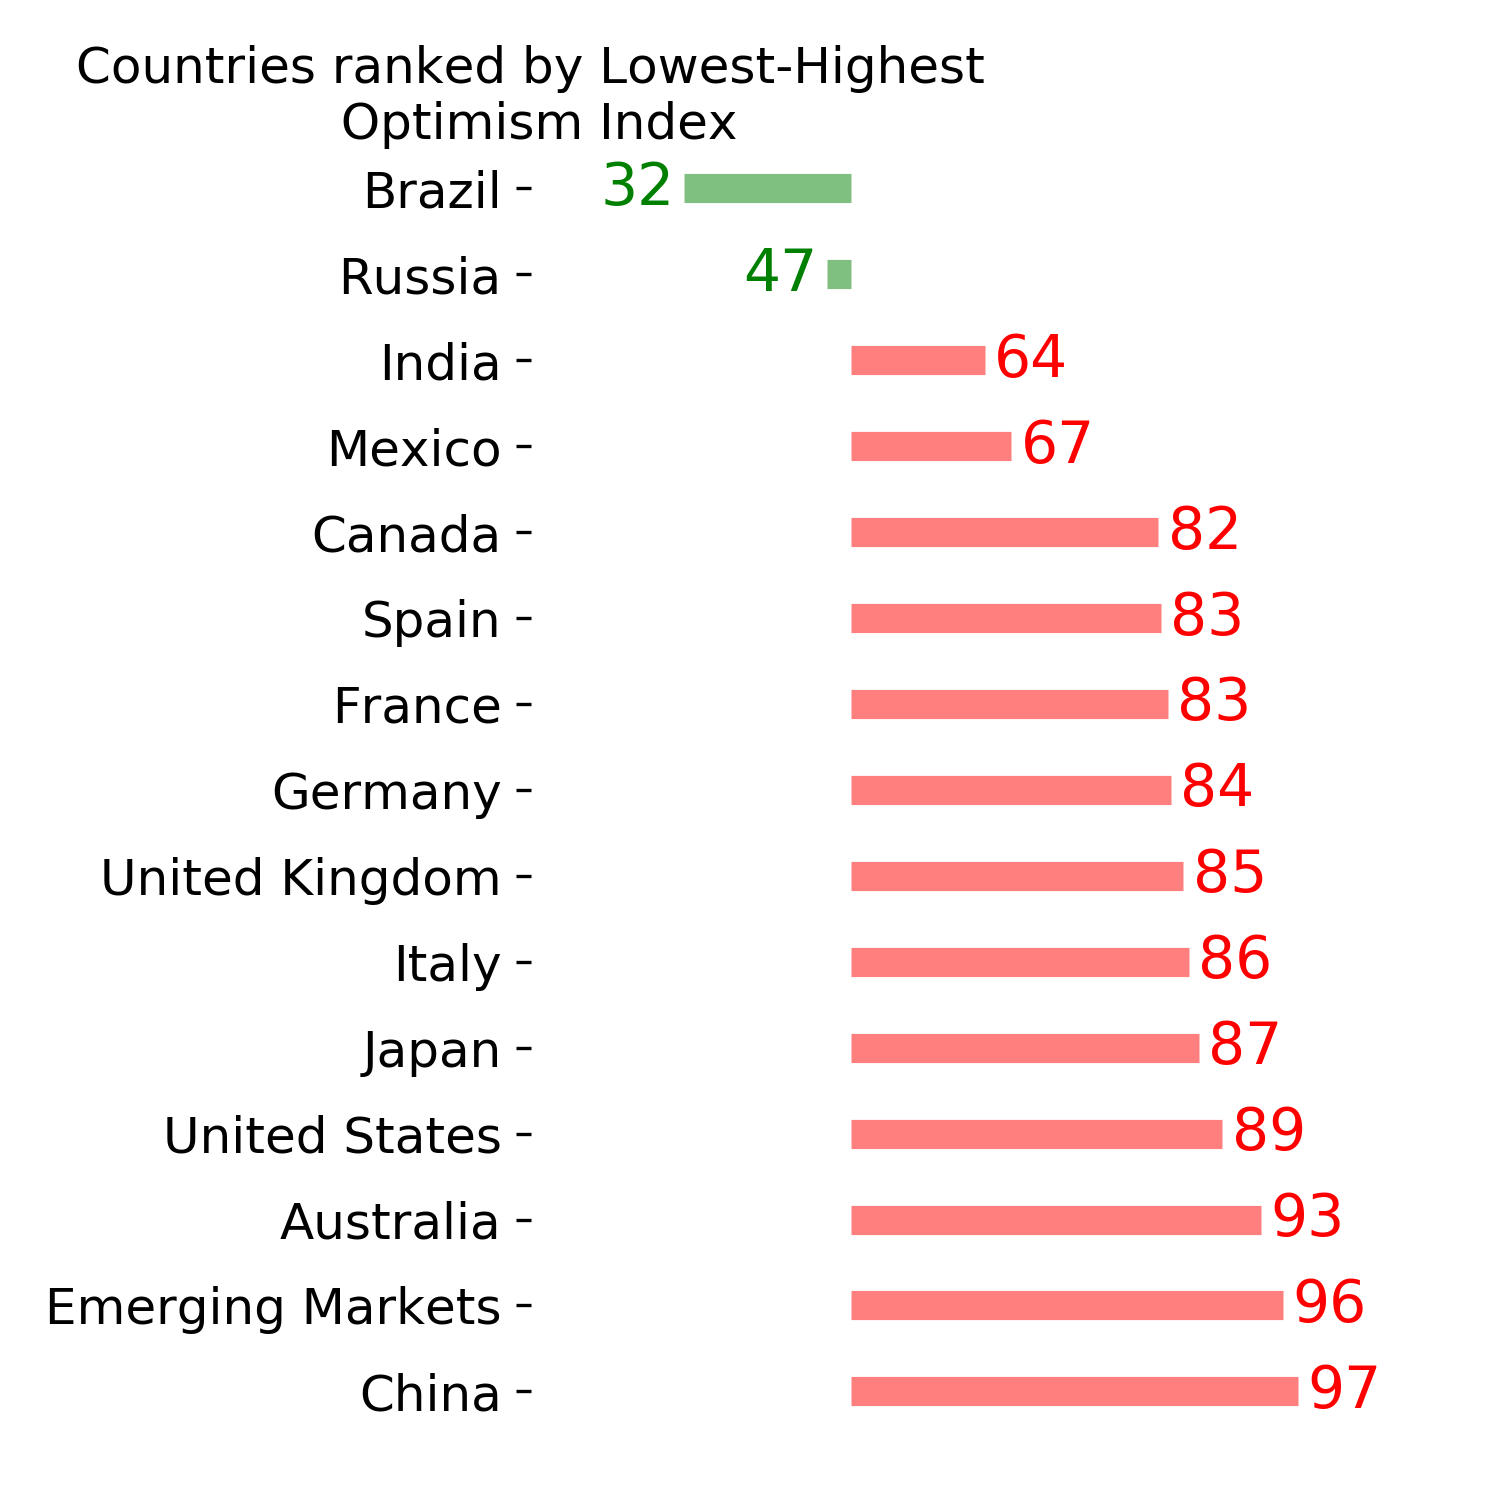
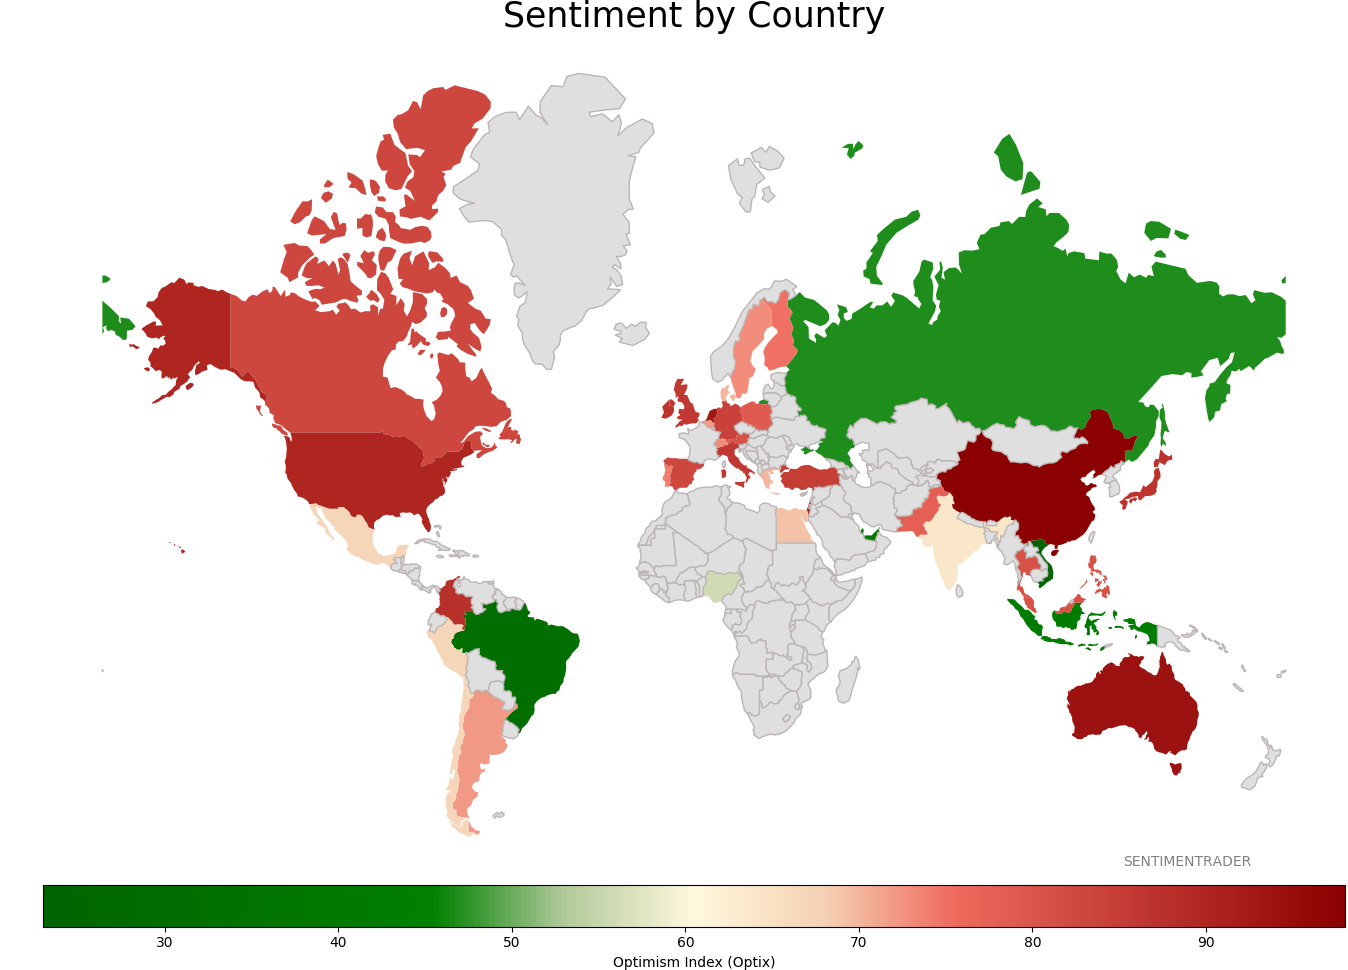
Sentiment Around The World
Optimism Index Thumbnails
|
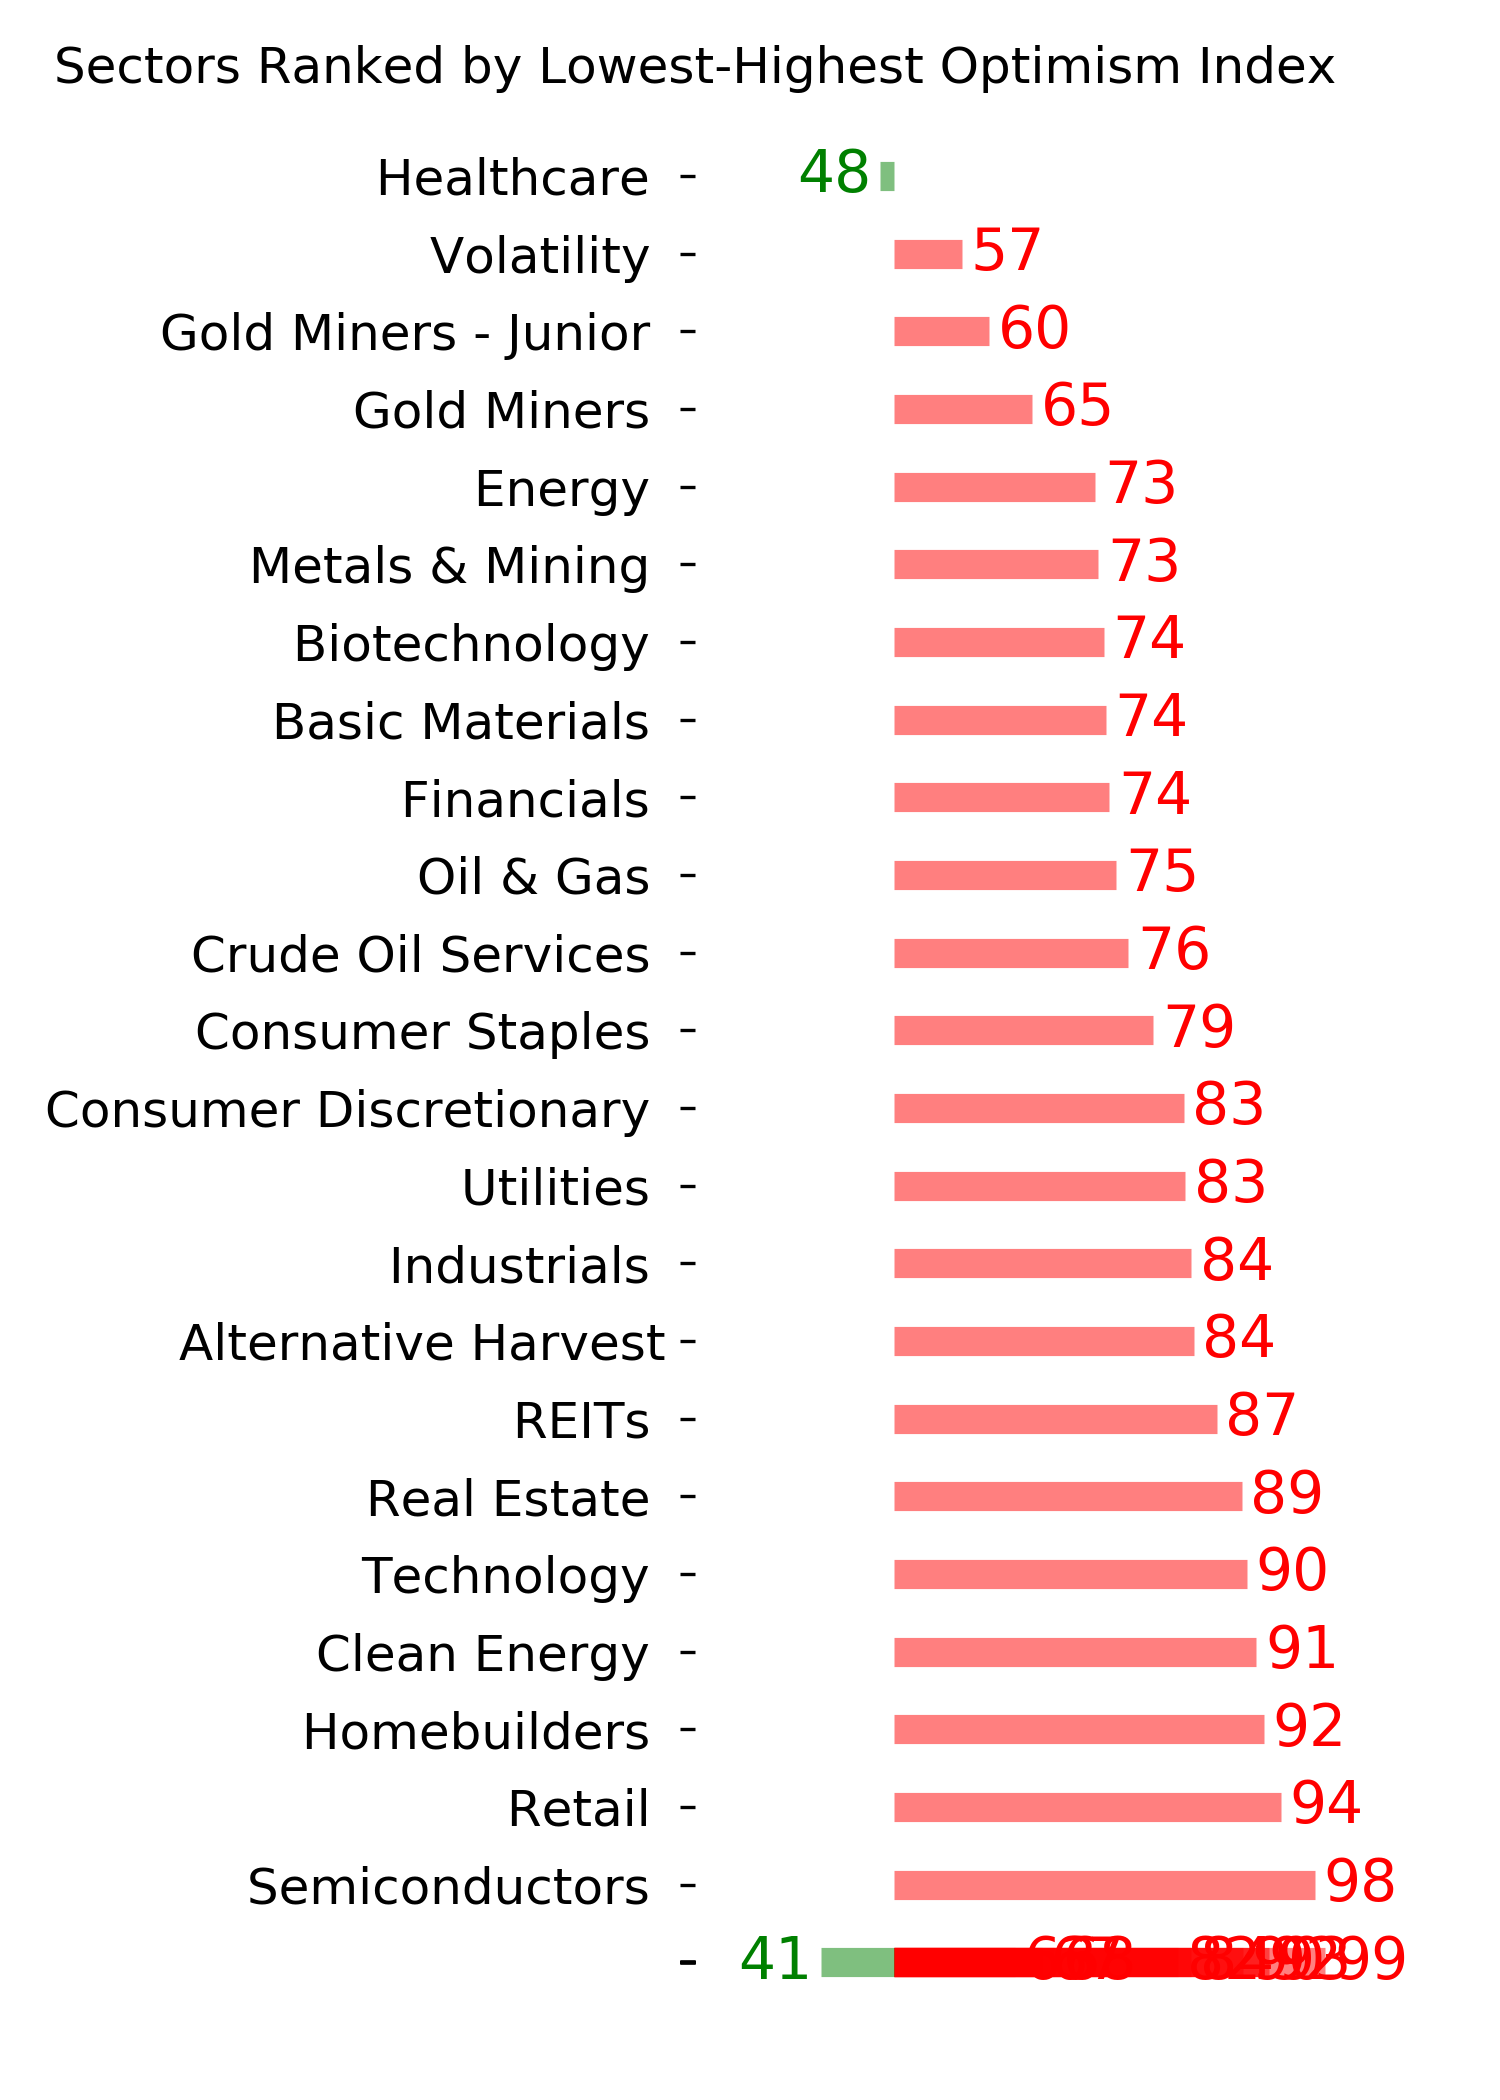
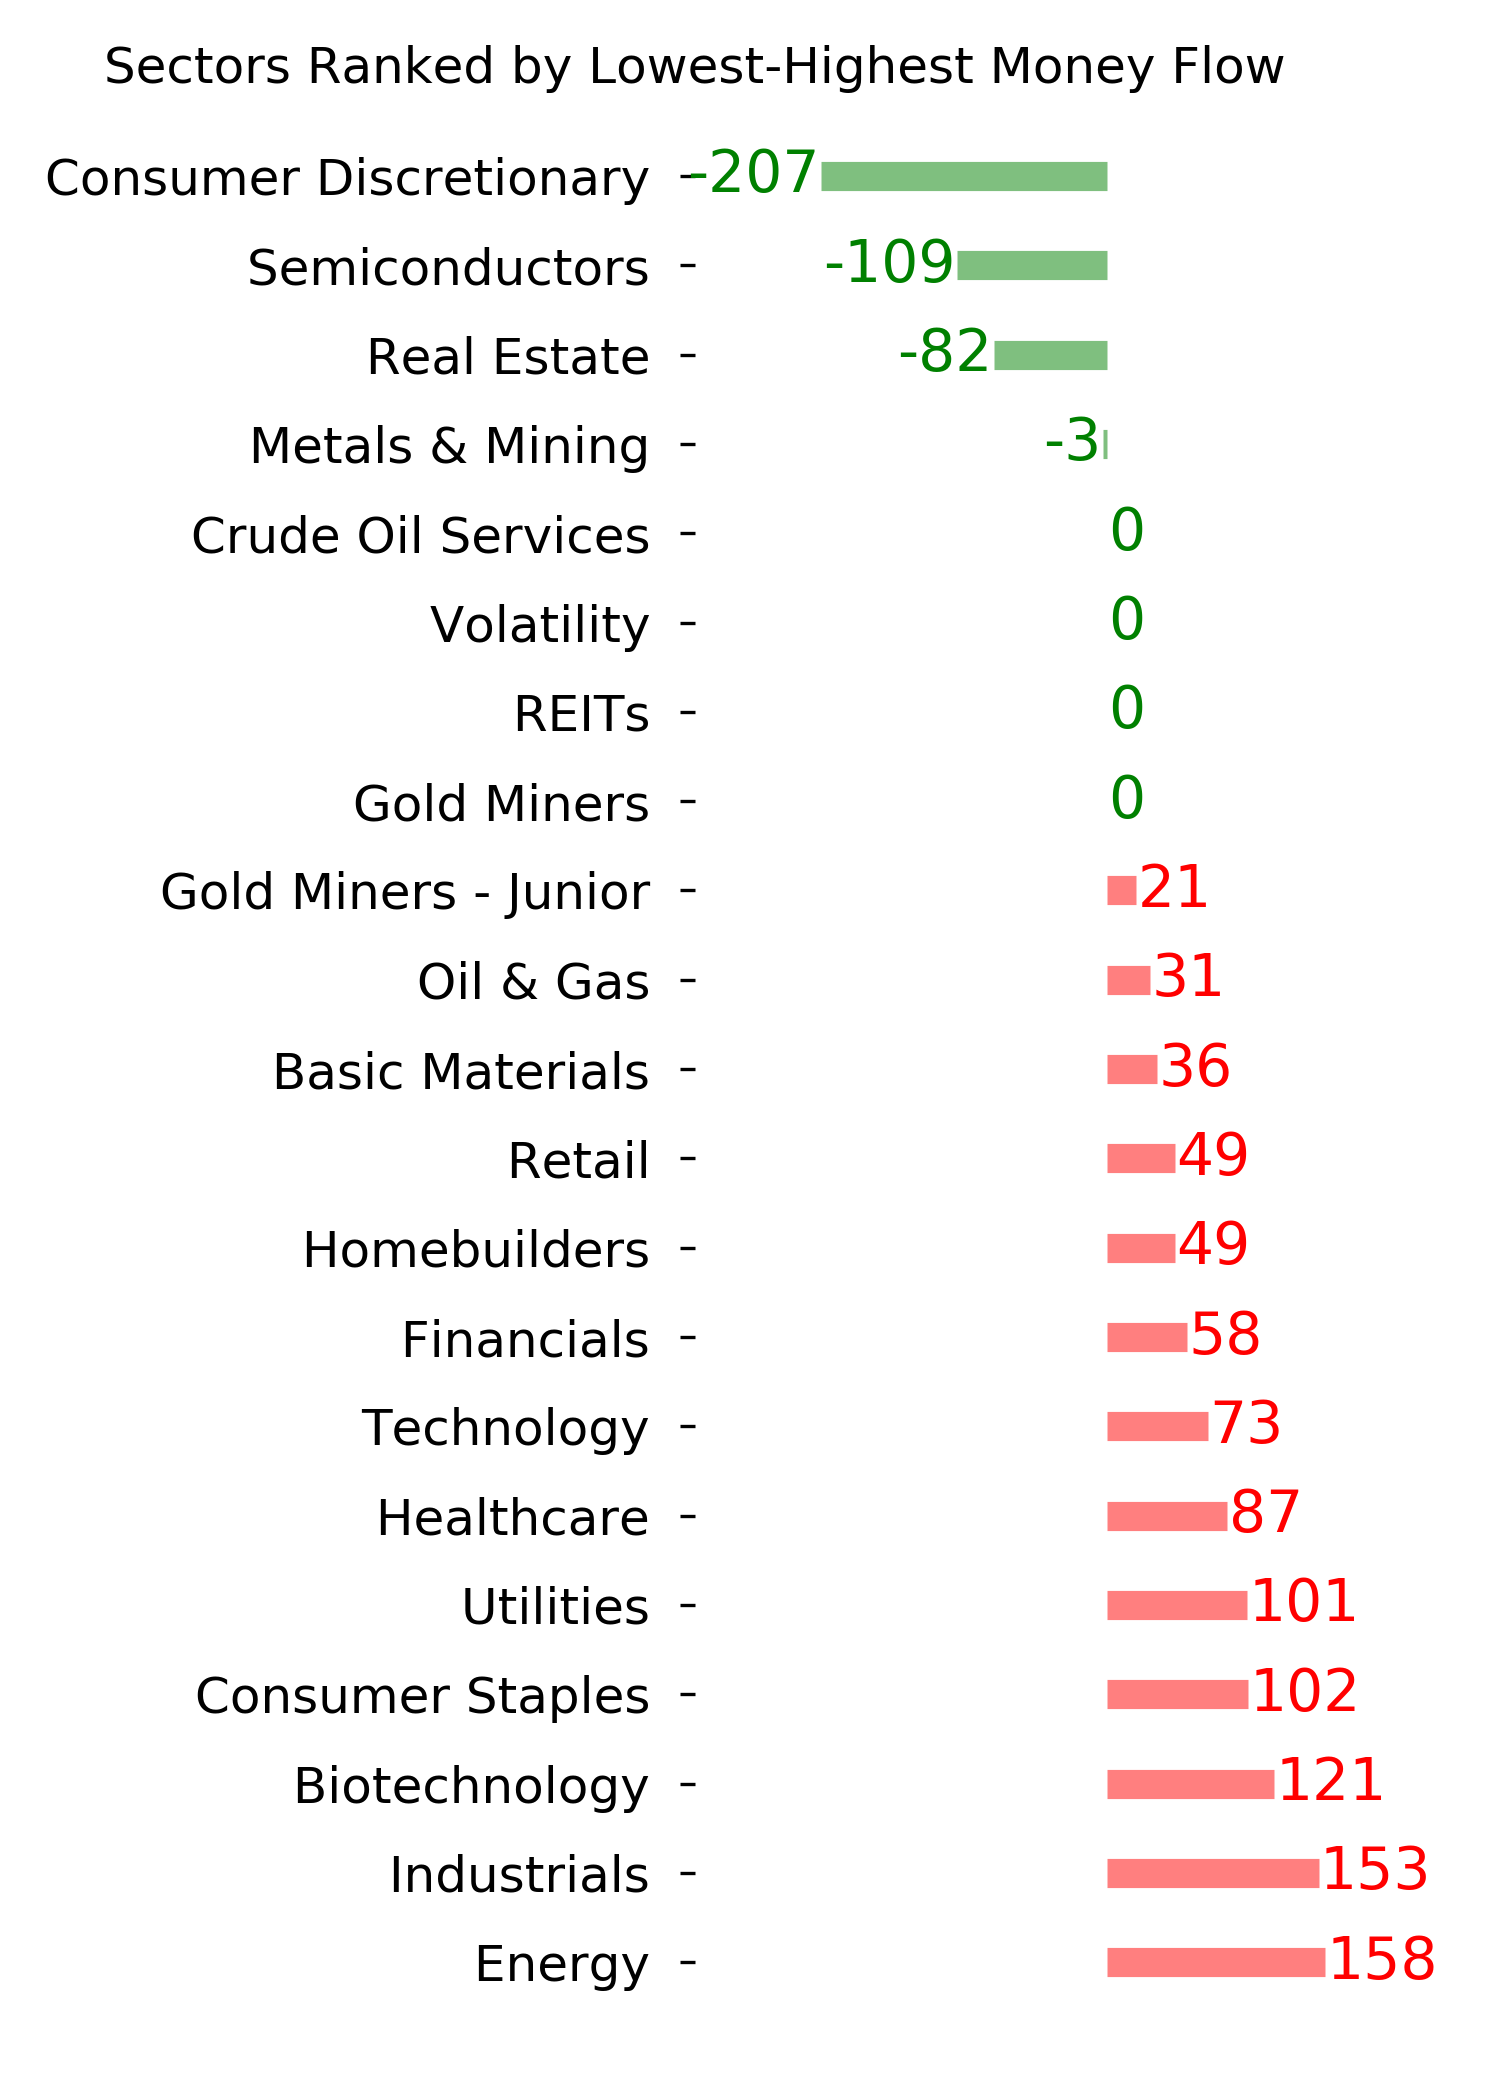
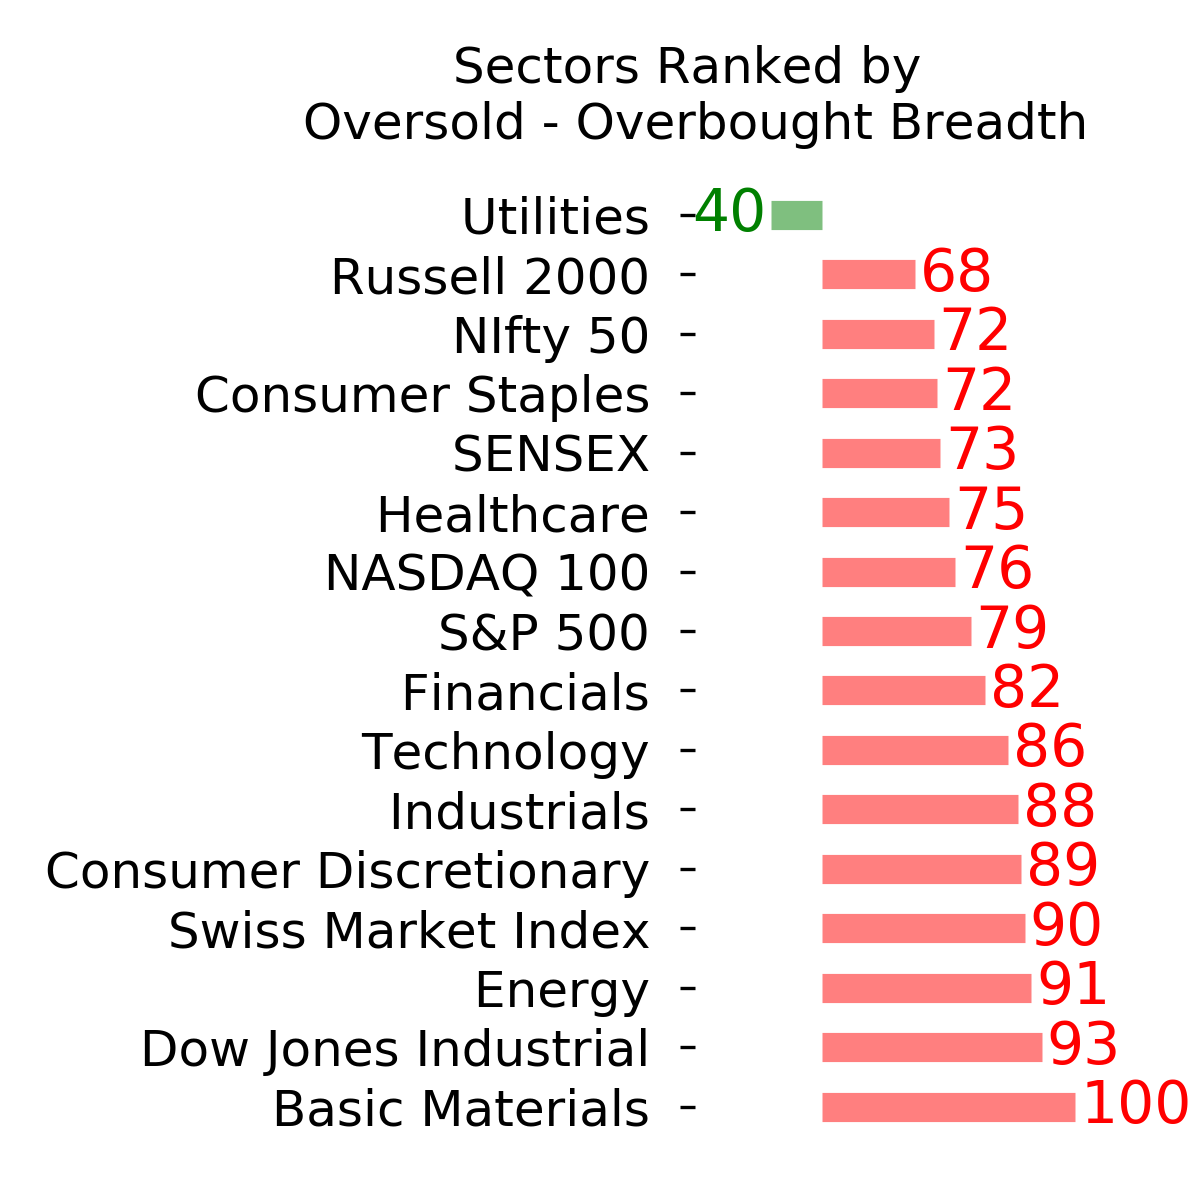
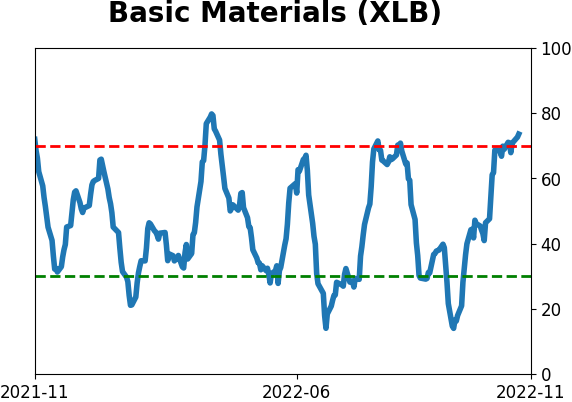
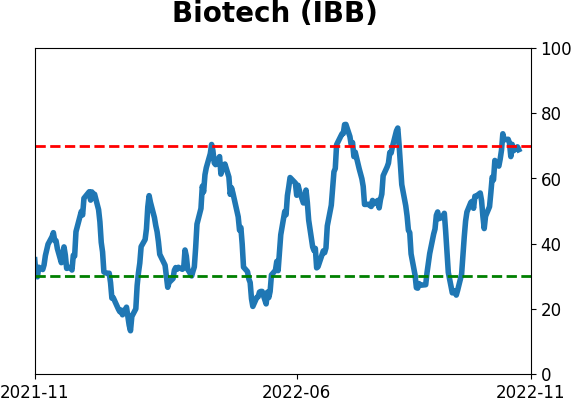
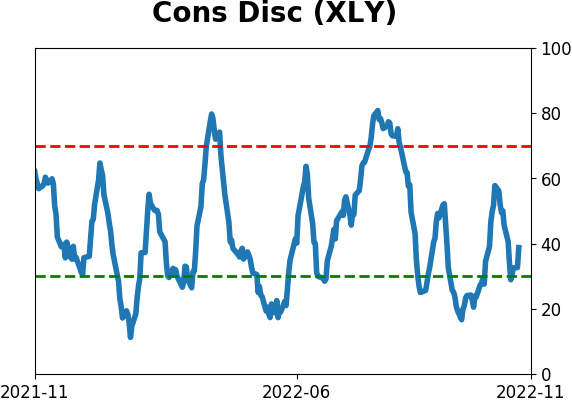
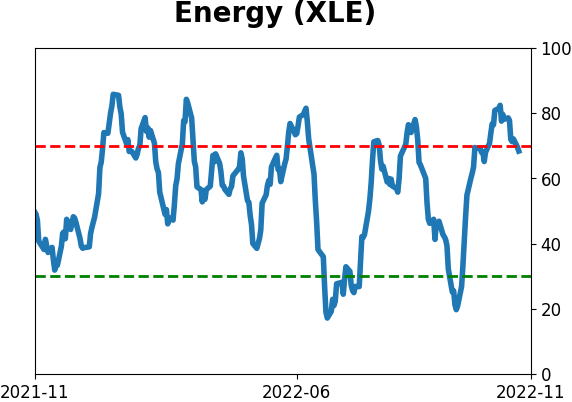
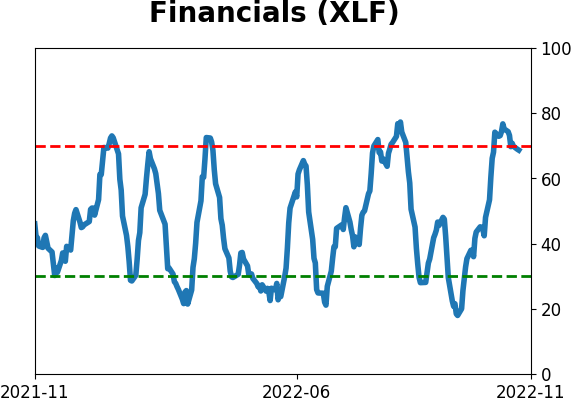
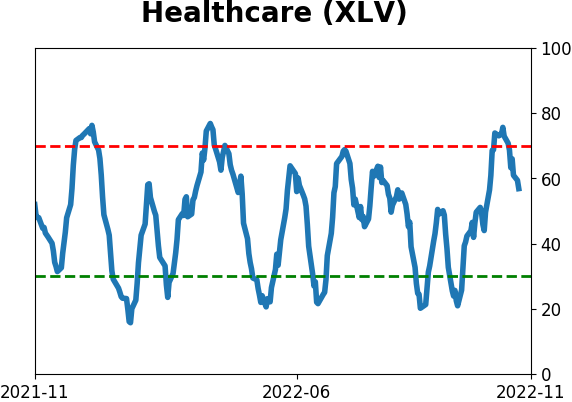
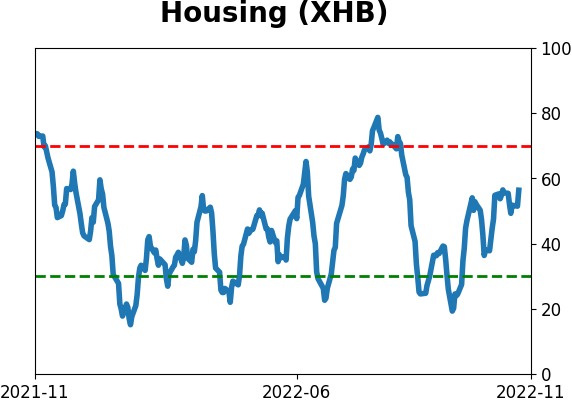
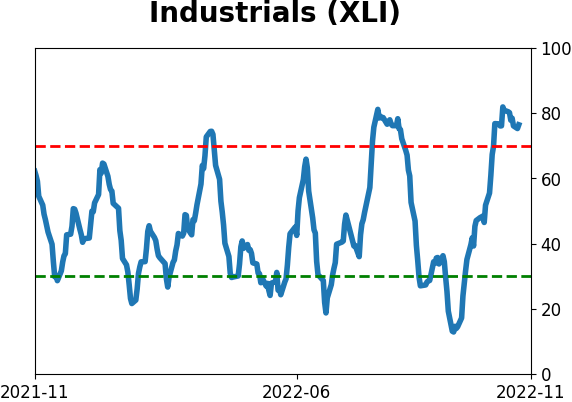
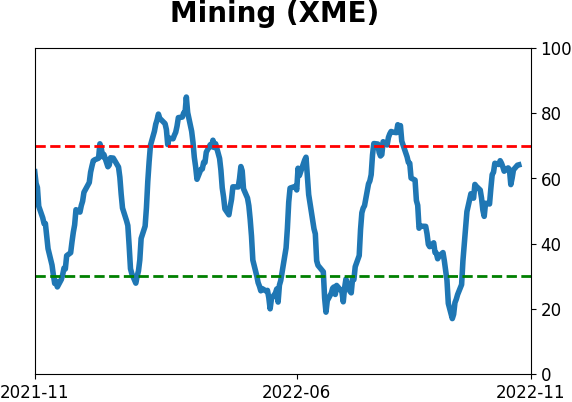
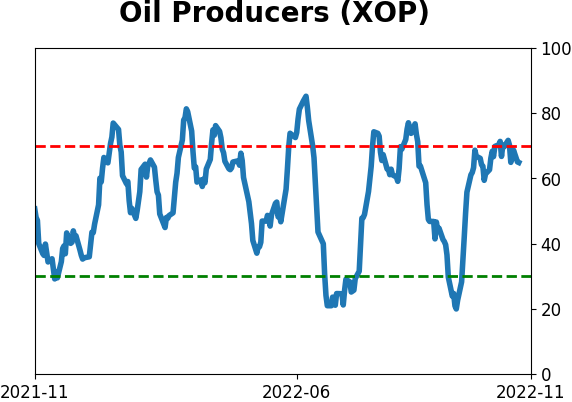
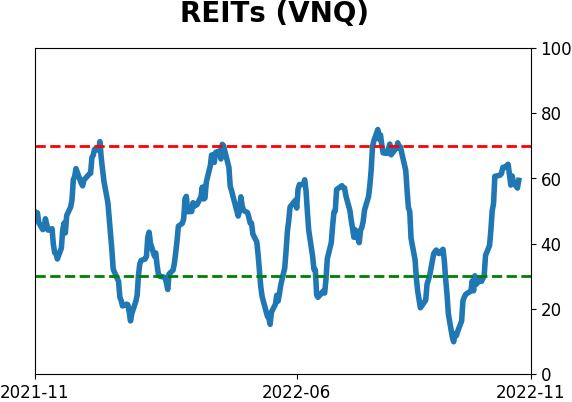
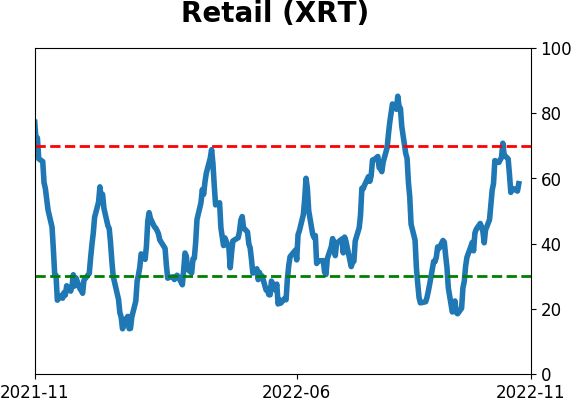
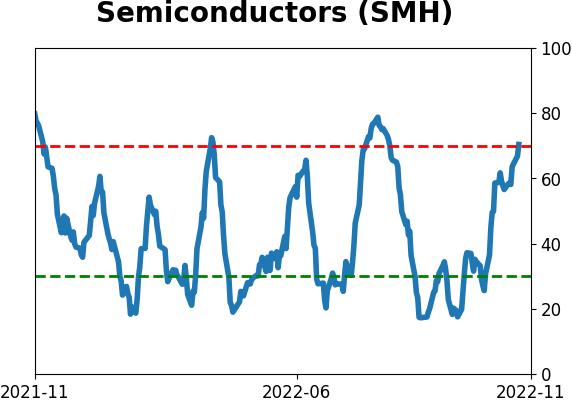
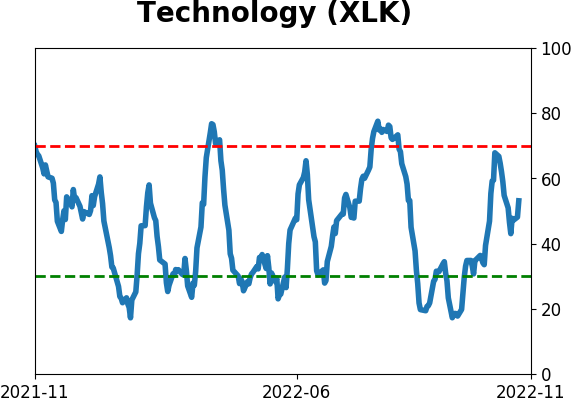
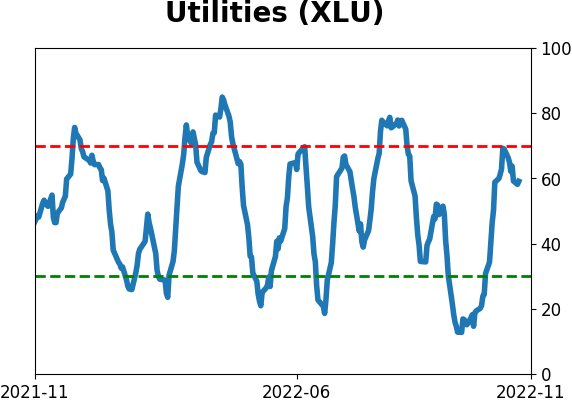
Sector ETF's - 10-Day Moving Average
|
|
|
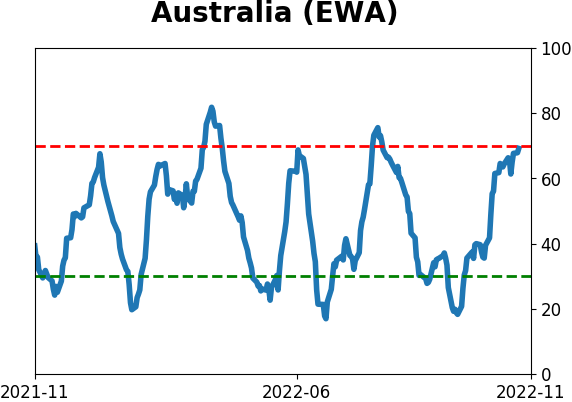
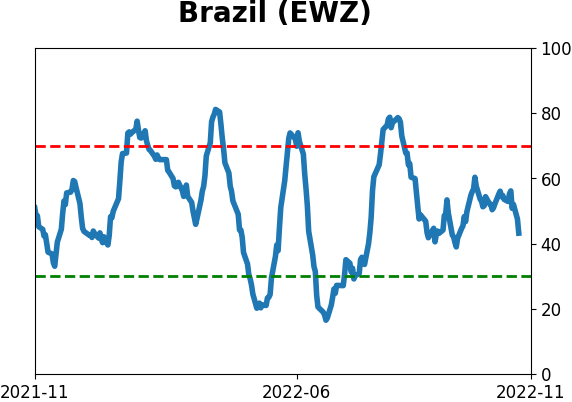
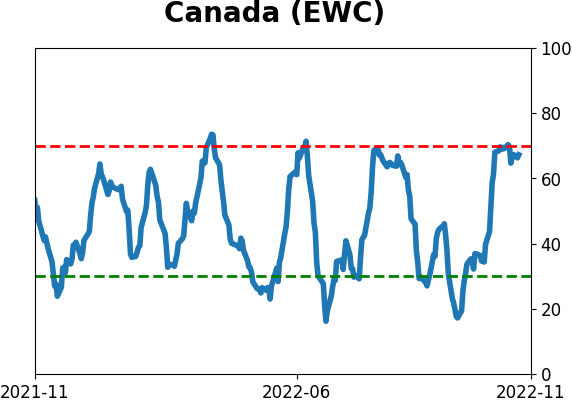
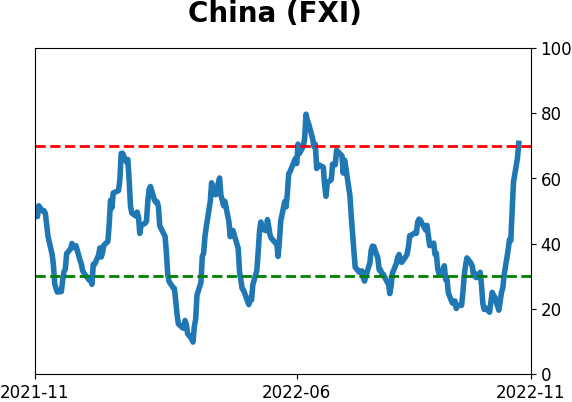
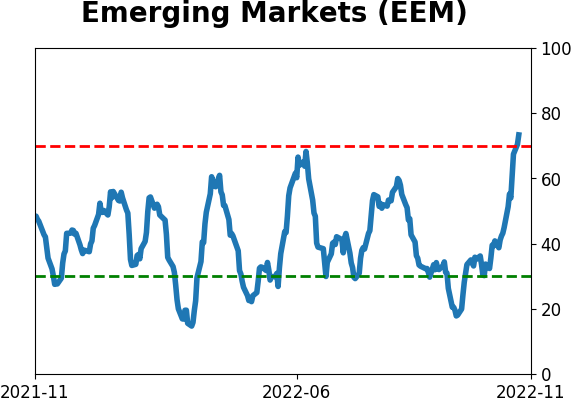
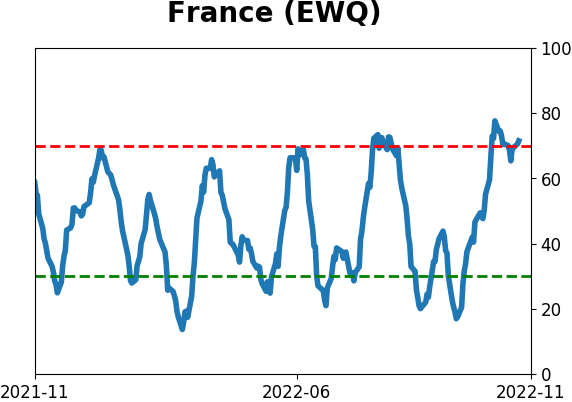
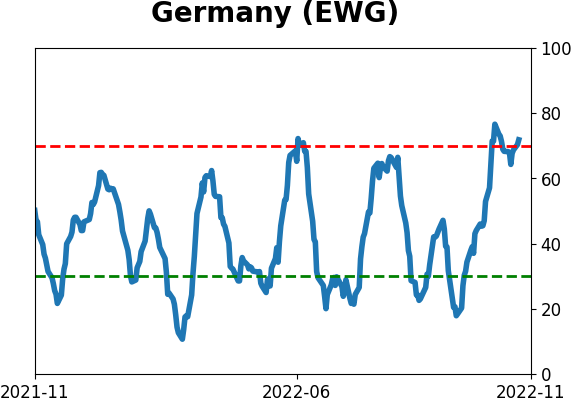
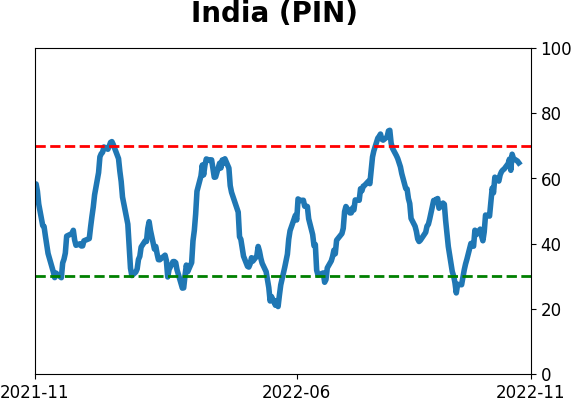
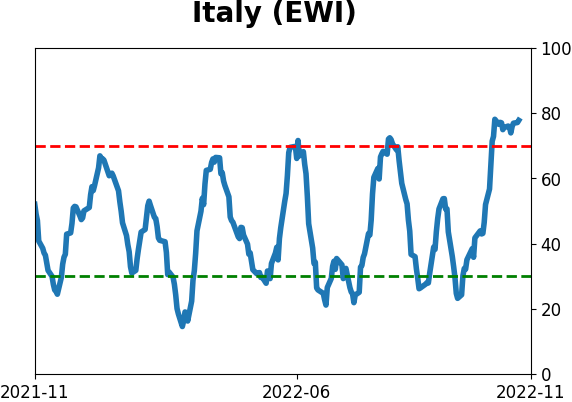
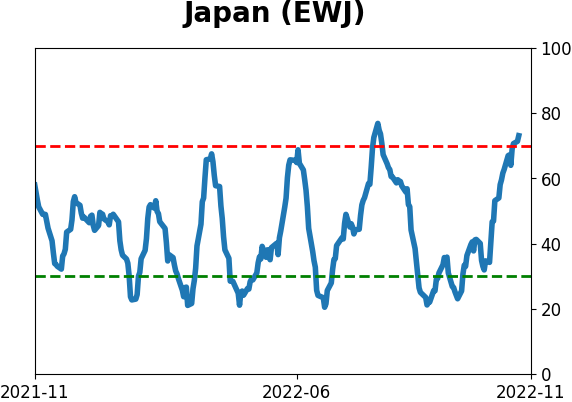
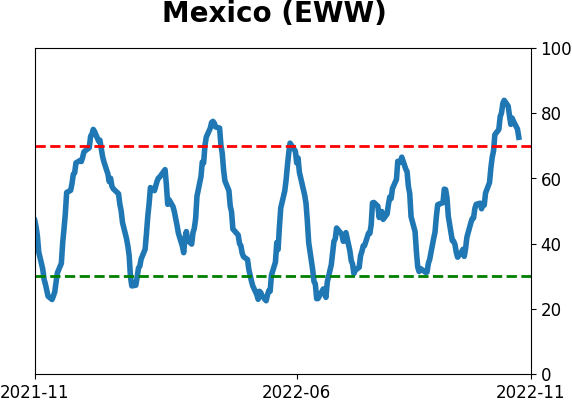
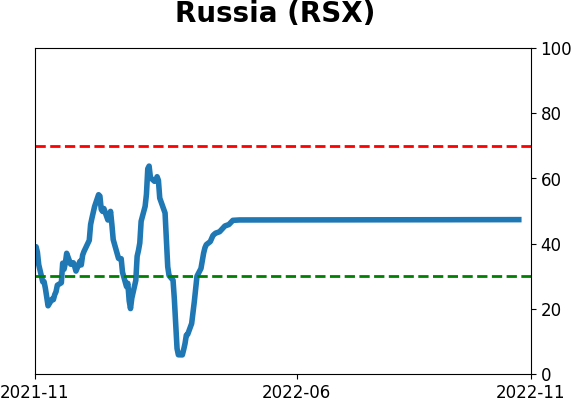
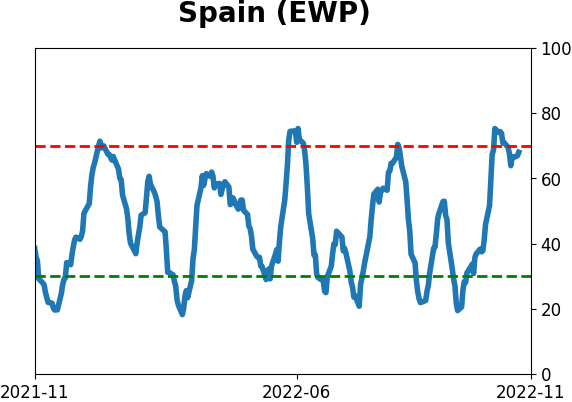
Country ETF's - 10-Day Moving Average
|
|
|
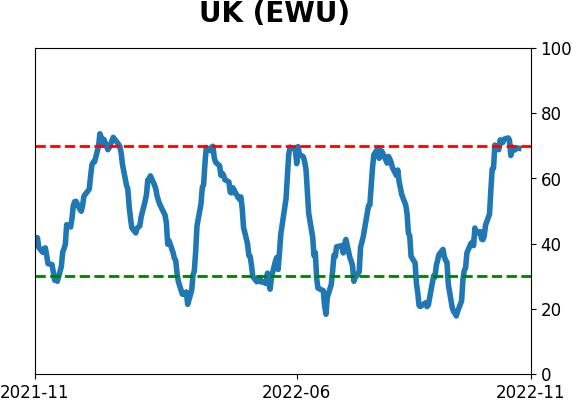
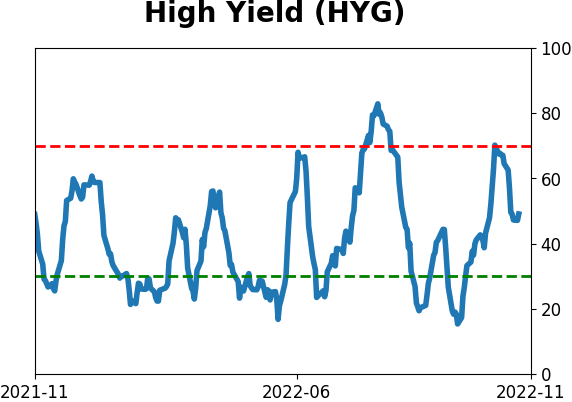
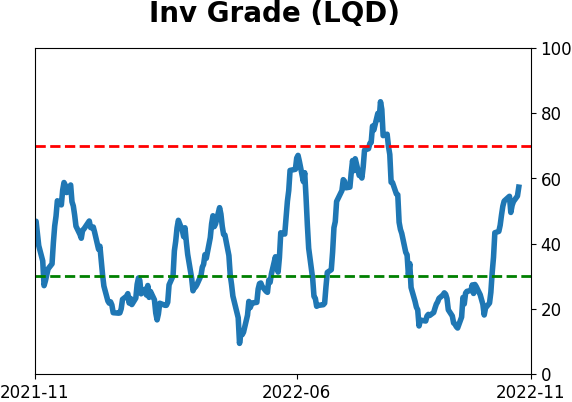
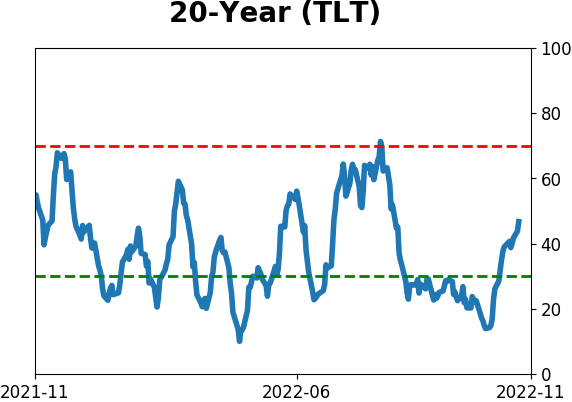
Bond ETF's - 10-Day Moving Average
|
|
|
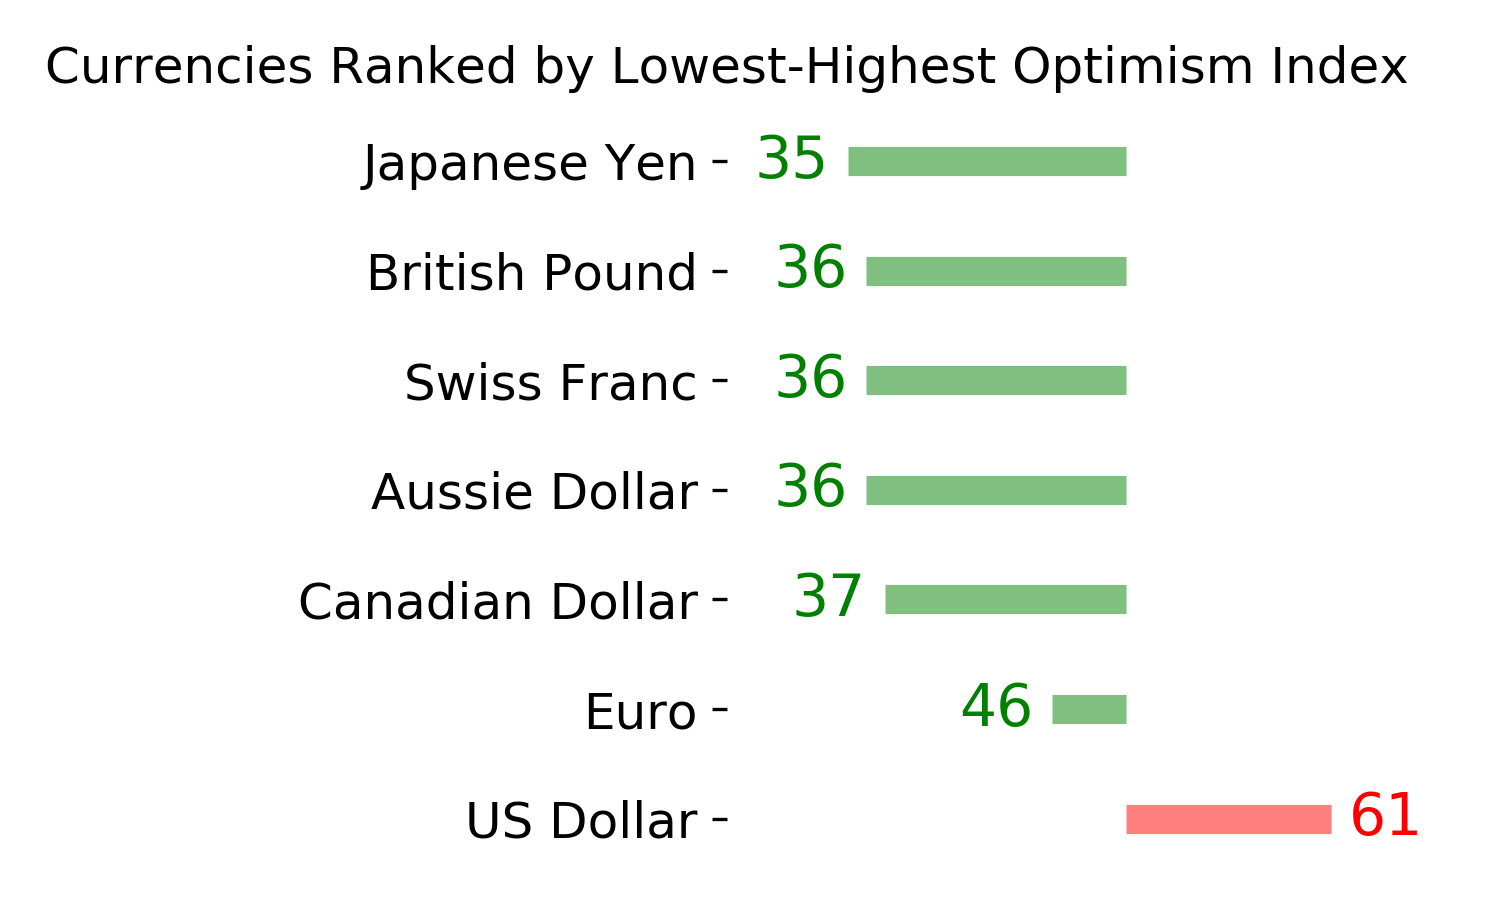
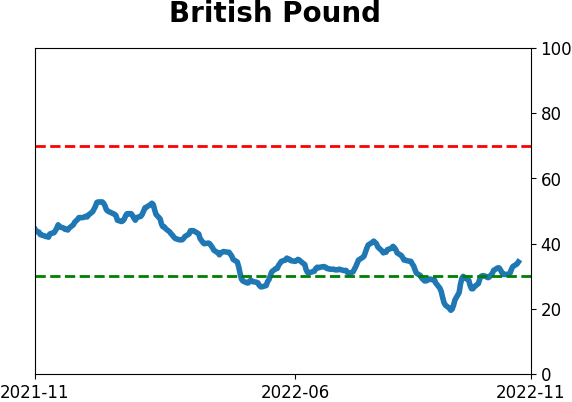
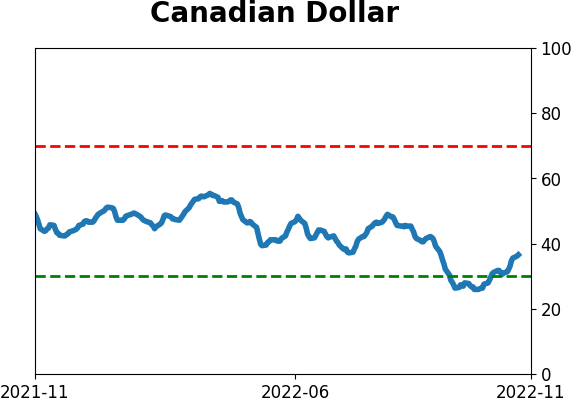
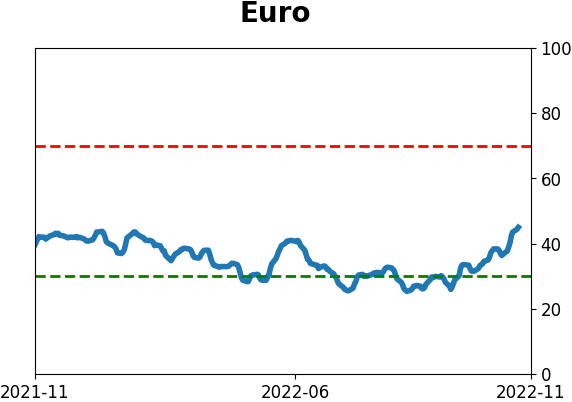
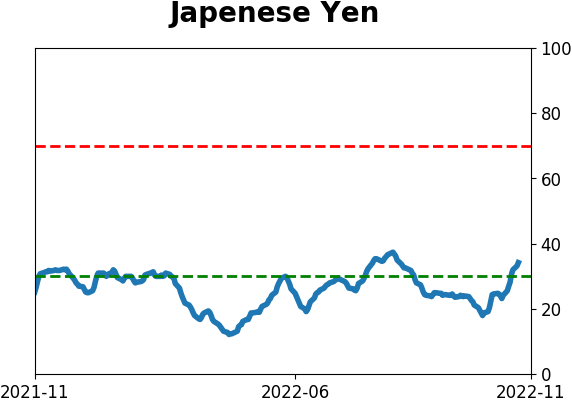
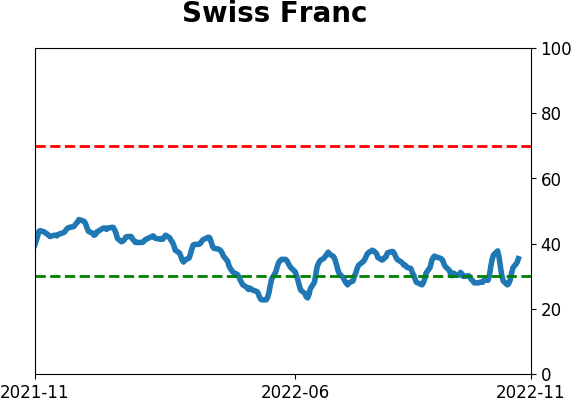
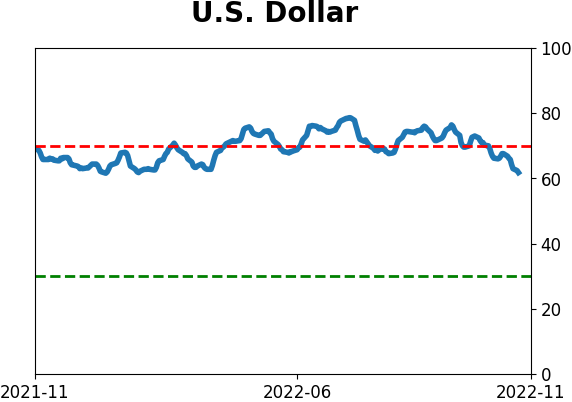
Currency ETF's - 5-Day Moving Average
|
|
|
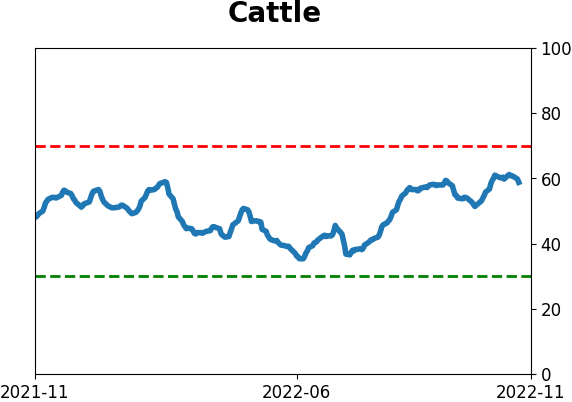
Commodity ETF's - 5-Day Moving Average
|
|