Headlines
|
|
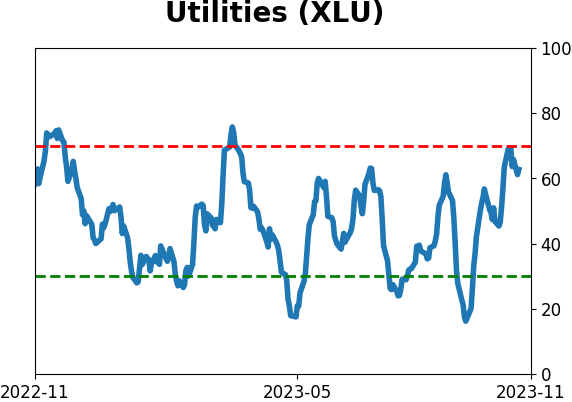
Utilities finally see some buying interest after severe pressure:
Utilities stocks witnessed washout selling pressure in early October. The rebound rally since then has ended some long streaks of stocks in medium-term downtrends. Similar behavior tended to precede further gains. Corporate insiders seem to be counting on it because they're not selling while others are.
|
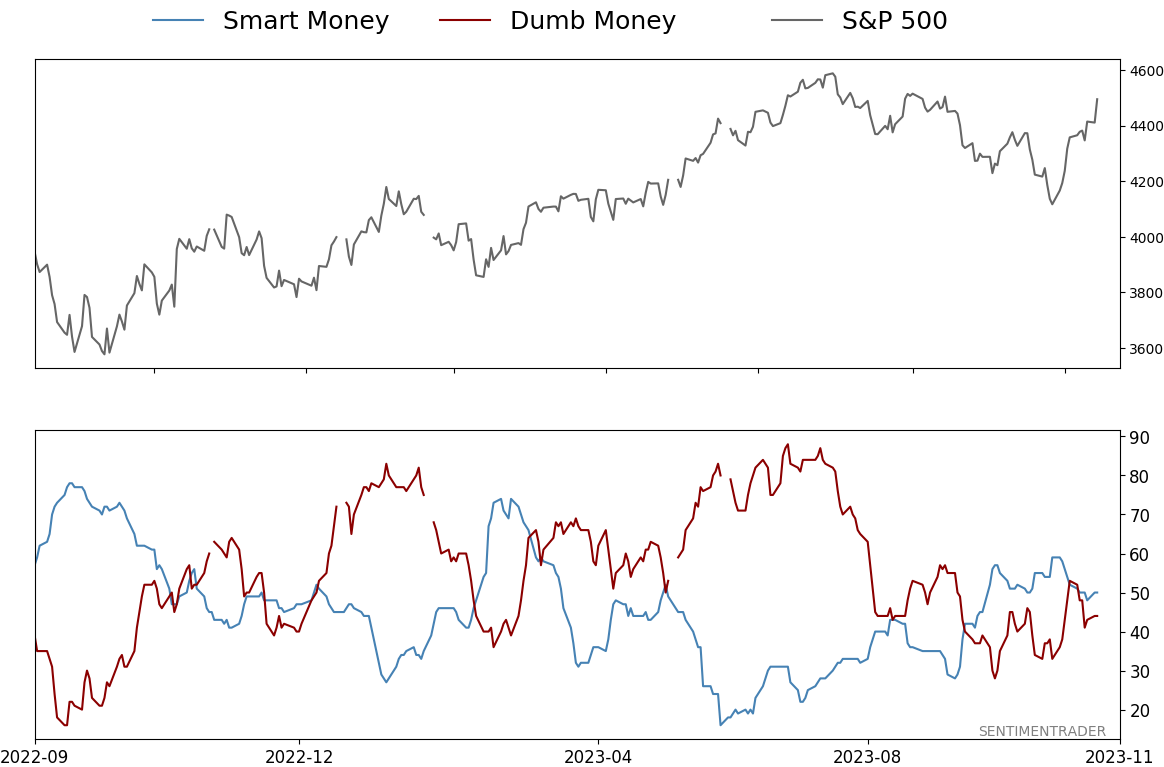
Smart / Dumb Money Confidence
|
Smart Money Confidence: 50%
Dumb Money Confidence: 44%
|
|
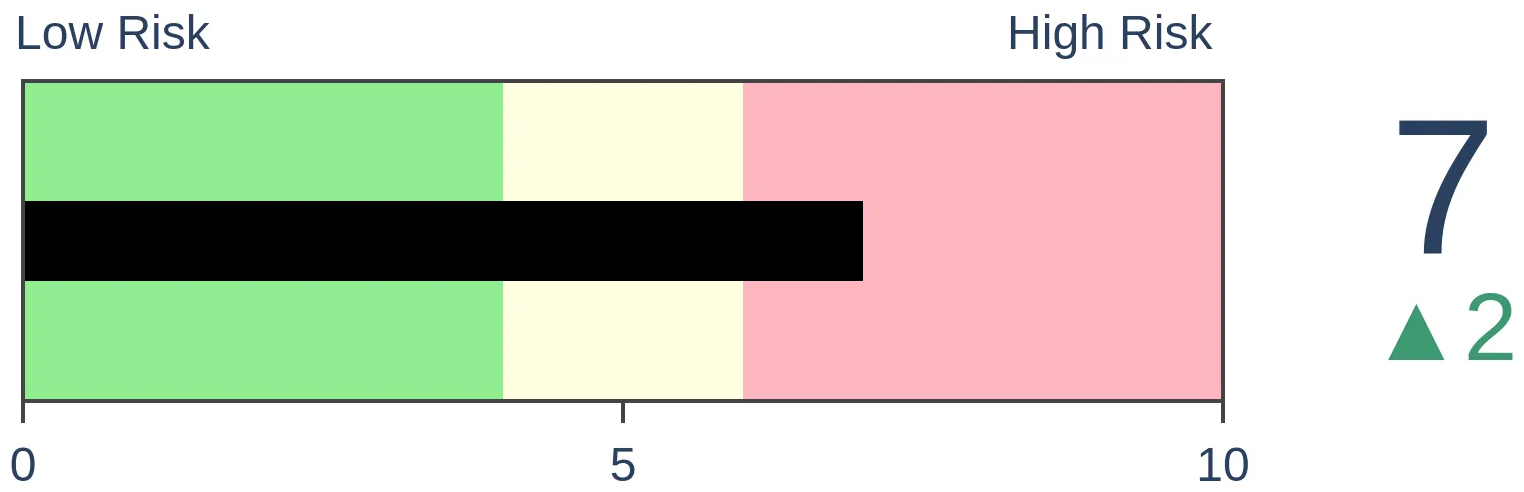
Risk Levels
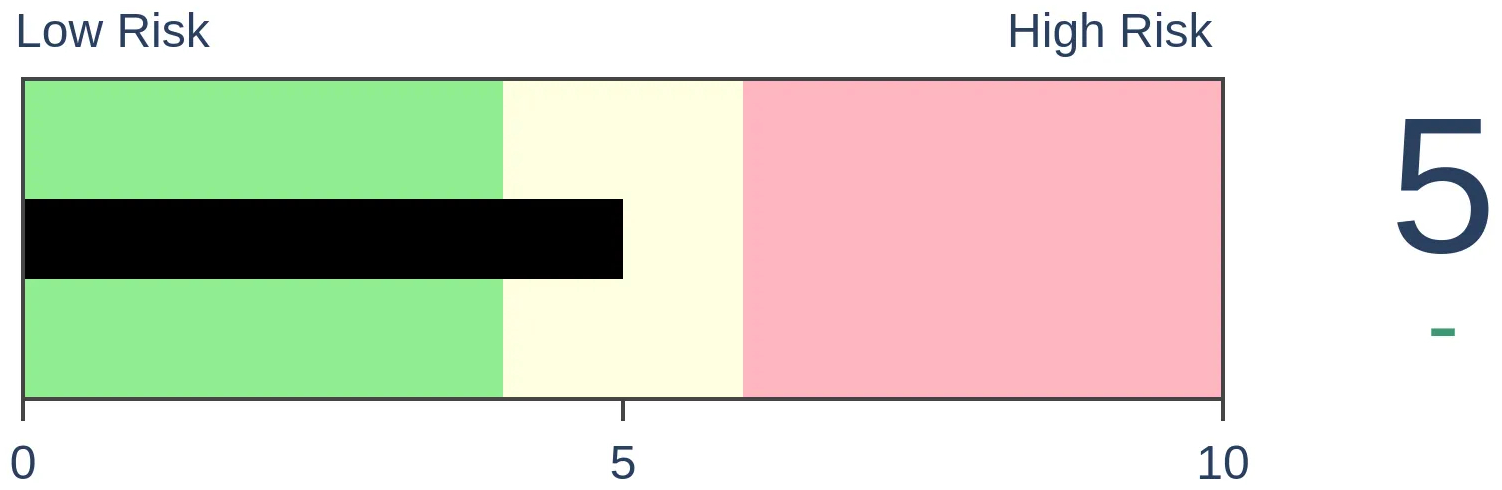
Stocks Short-Term
|
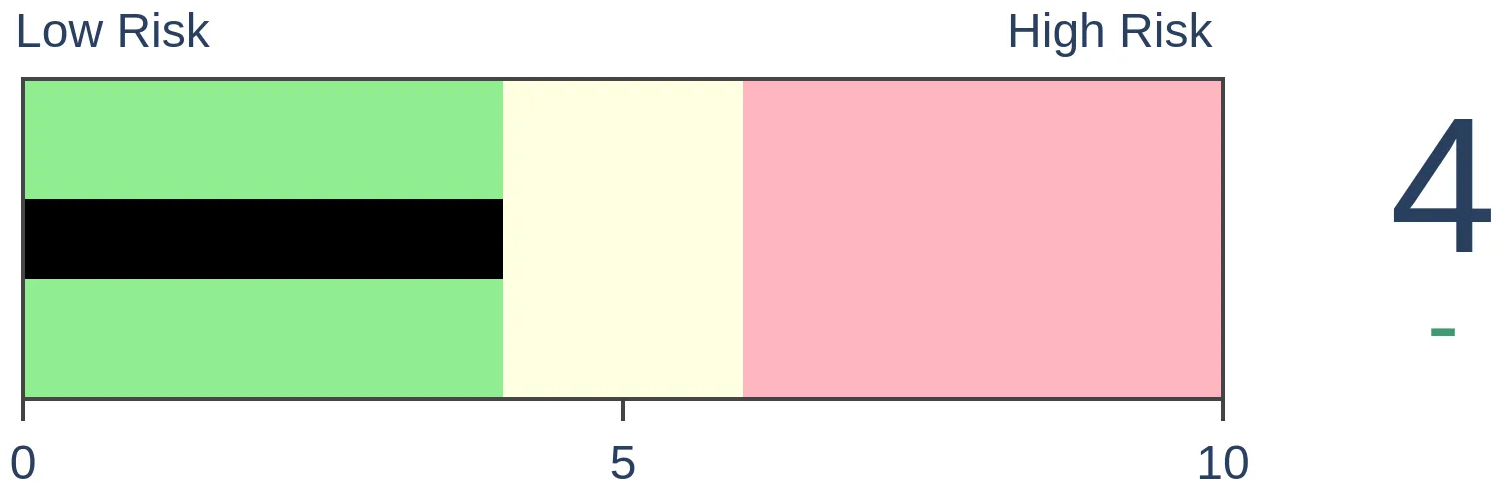
Stocks Medium-Term

|
|
Bonds

|
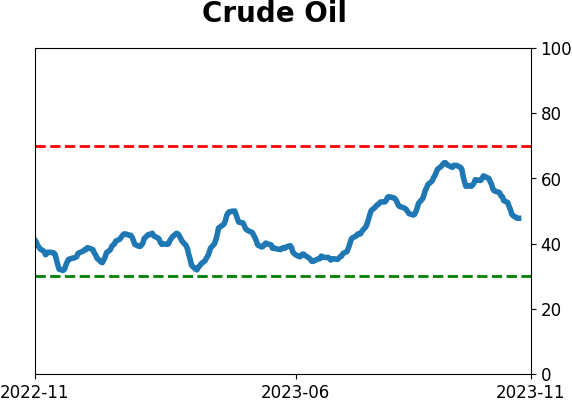
Crude Oil
|
|
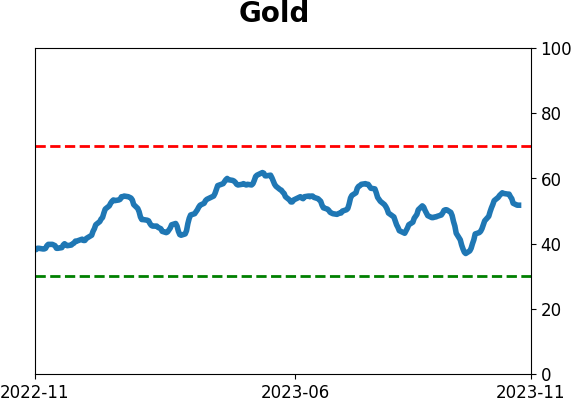
Gold
|
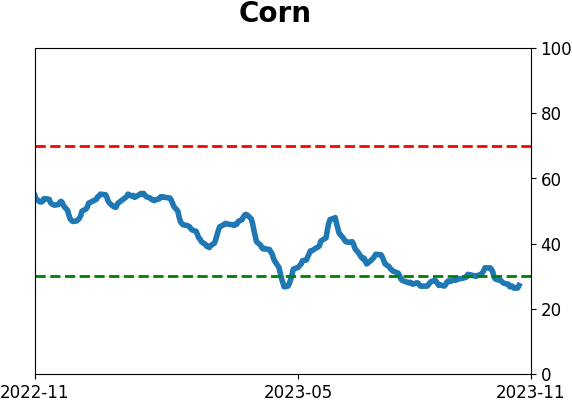
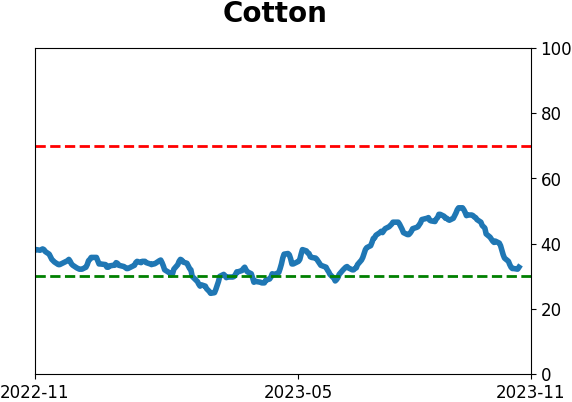
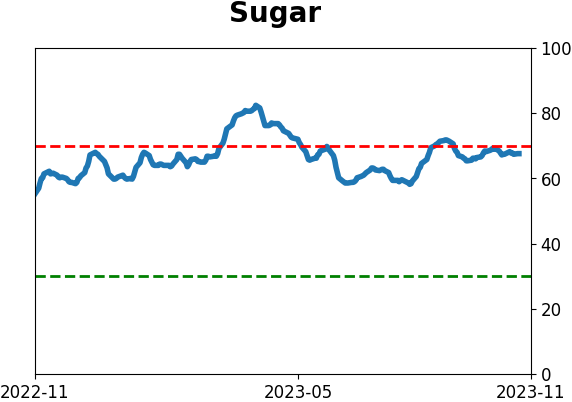
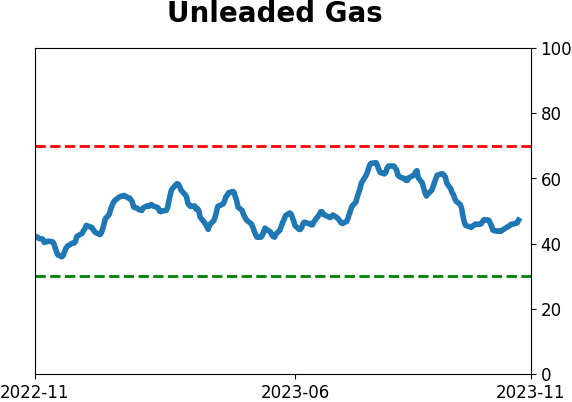
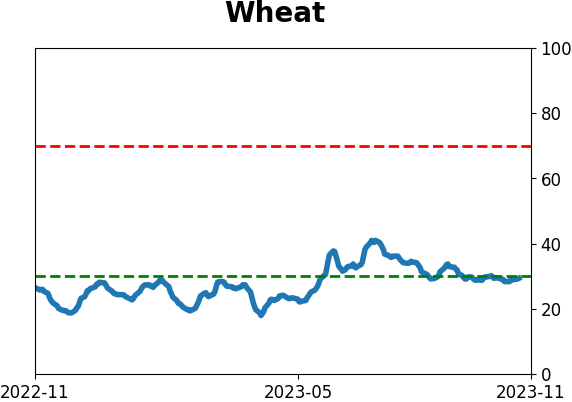
Agriculture

|
|
Research
By Jason Goepfert
BOTTOM LINE
Utilities stocks witnessed washout selling pressure in early October. The rebound rally since then has ended some long streaks of stocks in medium-term downtrends. Similar behavior tended to precede further gains. Corporate insiders seem to be counting on it because they're not selling while others are.
FORECAST / TIMEFRAME
None
|
Key points:
- For the first time in months, there was a surge in medium-term uptrends among Utilities
- Even so, a majority of the stocks remain in persistent long-term uptrends
- Similar behavior tended to precede buying interest, which corporate insiders seem to be anticipating
The most boring sector is seeing some renewed interest
Boring sectors have been anything but this year. At the start of October, about 60% of Utilities stocks hit a 52-week low at the same time. That was one of the greatest washouts in decades. Since then, the sector has rebounded somewhat, but many stocks remain stuck in long-term downtrends.
It has been nearly two months since more than 20% of stocks in the sector climbed above their 200-day moving averages. That's the longest streak since 2008.
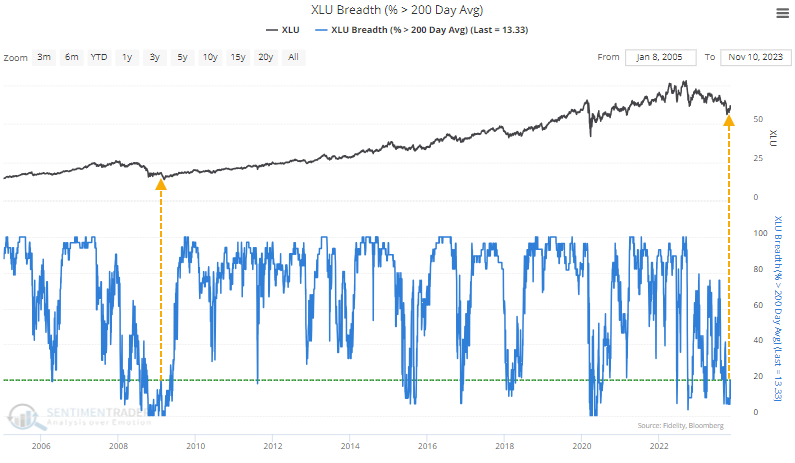
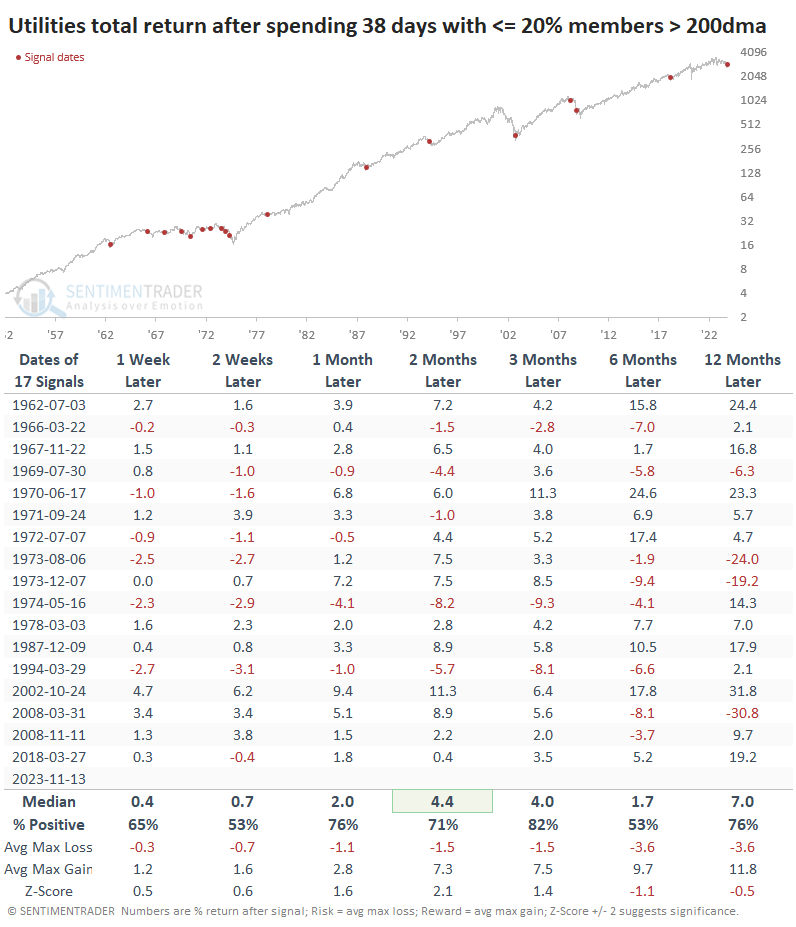
Over the past 70 years, there have been 17 other times when the sector went at least this many sessions with fewer than a fifth of its members in long-term uptrends. Most of them preceded medium-term bounces. Only two of them lost more than -5% over the next two months.
This downtrend has been especially wicked for investors, as there haven't even been many medium-term rebounds to get people excited. Until recently, fewer than 60% of members had climbed above their 50-day moving averages. That was the longest streak since 2018.
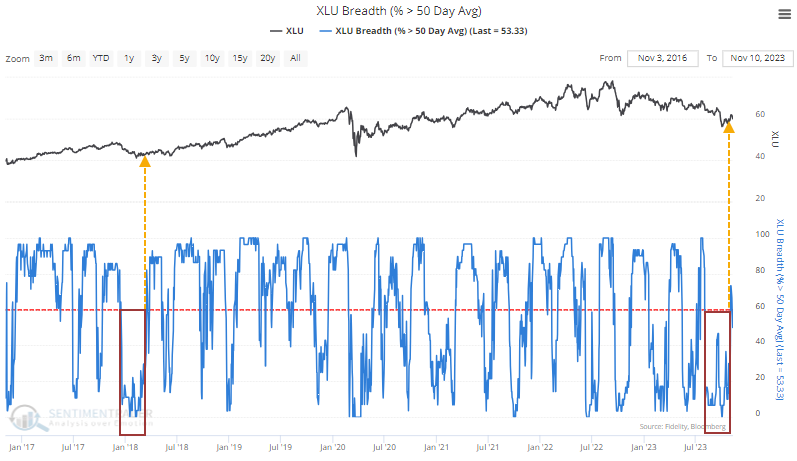
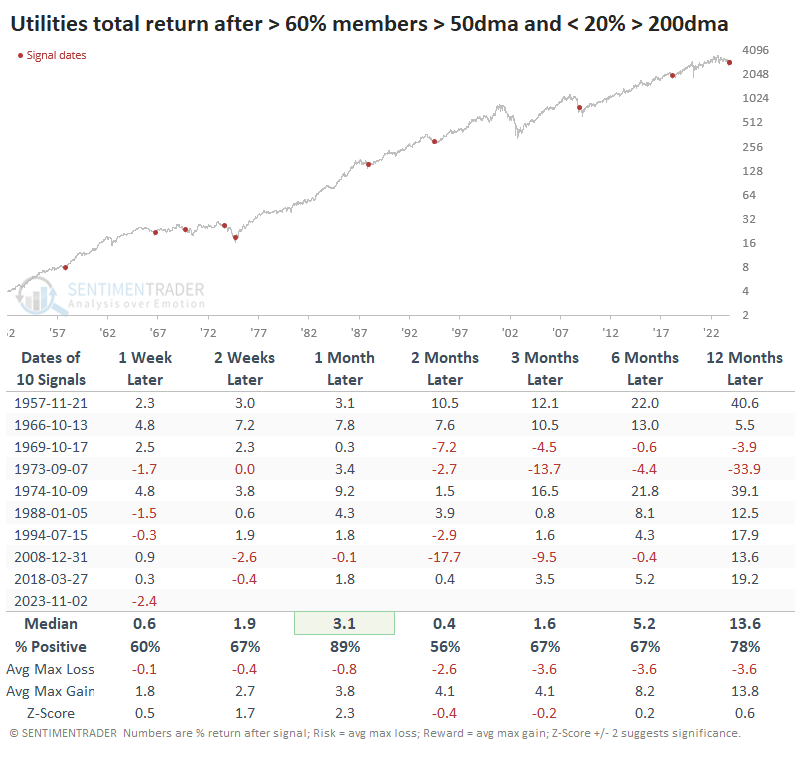
When the sector rebounded in early October, we finally saw more than 60% of Utilities climb above their medium-term averages. However, more than 80% of them had been stuck in long-term downtrends for at least the past 30 sessions. That has happened ten other times since 1952.
While the initial reaction to the shorter-term surge hasn't been encouraging this time, all but one of the others showed a positive return during the next month. There were two painful failures, in 1973 and 2008, though the latter eventually relented.
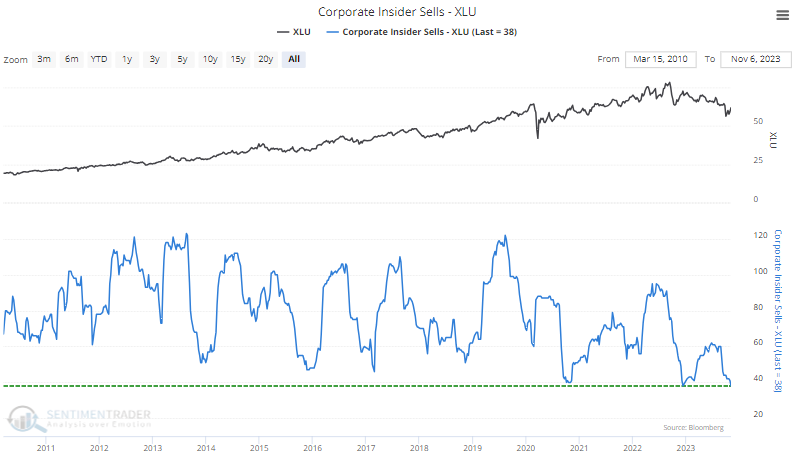
Insiders aren't selling while everyone else is
Corporate insiders don't see much point in selling their shares at such depressed levels. A six-month rolling sum of insider sales has dropped to its lowest level since 2010.
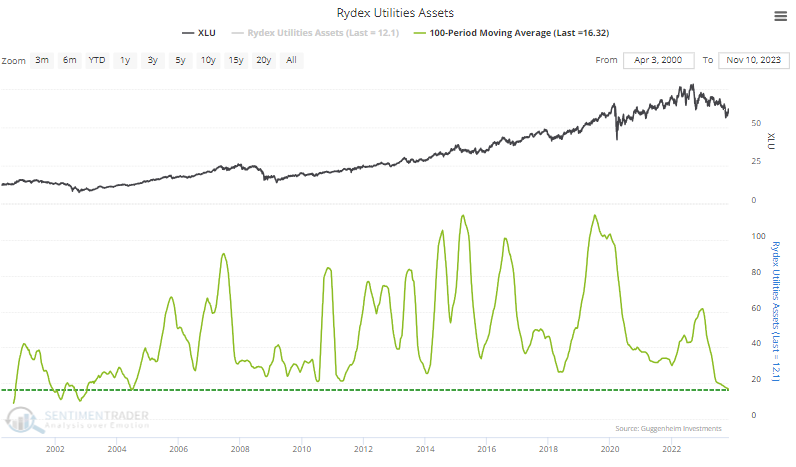
However, the market timers who use the Rydex family of mutual funds certainly have sold. Over the past 100 days, the average assets in the fund are now the lowest since 2004.
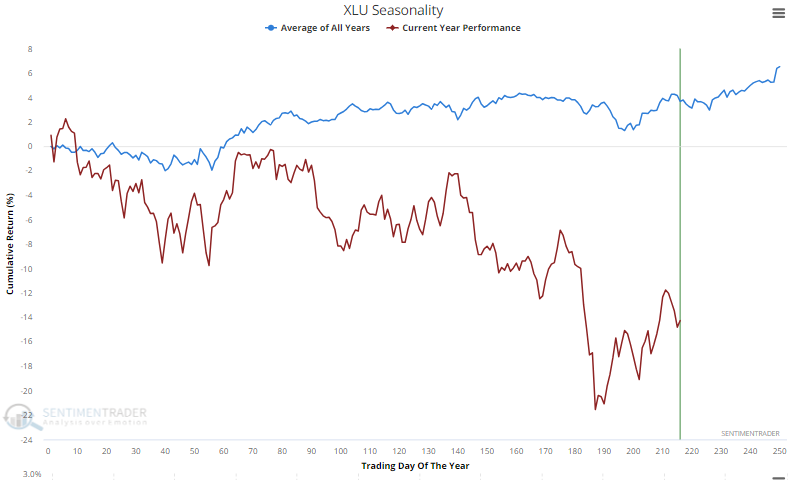
The seasonal window for the sector is positive, but that only lasts through year-end.
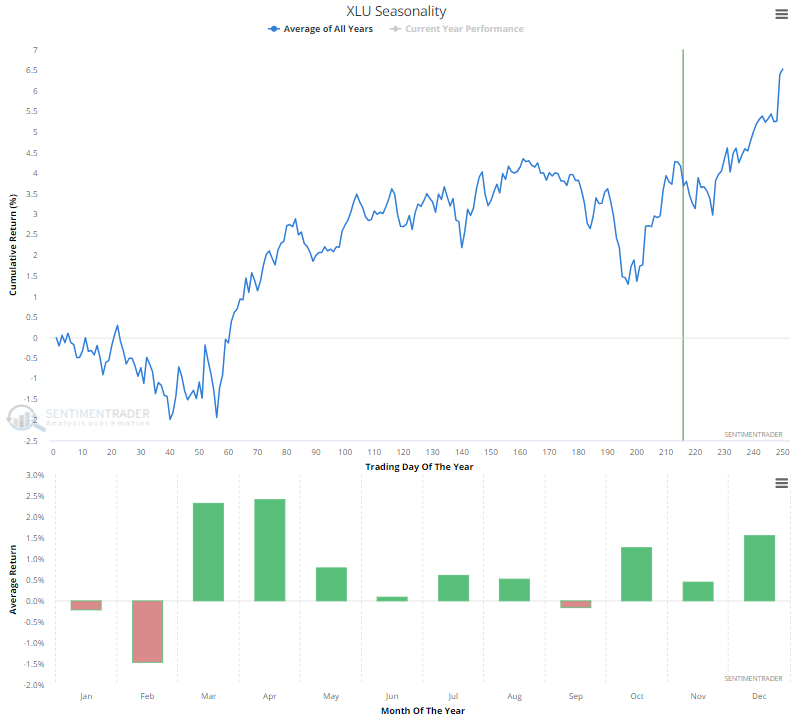
While the magnitude of moves this year is greatly exaggerated, the sector has roughly followed its seasonal pattern.
What the research tells us...
Normally boring defensive sectors have been anything but this year. They have disappointed widows and orphans, who are their cliched target audience. We've seen several compelling signs that Utilities, Consumer Staples, and Health Care stocks have been unduly punished as investors focused on more exciting opportunities.
They have become more interesting now that they've seen some nascent signs of buying interest. Insiders in these firms seem content to hold their shares in hopes of a rebound, and historically, they've been rewarded for their patience after declines have become this persistent and severe.
Indicators at Extremes
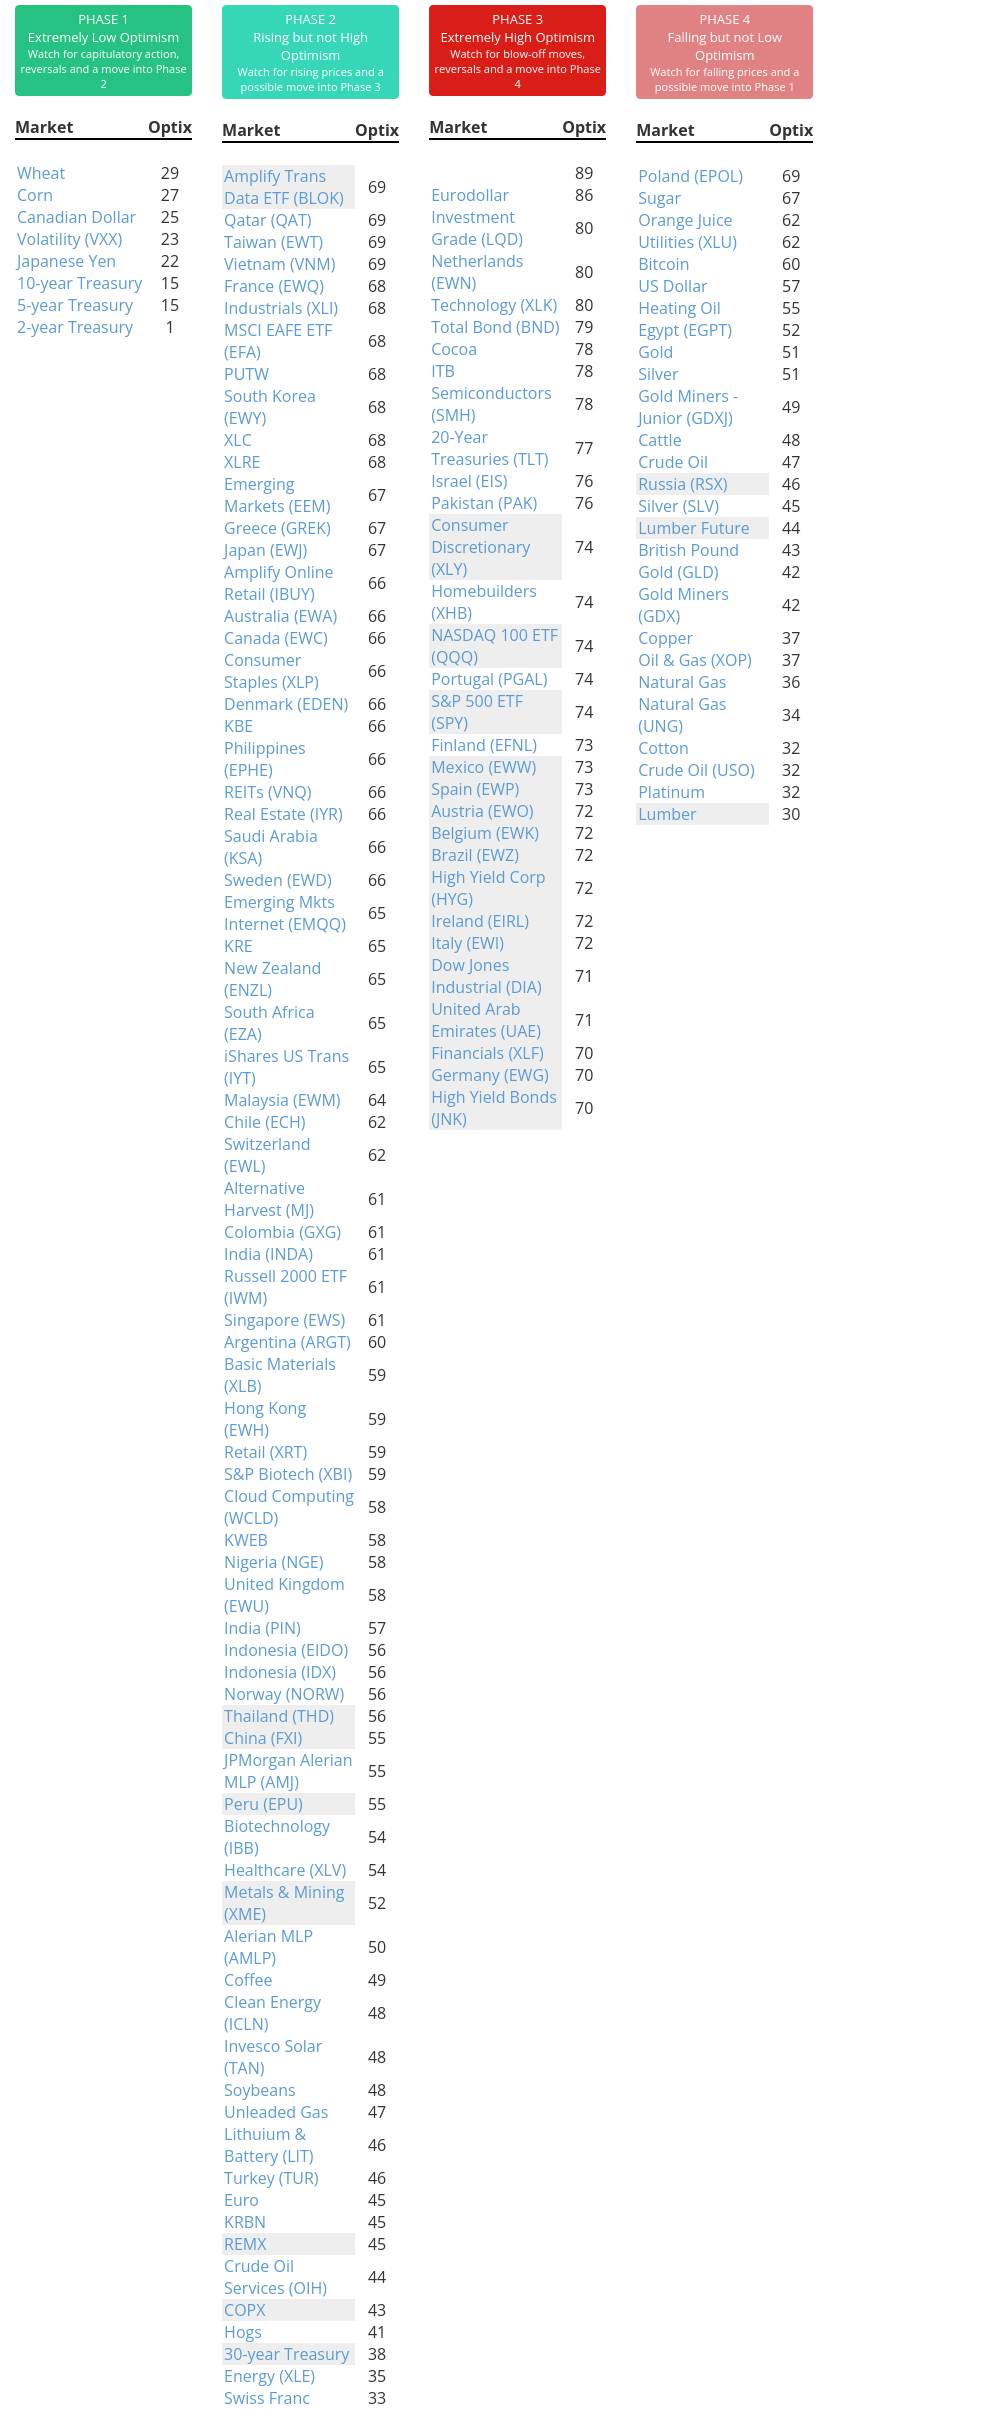
Phase Table
Ranks
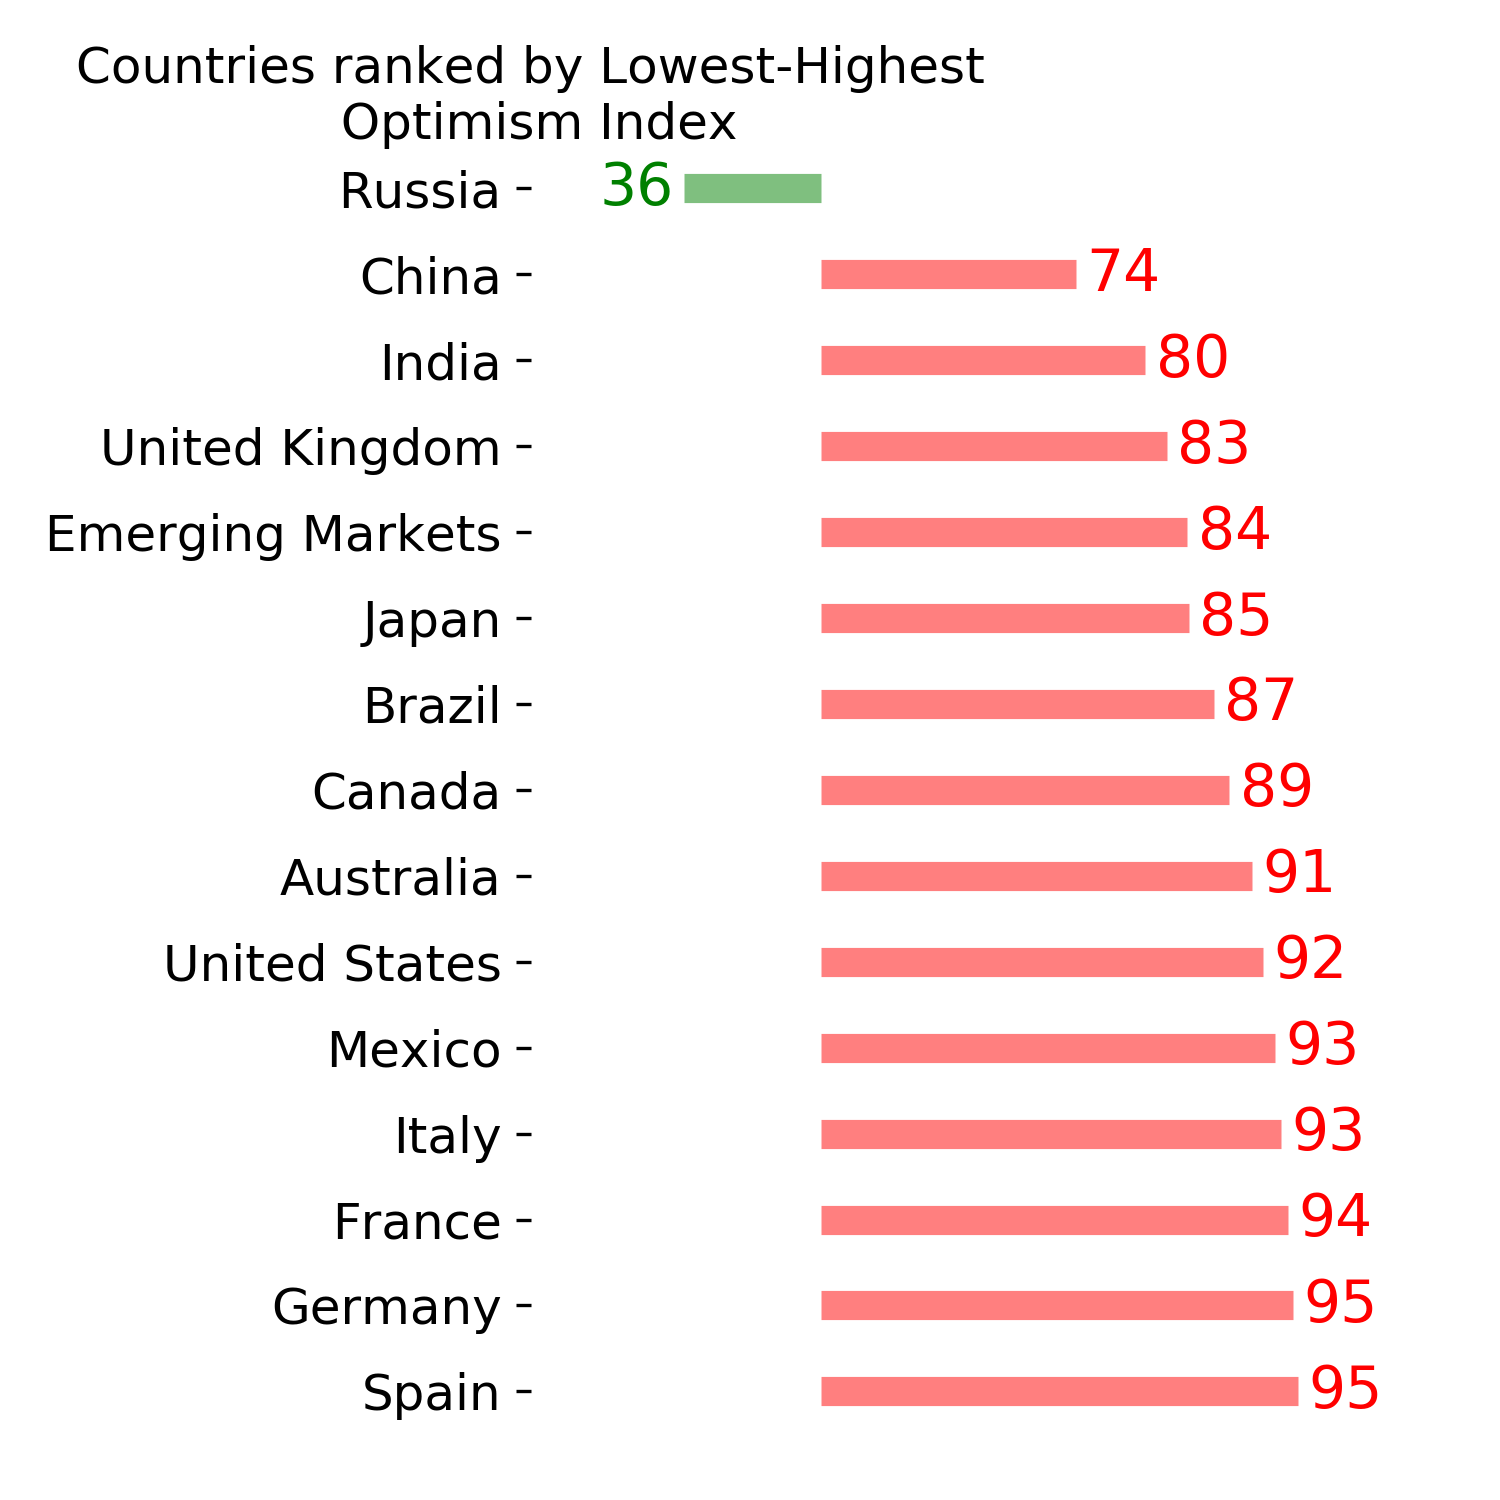
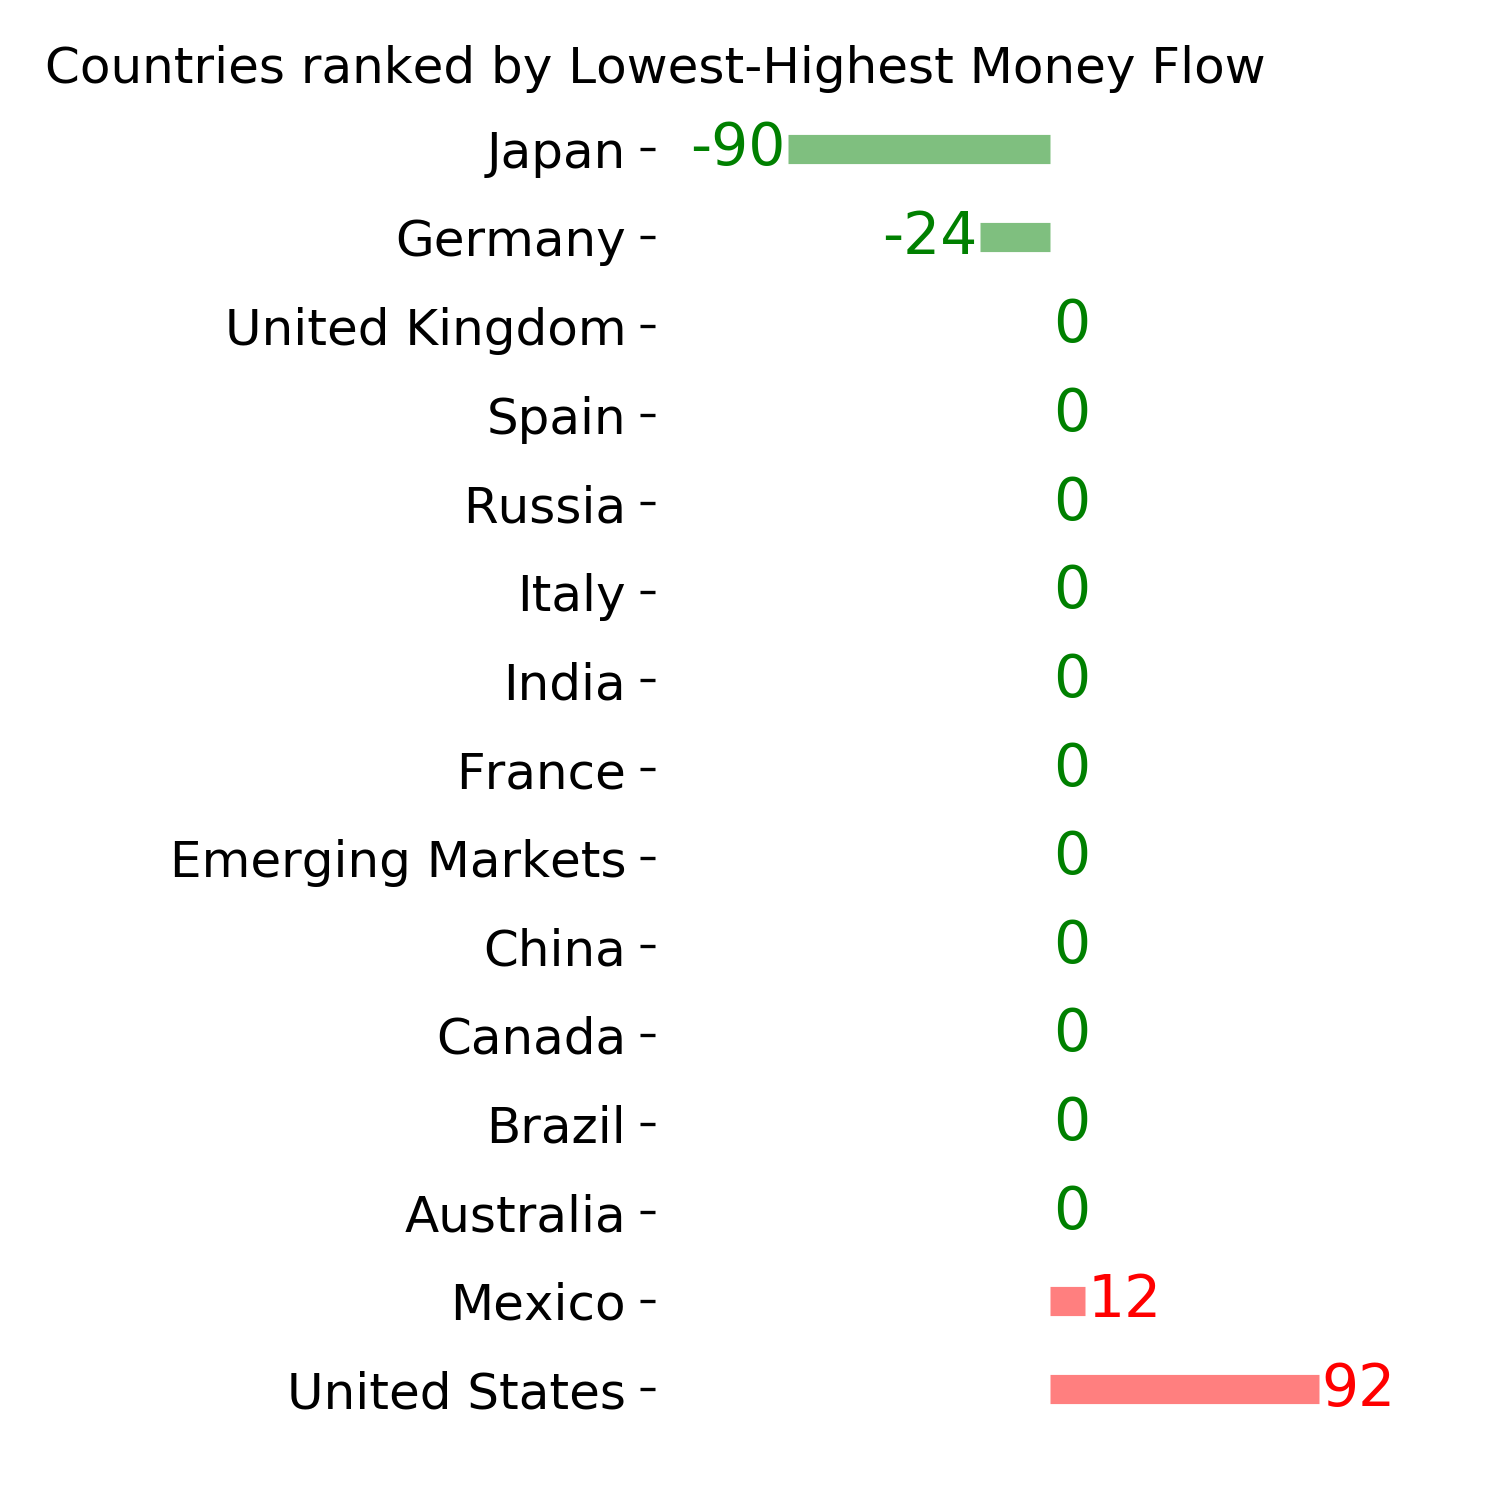
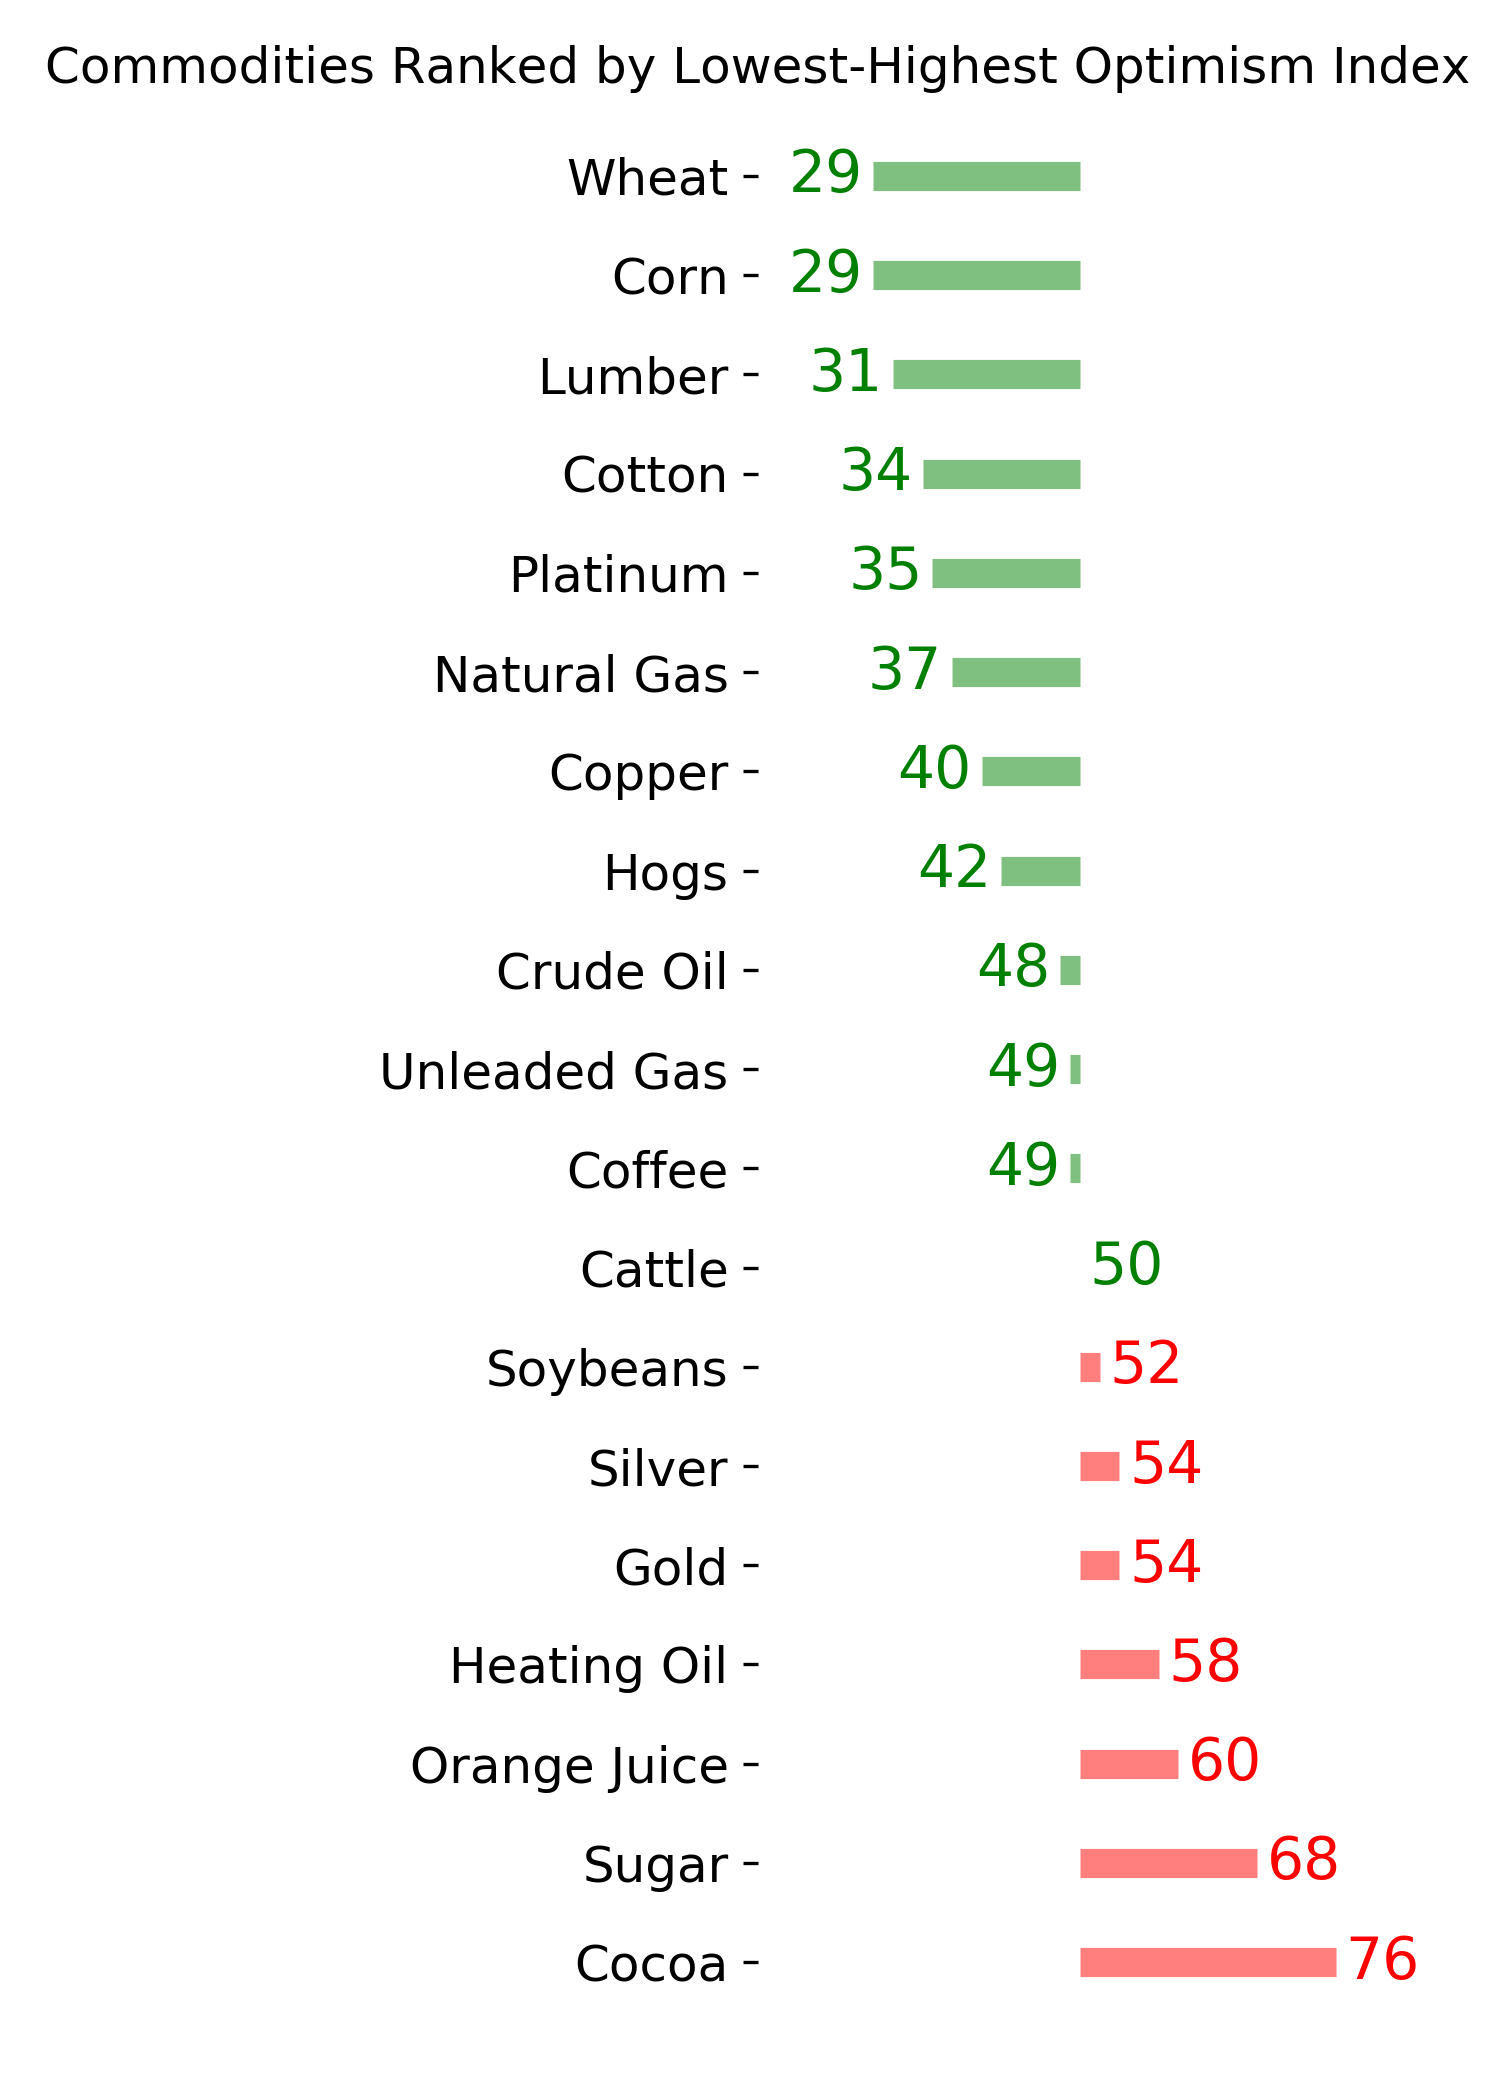
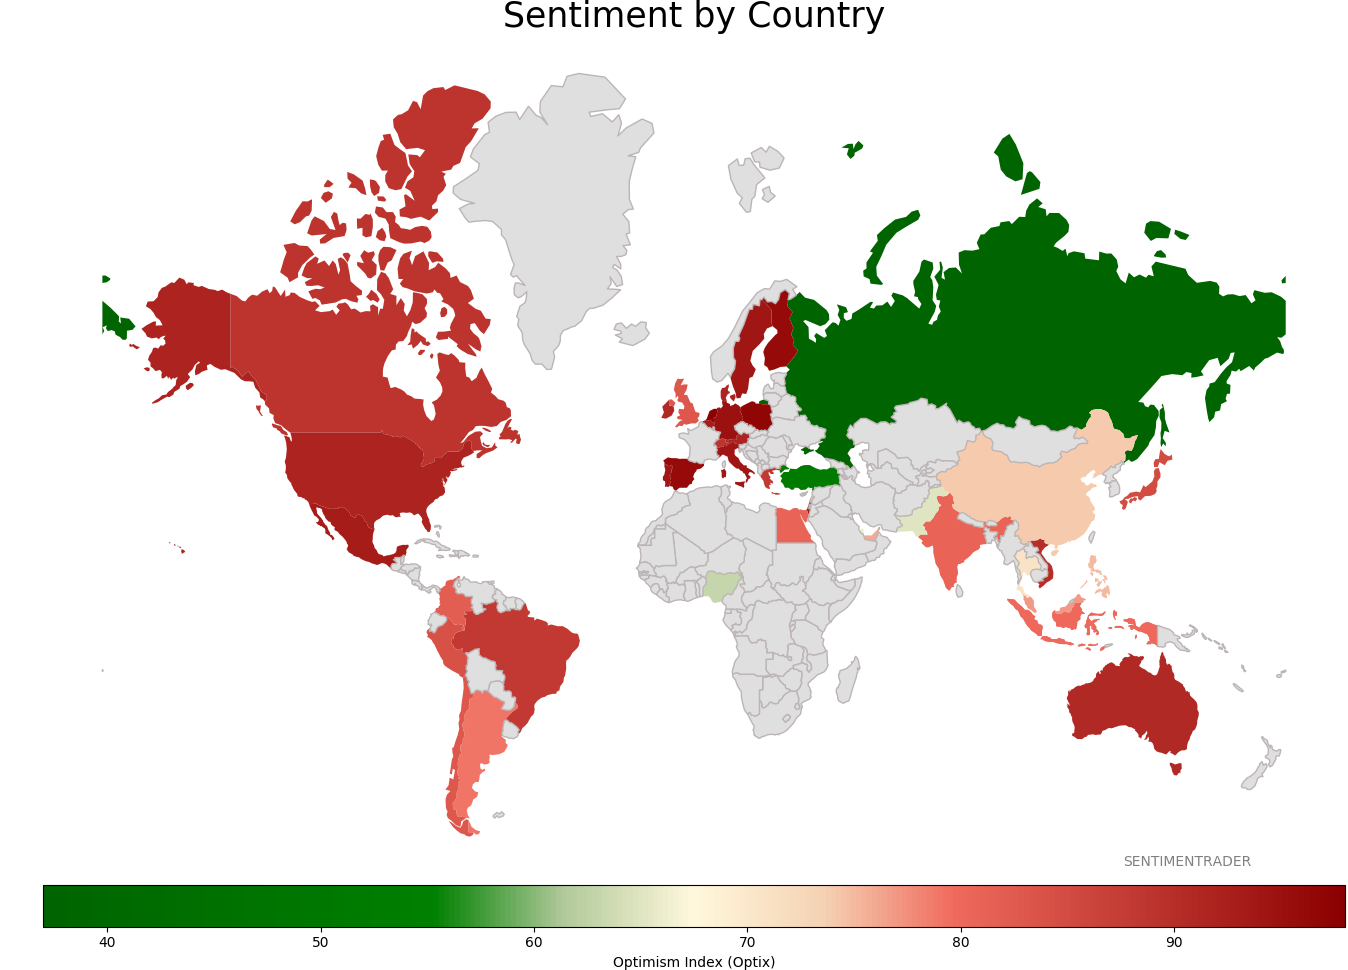
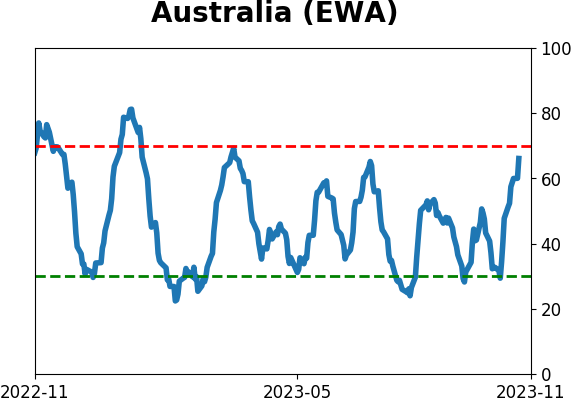
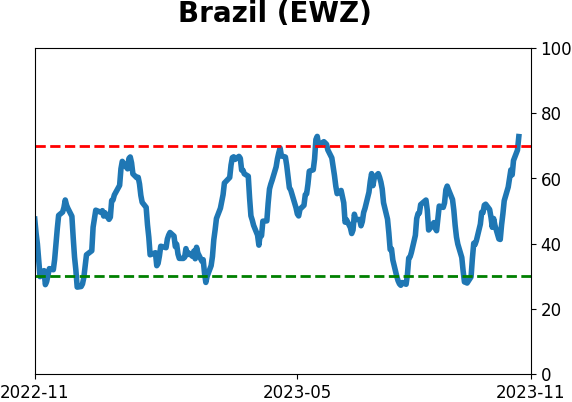
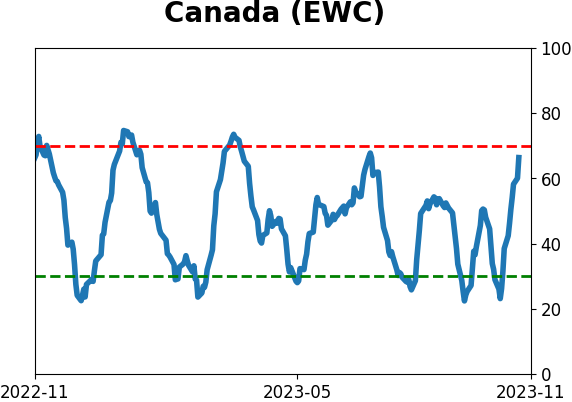
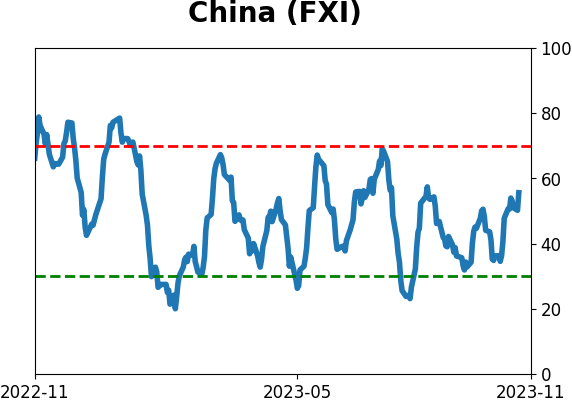
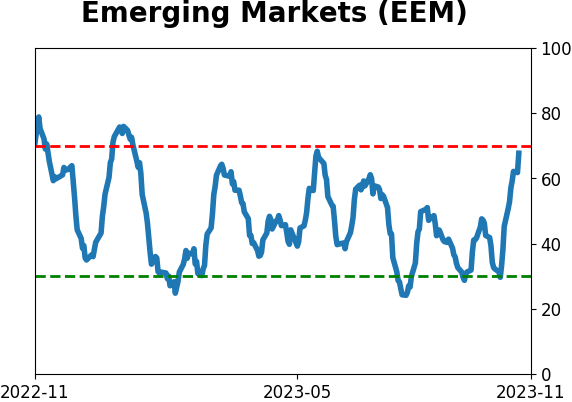
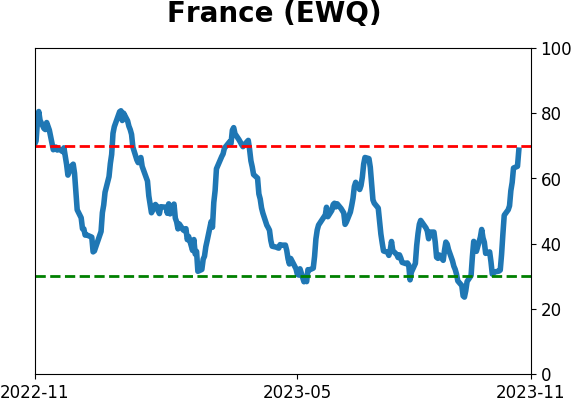
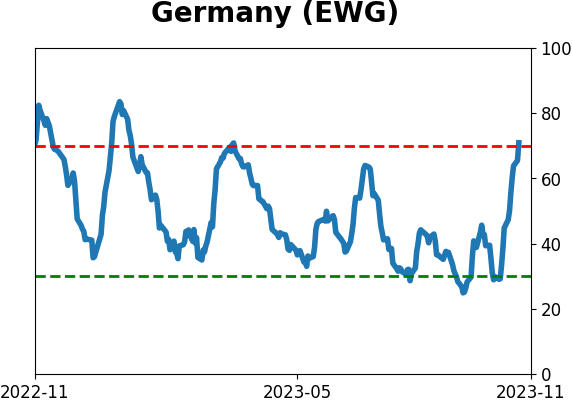
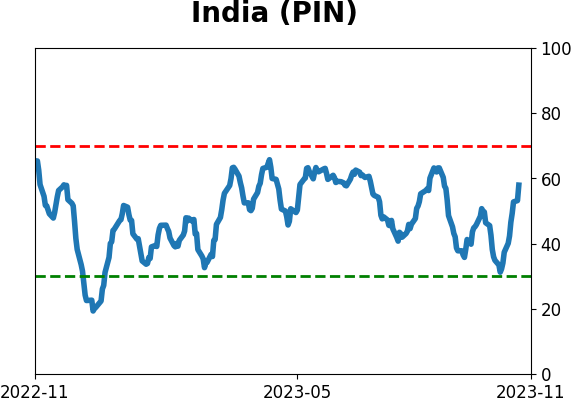
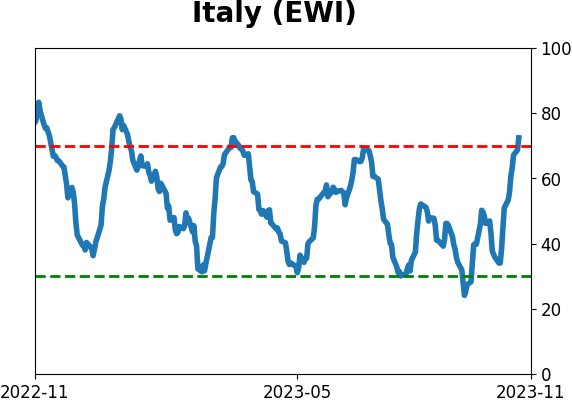
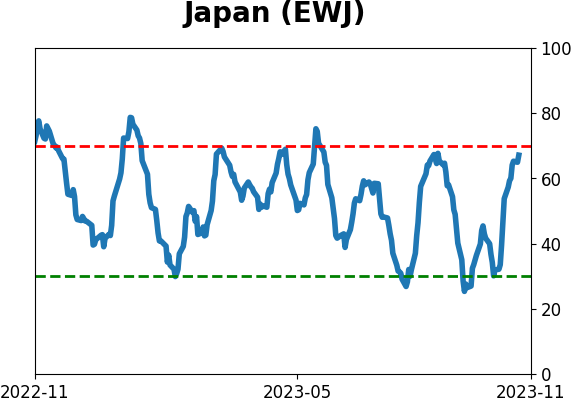
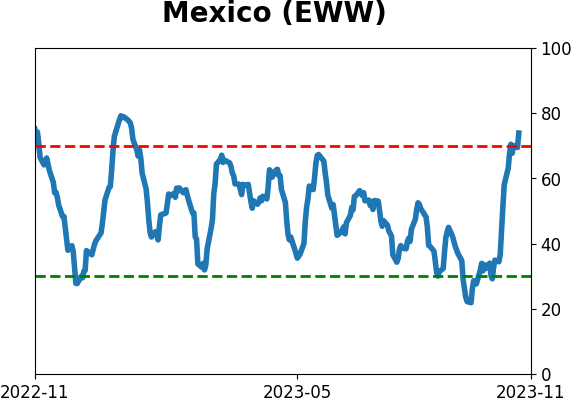
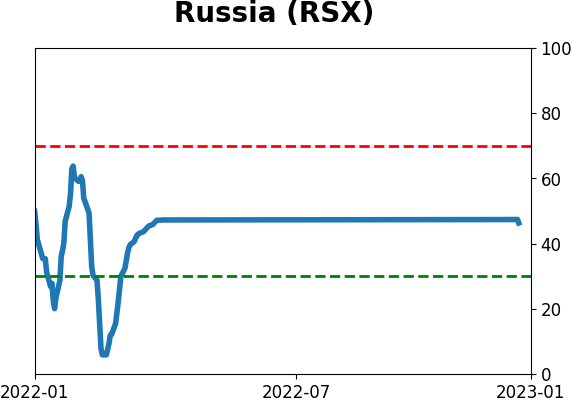
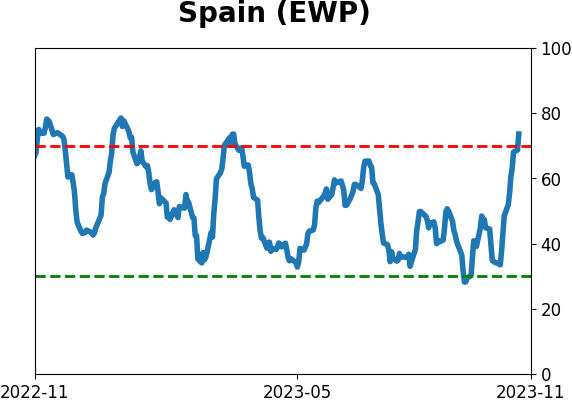
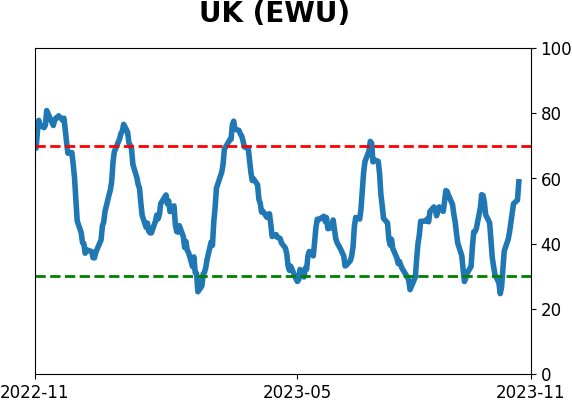
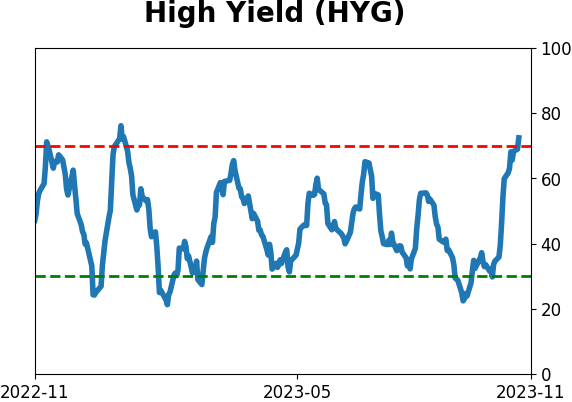
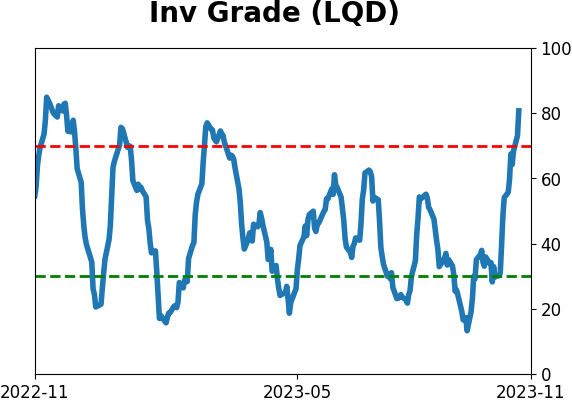
Sentiment Around The World
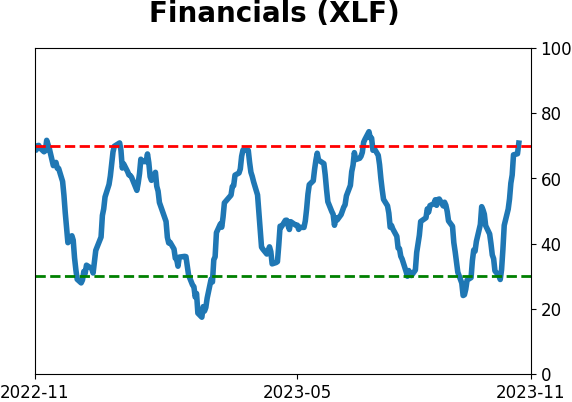
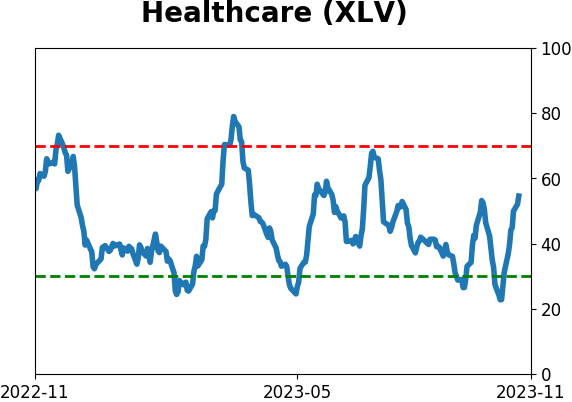
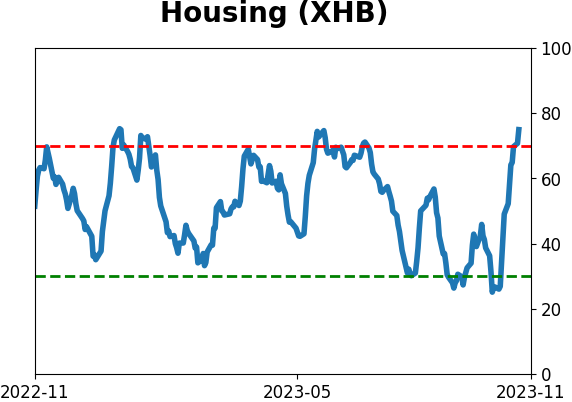
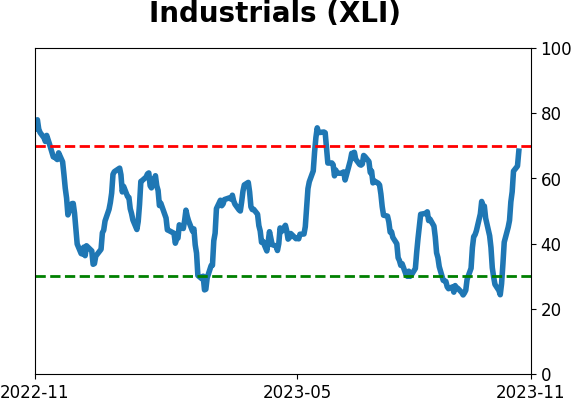
Optimism Index Thumbnails
|
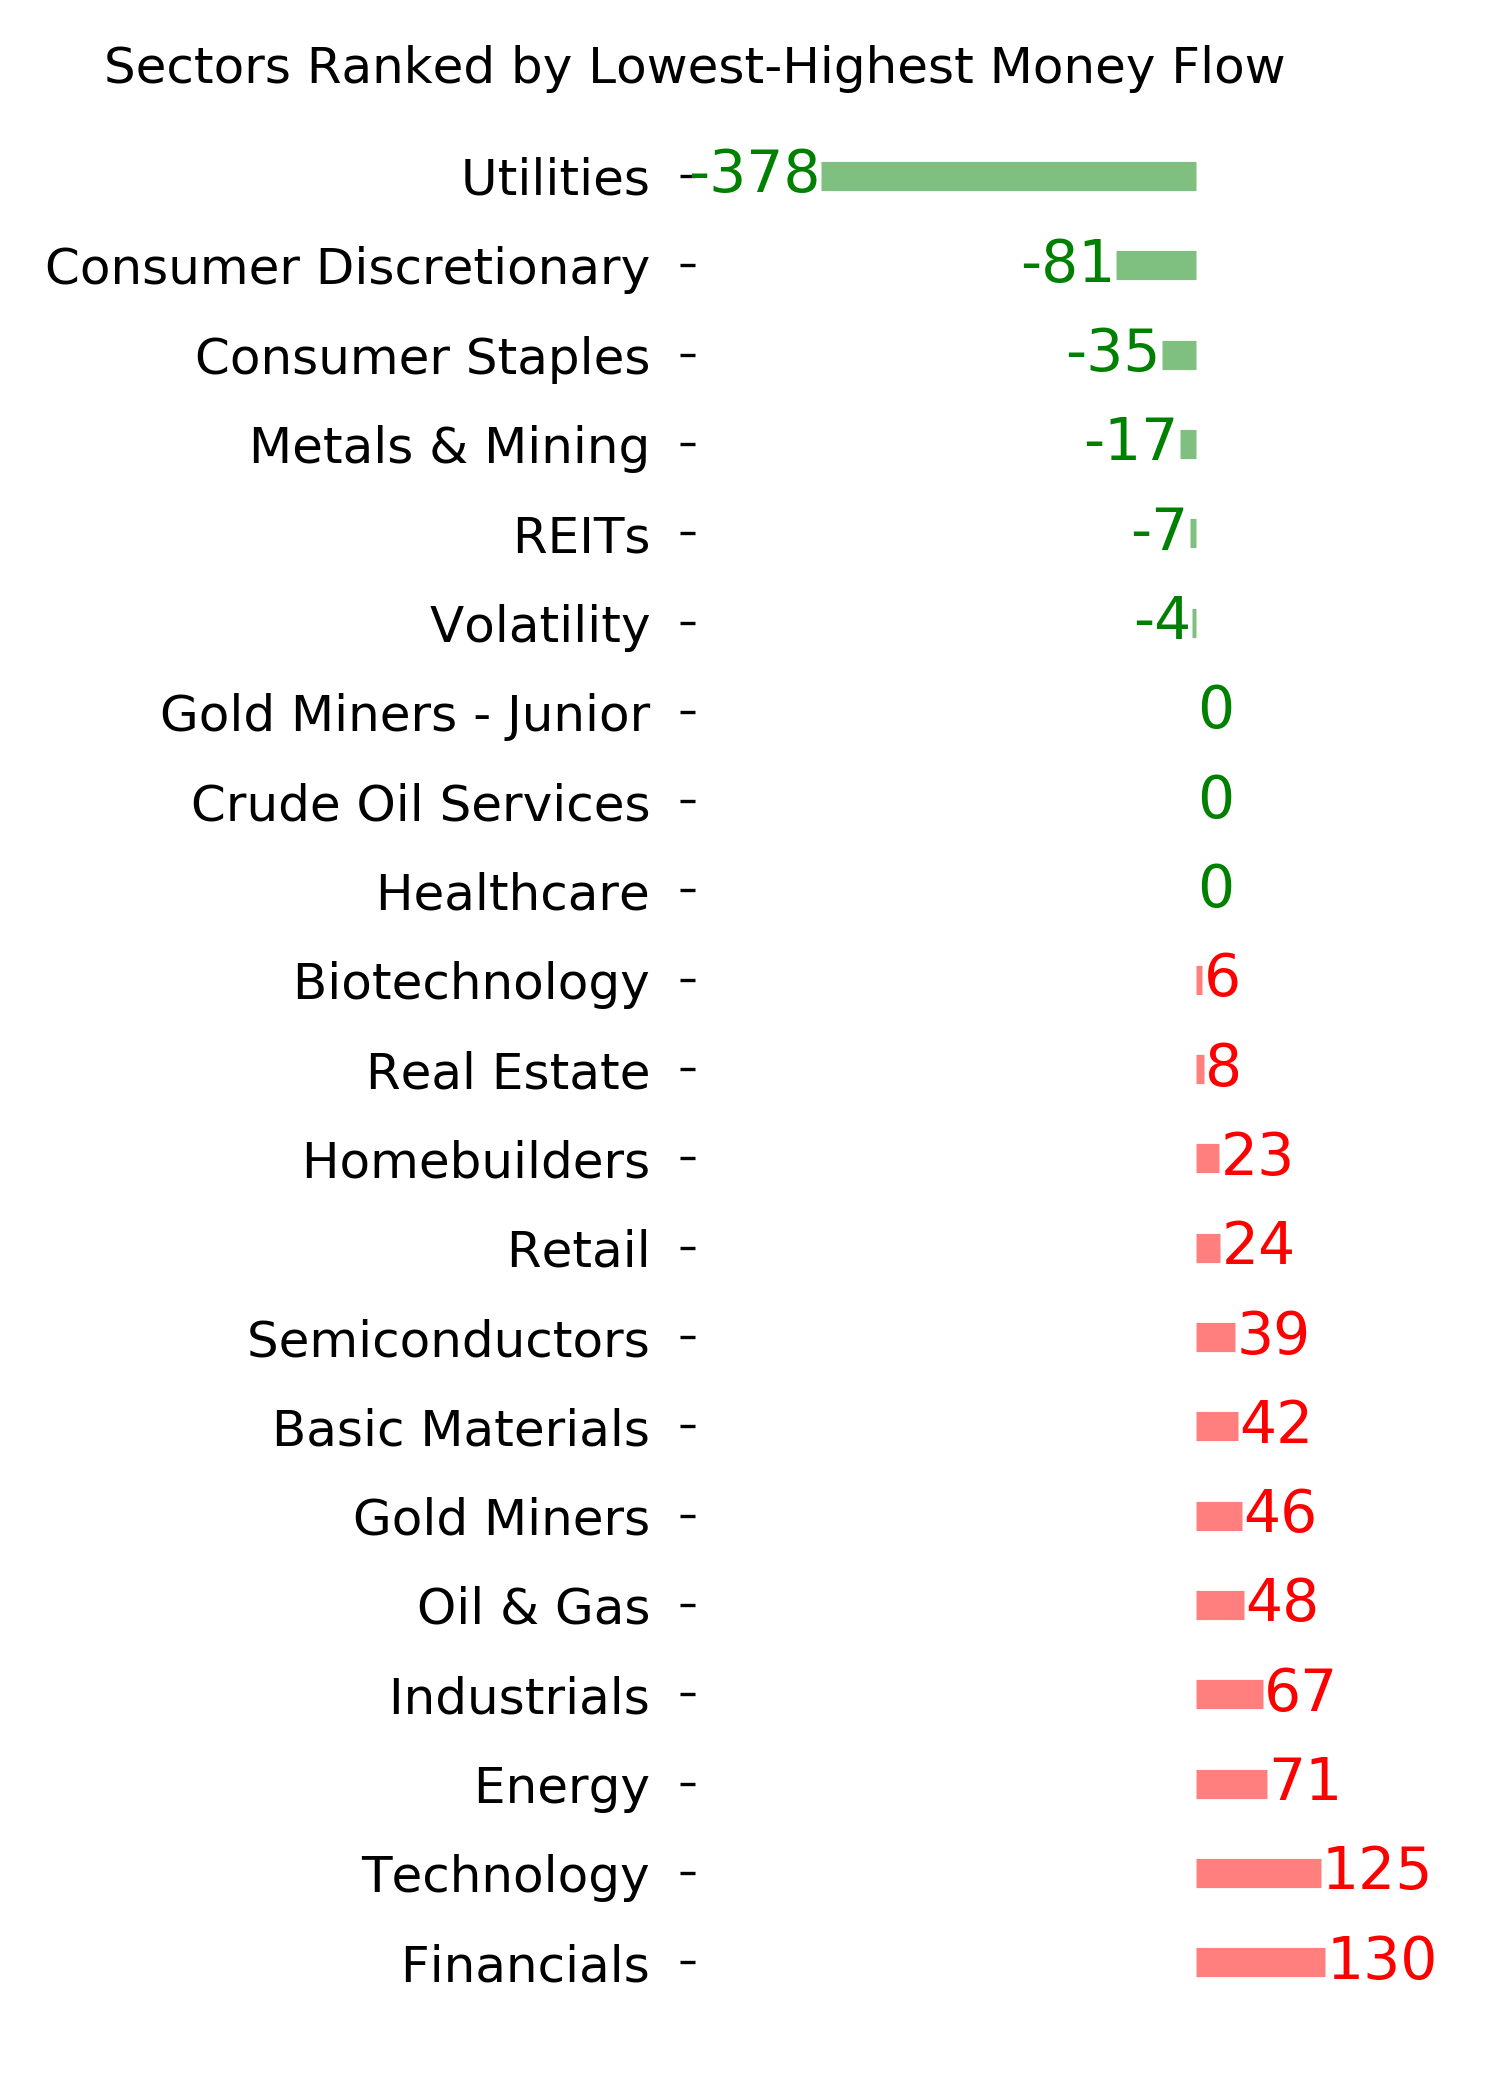
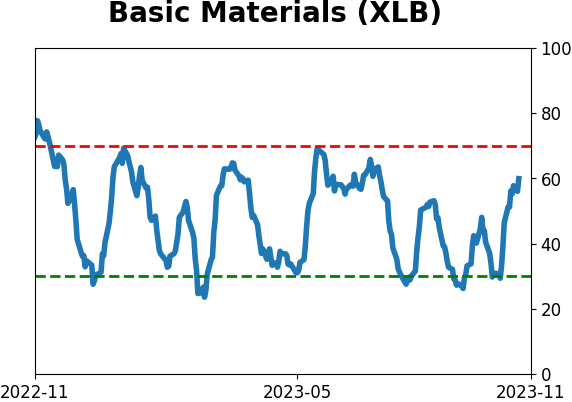
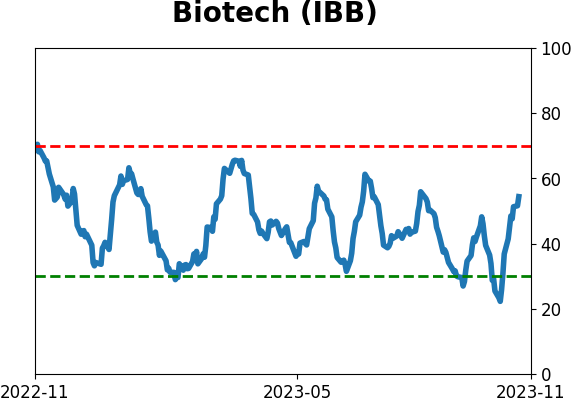
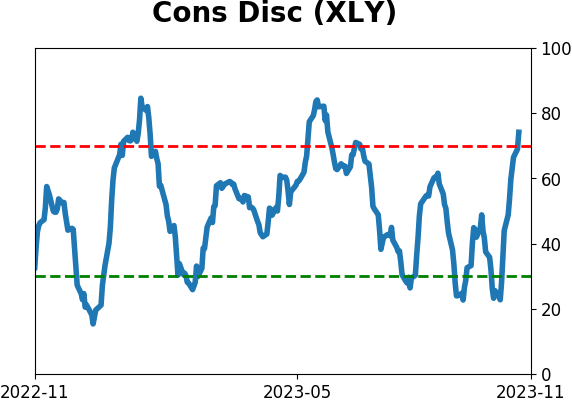
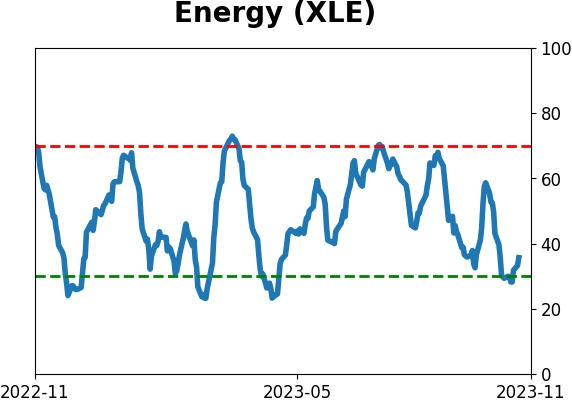
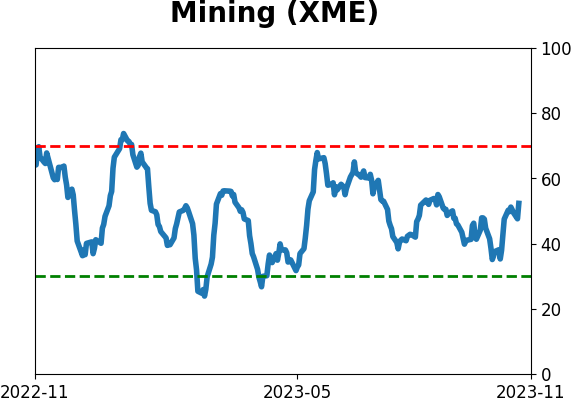
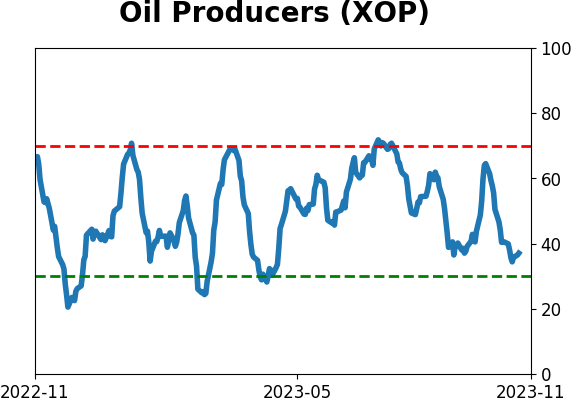
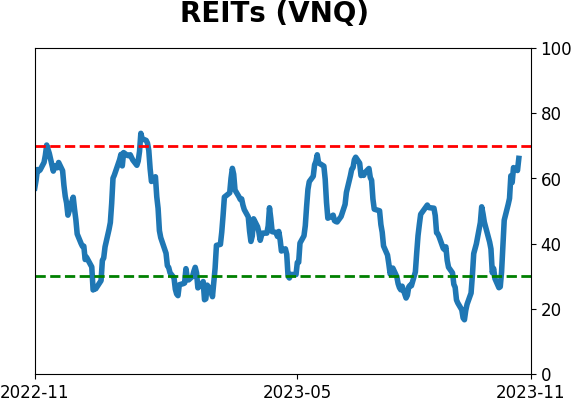
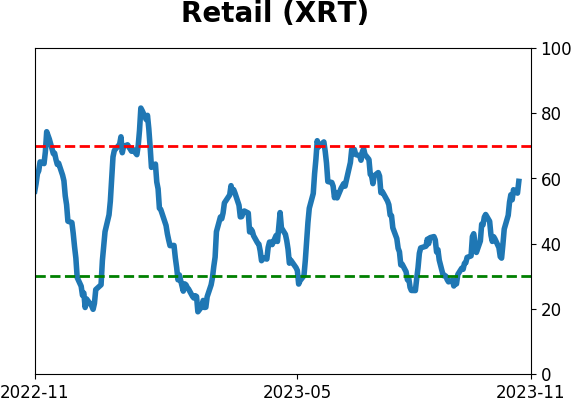
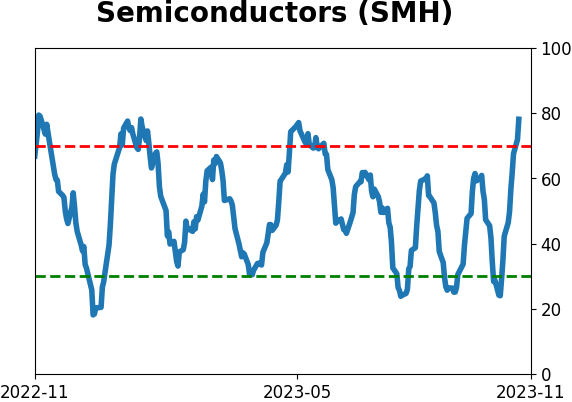
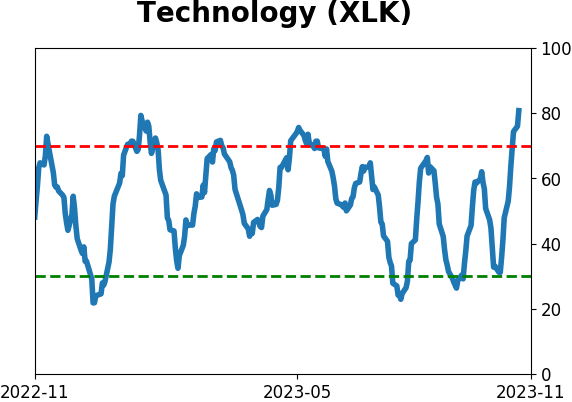
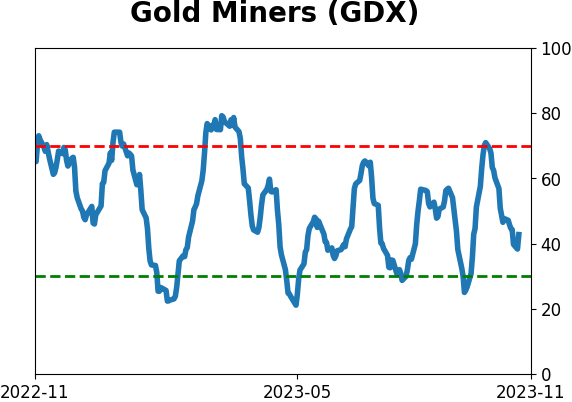
Sector ETF's - 10-Day Moving Average
|
|
|
Country ETF's - 10-Day Moving Average
|
|
|
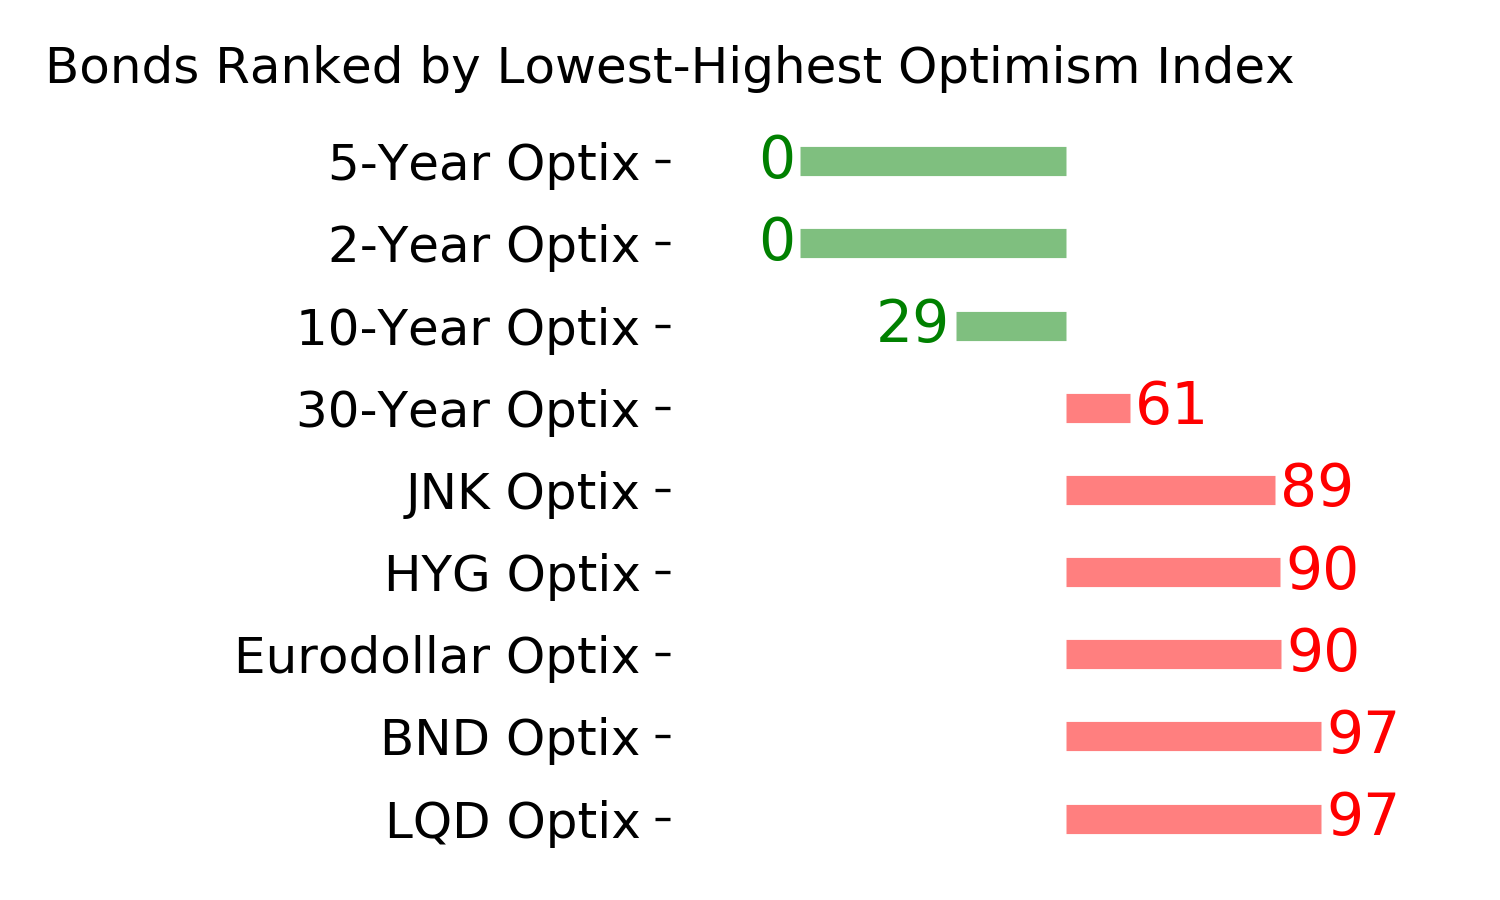
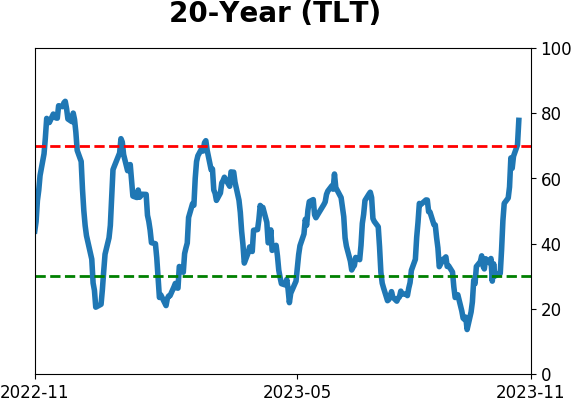
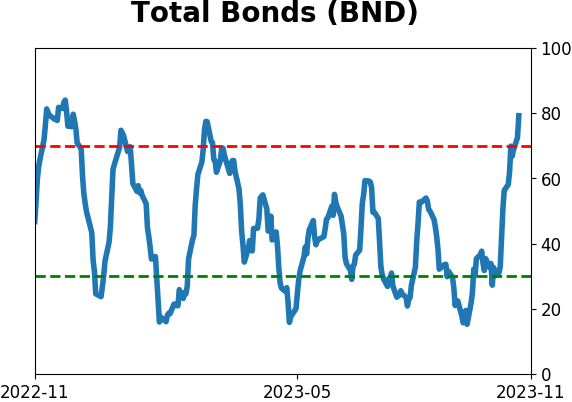
Bond ETF's - 10-Day Moving Average
|
|
|
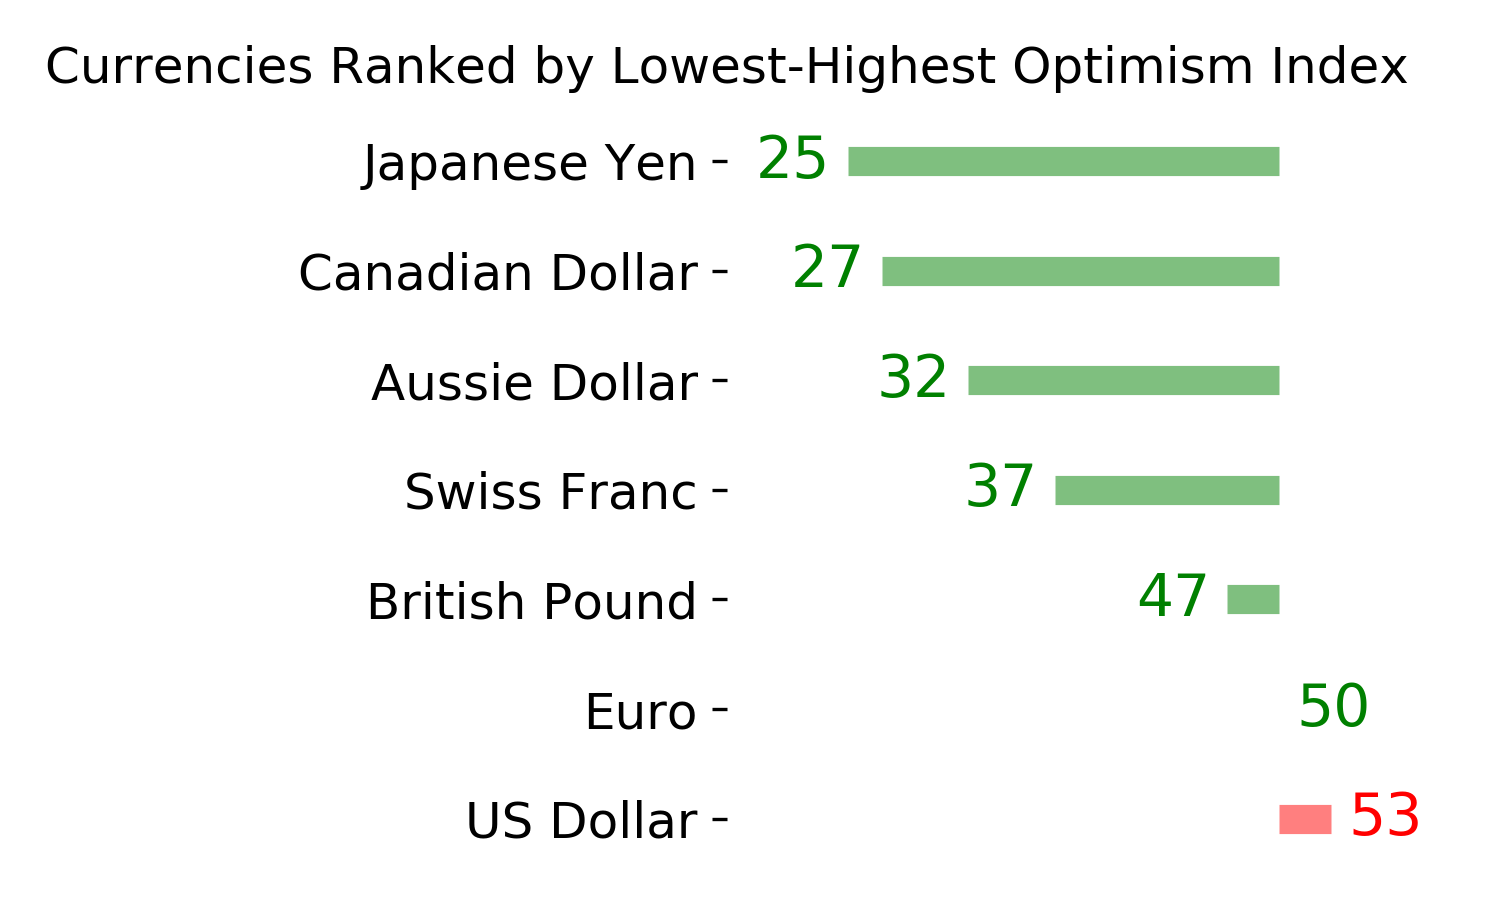
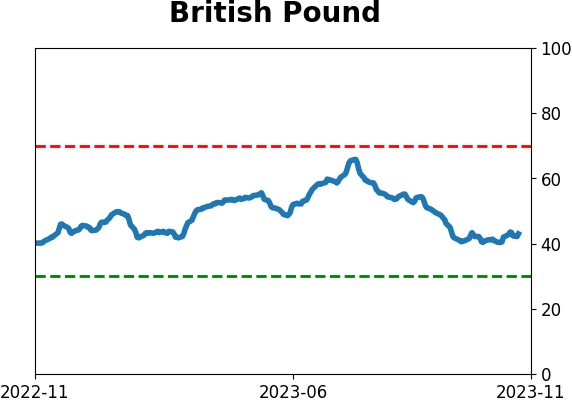
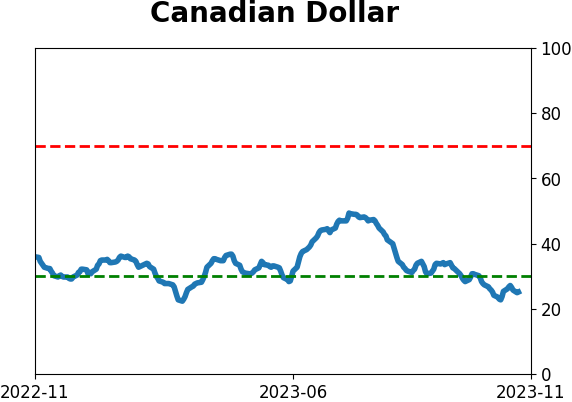
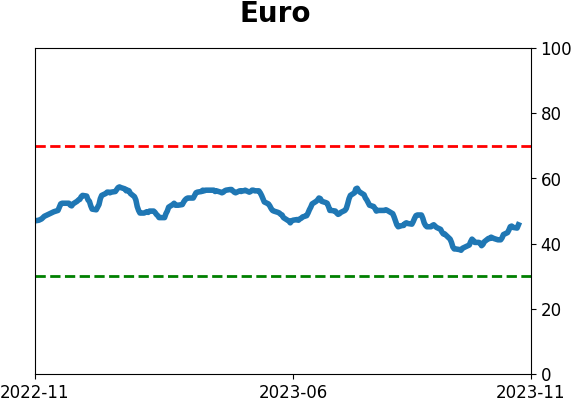
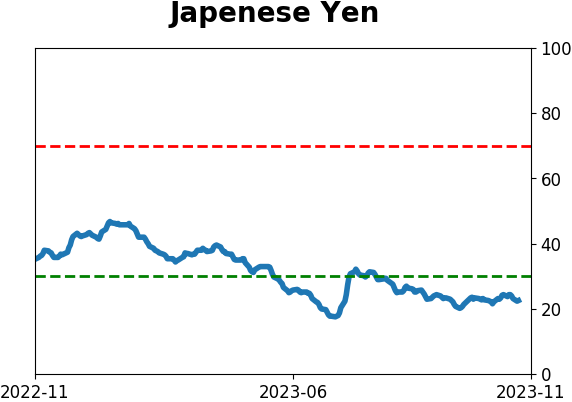
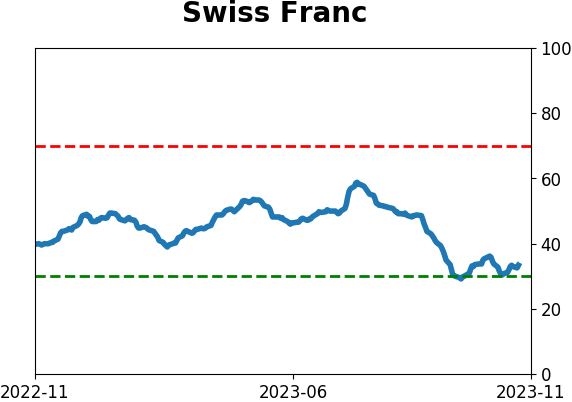
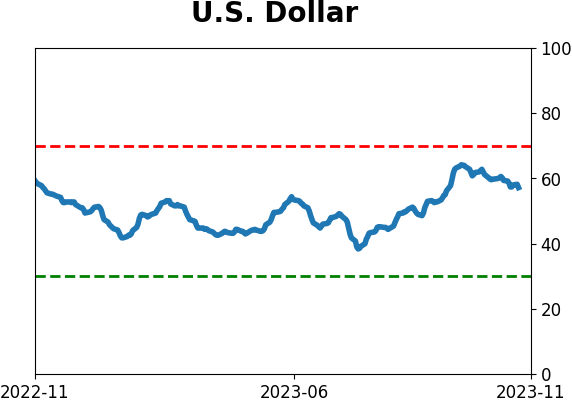
Currency ETF's - 5-Day Moving Average
|
|
|
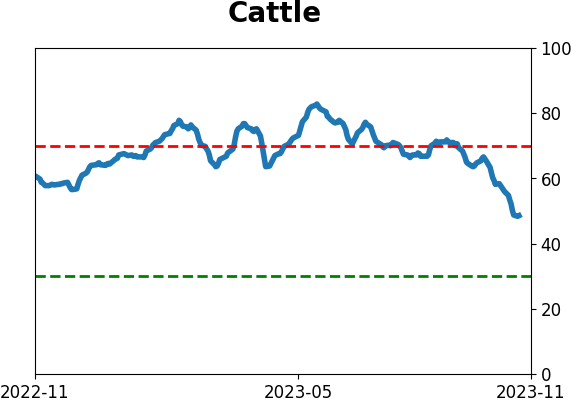
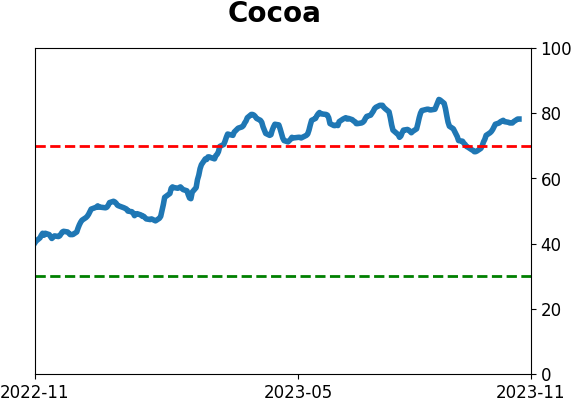
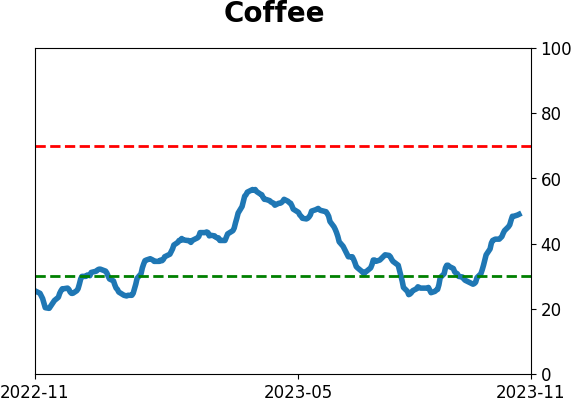
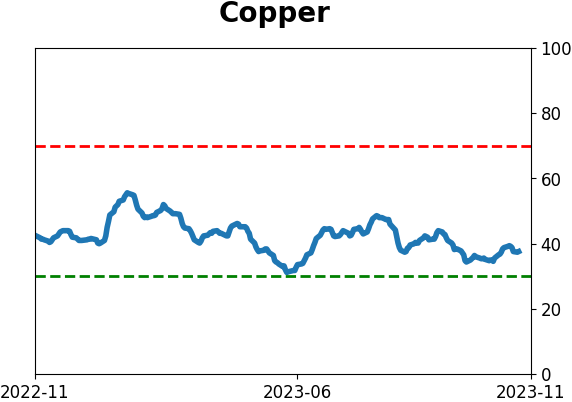
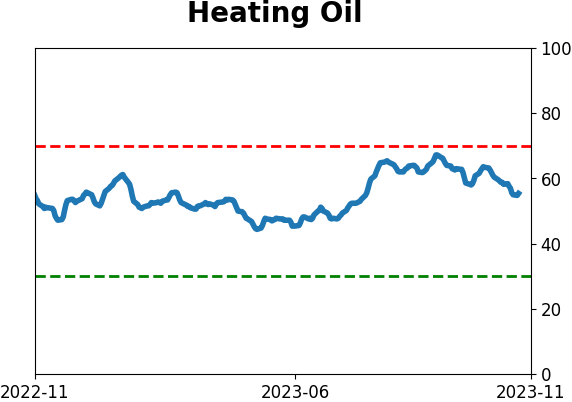
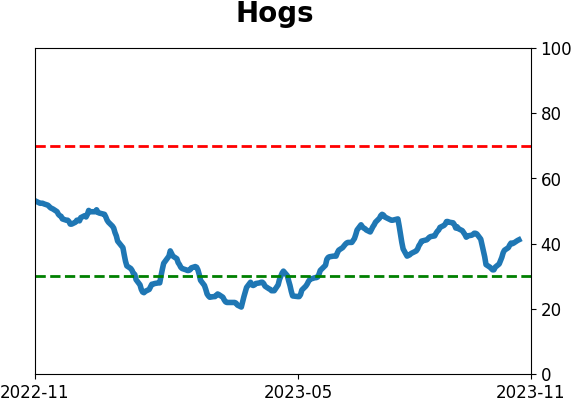
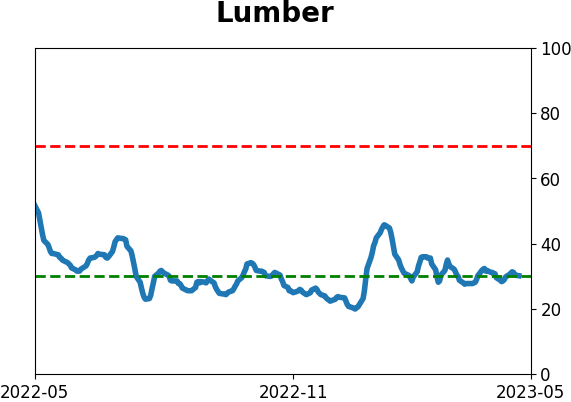
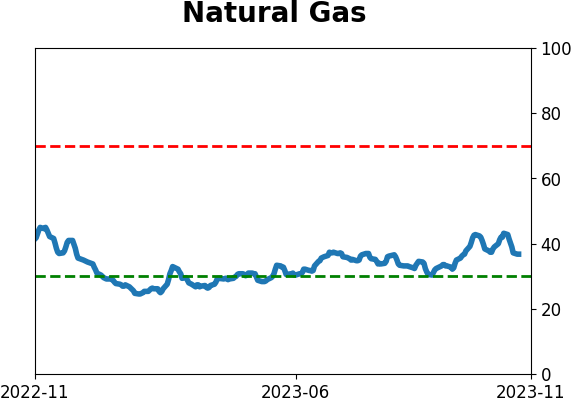
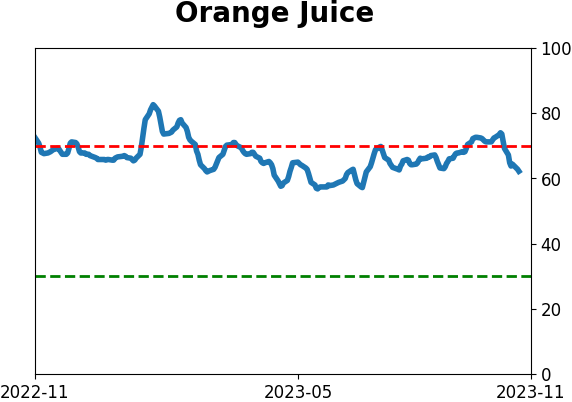
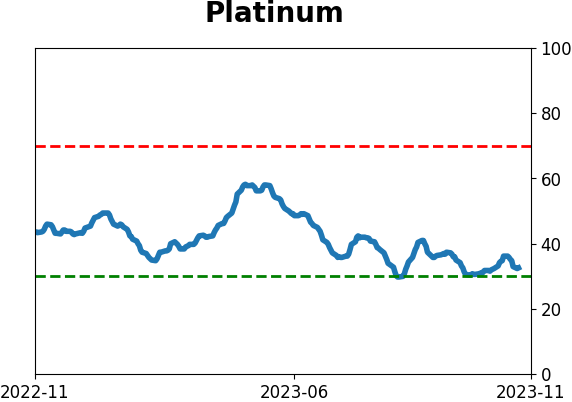
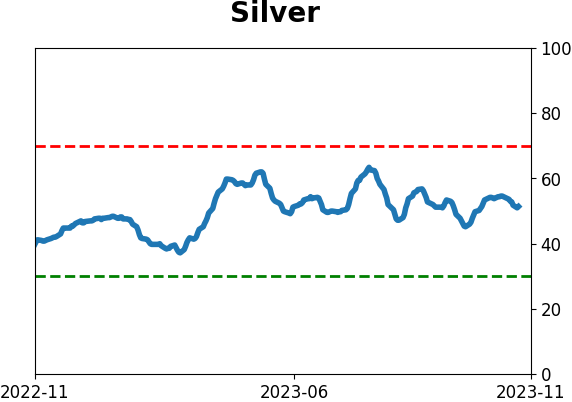
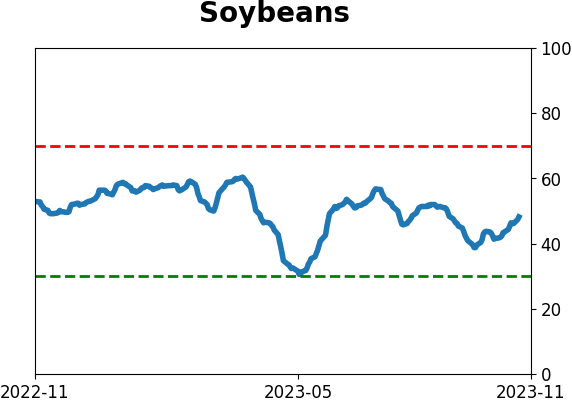
Commodity ETF's - 5-Day Moving Average
|
|