Headlines
|
|
Stocks are rising and investors aren't buying:
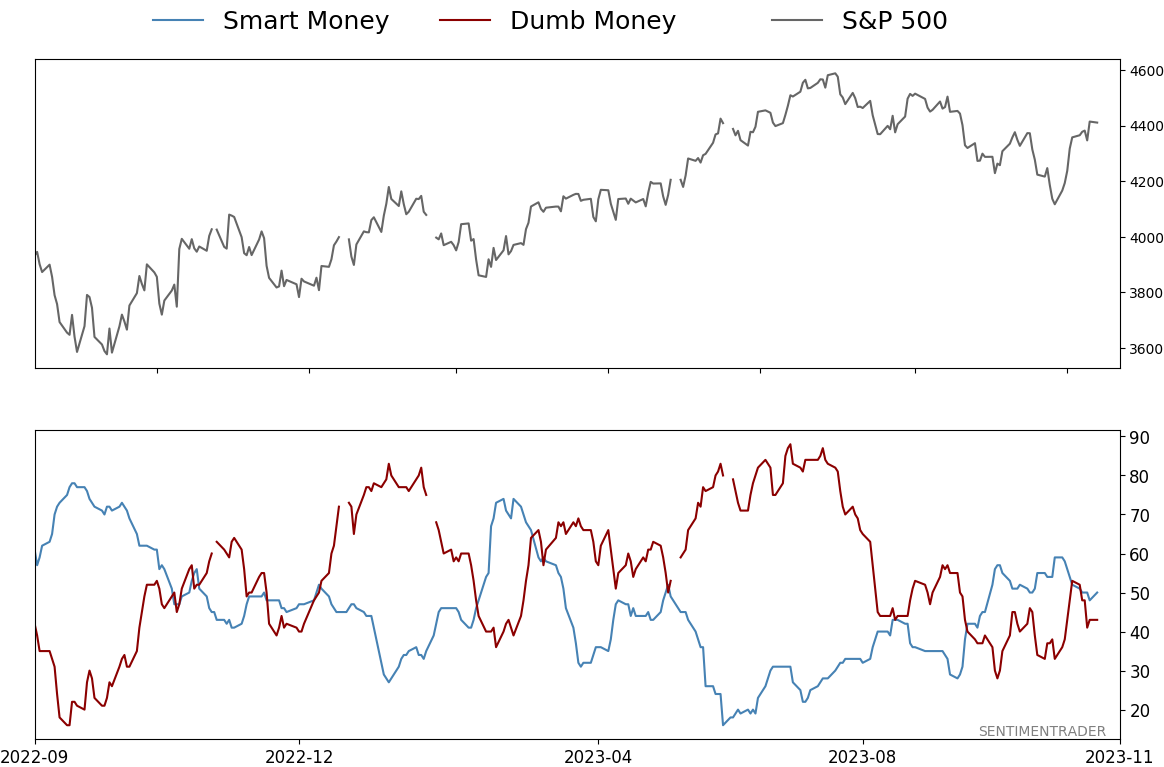
Stocks have been rallying strongly lately, but a couple of sentiment models show that investors aren't all that interested. Both Dumb Money Confidence and the Risk On/Risk Off Indicator are below 50% despite a 30-day high in the S&P. Similar hesitancy mostly preceded gains for stocks, but we should watch for a quick failure.
|
Smart / Dumb Money Confidence
|
Smart Money Confidence: 50%
Dumb Money Confidence: 43%
|
|
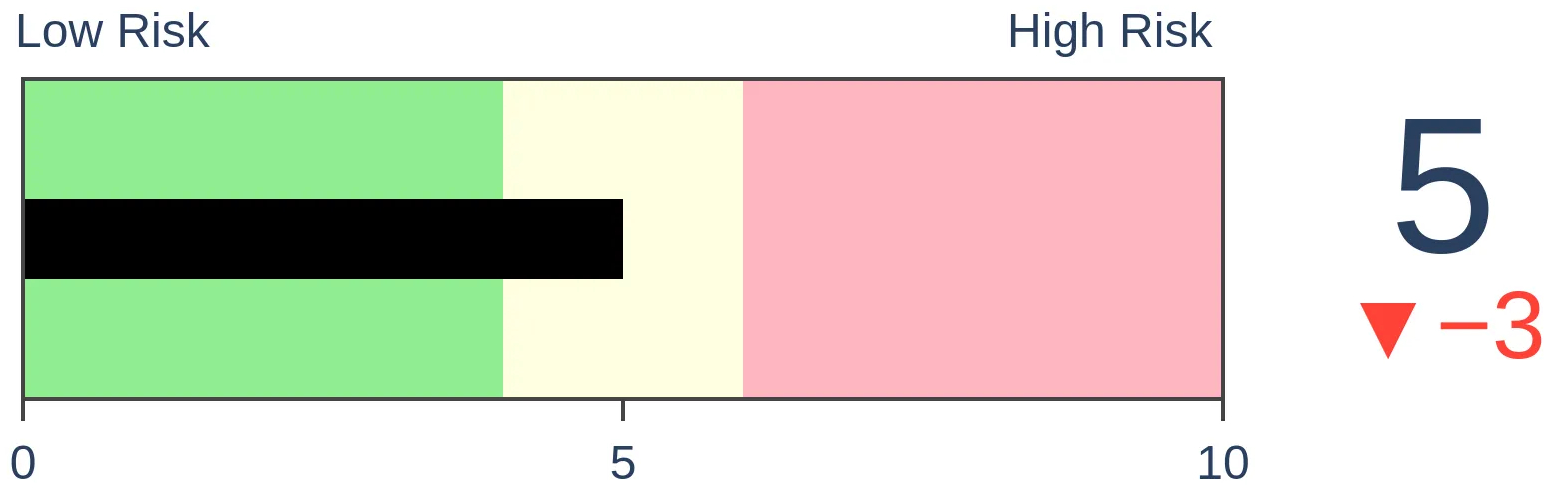
Risk Levels
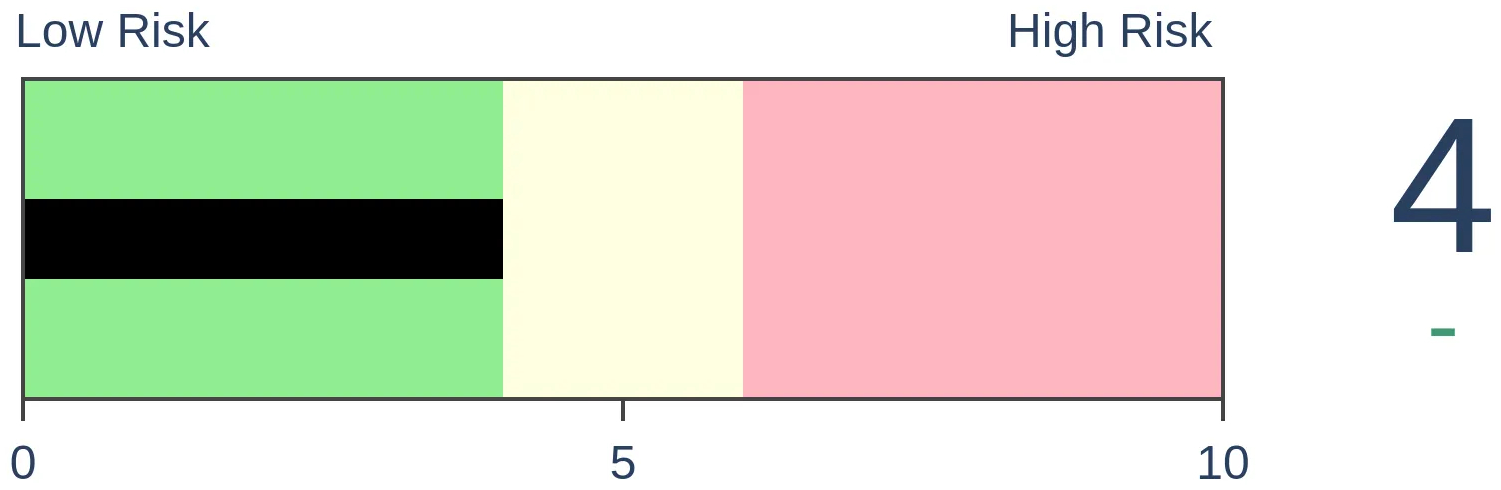
Stocks Short-Term
|
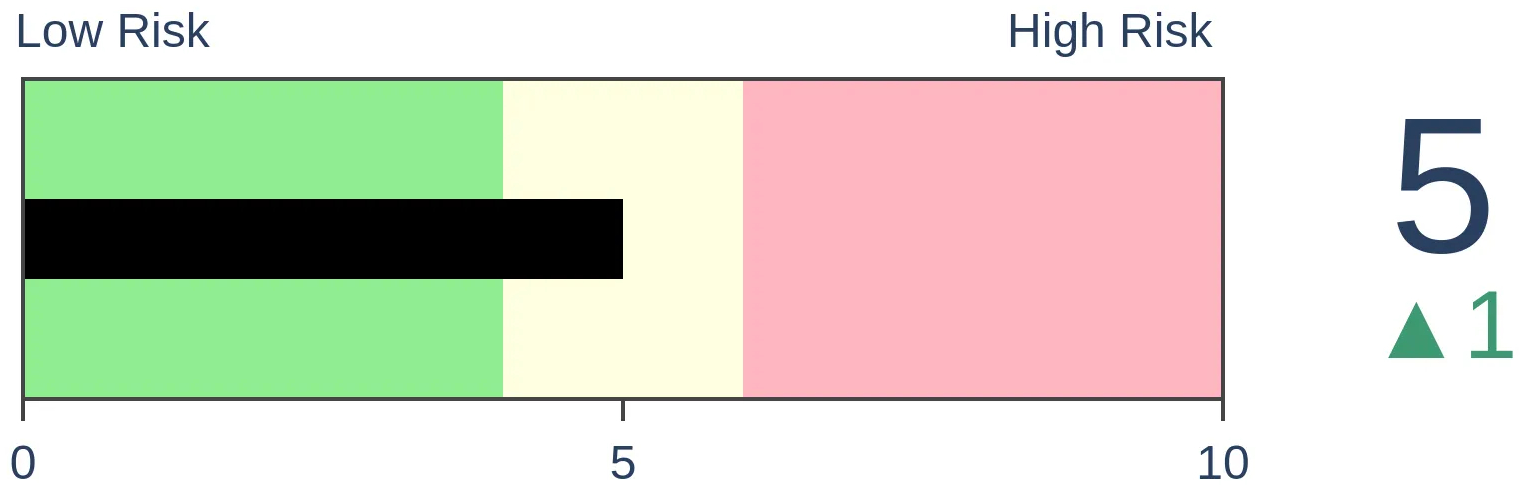
Stocks Medium-Term
|
|
Bonds
|
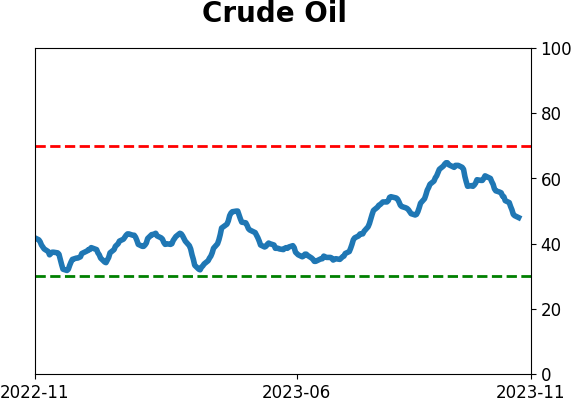
Crude Oil

|
|
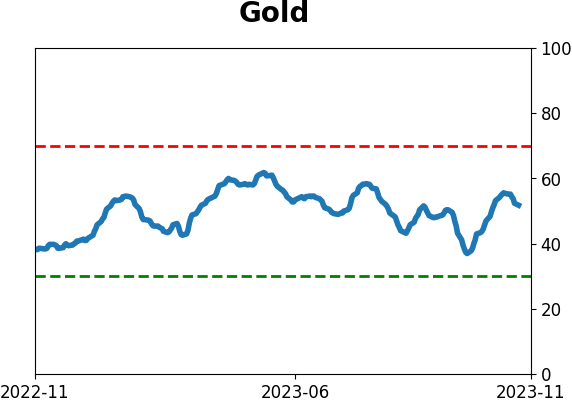
Gold

|
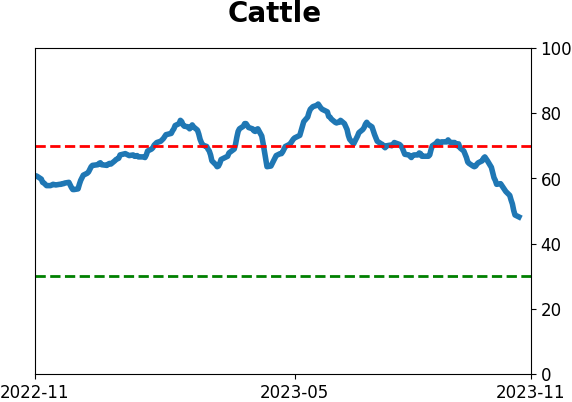
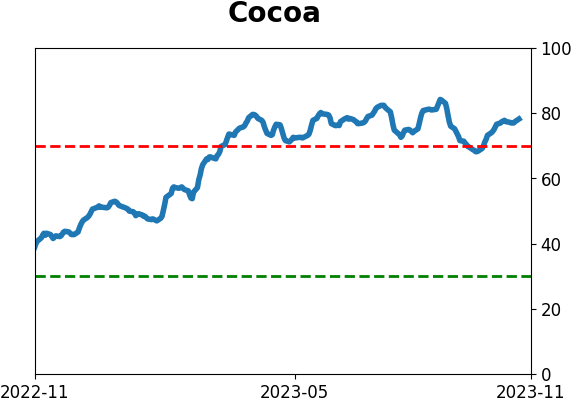
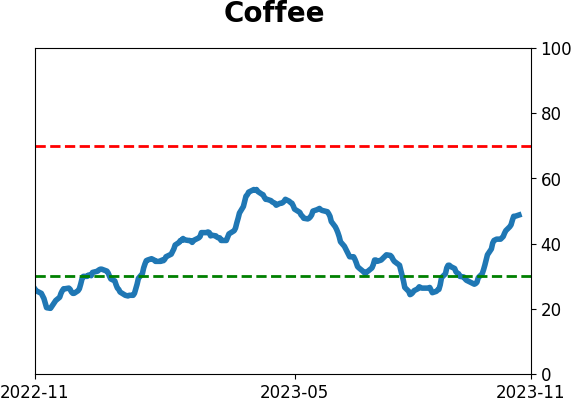
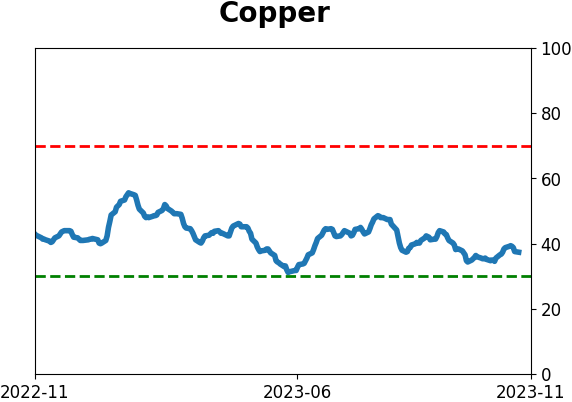
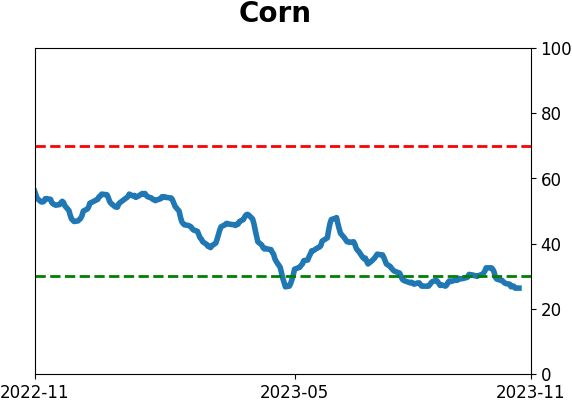
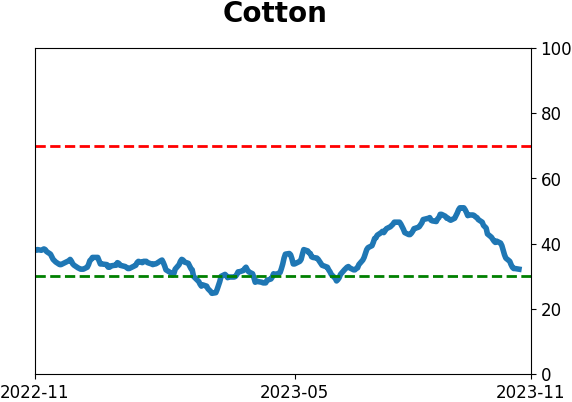
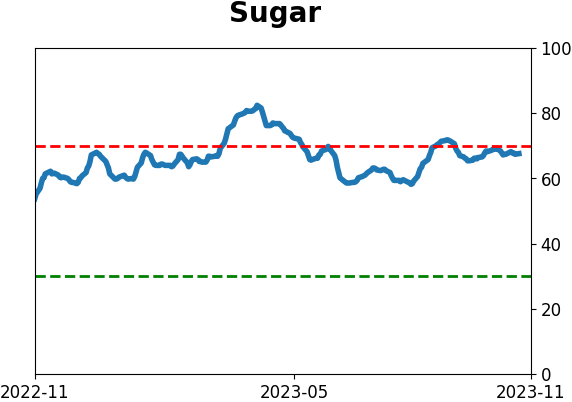
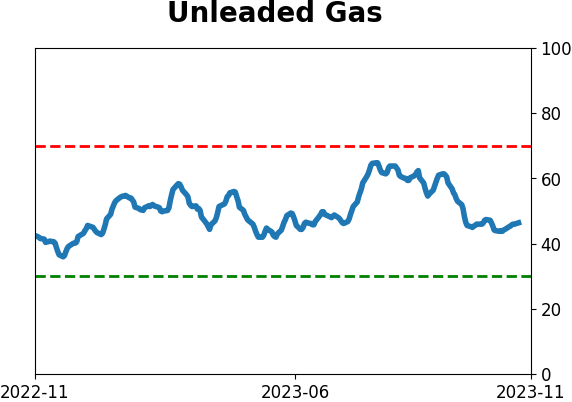
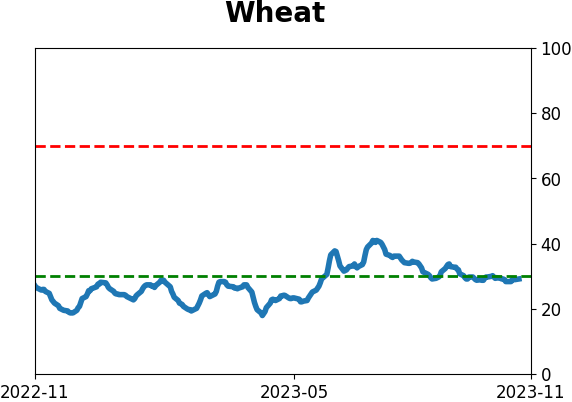
Agriculture
|
|
Research
By Jason Goepfert
BOTTOM LINE
Stocks have been rallying strongly lately, but a couple of sentiment models show that investors aren't all that interested. Both Dumb Money Confidence and the Risk On/Risk Off Indicator are below 50% despite a 30-day high in the S&P. Similar hesitancy mostly preceded gains for stocks, but we should watch for a quick failure.
FORECAST / TIMEFRAME
None
|
Key points:
- The S&P 500 has hit a 30-day high and sentiment models are still subdued
- Both Dumb Money Confidence and the Risk On/Risk Off Indicator are below 50%
- Similar behavior mostly preceded further gains, but we should watch for a quick failure
Recent gains haven't been enough to turn investors bullish
Knee-jerk contrarianism is a pernicious affliction. Investors tend to want to consider anything and everything a contrarian indicator. The trouble is that most things aren't effective as such, and even when they are, context is important.
Some are pointing out a big jump in bulls in the AAII survey last week as a sign of exuberant optimism. But using that survey as a reflection of "investor sentiment" is like using today's weather in Akron, OH as a reflection of "global climate." We've run regressions between that survey and dozens of demographic factors like age, income, race, and gender; it's mostly just a tiny, self-selected sample of modestly well-off crabby old white men.
We prefer to use broader models to approximate the current state of sentiment since there's always some indicator or other giving a weird reading.
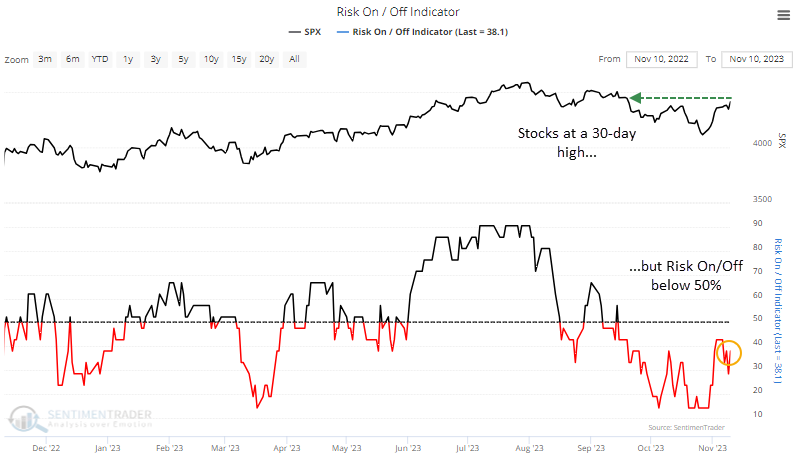
There are enough counter-vailing indicators to the AAII survey that a couple of broader sentiment models are subdued. Despite the S&P 500 rising to more than a 30-day high, Dumb Money Confidence is still well below 50%.
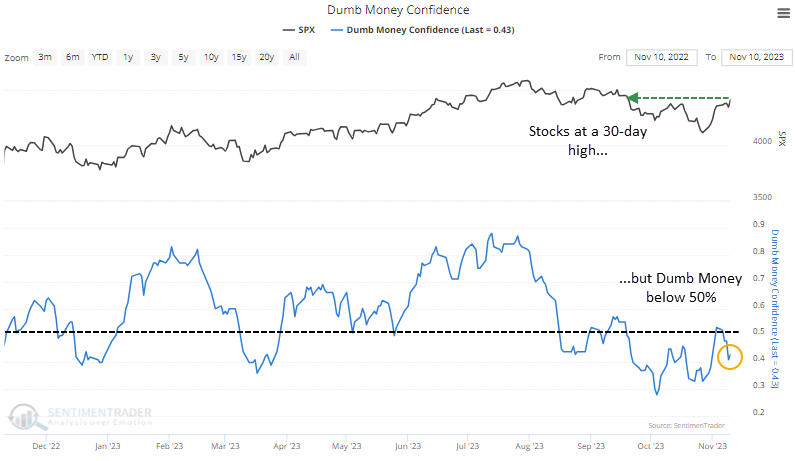
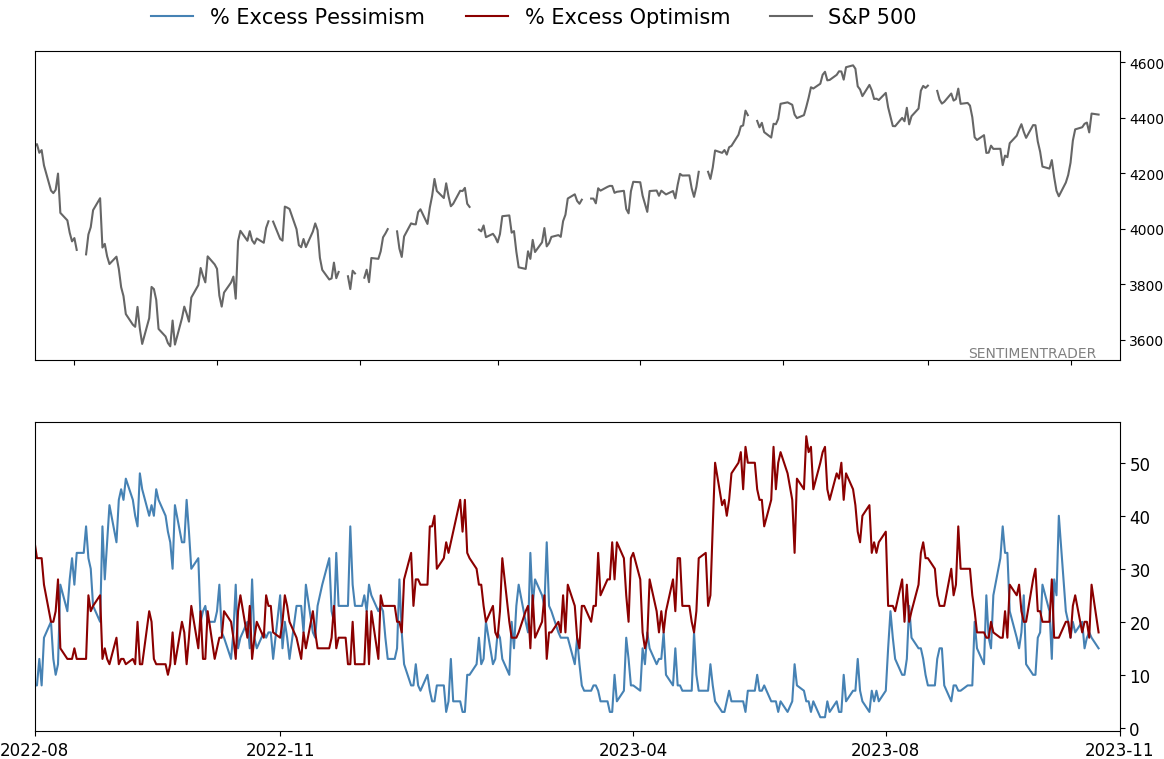
And the Risk On/Risk Off Indicator shows that fewer than 50% of indicators have climbed into risk-on territory.
This is where a knee-jerk contrarian would scream, "Buy!" If the average investor is relatively pessimistic in spite of good price action, then surely it's a sign of gains to come. But it's not that simple.
Hesitant sentiment can be a buy signal...sometimes
Bull markets need investors to become more bullish, not less. Subdued sentiment isn't necessarily a good sign. It can be, but it's not necessarily so. It happened several times since the 2022 peak, and the S&P 500 enjoyed minimal gains and concerning declines in the weeks afterward.
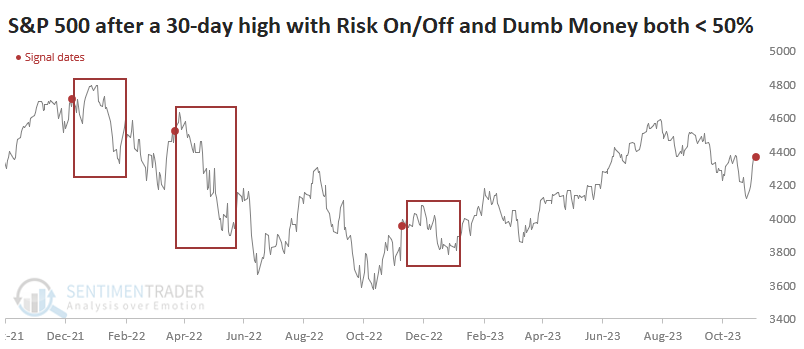
If we zoom out and look at all similar behavior since the year 2000 (as far back as we can go), it was a mixed sign. The table below shows every time the S&P eked out at least a 30-day high, and both Dumb Money Confidence and the Risk On/Off Indicator were below 50%.
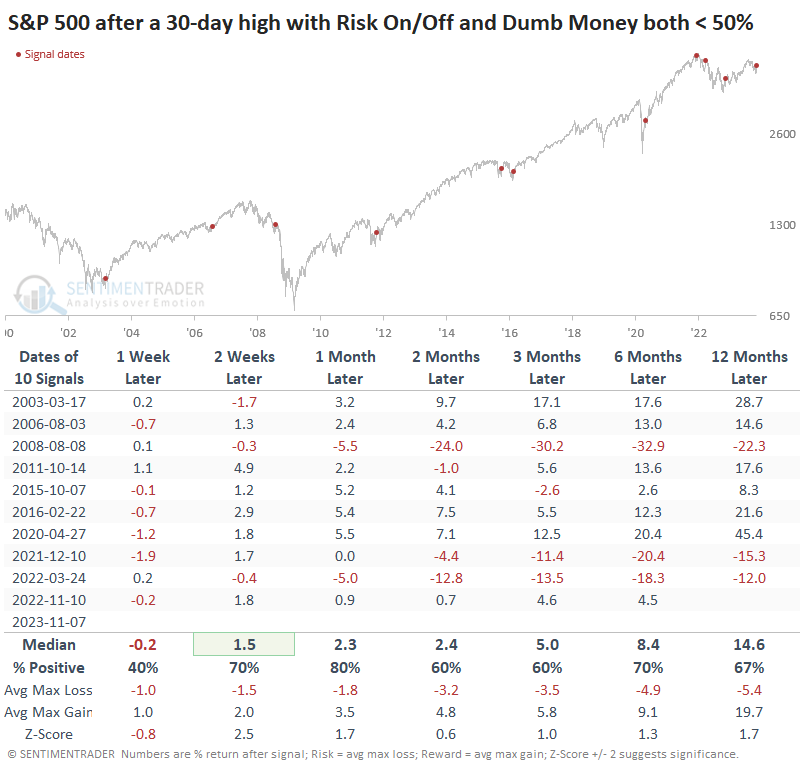
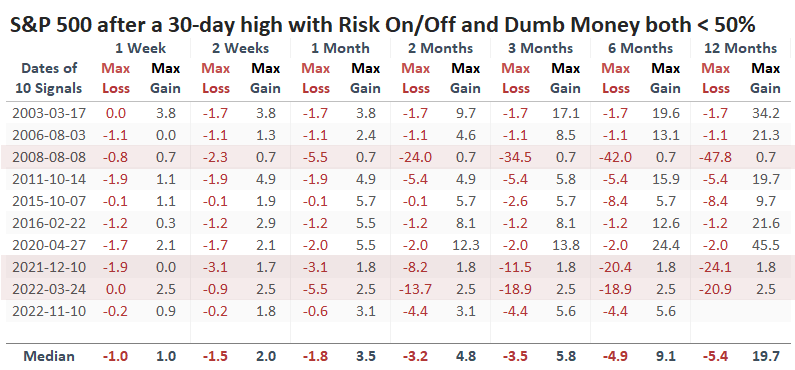
With such mixed results, the information isn't all that useful. However, it can be instructive to look at the maximum gains and losses across time frames after each signal. Doing so shows that the three times the signals failed miserably - in 2008, 2021, and 2022, the index lost more than -3% within the first month after the signal. None of the successful signals did so.
What the research tells us...
Everyone likes to go against the grain. When it works, it not only allows us to profit but also to feel superior to all the other investors out there. It's a dangerous game to play, however, because assuming that every indicator is a contrary indicator every time is a fool's game.
Using broad models of sentiment, we can see that investors seem to be relatively hesitant about jumping onto the latest rally. That seems like a tempting buy signal for bulls, but it hasn't been that easy. While the sample size is tiny, there has been compelling consistency after similar behavior, and if the S&P does not decline any more than -3% within the next few weeks, bulls should have more evidence that being contrarian is the right move this time.
Indicators at Extremes
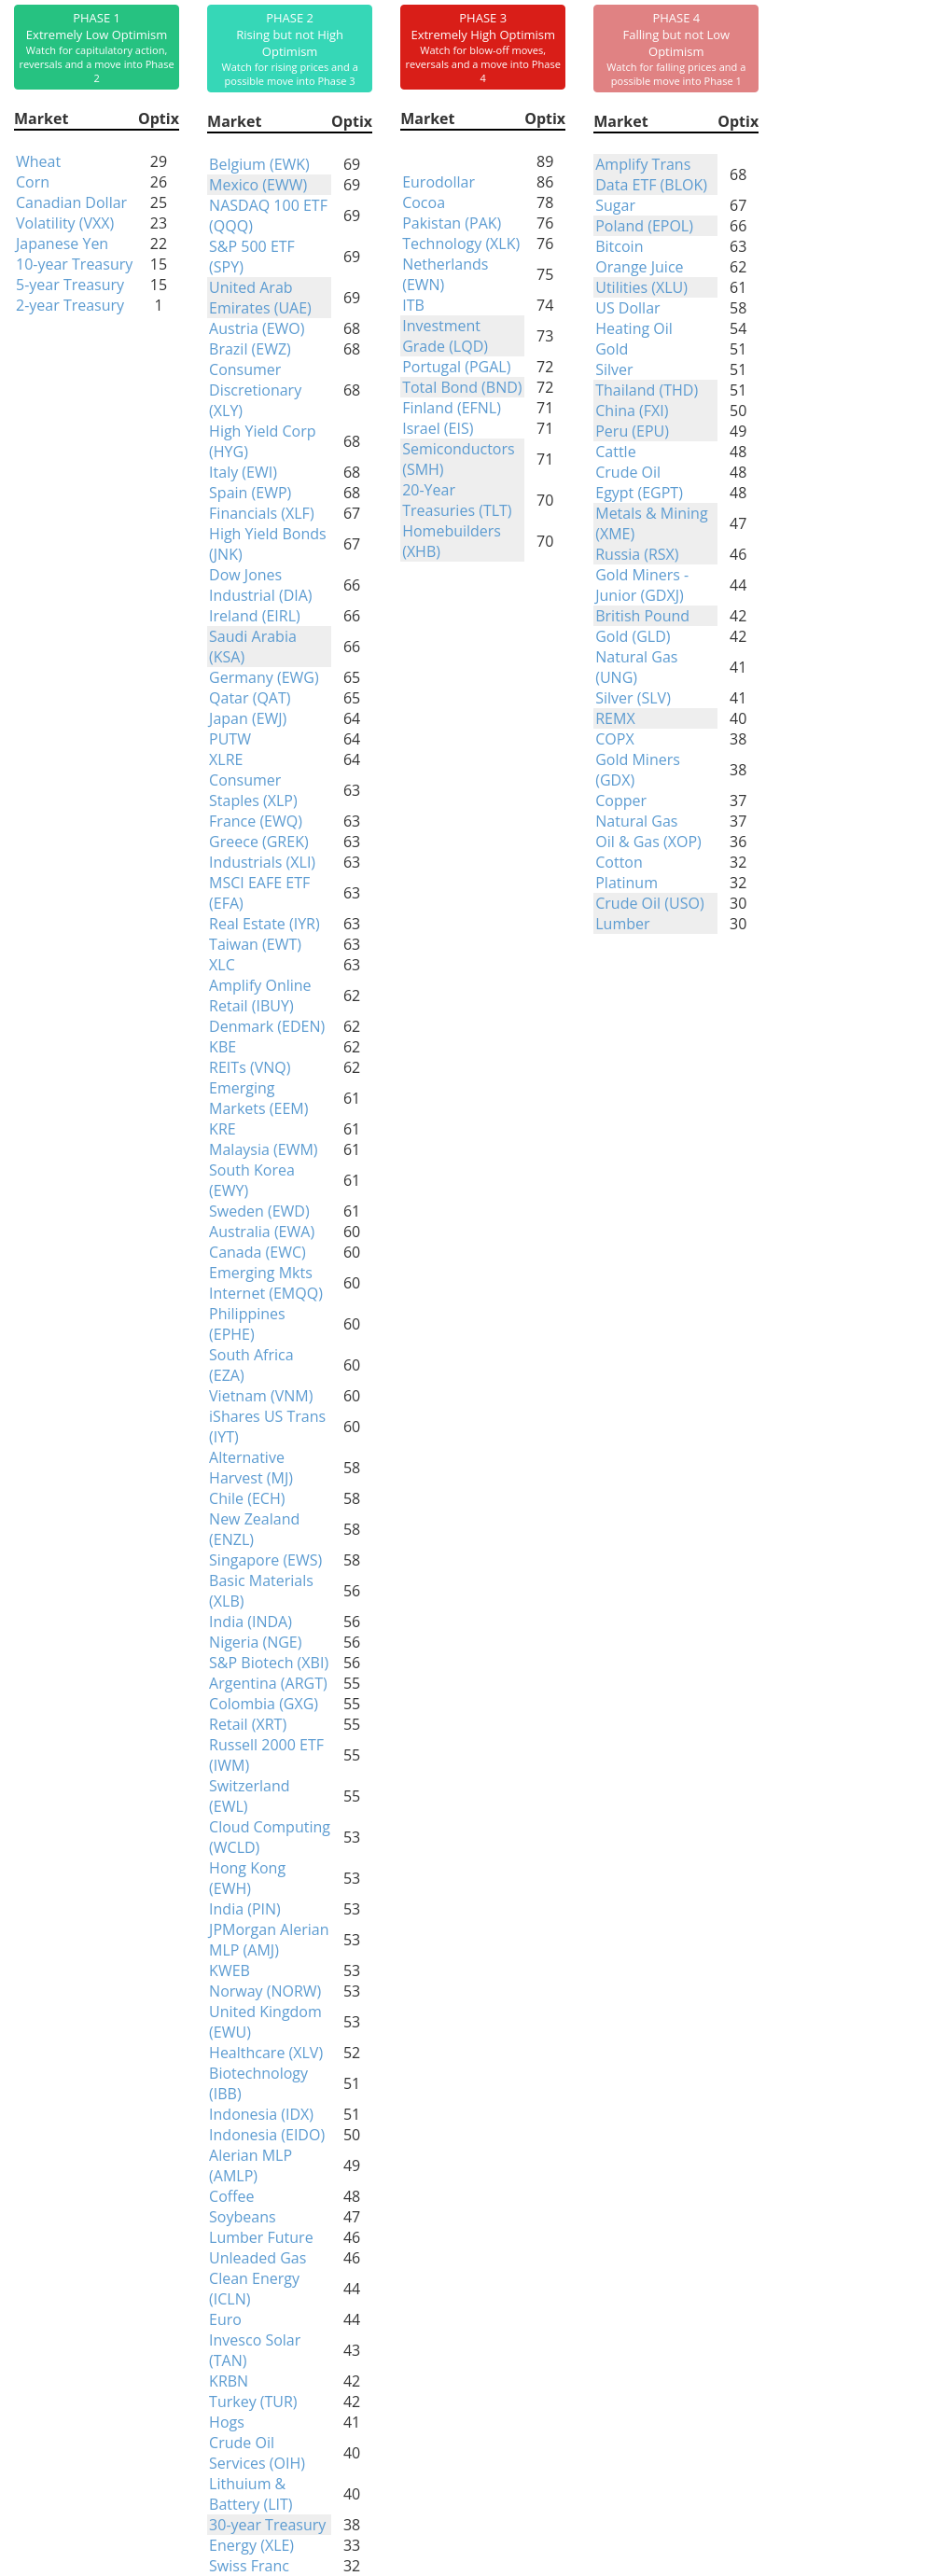
Phase Table
Ranks
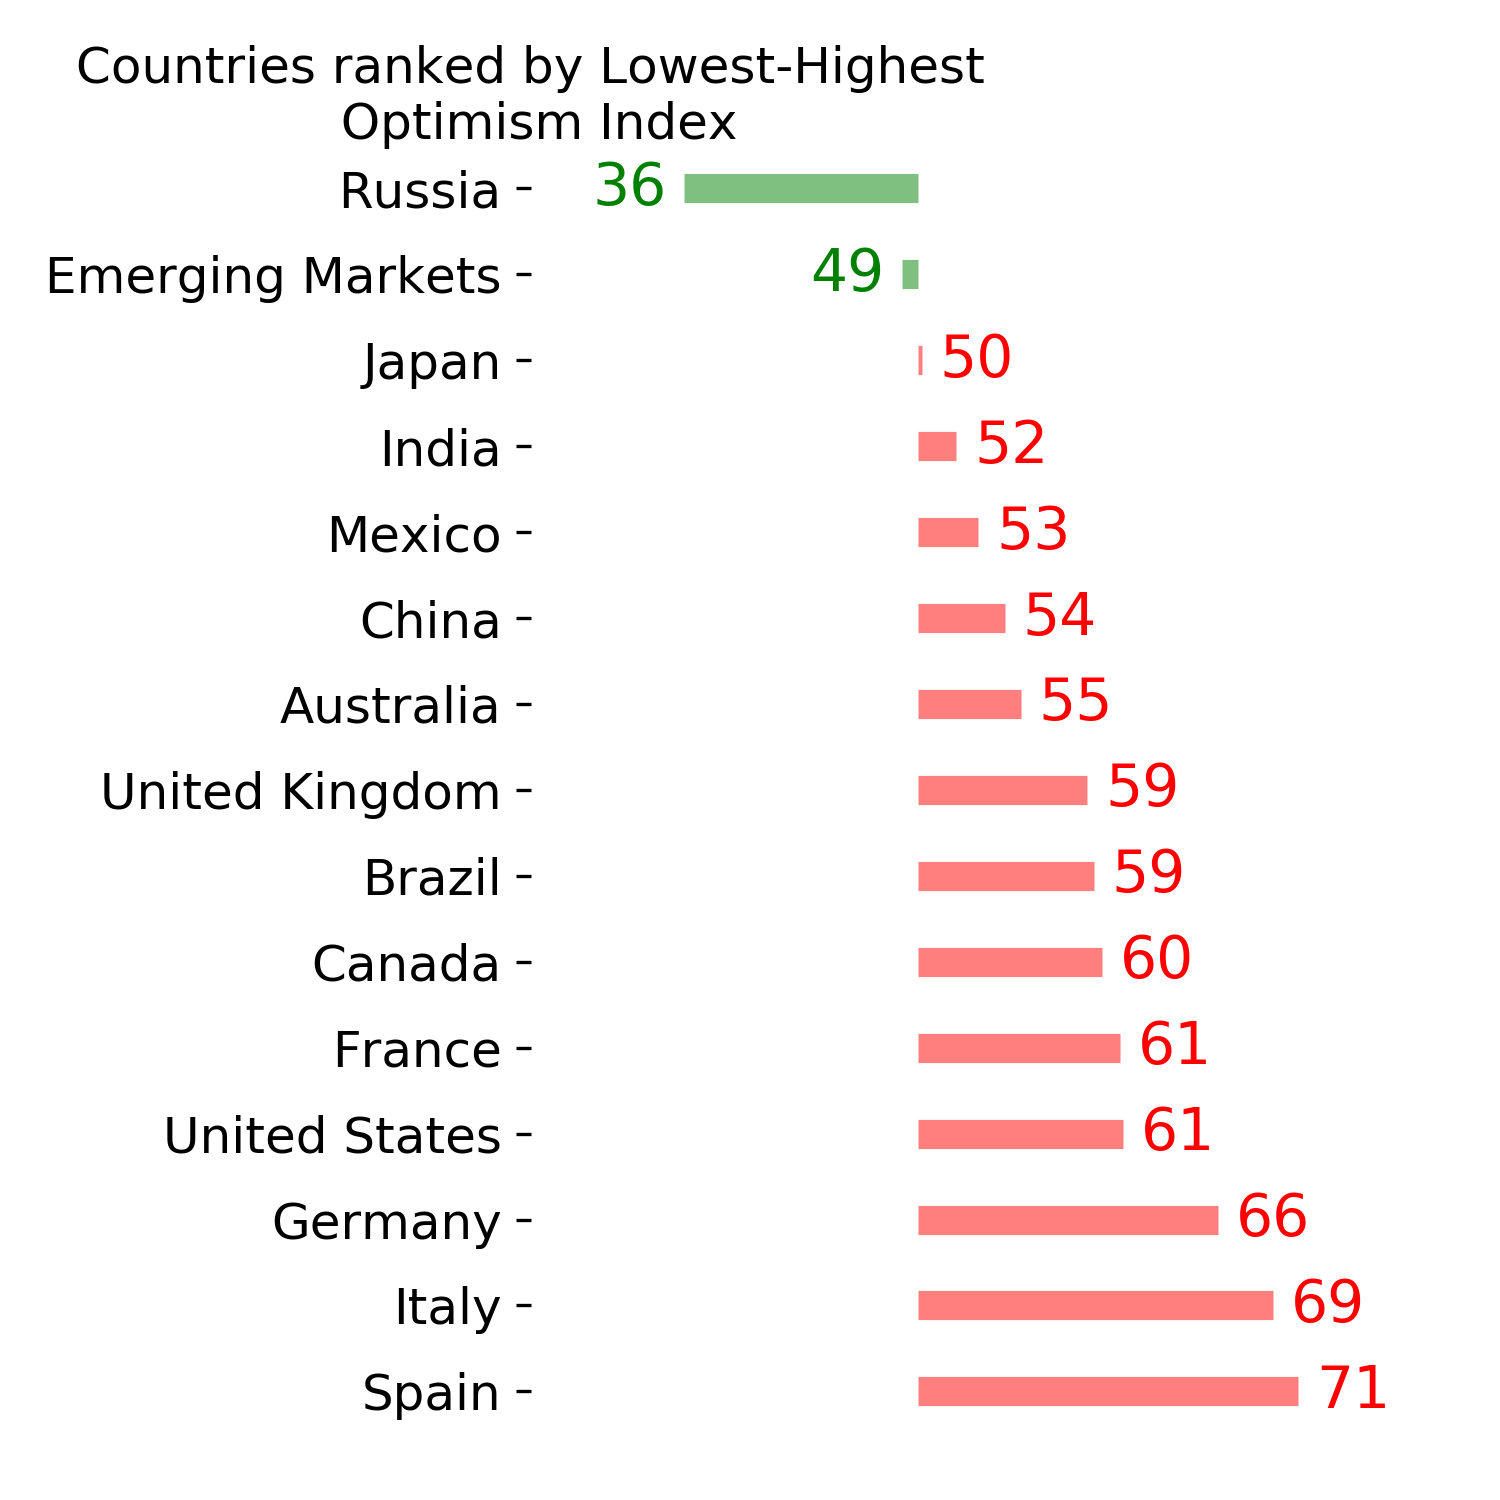
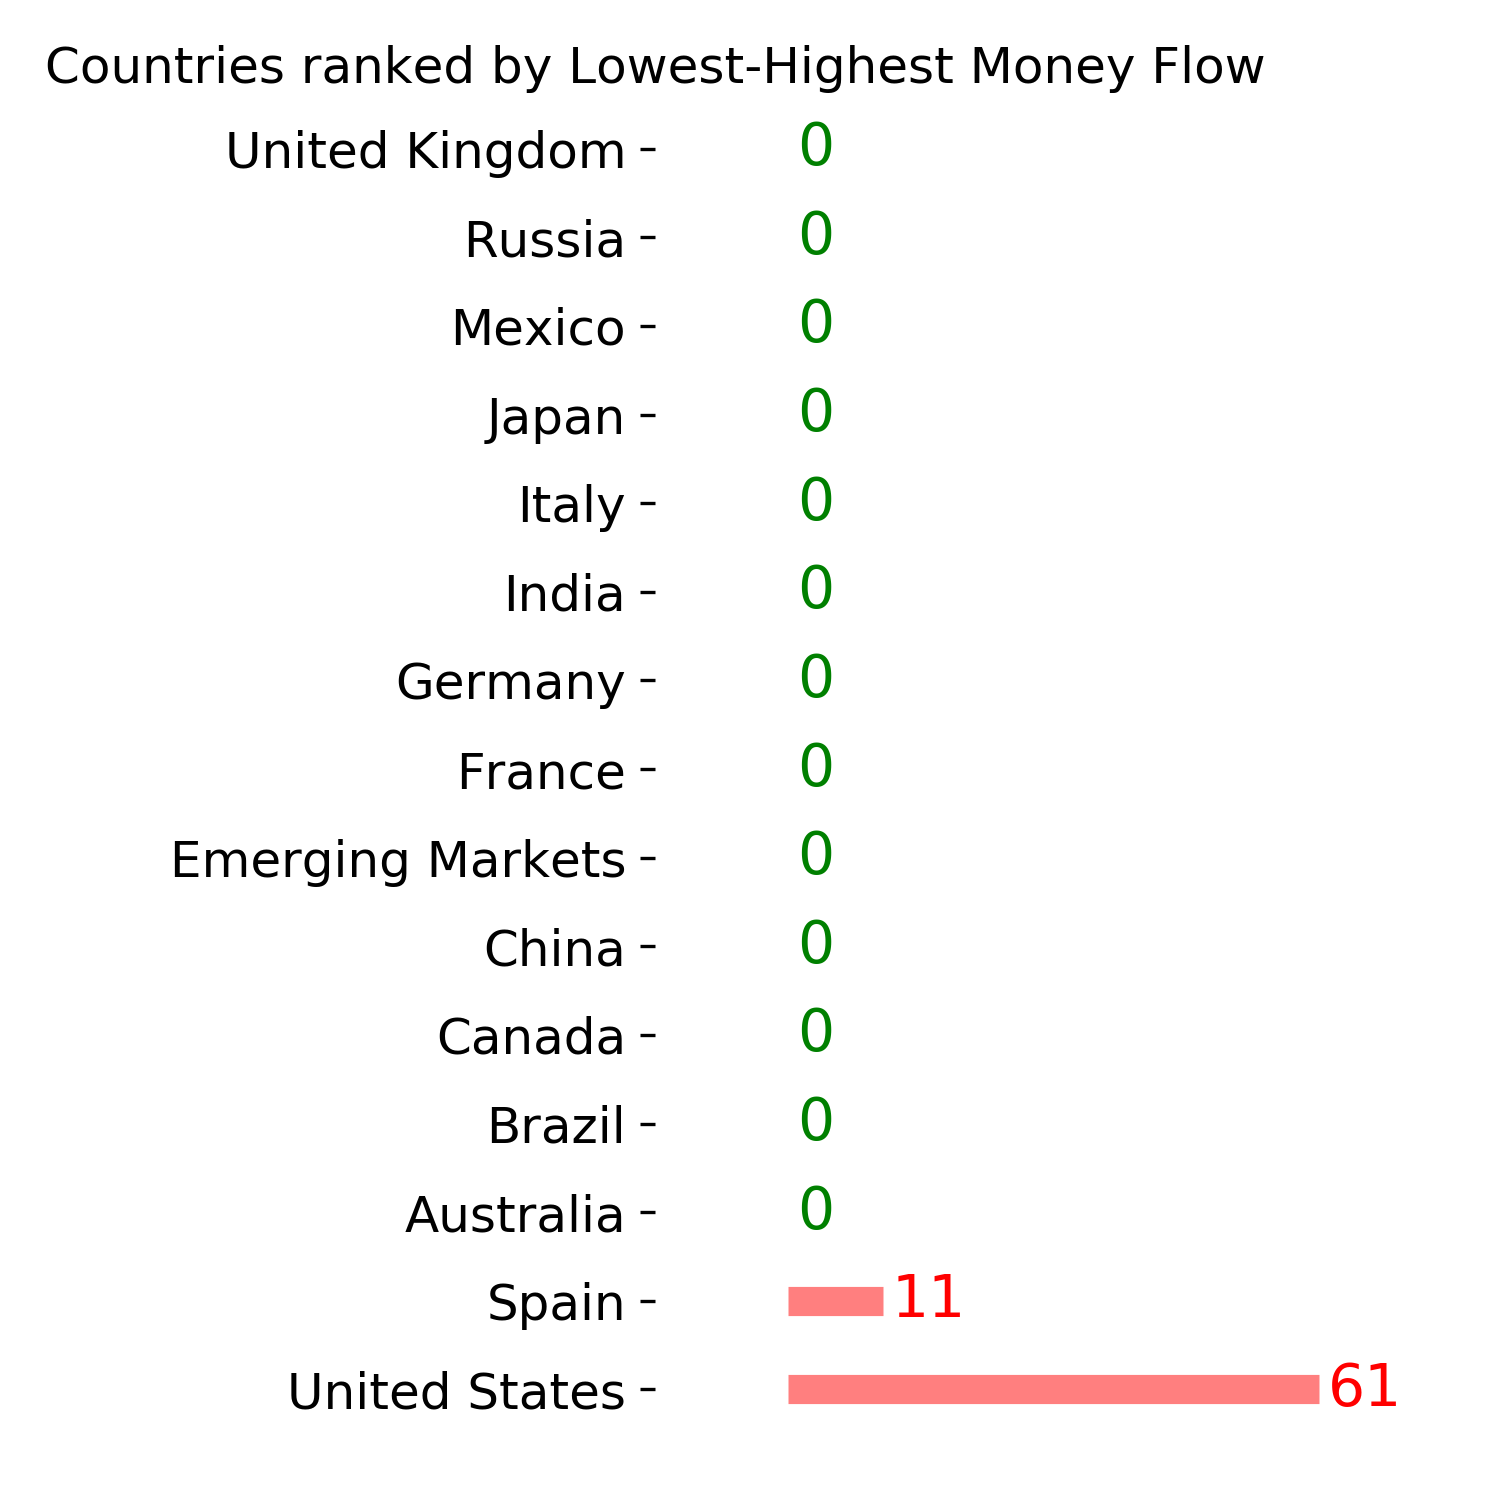
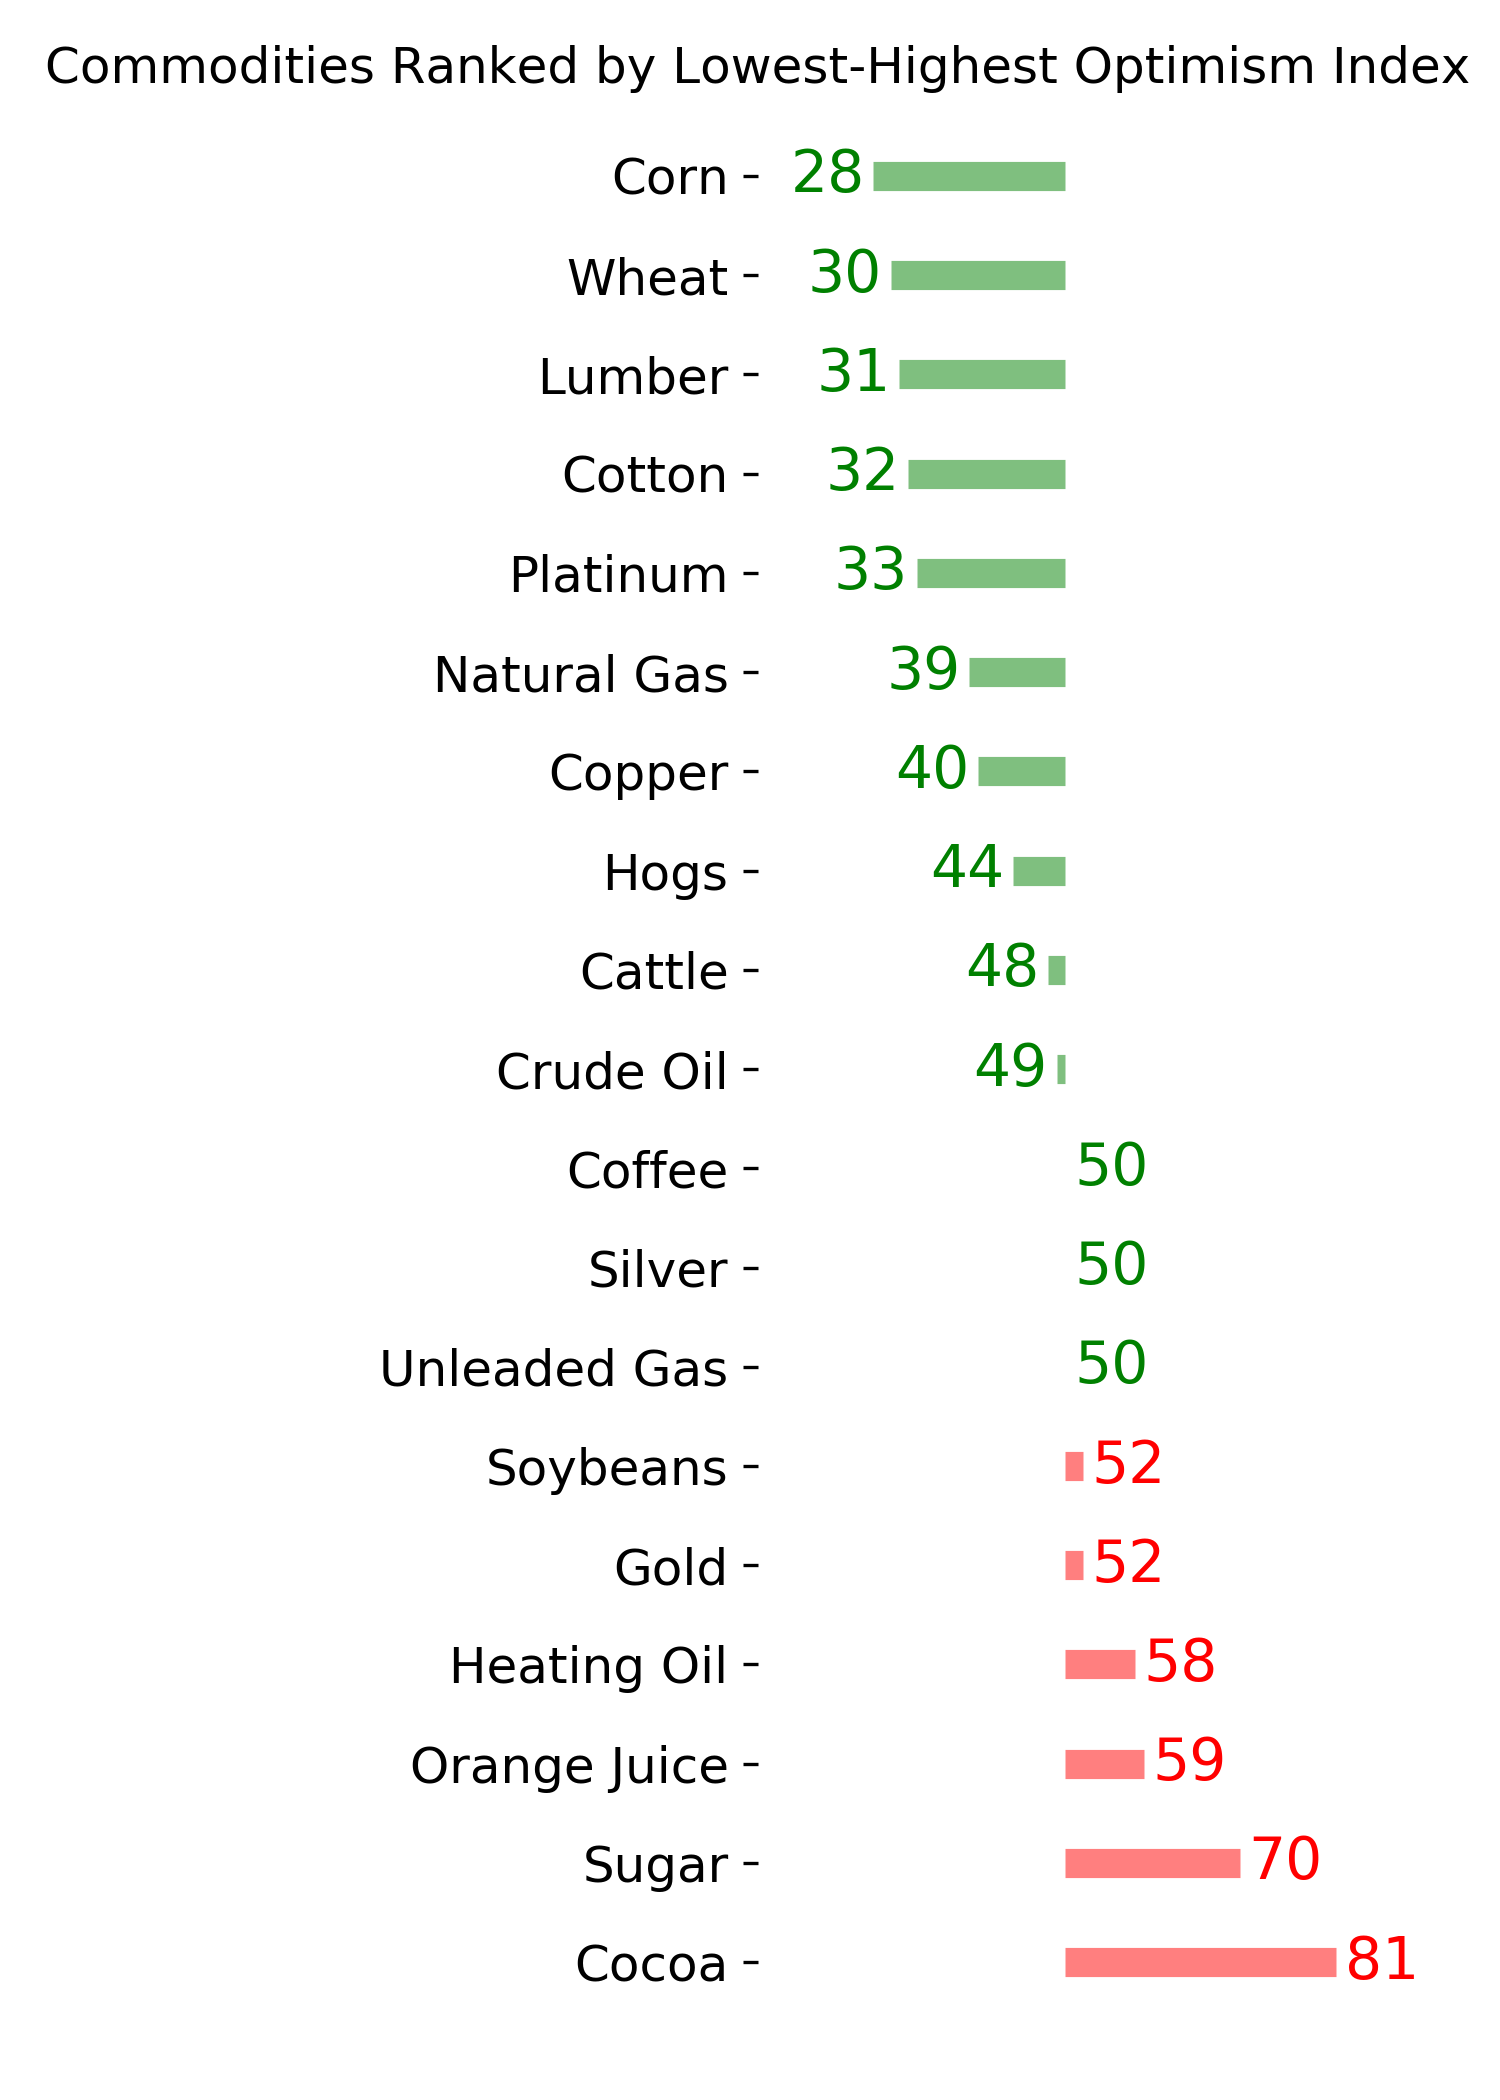
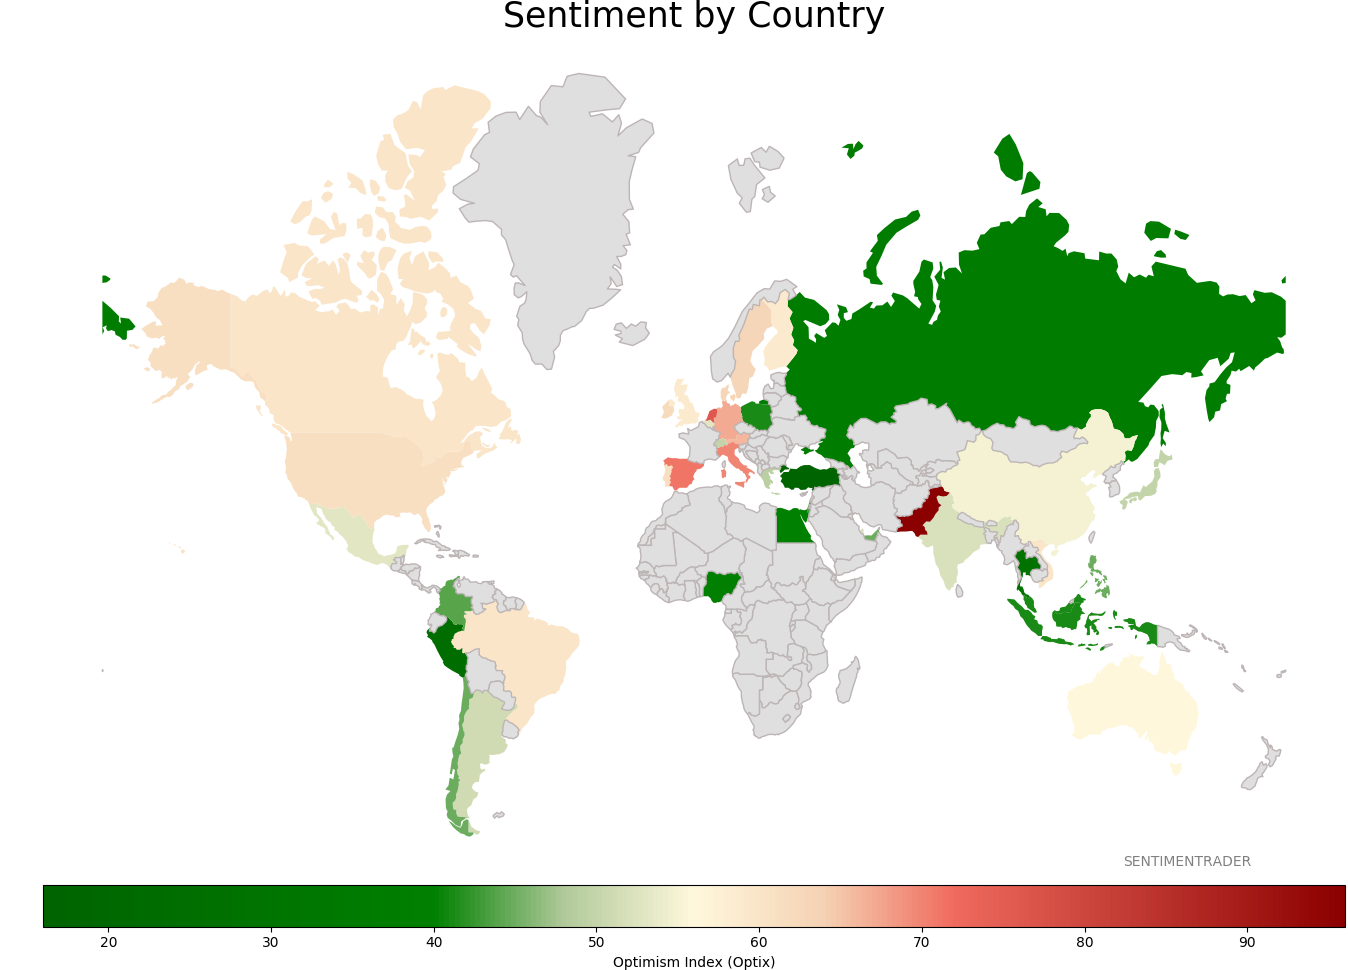
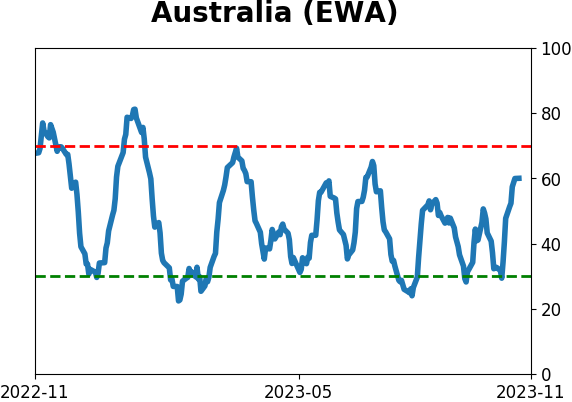
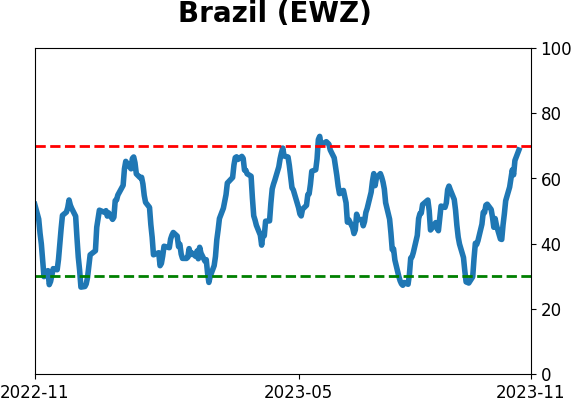
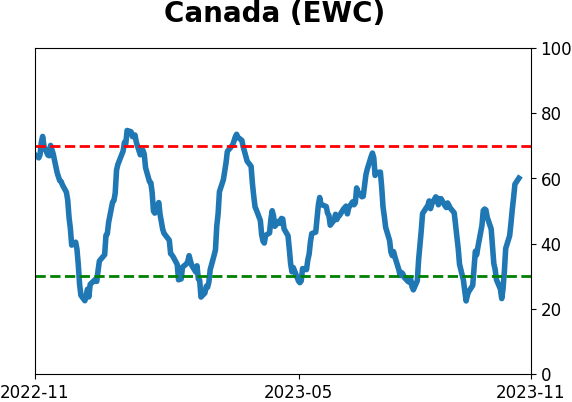
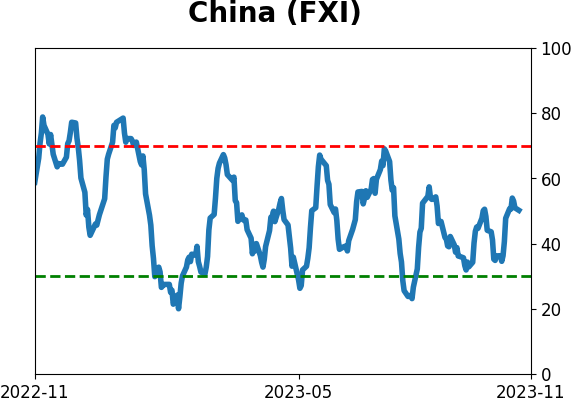
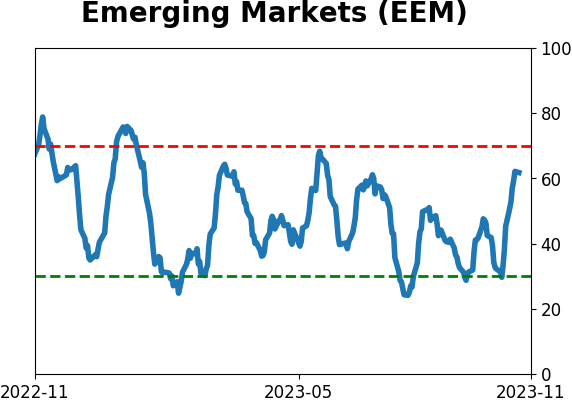
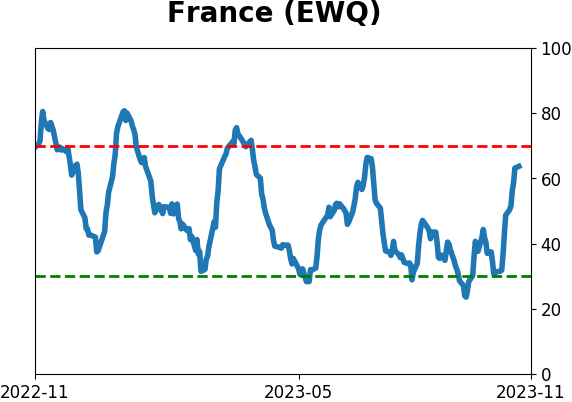
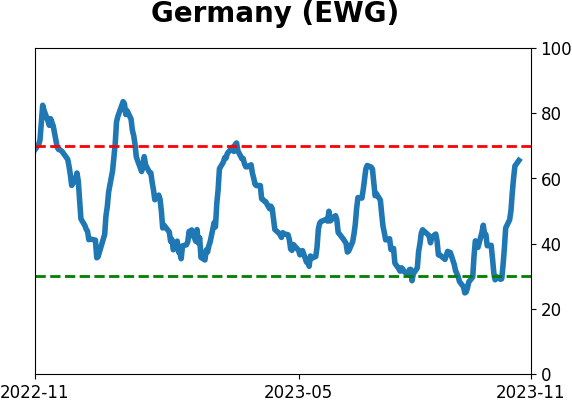
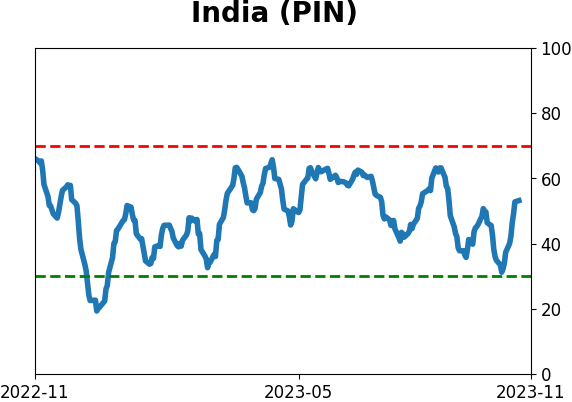
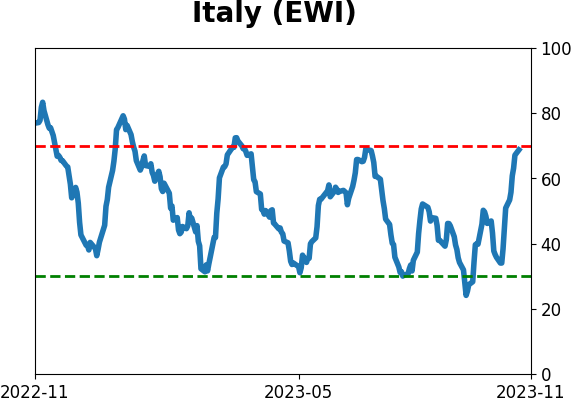
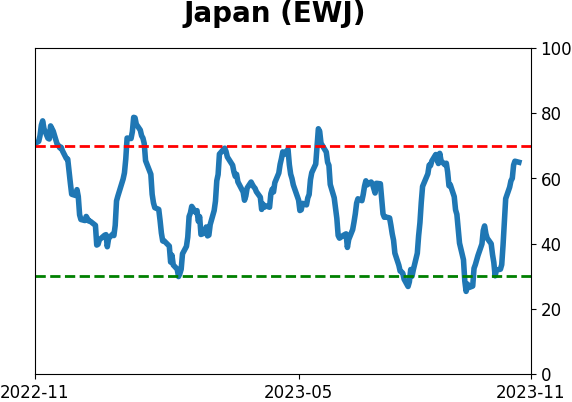
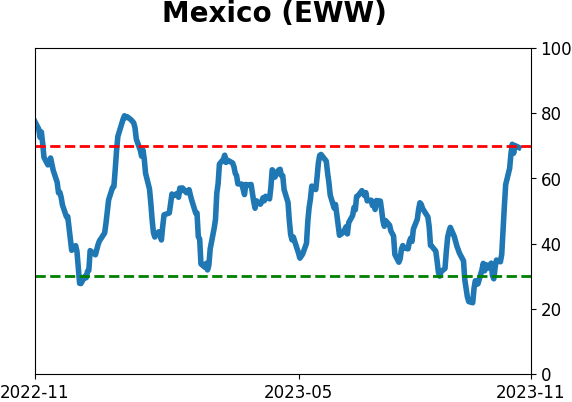
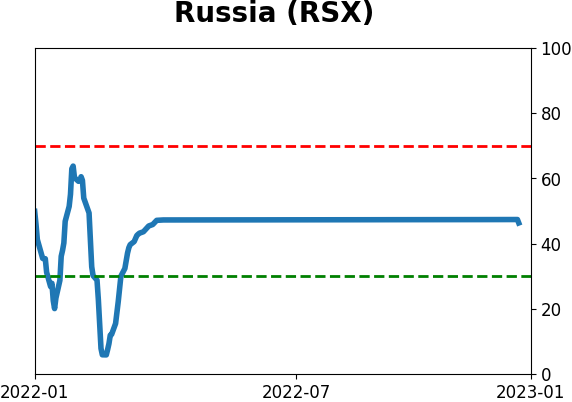
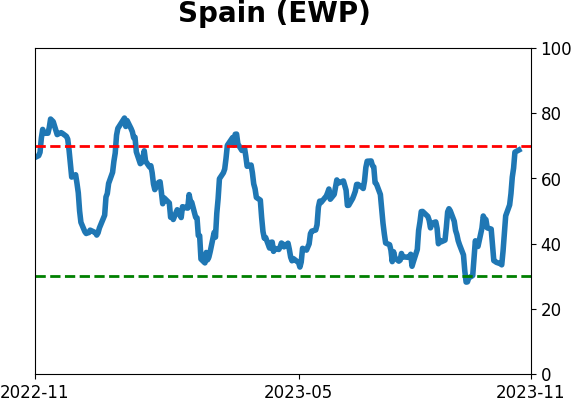
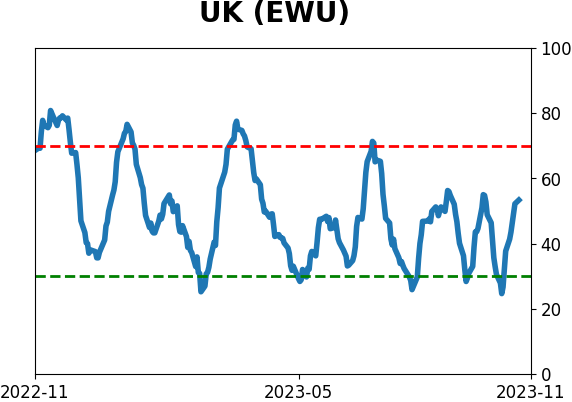
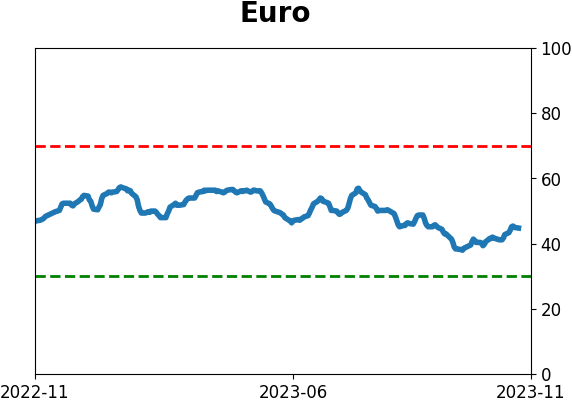
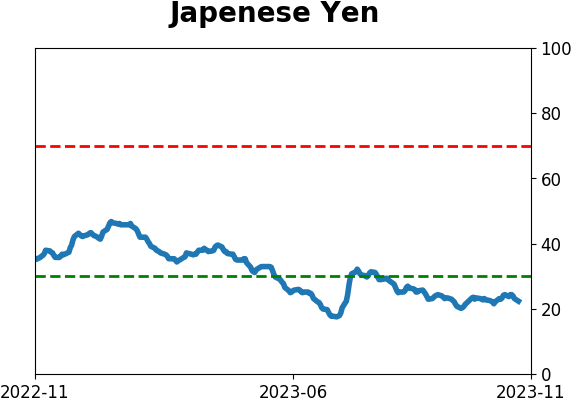
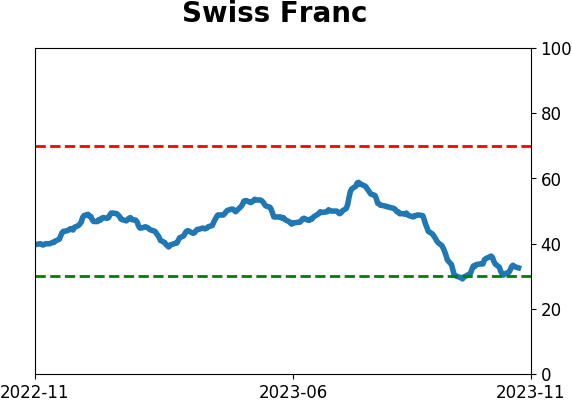
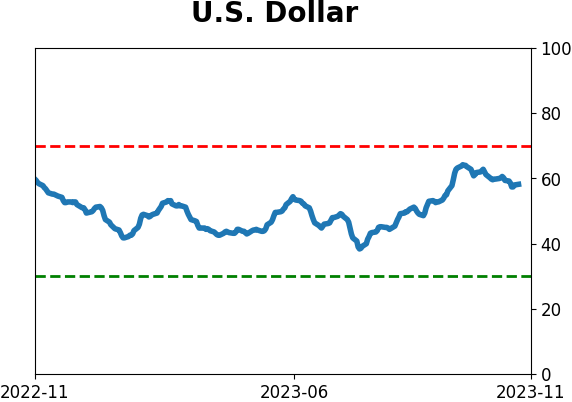
Sentiment Around The World
Optimism Index Thumbnails
|
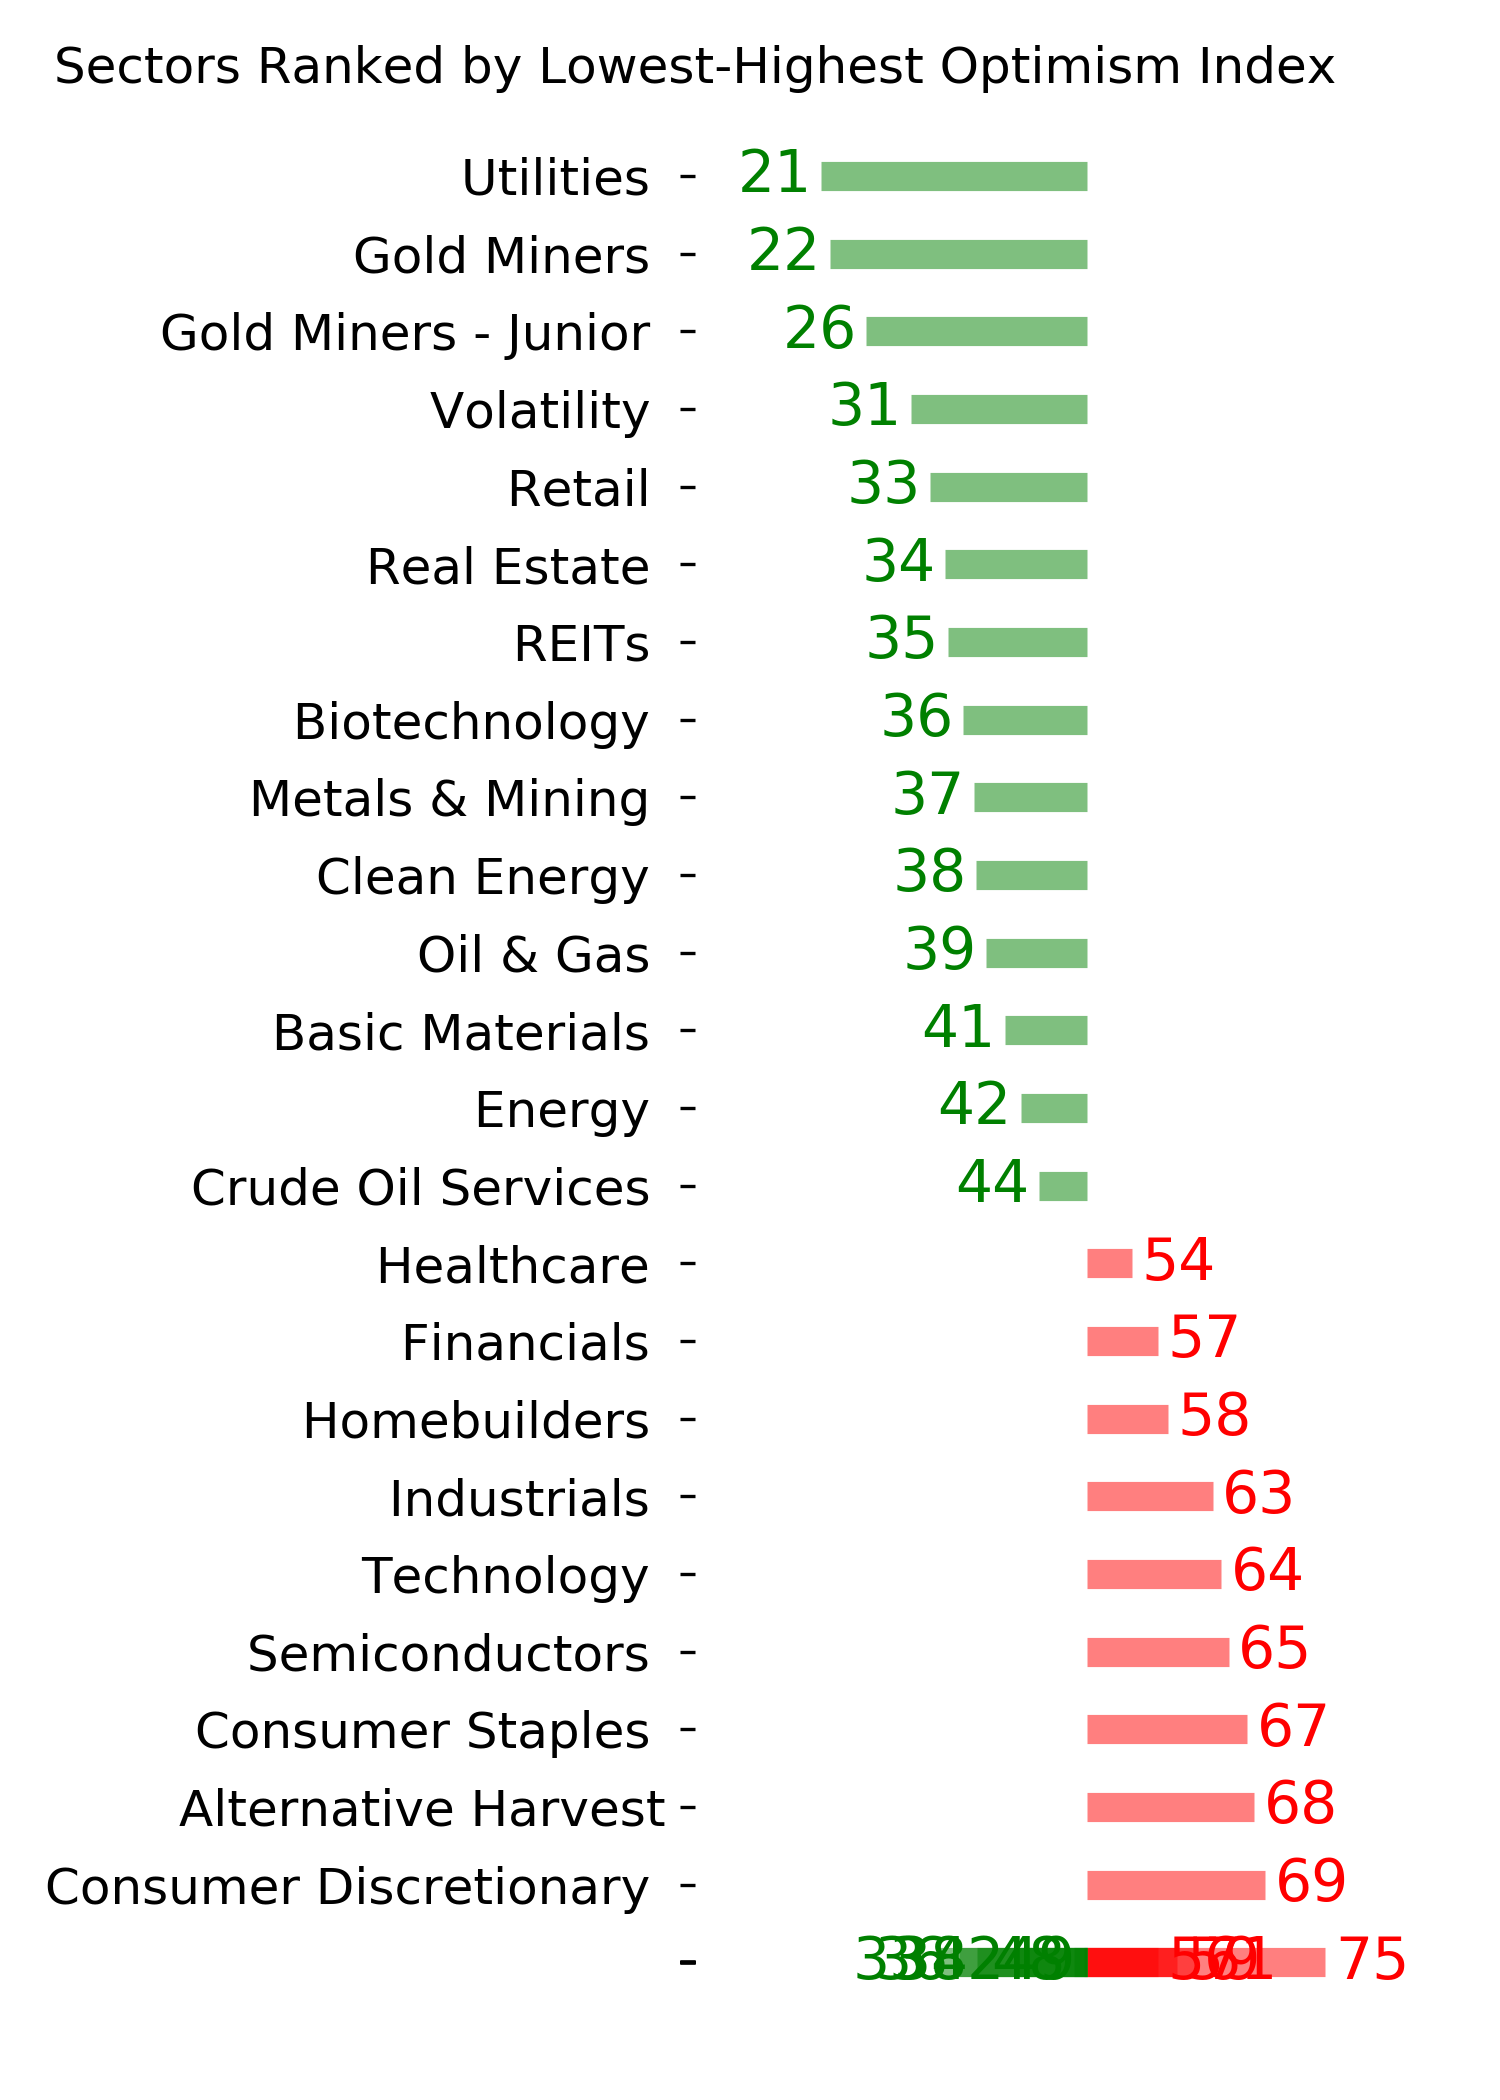
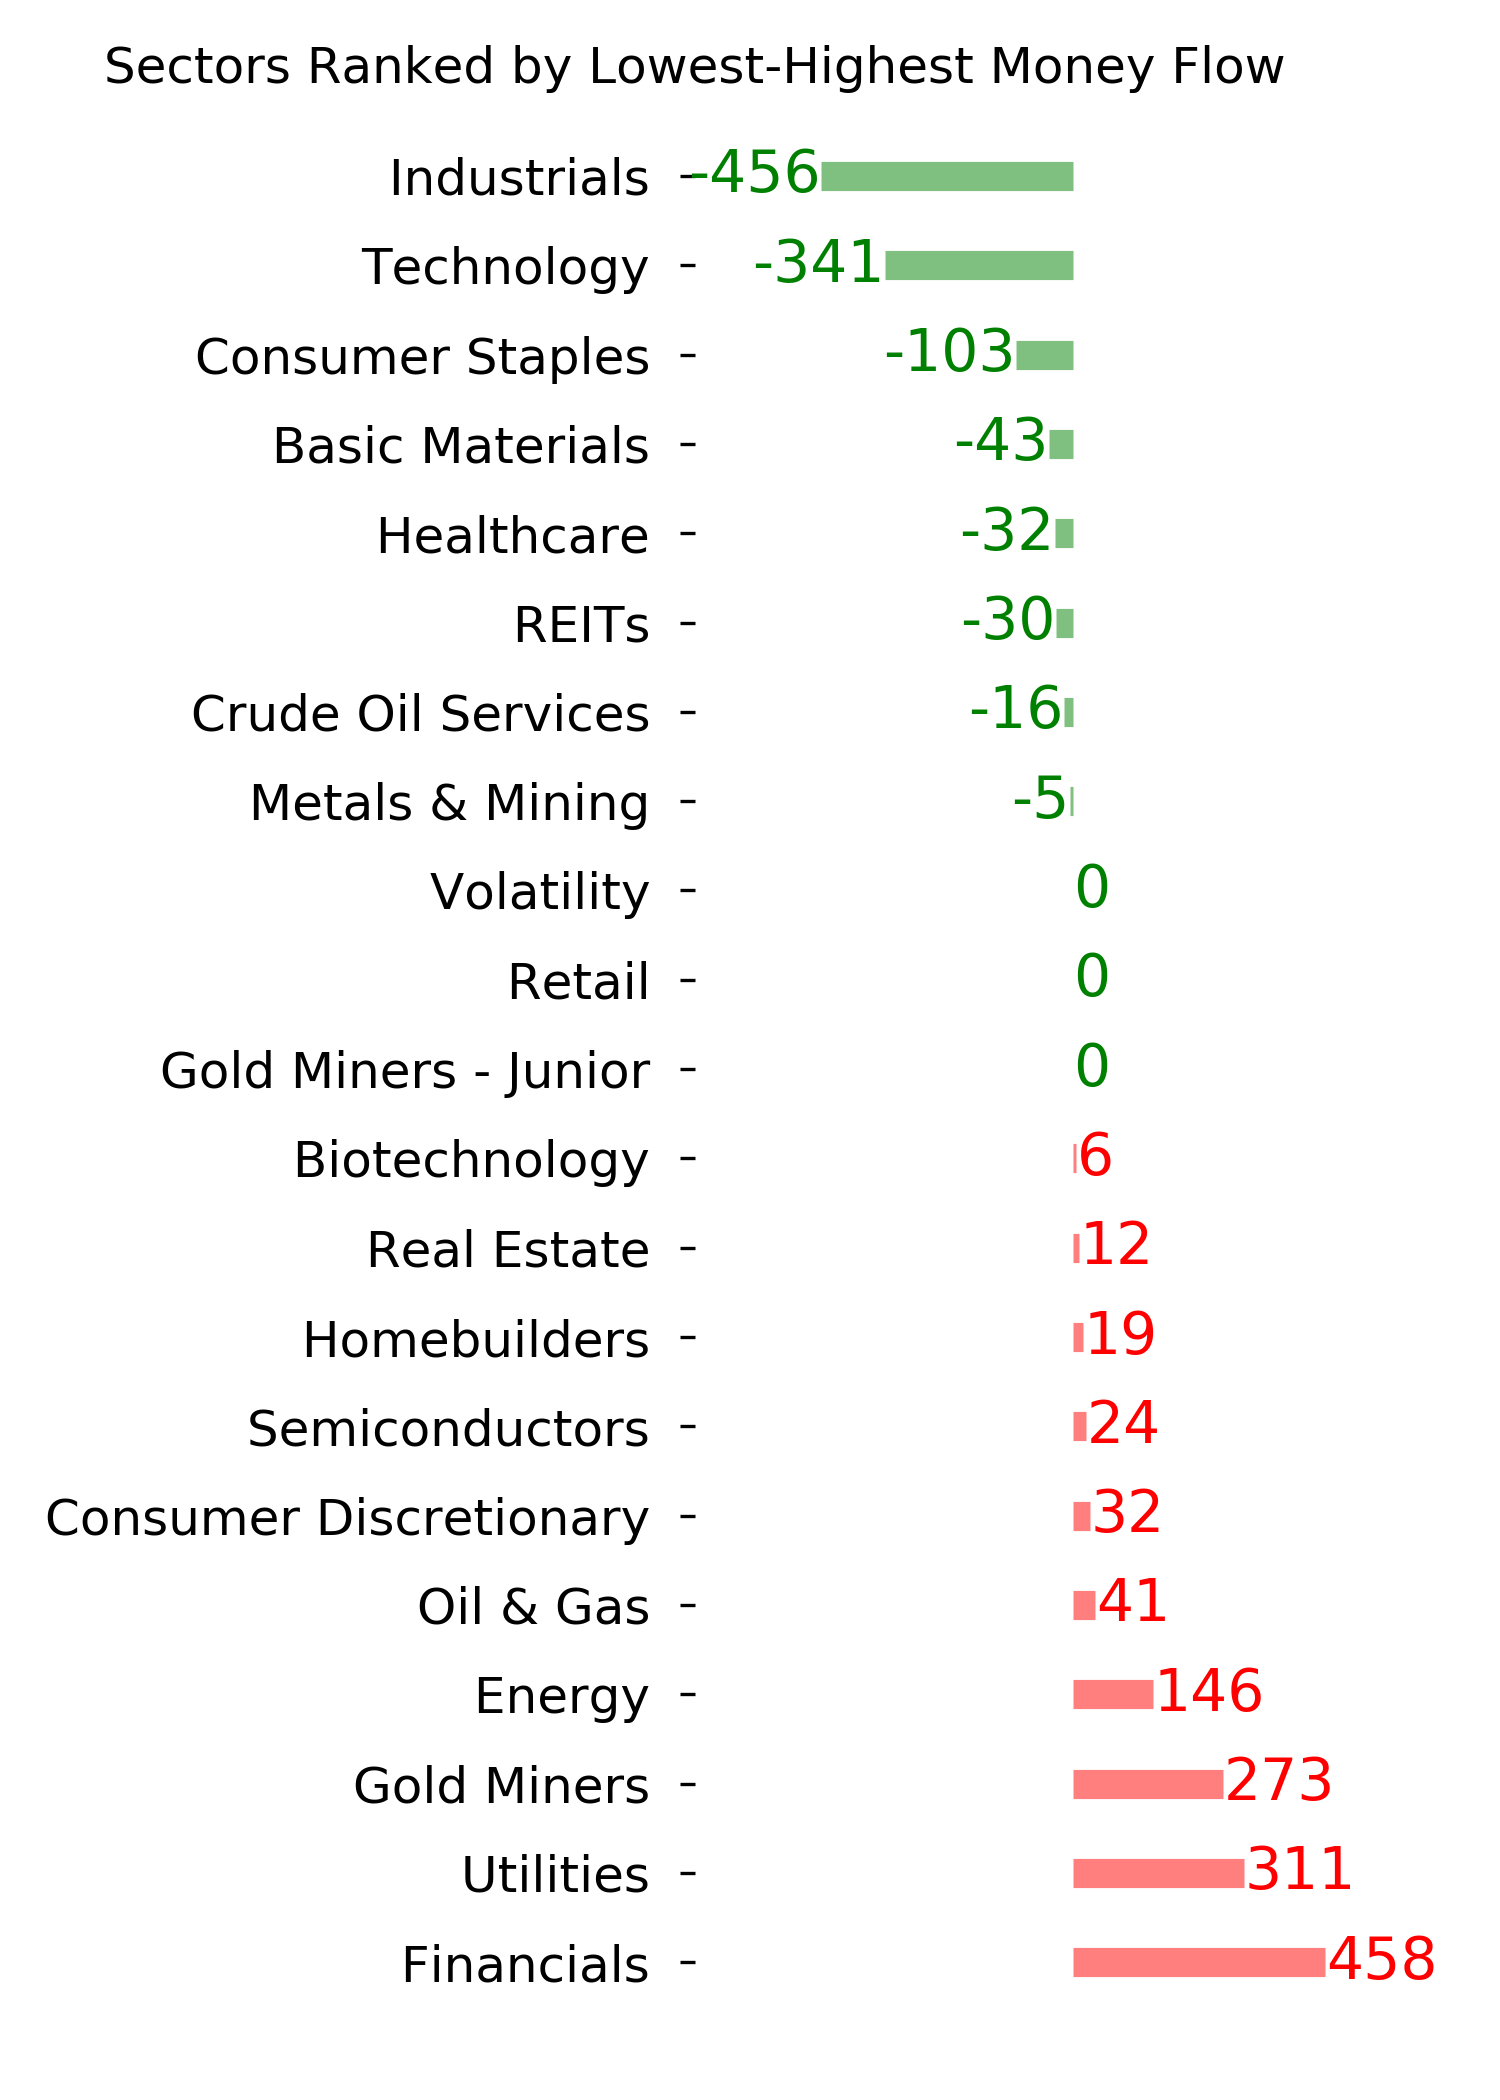
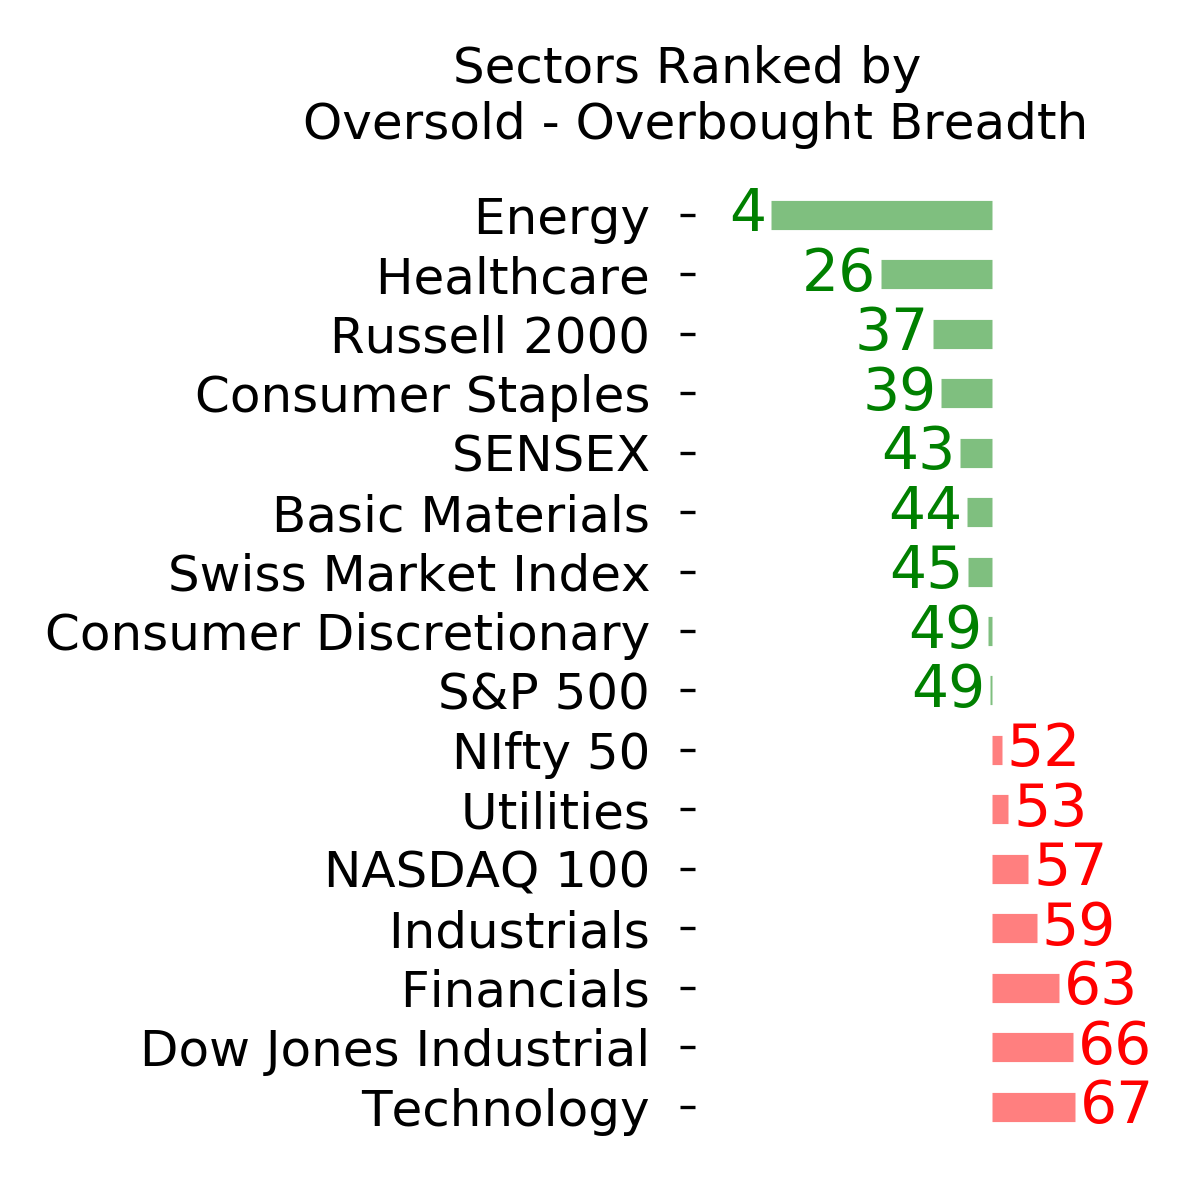
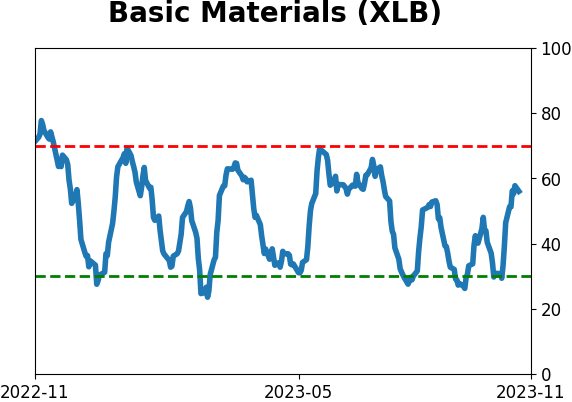
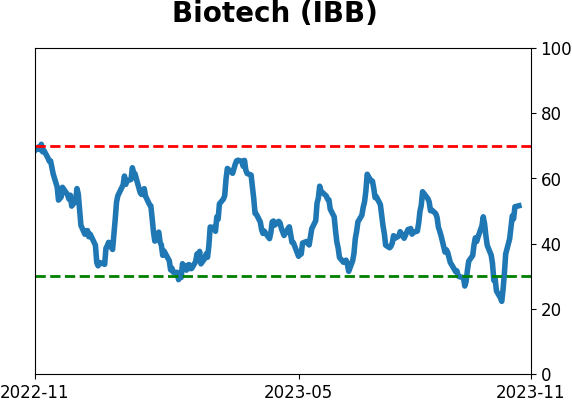
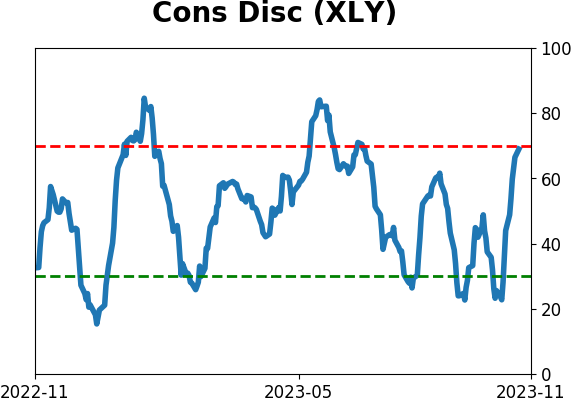
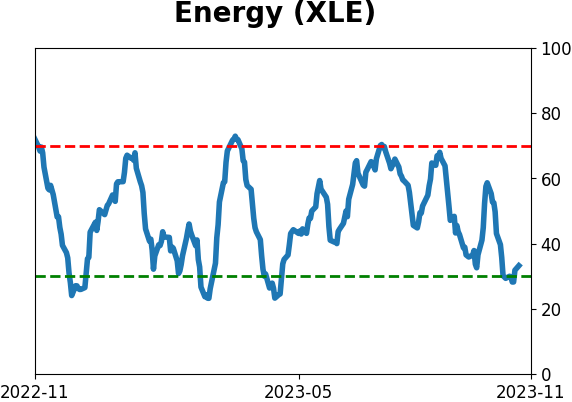
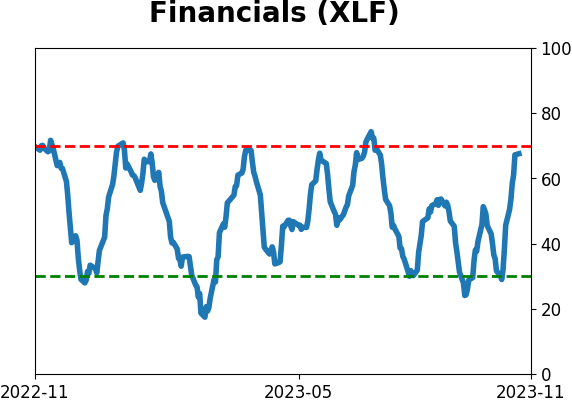
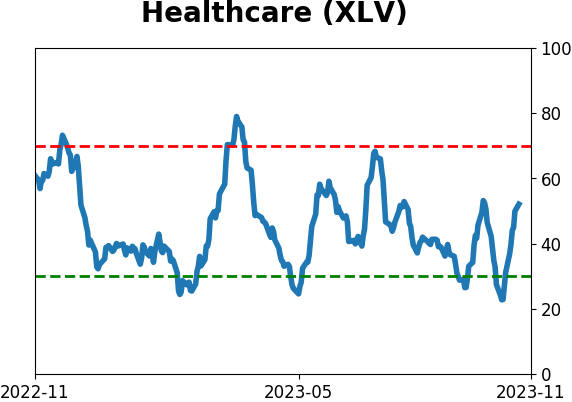
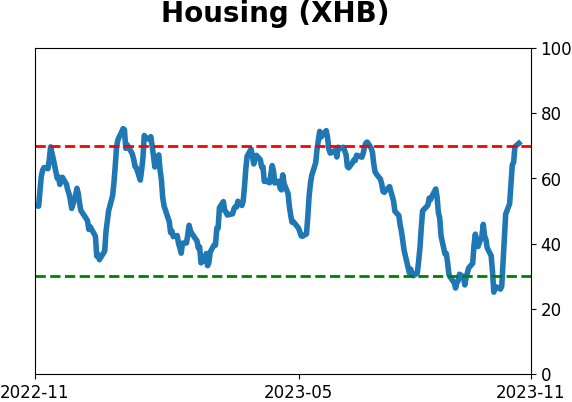
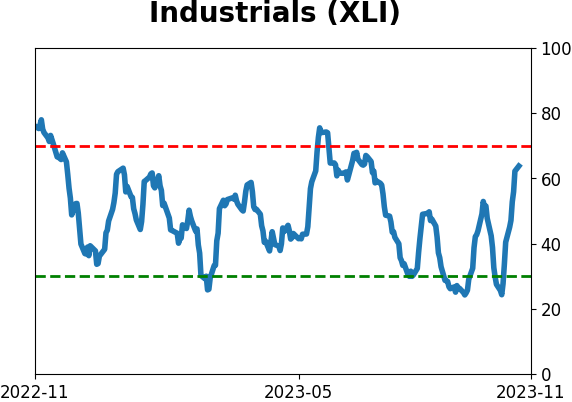
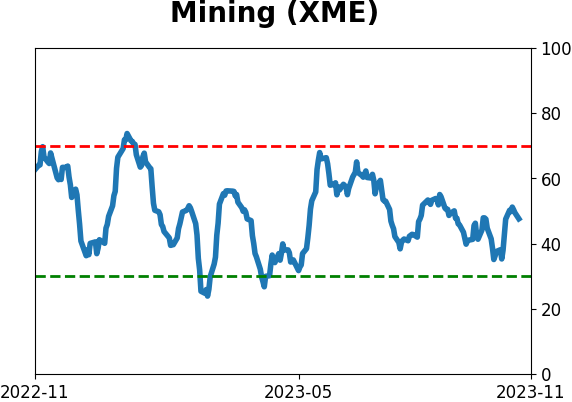
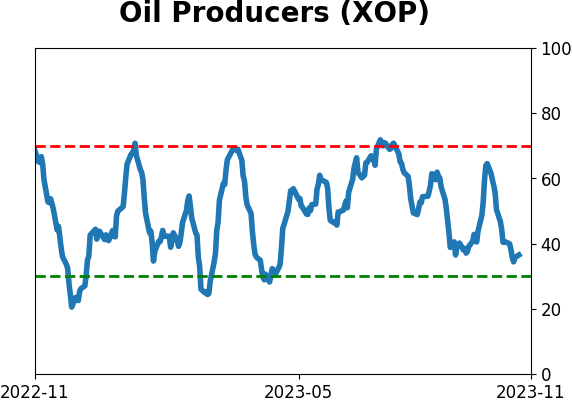
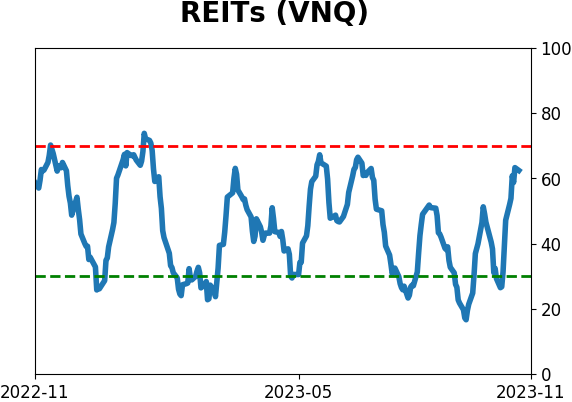
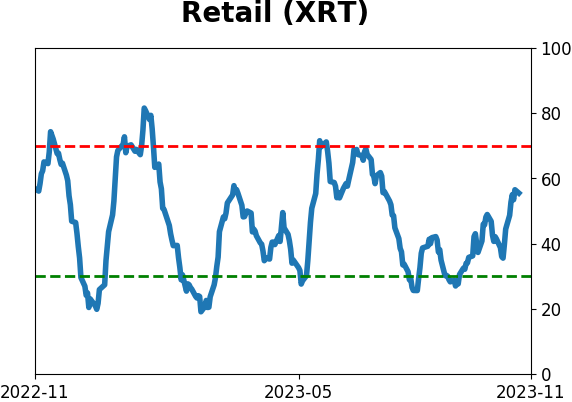
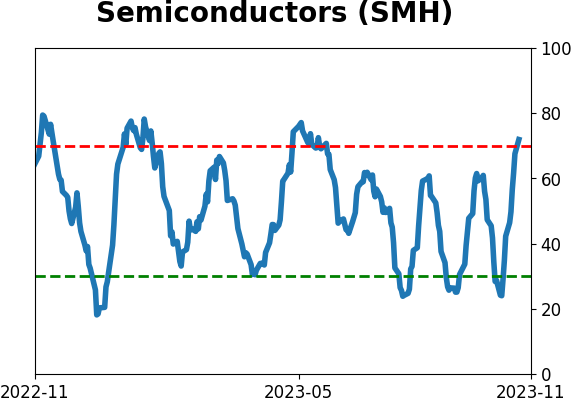
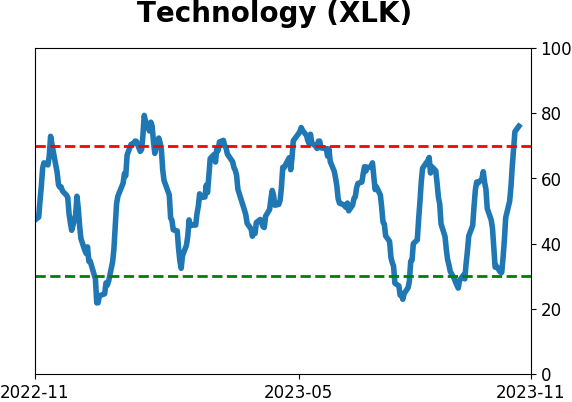
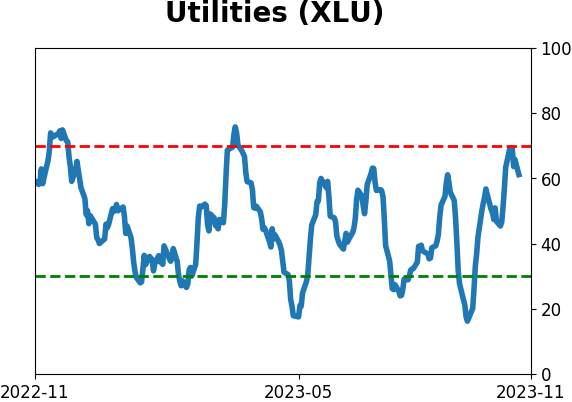
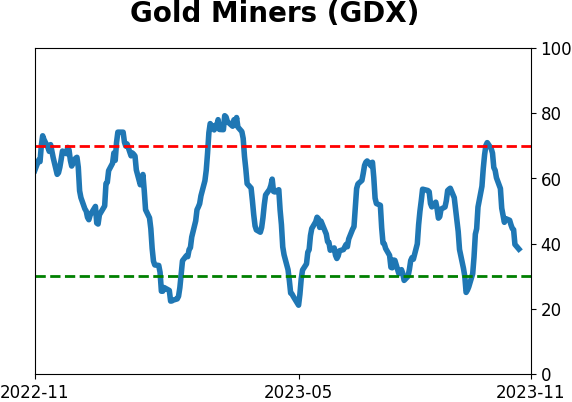
Sector ETF's - 10-Day Moving Average
|
|
|
Country ETF's - 10-Day Moving Average
|
|
|
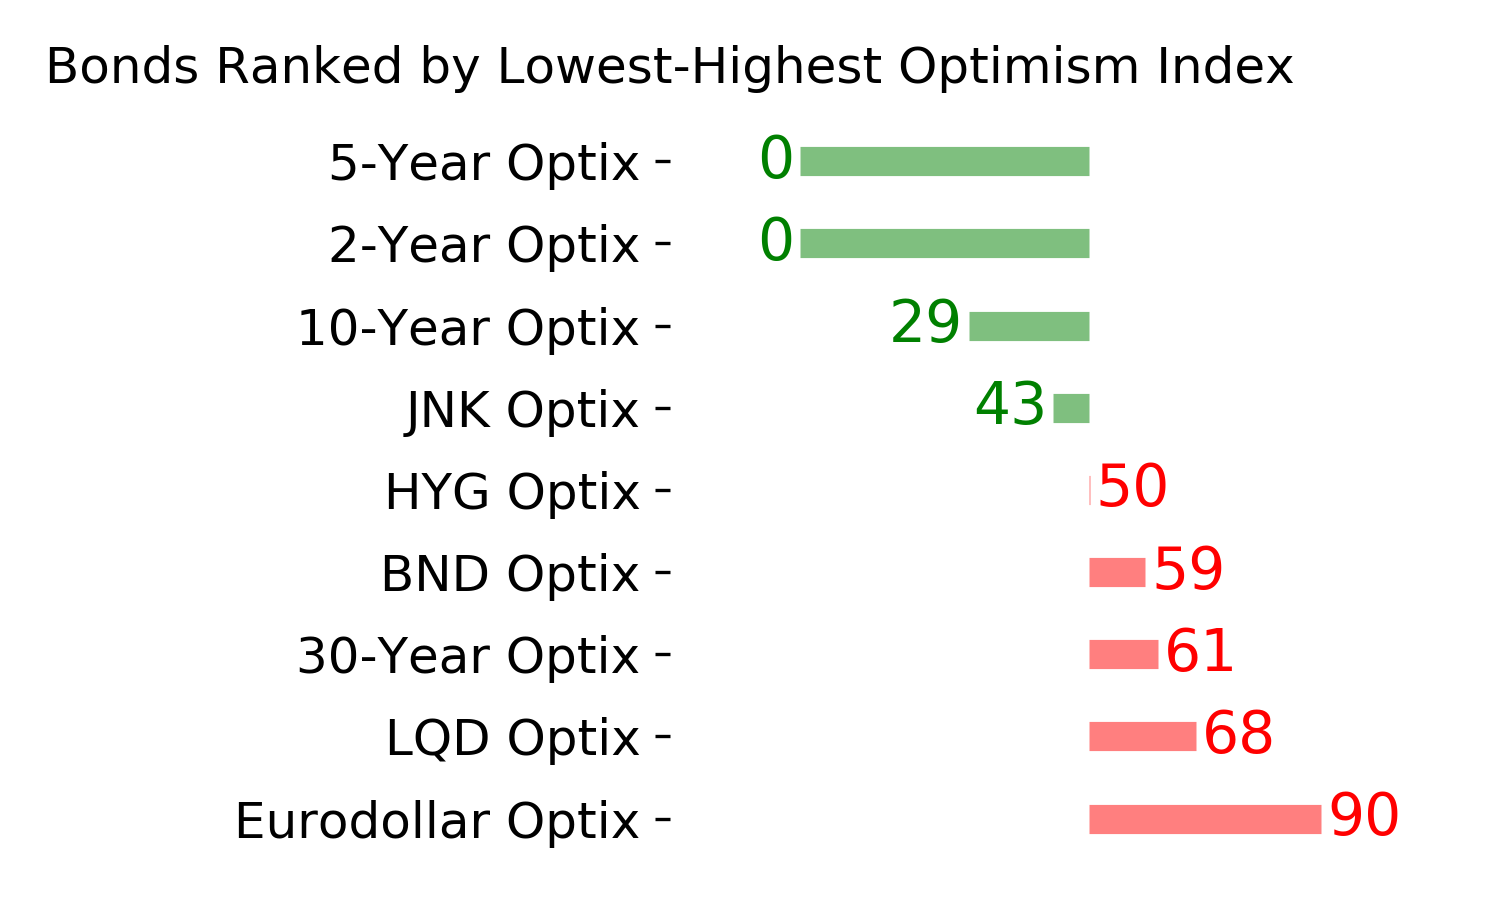
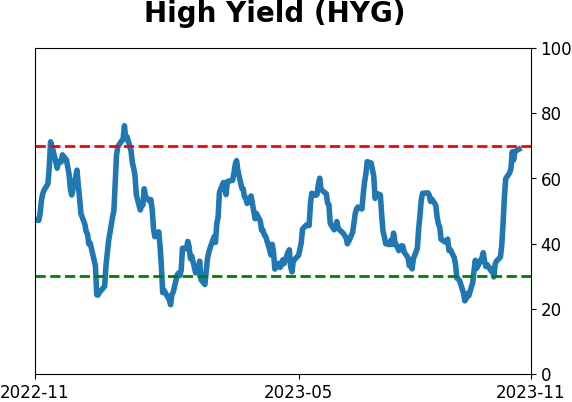
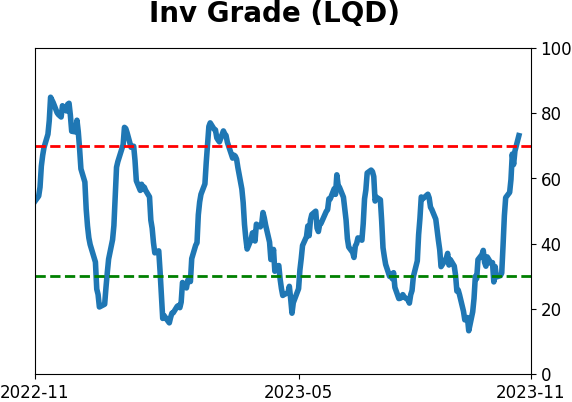
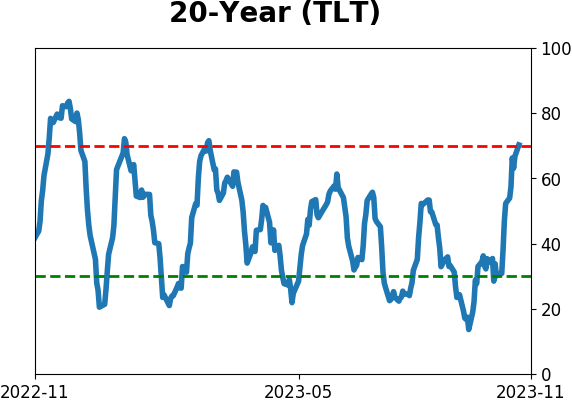
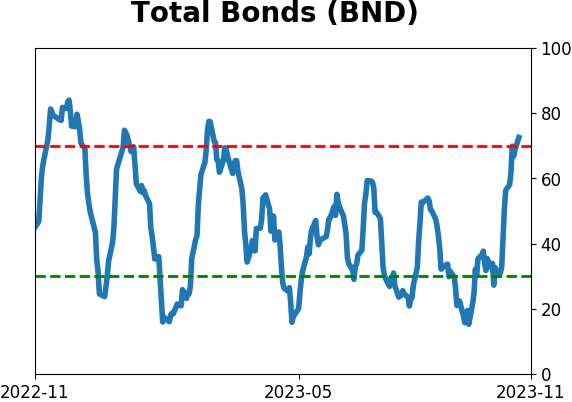
Bond ETF's - 10-Day Moving Average
|
|
|
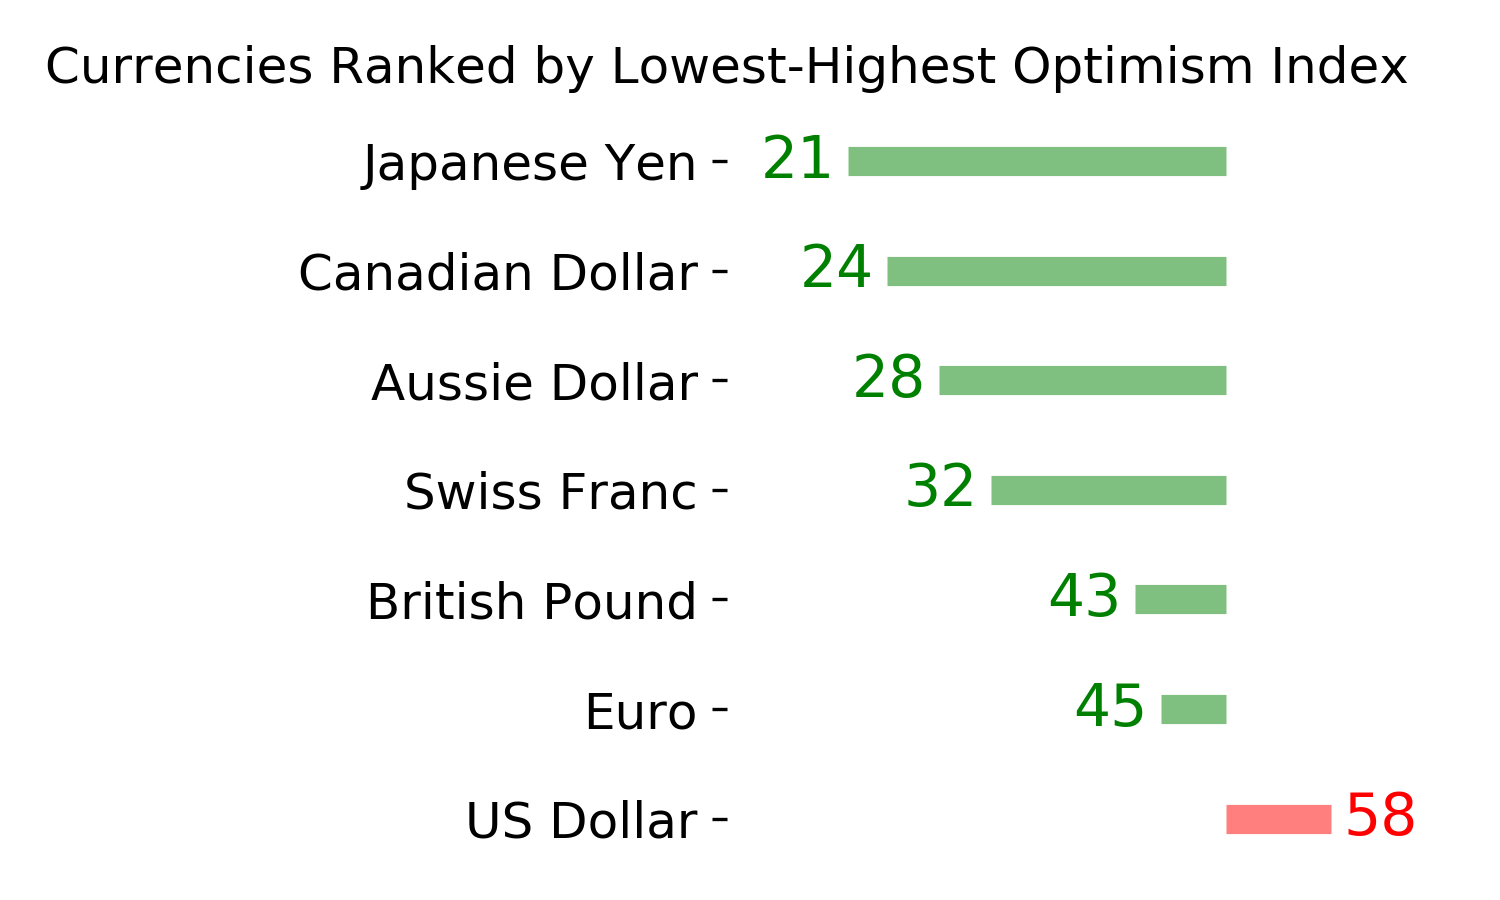
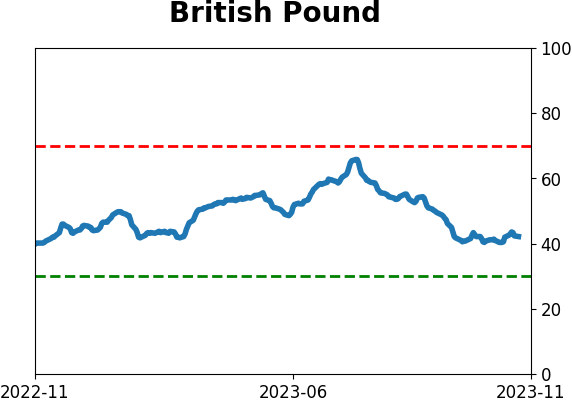
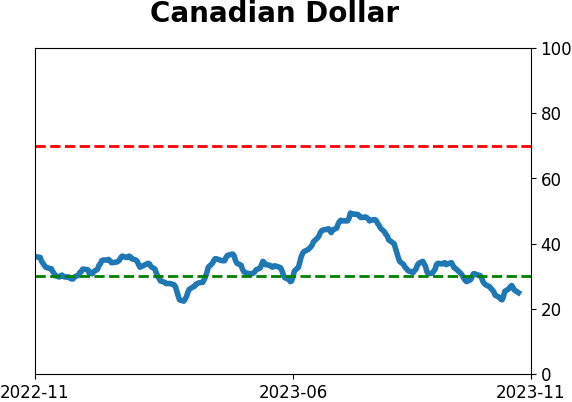
Currency ETF's - 5-Day Moving Average
|
|
|
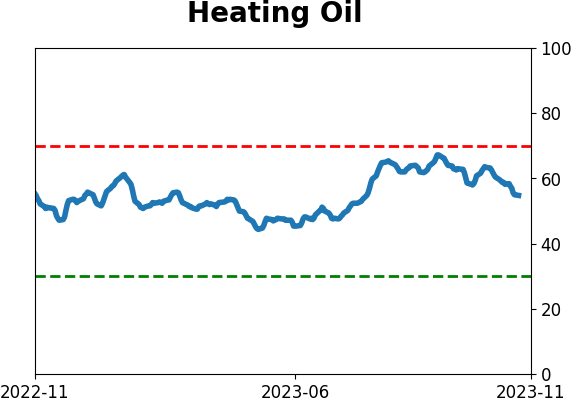
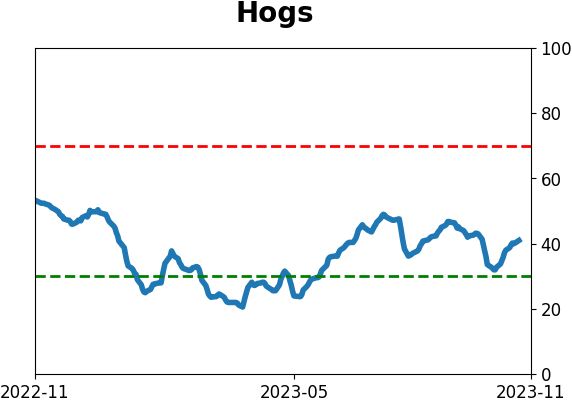
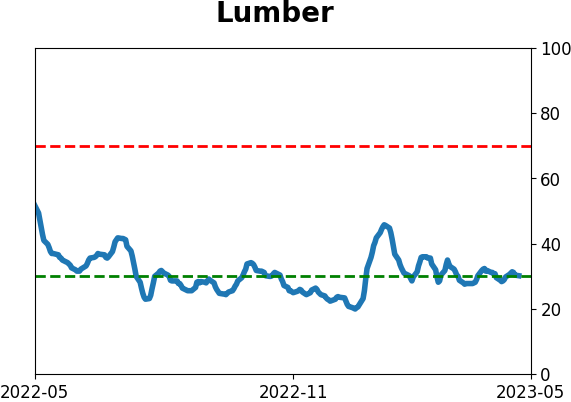
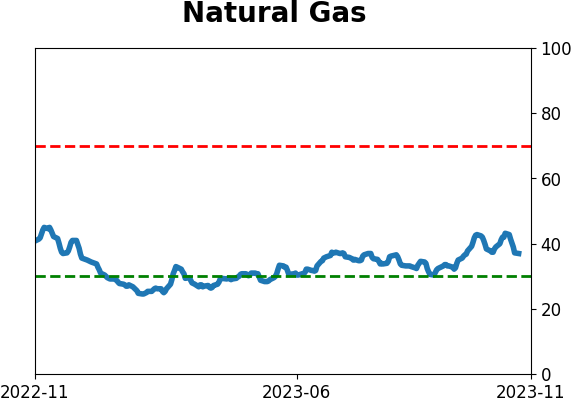
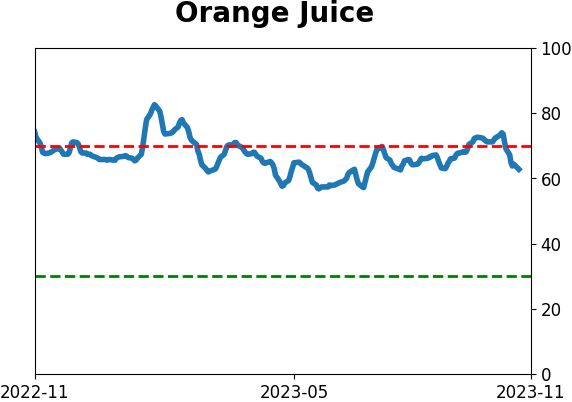
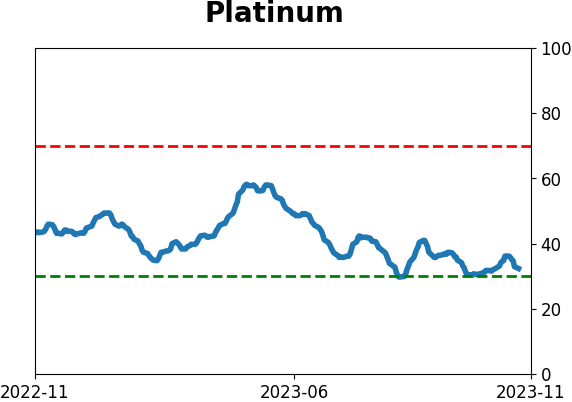
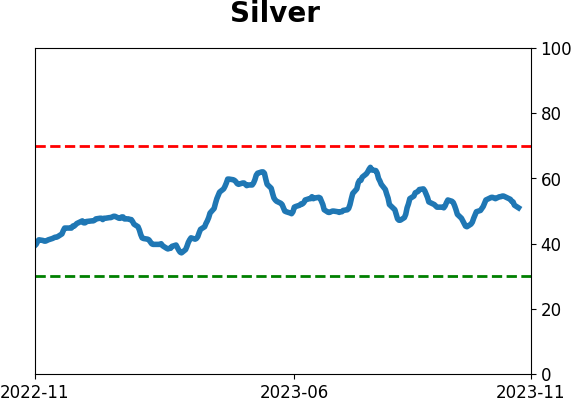
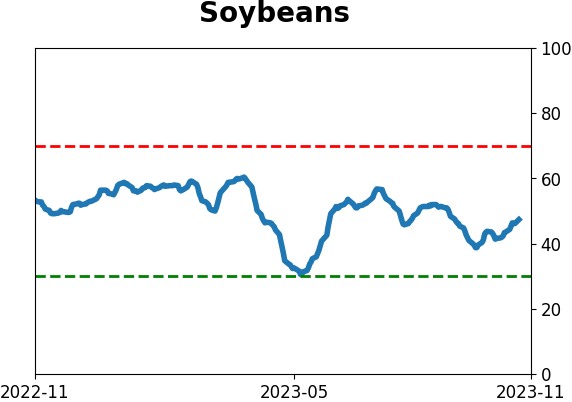
Commodity ETF's - 5-Day Moving Average
|
|