Headlines
|
|
Junk bonds are trying to recover but remain suspect:
The high-yield bond market diverged from the positive stock market in October. Breadth metrics show that junk bonds became moderately oversold and are now trying to recover. This should be a good sign...if it lasts.
Bottom Line:
STOCKS: Hold By early October, sentiment had reset. Several important momentum streaks ended, which has brought in buyers in the past, and seasonality turned positive. We're now seeing signs that sentiment has quickly shifted, especially among options traders. It's gotten to an extreme that has preceded weaker-than-average returns.
BONDS: Hold In late October, sentiment on bonds - from Treasuries to corporates - entered pessimistic territory. It's now starting to recover, with some quick moves in corporate bonds. We'll see if those bonds, in particular, can hold recent gains.
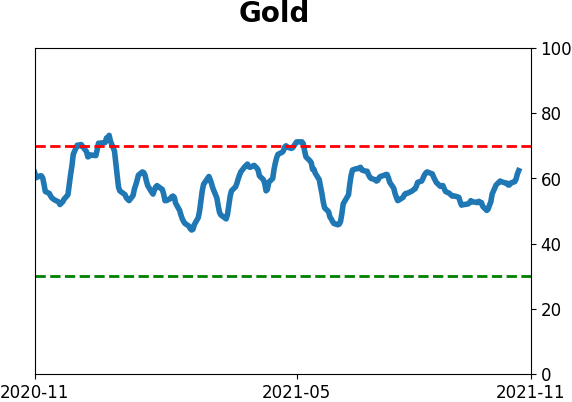
GOLD: Hold
Gold and miners were rejected after trying to recover above their 200-day averages in May. Some oversold extremes in breadth measures among miners triggered in late September, and they've recovered a bit since then. The group still has some proving to do.
|
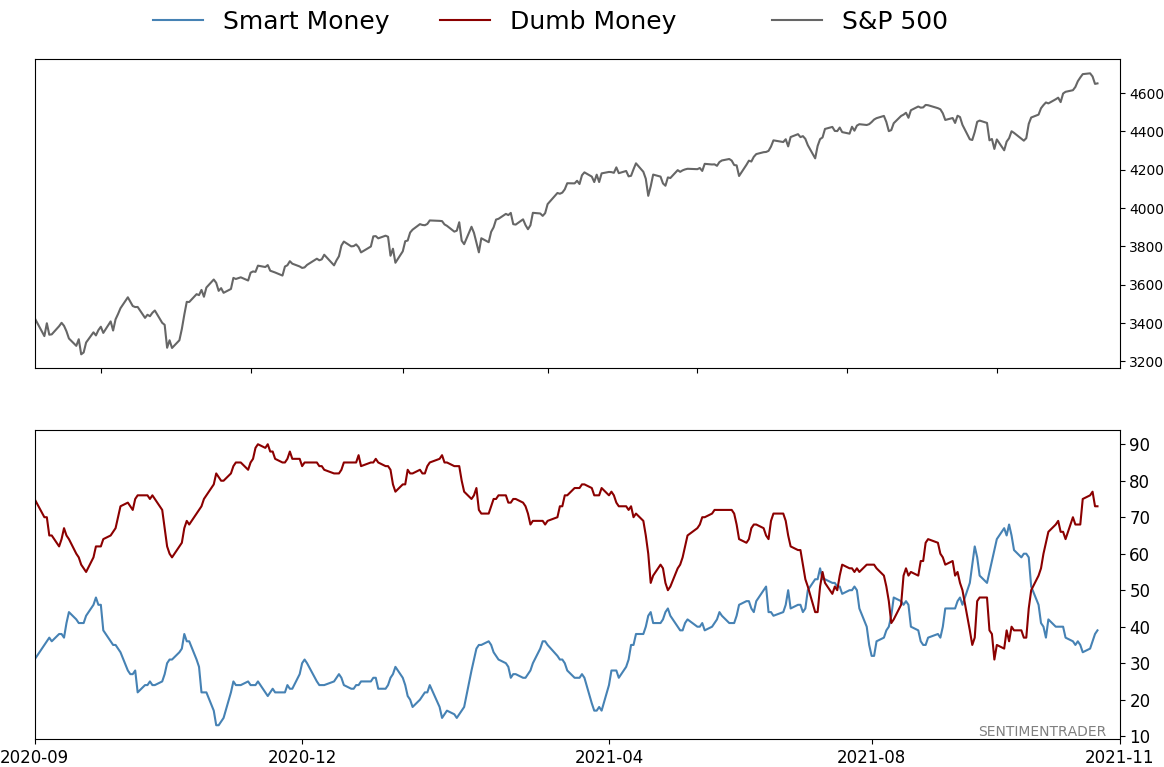
Smart / Dumb Money Confidence
|
Smart Money Confidence: 39%
Dumb Money Confidence: 73%
|
|
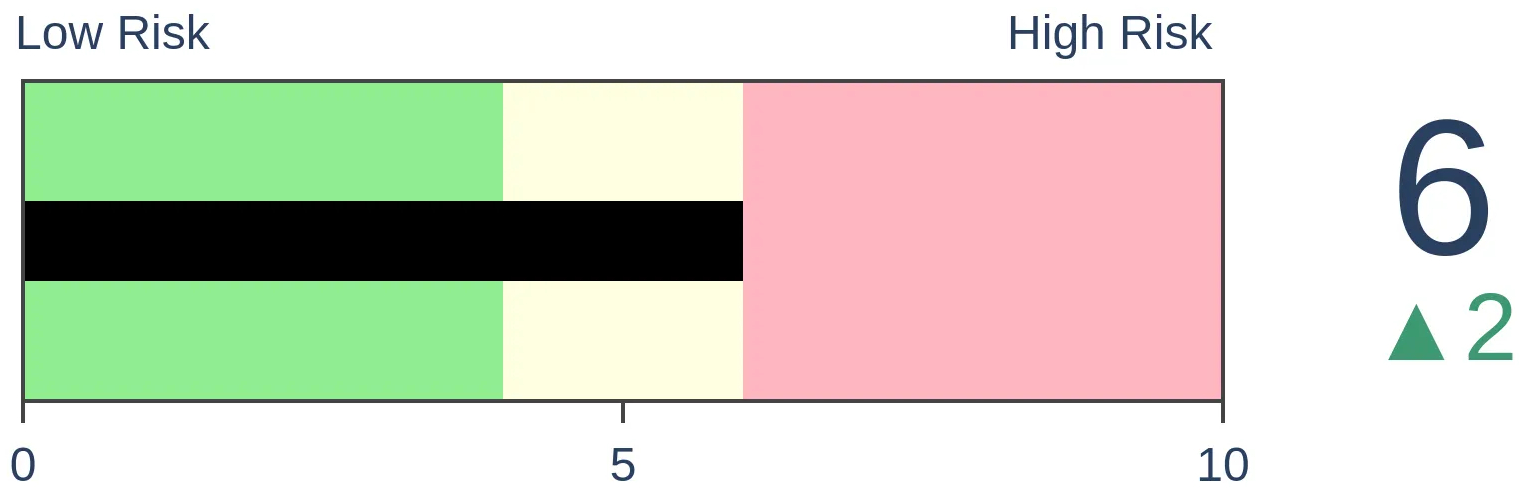
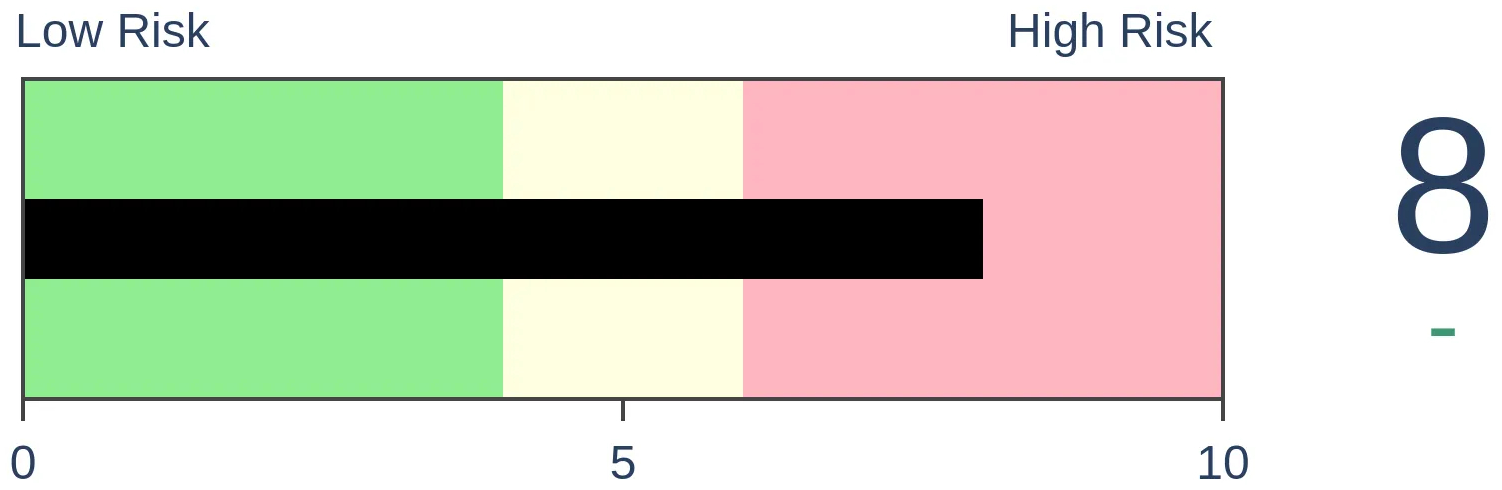
Risk Levels
Stocks Short-Term
|
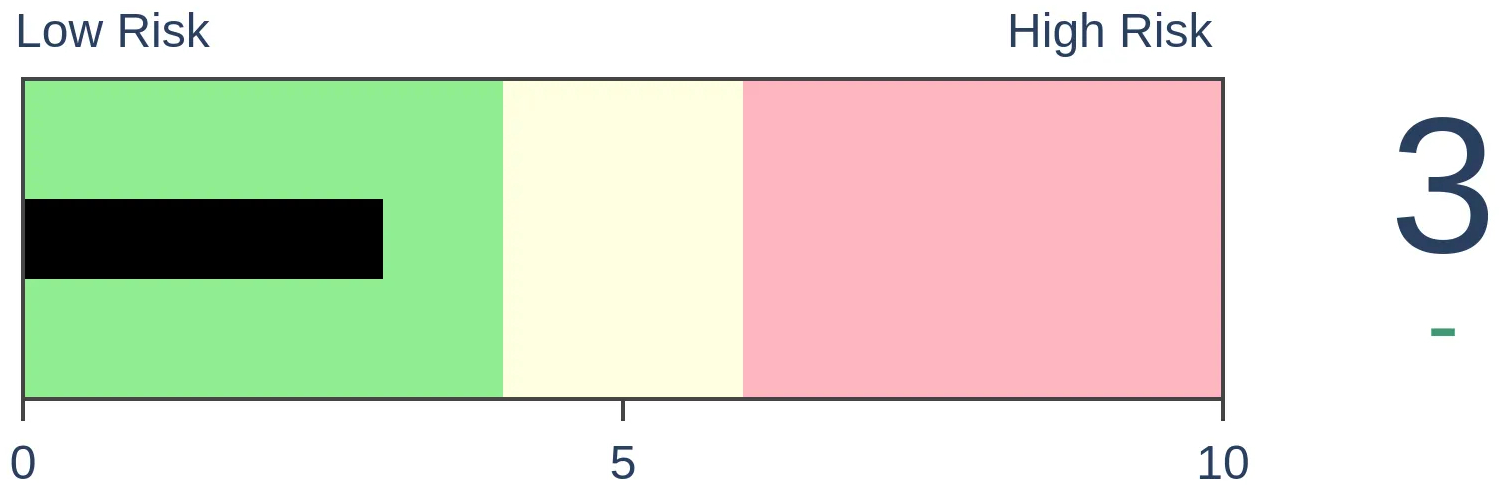
Stocks Medium-Term
|
|
Bonds
|
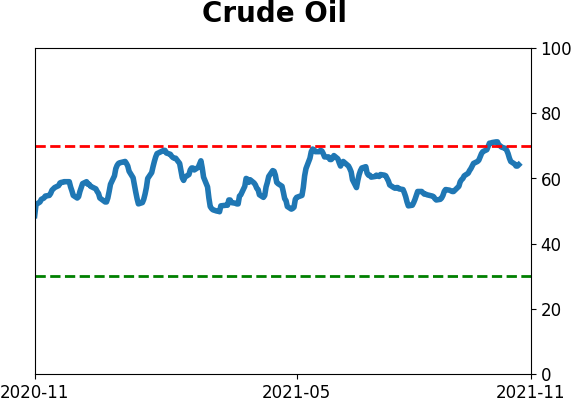
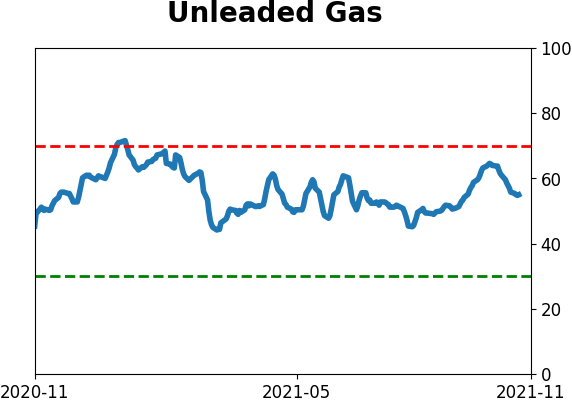
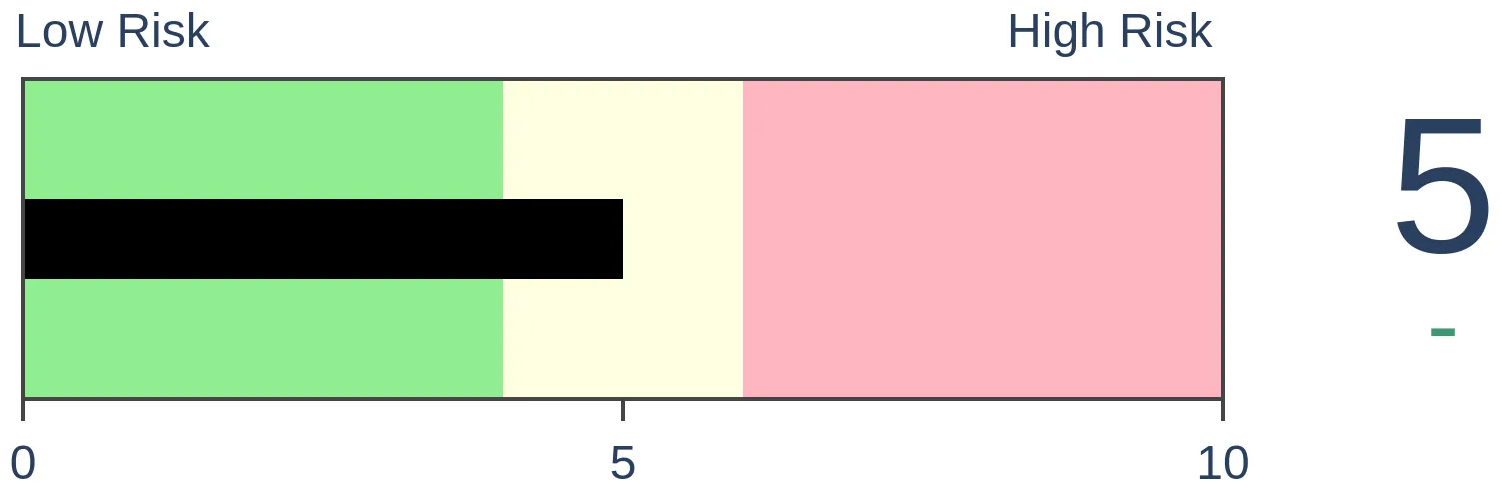
Crude Oil

|
|
Gold
|
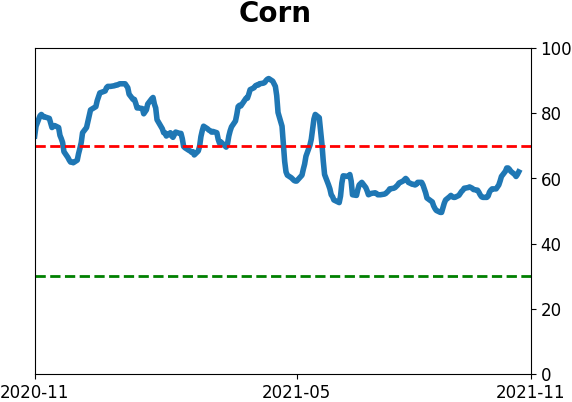
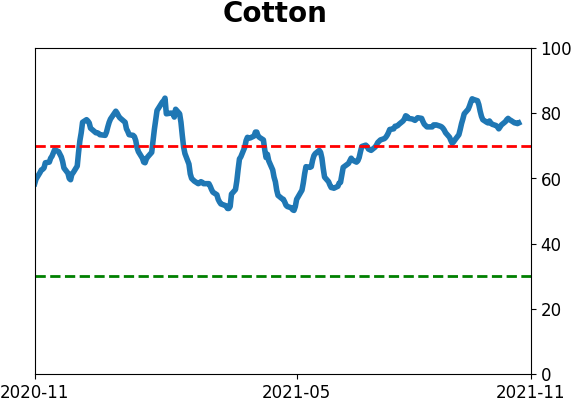
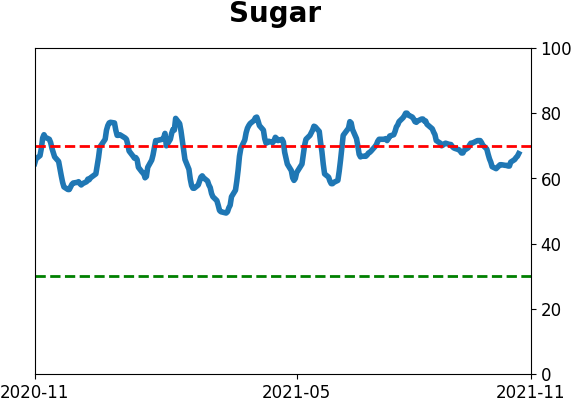
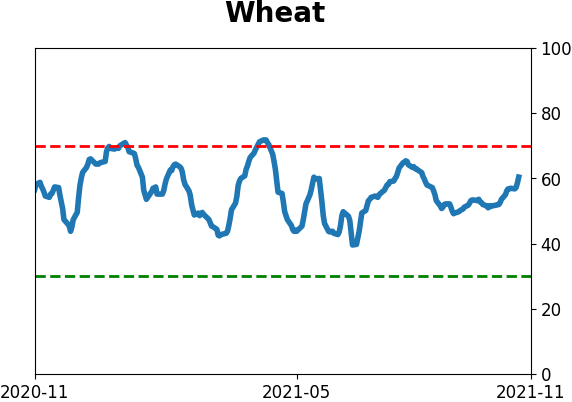
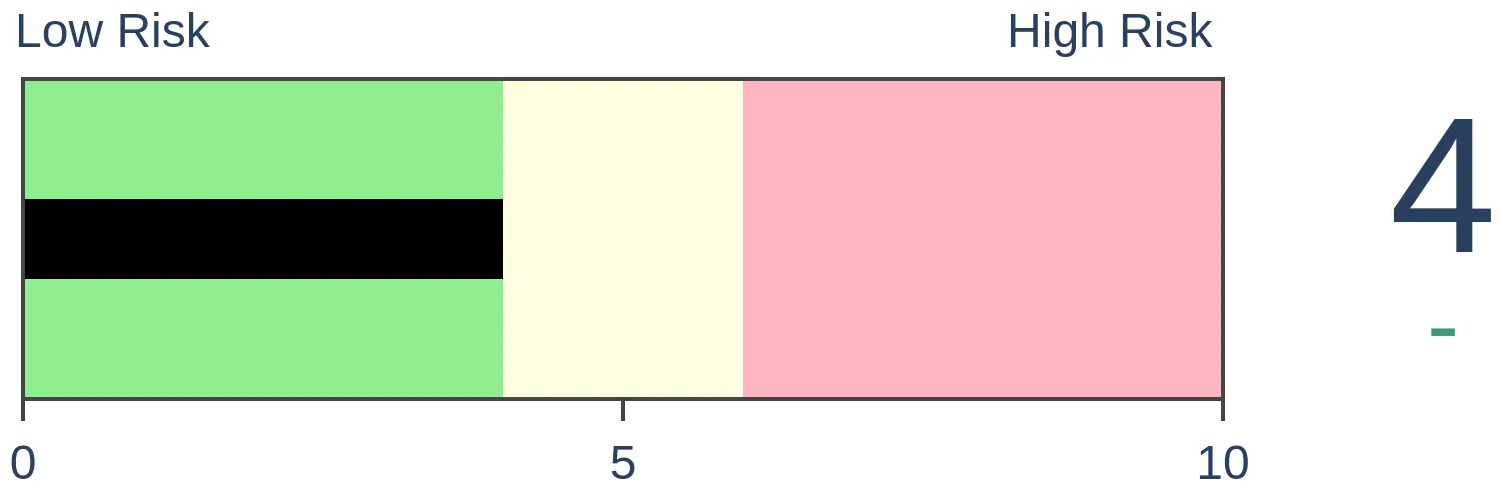
Agriculture
|
|
Research
By Jason Goepfert
BOTTOM LINE
The high-yield bond market diverged from the positive stock market in October. Breadth metrics show that junk bonds became moderately oversold and are now trying to recover. This should be a good sign...if it lasts.
FORECAST / TIMEFRAME
None
|
Key points:
- Many high-yield bonds diverged from the stock market through October
- Junk bond breadth indicators show a recovery attempt from oversold conditions
- This should be a good sign for stocks and bonds; we just need to watch for failures
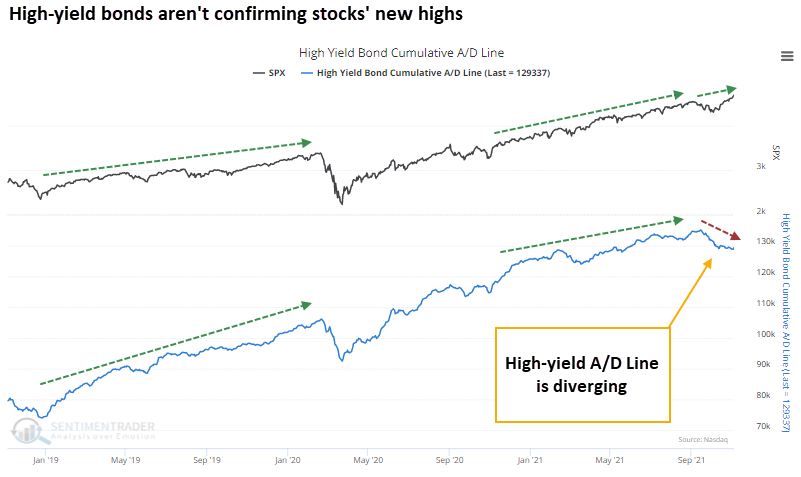
High-yield bond A/D Line has diverged from the stock market
In years past, we've looked at signals that the high-yield bond market is giving for stocks. Bond investors - especially junk bond investors - tend to be hypersensitive to changes in default risk and economic growth.
When these folks smell trouble, they sell first and wait for the smoke to clear. If high-yield bond prices are rising and hitting new highs, it's less likely that stocks are in imminent danger.
It's worth keeping an eye on now because, for the first time in a long time, many of these bonds aren't confirming the move in stocks. The Cumulative Advance/Decline Line for high-yield bonds has been sliding for weeks as the S&P 500 continually notched new highs.
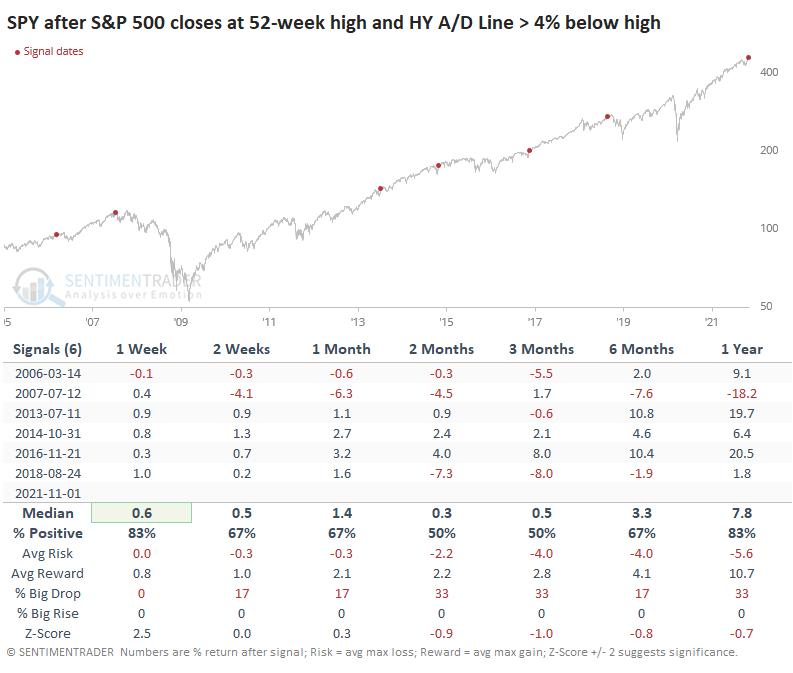
That seems like it should be a worry, and SPY did suffer a hiccup a few times. Our history is short and dominated by a roaring bull market, so those hiccups were enough to show mostly below-average returns over the next 2-3 months.
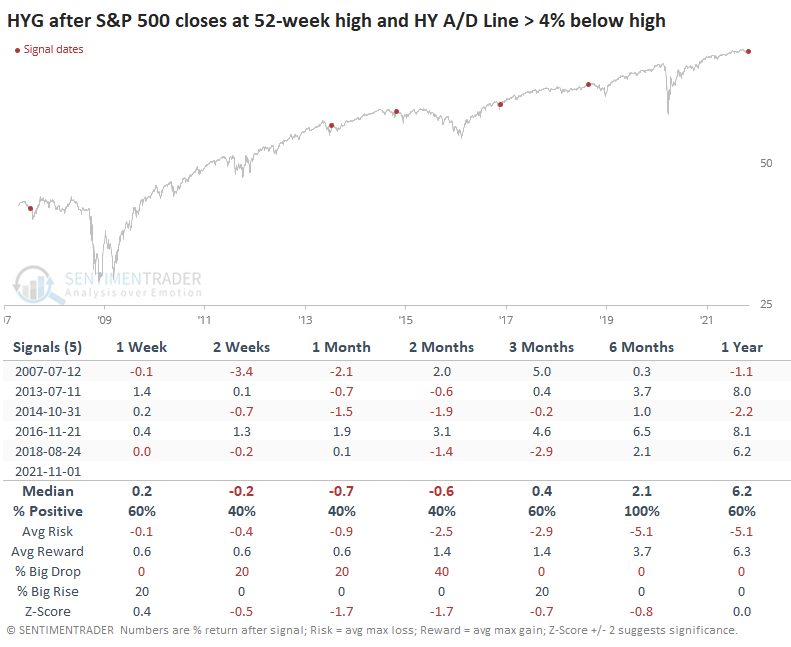
For the HYG high-yield bond fund, it was more of a concern. It wasn't around in 2006, and other proxies only had weekly data then, so we have fewer signals. Over the short- to medium-term, HYG showed a loss after 4 out of 5 signals but recovered over the next six months.
Other indicators show recovery from mild oversold conditions
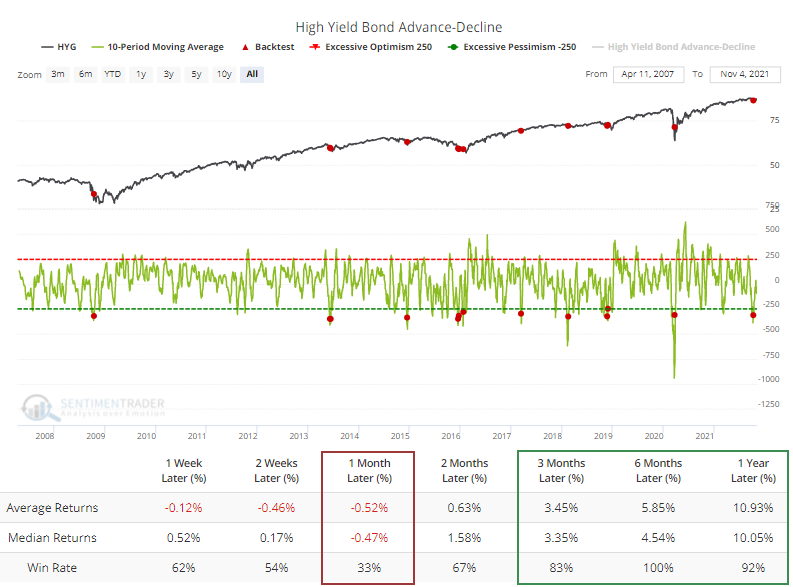
The A/D Line has been dropping because more bonds have been declining than rising (of course). The 10-day average of advancing minus declining junk bonds dipped to an extreme low in mid-October and has attempted to get back to even.
Other times when the average recovered from below -350, HYG struggled for up to a month, then showed strong returns according to the Backtest Engine.
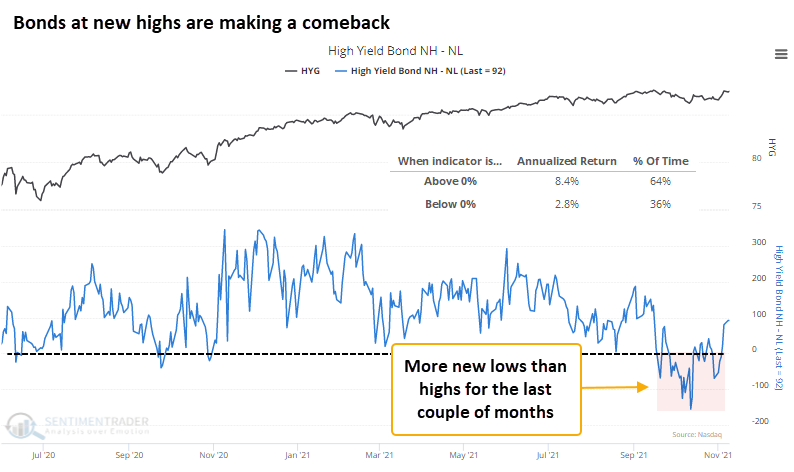
The net number of highs minus lows has recovered in recent sessions as more bonds hit 52-week highs than fell to 52-week lows. For much of the last couple of months, this was tilted toward new lows. The HYG fund has performed much better when this is positive, so that's good for now. It's just a bit worrisome that it has been diverging since the summer.
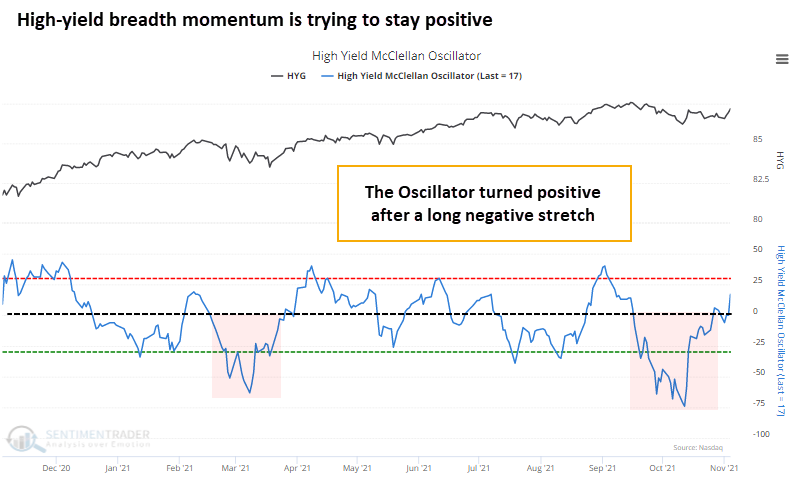
The lackluster performance in many high-yield bonds pushed the McClellan Oscillator below zero for most of September and October. That, too, has recovered in recent sessions.
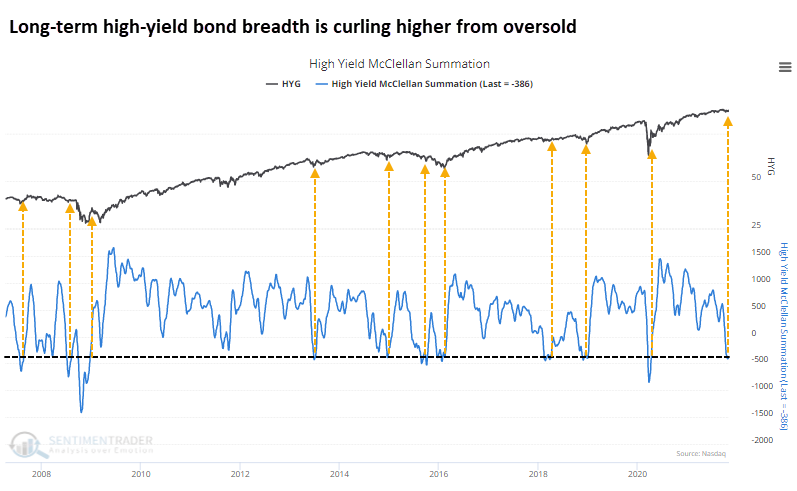
The lagging breadth in junk bonds was so persistent that the longer-term McClellan Summation Index fell well below zero. It's now trying to curl higher, which is another mostly positive sign over the medium- to long-term.
What the research tells us...
For most of this year, activity in the high-yield bond market confirmed the good performance in stocks. They stumbled along with most stocks in September, and there was a significant deterioration in many of these junk bonds. That market is now recovering from moderate oversold conditions, which should be a good sign. It's just a bit worrying that so many bonds suffered substantial losses, something we hadn't seen since the pandemic panic. We will continue to monitor behavior in these bonds to see if they give a tip-off of potential risk-off behavior in the coming weeks.
Active Studies
| Time Frame | Bullish | Bearish | | Short-Term | 2 | 0 | | Medium-Term | 11 | 0 | | Long-Term | 12 | 5 |
|
Indicators at Extremes
Portfolio
| Position | Description | Weight % | Added / Reduced | Date | | Stocks | RSP | 10.7 | Added 6.4% | 2021-10-01 | | Bonds | 32.7% BND, 7.1% SCHP | 39.8 | Added 8.3% | 2021-10-26 | | Commodities | GCC | 2.4 | Reduced 2.1%
| 2020-09-04 | | Precious Metals | GDX | 4.6 | Reduced 4.2% | 2021-05-19 | | Special Situations | 9.8% KWEB, 4.7% XLE, 2.9% PSCE | 17.3 | Added 9.78% | 2021-10-01 | | Cash | | 24.1 | | |
|
Updates (Changes made today are underlined)
Much of our momentum and trend work has remained positive for several months, with some scattered exceptions. Almost all sentiment-related work has shown a poor risk/reward ratio for stocks, especially as speculation drove to record highs in exuberance in February. Much of that has worn off, and most of our models are back toward neutral levels. There isn't much to be excited about here. The same goes for bonds and even gold. Gold has been performing well lately and is back above long-term trend lines. The issue is that it has a poor record of holding onto gains when attempting a long-term trend change like this, so we'll take a wait-and-see approach. Momentum has ebbed quickly in recent weeks, and nearing oversold levels in some indicators. This can be a dangerous area, with a lot of short-term volatility, but we'd be more inclined to add medium- to long-term exposure rather than sell on much more of a decline, thanks to already rock-bottom exposure. Other areas look more attractive, including some overseas markets. RETURN YTD: 12.1% 2020: 8.1%, 2019: 12.6%, 2018: 0.6%, 2017: 3.8%, 2016: 17.1%, 2015: 9.2%, 2014: 14.5%, 2013: 2.2%, 2012: 10.8%, 2011: 16.5%, 2010: 15.3%, 2009: 23.9%, 2008: 16.2%, 2007: 7.8%
|
|
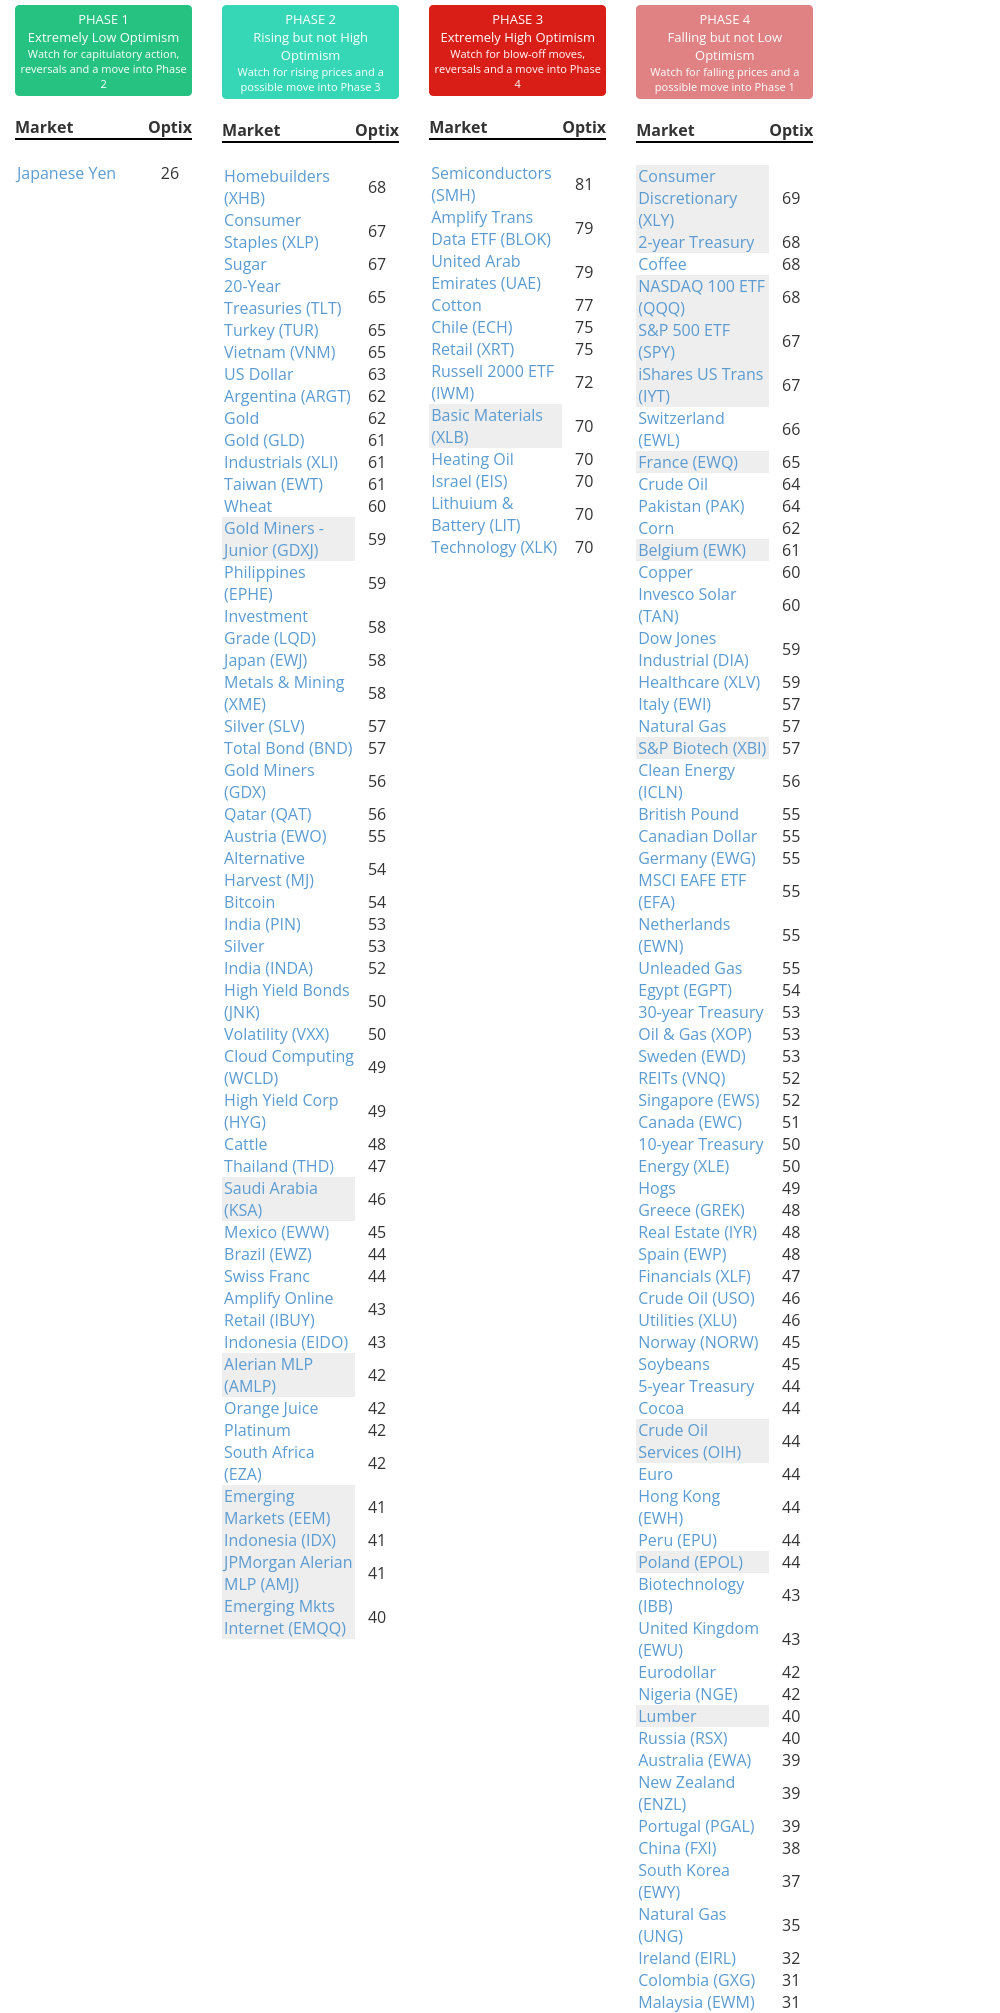
Phase Table
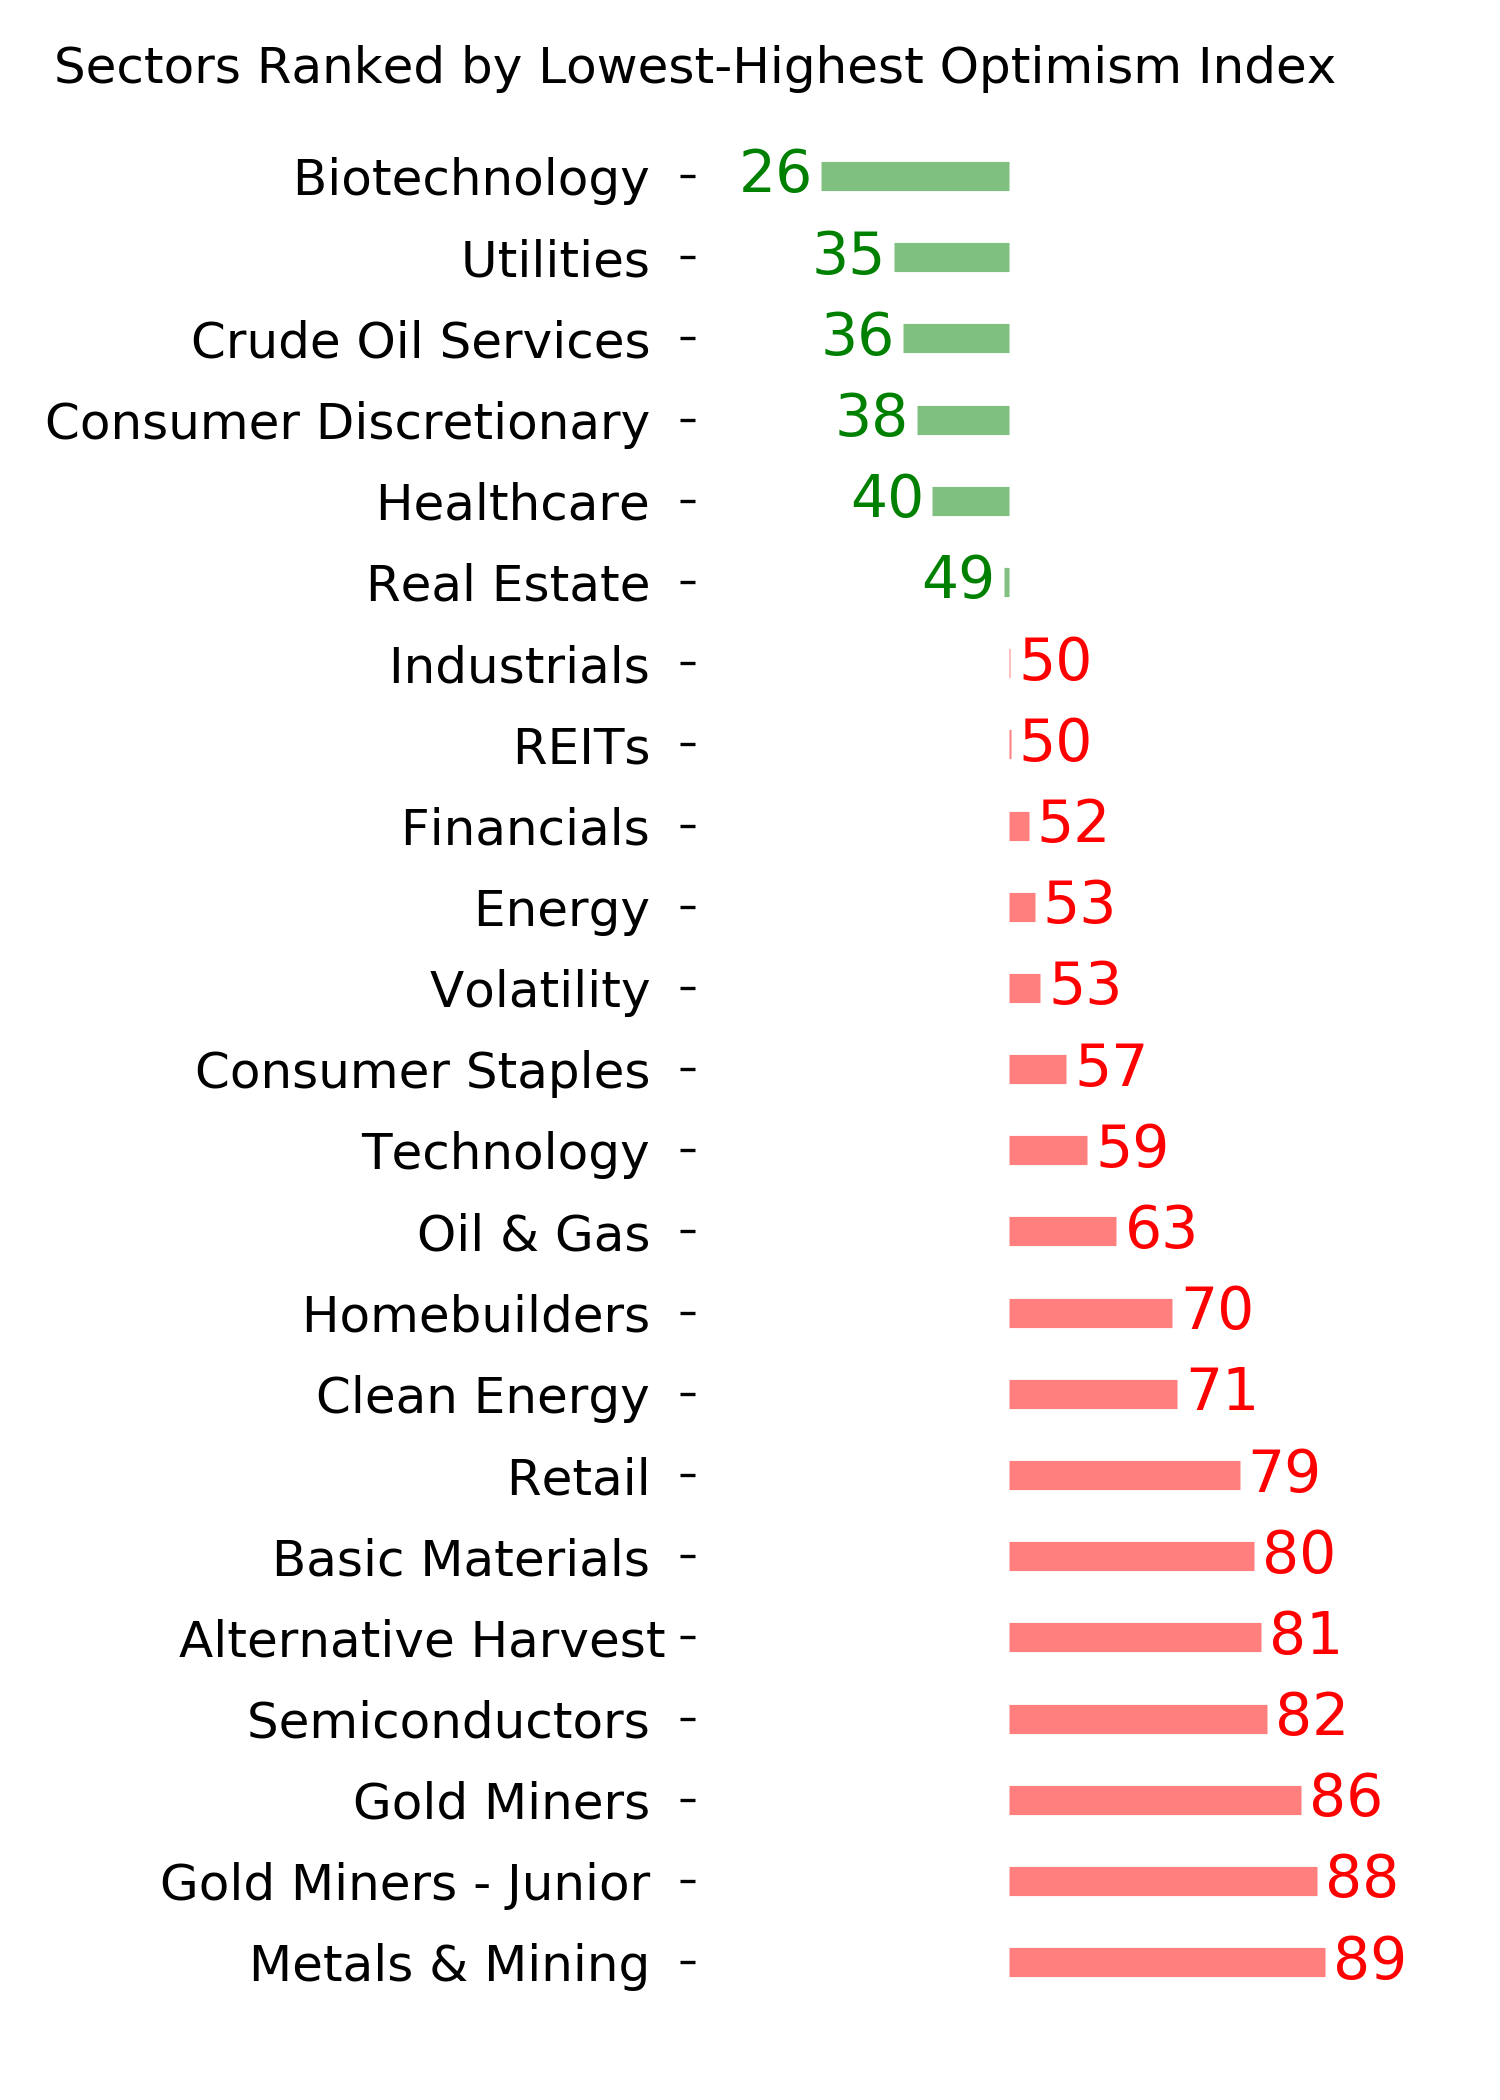
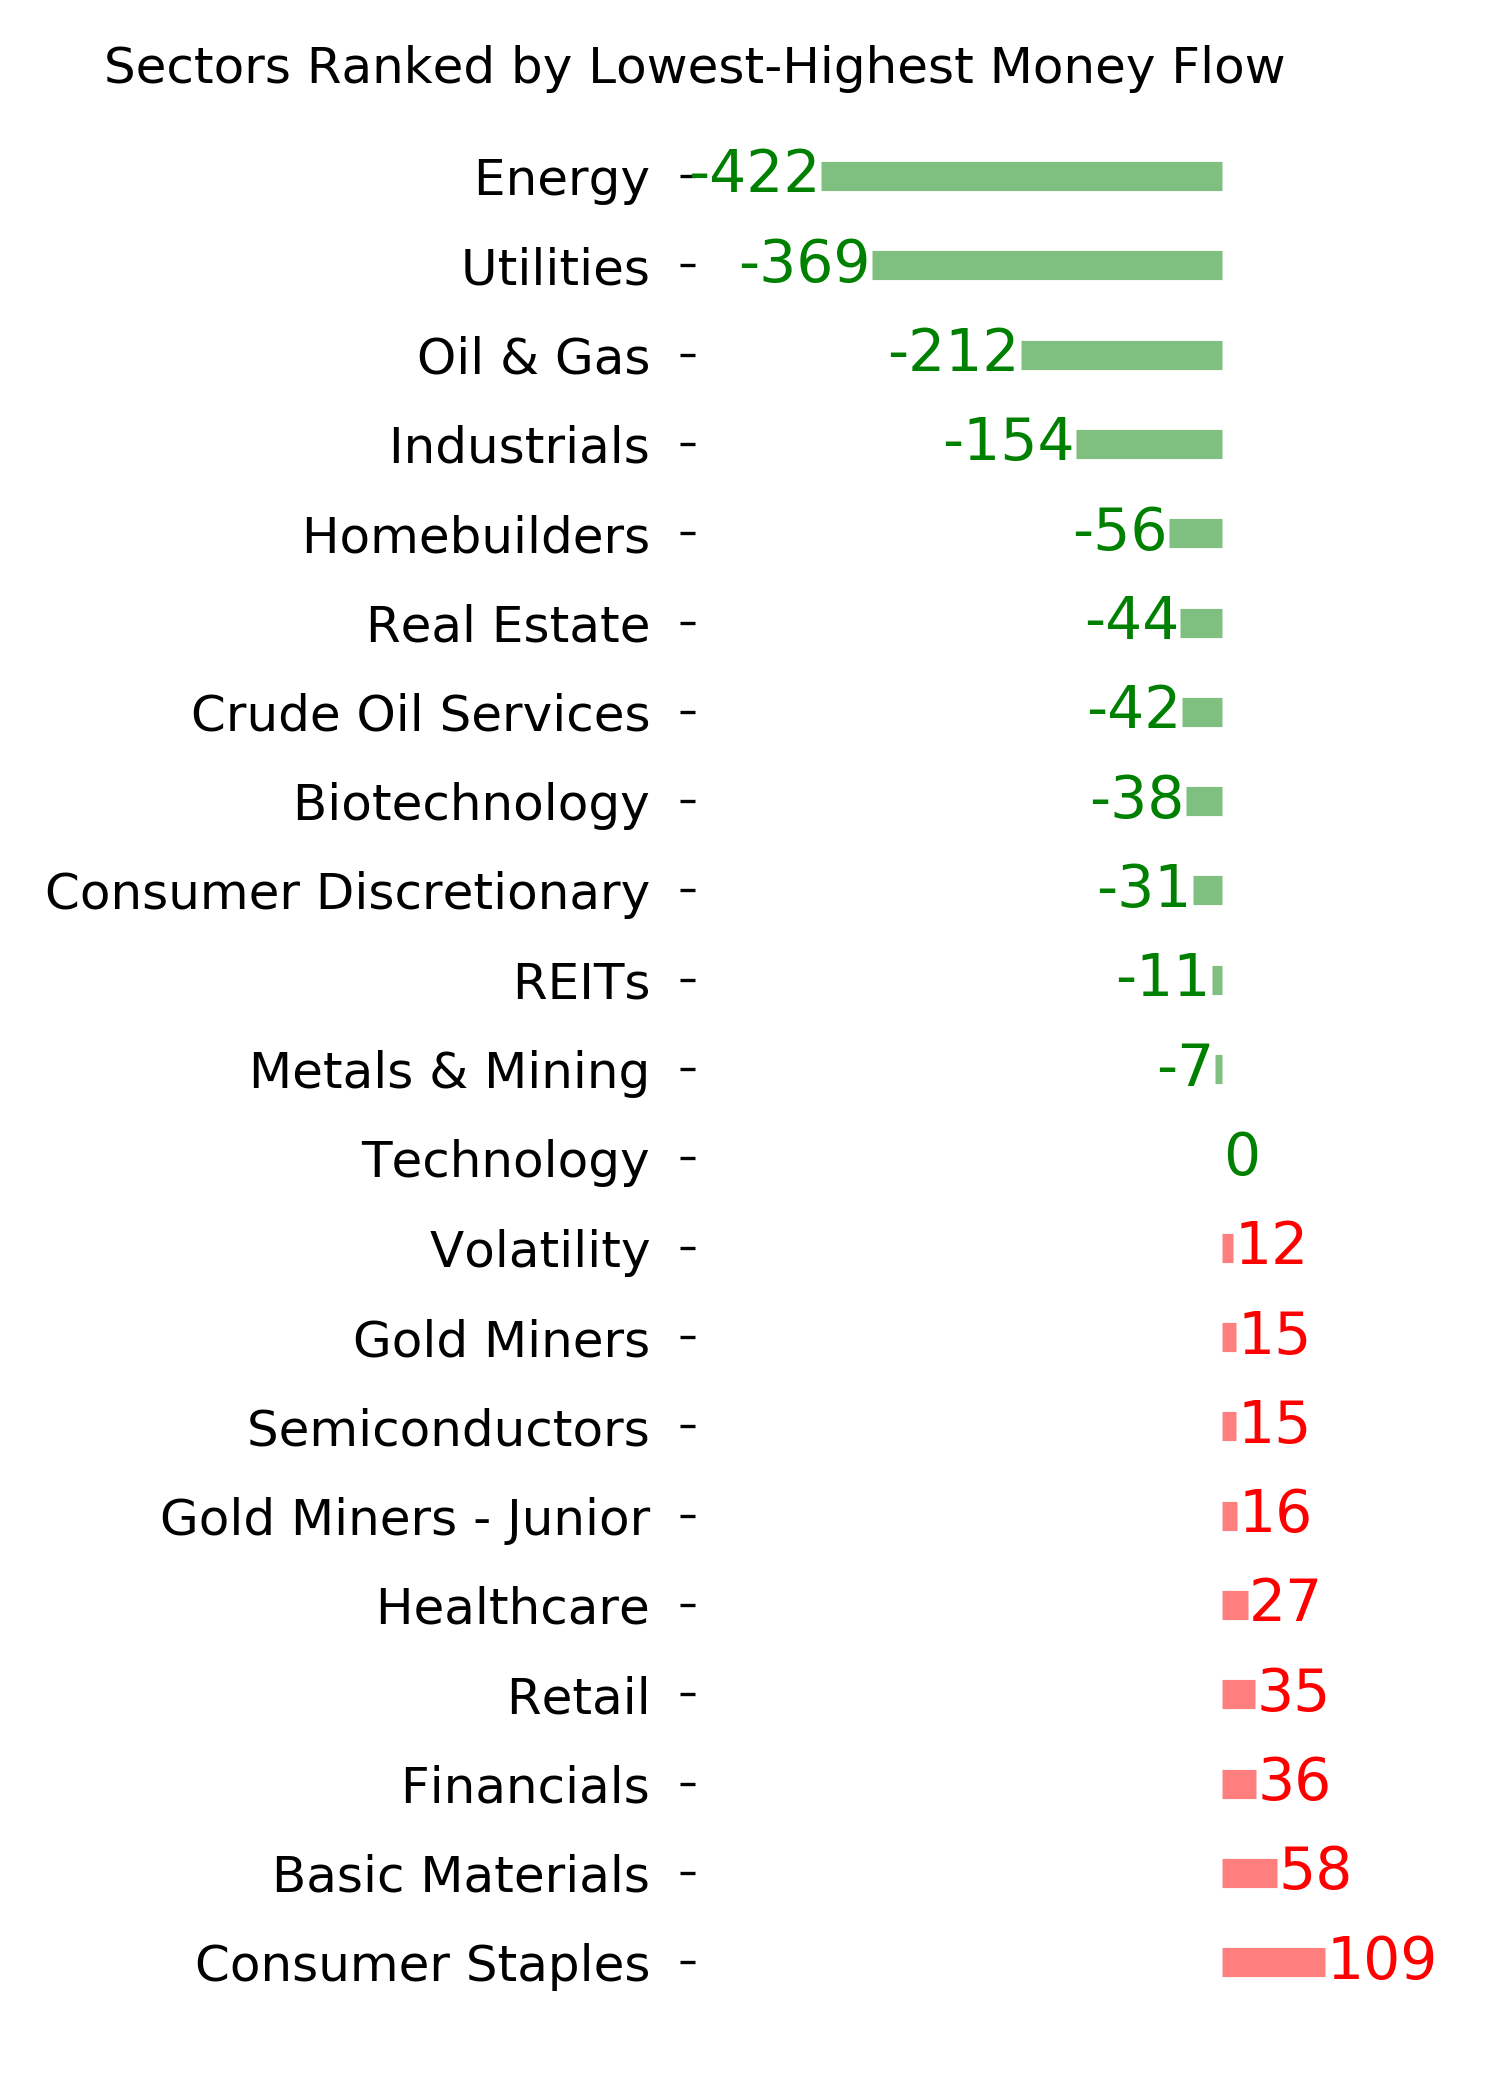
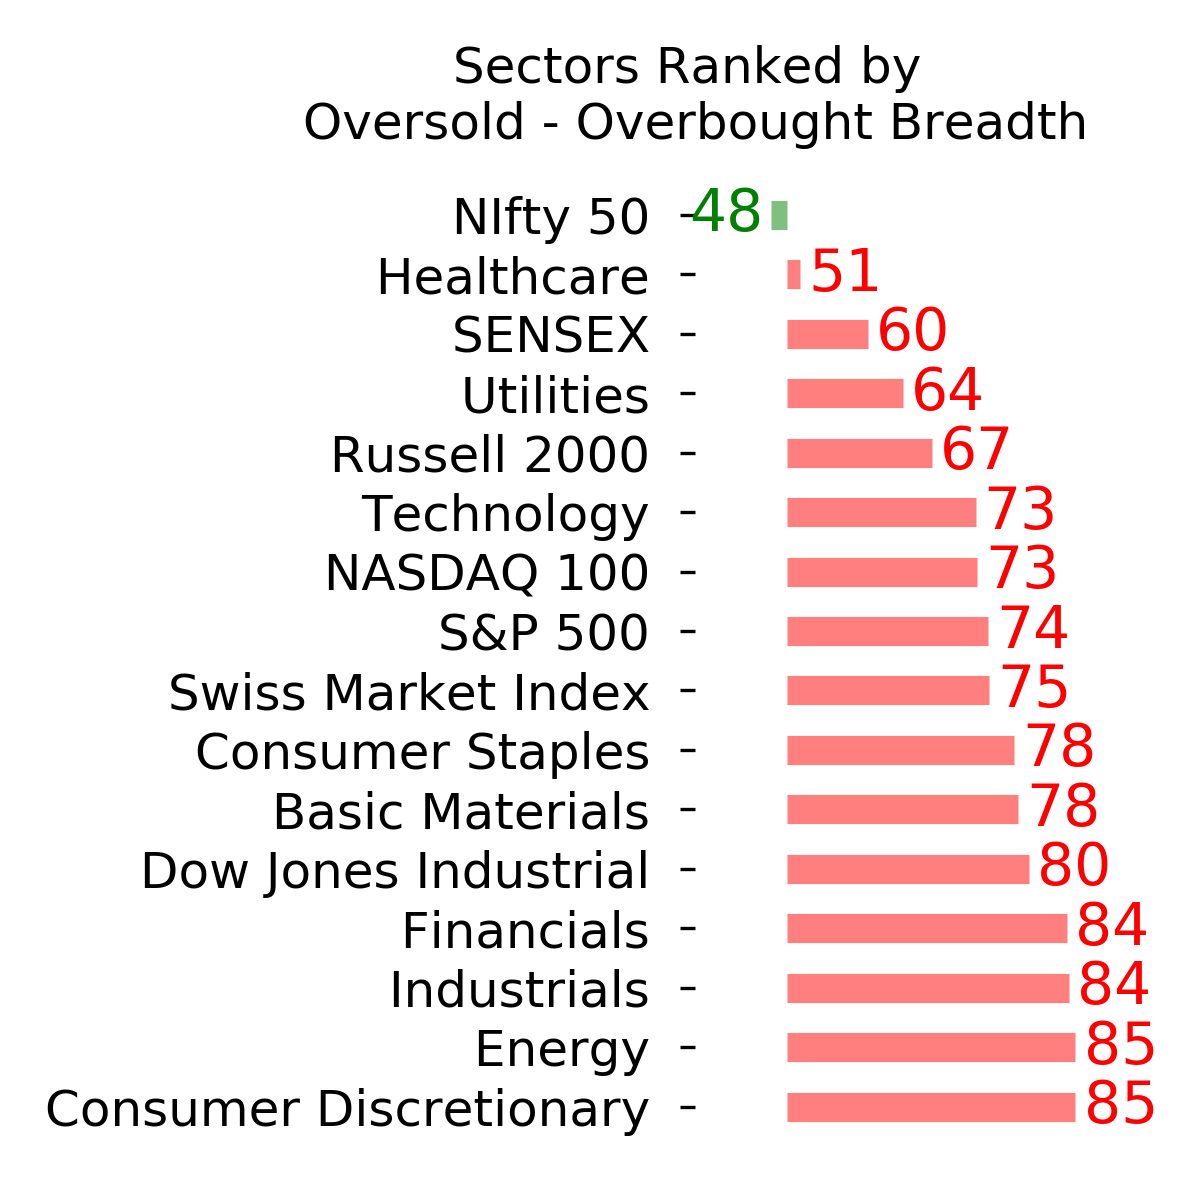
Ranks
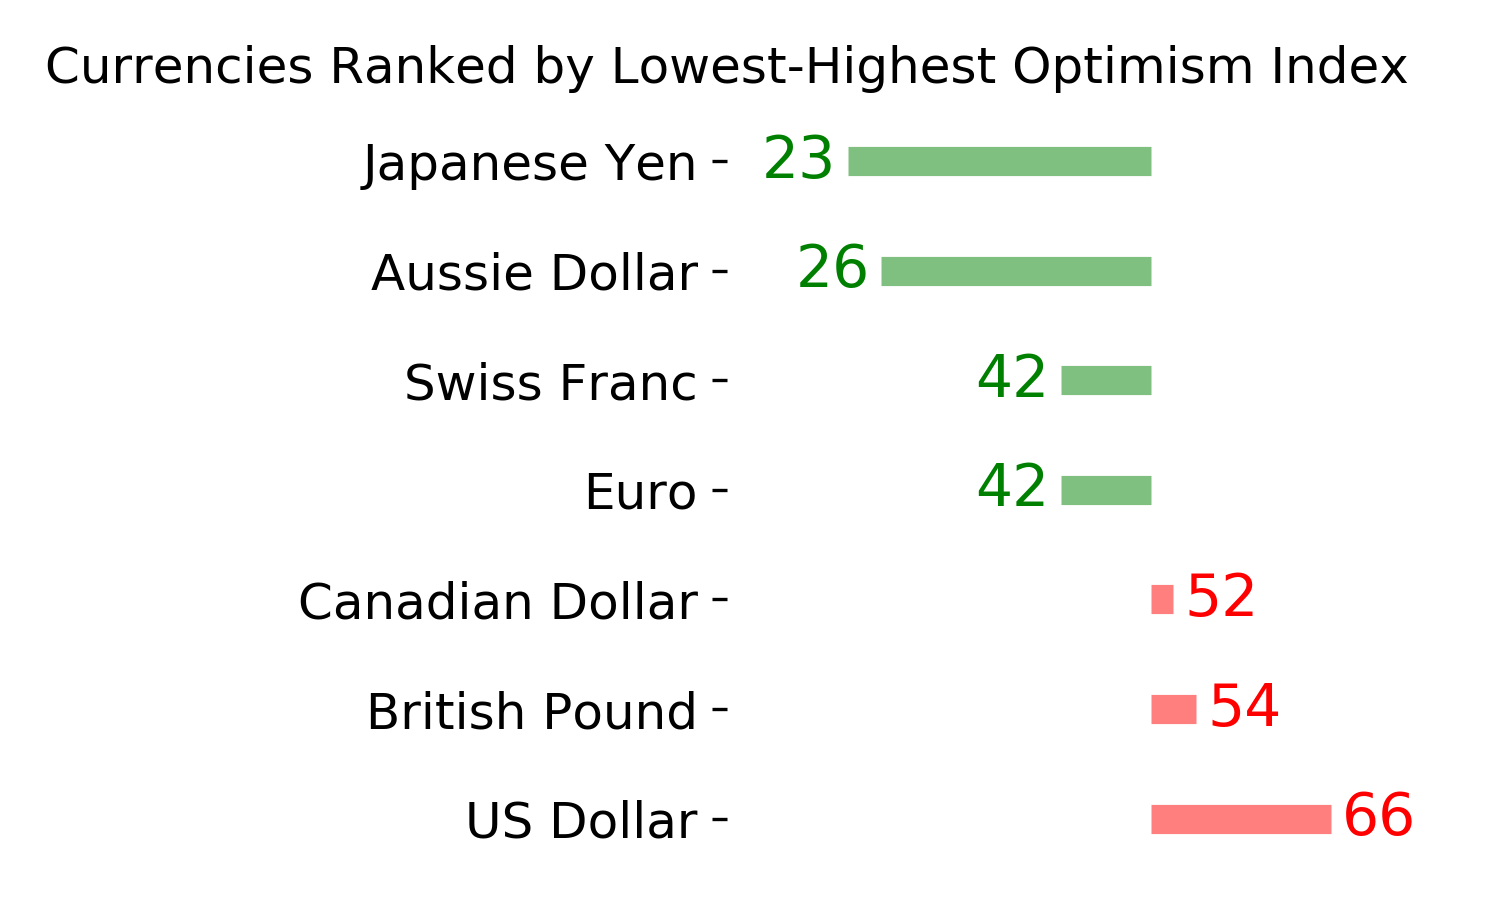
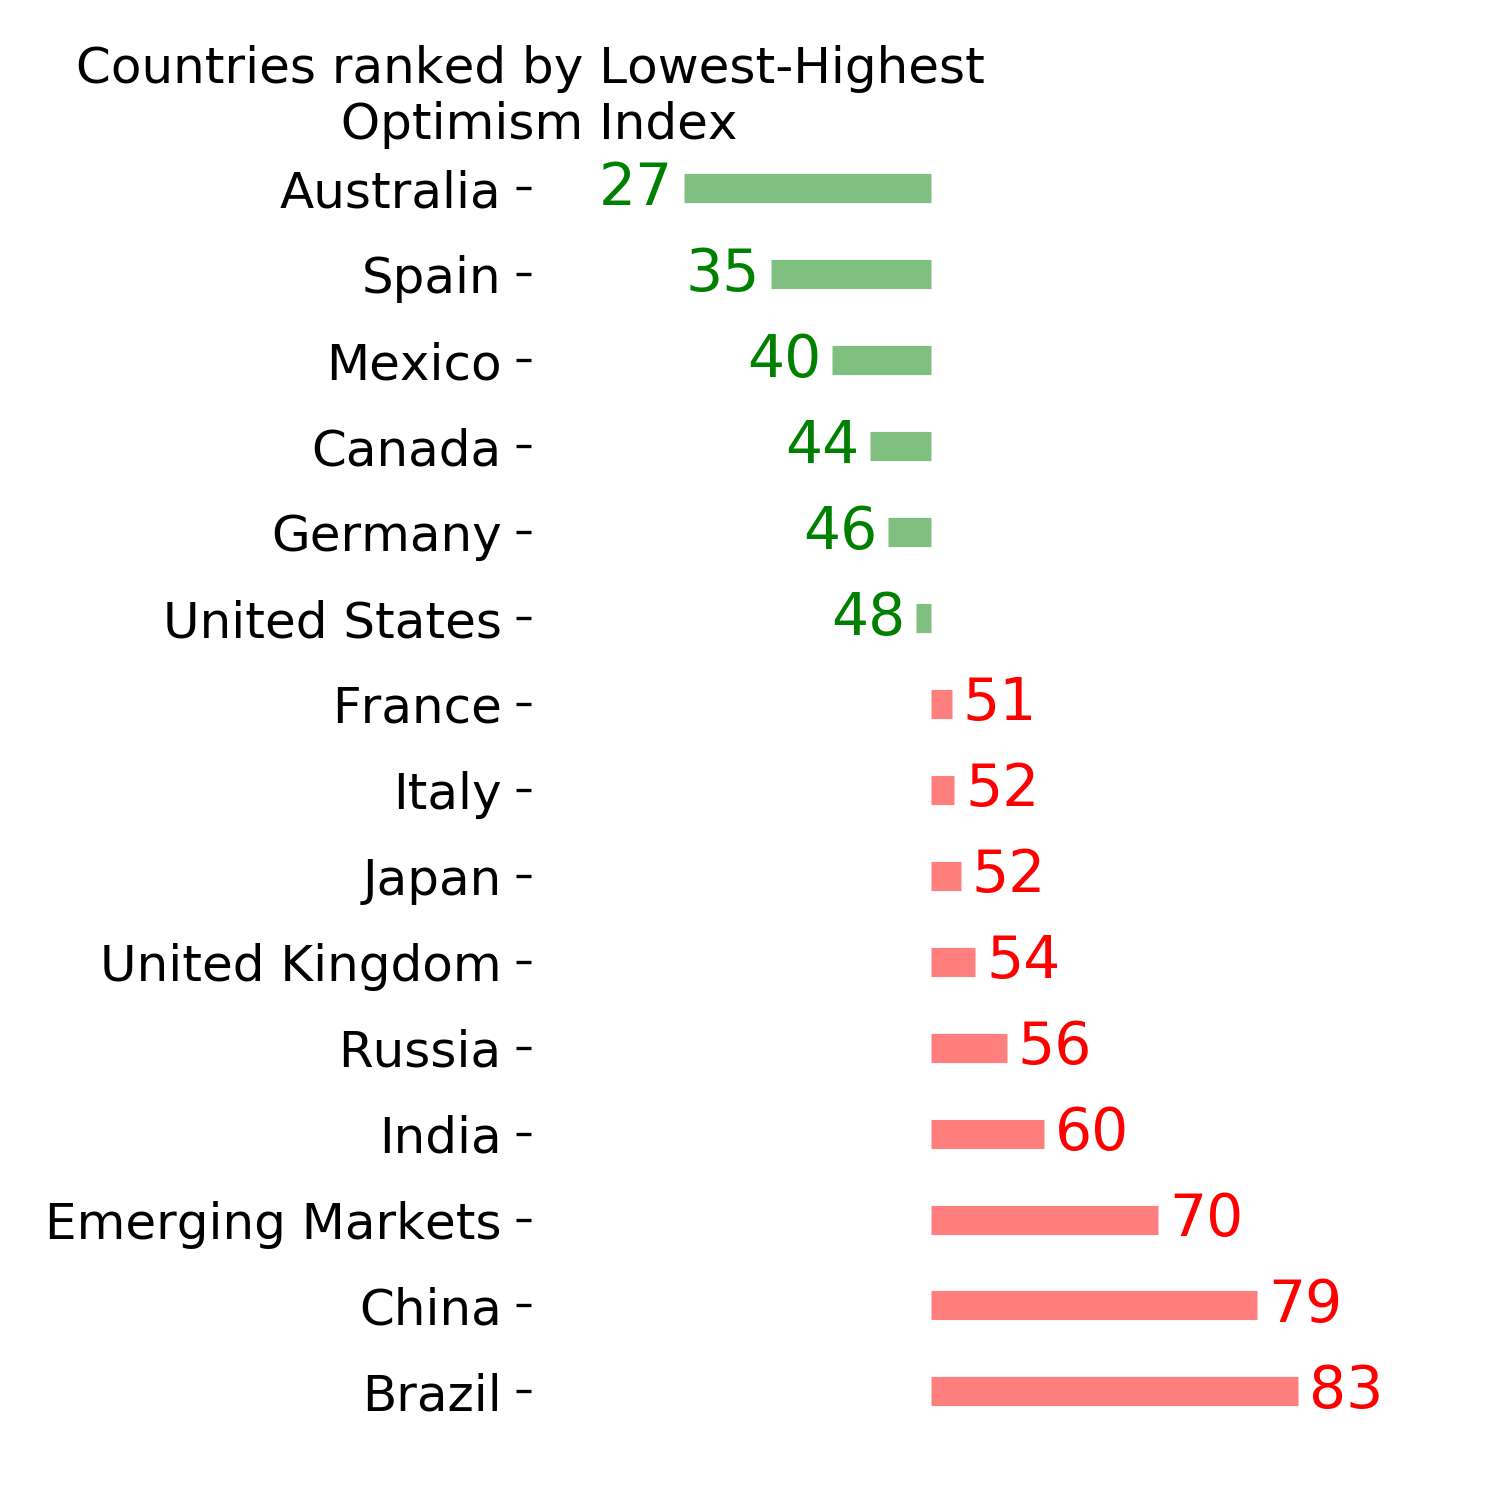
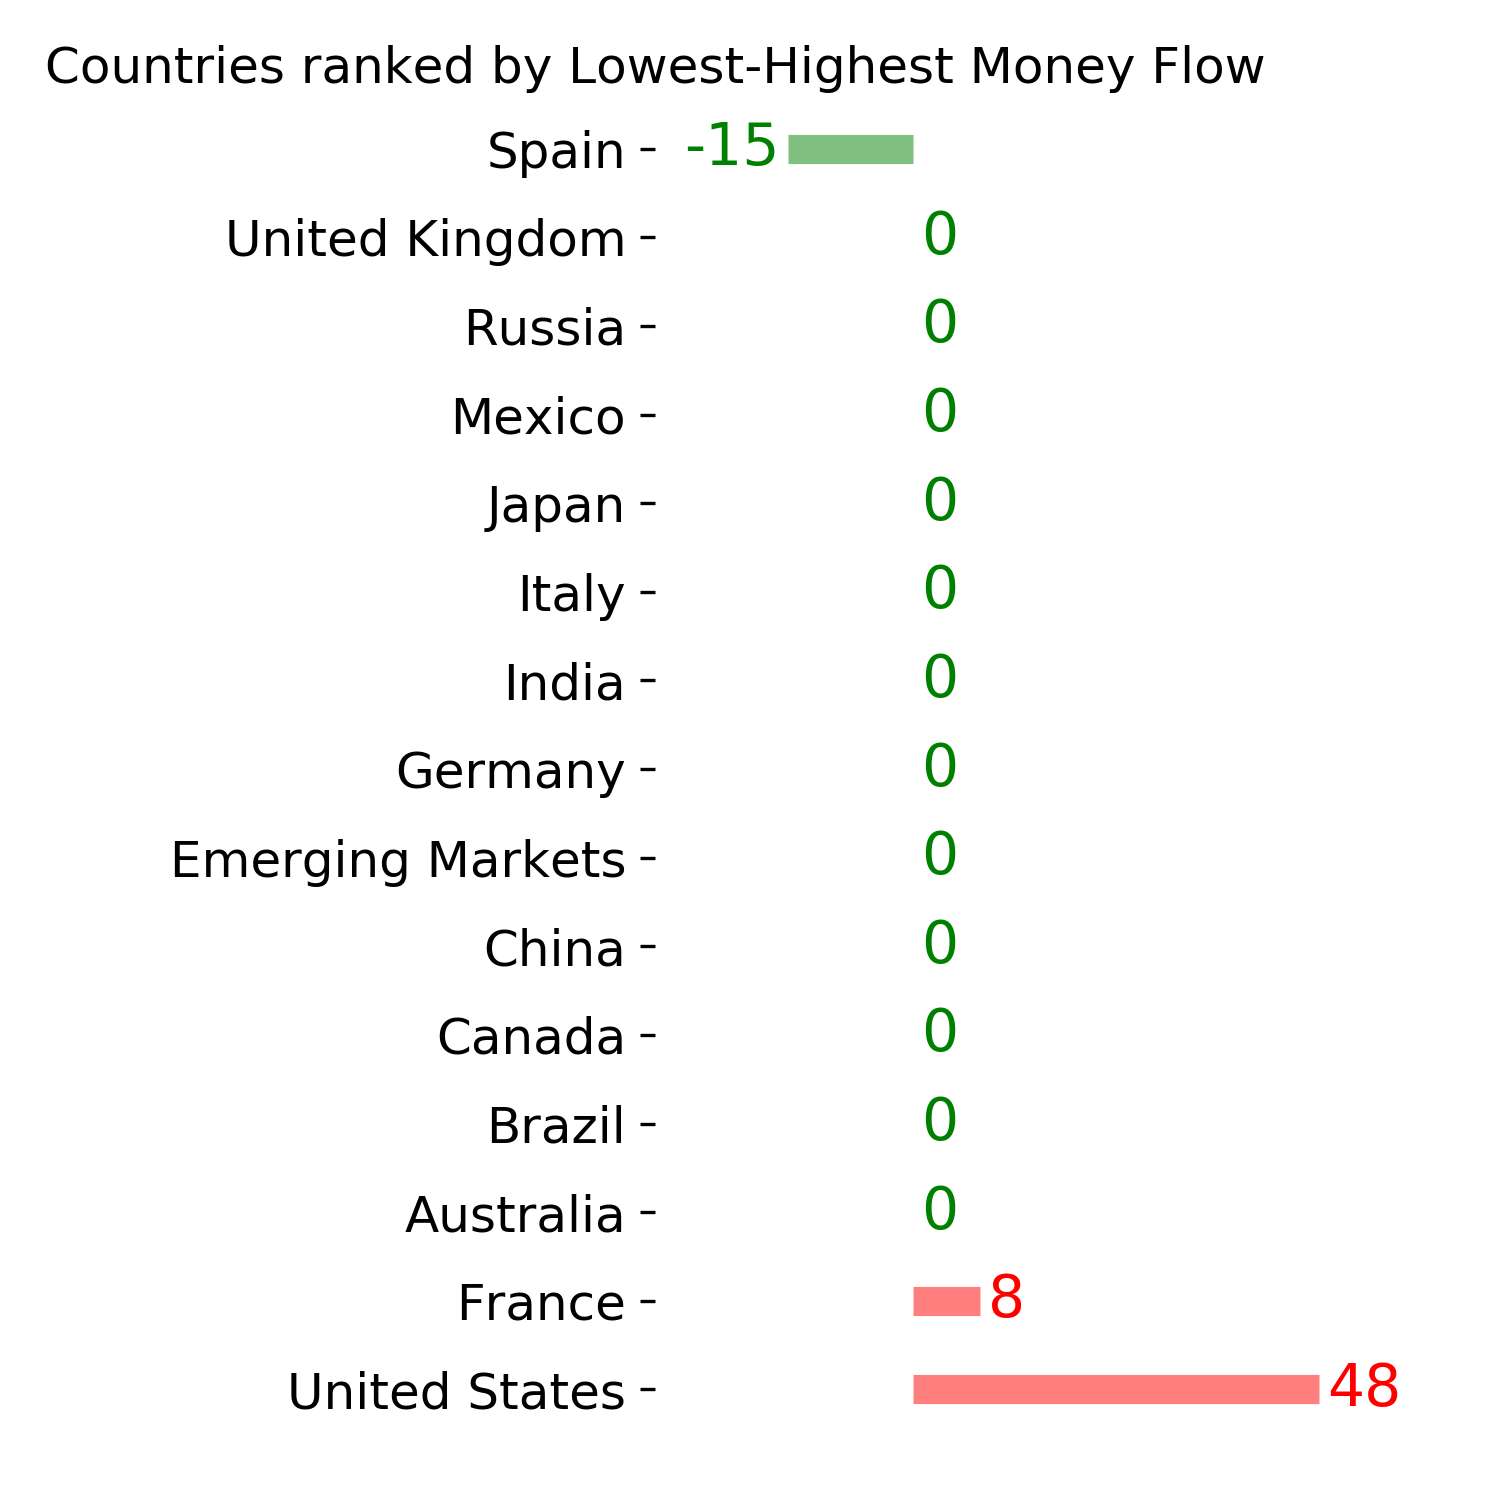
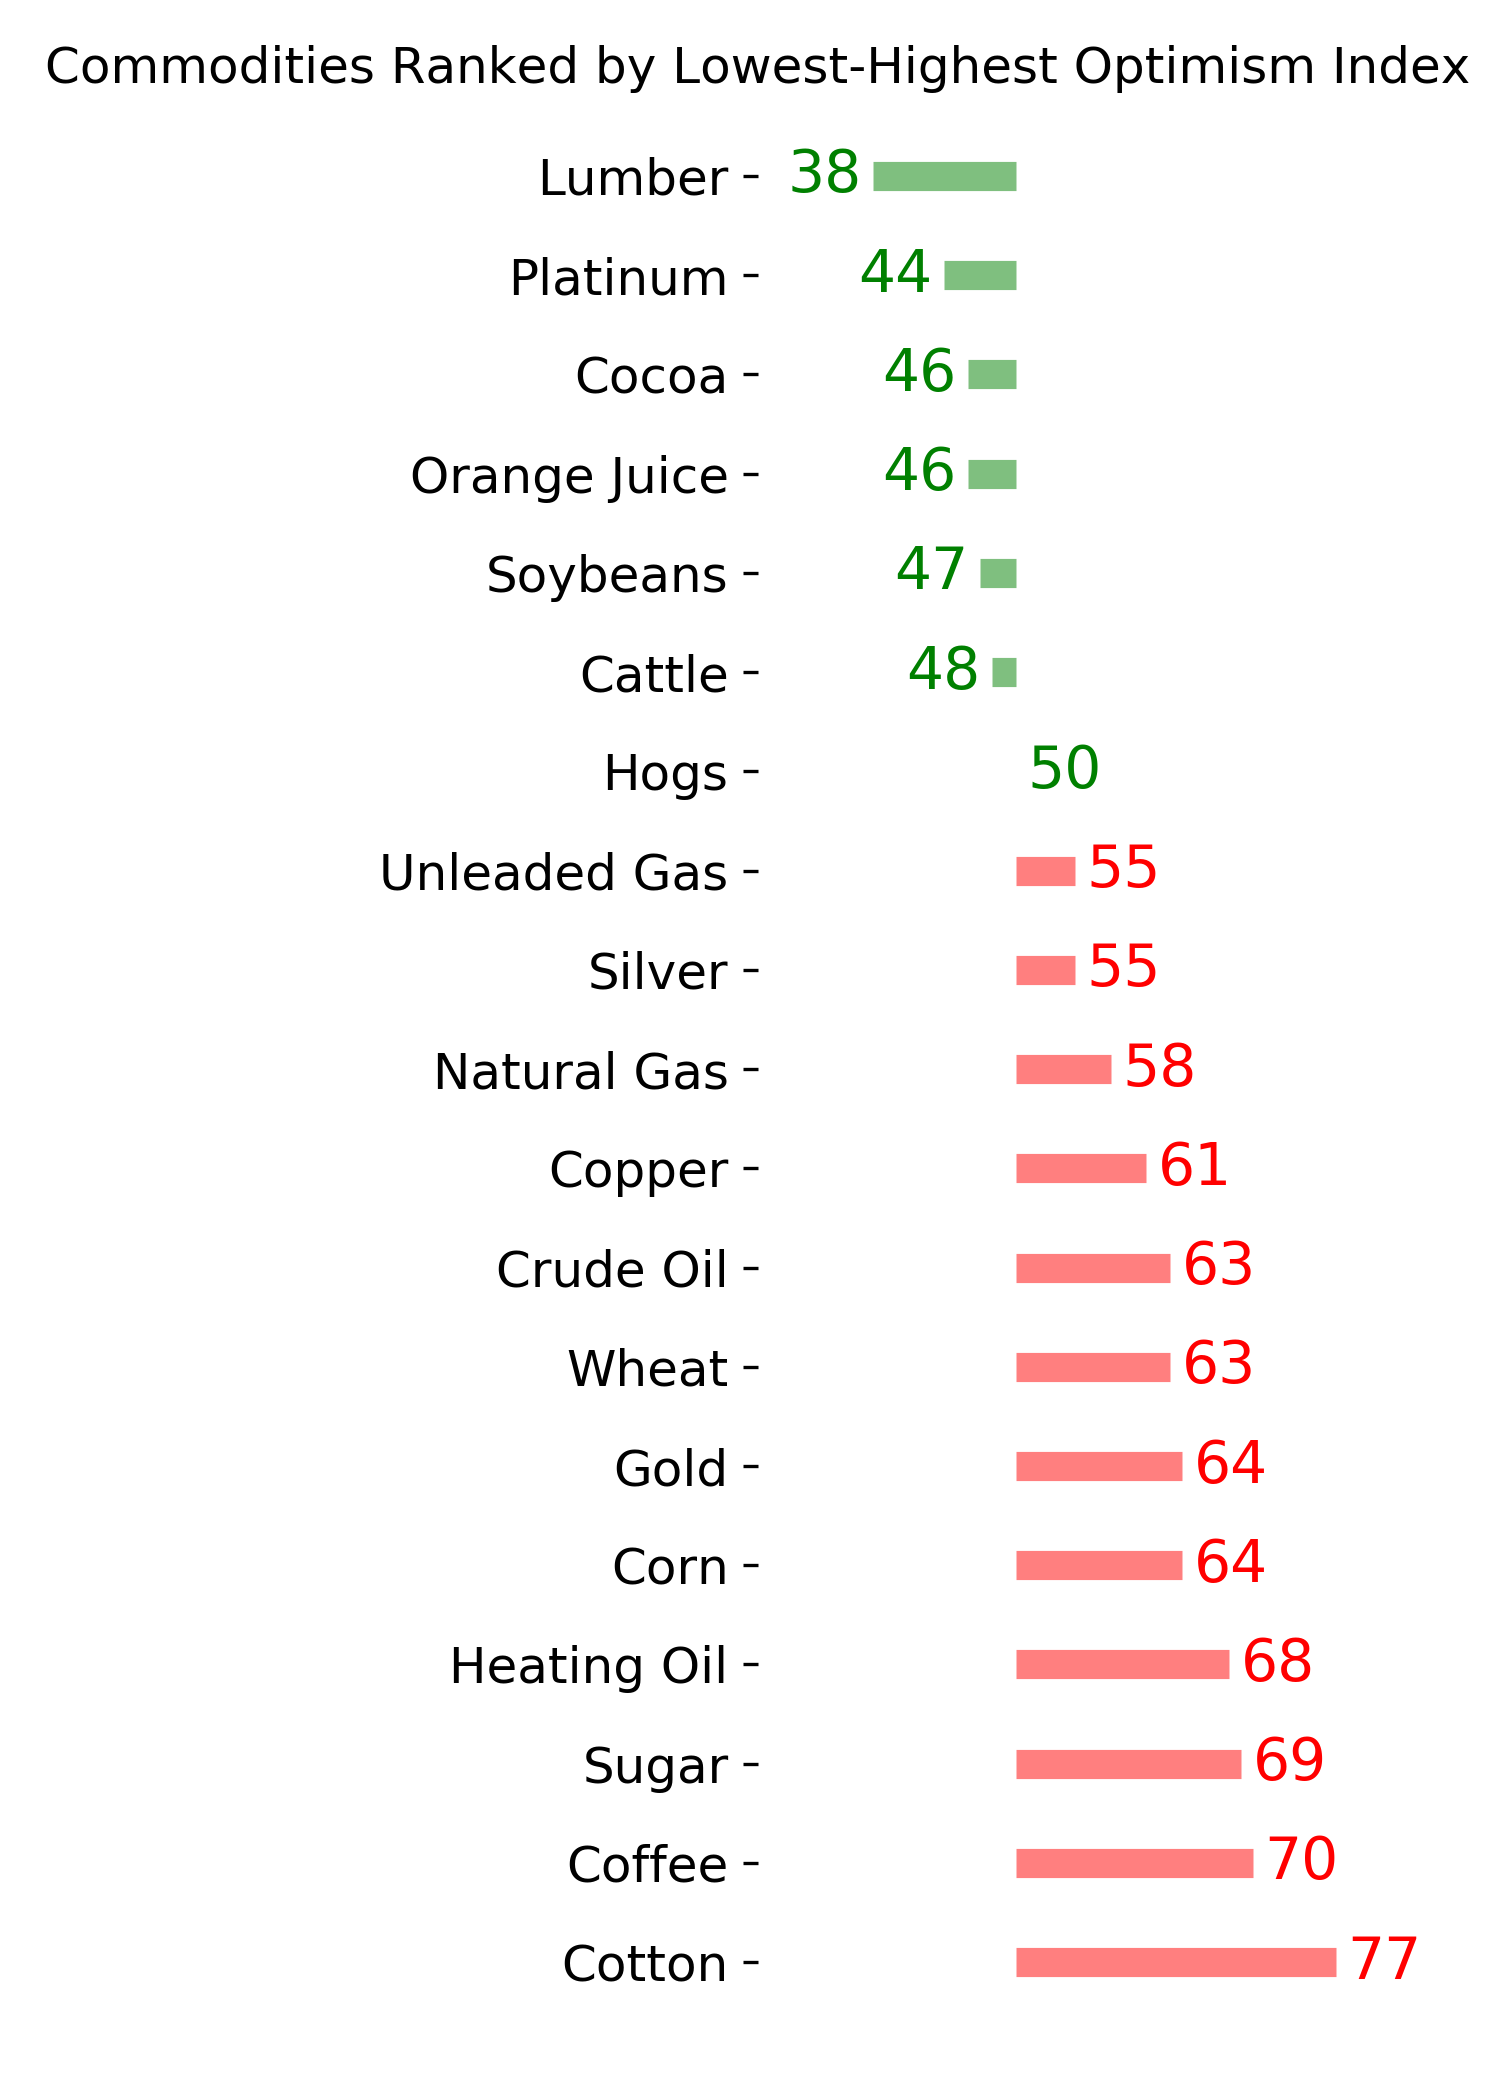
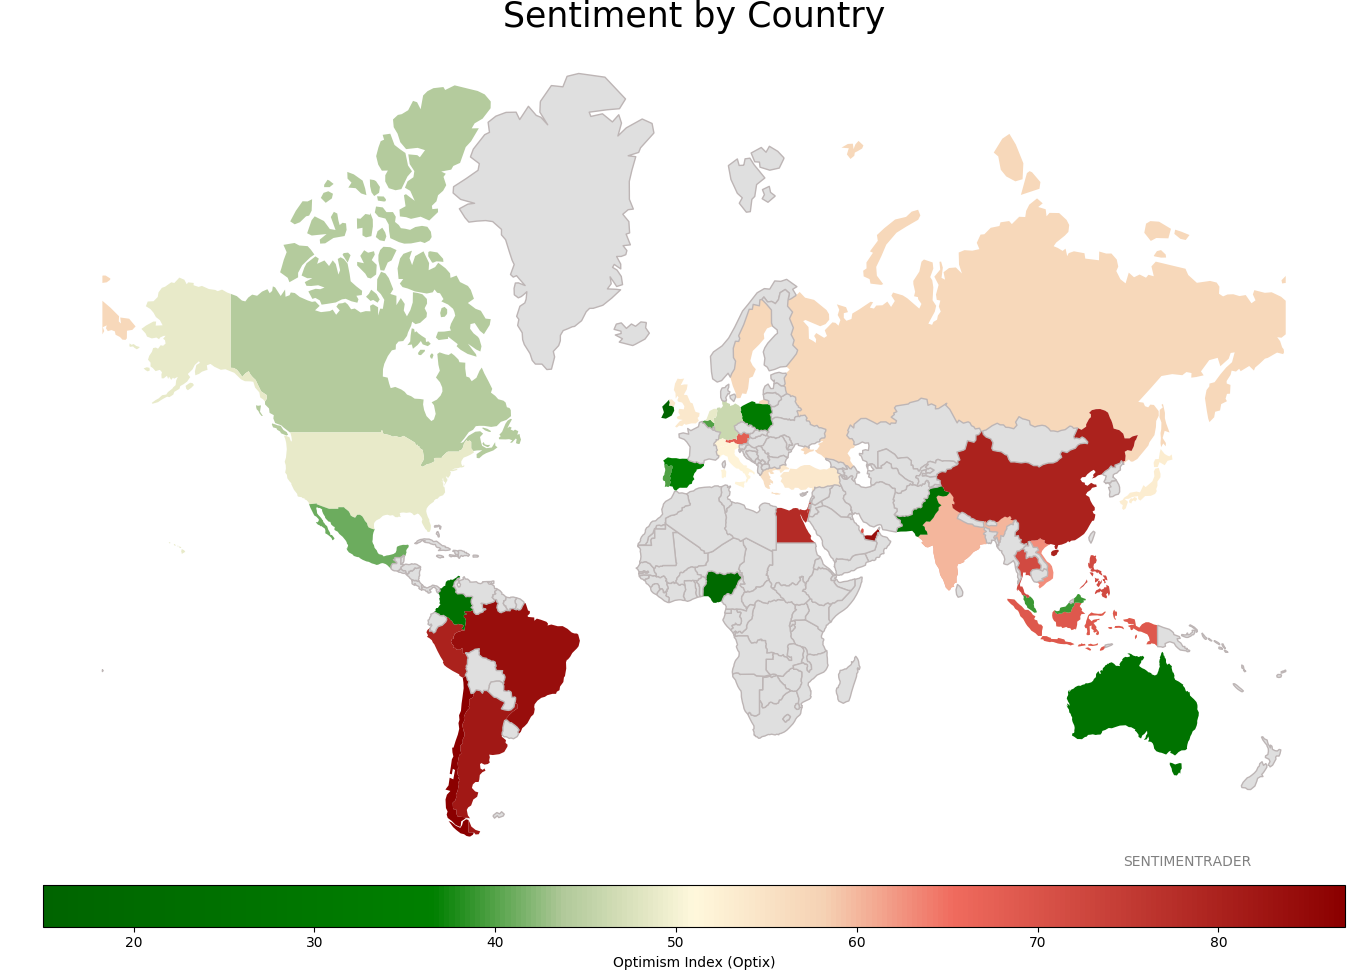
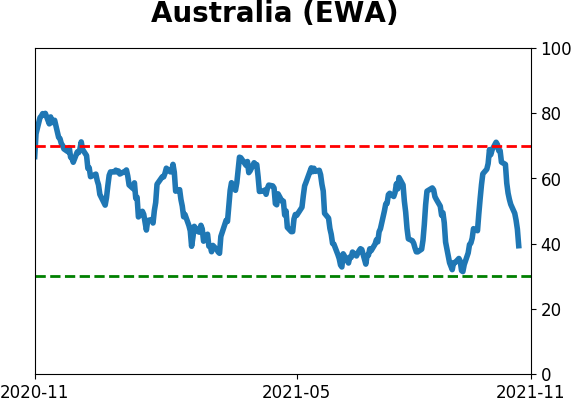
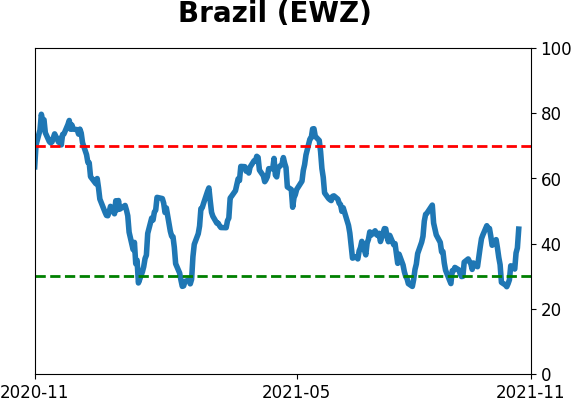
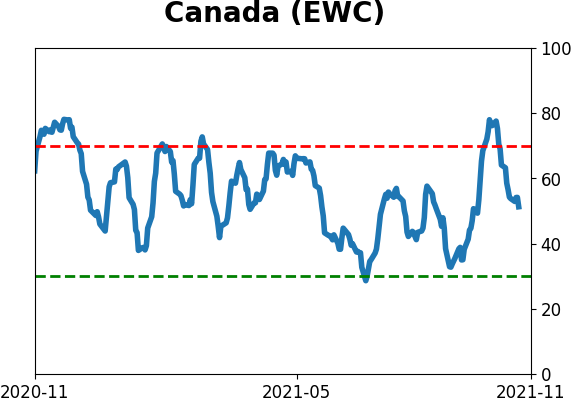
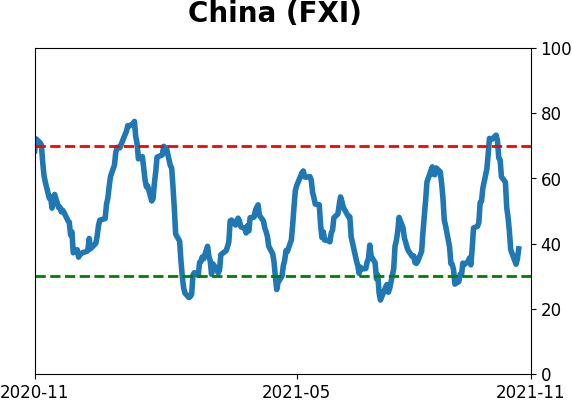
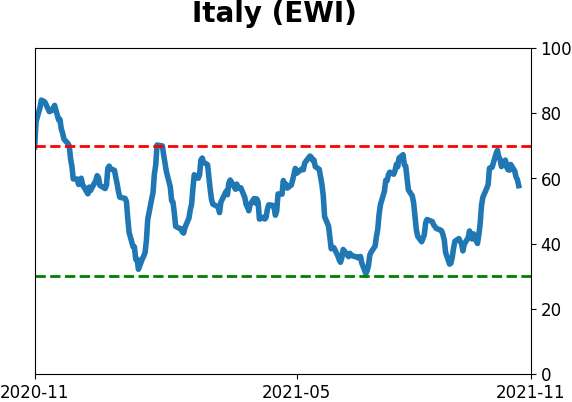
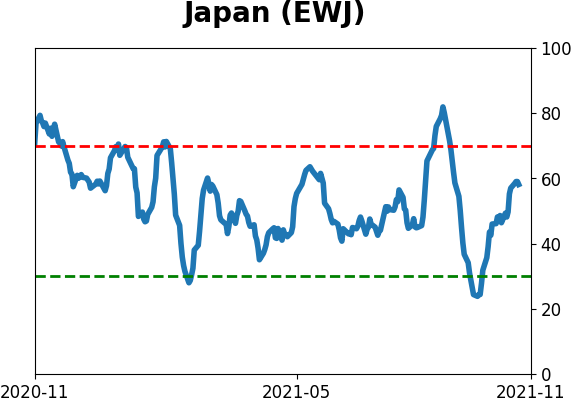
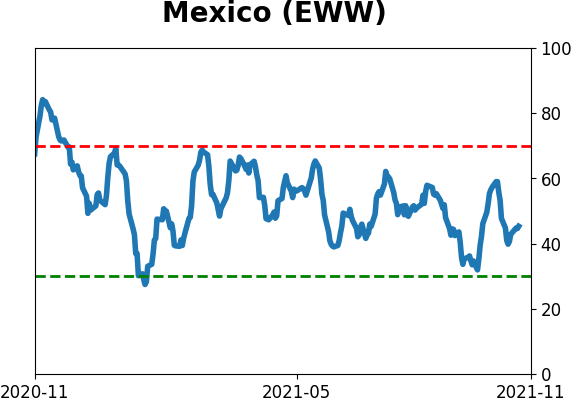
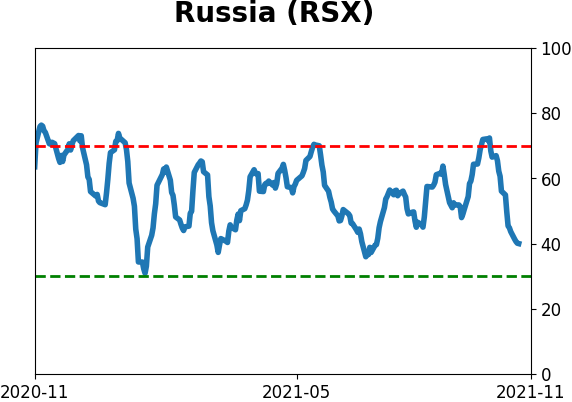
Sentiment Around The World
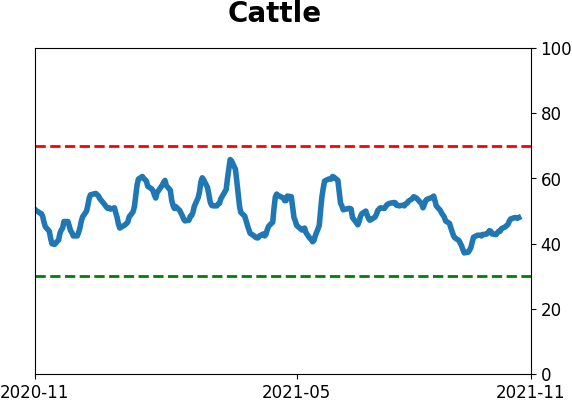
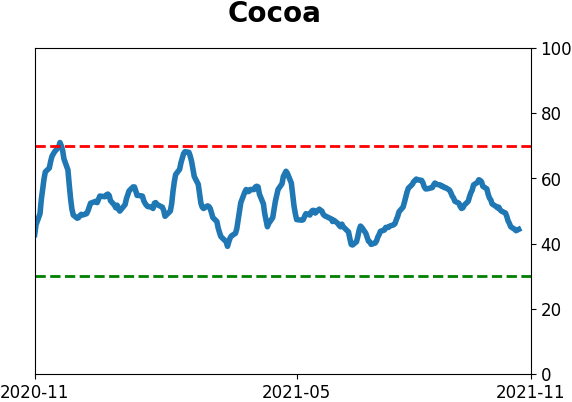
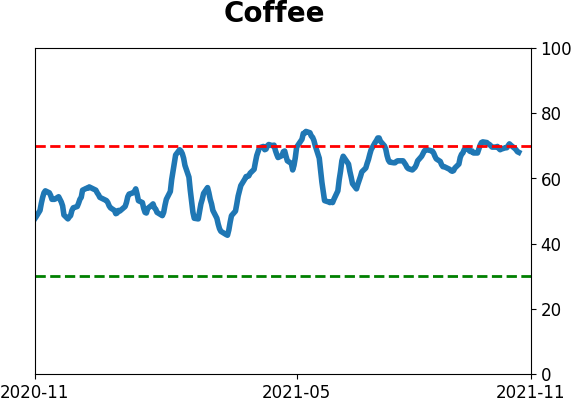
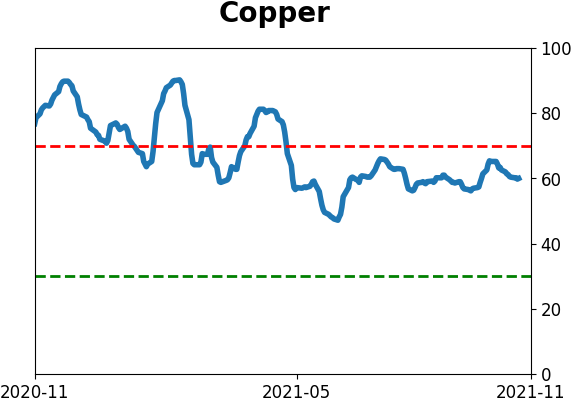
Optimism Index Thumbnails
|
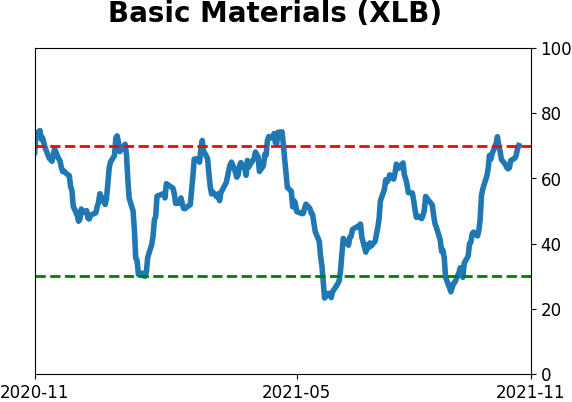
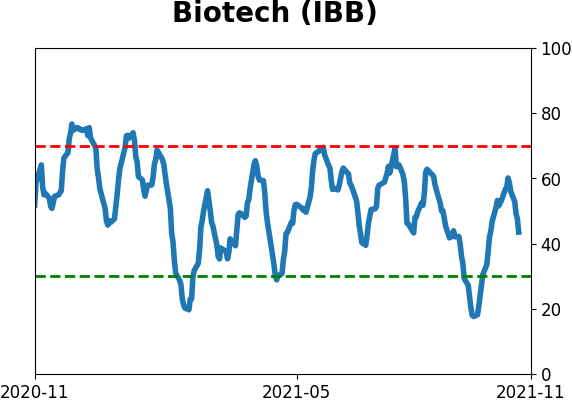
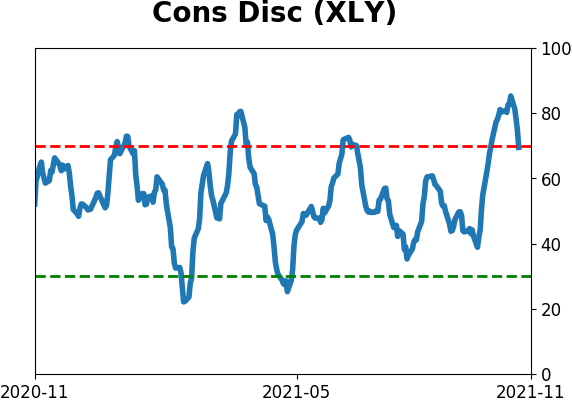
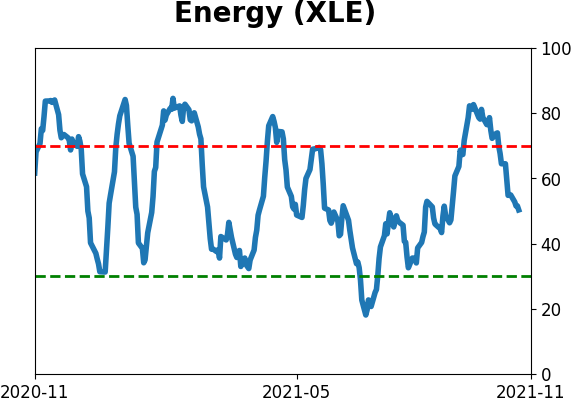
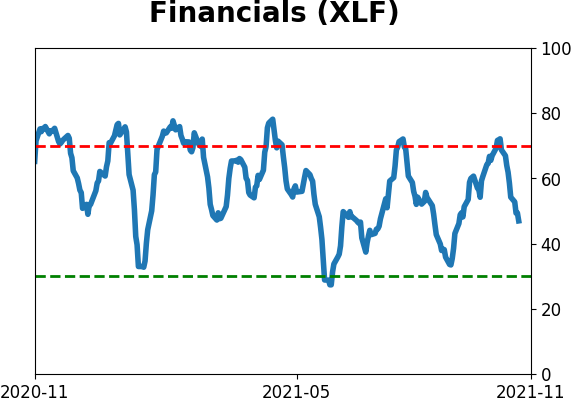
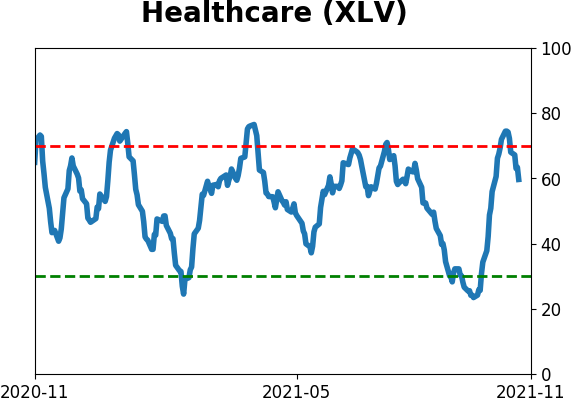
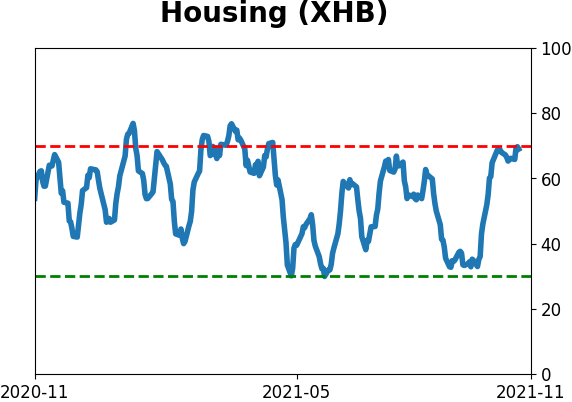
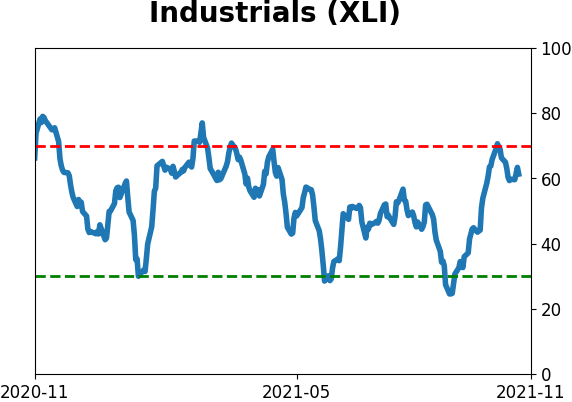
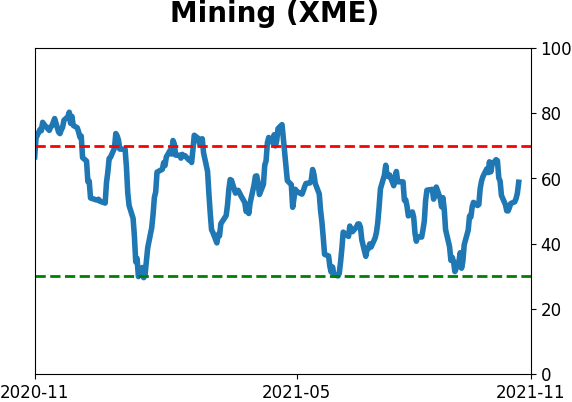
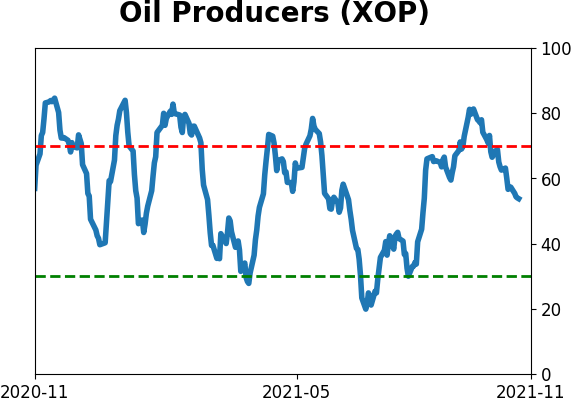
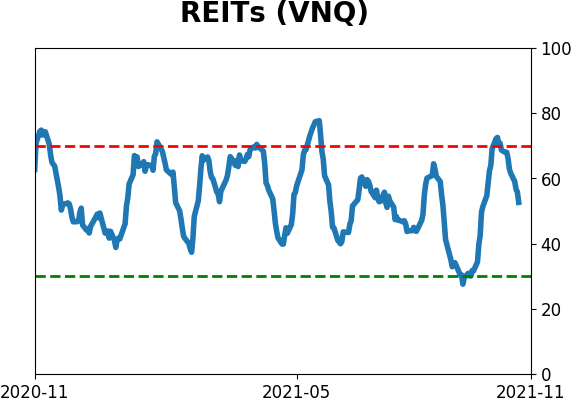
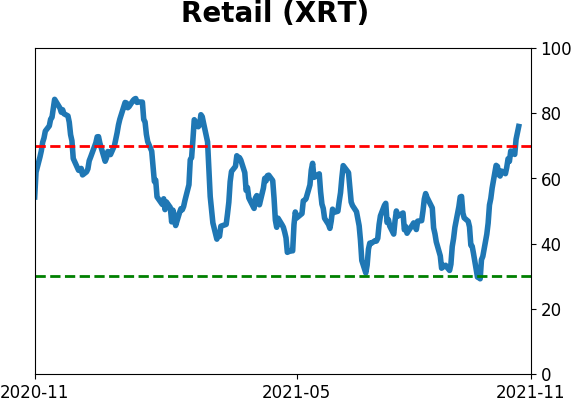
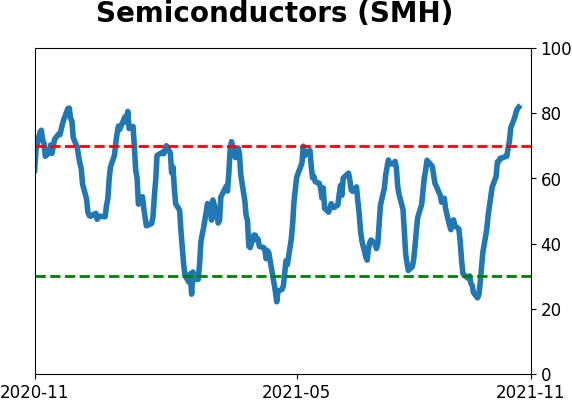
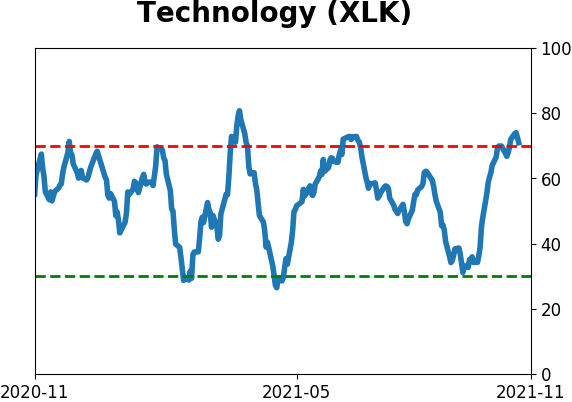
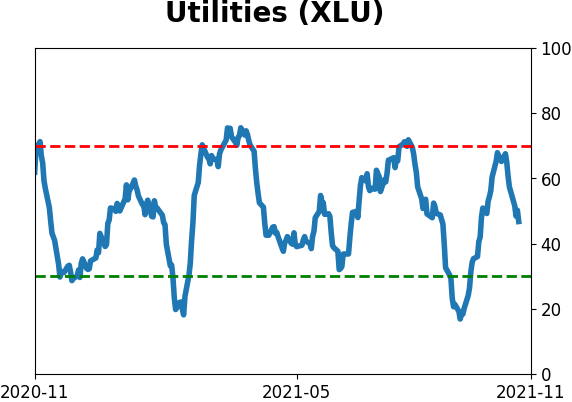
Sector ETF's - 10-Day Moving Average
|
|
|
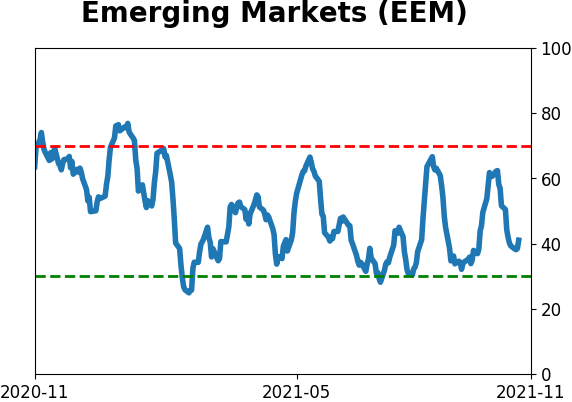
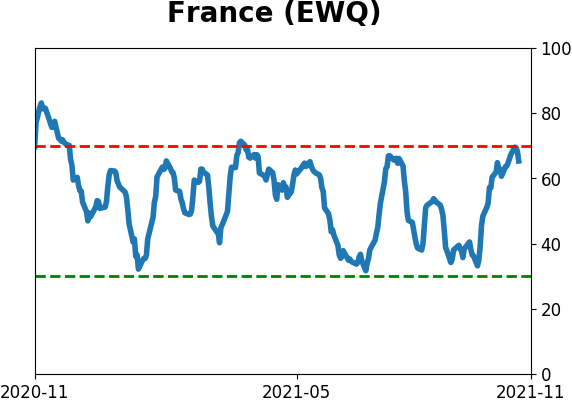
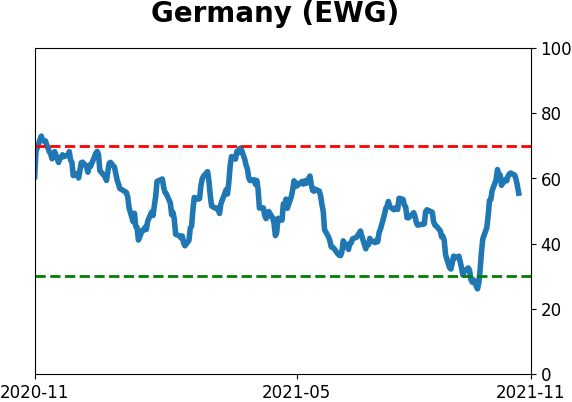
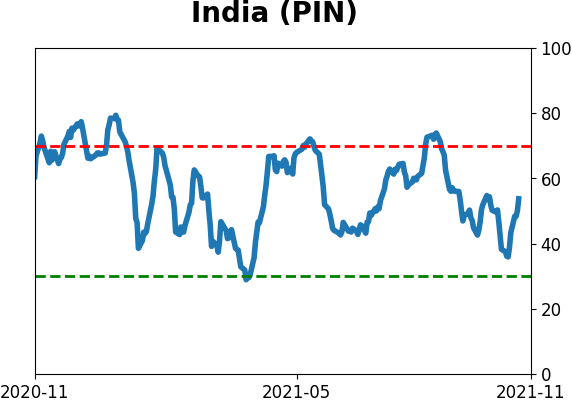
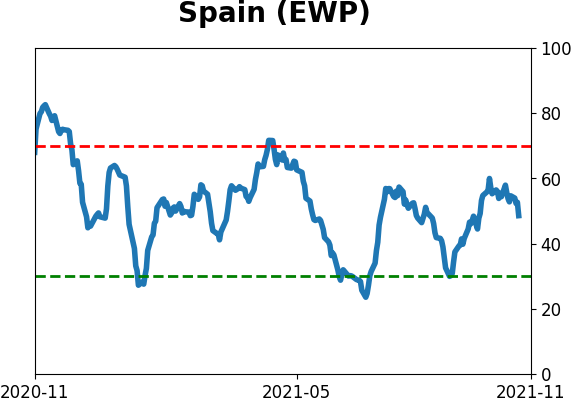
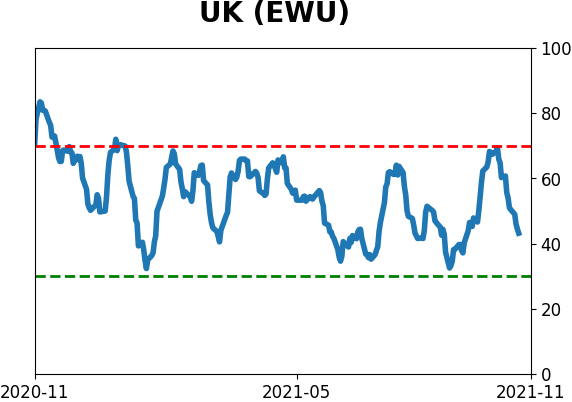
Country ETF's - 10-Day Moving Average
|
|
|
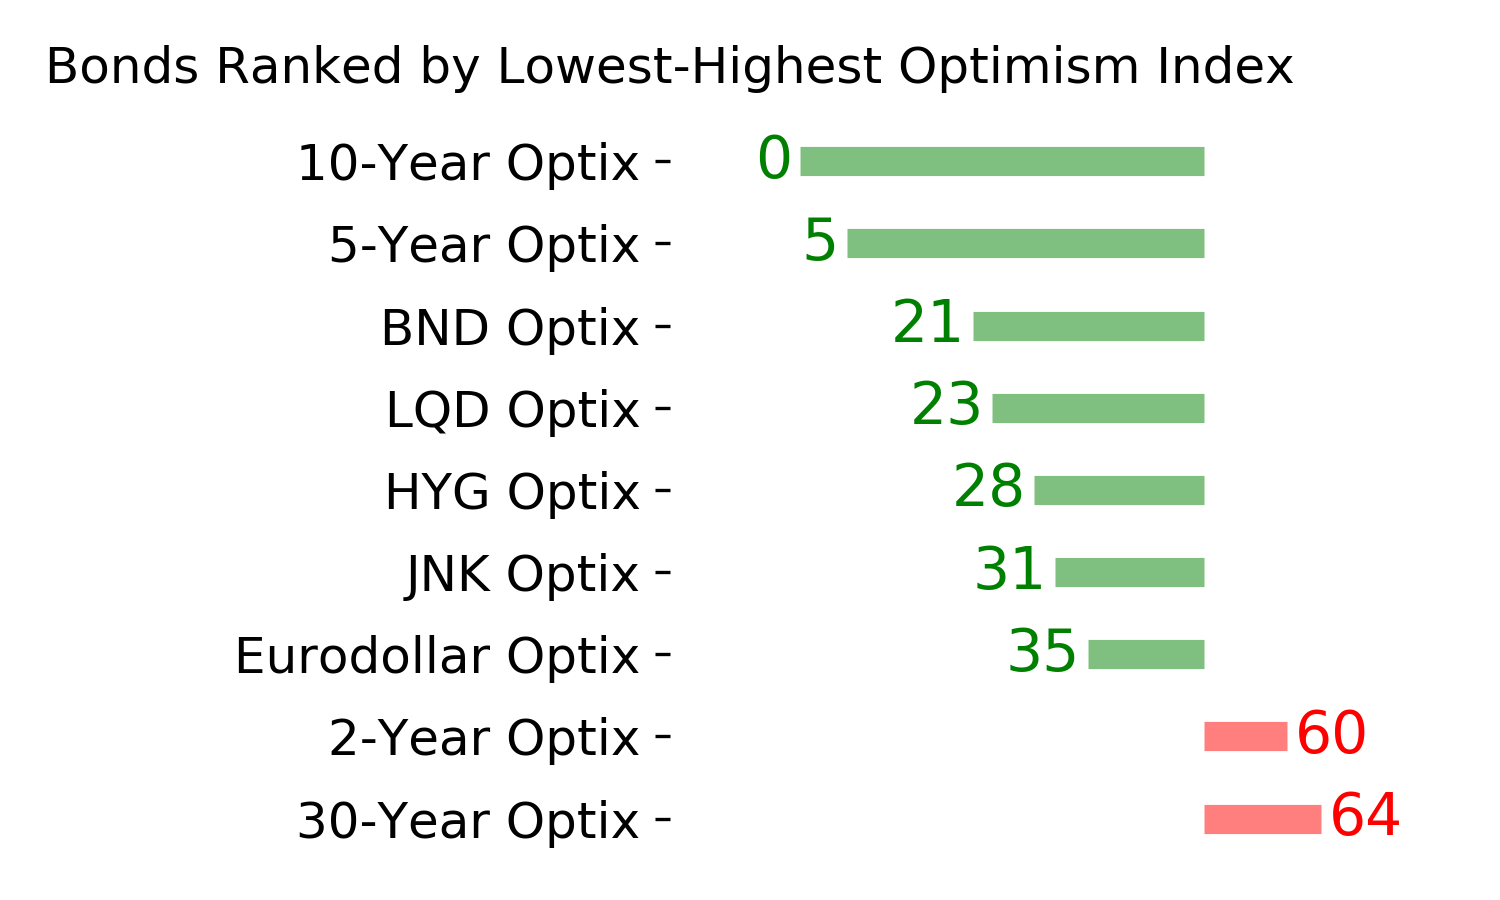
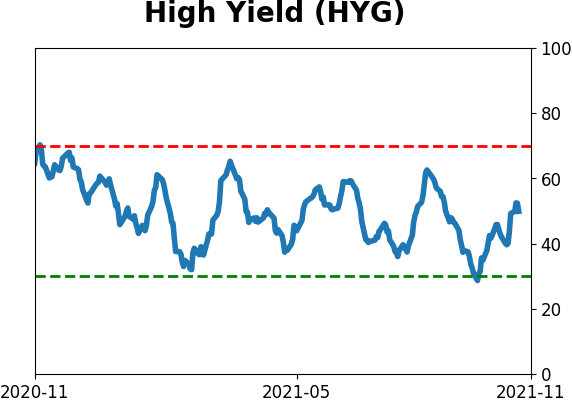
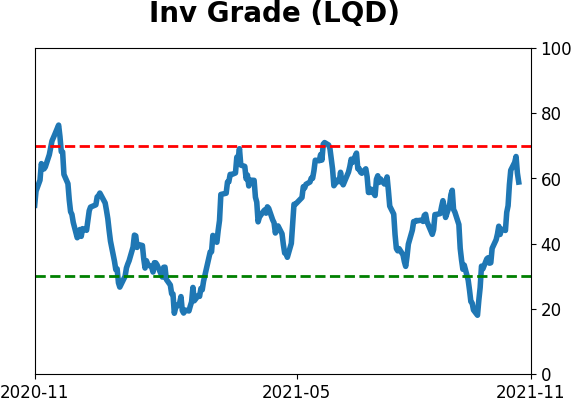
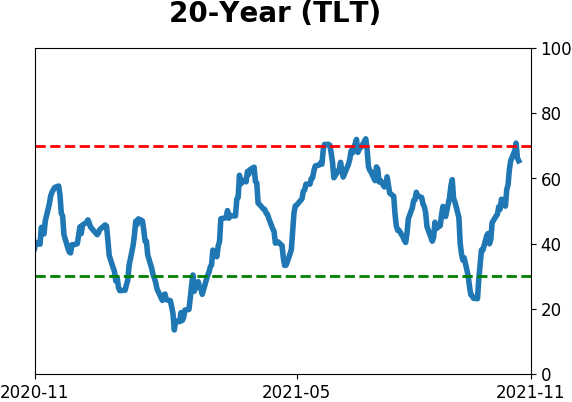
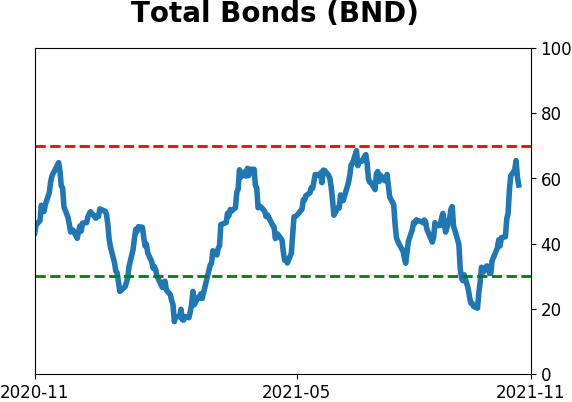
Bond ETF's - 10-Day Moving Average
|
|
|
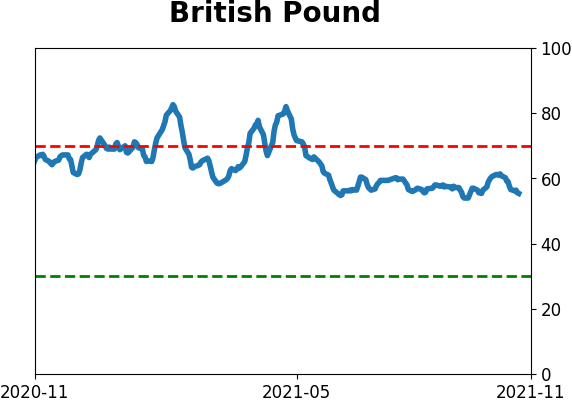
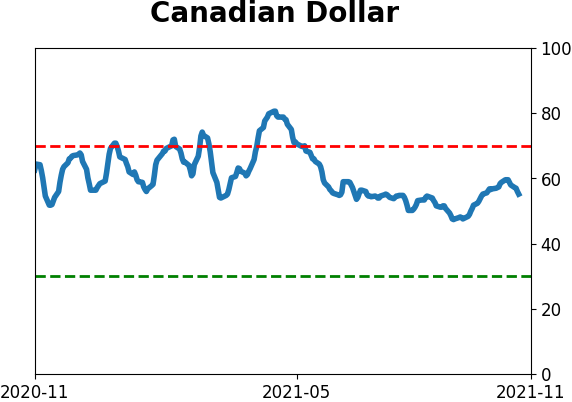
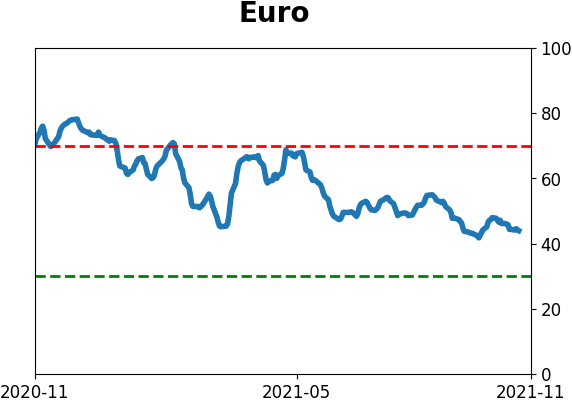
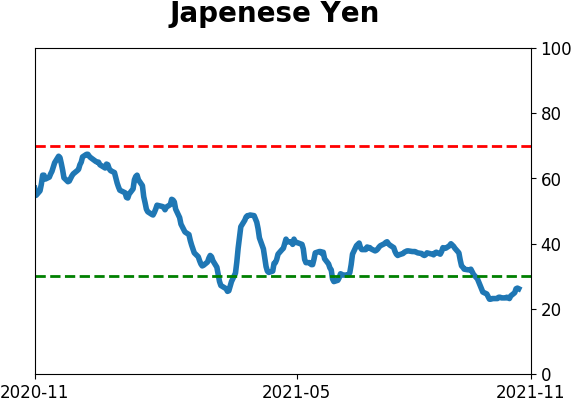
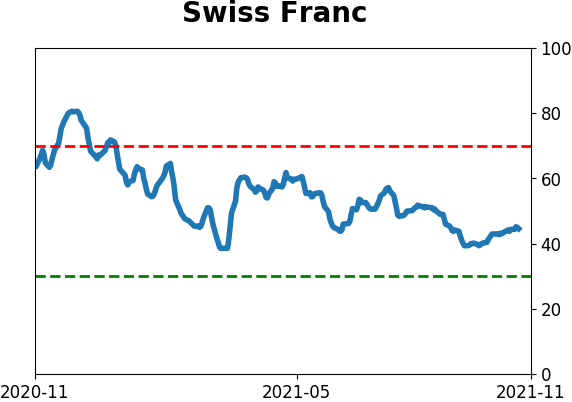
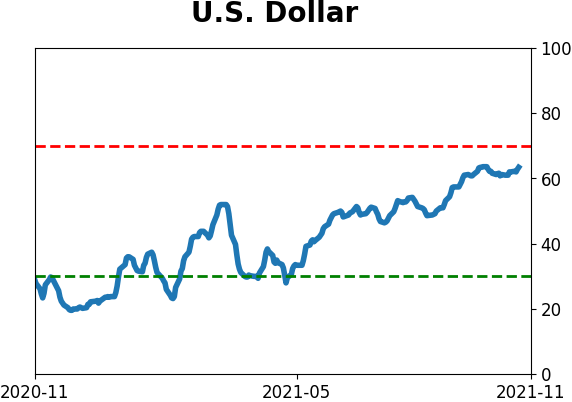
Currency ETF's - 5-Day Moving Average
|
|
|
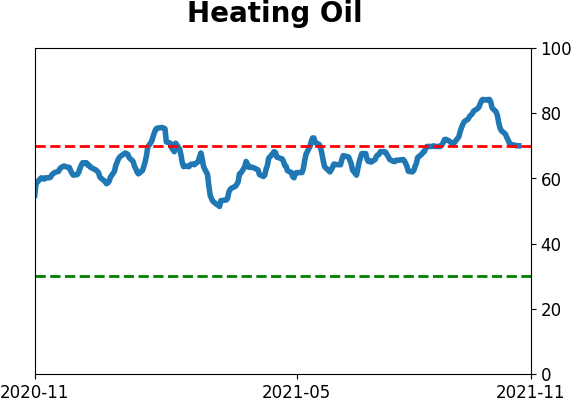
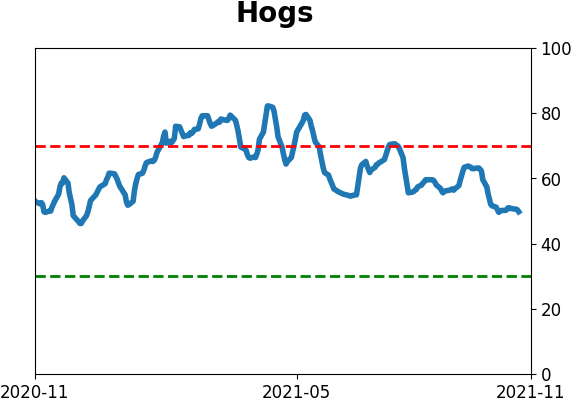
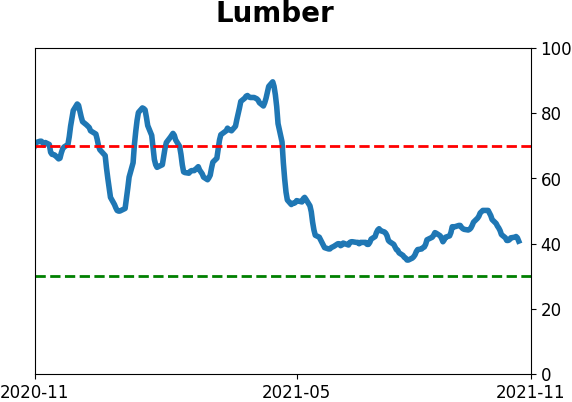
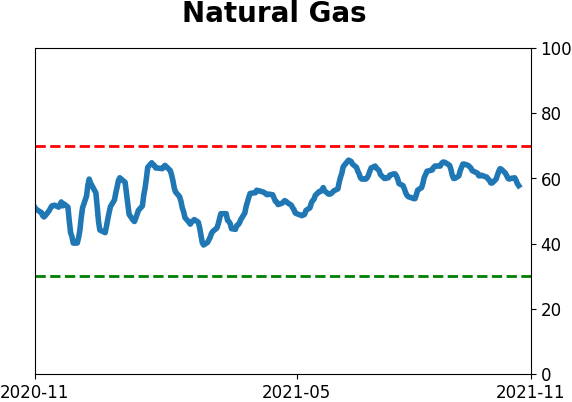
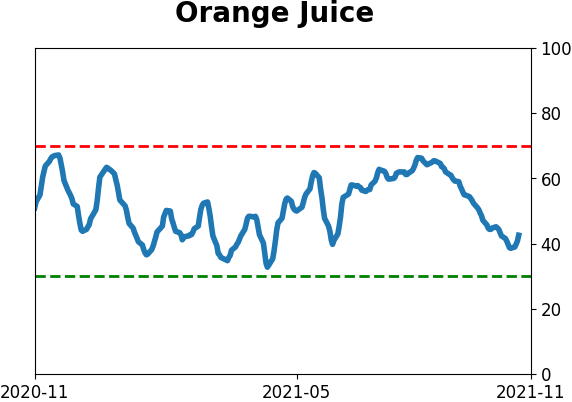
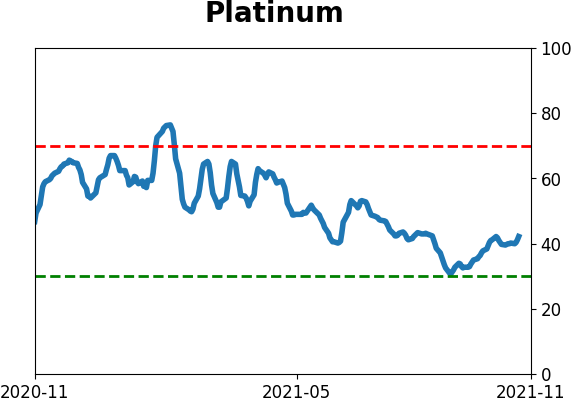
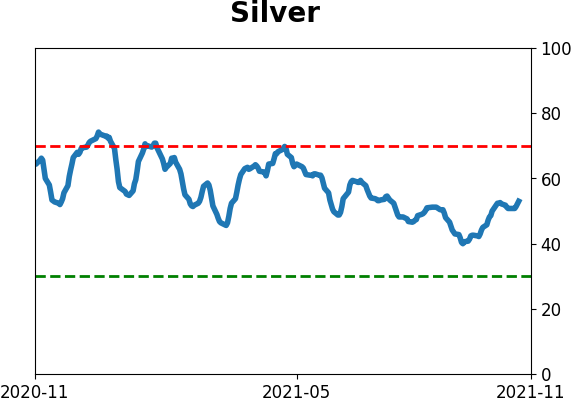
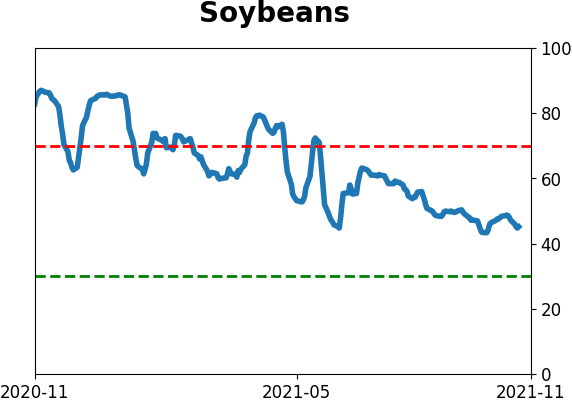
Commodity ETF's - 5-Day Moving Average
|
|