Daily Report : TradingEdge Weekly for Nov 10 - So many thrusts, melting volatility, cautious sentiment

| View/Print a PDF version of this Report |
Headlines
|
TradingEdge Weekly for Nov 10 - So many thrusts, melting volatility, cautious sentiment: This week, we saw that there has been a big surge in breadth thrusts across sectors, factors, and the broader market. Many indicators are showing rapid, and substantial, improvements as expected volatility continues to drip lower. Big money managers are getting a little more optimistic as trends among tech stocks rapidly improve. Bonds staged a sharp reversal. |
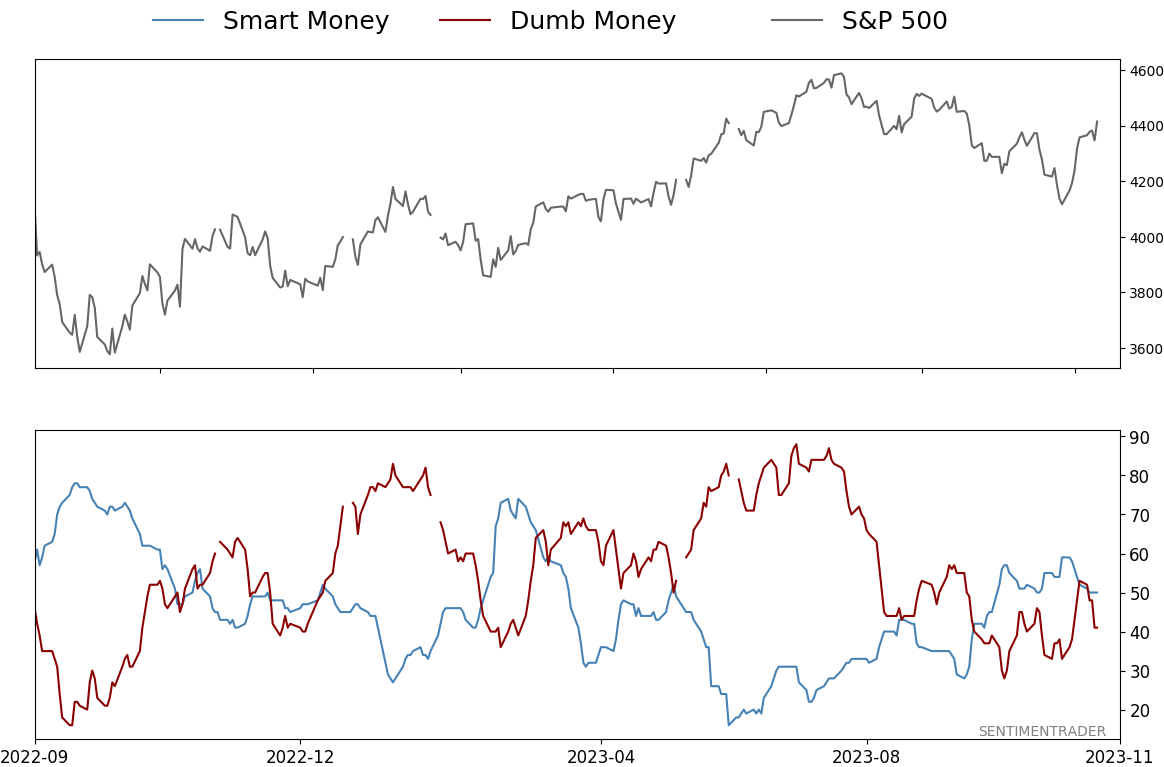
Smart / Dumb Money Confidence
|
|
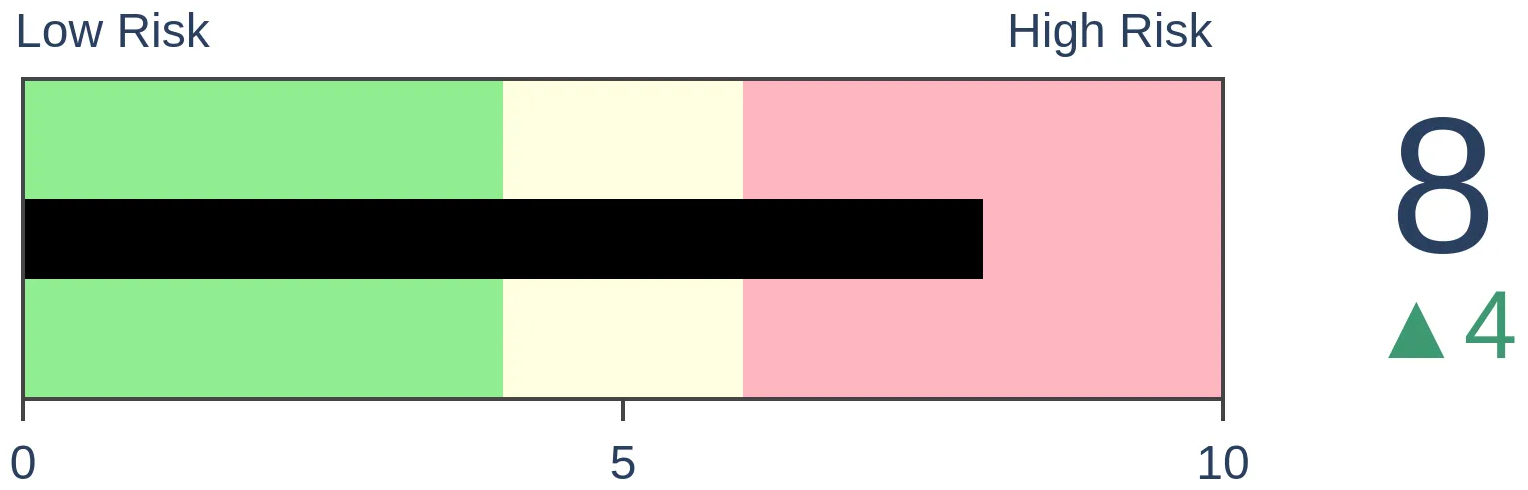
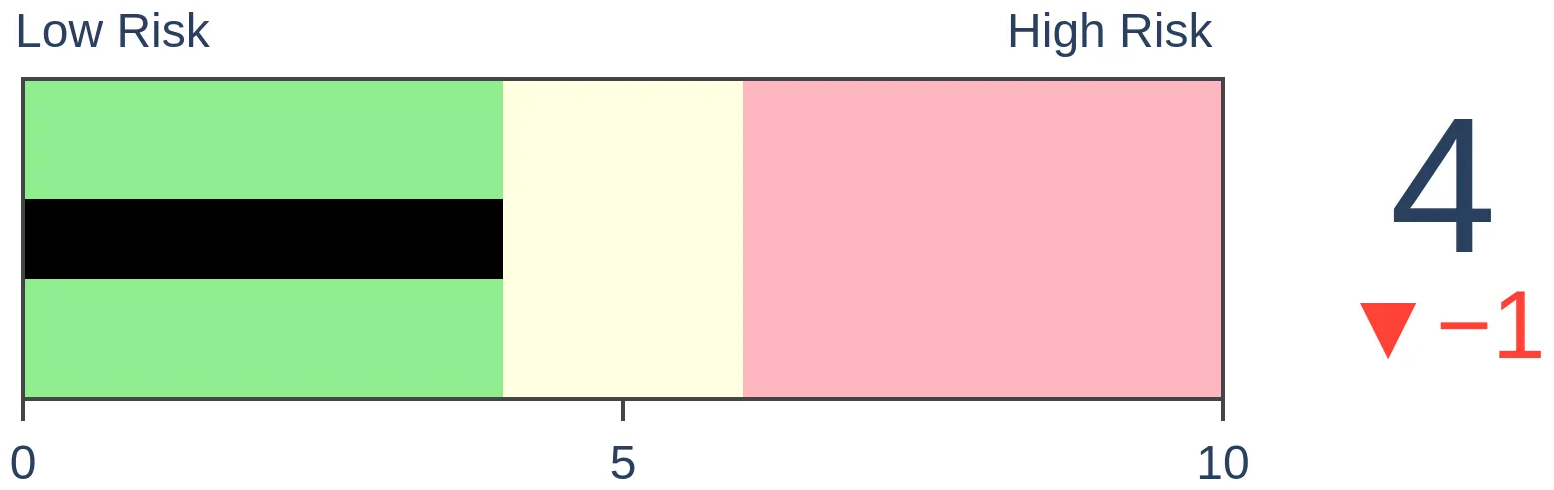
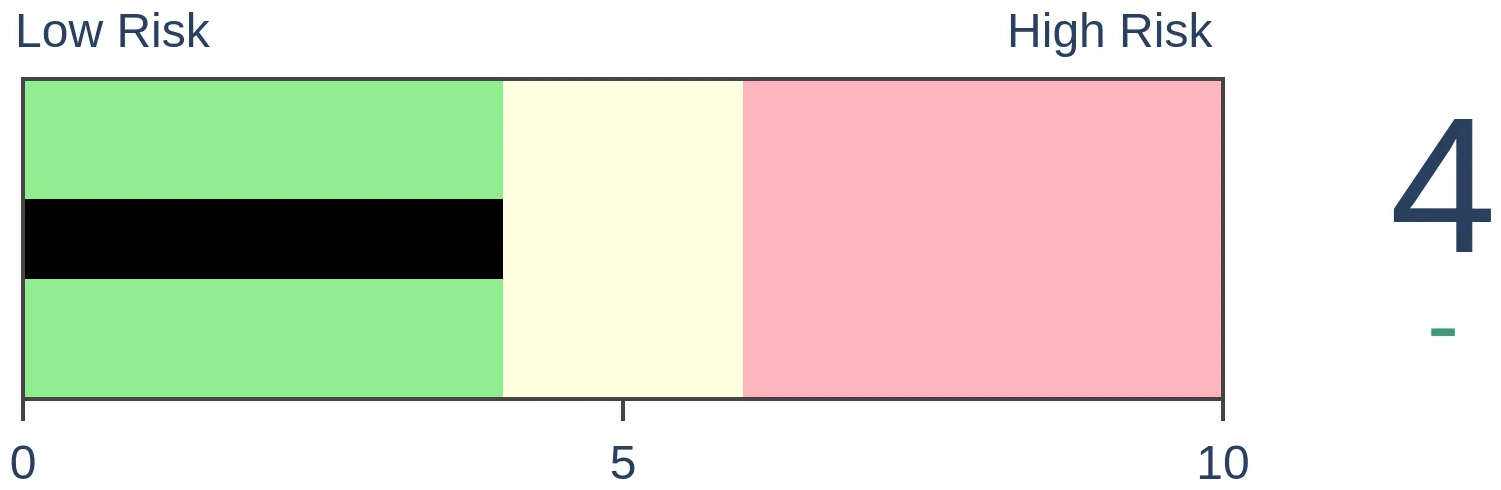
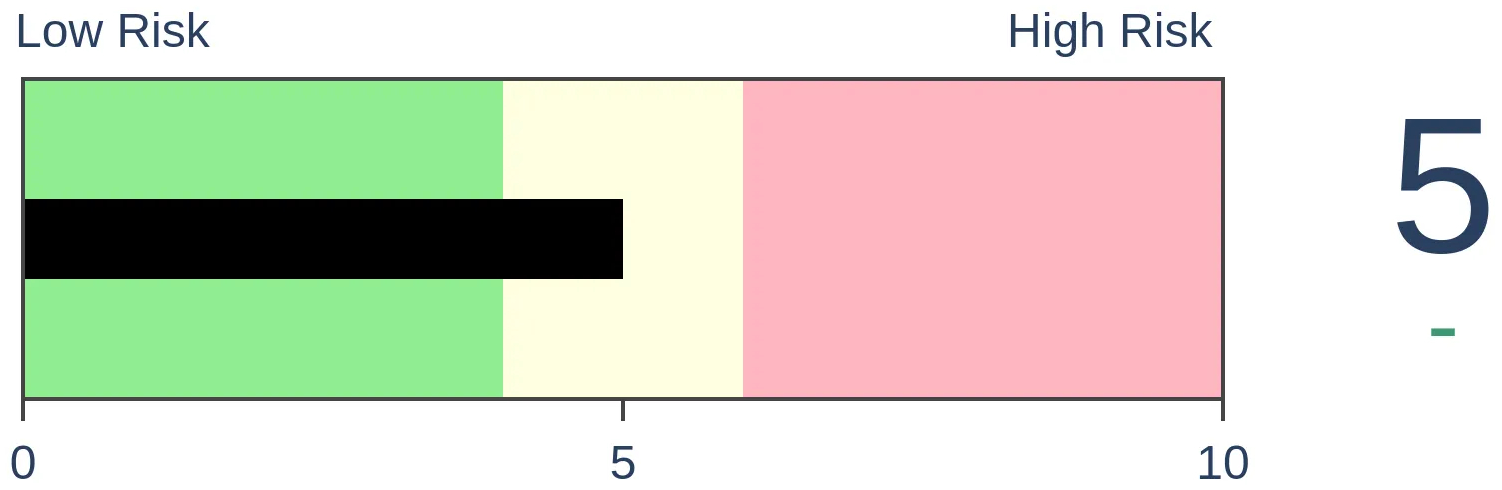
Risk Levels
|

|

|
Research
TradingEdge Weekly for Nov 10 - So many thrusts, melting volatility, cautious sentimentBy Jason GoepfertBOTTOM LINEThis week, we saw that there has been a big surge in breadth thrusts across sectors, factors, and the broader market. Many indicators are showing rapid, and substantial, improvements as expected volatility continues to drip lower. Big money managers are getting a little more optimistic as trends among tech stocks rapidly improve. Bonds staged a sharp reversal. FORECAST / TIMEFRAME |
Key points:
- The granddaddy of breadth thrusts has triggered
- Across sectors and Small Cap stocks, there has been a surge in breadth thrusts
- Volatility expectations are melting
- Other indicators are showing how swiftly breadth has turned
- The Big Money is getting a little more optimistic
- Other investors are showing some fear within a generally uptrending market
- Technology stock trends are quickly turning positive
- Using options to trade a resurgent tech sector
- An important juncture for Health Care
- Bonds experienced a sharp reversal
The granddaddy of breadth thrusts has triggered
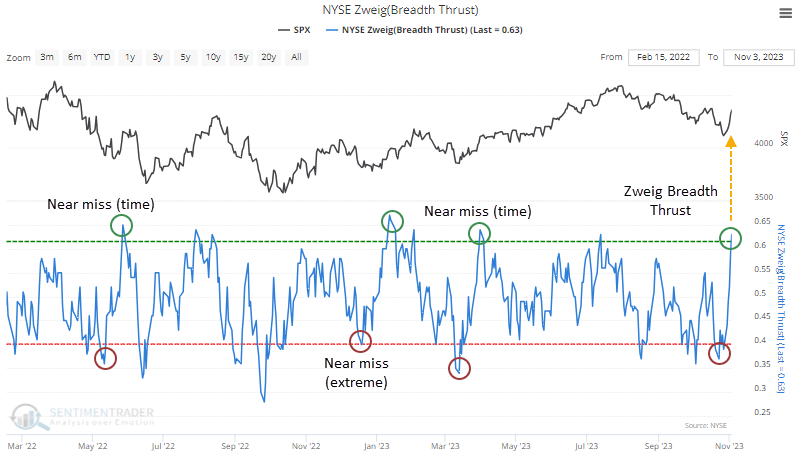
The gold standard of breadth thrusts has become the Zweigh Breadth Thrust from well-respected late analyst and money manager Martin Zweig. A 10-day exponential moving average of the NYSE Advance-Decline figure must cycle from below 40% to above 61.5% within ten sessions.
Across all stocks traded on the NYSE, the traditional Zweig Breadth Thrust just triggered after several very near misses since the 2021 peak.
This will vary depending on the data source, but according to our data, it has been triggered 19 other times since 1928. Those 1930s signals were painful for those hoping to hop onto a new uptrend, as they suffered an almost immediate rug-pull.
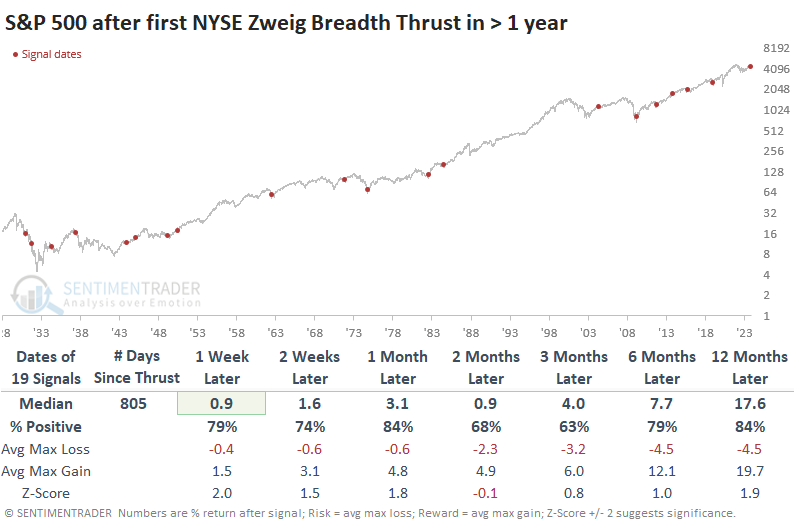
If we lengthen the time between signals and only look at the first Thrust in at least two years, even the 1930s signals preceded rallies over the next month.
It's arguable whether signals from 90 years ago apply to modern markets, but that's an individual determination. If we want to focus on more modern markets then the S&P 500 never suffered a loss 6-12 months after these Thrusts.
The ratio of maximum losses to maximum gains across time frames was even more impressive. None of them suffered more than a -10% loss at any point within the following year. Among sectors and factors, Technology stocks enjoyed some of the best returns, but it was pretty much just the best entrée among a beautiful buffet.
Thrusts were persistent and broad-based
Among stocks and sectors, the thrusts were fairly broad-based, thanks partly to participation among one of the year's laggards - small-cap stocks.
As we saw with the broader NYSE data, Small Caps narrowly missed the parameters for a ZBT throughout the 2022 bear market. It either reached the necessary extremes but didn't cycle fast enough or cycled fast enough but didn't quite exceed the upper or lower extremes.
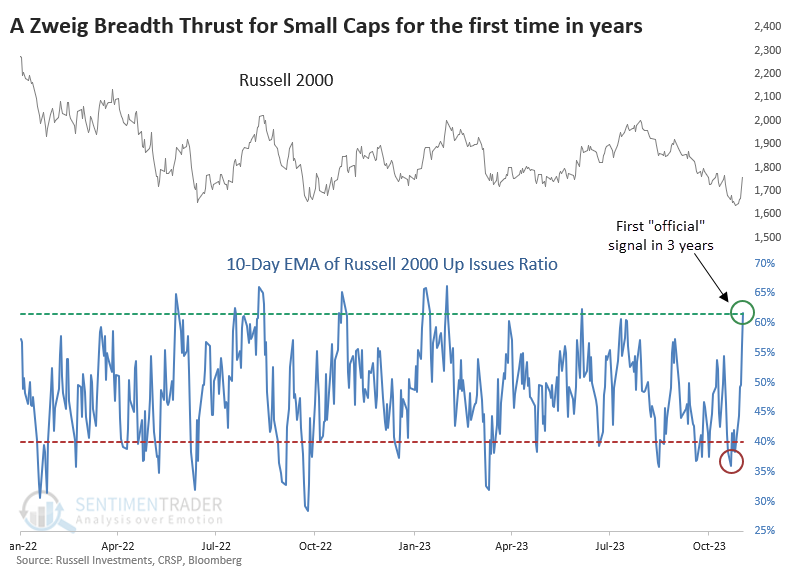
This was the 2nd-longest stretch between thrusts in the index's history, next to the long dry spell after the 2008 financial crisis. Over the next year, the Russell 2000 showed a positive return each time, averaging more than +20%, and enjoyed more than a 4-to-1 reward-to-risk ratio
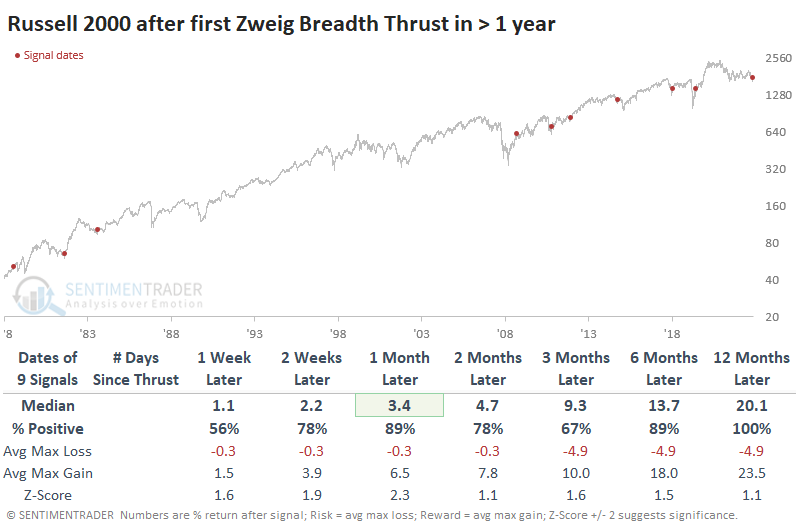
When Small Caps do well, the S&P 500 often does even better, and that was the case here. It was unusual to see a loss in any time frame after any signal, and none were meaningful.
Thanks to more volatile trading behavior and generally higher correlations among stocks, breadth figures among sectors have become whippier than in prior decades. We can see that below, which looks at the total number of ZBT signals across the ten major S&P 500 sectors over a rolling 50-day period.
The Discretionary and Technology sectors triggered Zweig Breadth Thrust signals last week. We've now seen 14 total Thrusts across sectors, one of the highest readings in 70 years.
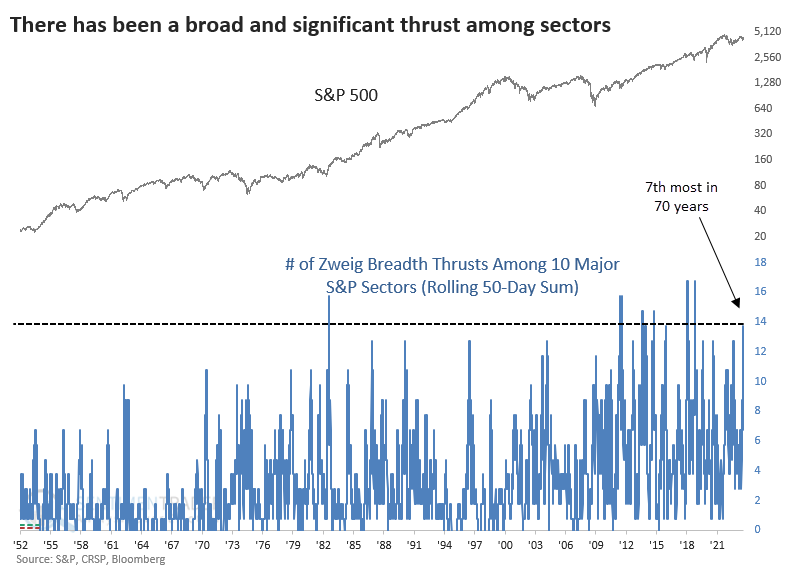
When the count of ZBT sector signals cycled from 7 or fewer to 14 or more, it was again an excellent sign for the broader S&P 500. The index showed a gain across most time frames and signals, with no significant losses.
Volatility expectations are melting
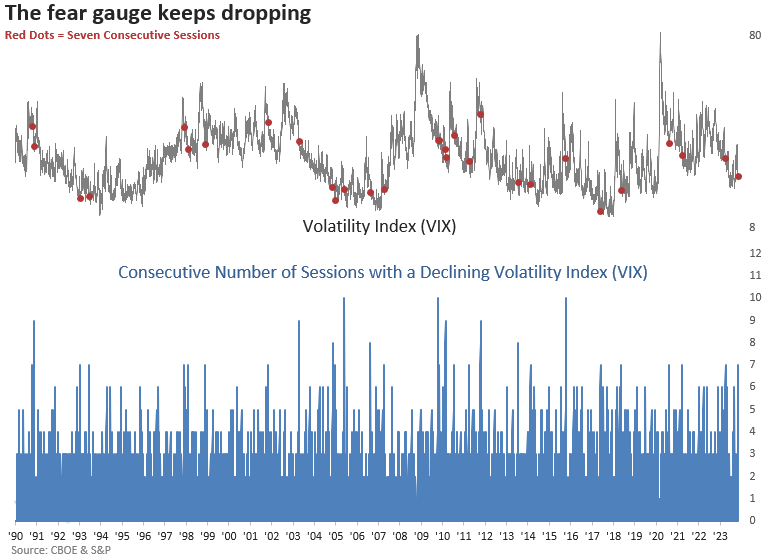
Dean showed that the multiple thrusts helped push the Volatility Index (VIX) lower for seven successive sessions. After similar drops, the S&P 500 was higher 93% of the time over the subsequent two months, coinciding nicely with seasonal trends.
For only the 30th time since 1990, the Volatility Index (VIX) declined for seven straight sessions. The previous instance occurred in April 2023, leading to an almost 8% gain for the S&P 500 over the subsequent three months.
When the Volatility Index (VIX) dropped for seven straight sessions, the S&P 500 displayed outstanding returns, win rates, and z-scores across all time frames. Over the following two months, the large-cap index was higher at some point in every case, albeit one precedent was a marginal gain. Even more astonishing than the optimistic outlook for the S&P 500 is its track record of consistently steering clear of a maximum loss of more than -5% after experiencing similar drops in expected volatility.
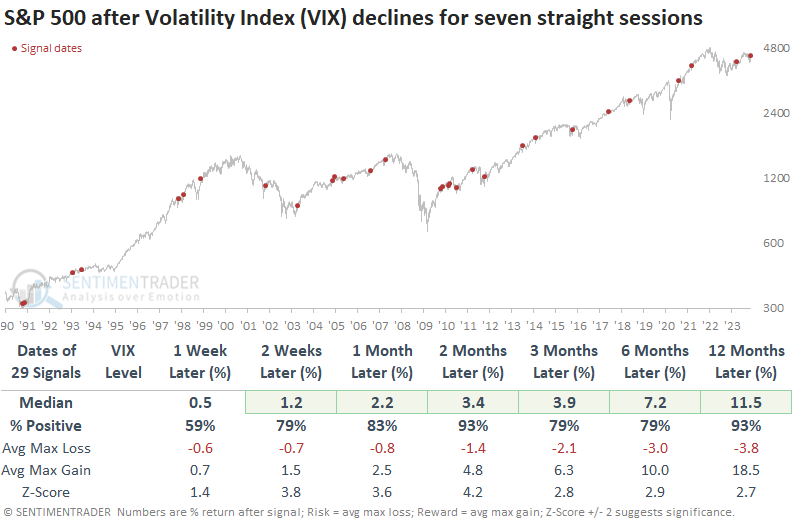
After seven consecutive sessions of the Volatility Index dropping, expected volatility tended to recede, with 5 out of 7 horizons showing losses and unfavorable win rates. Seasonality for the Volatility Index (VIX) suggests the path of least resistance is lower through year-end if history rhymes.
Even more indicators showing thrust-y behavior
Jay showed that the NYSE McClellan Oscillator just crossed a significant threshold and the percentage of S&P 500 stocks in medium-term uptrends bounced off of an oversold level while the index was in an uptrend.
Jay put together a 50-minute video discussing this and many other important indicators, which you can view for free here.
The McClellan Oscillator is essentially a look at the momentum of the underlying breadth of the market. When it is above zero, momentum is positive; below zero, it is negative. The oscillator just pierced a rare level last week as it crossed above 91%.
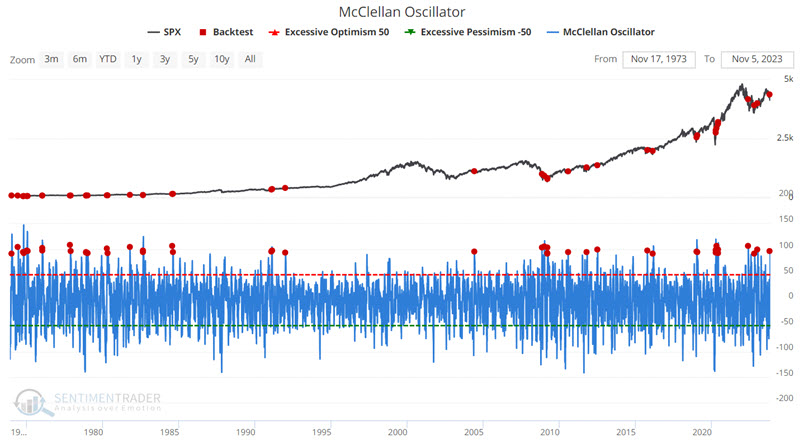
While many interpret this action as indicating an overbought market, the results suggest that this type of strength is more often an indication of a powerful thrust higher based on an expansion in the number of stocks participating in the accompanying rally. The table below displays S&P 500 performance following all crosses above 91% since 1962.
The 1973-09-26 signal saw the S&P 500 plummet -38% in the next twelve months. That said, the last 32 signals, starting in 1978, have seen the S&P 500 higher twelve months later, with a median gain of +20%.
In addition, a 5-day average of the percentage of S&P 500 Index constituent stocks trading above their 50-day moving average crossed above 30% while the index was above its 50-day moving average. This configuration highlights the market coming off an oversold level while in an uptrend.
The 2000-03-16 signal serves as a reminder that no one indicator or signal should be relied upon 100% as a standalone trading model. Nevertheless, as a weight of the evidence piece of the puzzle, this serves as another item falling firmly on the favorable side of the ledger.
Yet more thrust-y indications
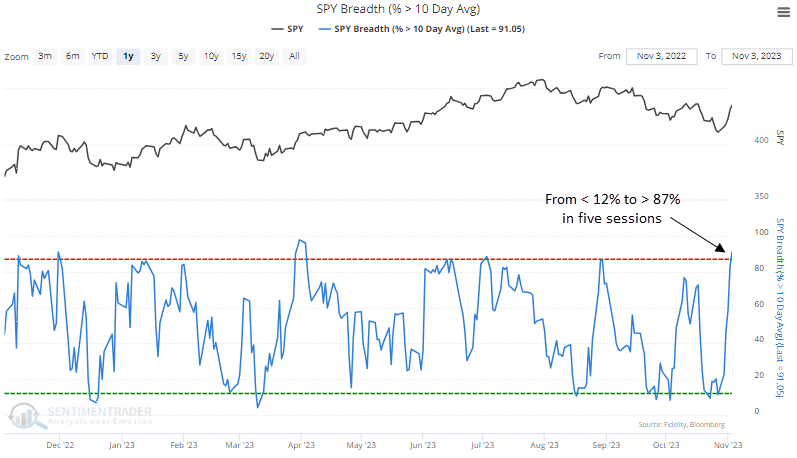
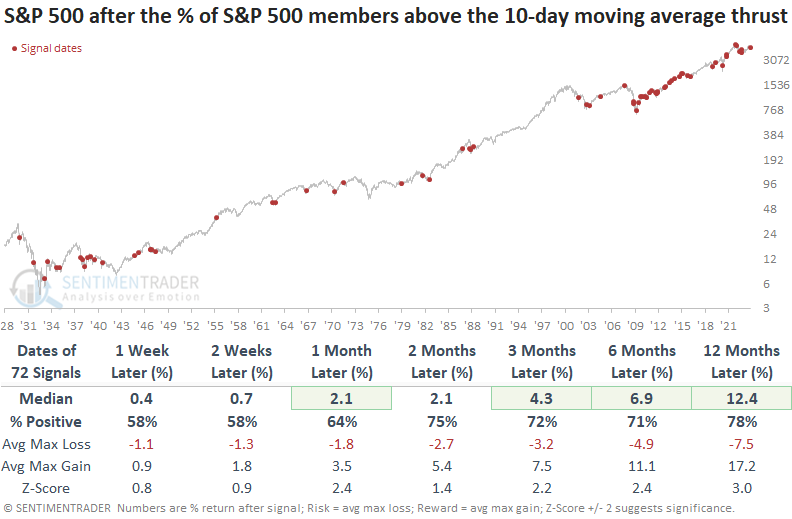
The prevalence of short-duration thrust signals is increasing, as Dean noted that S&P 500 members trading above their 10-day average cycled from less than 12% to greater than 87%, Russell 2000 stocks above their 10-day average also reversed, and the S&P 500 increased for five straight sessions from a five-month low.
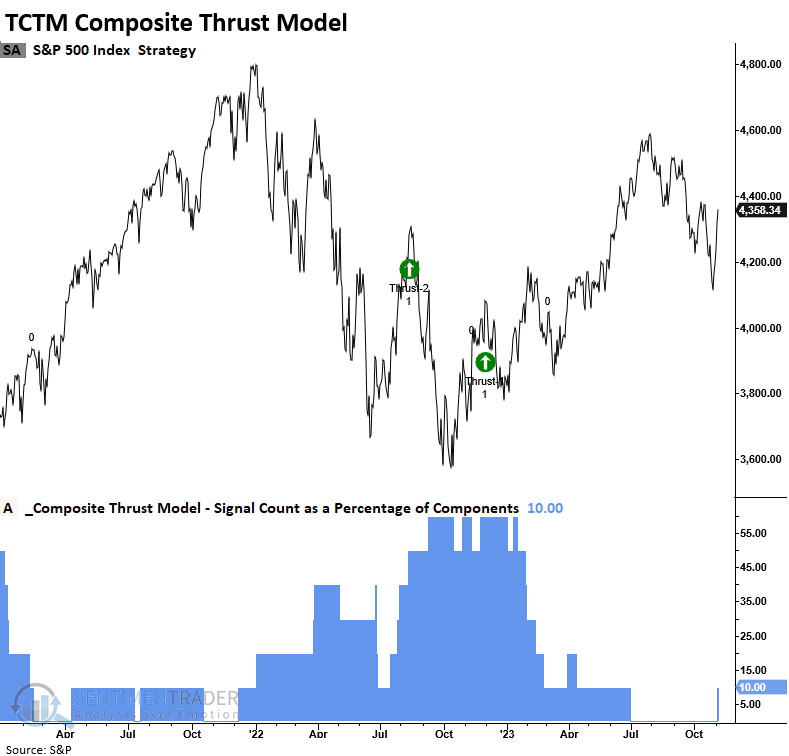
One of the thrust signals, a voting member in the TCTM Composite Thrust Model, issued an alert at the close of trading last Friday. The system identifies when the percentage of S&P 500 members above their 10-day moving average cycled from less than 12% to greater than 87% in nine or fewer sessions.
Whenever this triggers, there's a solid tendency that the bullish price momentum in the world's most benchmarked index will continue, though past bear market precedents have demonstrated their share of difficulties.
The TCTM Composite Thrust Model utilizes a blend of short and medium-term breadth-based indicators to pinpoint crucial turning points in the S&P 500. Following the latest alert, the composite count has risen to 10%. Model signals trigger once the count reaches 50%. Keep an eye out for updates.
Small-cap stocks, which have struggled in a prolonged downtrend, recently saw their first oversold to overbought thrust signal since the October 2022 low. Although small-cap stocks don't necessarily need to outperform in a cyclical uptrend, it's always more advantageous to see widespread participation across various market capitalizations rather than a lack of it.
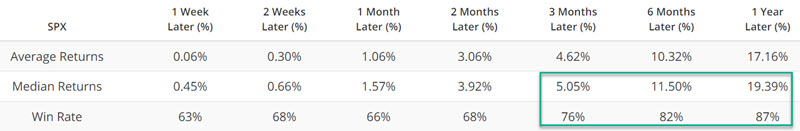
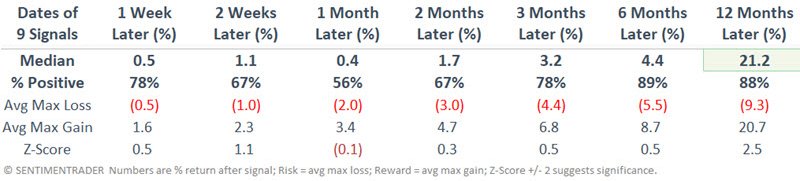
Also, after reaching a five-month low on October 27th, the S&P 500 experienced a resurgence, climbing for five consecutive sessions last week. When it increases for five straight sessions from a five-month low, the large-cap index tends to pause over the following few weeks. A month later, the S&P 500 was higher 76% of the time, with a median gain of 3.2%.
The Big Money is getting a little more optimistic
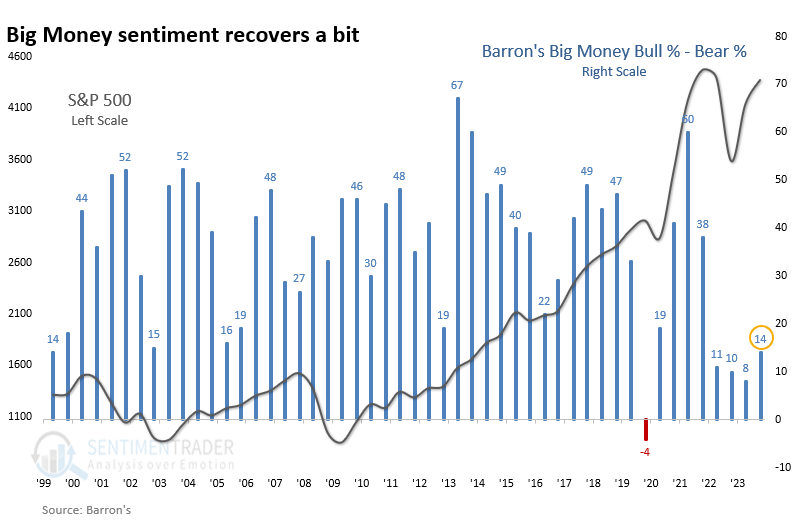
We like to update the semi-annual poll of large money managers conducted by Barron's. It gives an interesting glimpse into the thought processes of some of the largest wealth managers in the country.
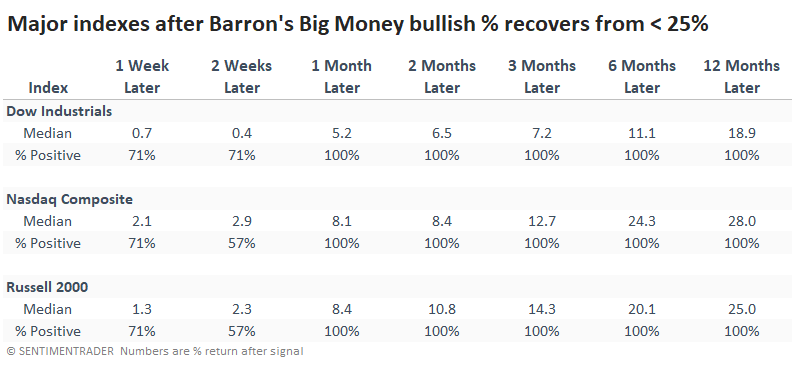
The publication notes that the Big Money got a little more optimistic than it was in the spring. We have historically used a bullish percentage for this survey, which adds the sentiment among those who are bullish or very bullish and subtracts those who are bearish or very bearish. This figure has ticked up to 14% from only 8% during the last survey in April, which was the 2nd-lowest optimism in 24 years.
When sentiment among these large money managers recovers from a very low level, it has been a good sign for stocks. Whenever their bullish percentage increases from the prior survey, and that prior survey was below 25%, the S&P 500 never showed a negative return up to a year later.
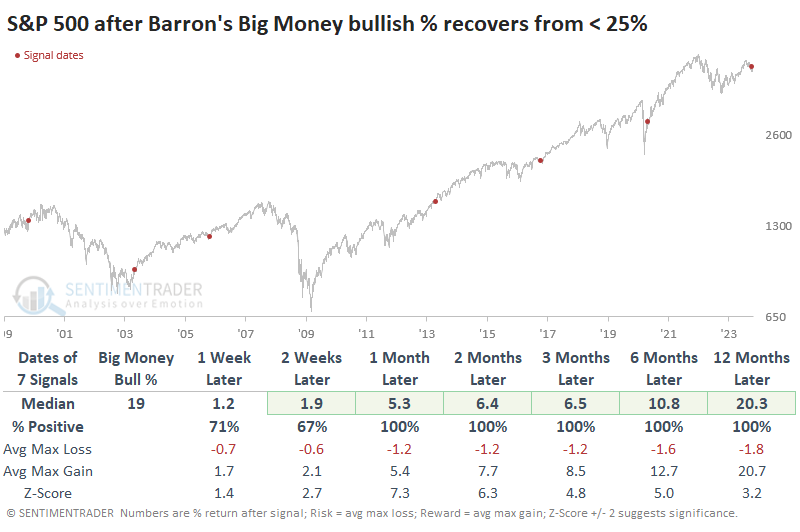
The table of maximum gains and losses across time frames shows just how limited the risk tended to be.Because of the consistent tendency to rise, it's not a shocker that the higher-beta indexes tended to show higher returns.
Less defensive sectors and factors also showed higher returns, in general.
Fear in an uptrend
Jay highlighted a couple of indicators that are showing investor fear within a generally uptrending market.
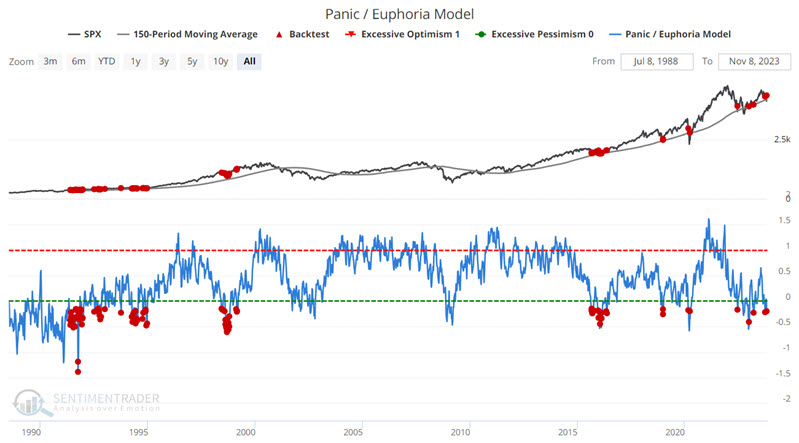
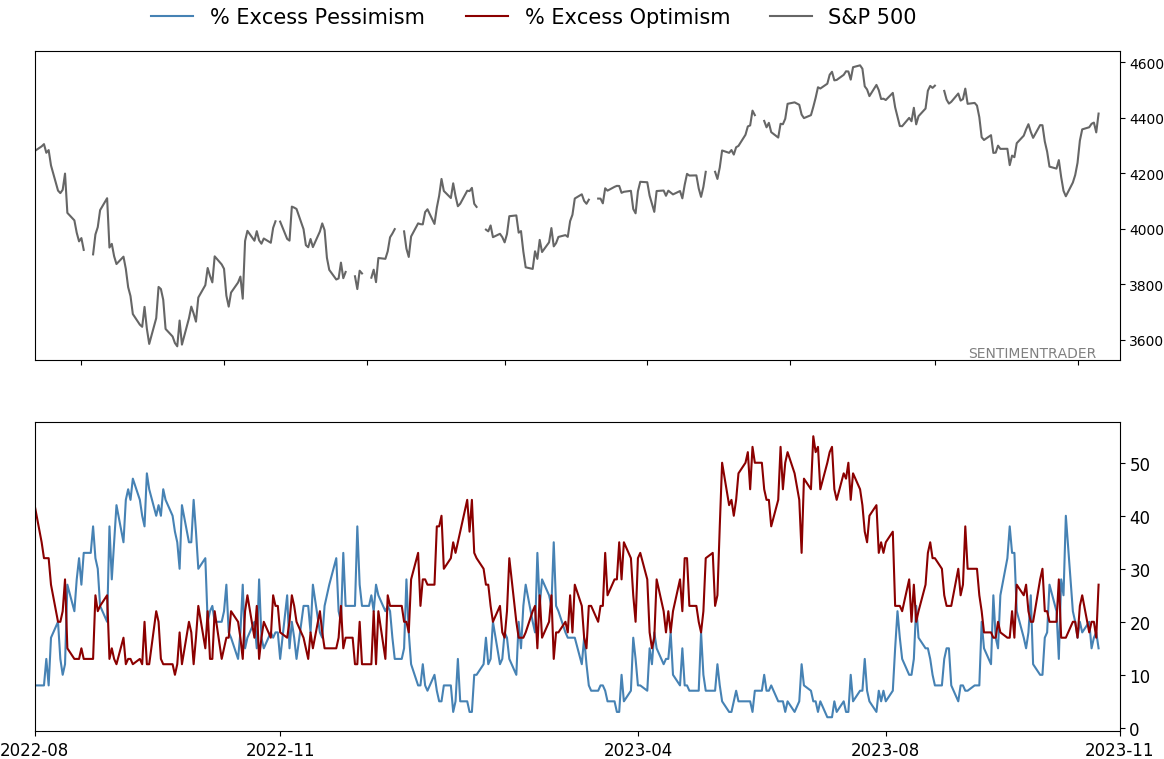
Our Panic/Euphoria Model is based on the Citi Panic / Euphoria model published in Barron's magazine. It does not reflect those published values; instead, it is our interpretation of the model inputs and construction and differs modestly from the published figures.
It is composed of the following primary inputs:
- NYSE short interest
- Margin debt
- Nasdaq vs NYSE volume
- Investor's Intelligence survey
- AAII survey
- Retail money market funds
- Put/call ratios
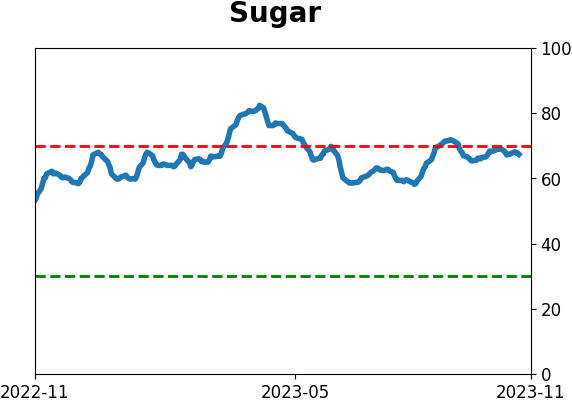
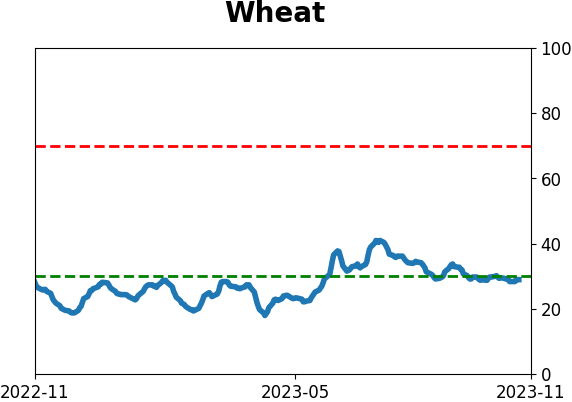
- Commodities prices
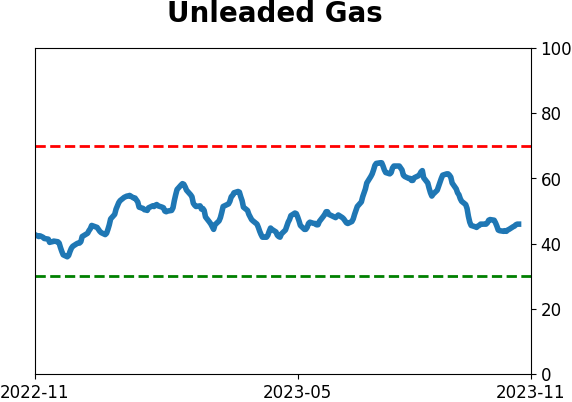
- Retail gasoline prices
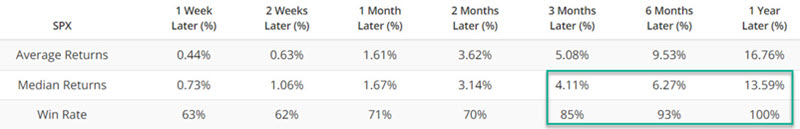
Low values, particularly below zero, suggest investors have panicked, and higher forward returns are expected. The chart below highlights all dates when the Panic/Euphoria Model was below -0.15 while the S&P 500 Index was above its 150-week moving average. All 92 occurrences were followed by a gain for the S&P 500 Index twelve months later.
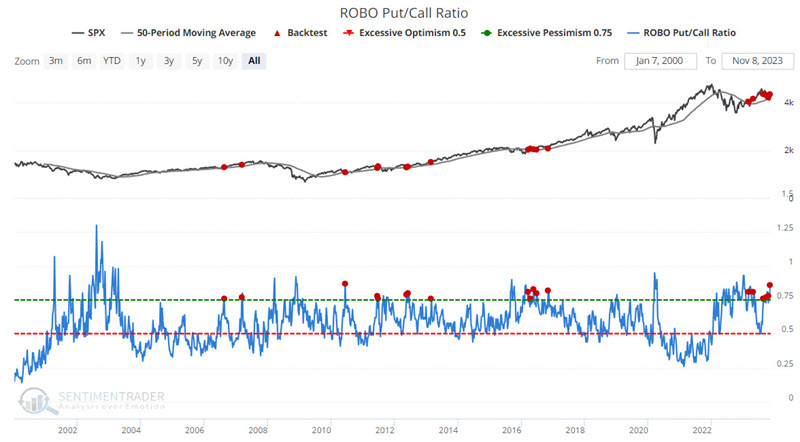
ROBO is an acronym we coined for the Retail-Only, Buy-to-Open put/call ratio.
This ratio focuses on small traders to better understand what they're trying to do. When looking at put/call information, it is most helpful to see if the volume is going into opening transactions or closing transactions, as it will tell us how aggressive the traders are in betting on a market move.
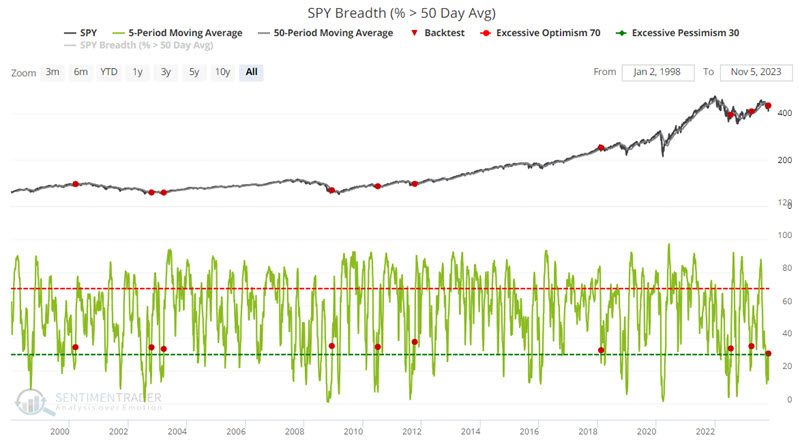
When the ROBO put/call ratio is high, that means small traders are buying many puts in relation to calls, which suggests that they believe their stocks will decline. This is bullish for the market once it reaches an extreme. The chart below highlights those dates when the ROBO Put/Call Ratio rose above 0.75 while the S&P 500 Index was above its 50-week moving average. Over the next year, the S&P 500 rose 92% of the time.
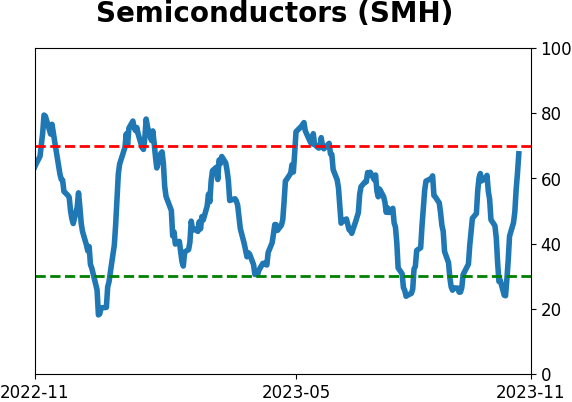
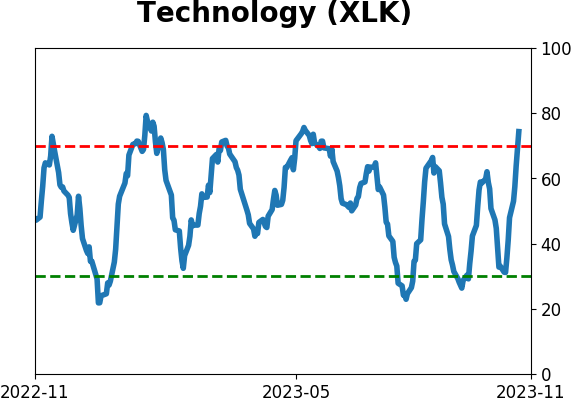
Tech stock surge
Dean showed that a composite trend model for the Technology sector recorded a significant bullish surge. Similar trend score shifts displayed solid returns and win rates over the following three months.
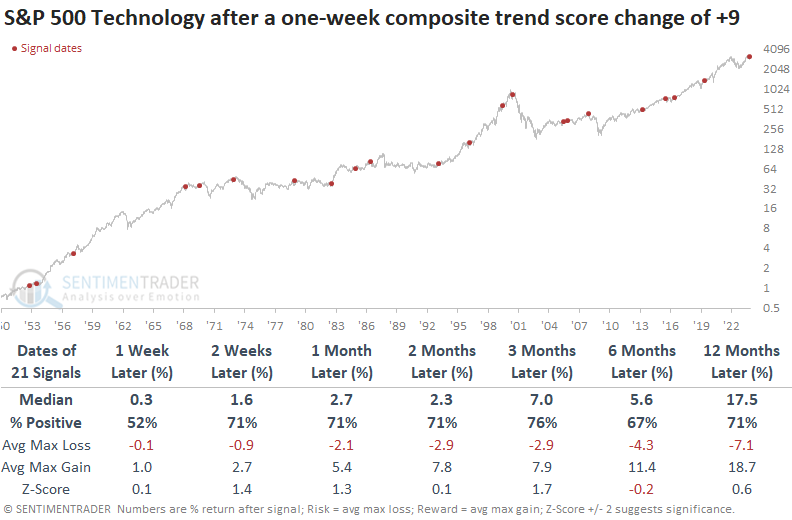
For only the 50th time since 1952, a composite trend model for the Technology sector registered a week-over-week increase of nine points or more.
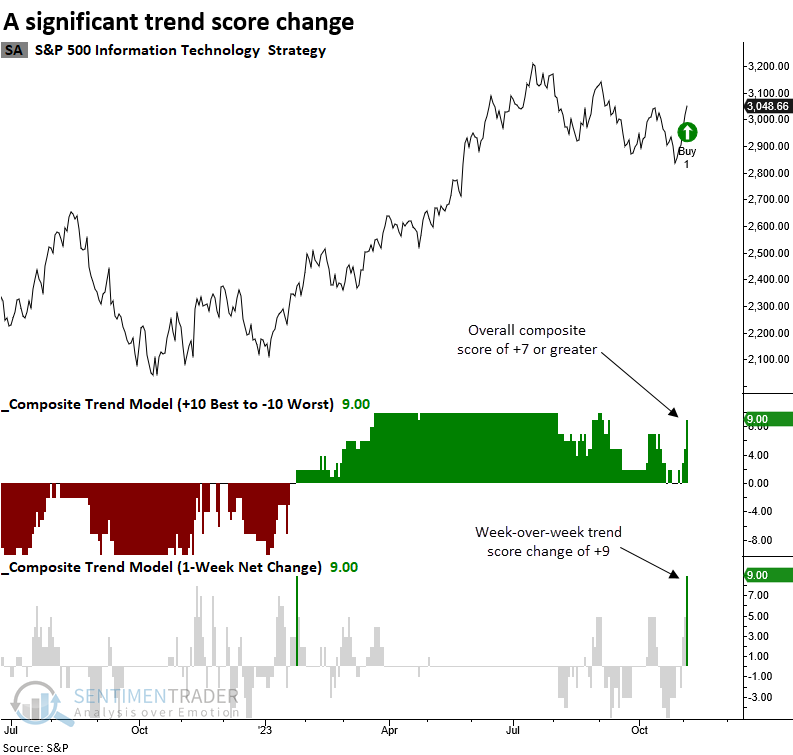
The composite trend model utilizes a scoring system of +1 for favorable trend conditions and -1 for adverse trend conditions.
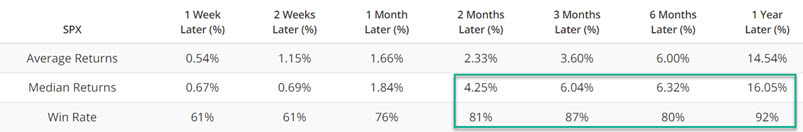
Whenever the composite trend score for the Technology sector experiences a surge of nine points or more in one week, the improvement in trend indicators usually paves the way for a bullish upward bias in the sector for the following three months. Over that same time frame, the sector was higher at some point in all but one instance, albeit two precedents were marginal gains.
Excluding the first week, the Technology sector tends to outperform the broad market across medium and long-term time frames. Dean further looked at performance in growth versus value factors after these types of signals.
Betting on a Tech rally
Jay noted that a calendar spread can allow a trader to profit from a bullish move while limiting downside risk at a fraction of the cost of buying shares.
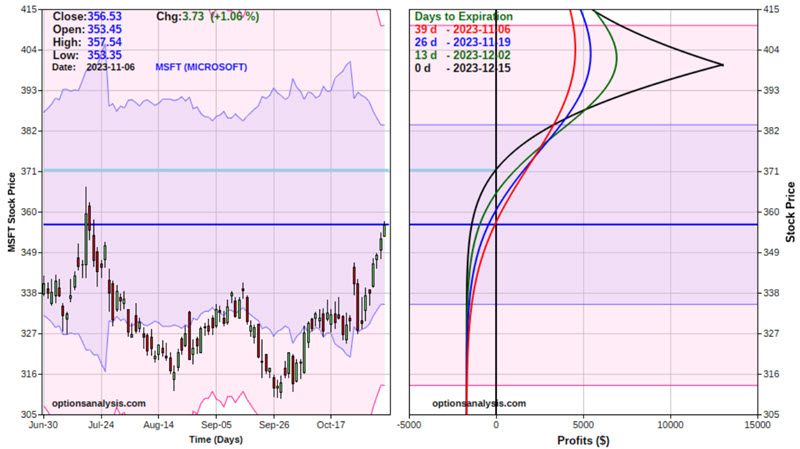
Microsoft (MSFT) is threatening to break out to a new high. At the same time, there is also a chance that MSFT will try and fail to break out and then reverse sharply to the downside. For a trader expecting an upside breakout and another run to the upside, the most straightforward play would be to buy 100 shares of MSFT. The expected $ P/L based on movements in the price of MSFT shares appears in the figure below (all charts below are courtesy of www.Optionsanalysis.com).
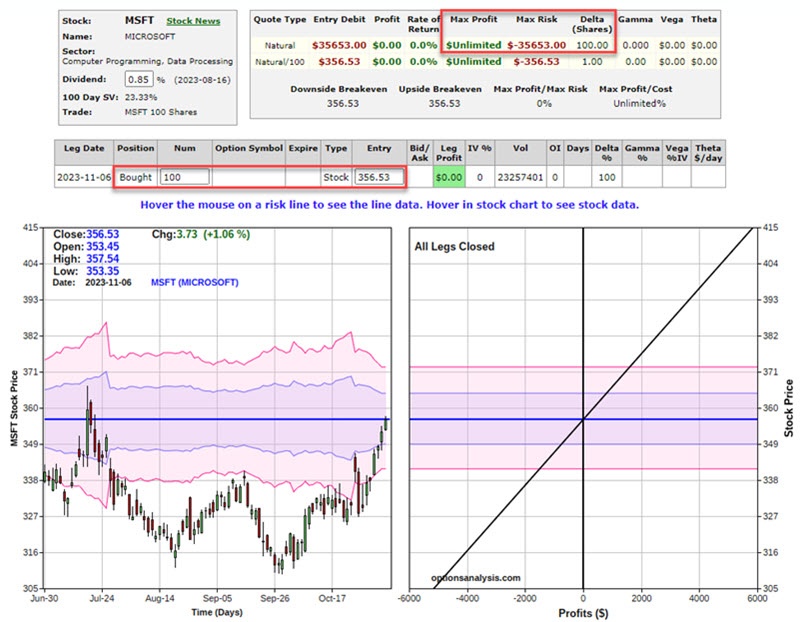
A position of long 100 shares has a delta of 100. This tells us that for each $1 movement in the price of MSFT shares, the position will gain or lose $100. The most important thing to note is that with MSFT trading at $356.53 a share, the trader must commit $35,653 to buy 100 shares.
A bull call calendar spread is an option position that buys an out-of-the-money call option in a further out calendar month and simultaneously sells another put option at the same strike price in a closer calendar month. Note in the chart below that implied option volatility for MSFT options (the black line in the chart below) is near the low end of its historical range.
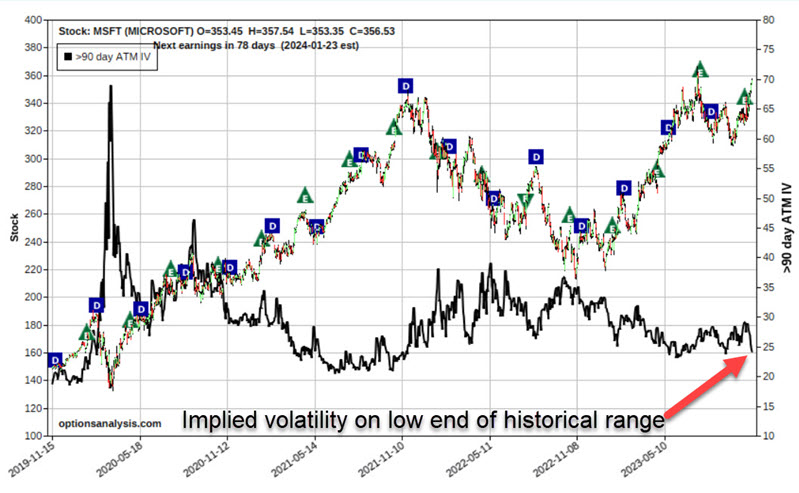
Out-of-the-money options are comprised solely of time premium - which will evaporate by options expiration. Implied options volatility tells us whether the amount of time premium built into the options for a given stock is presently on the high or low end of the historical range - or somewhere in between. If IV is on the low end of the historical range, then options are considered "cheap," and if IV is on the high end of the historical range, then options are considered "expensive."
When buying a calendar spread, it is advantageous to enter the trade when implied volatility is low. For our example trade, we will:
- Buy 15 MSFT Jan19 2024 400 strike price calls @ $1.47
- Sell 15 MSFT Dec15 2023 400 strike price calls @ $0.31
The particulars and risk curves appear in the figures below.
The cost to enter this trade is $1,695 (compared to $35,653 to buy 100 shares of MSFT stock) and $1,695 is also the maximum risk on the trade. This position has a delta of 99.06. This means that for now, this position will behave like a position holding 99 shares of MSFT stock.
As you can see in the chart above, the position will continue to gain value as long as MSFT shares keep rising - up to the strike price of $400 a share. Then, the risk curves would roll over and begin to decrease. If MSFT shares fail to rise or decline in value, the option position could expire worthless and result in a loss of the total amount paid to enter the price ($1,695).
Jay went into further detail showing the advantages (and disadvantages) of this kind of option position versus just holding the stock.
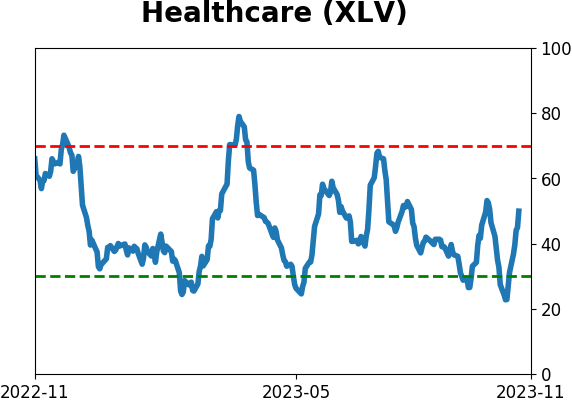
An important juncture for Health Care
The healthcare sector has been dead money for two and a half years. Jay noted that a bevy of indicators have recently flashed favorable signals for this sector and if the sector fails to rally soon, it may be a sign of a deeper problem.
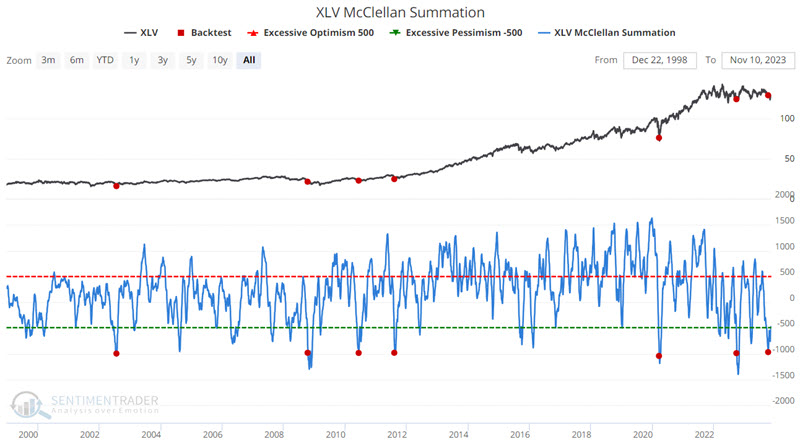
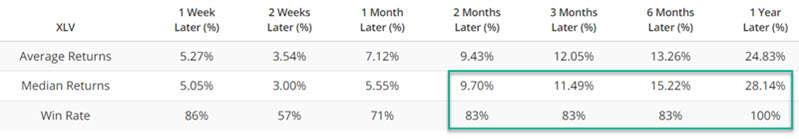
The chart below highlights when the XLV McClellan Oscillator crossed below -970 for the first time in three months. This was triggered in October and has preceded gains in the sector every time over the following year.
Jay also looked at the percentage of Health Care stocks that are oversold, and that are above their 50-day moving averages. Both indicators have preceded positive returns for the sector when reaching recent levels. He also noted capitulation in the form of a 50-day moving average of our Optimism Index for XLV.
The chart below displays the annual seasonal trend for ticker XLV along with the actual year-to-date performance for XLV.
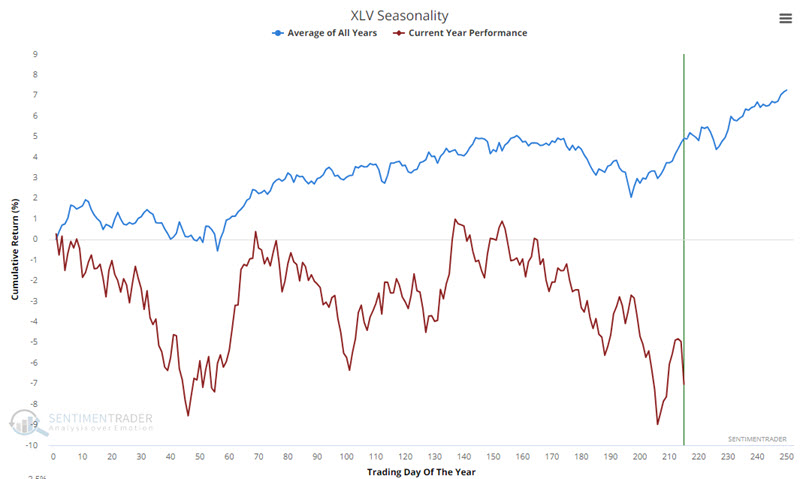
We can see that XLV has struggled to bounce off its low following the expected seasonal turn on Trading Day of Year #197. Another potentially favorable period extends from the close on TDY #226 through TDY #11 of next year. For 2023-24, this period will extend from the close on 2023-11-24 through 2024-01-17.
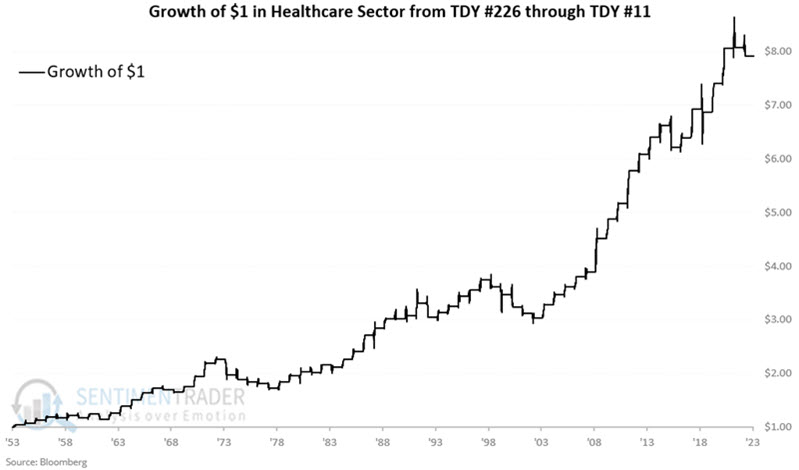
To backtest this period, we use the S&P 500 Healthcare sector index (the index that XLV tracks) starting in 1953. The growth of $1 invested in this sector only during this period appears in the chart below.
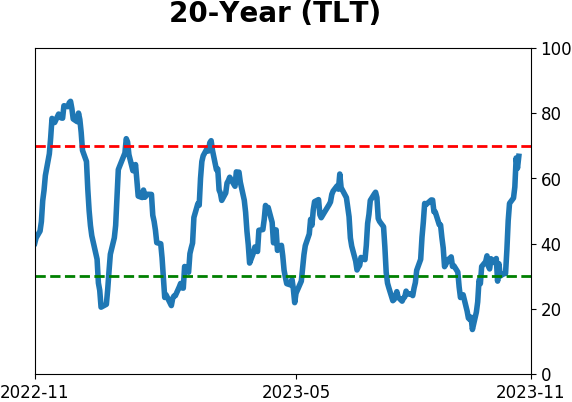
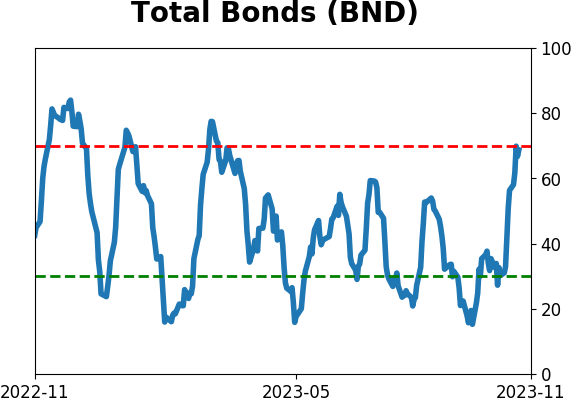
A big bond reversal
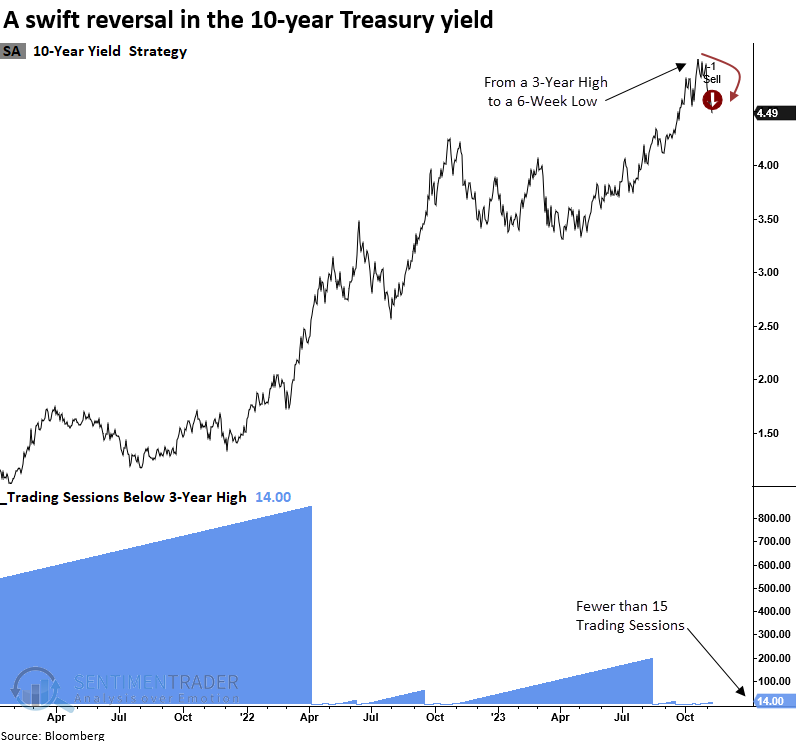
Dean showed that over the last three weeks, the 10-year Treasury yield experienced a sharp reversal from a 3-year high. Following similar patterns, the 10-year saw additional downside follow-through over the short-term.
In the wake of the FOMC holding the target rate steady once more and the Treasury's Quarterly Refunding Announcement revealing a preference for short-duration T-bill issuance, traders swiftly seized the opportunity to acquire long-dated bonds, resulting in one of the most rapid reversals in history. The 10-year bond saw a remarkable reversal, as the benchmark yield shifted from a 3-year high to a 6-week low in under 15 trading sessions.
When the 10-year yield experiences a rapid drop from a 3-year high to a 6-week low in 15 sessions or less, the benchmark yield tends to follow the same trend by declining further. At some point over the next month, 8 out of 11 precedents saw lower bond yields. However, from three to twelve months later, the 10-year yield was higher at some point in all but one case.
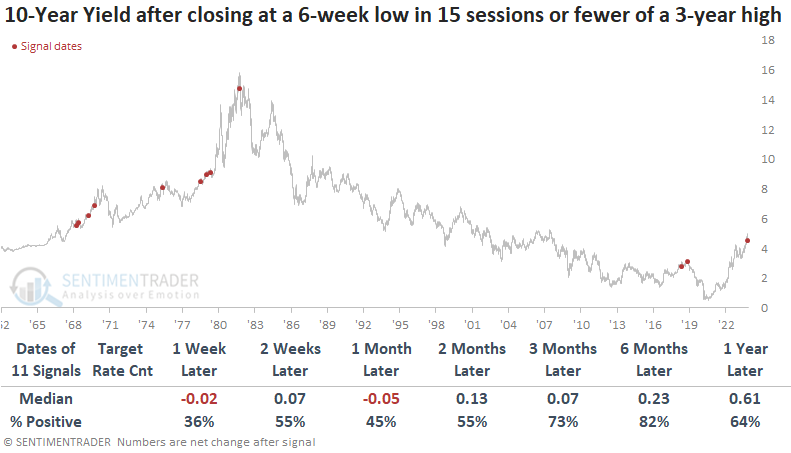
Should the 10-year yield experience a 40 basis point decline in 15 trading sessions or fewer from a 3-year high, it implies an underlying upward bias across most time horizons. More importantly, before 2022, reversals of this nature have only occurred in secular uptrends in yields.
In a recent note, Dean shared a composite that measures whether ten diverse bond ETFs are on a buy signal relative to a cash proxy. Despite the sharp move lower in the 10-year yield and other bond components, the composite did not generate any new buy signals, suggesting a significant bond market trend shift.
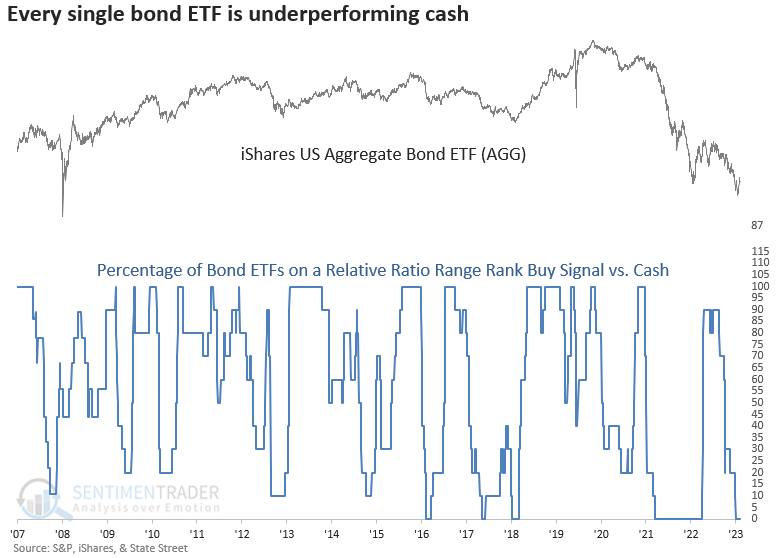
Once the Federal Reserve completes its interest rate hiking cycle, the percentage of Treasury bond yields trading above their 200-day average should provide a timely signal for a bullish bond trade.
About TradingEdge Weekly...
The goal of TradingEdge Weekly is to summarize some of the research published to SentimenTrader over the past week. Sometimes there is a lot to digest, and this summary highlights the highest conviction or most compelling ideas we discussed. This is NOT the published research; rather, it pulls out some of the most relevant parts. It includes links to the published research for convenience, and if you don't subscribe to those products, it will present the options for access.
Indicators at Extremes
|
|
|
Phase Table
|
|
|
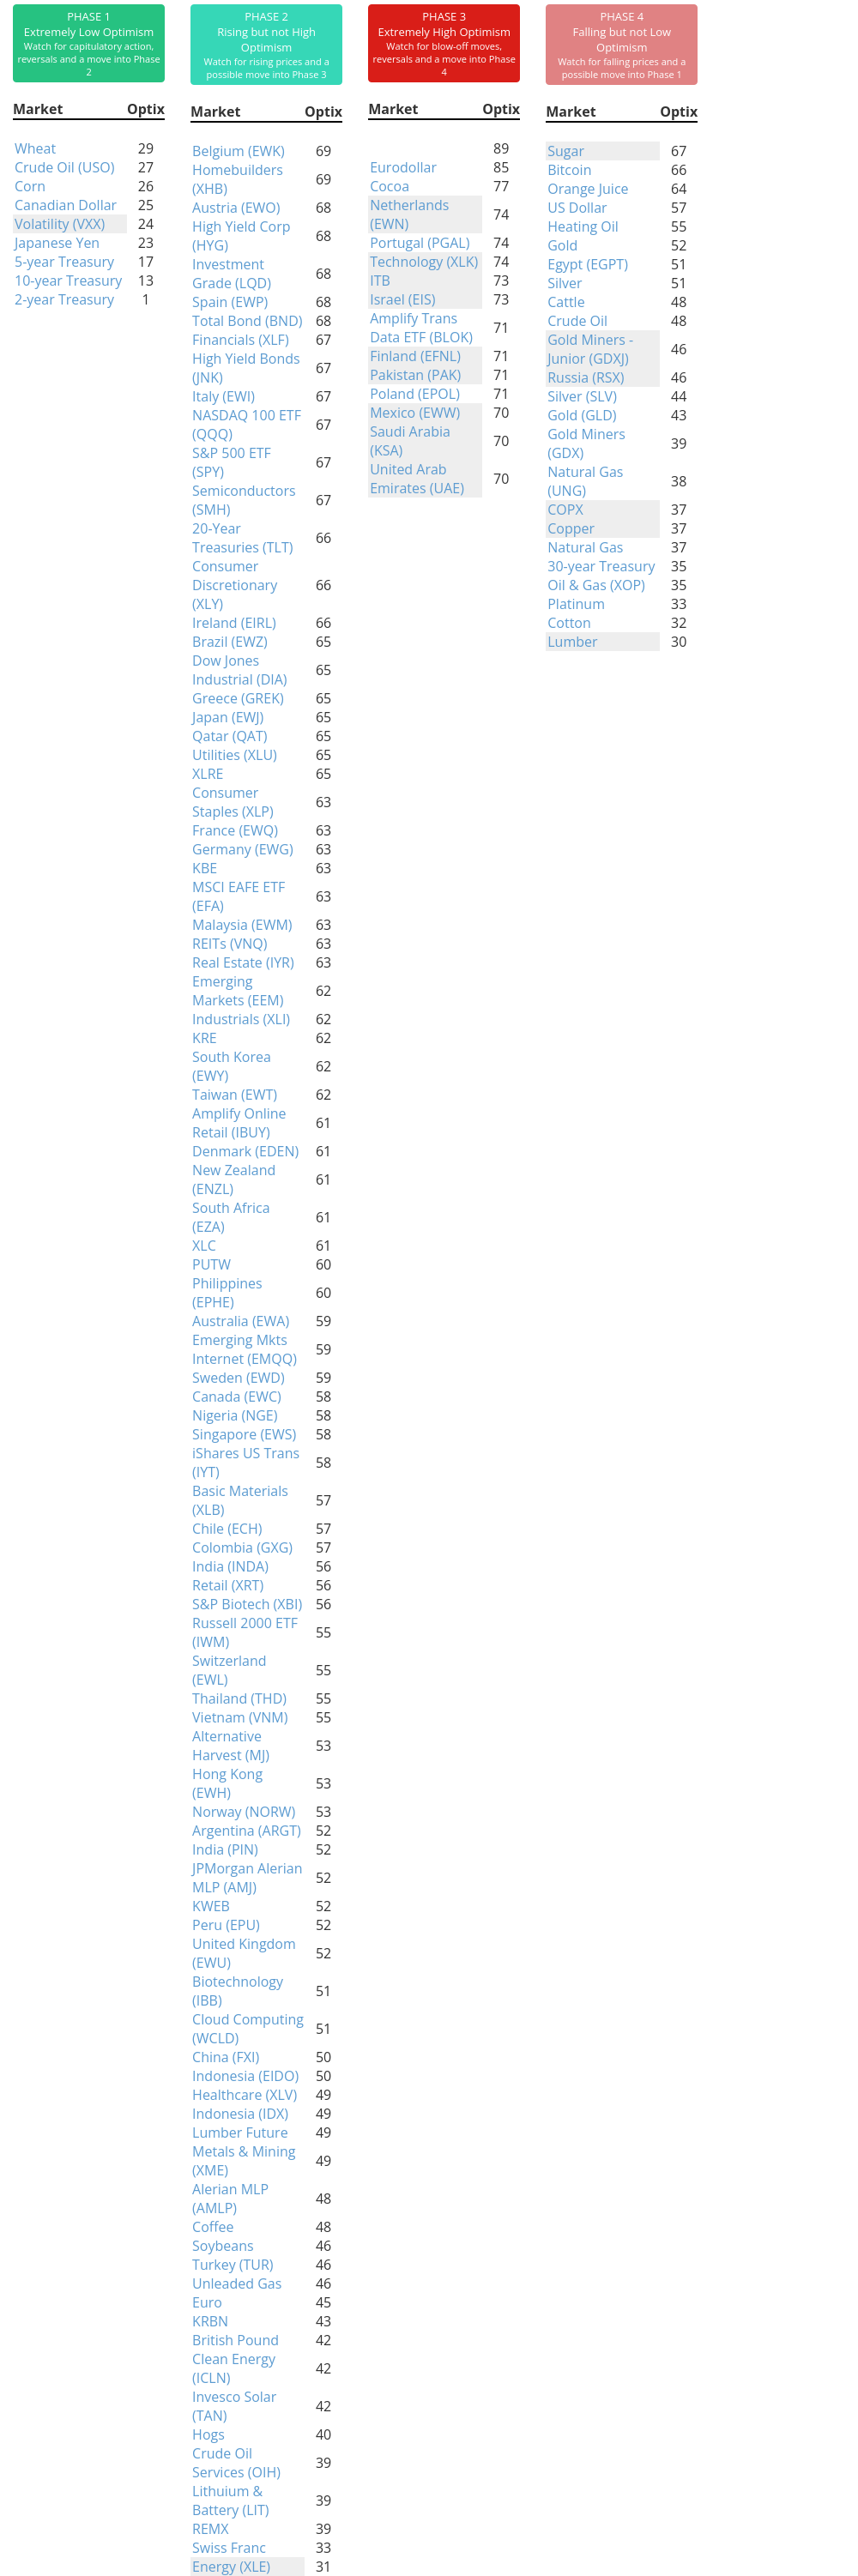
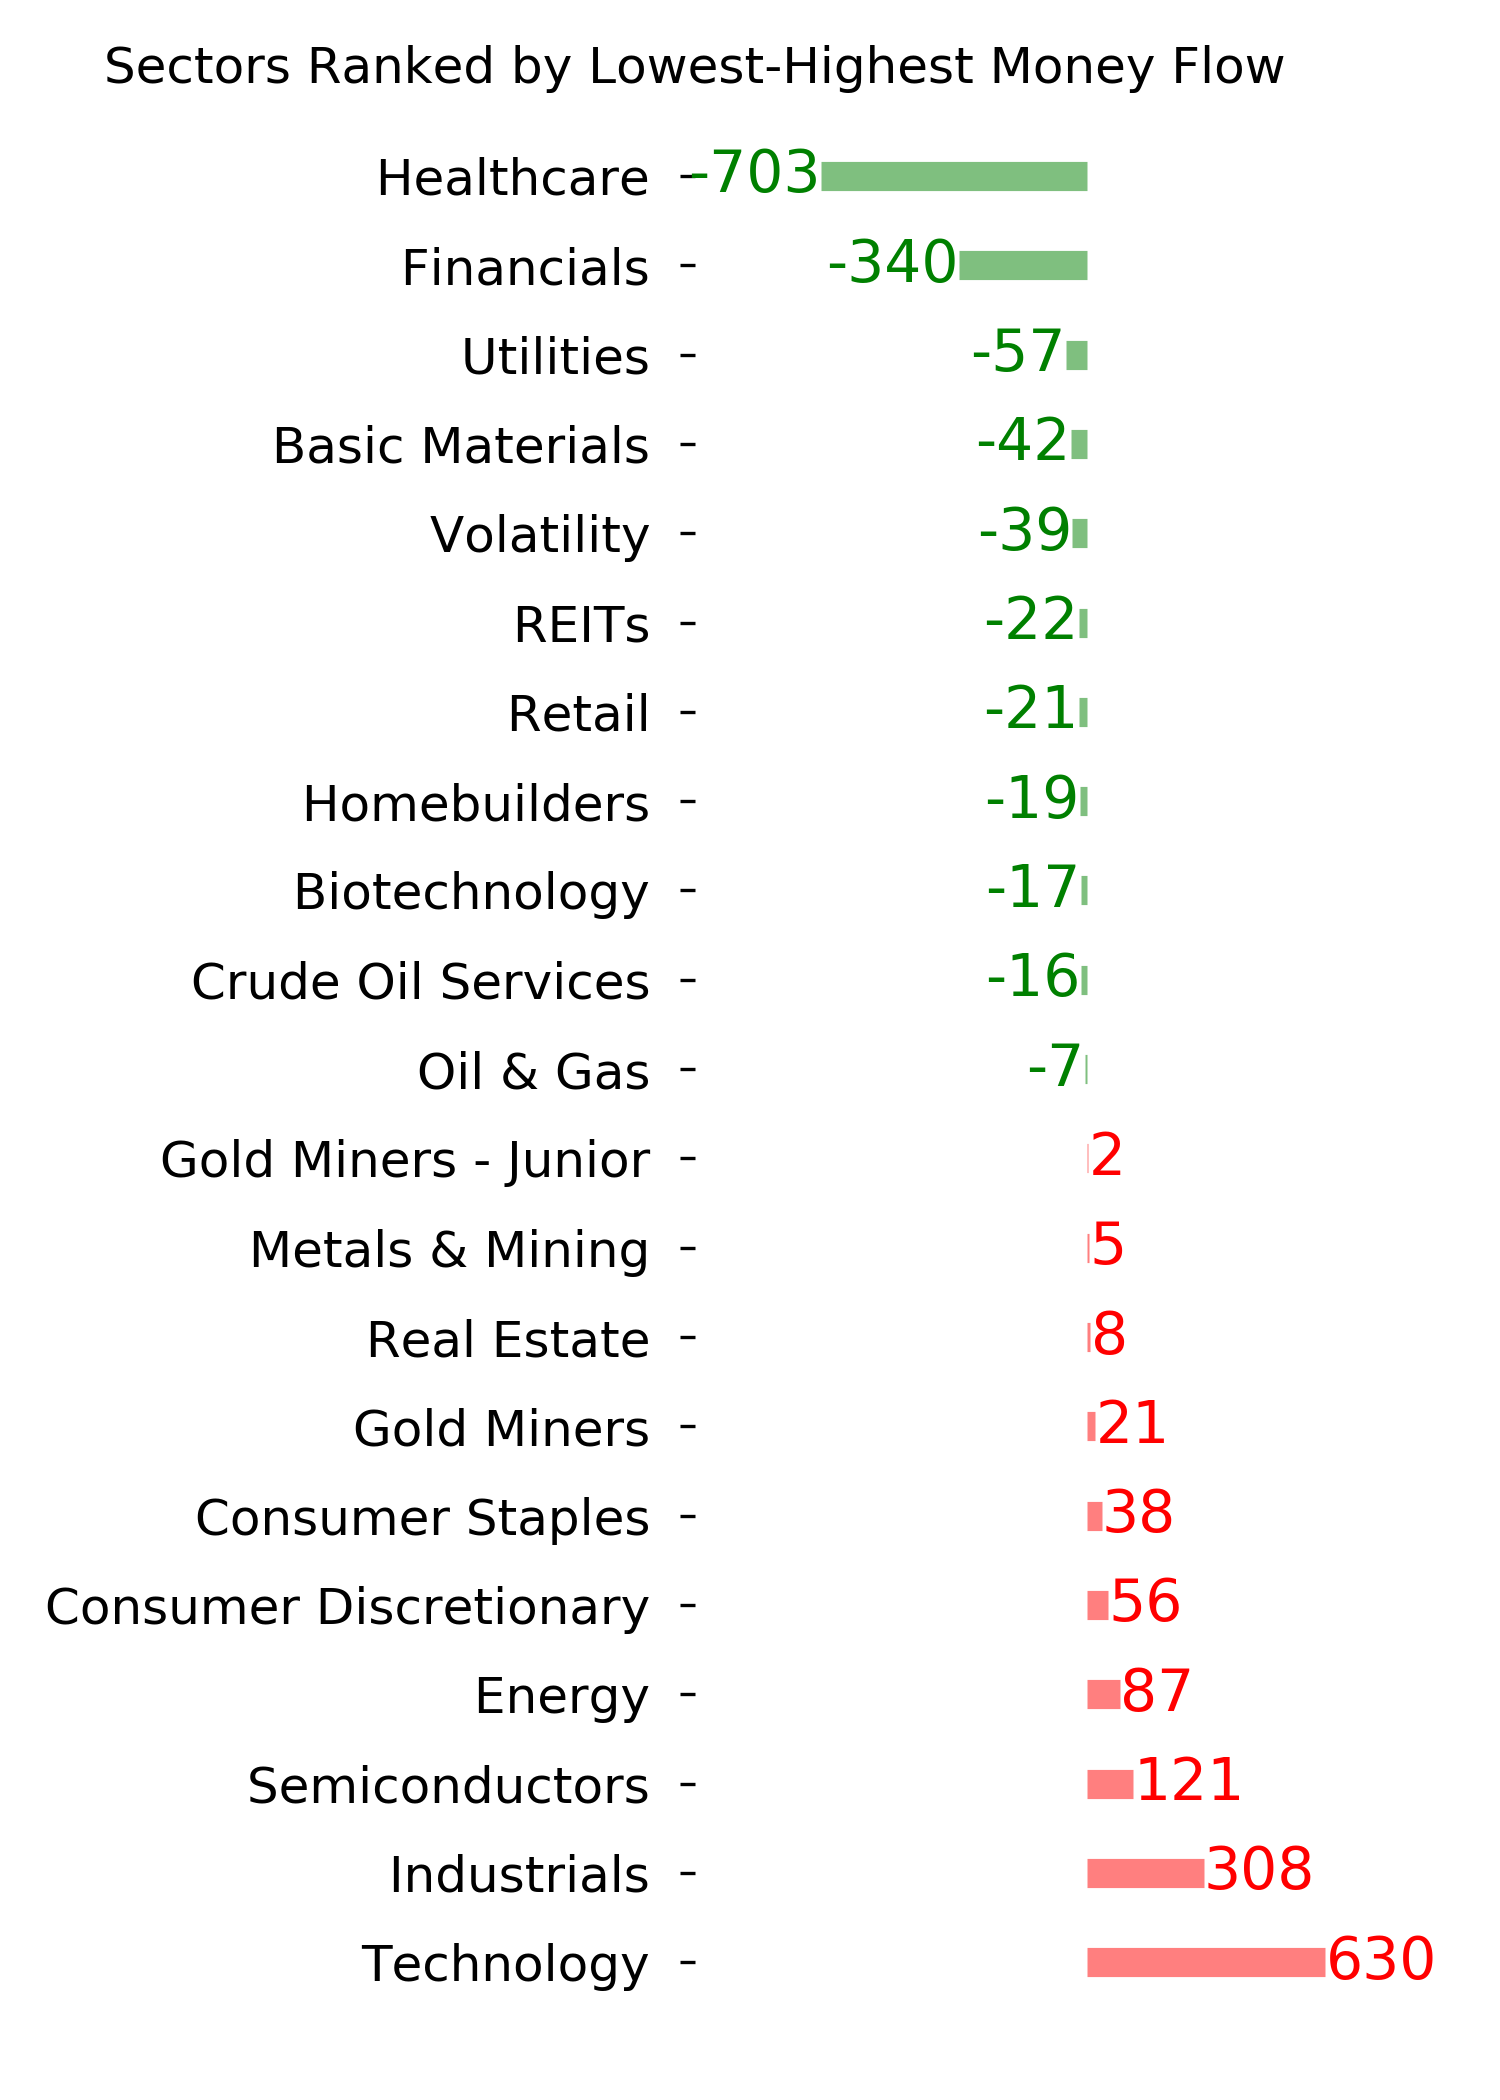
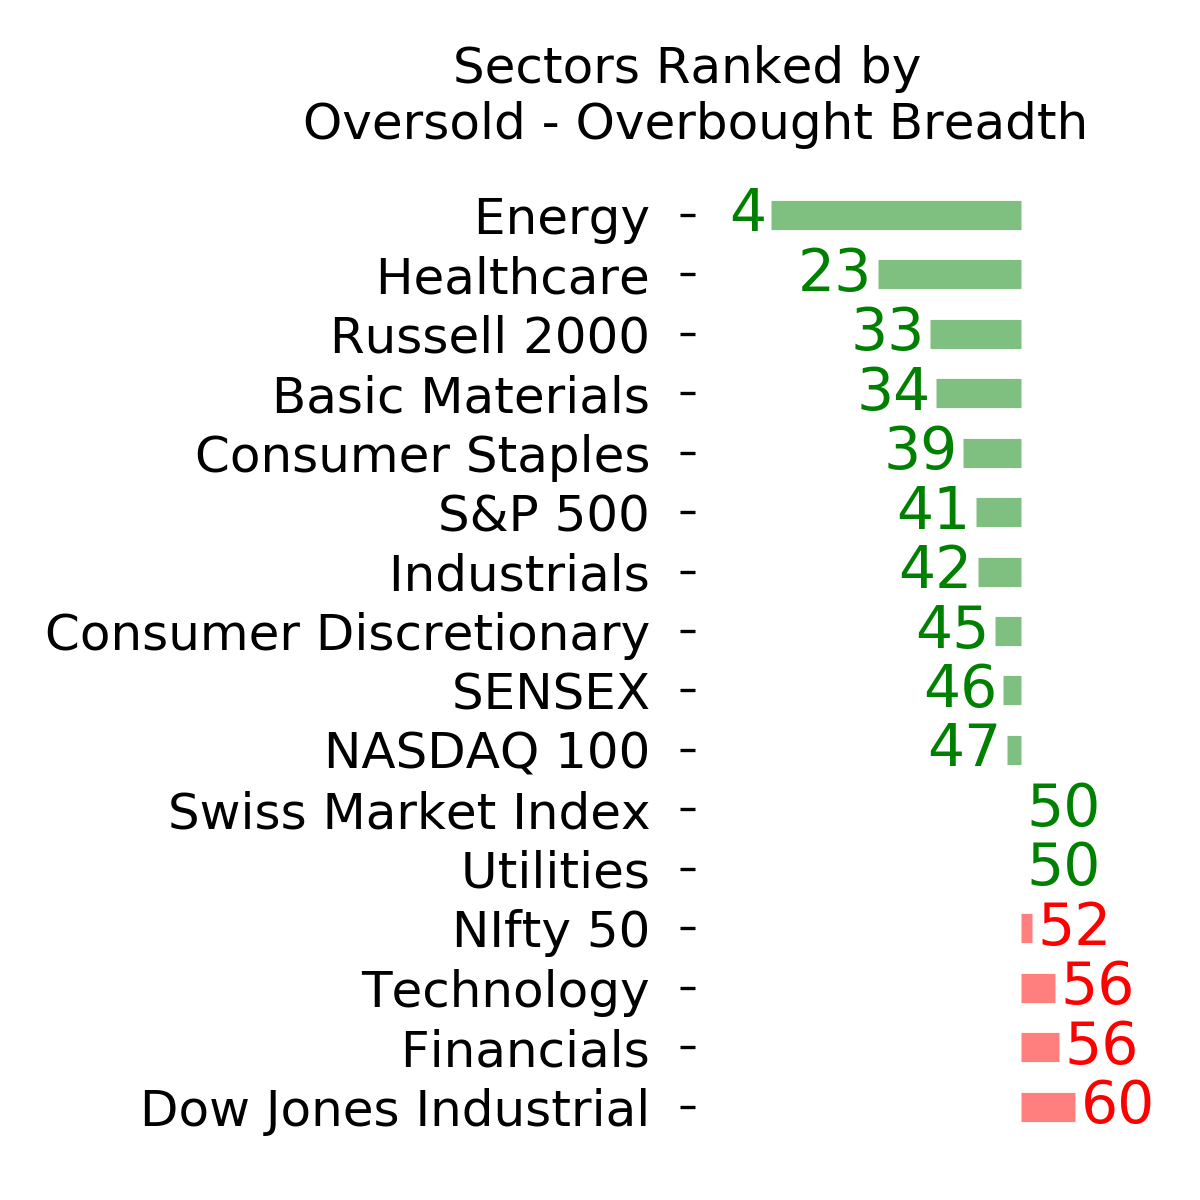
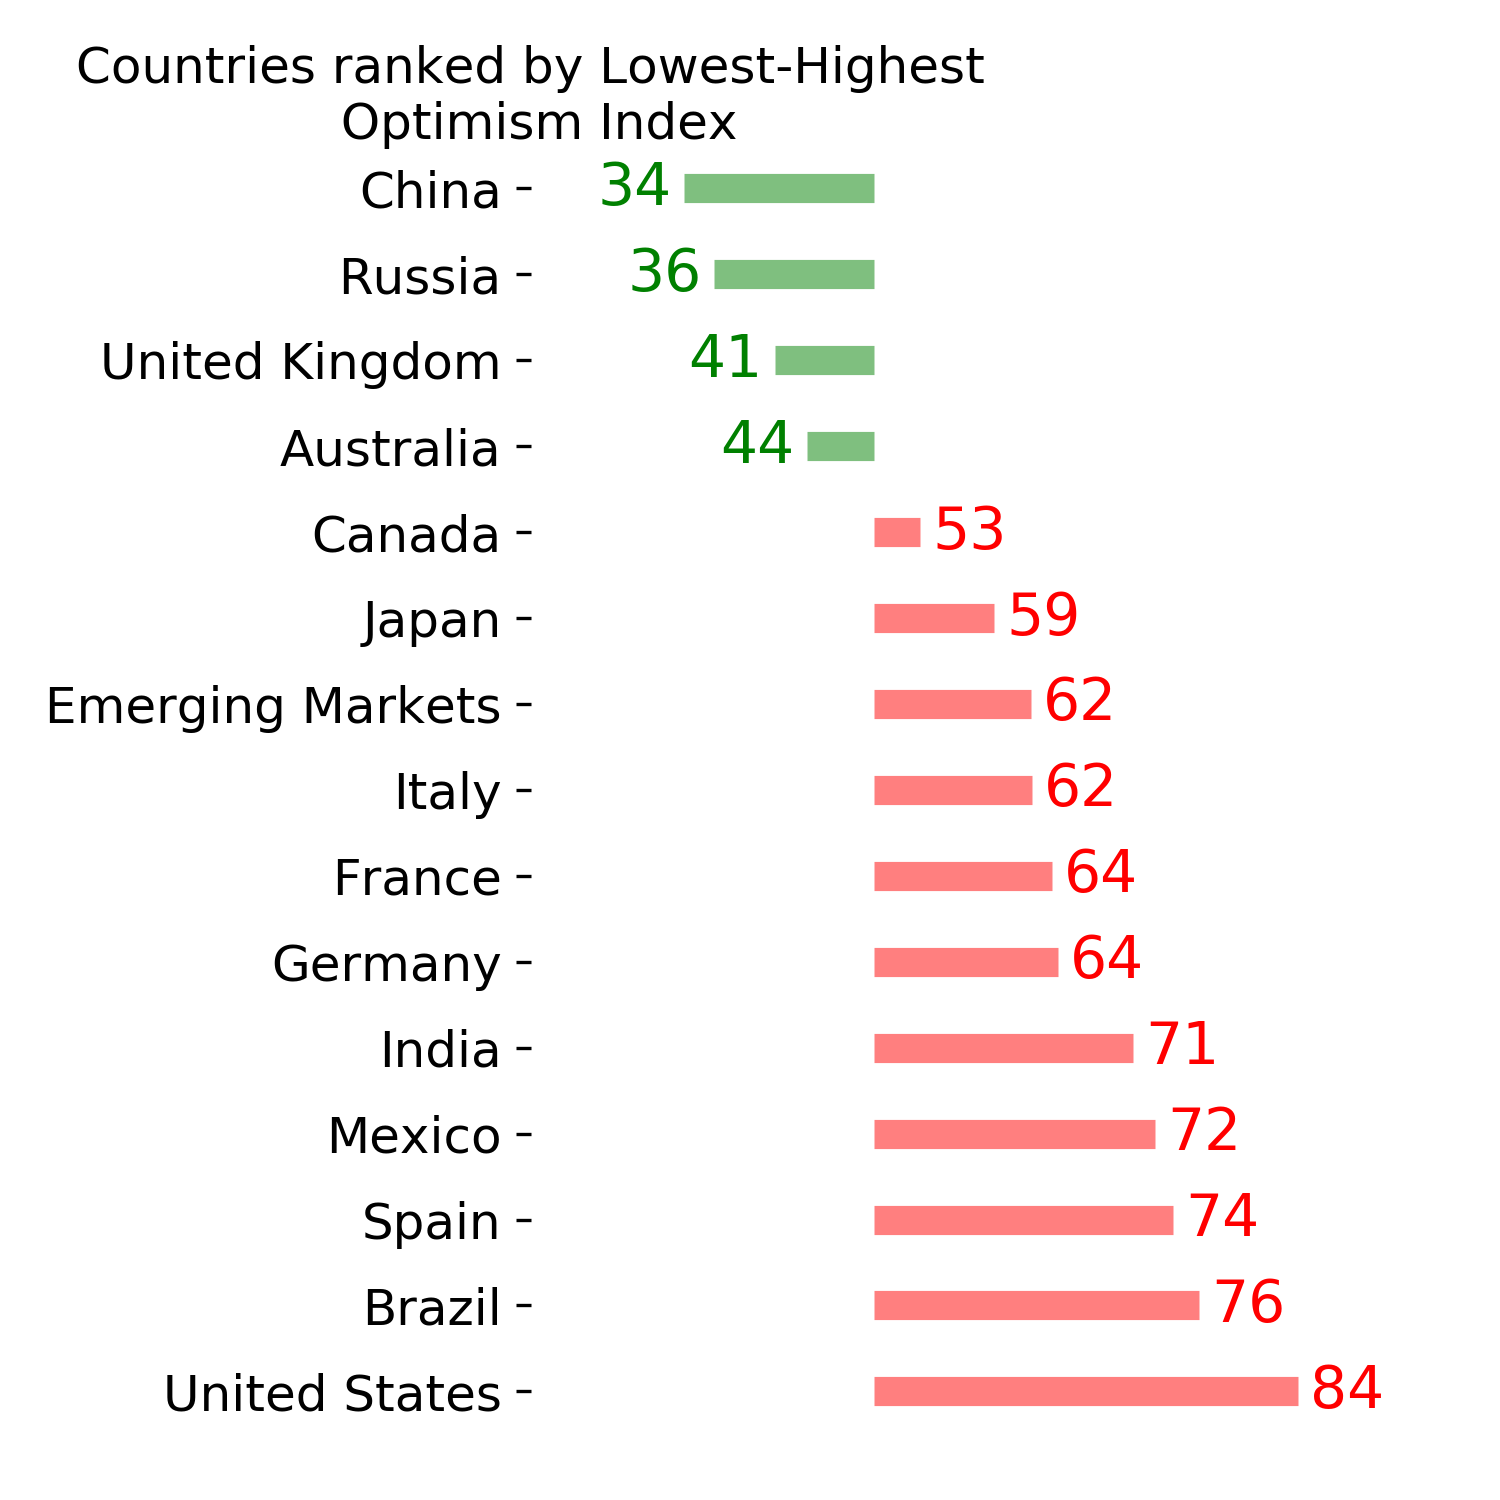
Ranks
|
|
|
|
|
|
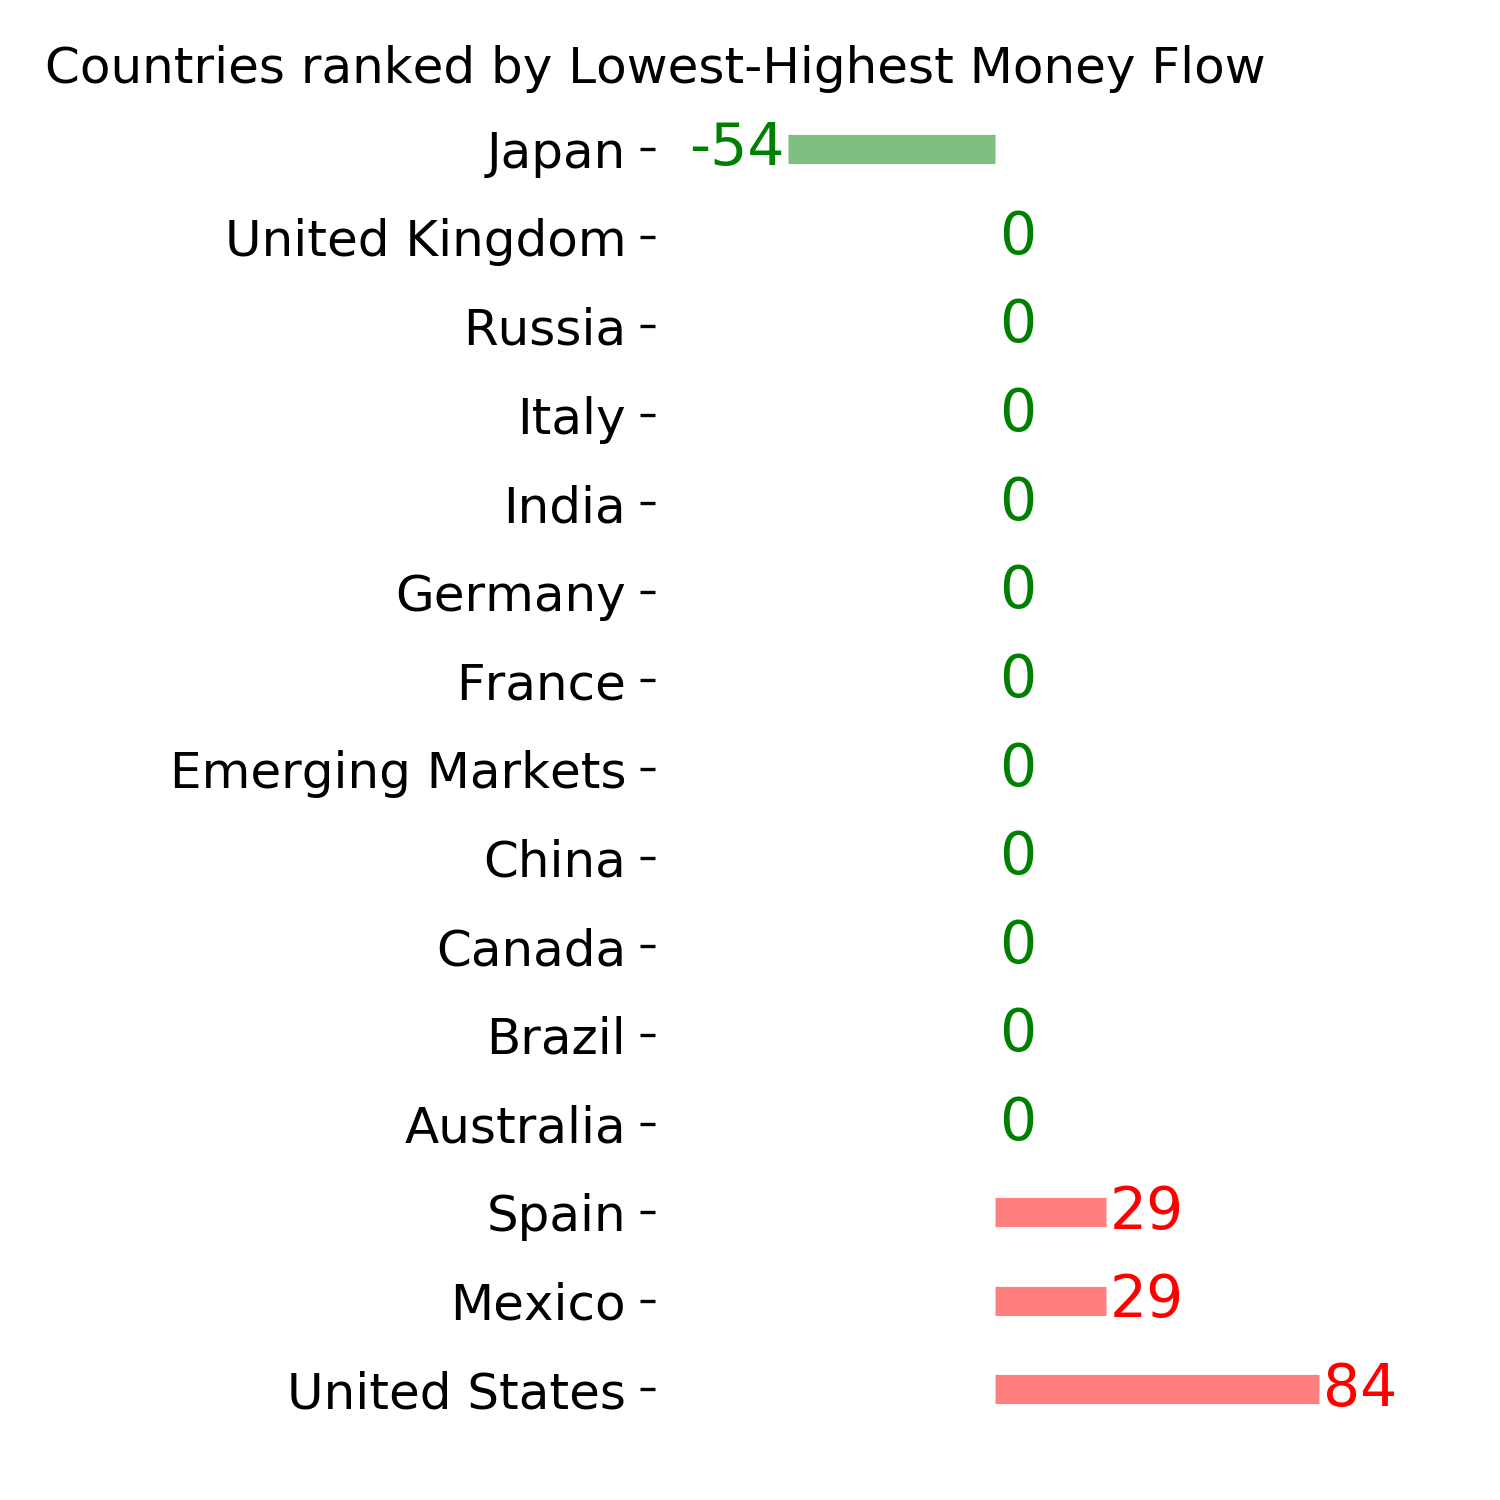
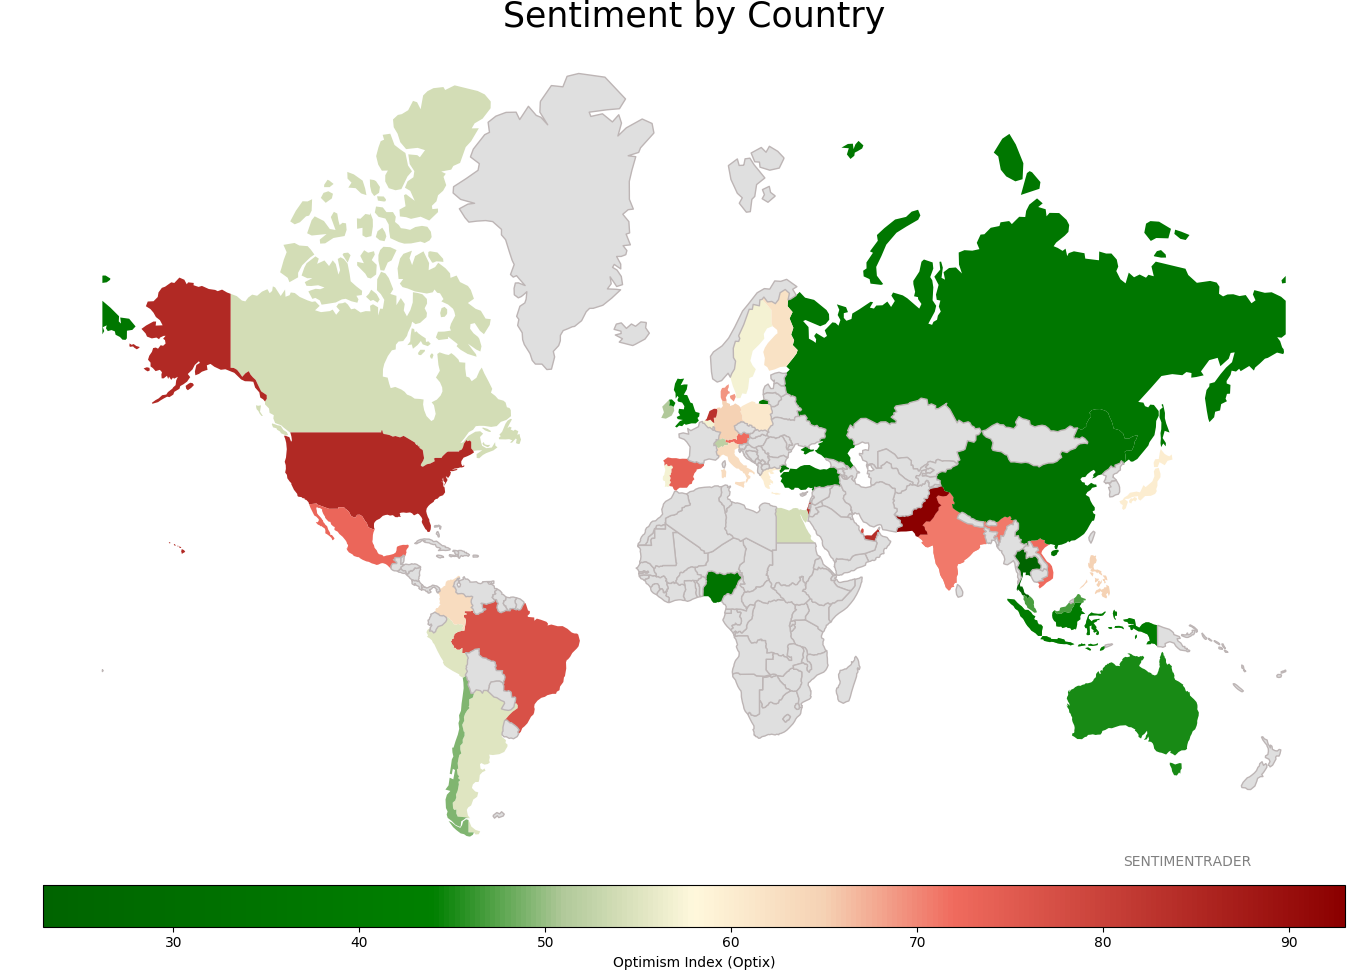
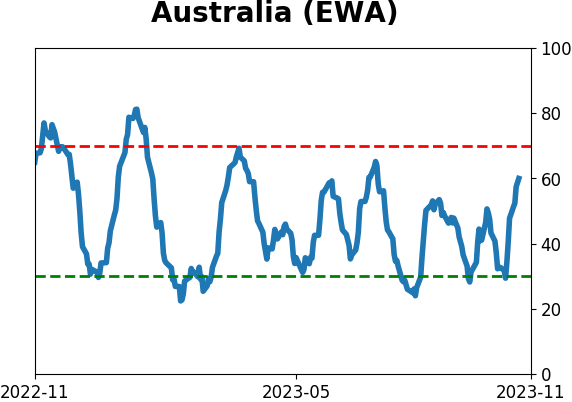
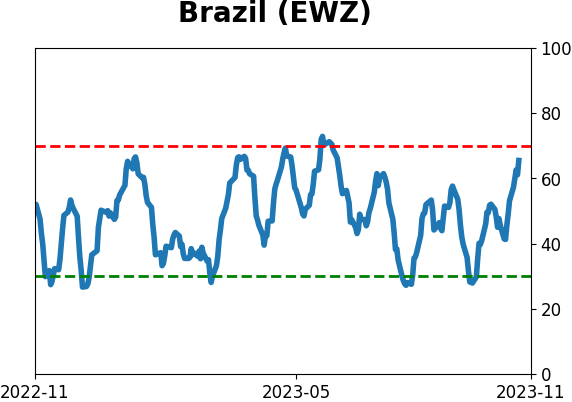
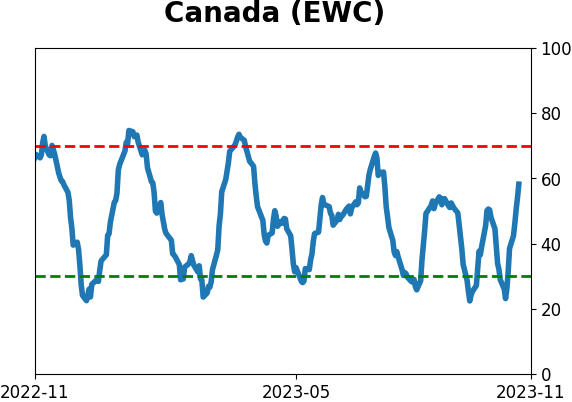
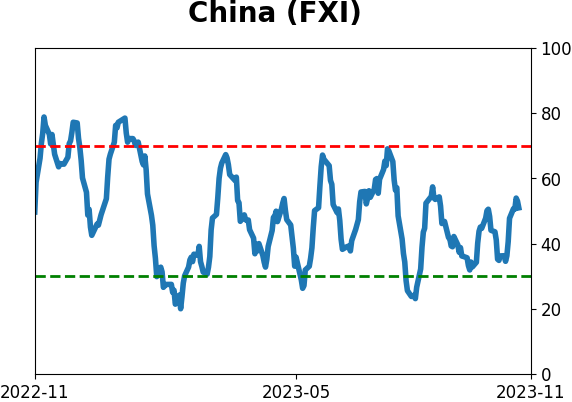
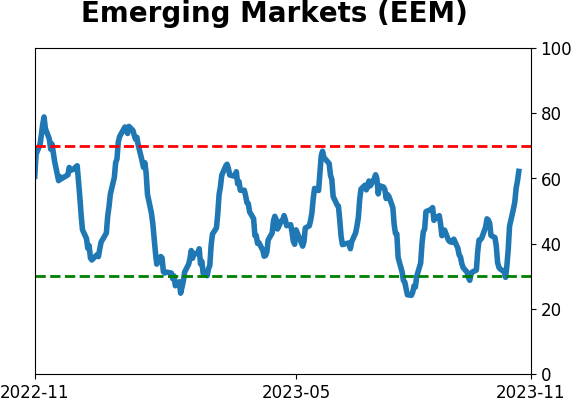
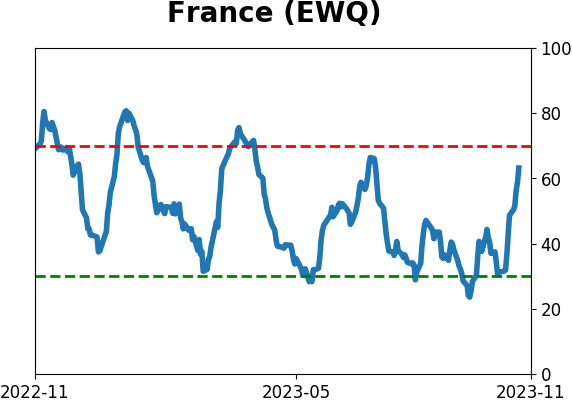
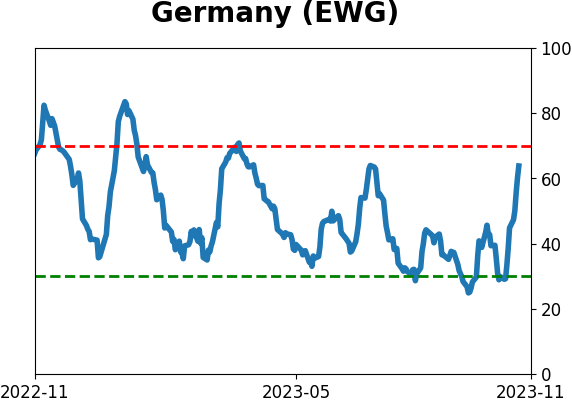
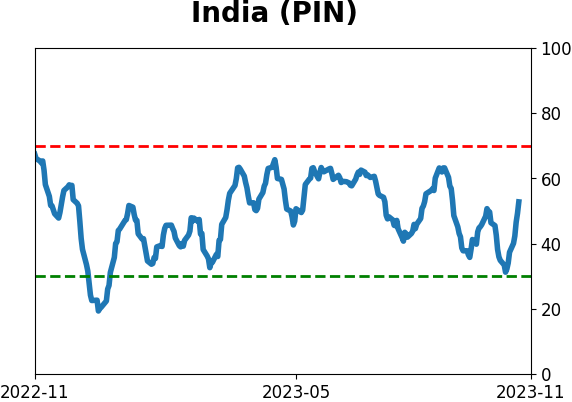
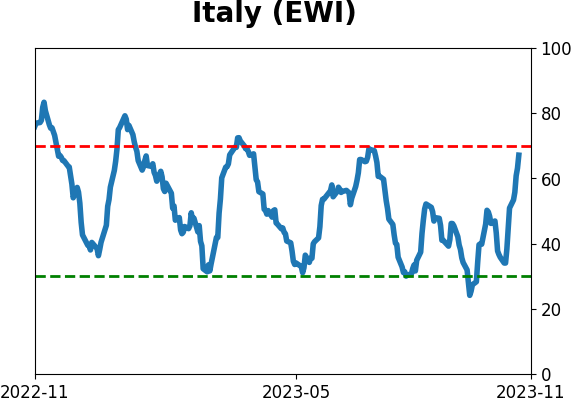
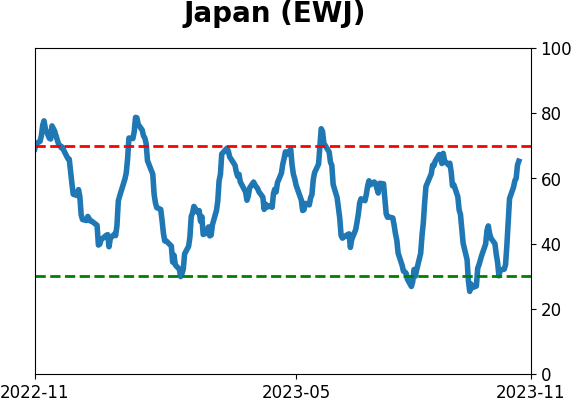
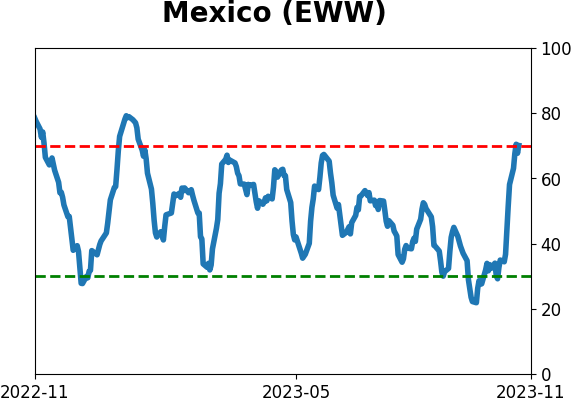
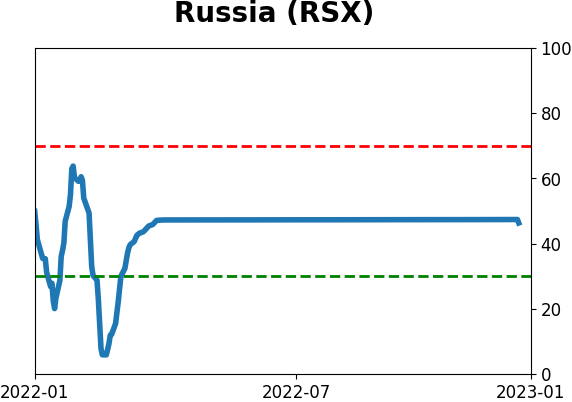
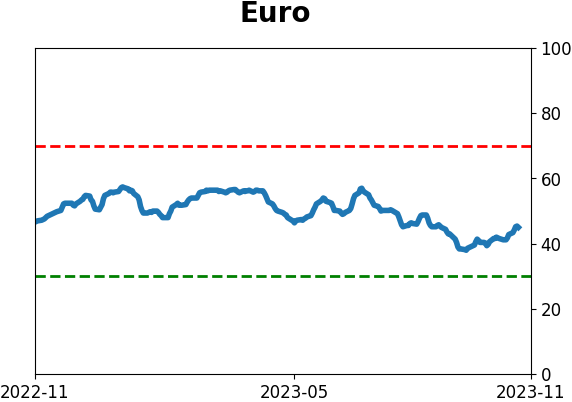
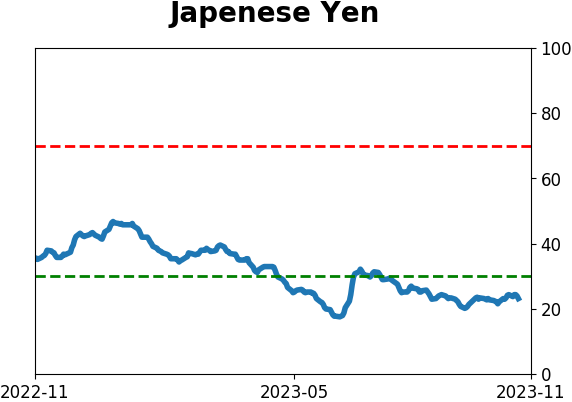
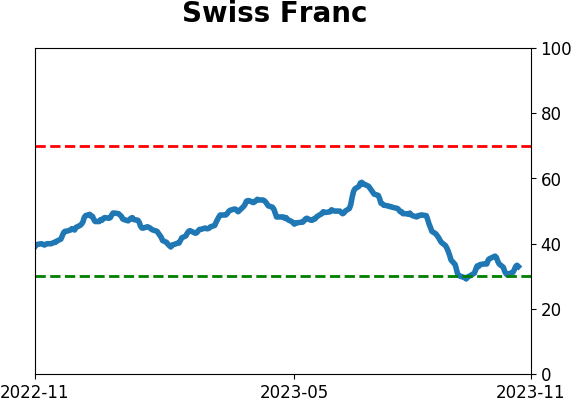
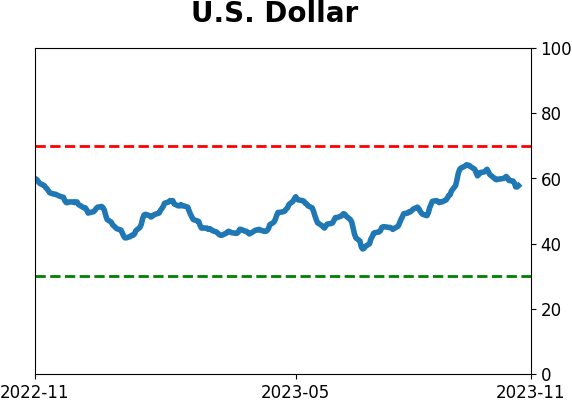
Sentiment Around The World
|
|
|
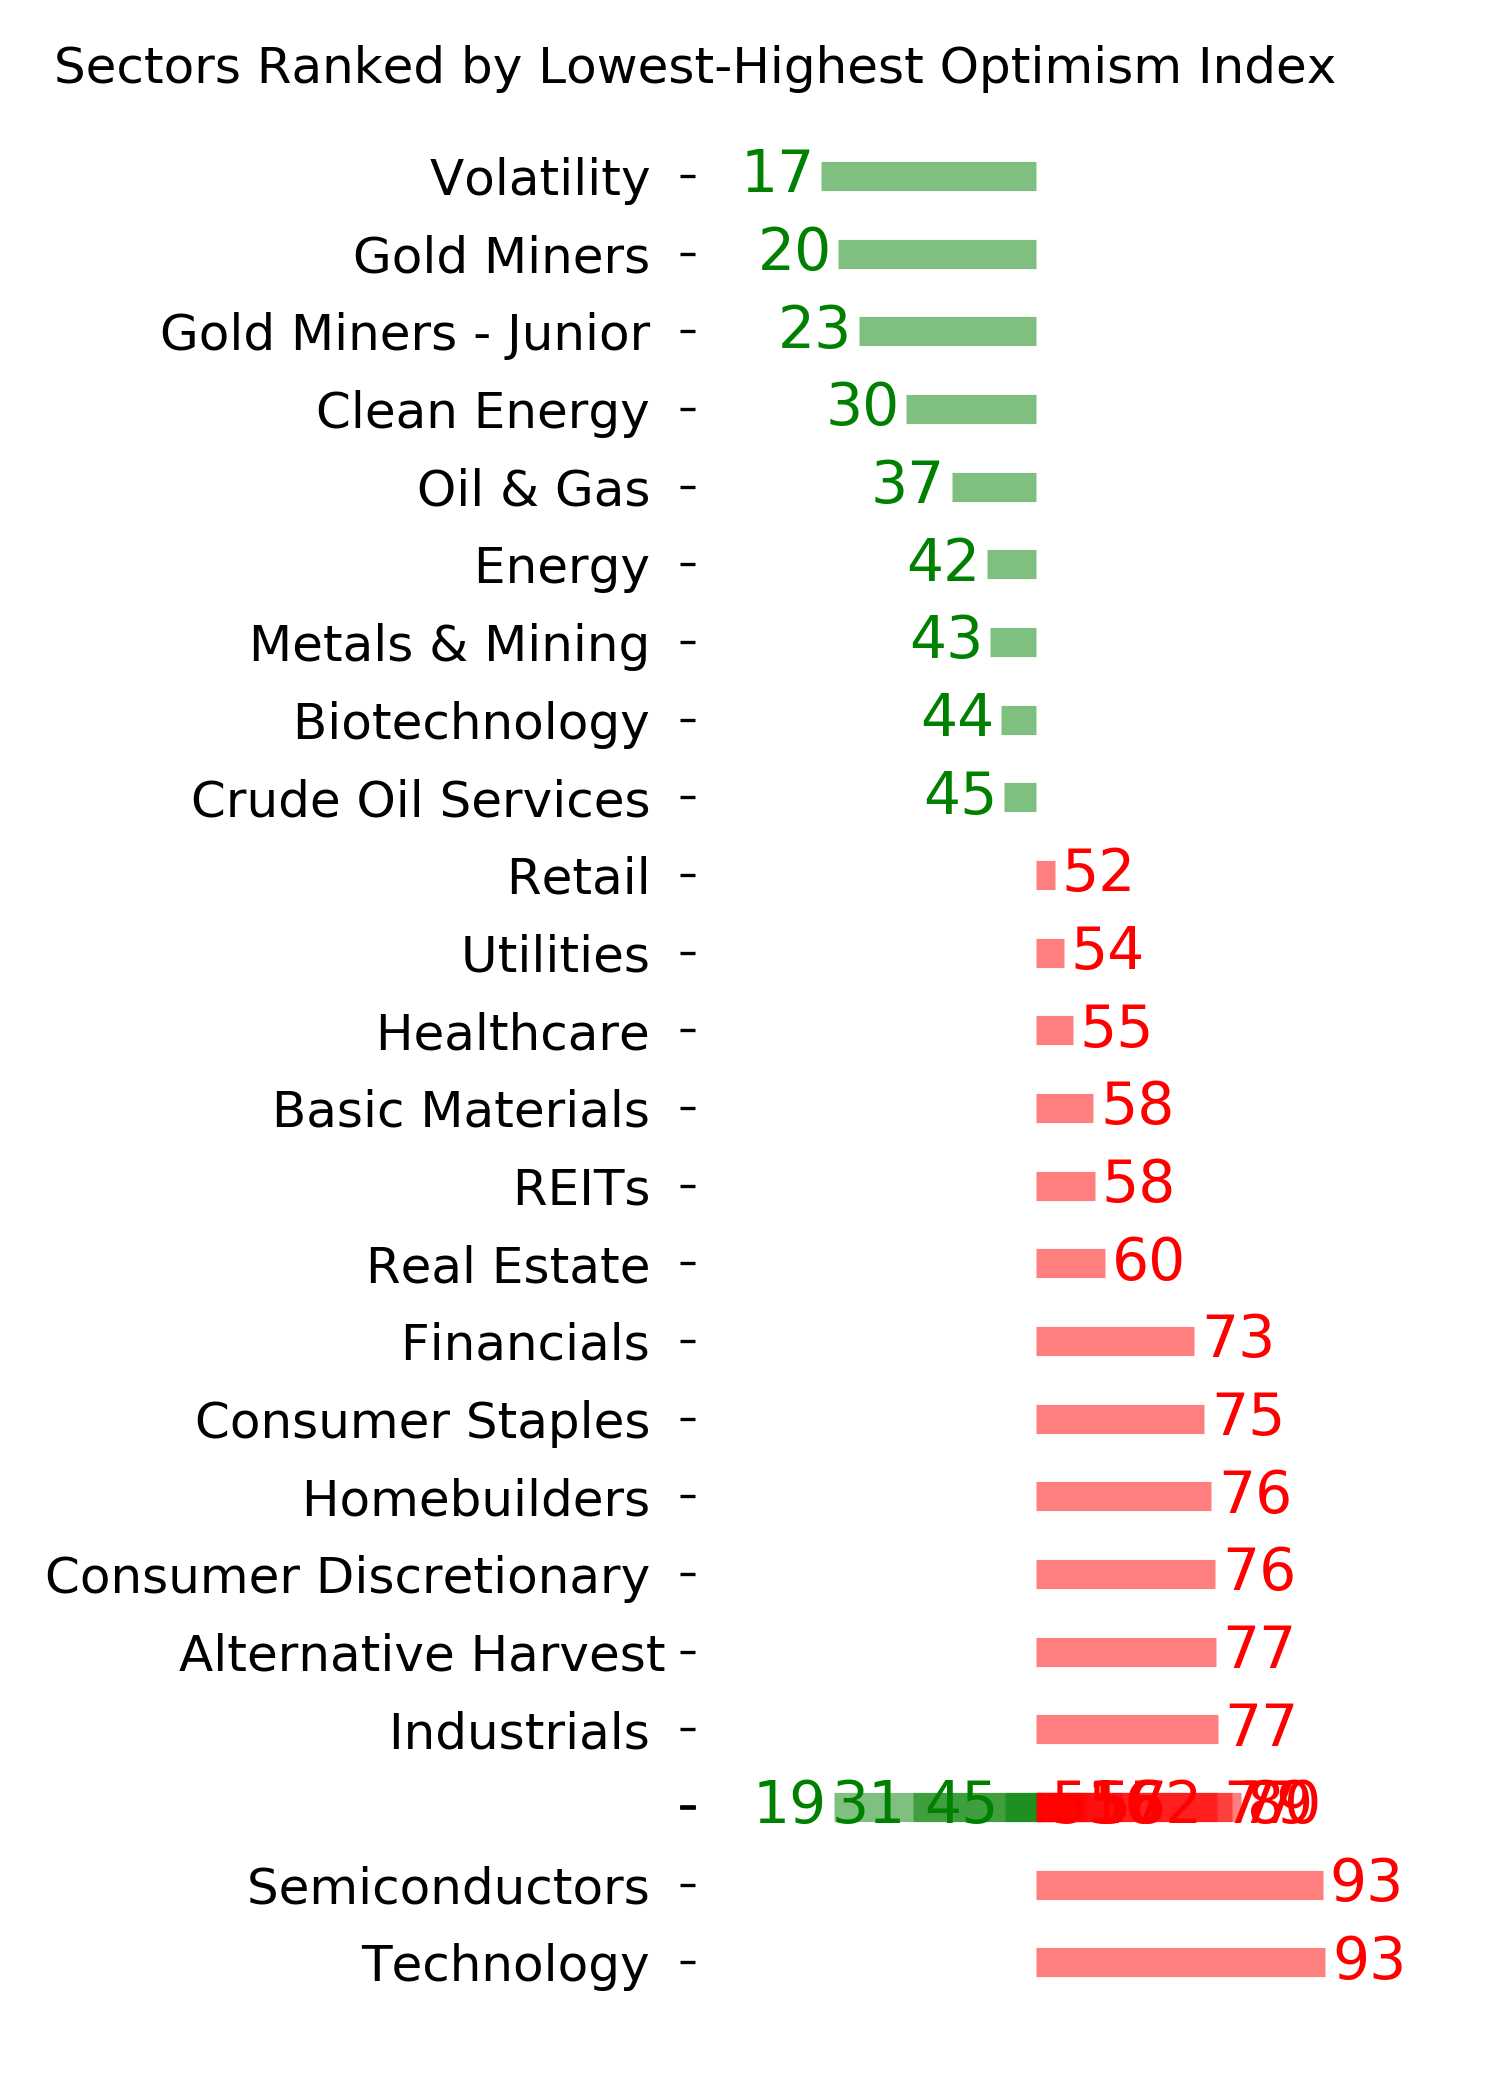
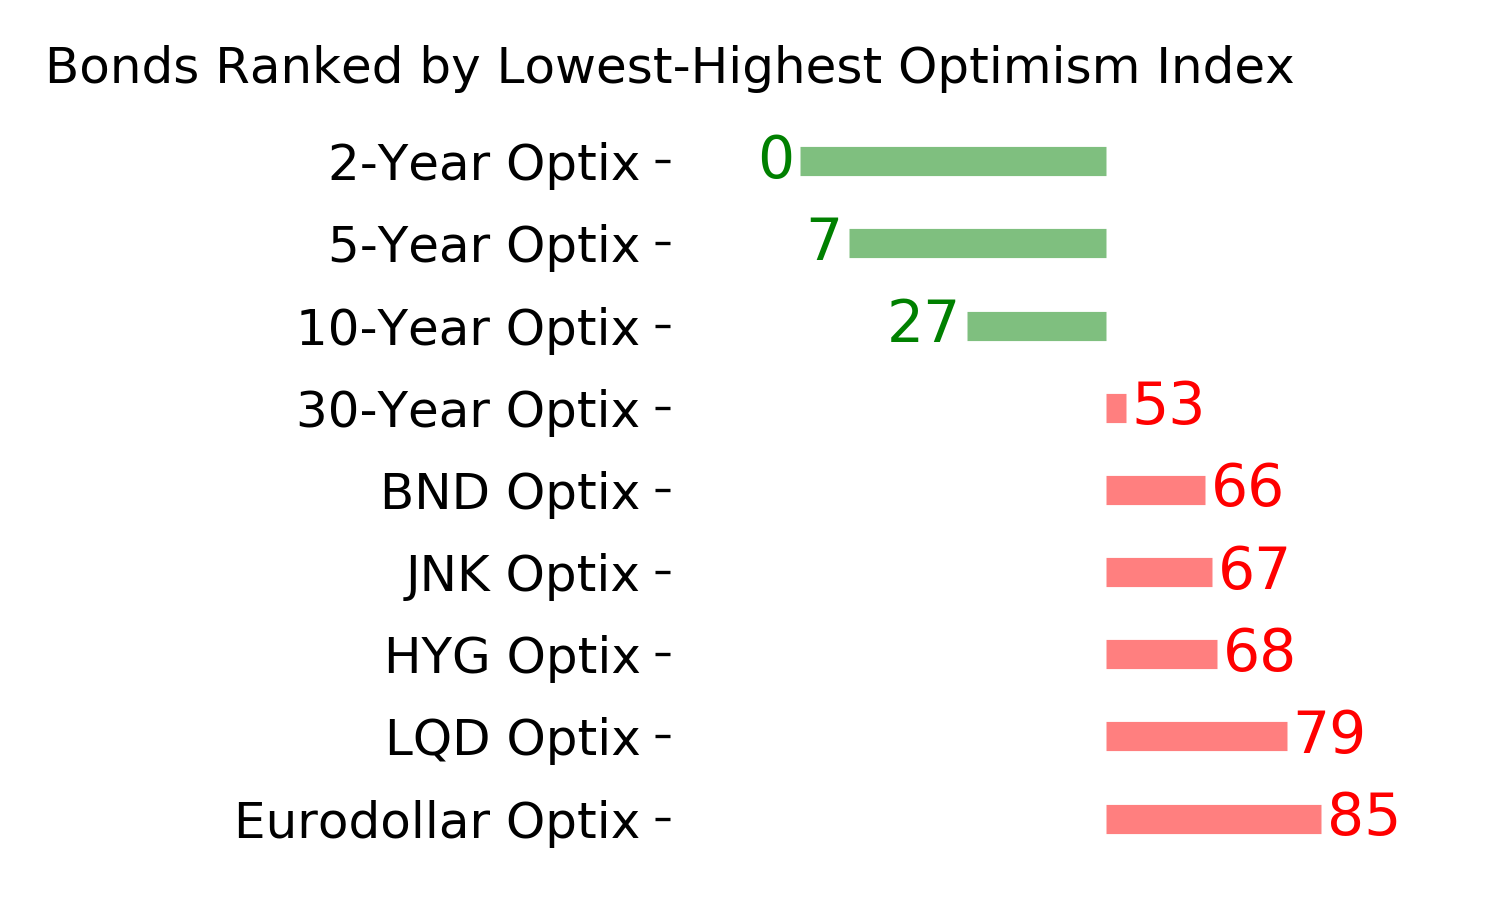
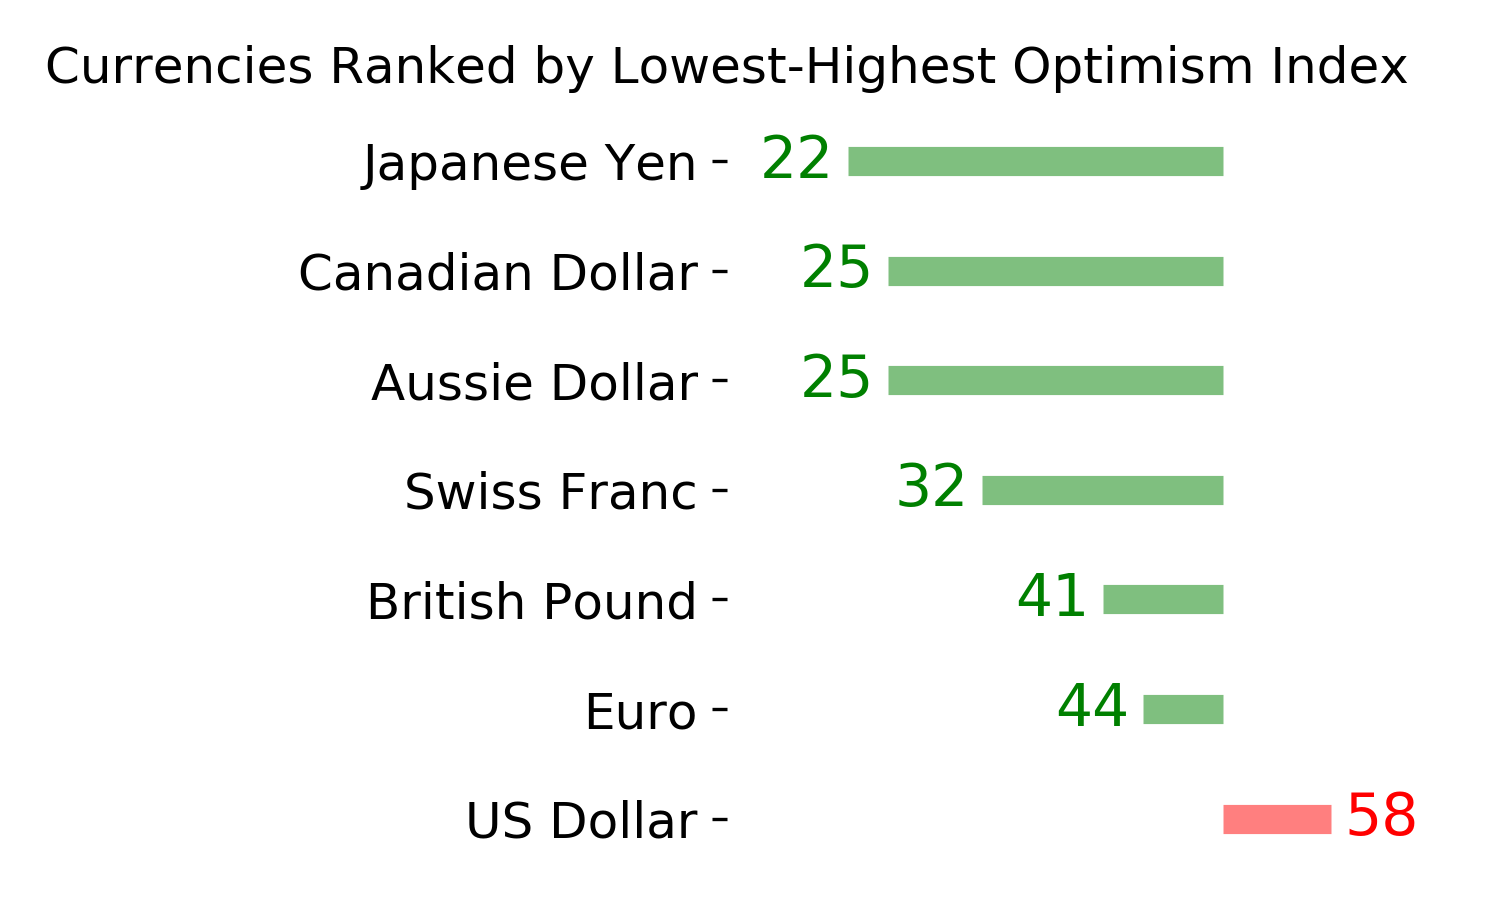
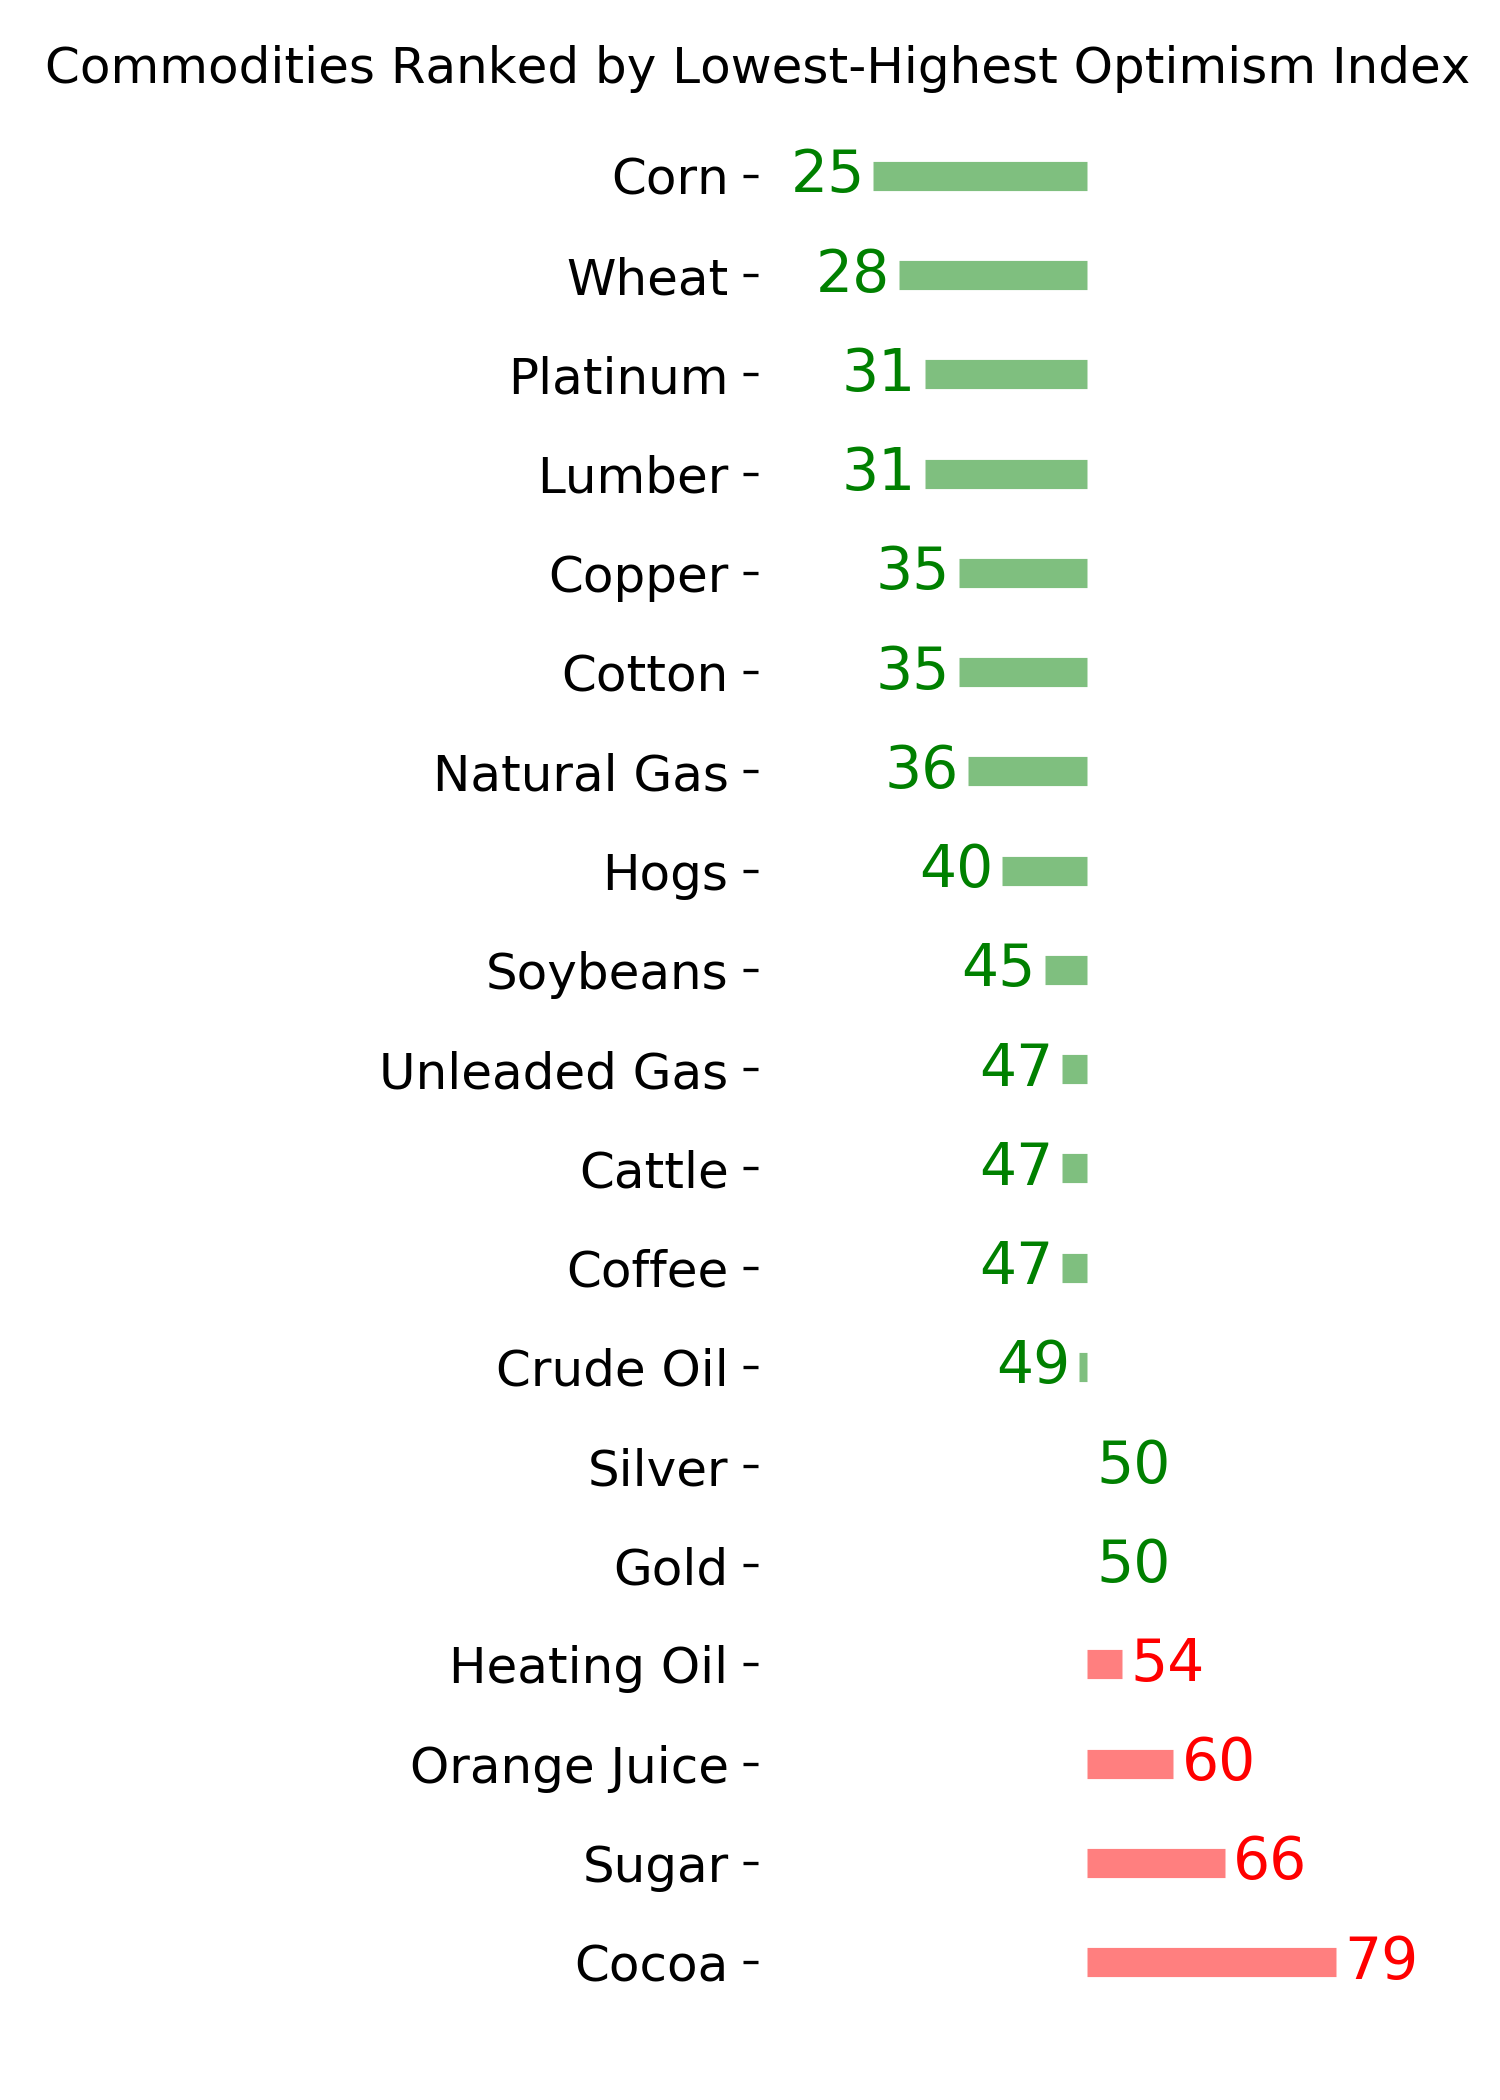
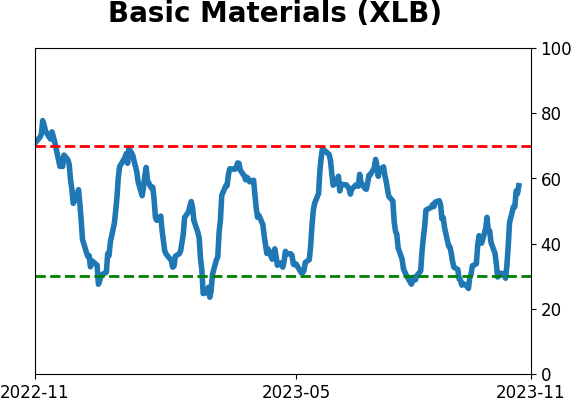
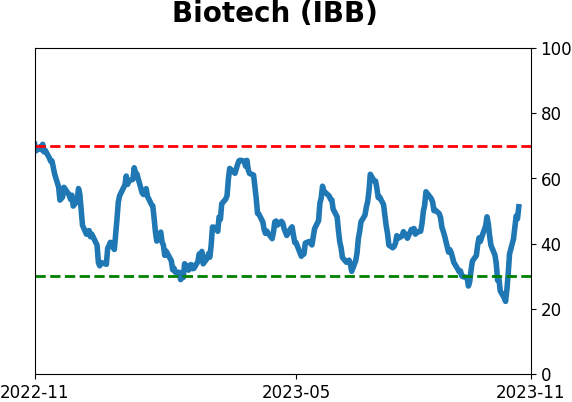
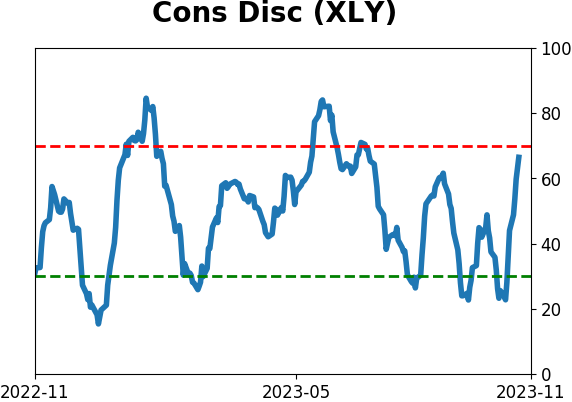
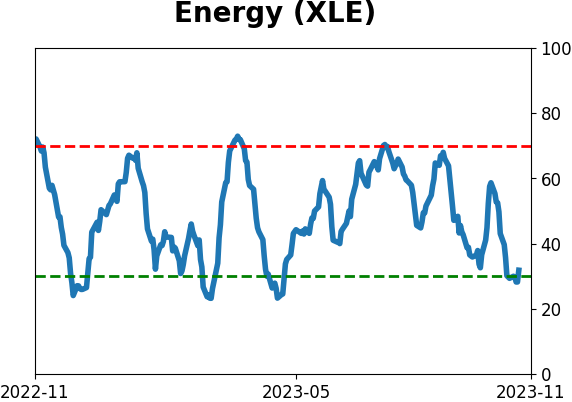
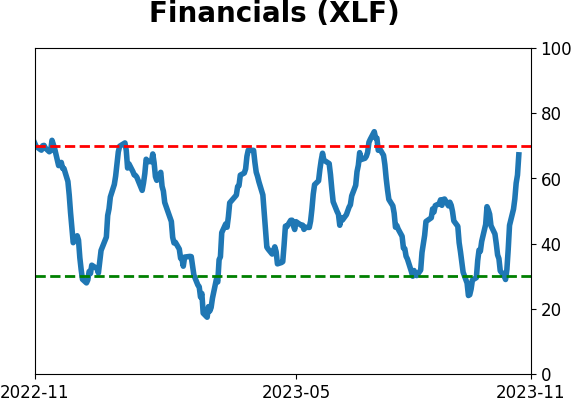
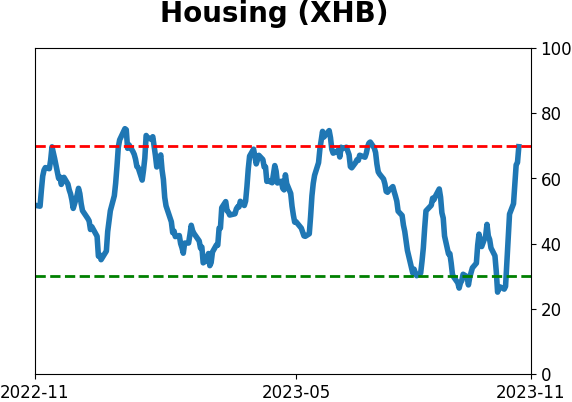
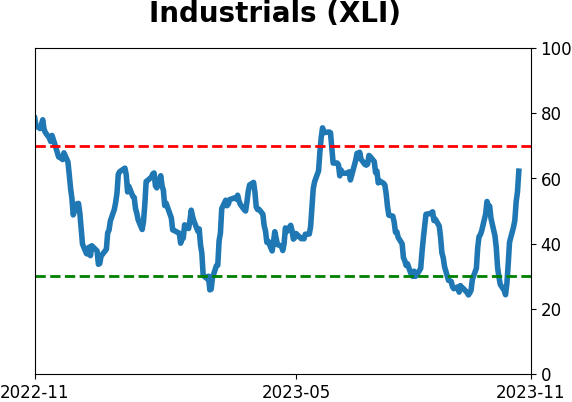
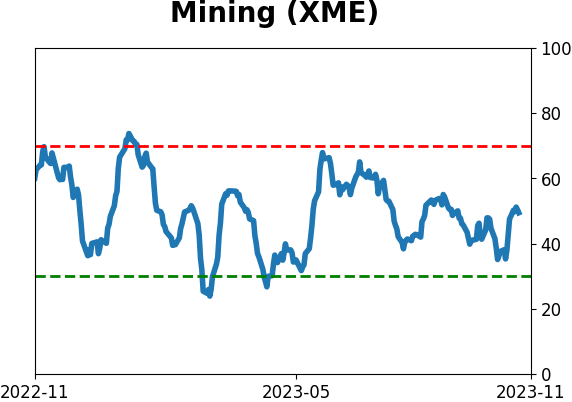
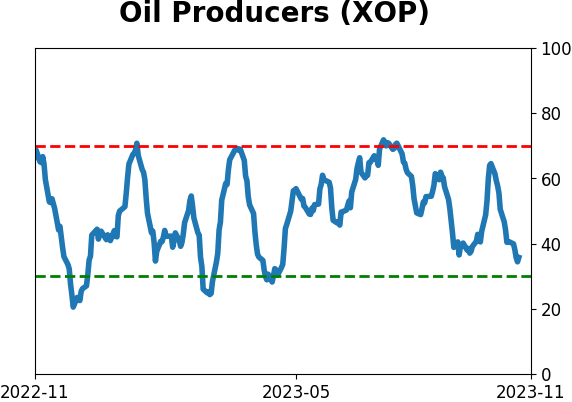
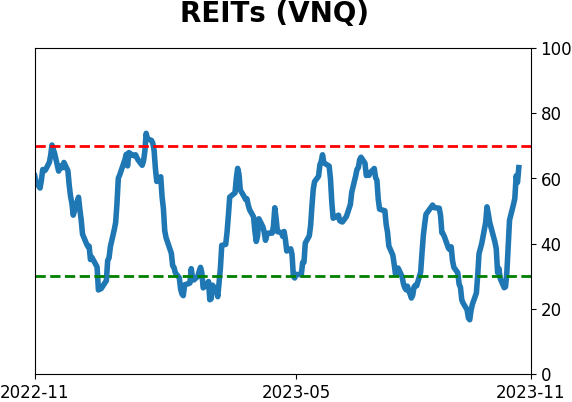
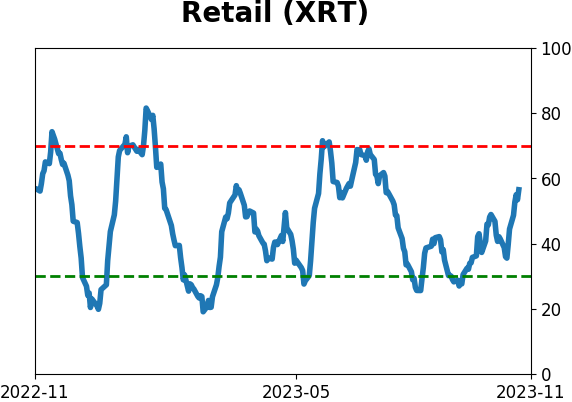
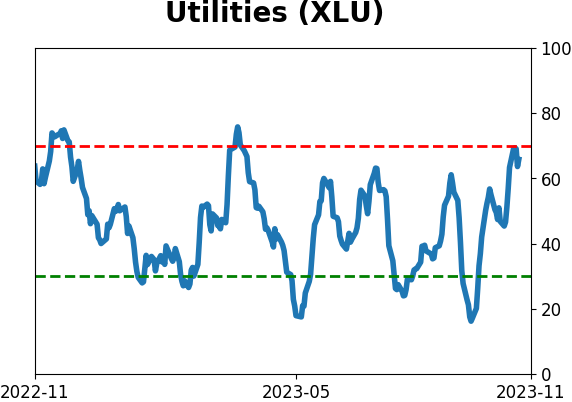
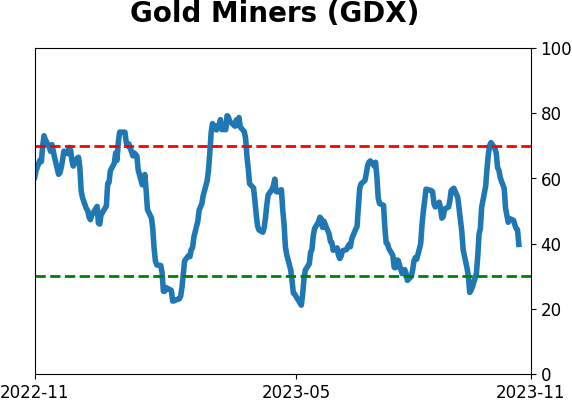
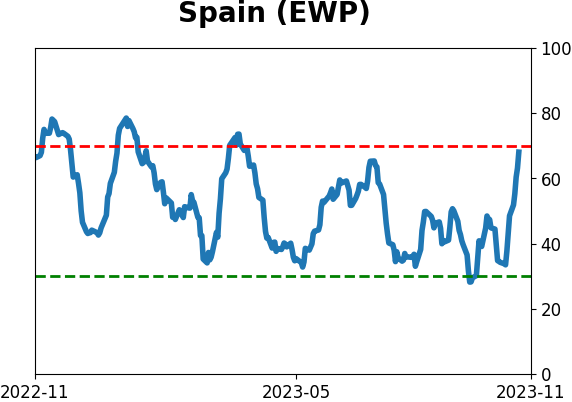
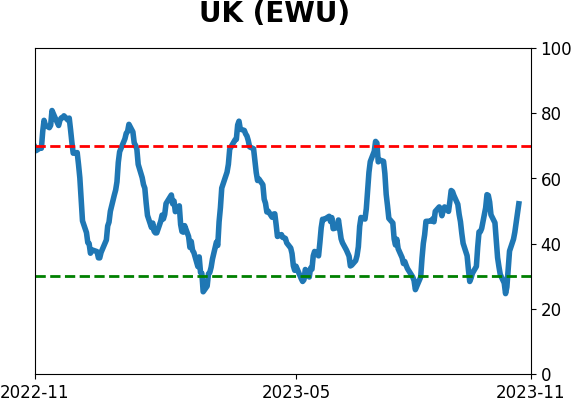
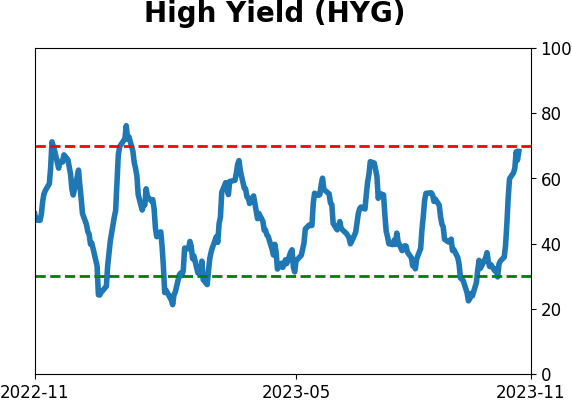
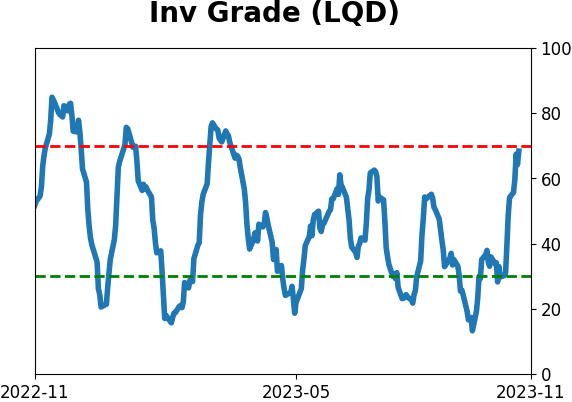
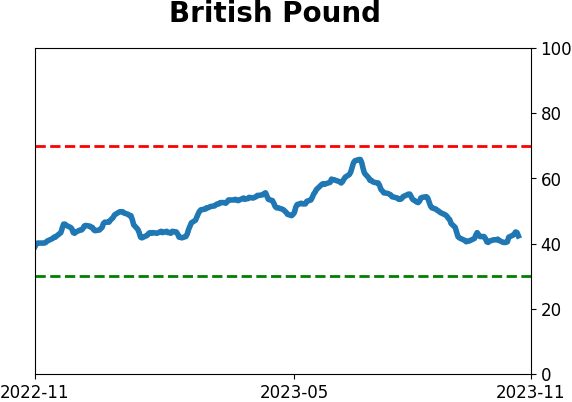
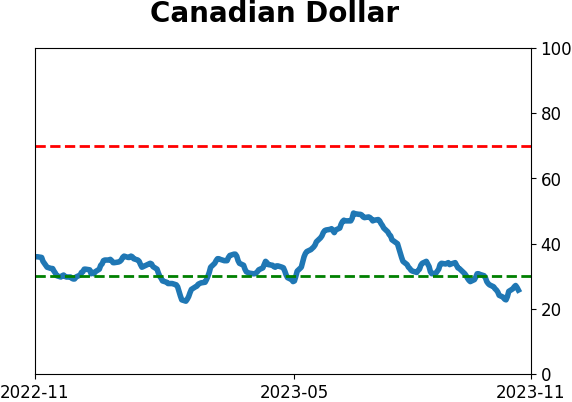
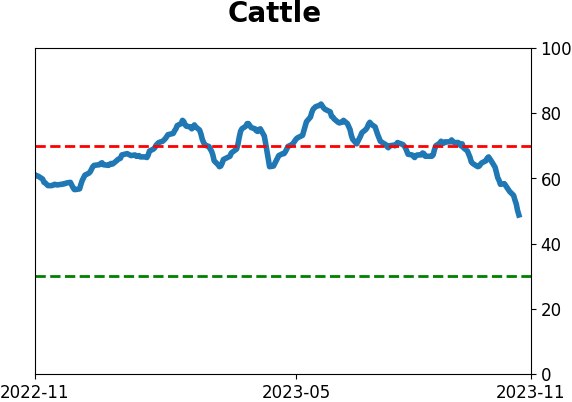
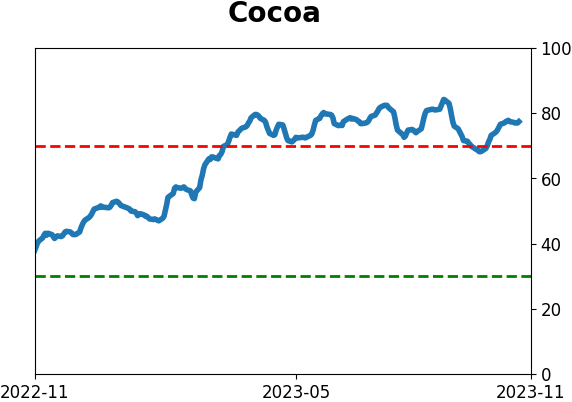
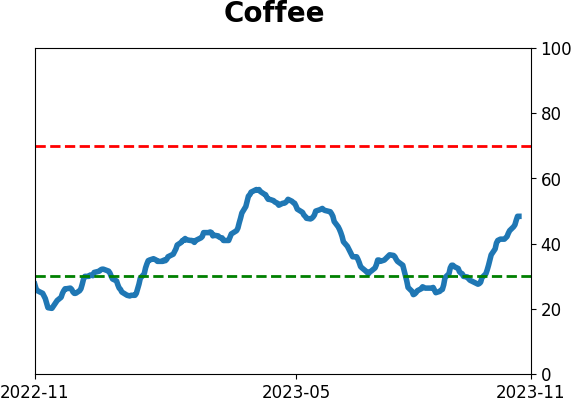
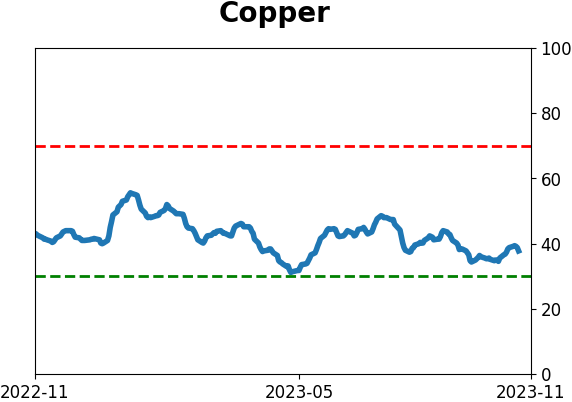
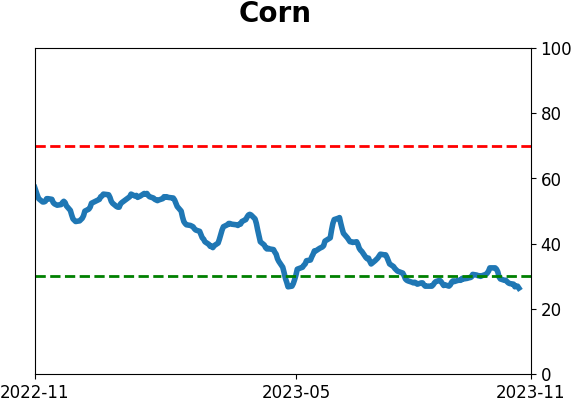
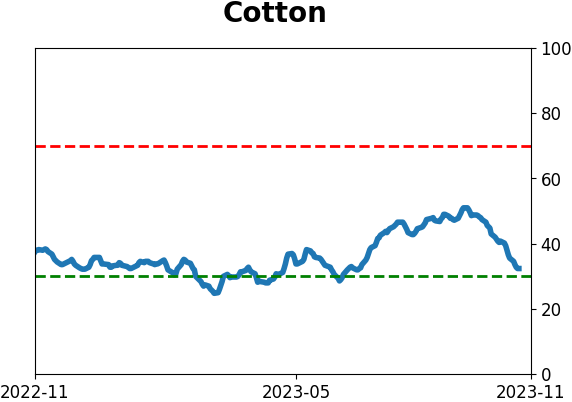
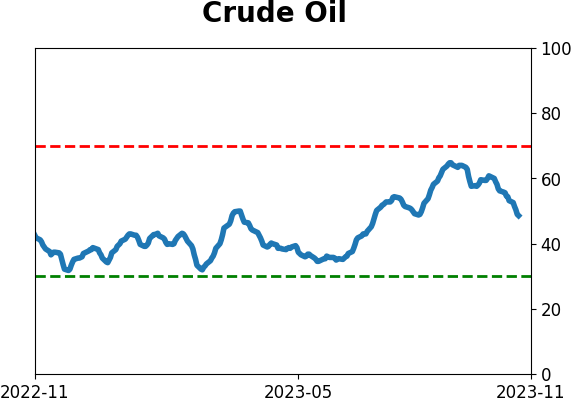
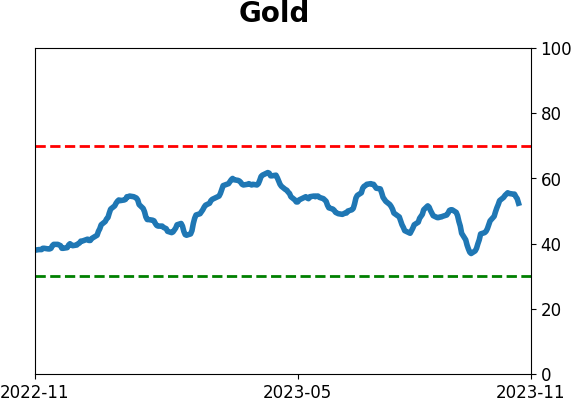
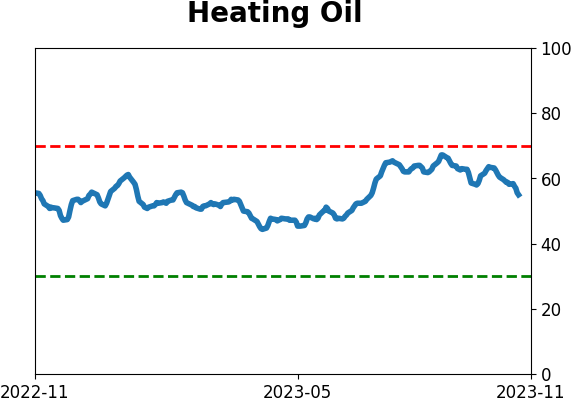
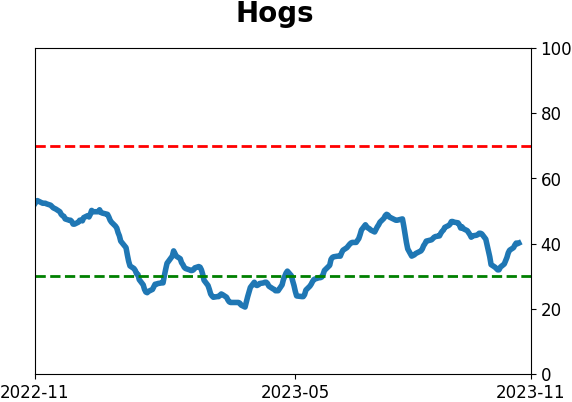
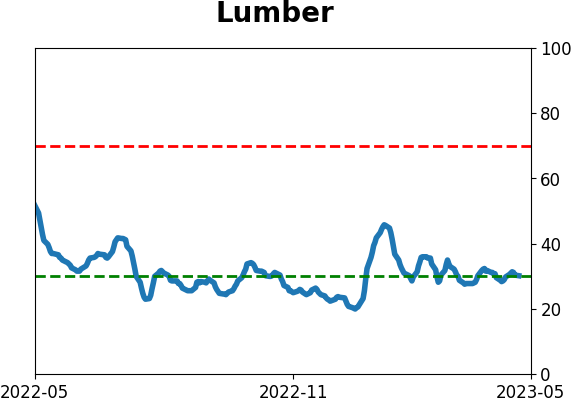
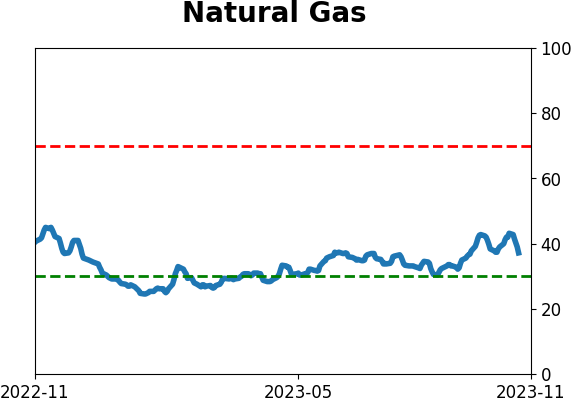
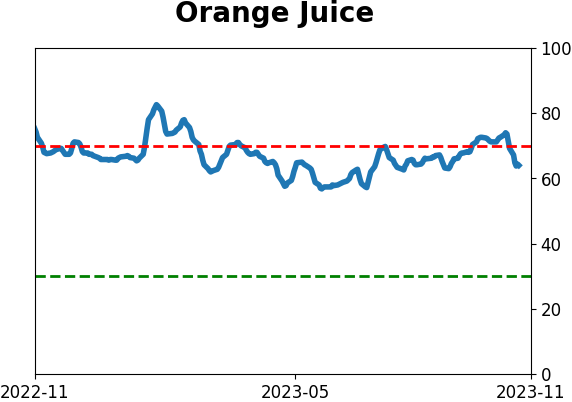
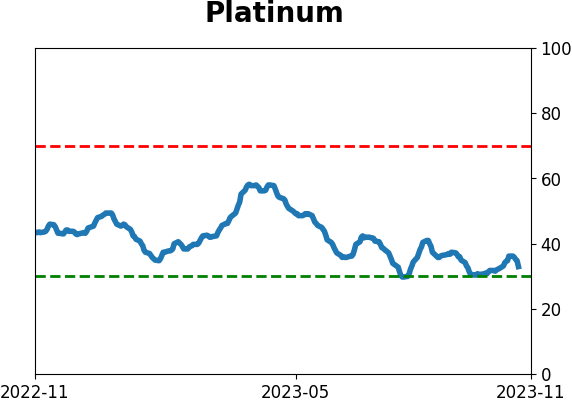
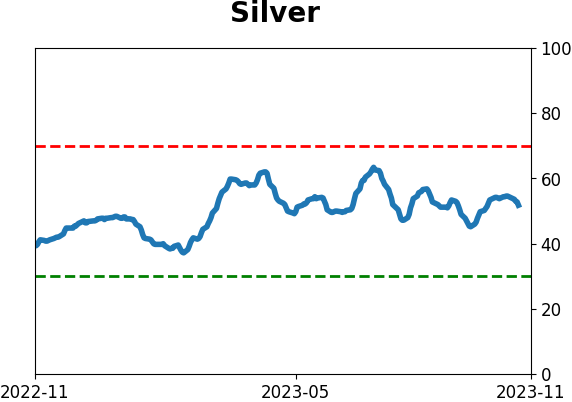
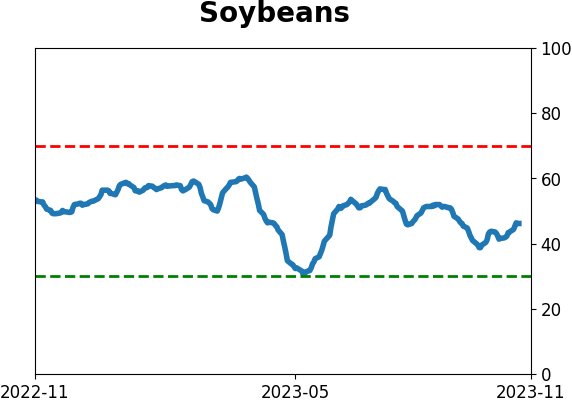
Optimism Index Thumbnails
|
|
|
|
|
|
|
|
|
|
|
|
|
|
|
|
|
|
|
|
|