Headlines
|
|
Why Growth may continue to underperform versus Value:
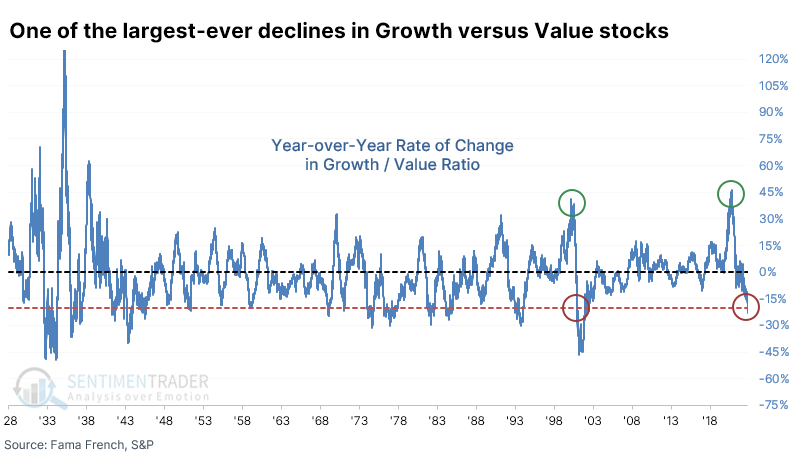
Over the past year, investors have dramatically shifted their preferences away from Growth stocks and toward Value. The ratio between those factors has plunged 20% in a year, one of the largest on record. Similar declines were inconsistently positive for the broader market, but Growth still struggled relative to Value.
|
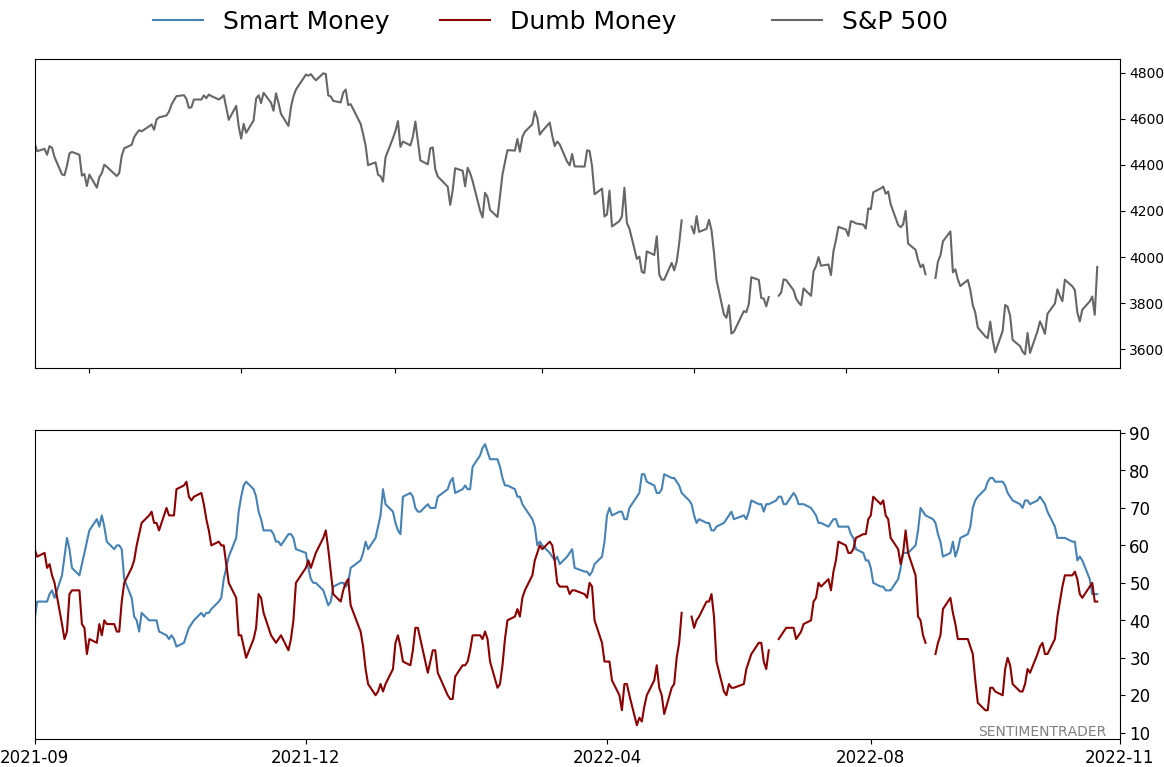
Smart / Dumb Money Confidence
|
Smart Money Confidence: 47%
Dumb Money Confidence: 45%
|
|
Risk Levels
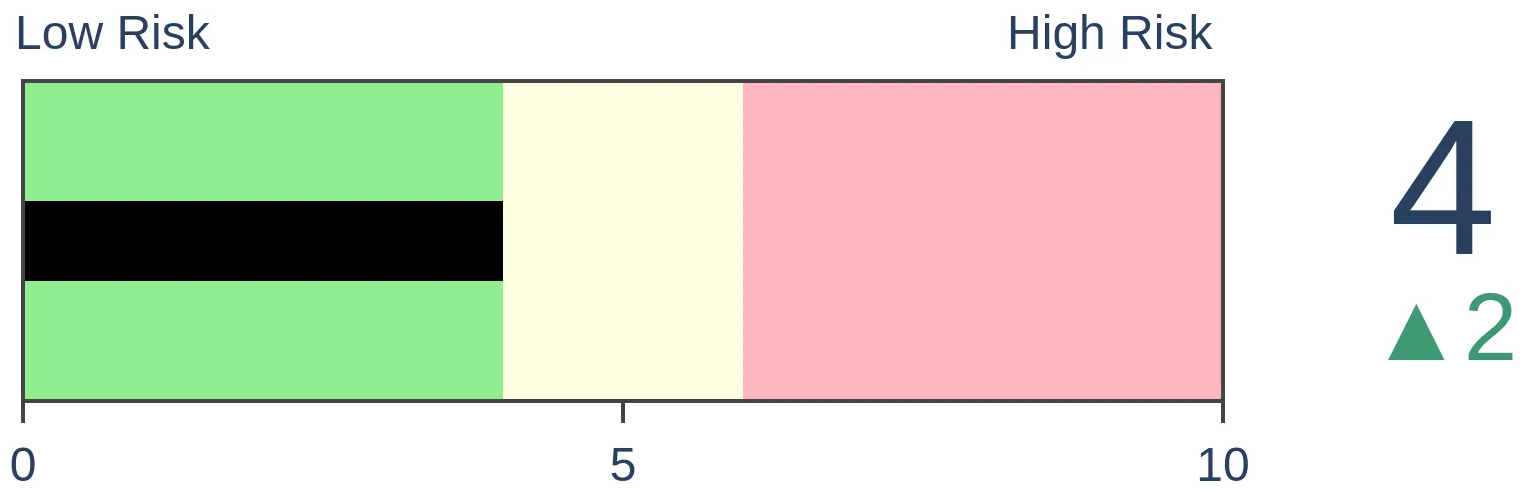
Stocks Short-Term
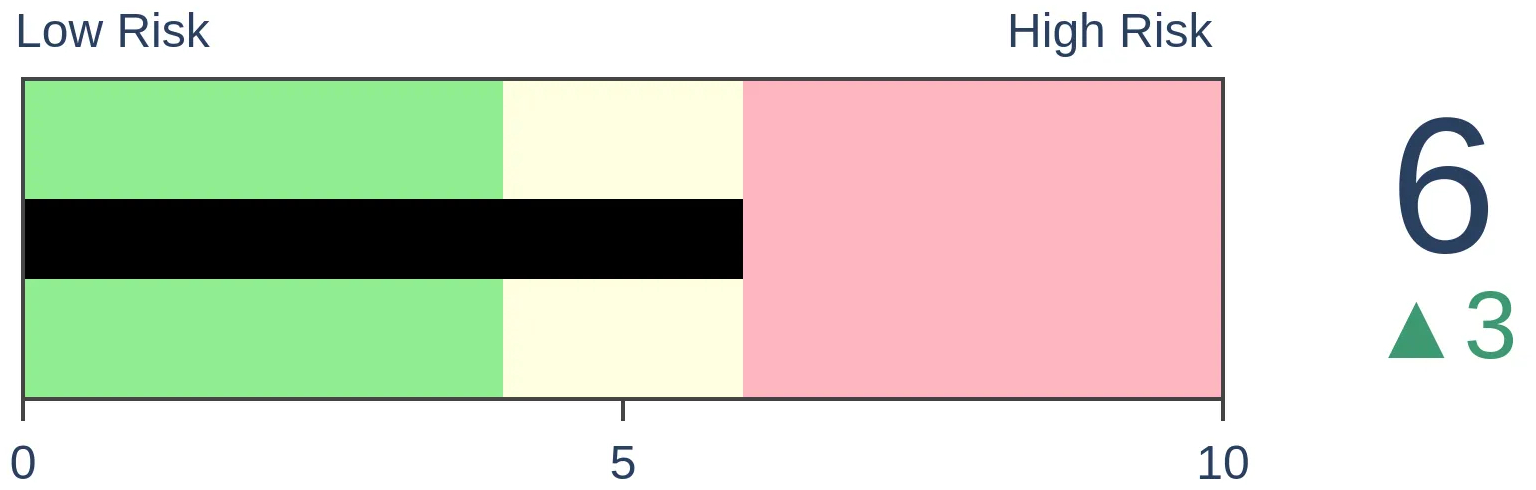
|
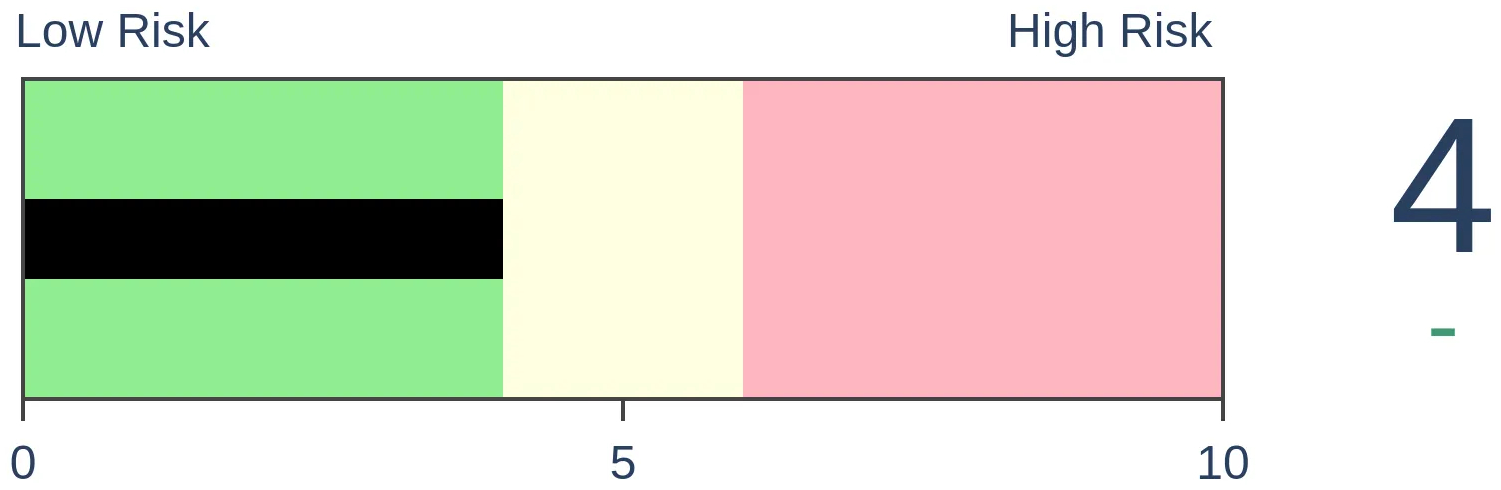
Stocks Medium-Term
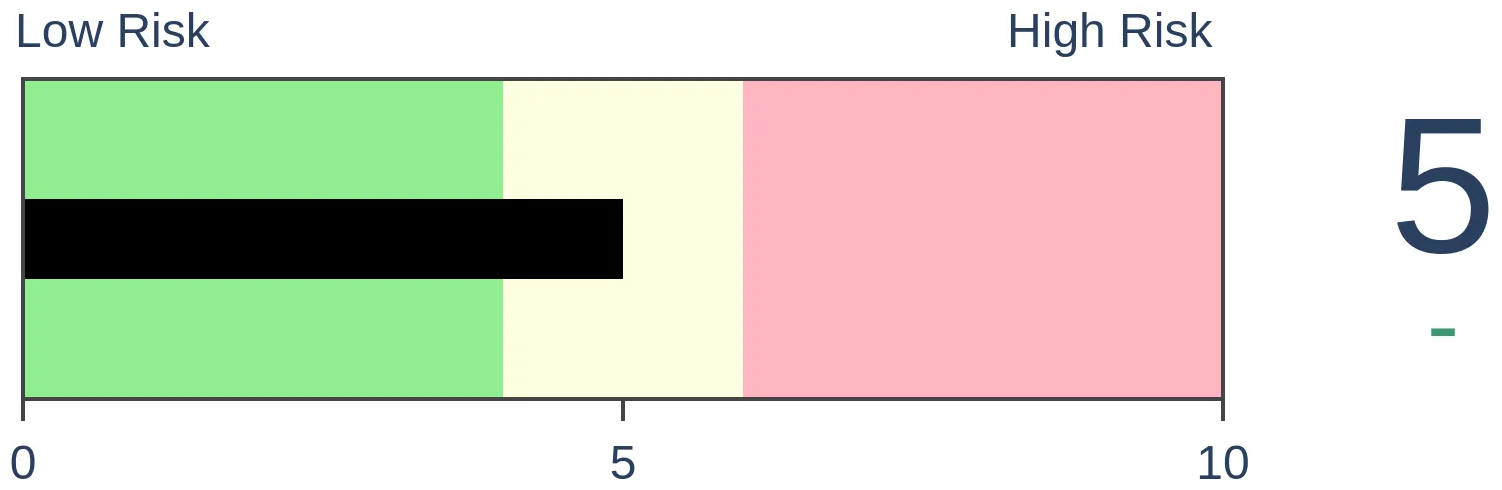
|
|
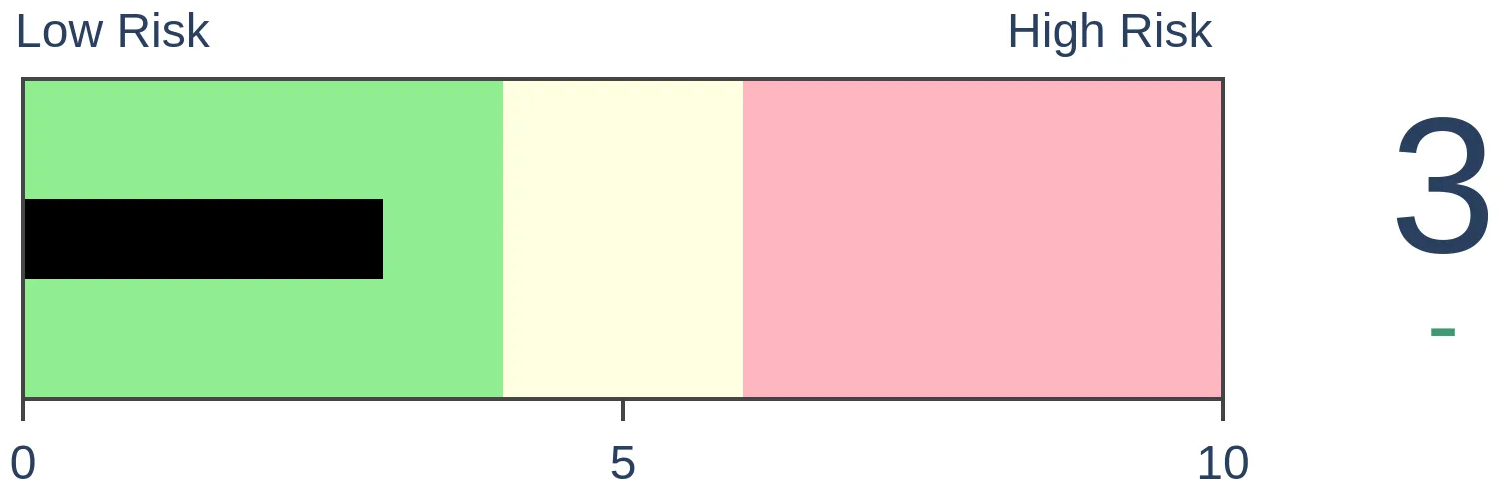
Bonds
|
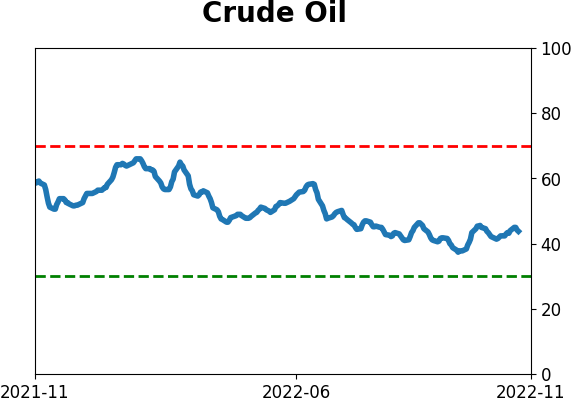
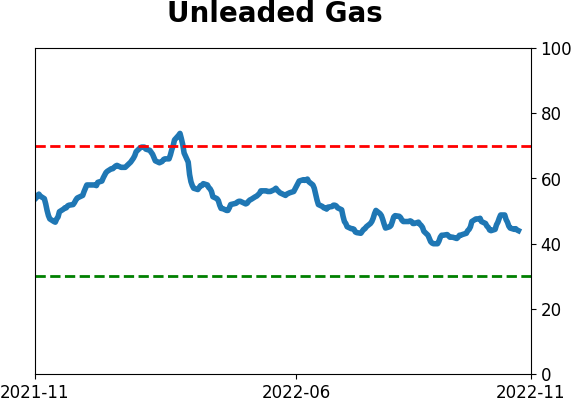
Crude Oil
|
|
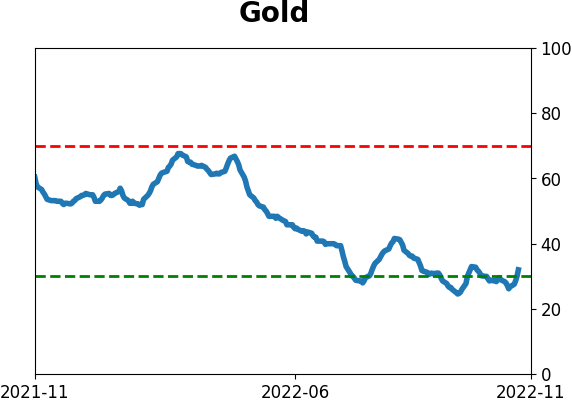
Gold
|
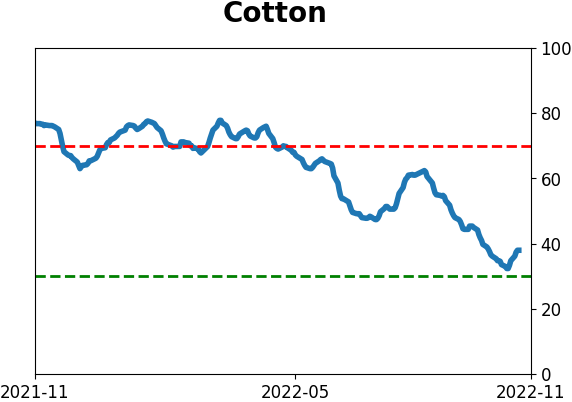
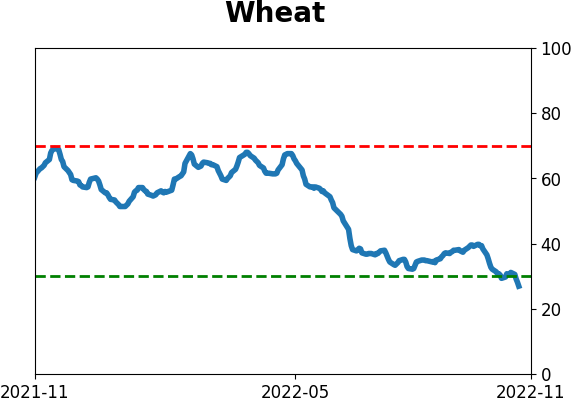
Agriculture

|
|
Research
By Jason Goepfert
BOTTOM LINE
Over the past year, investors have dramatically shifted their preferences away from Growth stocks and toward Value. The ratio between those factors has plunged 20% in a year, one of the largest on record. Similar declines were inconsistently positive for the broader market, but Growth still struggled relative to Value.
FORECAST / TIMEFRAME
None
|
Key points:
- The ratio of Growth to Value stocks has plunged more than 20% over the past year
- The only other time in 80 years with a similar cycle was late in the year 2000
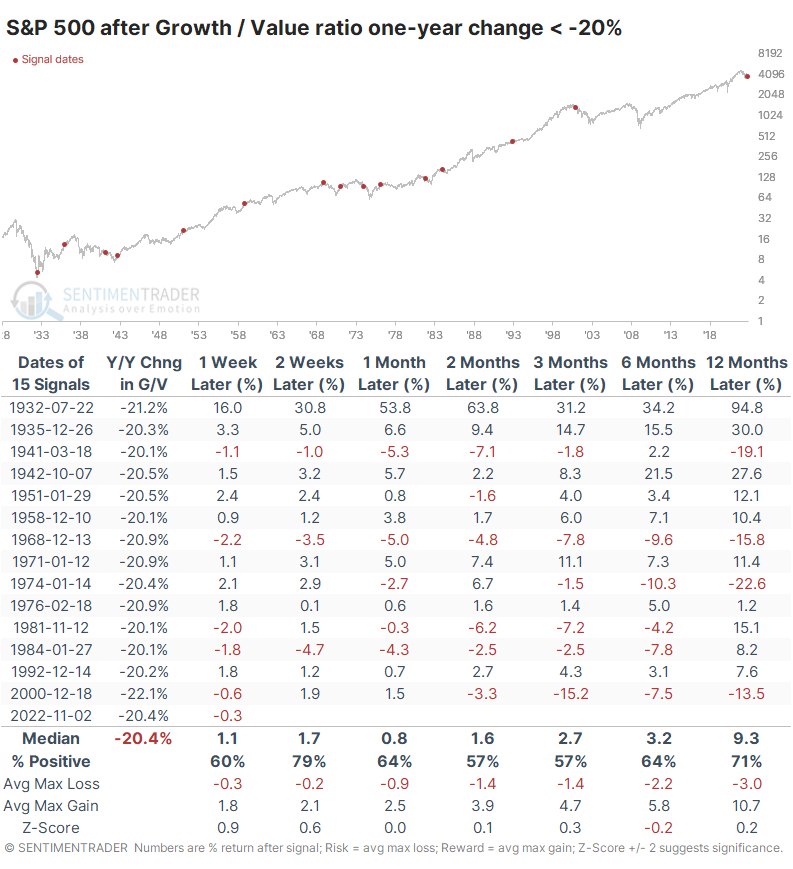
- Historically, big drops between the factors were okay for the broader market, but Growth stocks struggled
Investors have dramatically shifted their preferences
Thanks to a jump in interest rates, investors have fled from pretty much anything growth-related and shifted to companies making "things" and throwing off cash.
The ratio of the total return in the Growth factor versus Value has therefore plunged over the past year. It's one of the most dramatic shifts in investor preferences in 30 years. With a soft CPI print, this relationship will likely rebound some, but the long-term trend is clear.
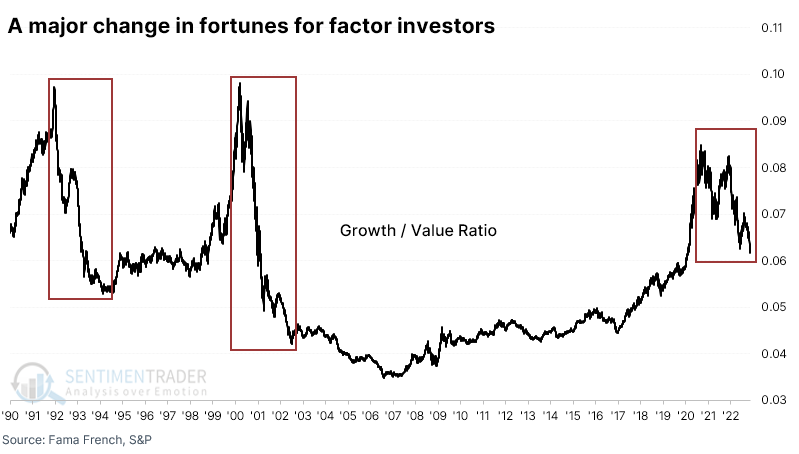
There have been a handful of larger one-year shifts since 1928, but a 20% decline between the factors is historically significant. It's chilling to note that the only other time in 80 years when the rate of change cycled from above +40% to below -20% was in December 2000, as the internet bubble got pricked.
Big shifts in preferences weren't always bad, but Growth struggled
That 2000 precedent preceded some nasty months for the most benchmarked index in the world. But other times when the Growth / Value Ratio fell 20% or more for the first time in a year did not necessarily lead to similar outcomes. It led to terrible returns in 1941, 1969, and 1974, but that's about it.
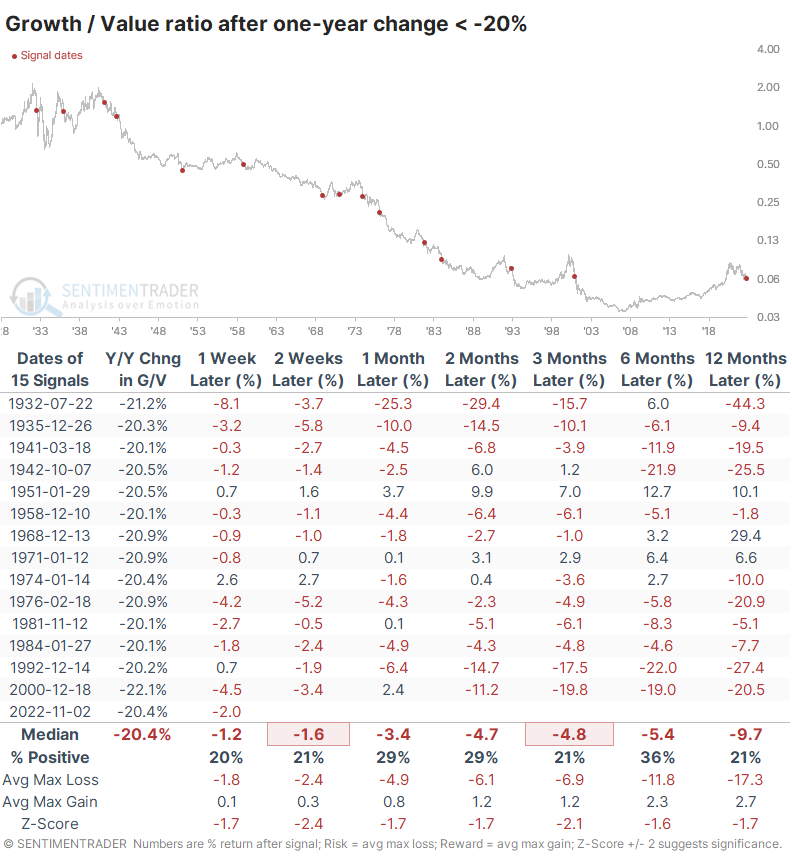
More tellingly, dramatic declines in the ratio were not effective contrary signals.
When a drastic shift in preferences hit Growth stocks, they tended to keep underperforming relative to Value. Over the next three months, the ratio increased only 3 times out of 15 attempts, and the underperformance was significant. Over the next year, the ratio declined by nearly 10% on average.
What the research tells us...
Whenever we see an extreme move in a market on an absolute or relative basis, it's a natural instinct to think it's automatically a contrary indicator. The urge to assume mean-reversion is strong. With these particular factors, though, such drastic changes in investor preferences have tended to keep going in the direction of the change. That bodes ill for investors assuming that the resurgence in Value stocks is likely to be temporary.
Indicators at Extremes
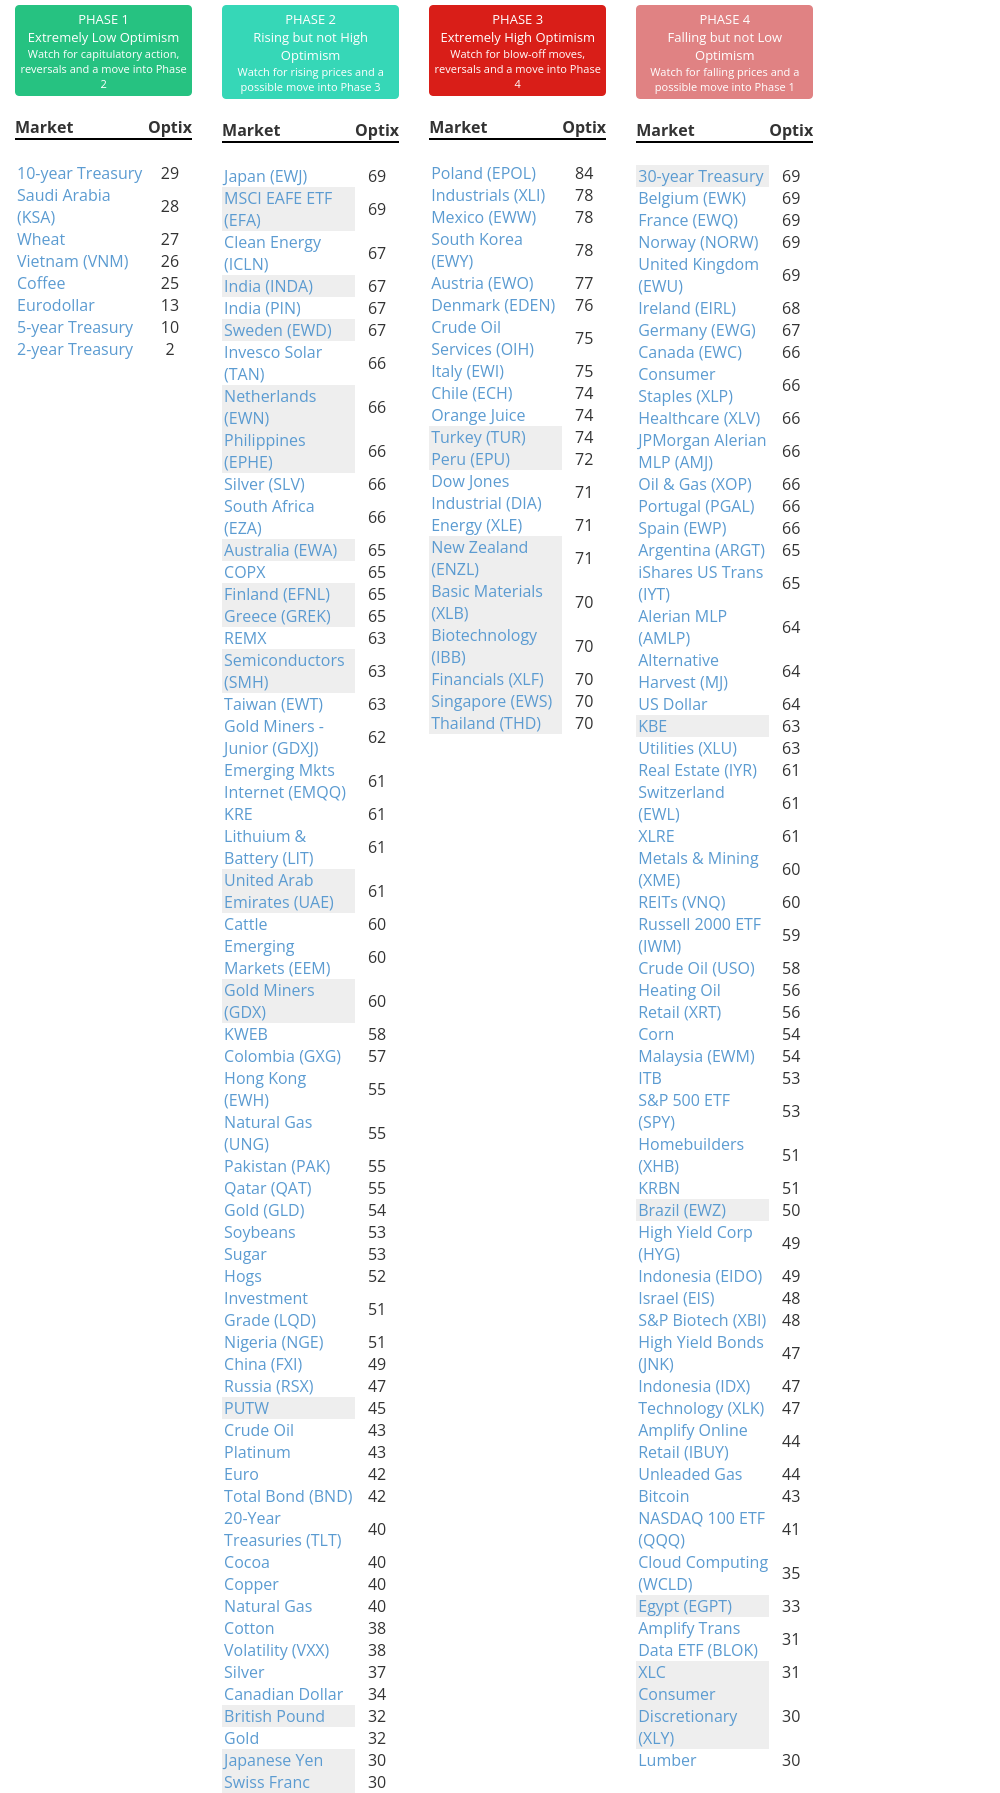
Phase Table
Ranks
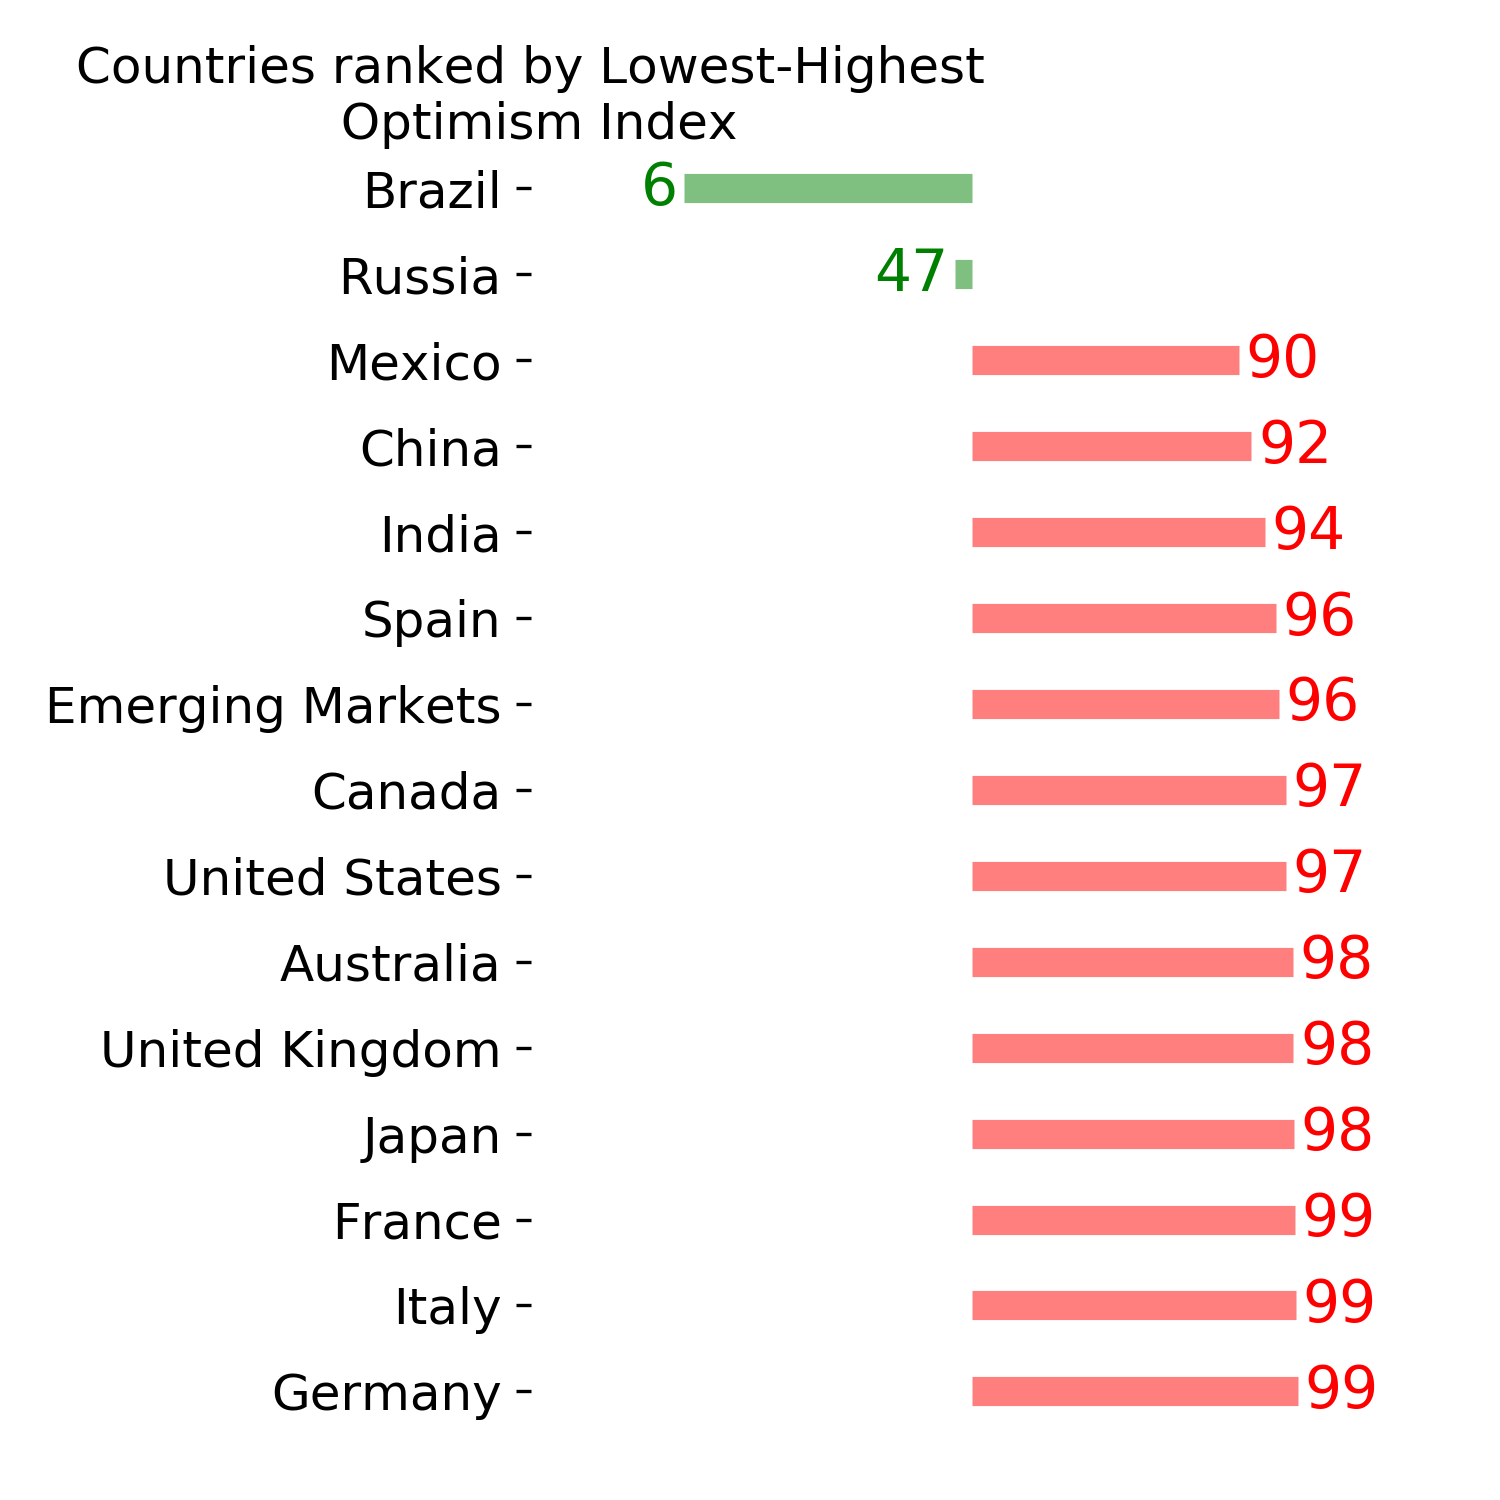
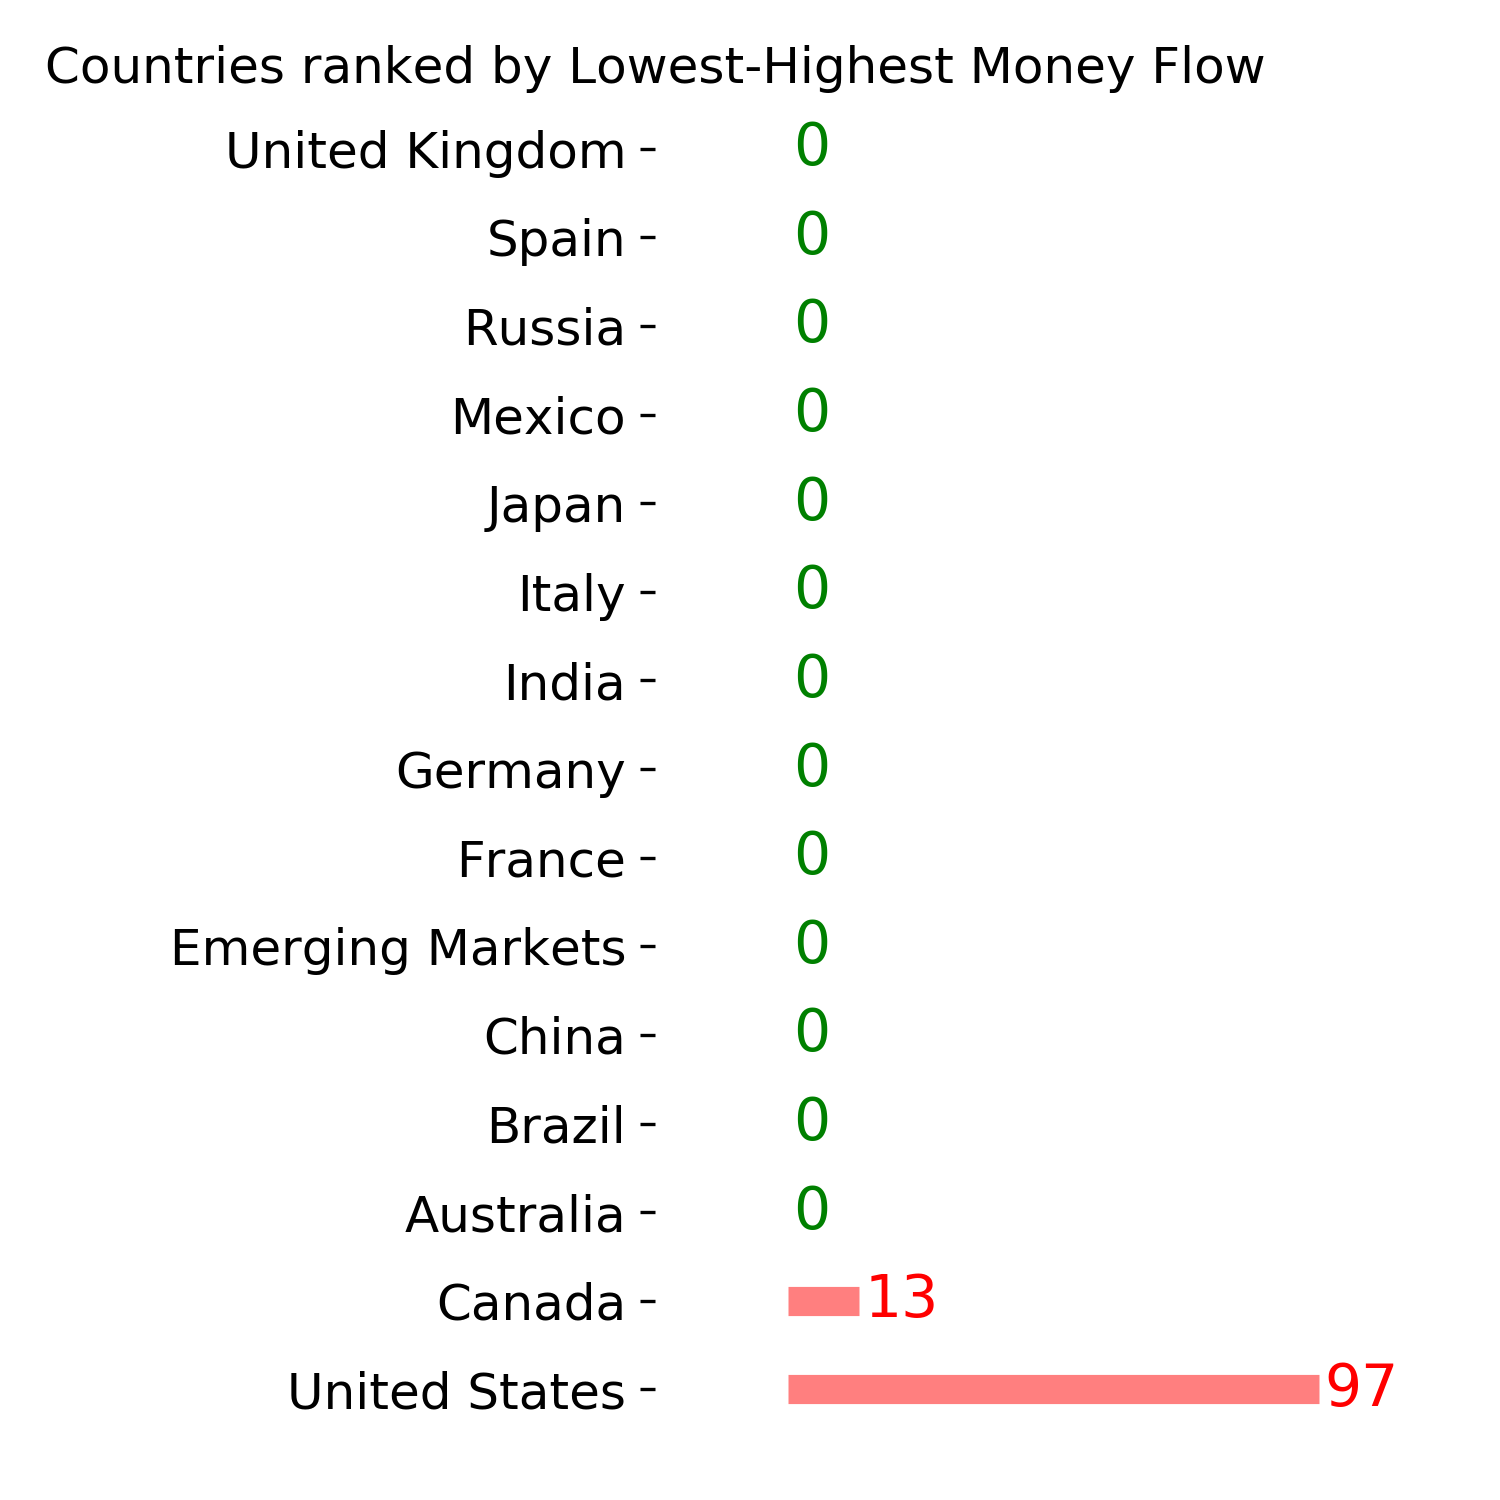
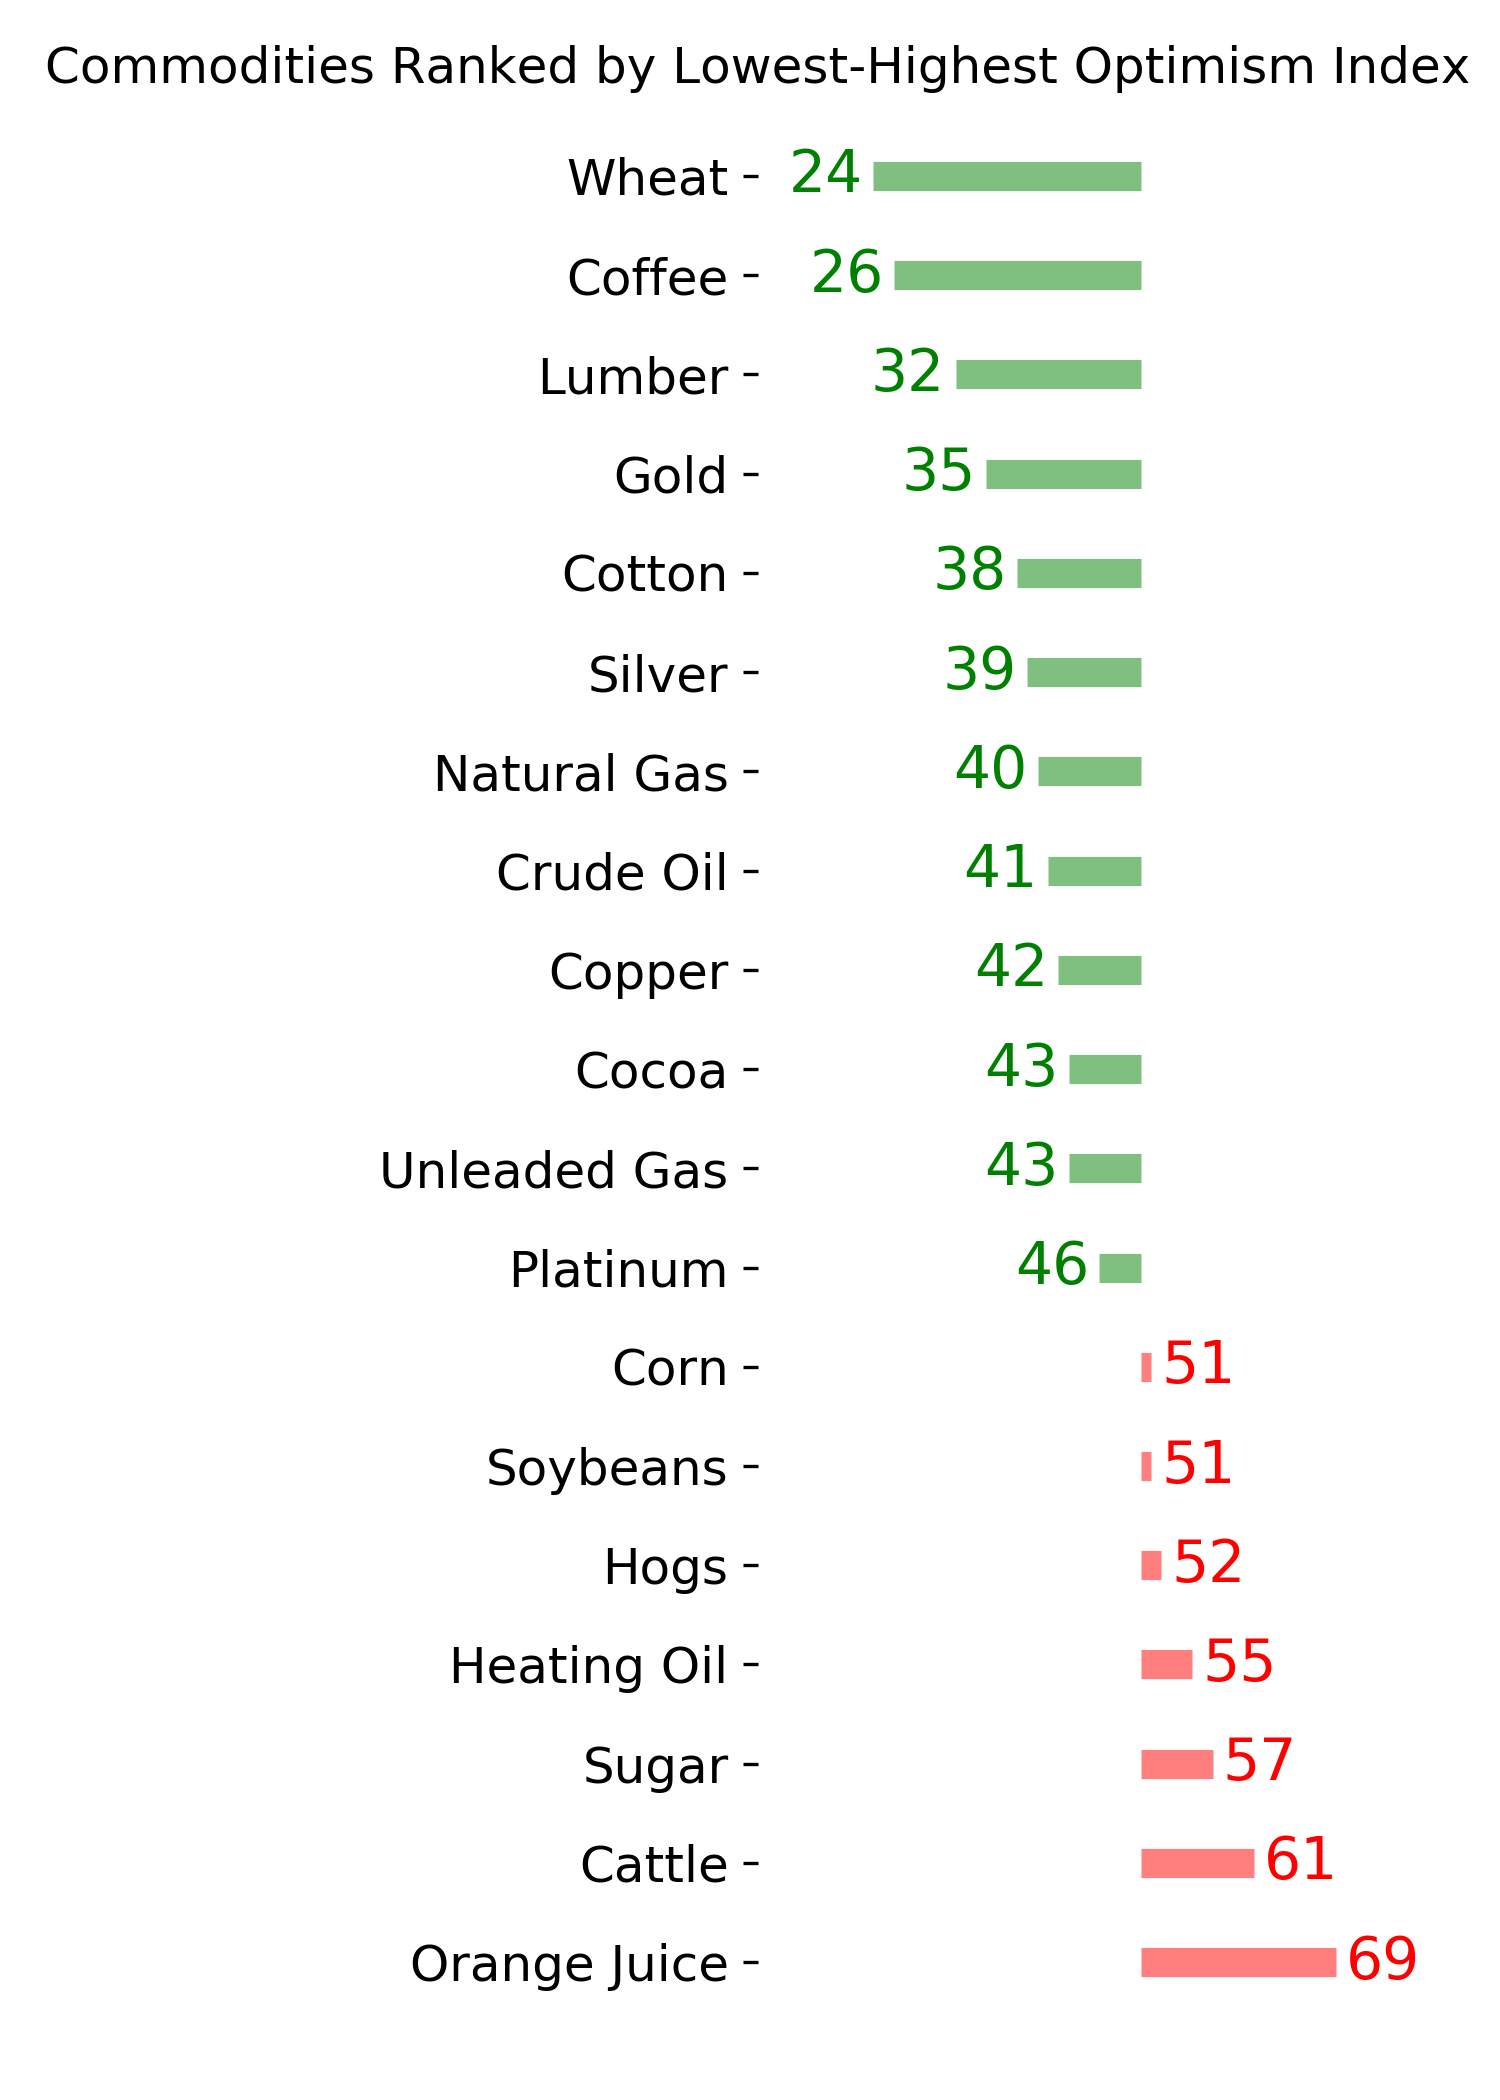
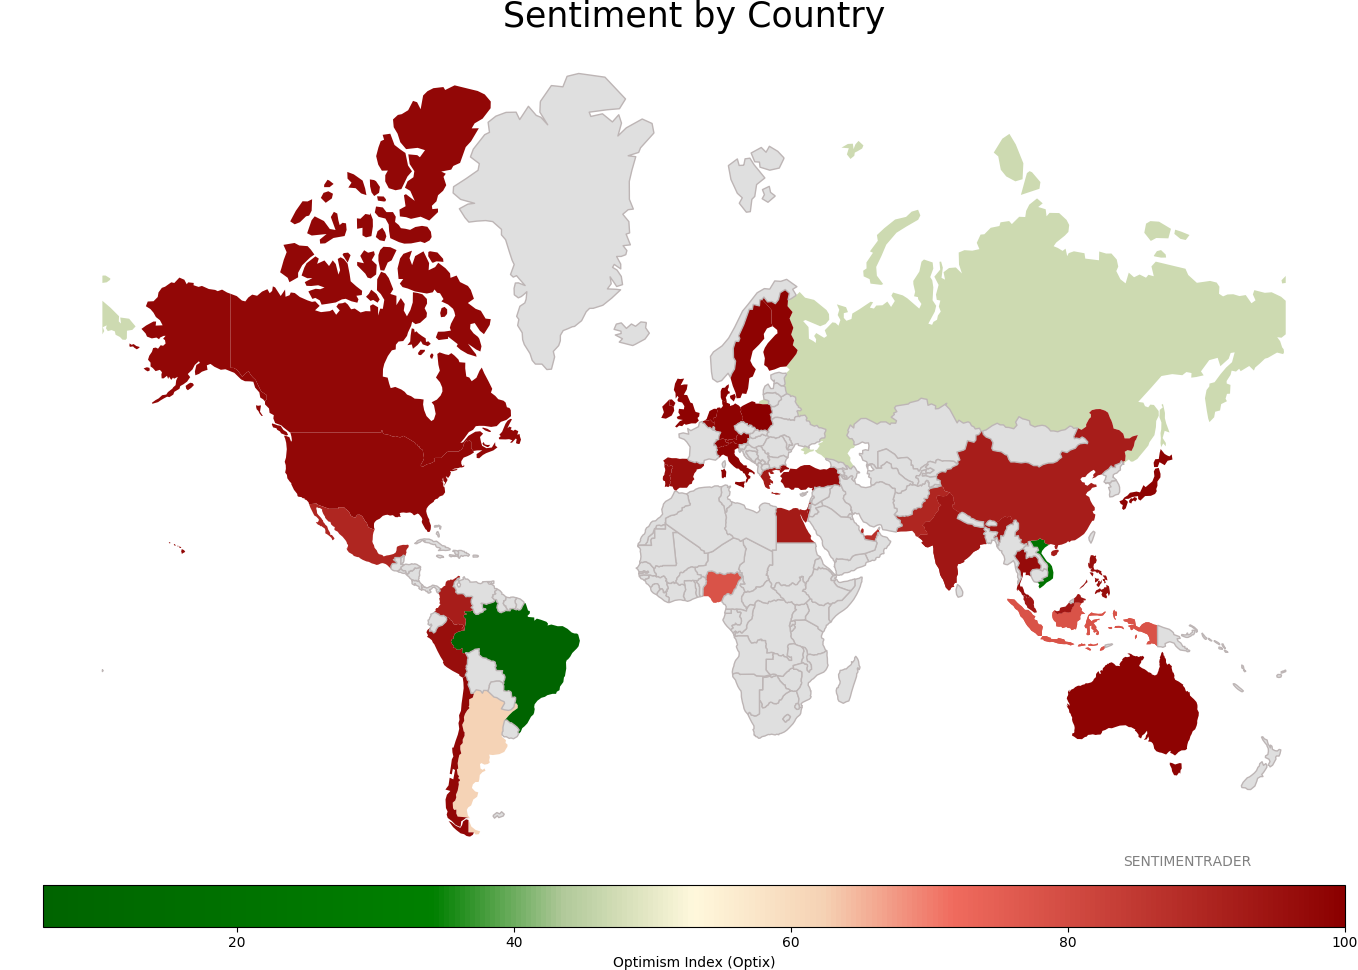
Sentiment Around The World
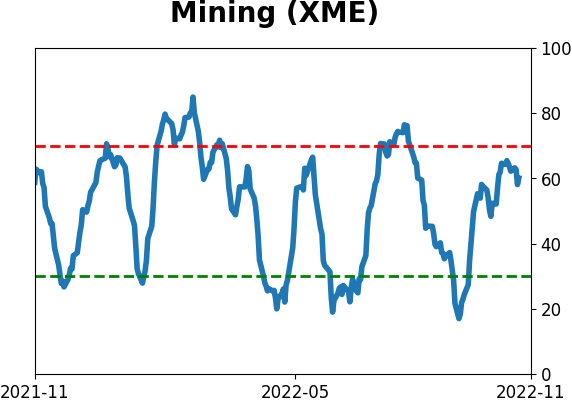
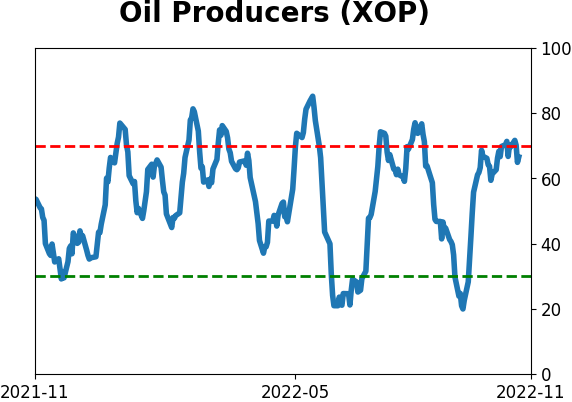
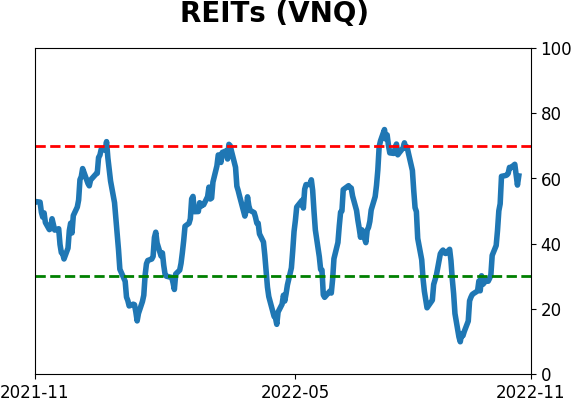
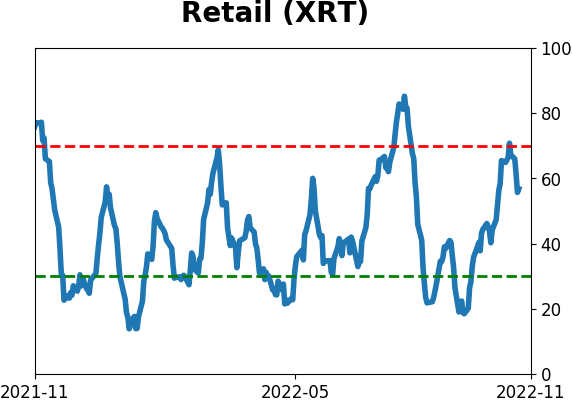
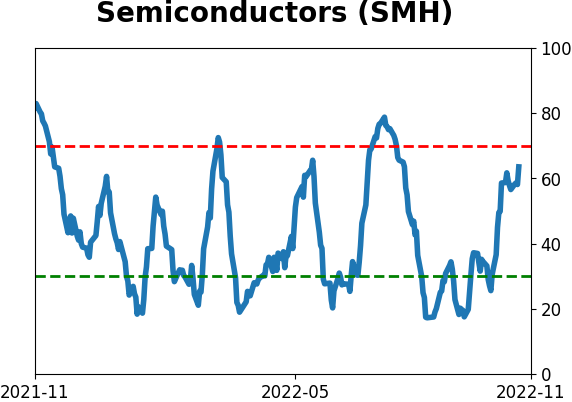
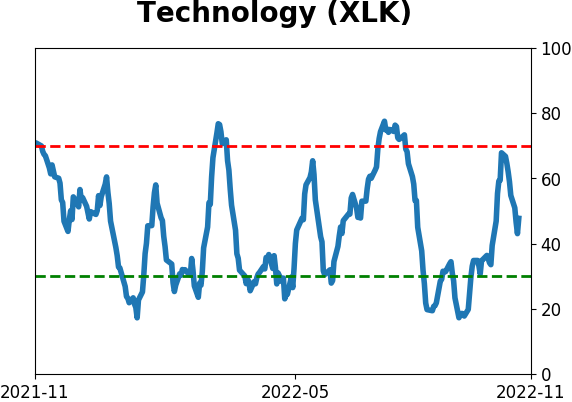
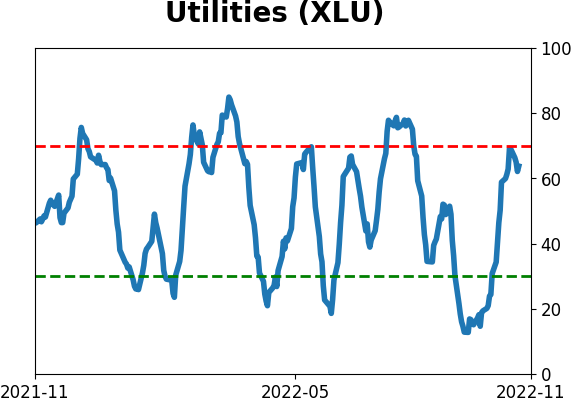
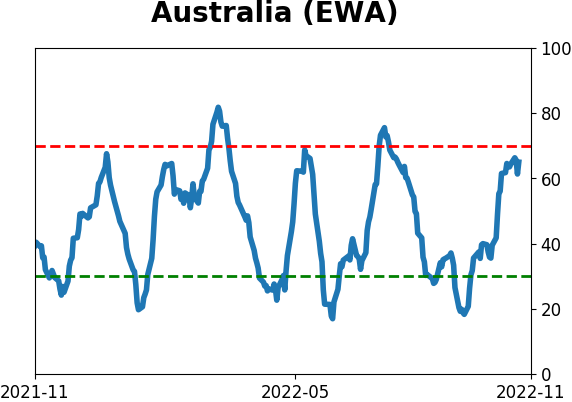
Optimism Index Thumbnails
|
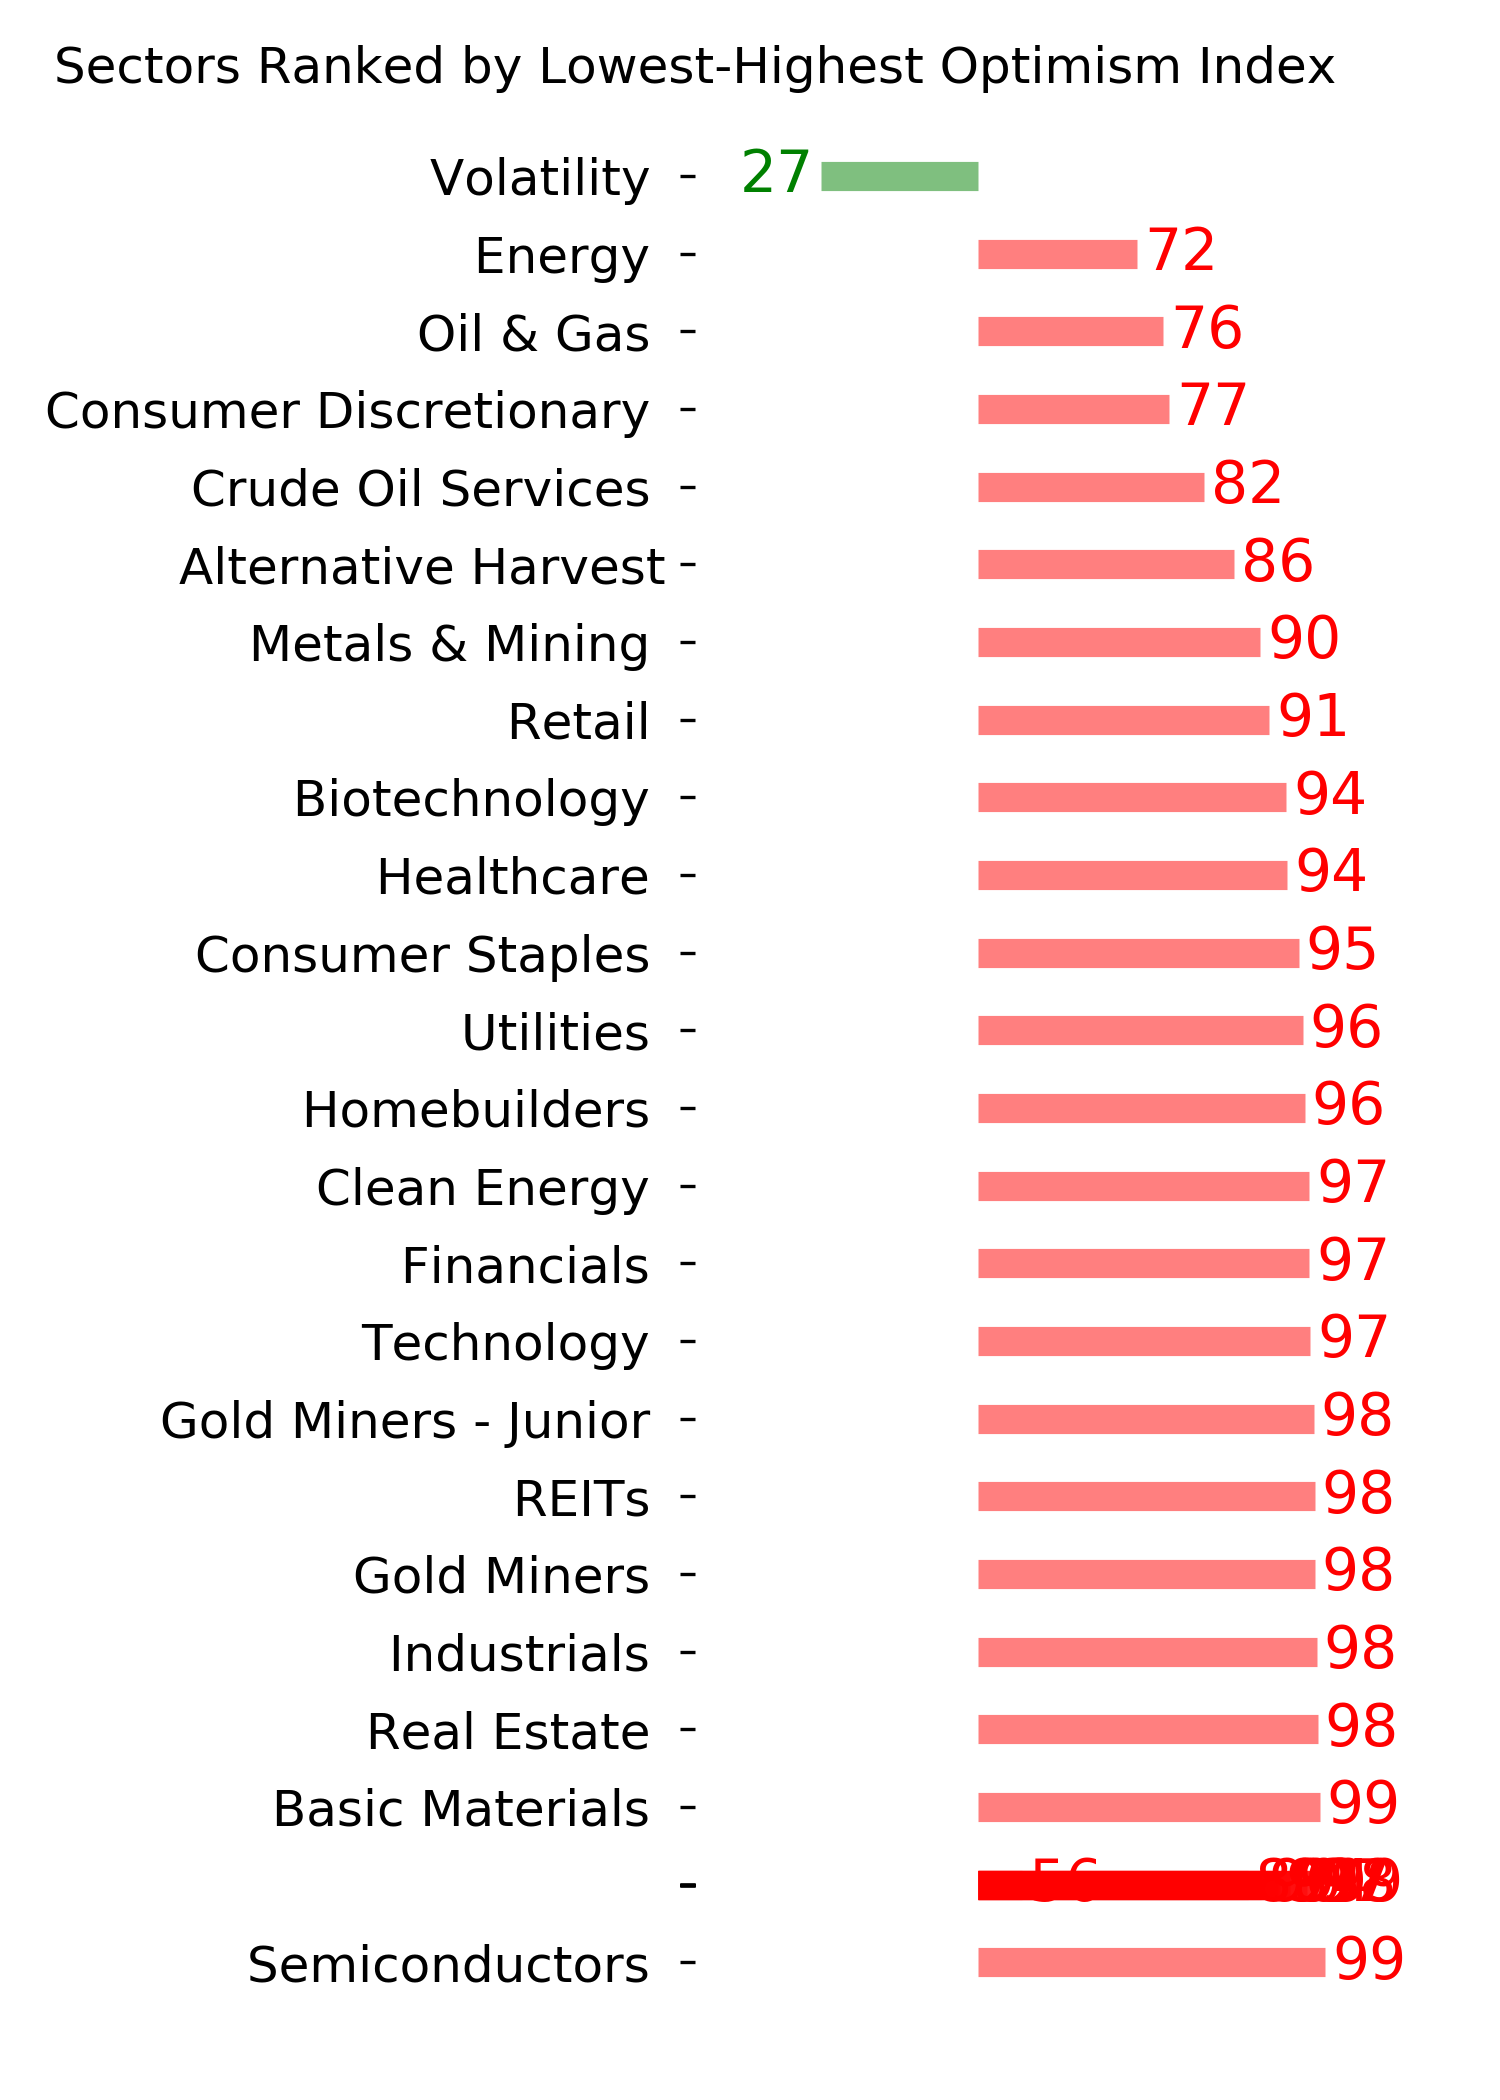
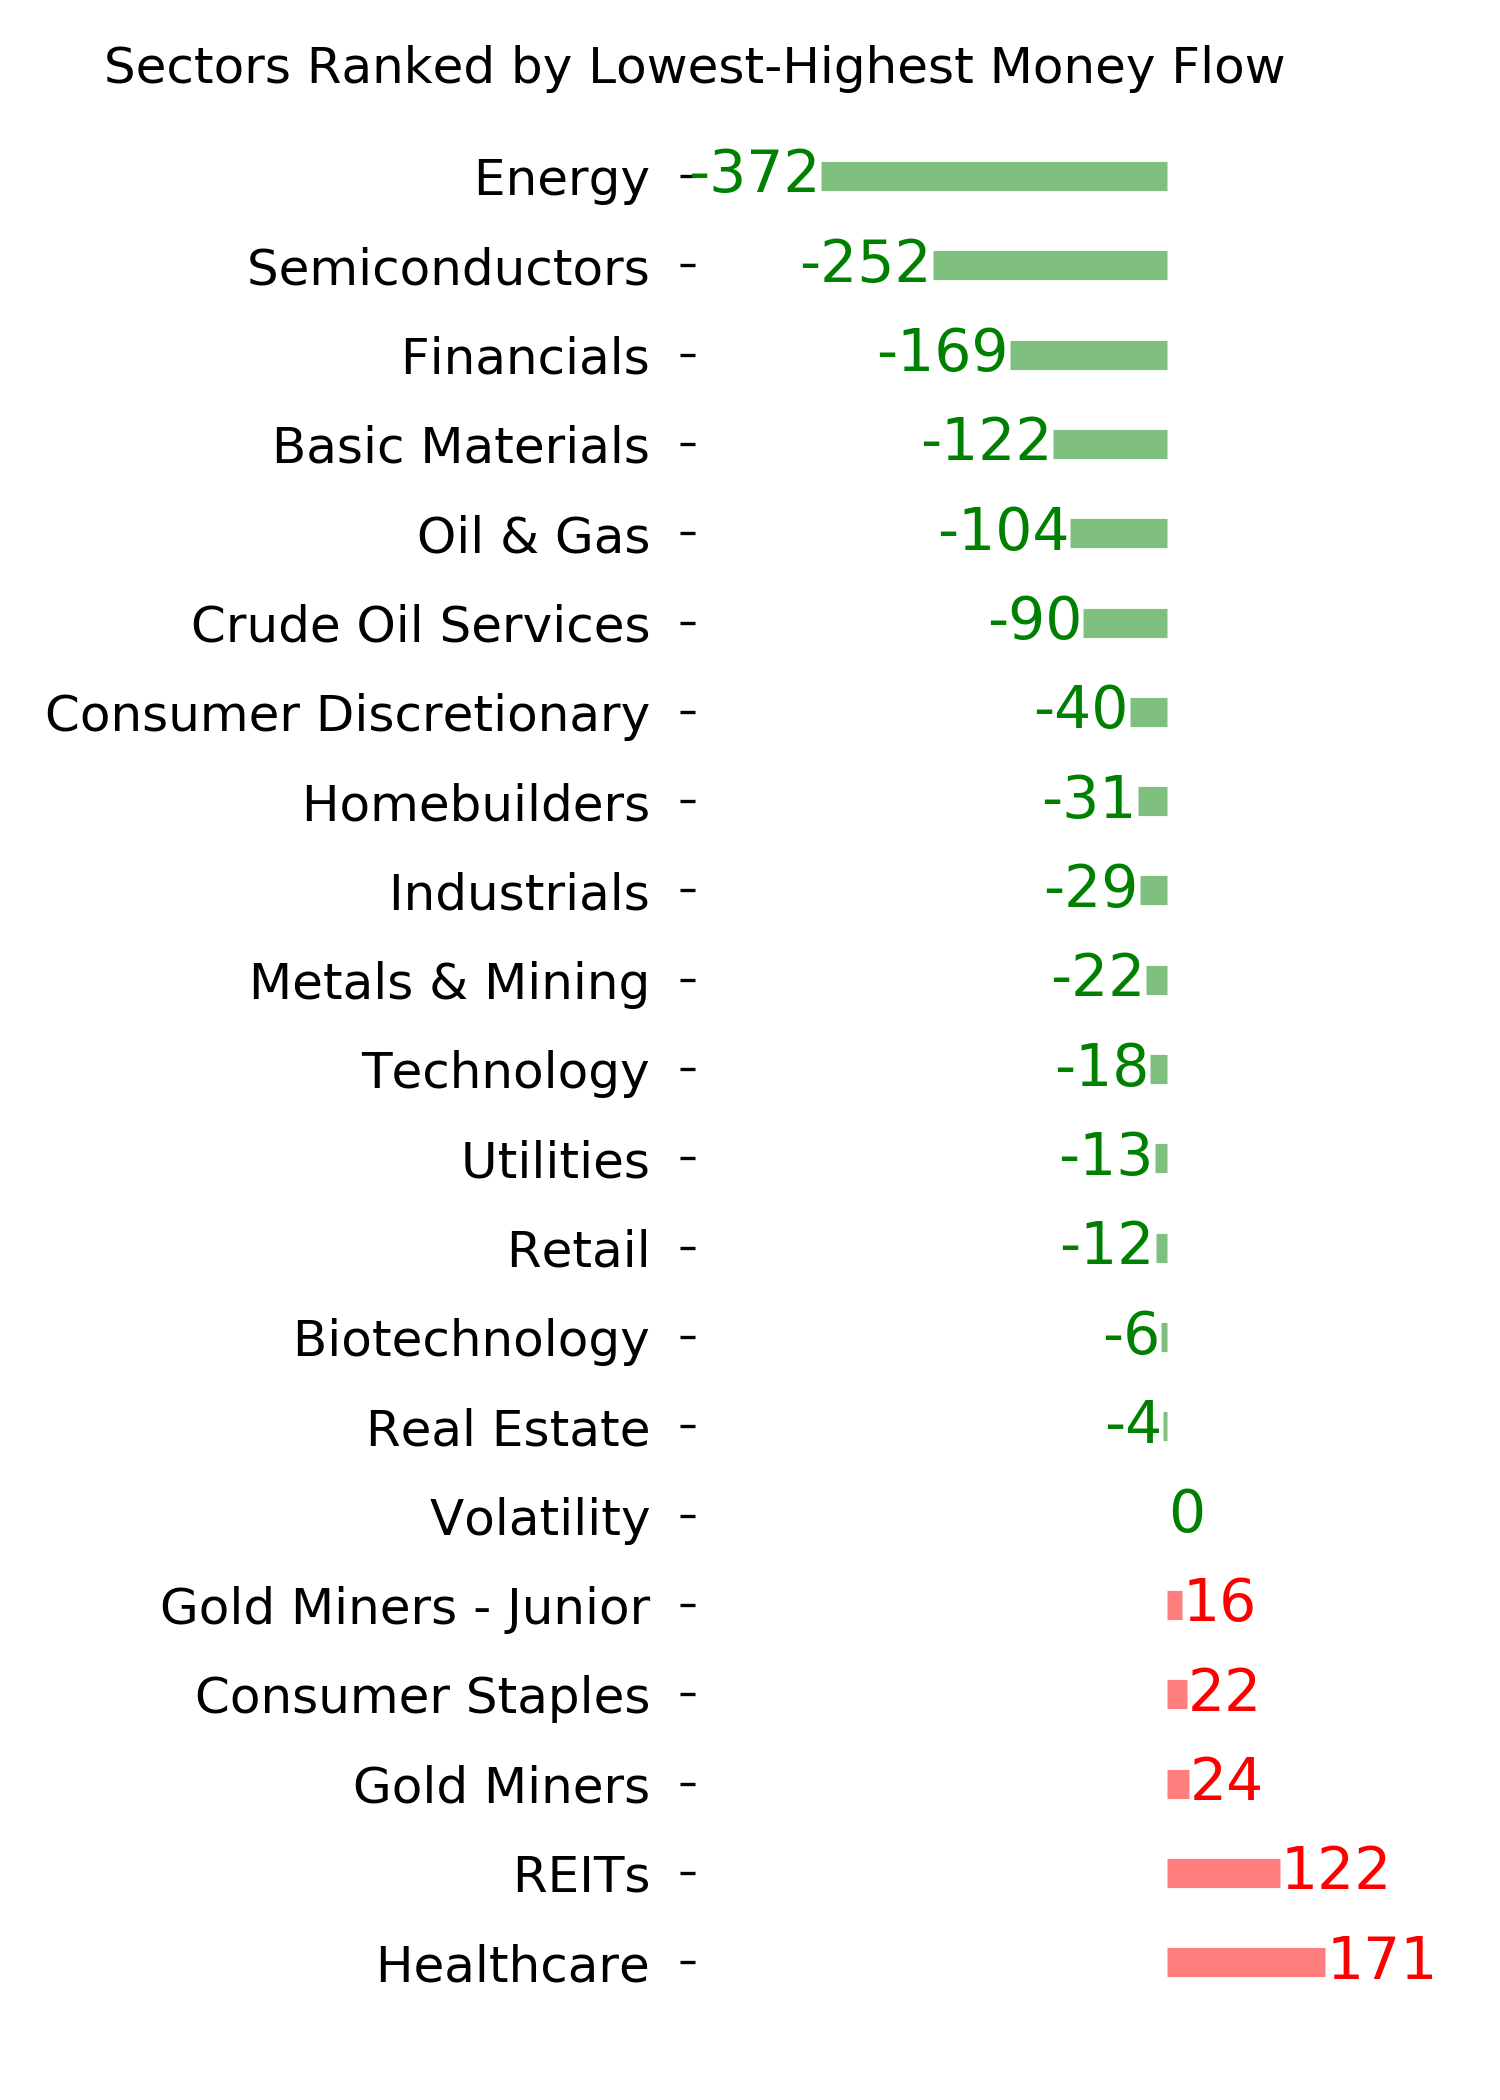
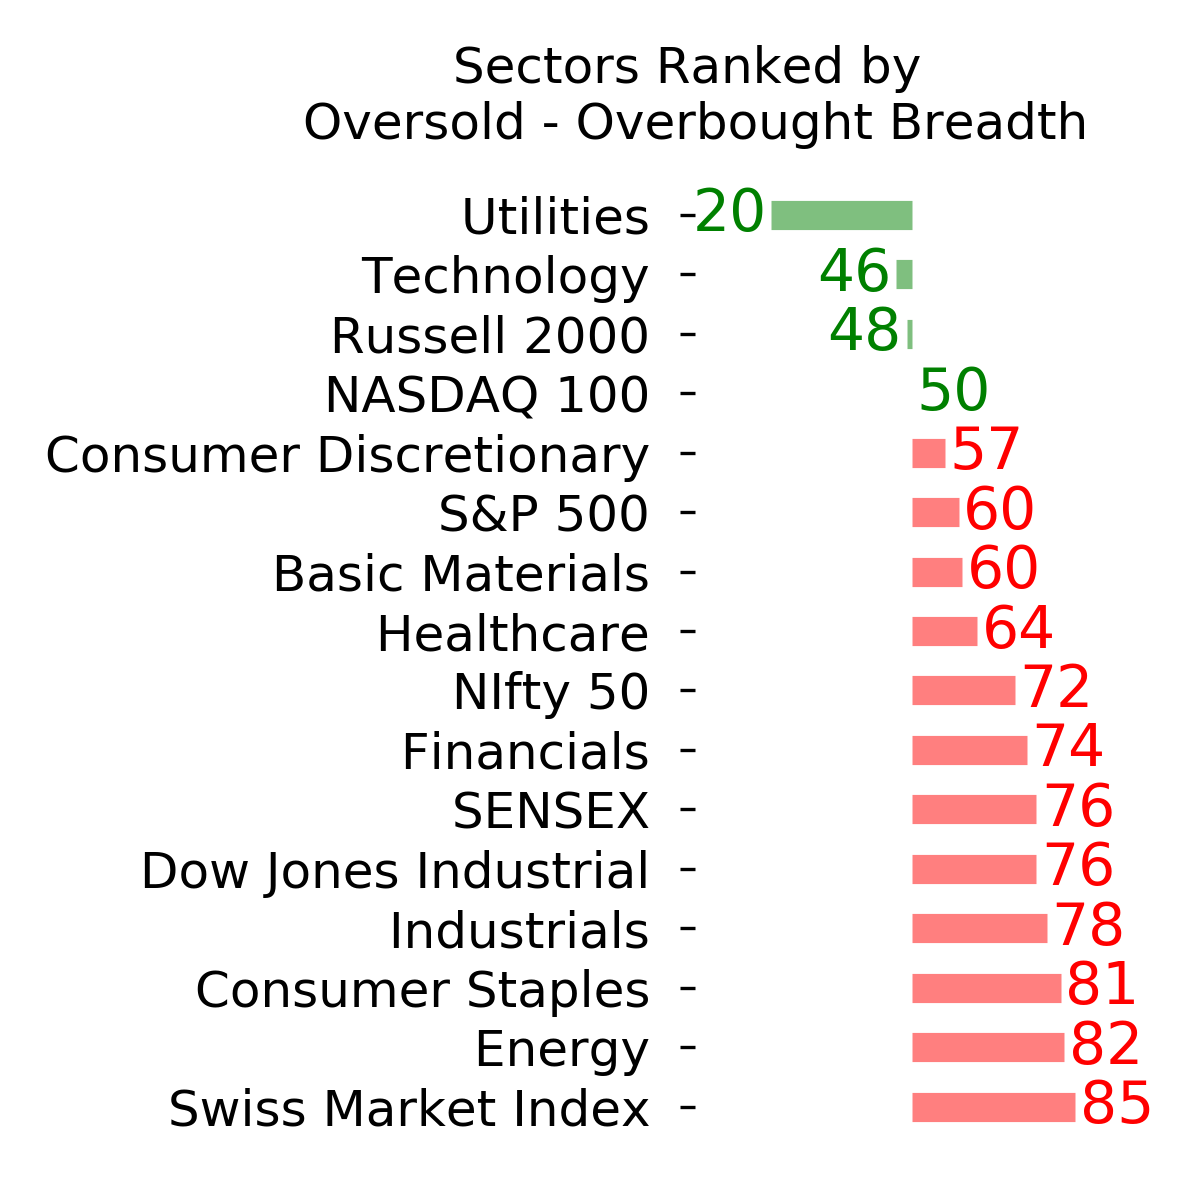
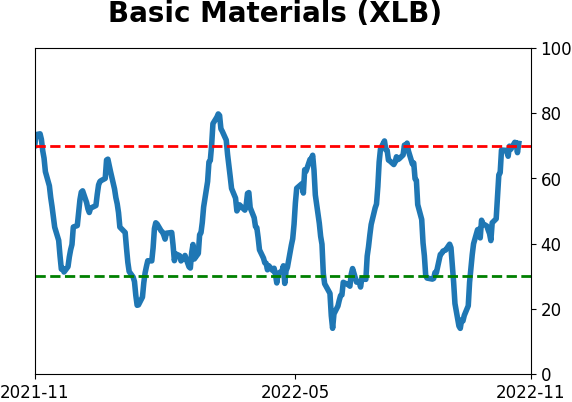
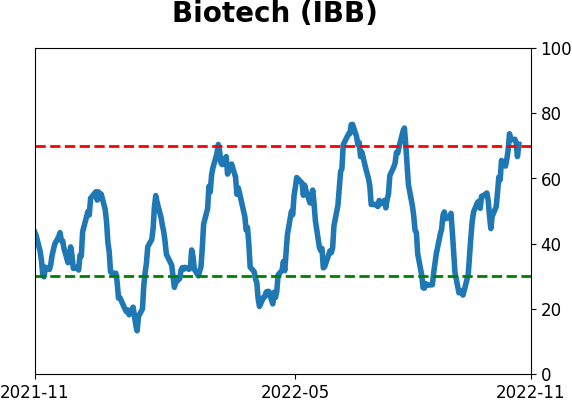
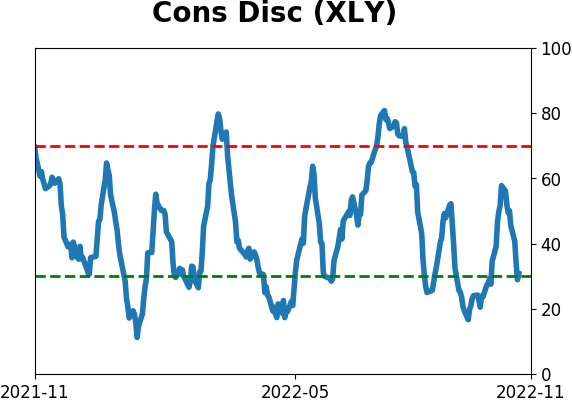
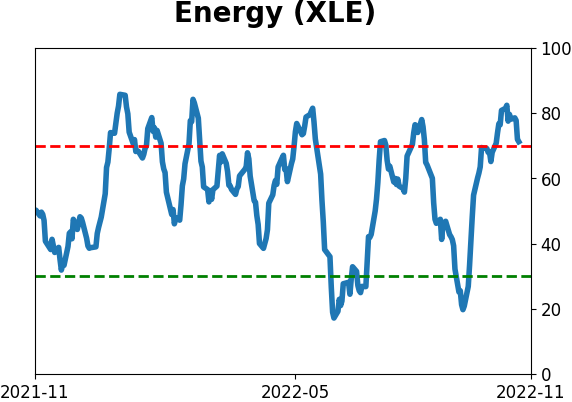
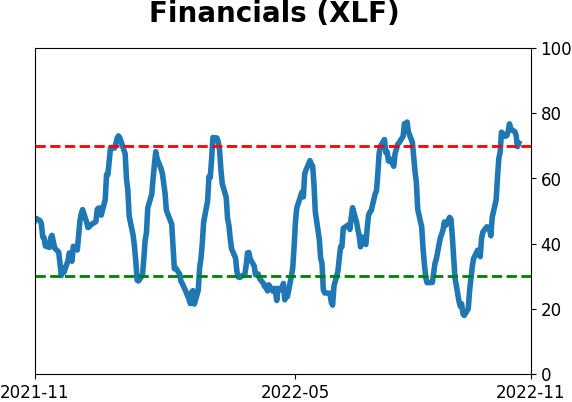
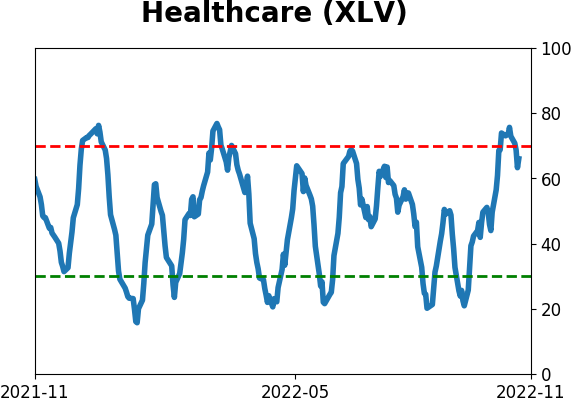
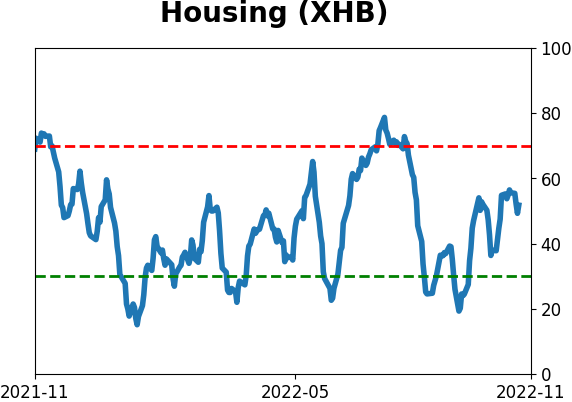
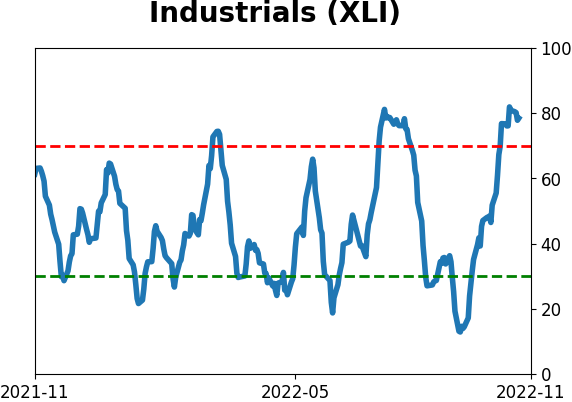
Sector ETF's - 10-Day Moving Average
|
|
|
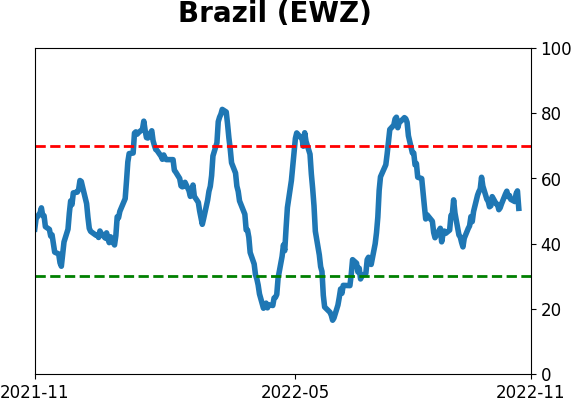
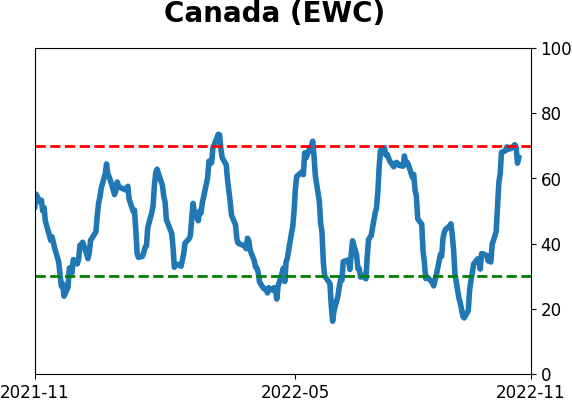
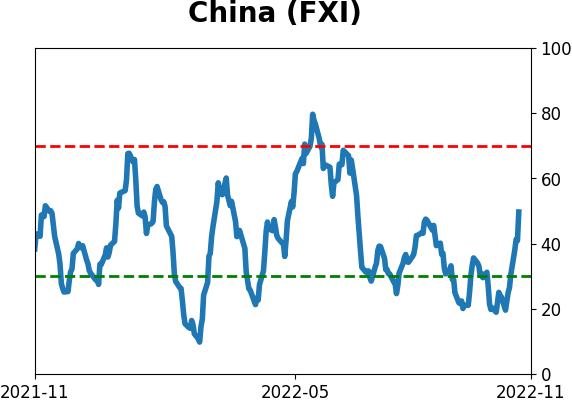
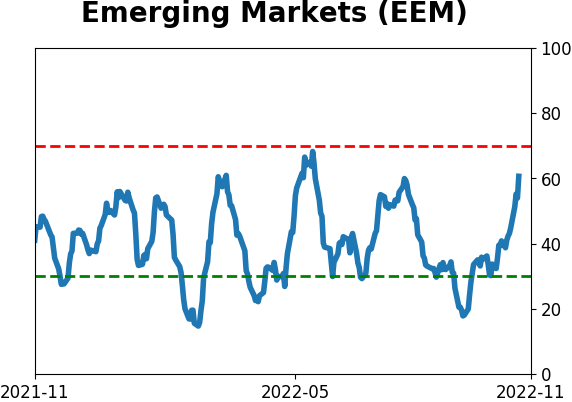
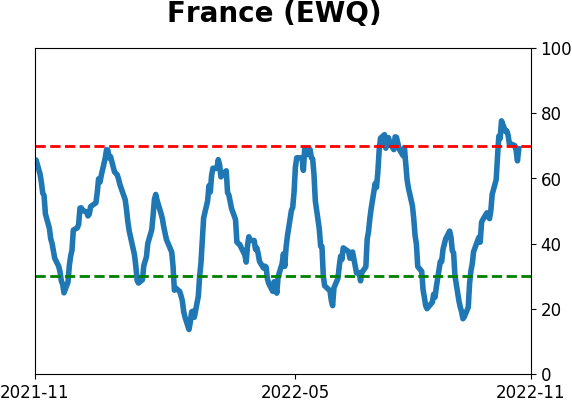
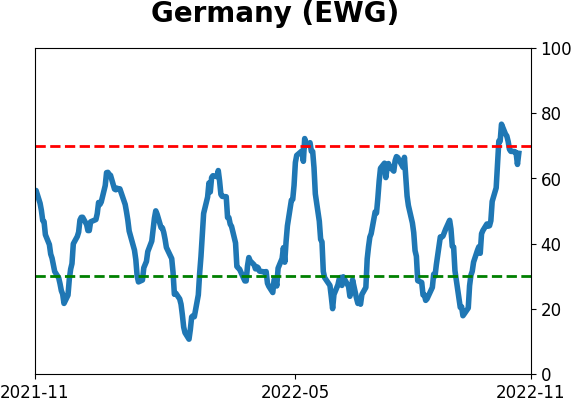
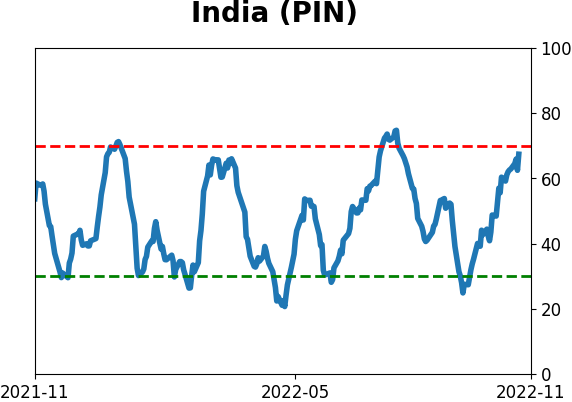
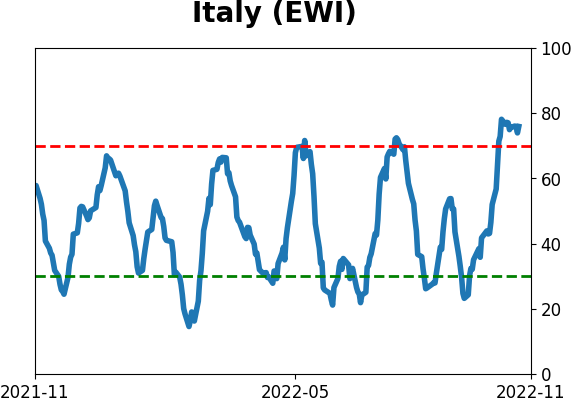
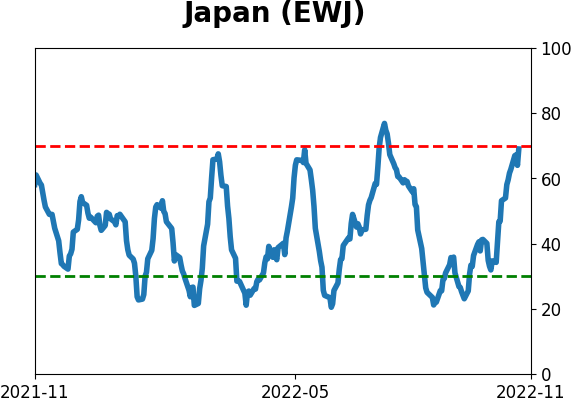
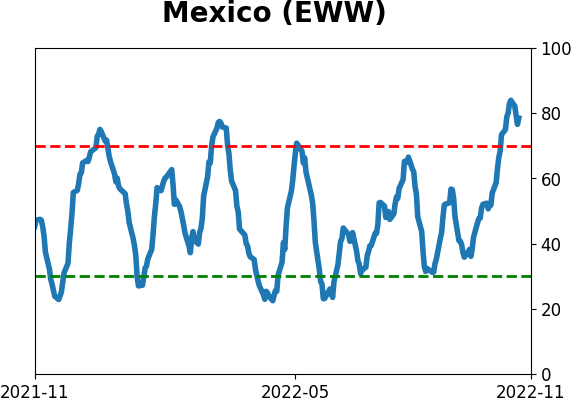
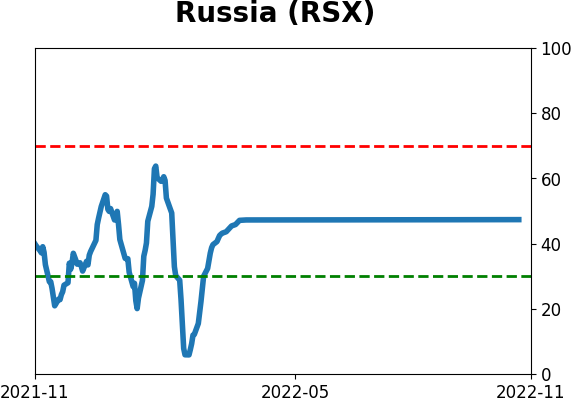
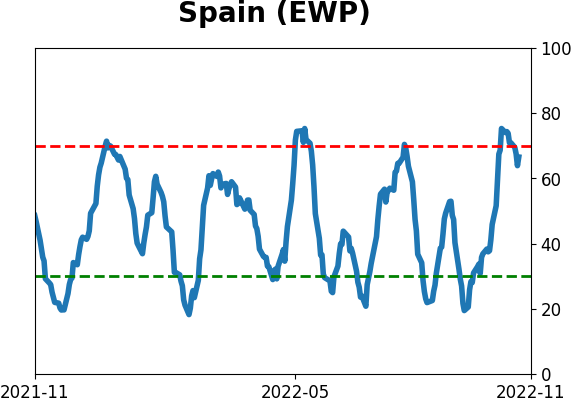
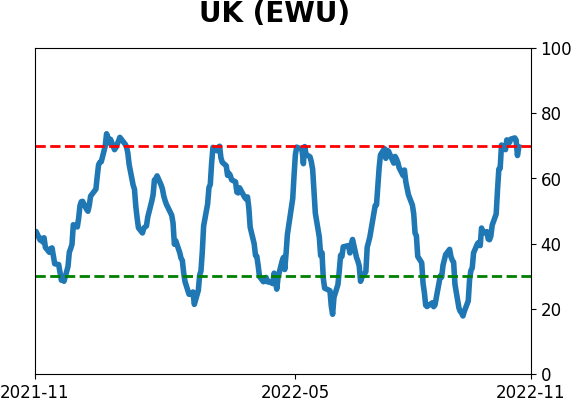
Country ETF's - 10-Day Moving Average
|
|
|
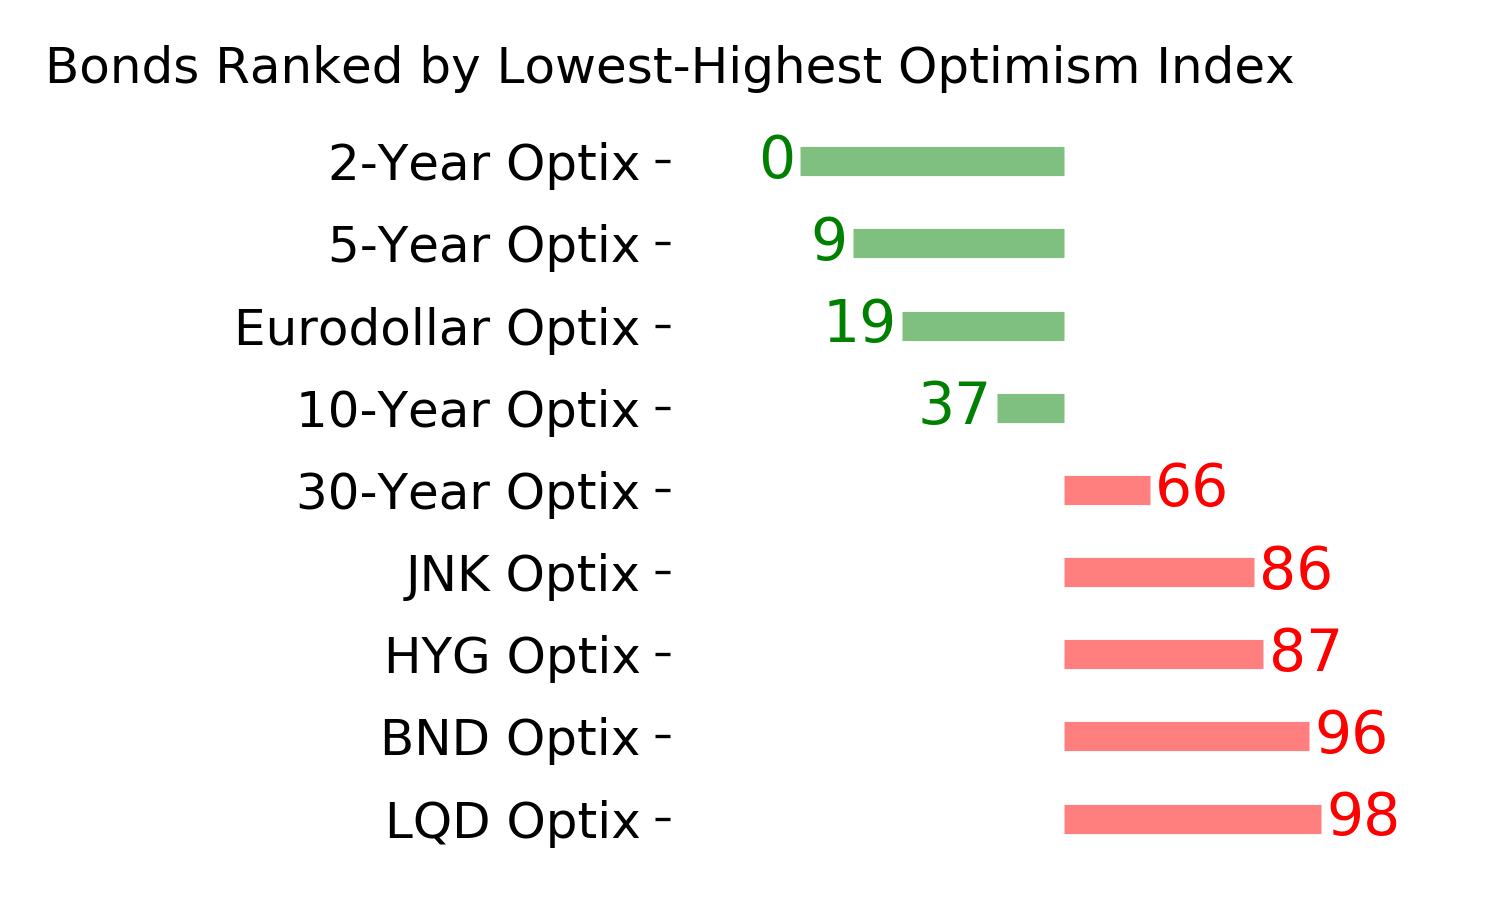
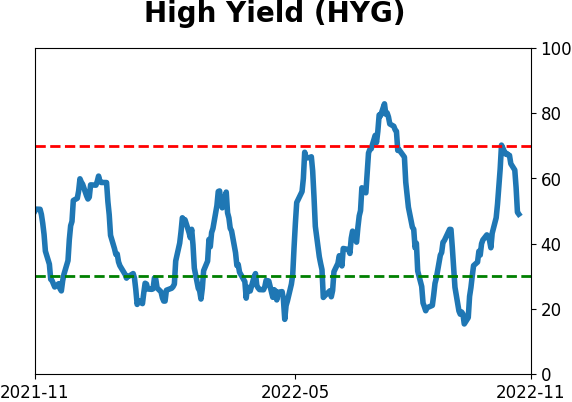
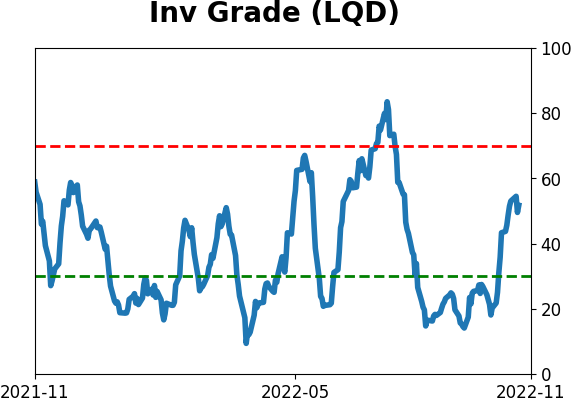
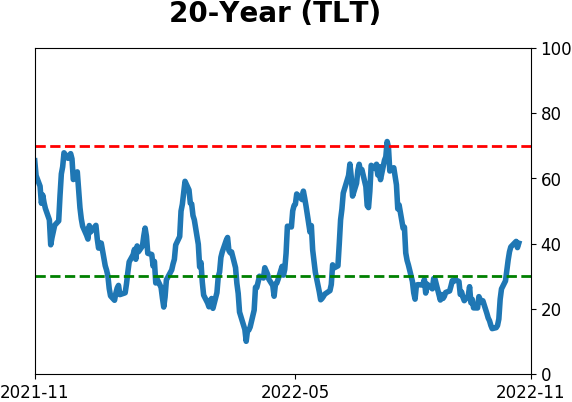
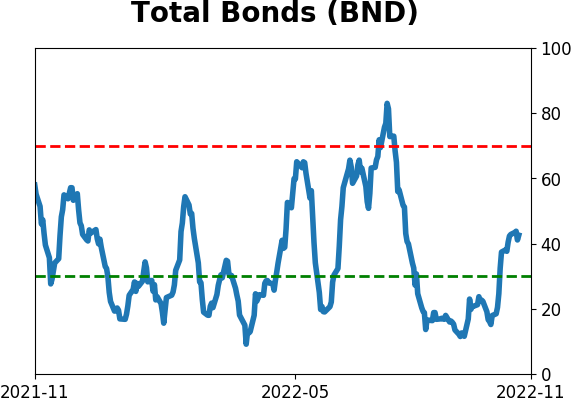
Bond ETF's - 10-Day Moving Average
|
|
|
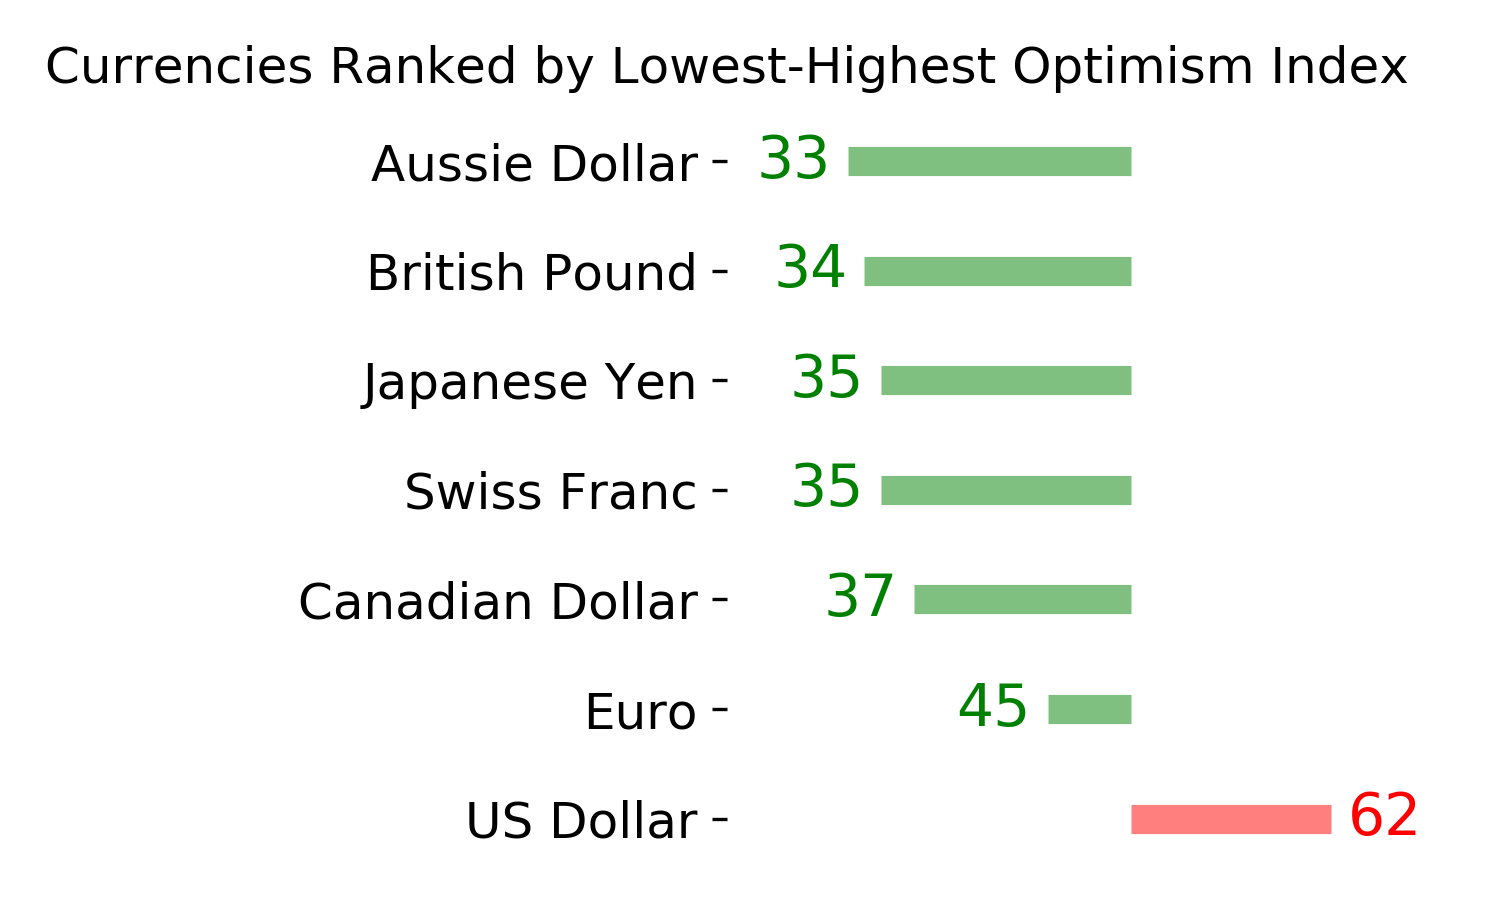
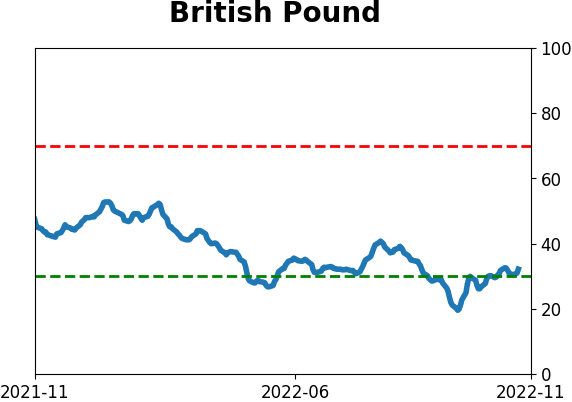
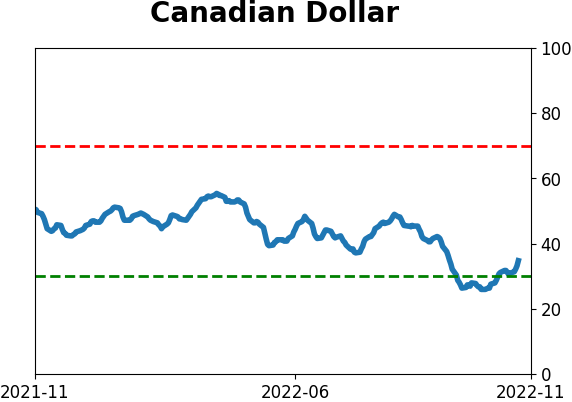
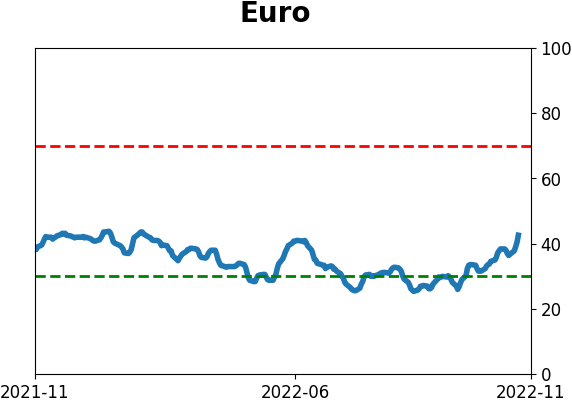
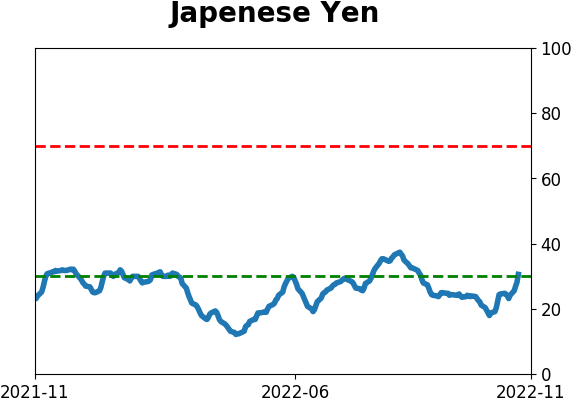
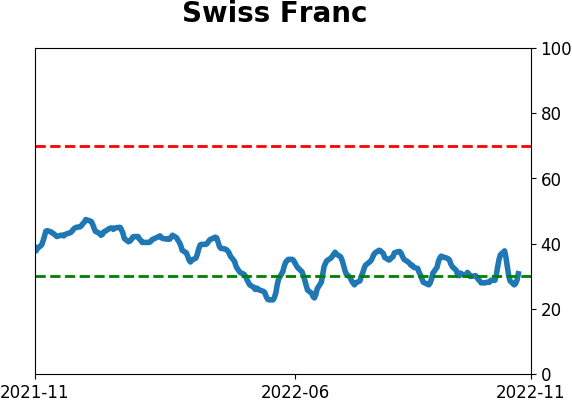
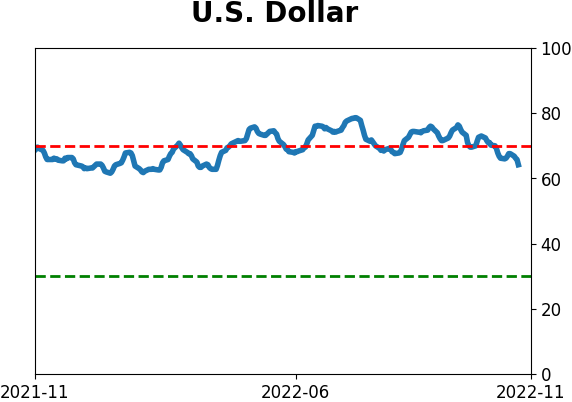
Currency ETF's - 5-Day Moving Average
|
|
|
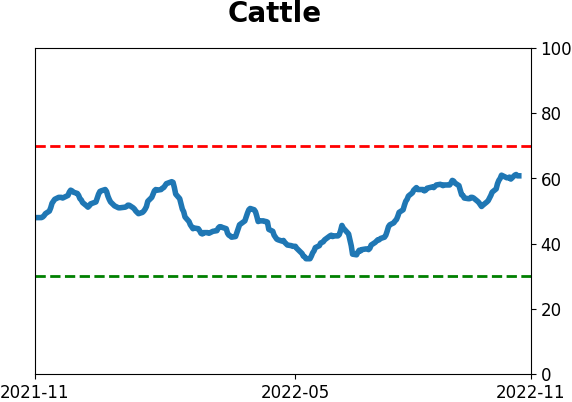
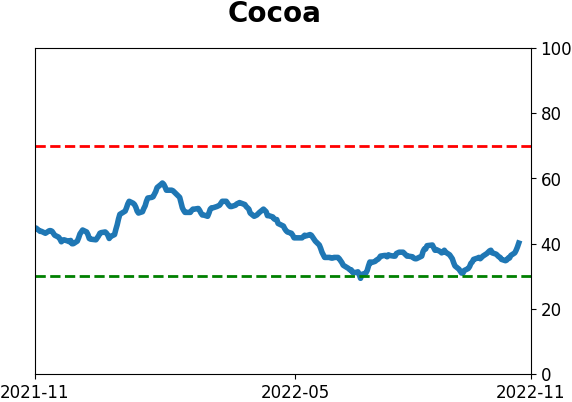
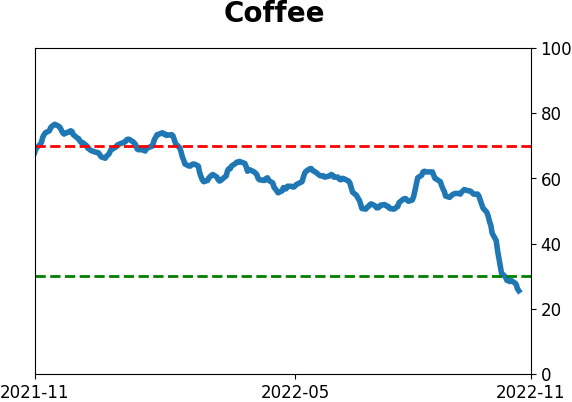
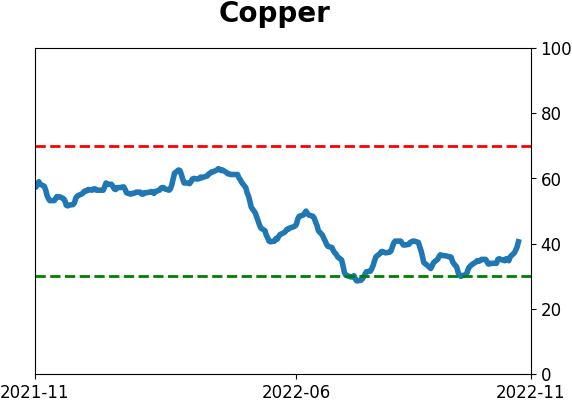
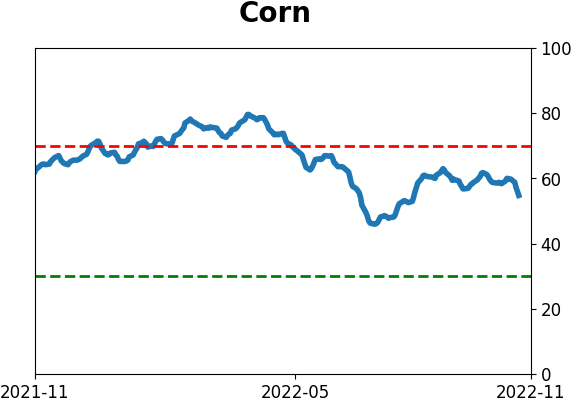
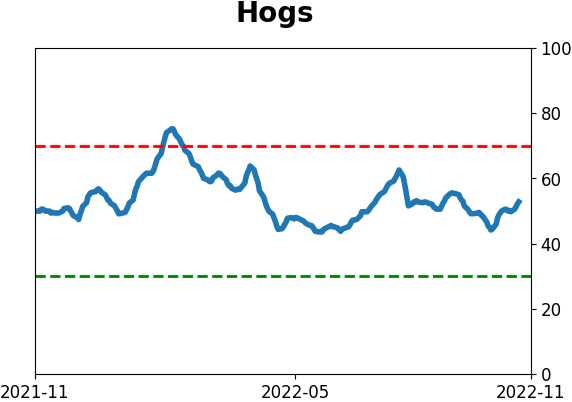
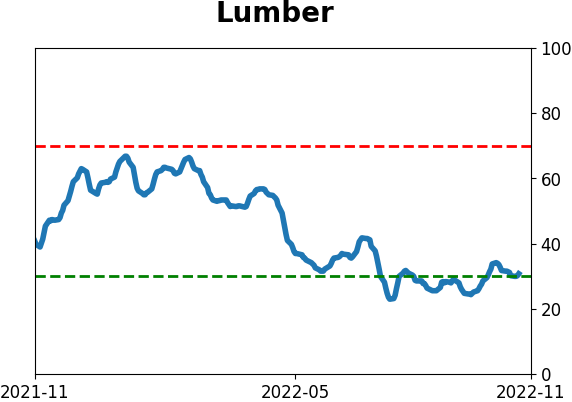
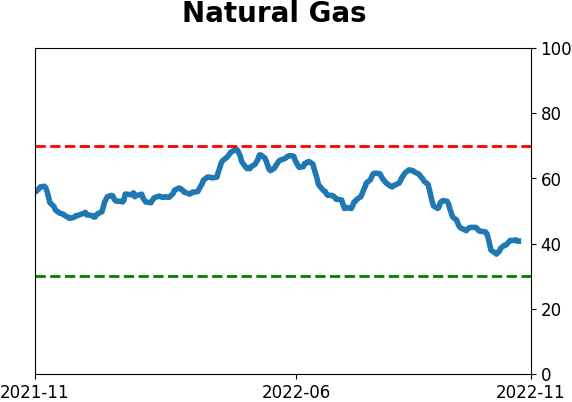
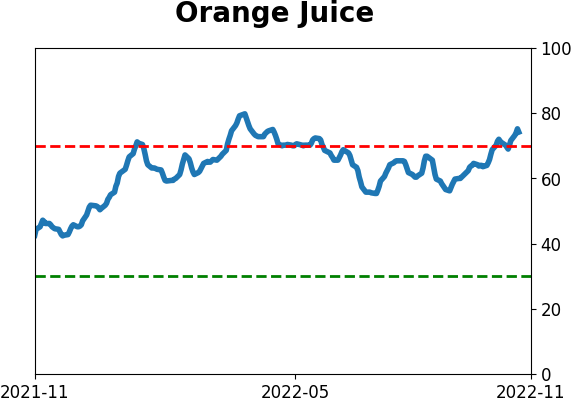
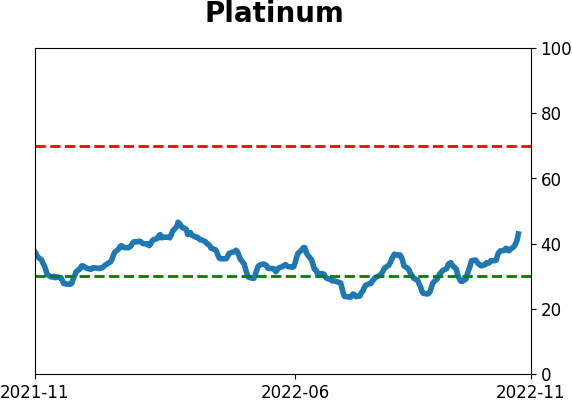
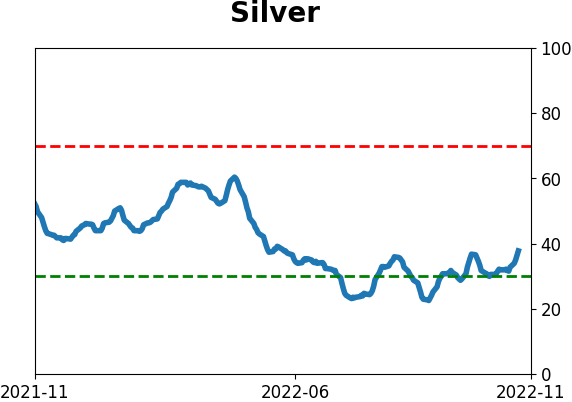
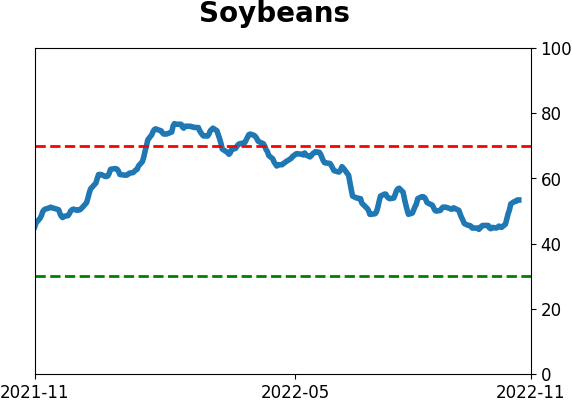
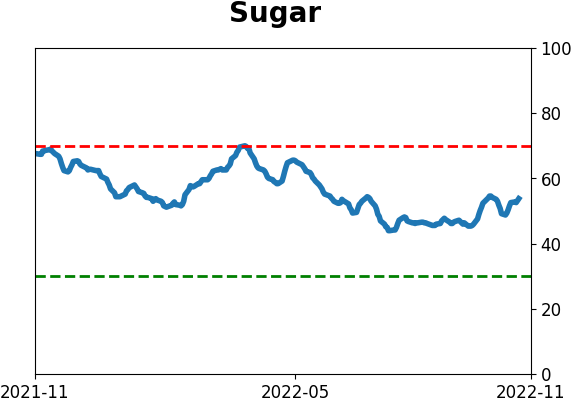
Commodity ETF's - 5-Day Moving Average
|
|