Headlines
|
|
The VIX drops by a quarter as traders worry about complacency:
The VIX "fear gauge" has dropped by more than 25% from its peak over the past couple of months. That usually means a big rally in the S&P 500, but not this time. Even so, it doesn't suggest irrational complacency from investors, nor do low readings in "fear" indicators like SKEW and the Fear Barometer, though the put/call ratio has spiked.
|
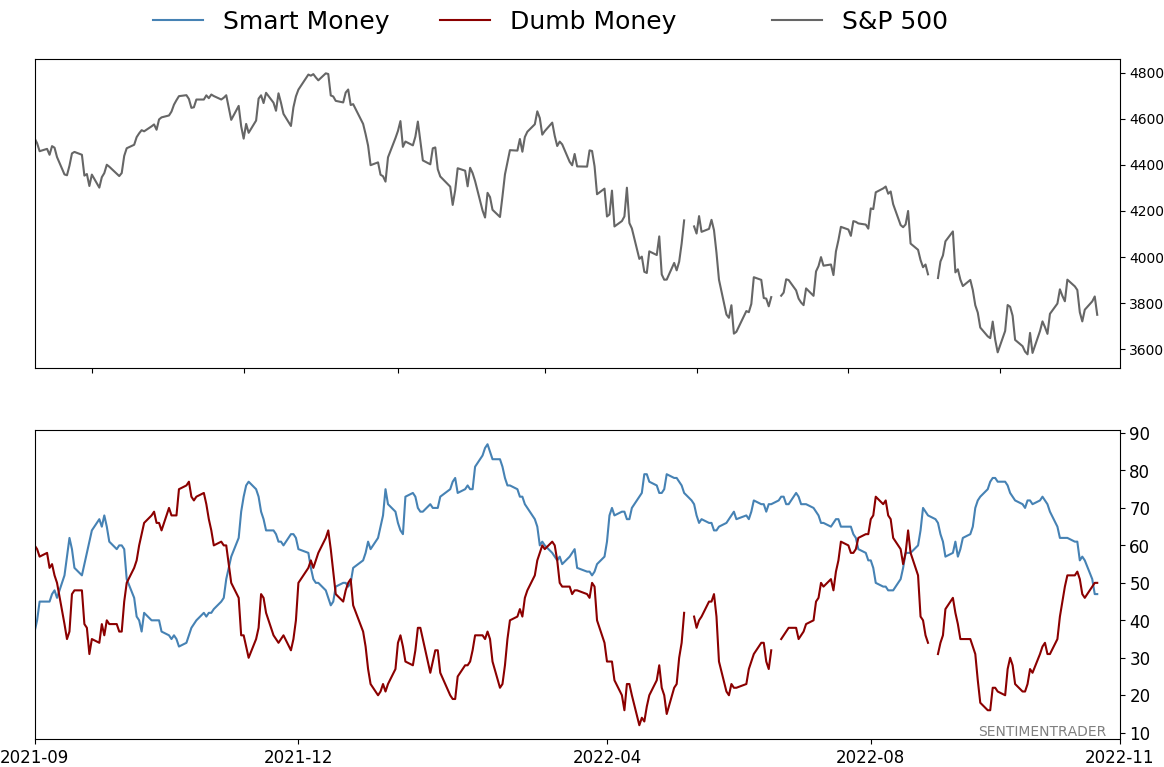
Smart / Dumb Money Confidence
|
Smart Money Confidence: 47%
Dumb Money Confidence: 50%
|
|
Risk Levels
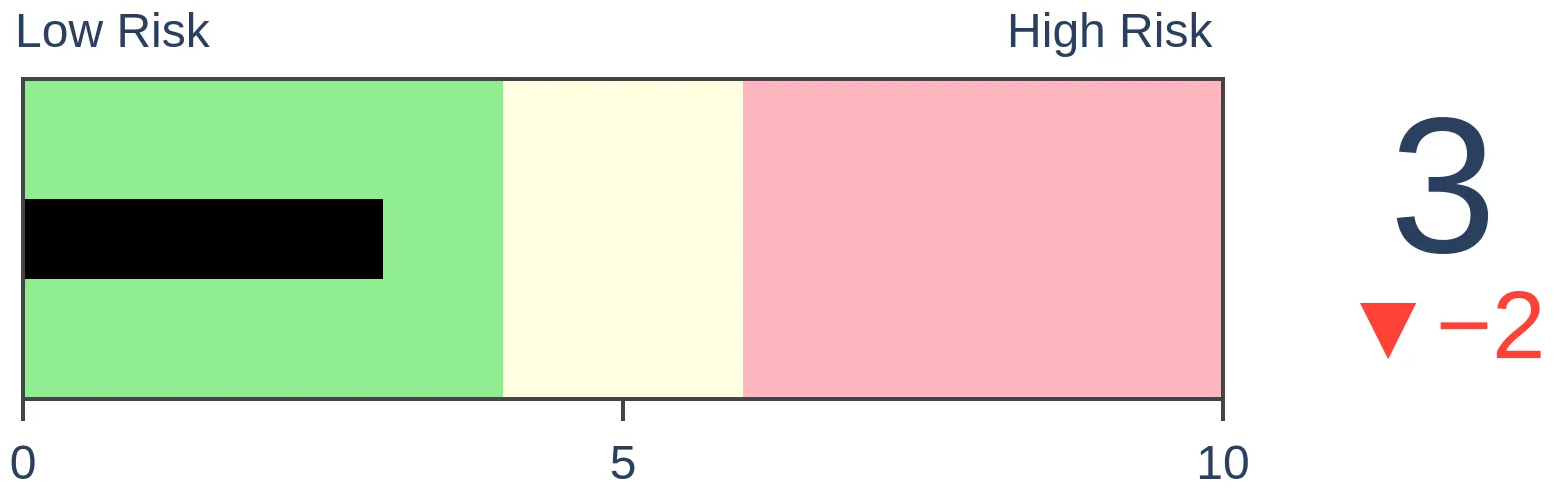
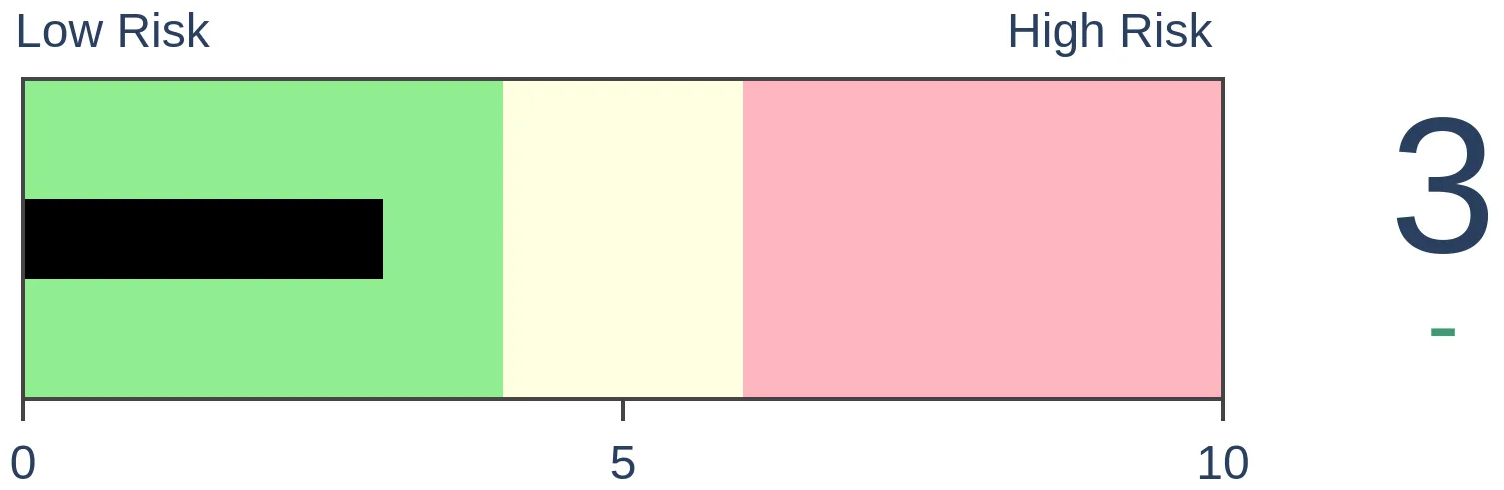
Stocks Short-Term
|
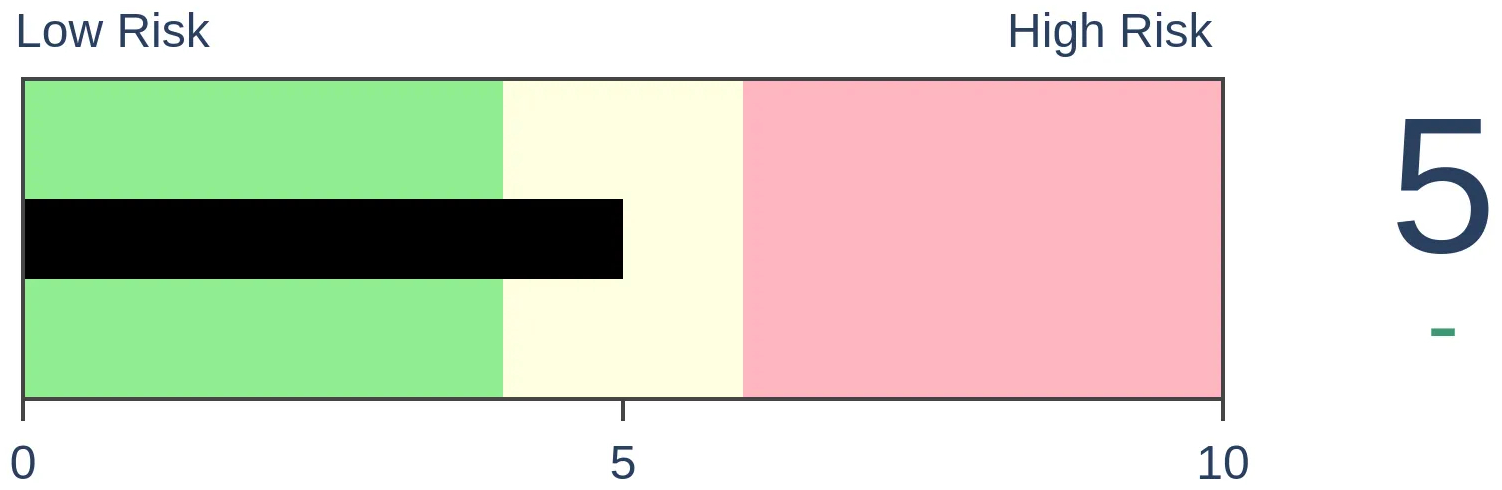
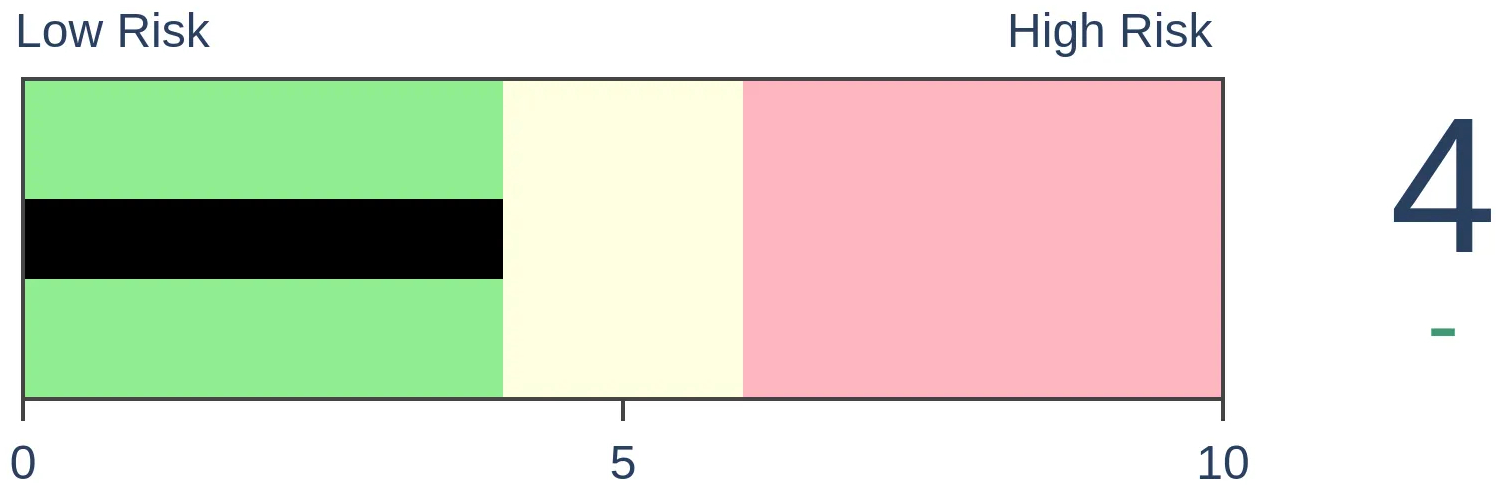
Stocks Medium-Term
|
|
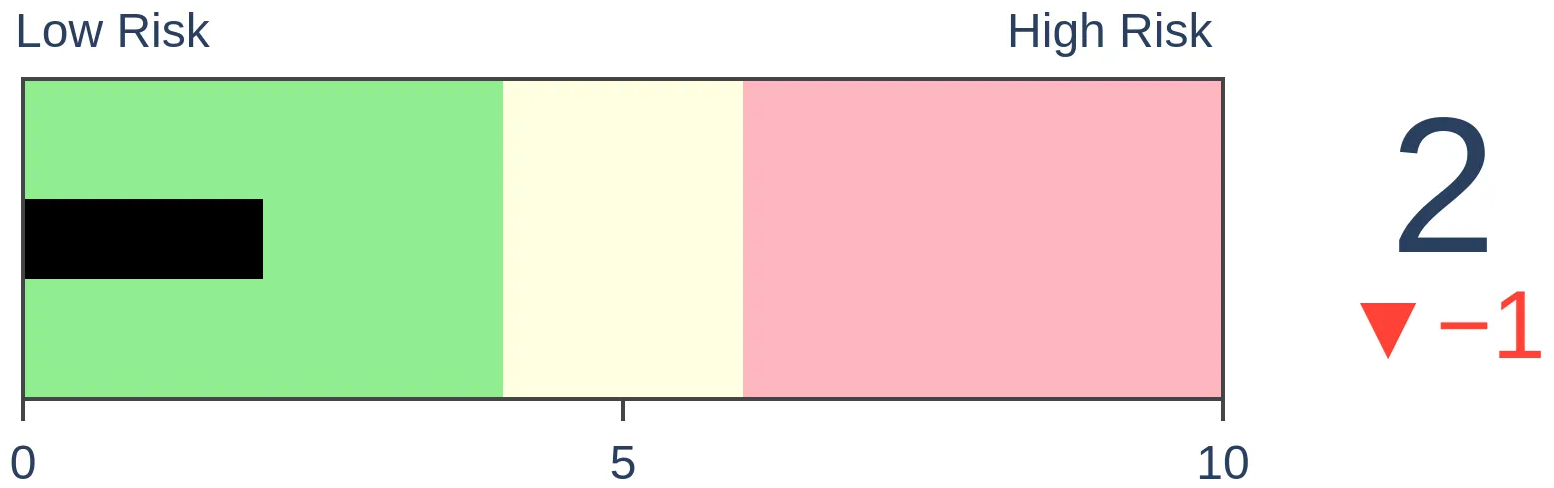
Bonds
|
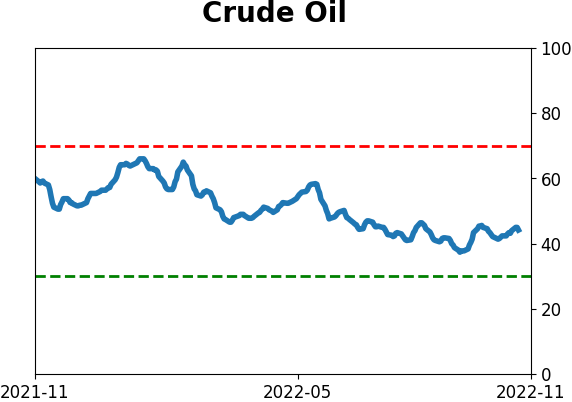
Crude Oil

|
|
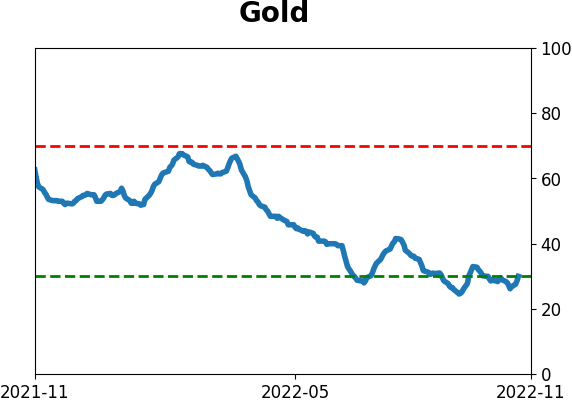
Gold
|
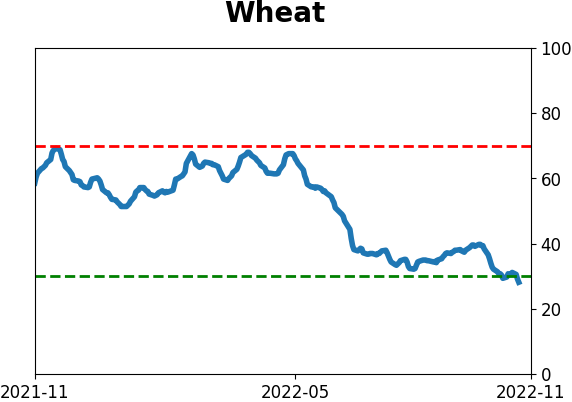
Agriculture
|
|
Research
By Jason Goepfert
BOTTOM LINE
The VIX "fear gauge" has dropped by more than 25% from its peak over the past couple of months. That usually means a big rally in the S&P 500, but not this time. Even so, it doesn't suggest irrational complacency from investors, nor do low readings in "fear" indicators like SKEW and the Fear Barometer, though the put/call ratio has spiked.
FORECAST / TIMEFRAME
None
|
Key points:
- Over the past couple of months, the VIX has declined by more than 25%
- But the S&P 500 is still stuck about in the middle of its two-month range
- Similar behavior preceded mostly positive returns, as did low measures of investor "fear"
The VIX has dropped by a quarter, but stocks are still stuck
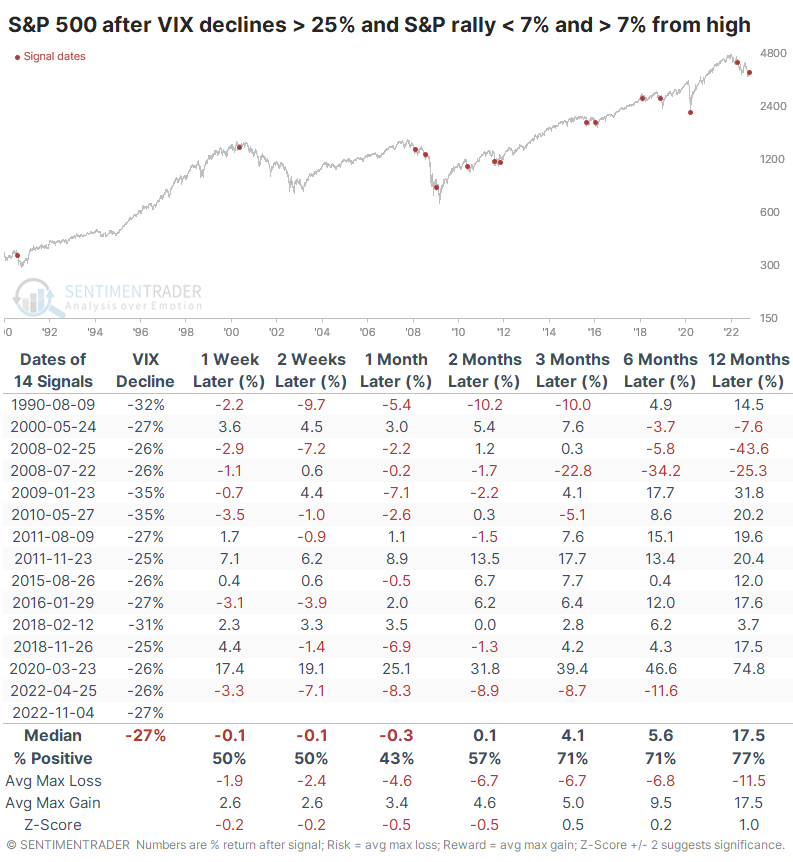
The latest hand-wringing about the recent rally suggests that the VIX has dropped too far and too fast. Traders are pricing in much less future volatility despite relatively minor gains in the S&P 500. From its two-month peak, the VIX has plunged more than 25% while the S&P only rallied about 5%.
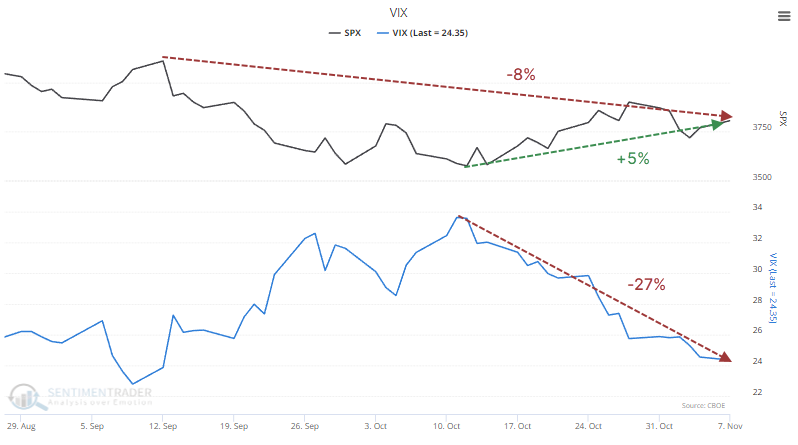
Since 1990, when the VIX declined 25% or more from its highest level of the past two months, the S&P 500 was within 1% of its two-month high on average. This time, it was far below, and that's unusual.
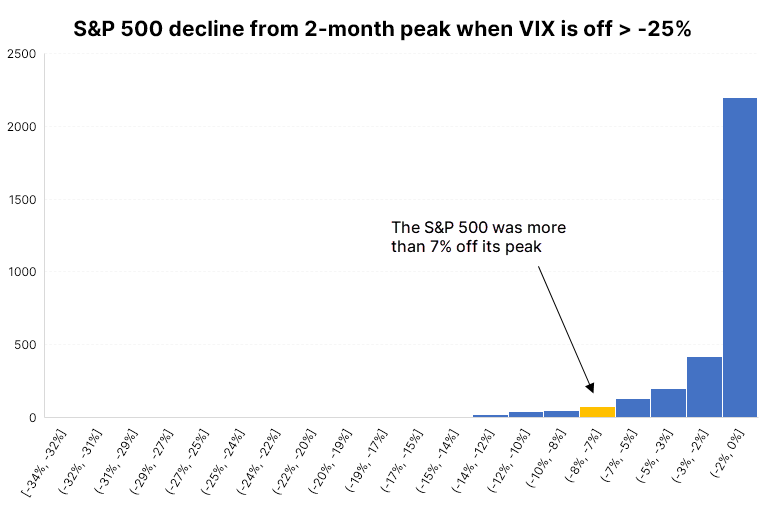
The table below shows every date since 1990 when the VIX declined at least 25% from its highest point of the past two months. At the same time, the S&P 500 rallied less than 7% from its lowest point and remained at least 7% from its highest point. Supposedly, this would show us times of complacency.
The S&P did suffer some poor shorter-term returns, but it didn't consistently and negatively impact medium- to long-term returns.
Not enough fear?
The SKEW and CSFB indicators purport to show how much fear is being priced into the options market. Because they're both at multi-year lows, investors think that others are complacent, which necessarily means we're going to crash. Complacency during bear markets is dangerous.
But the indicators don't work like they're supposed to.
SKEW shows how expensive put options are relative to calls. The higher the figure, the more expensive puts are. It was designed with the assumption that high readings would be equivalent to "fear" and replace the VIX as a gauge of investor anxiety. In practice, it has worked in precisely the opposite way.
With backdated data available to 1990, high readings preceded an annualized return of only +1.6% in the S&P 500. But very low readings, which are supposed to indicate complacency and which we are seeing now, preceded returns of +15.0.
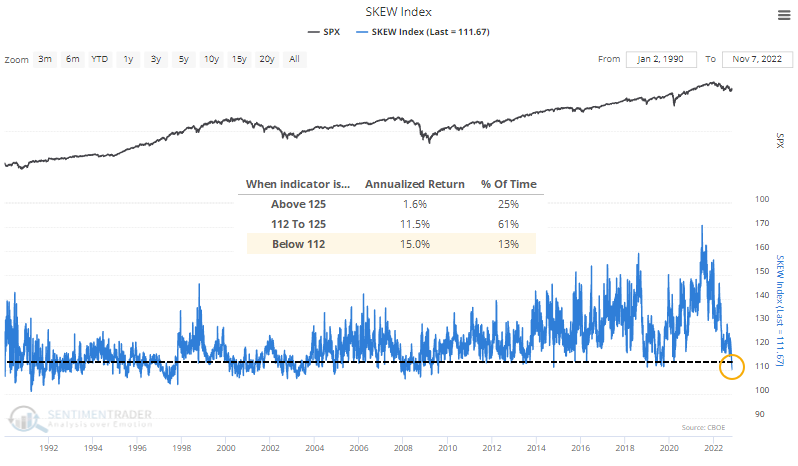
There are many reasons why this relationship exists, and I'm not going to pretend to be an options or volatility expert. All I know is what's in front of my face, and that's that despite whatever the theory is supposed to be, low readings lead to above-average returns.
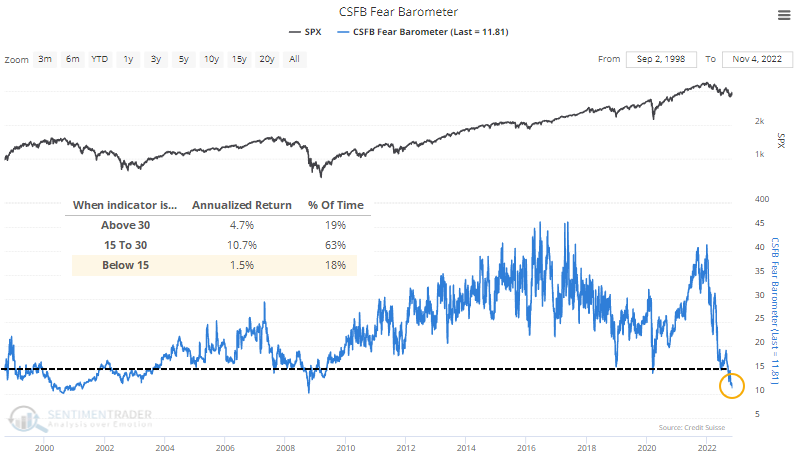
It's not as clear when it comes to the CSFB Fear Barometer. Again, we're supposed to see high readings during times of panic, but that hasn't happened. Even so, low readings have preceded poor annualized returns in the S&P.
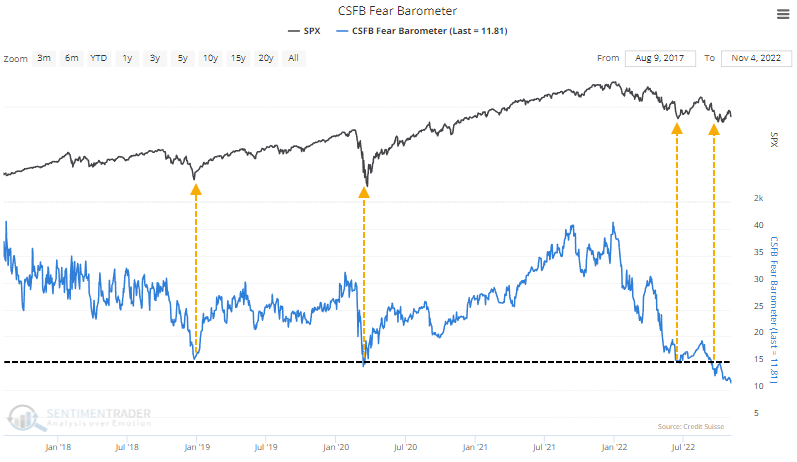
Over the past five years, though, we saw low readings in this indicator at the lows in the S&P 500 and high readings at the highs.
Put/call ratios are starting to show some of this anxiety that seems to be lurking just under the surface. Thanks largely to a surge in put trading in Tesla stock, the Equity Put/Call Ratio surged to one of its highest-ever levels on Tuesday.
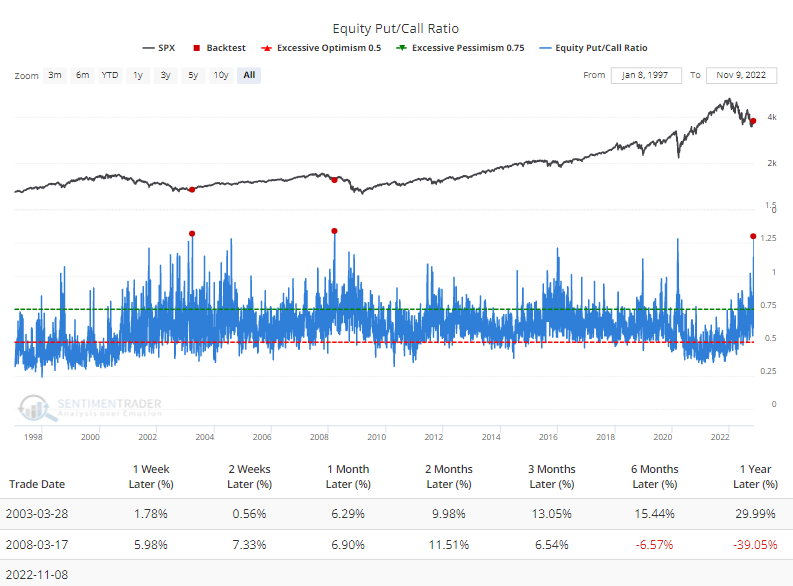
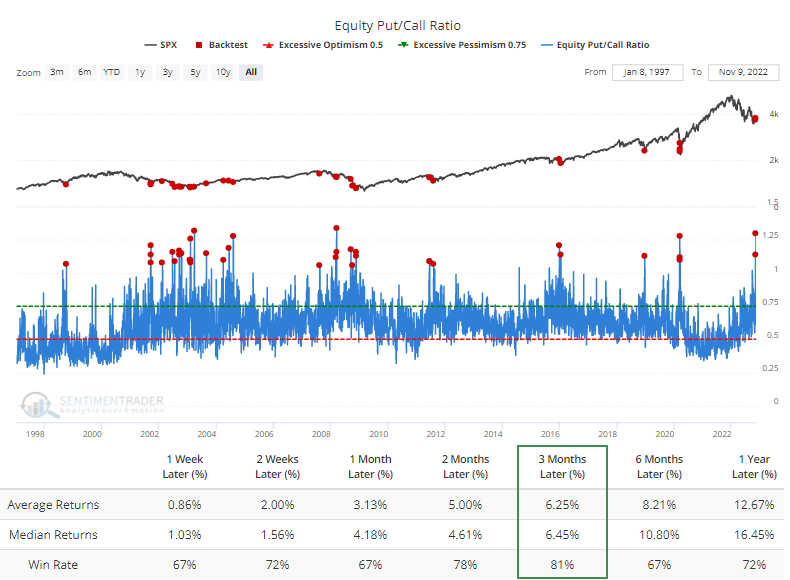
There were seven times put trading exceeded calls by 20%, all leading to gains in the S&P 500 over the next three months. The Backtest Engine shows that when put trading outpaced calls by even 5%, the S&P 500 rose over the next three months 29 out of 36 times.
We've never made excuses for indicators, and just because put trading in Tesla was brisk doesn't mean the indicator should be ignored. Traders constantly try to guess why indicators are giving the readings they are, but it rarely seems to be an effective exercise.
What the research tells us...
Volatility indicators have become the latest bogeymen for bears who insist that investors haven't panicked enough for stocks to enjoy at least a bear market rebound rally. While it's true that the VIX has declined precipitously despite a relatively modest rally in the S&P, and "fear" measures are showing the opposite, history tells us that it doesn't matter. Under similar conditions, stocks showed a strong tendency to rally anyway.
Indicators at Extremes
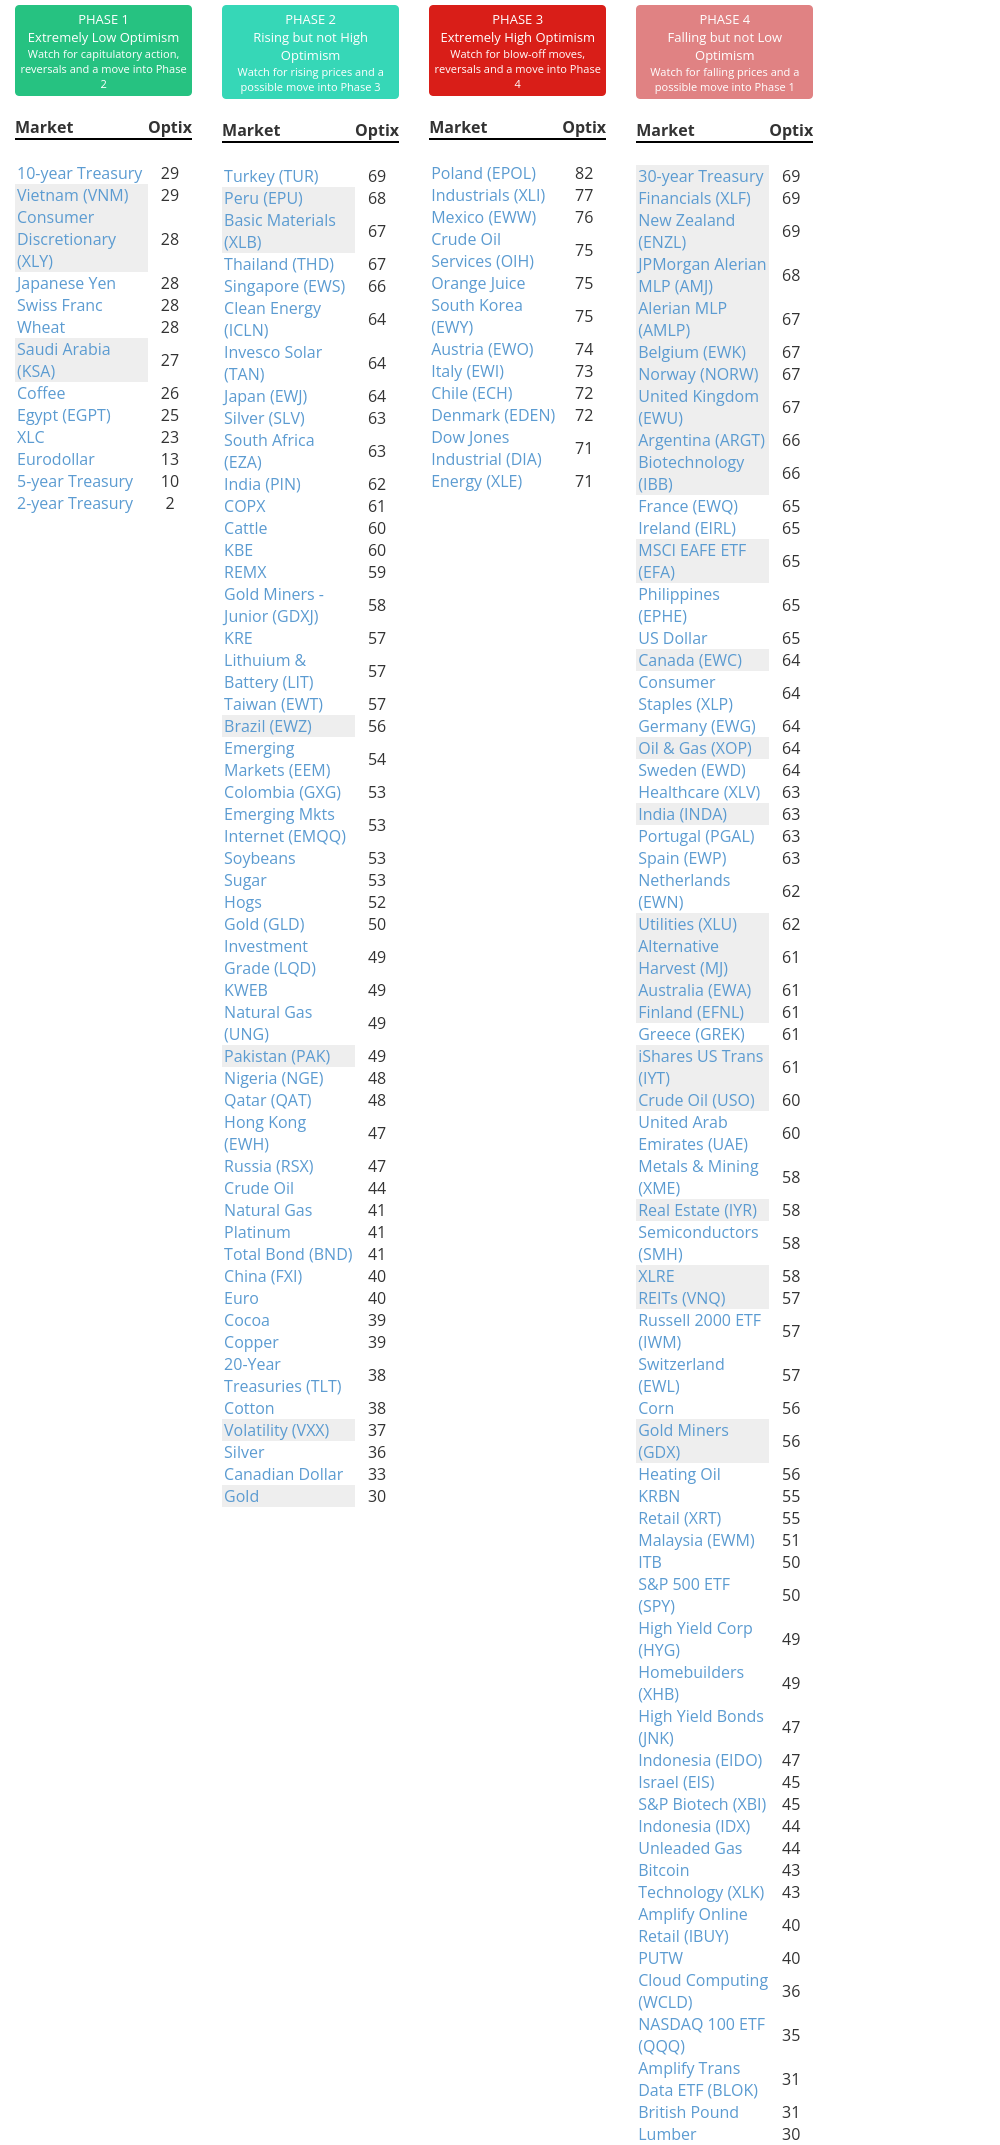
Phase Table
Ranks
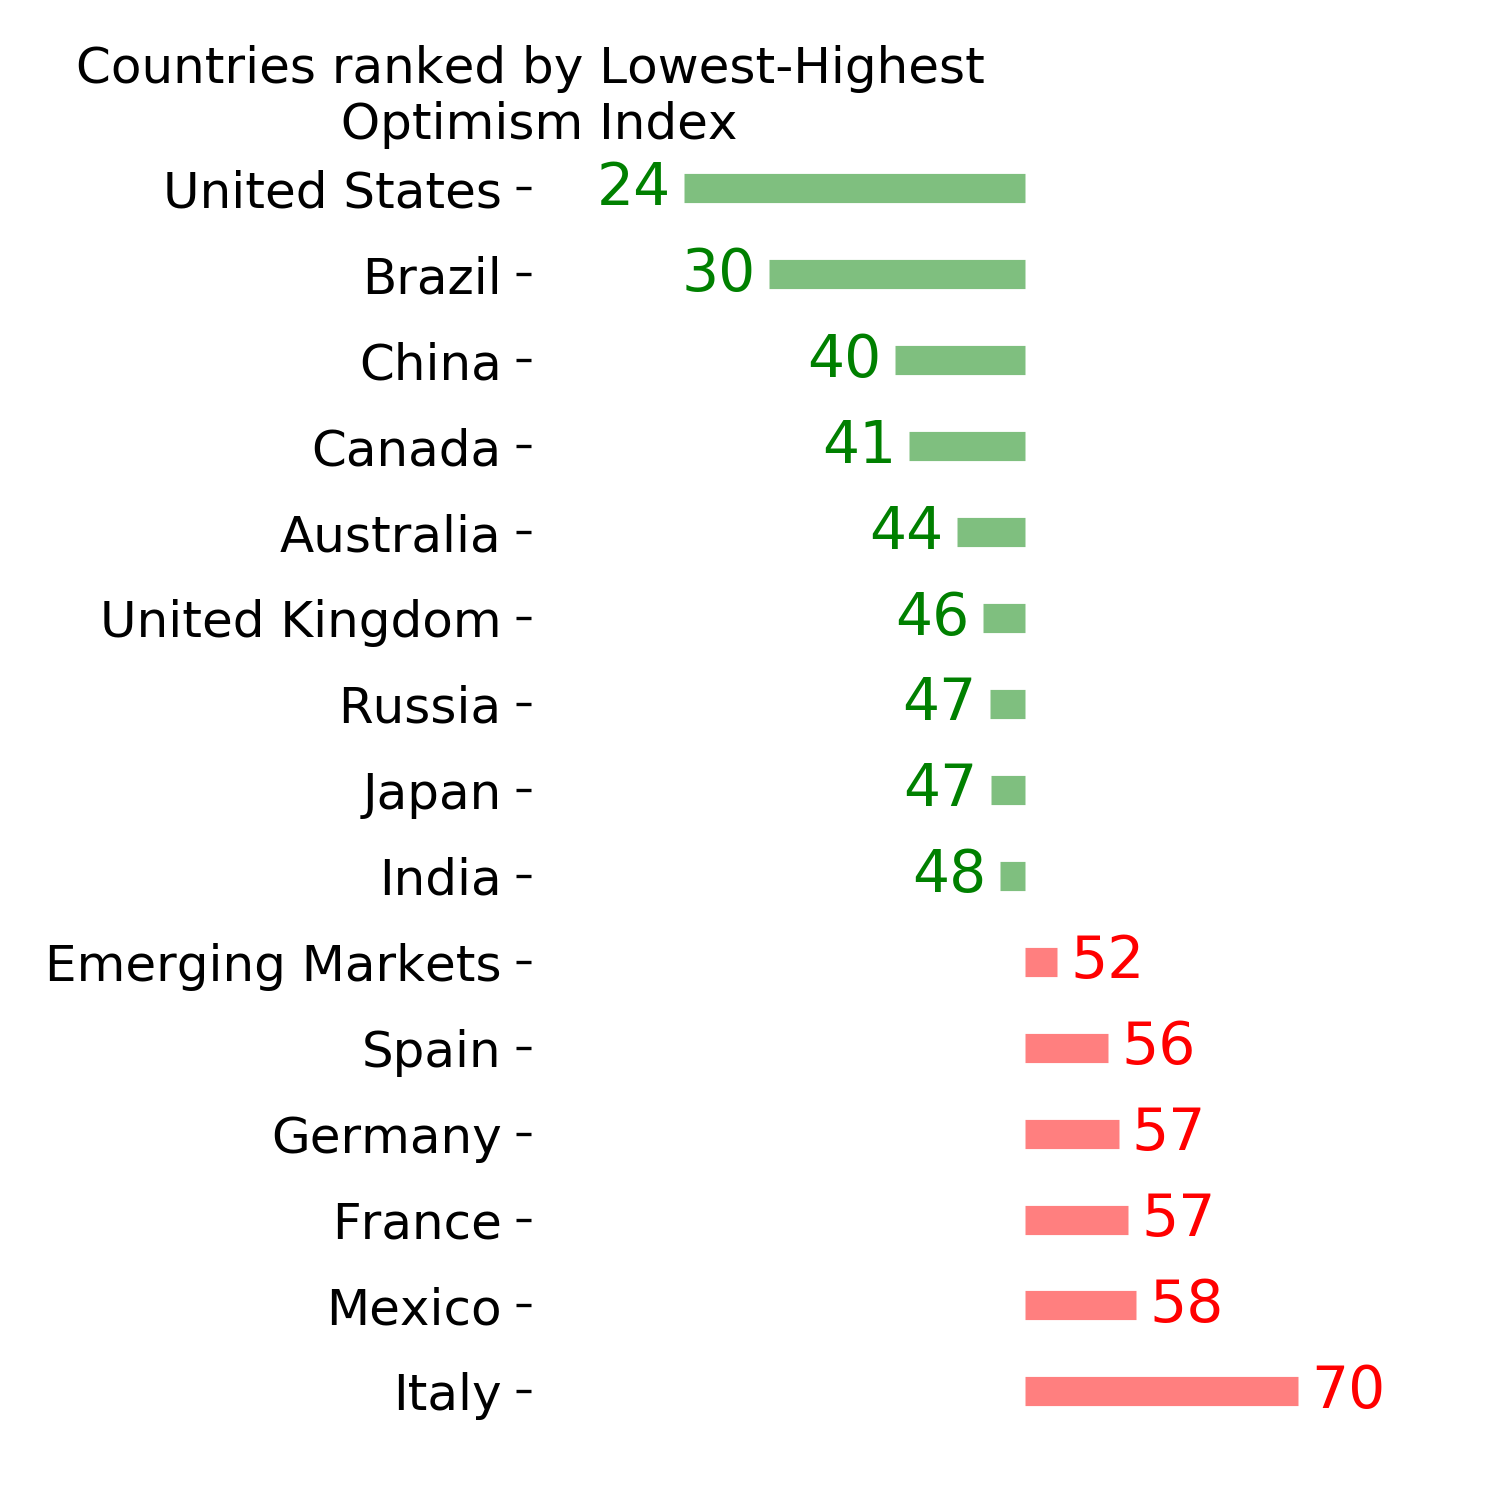
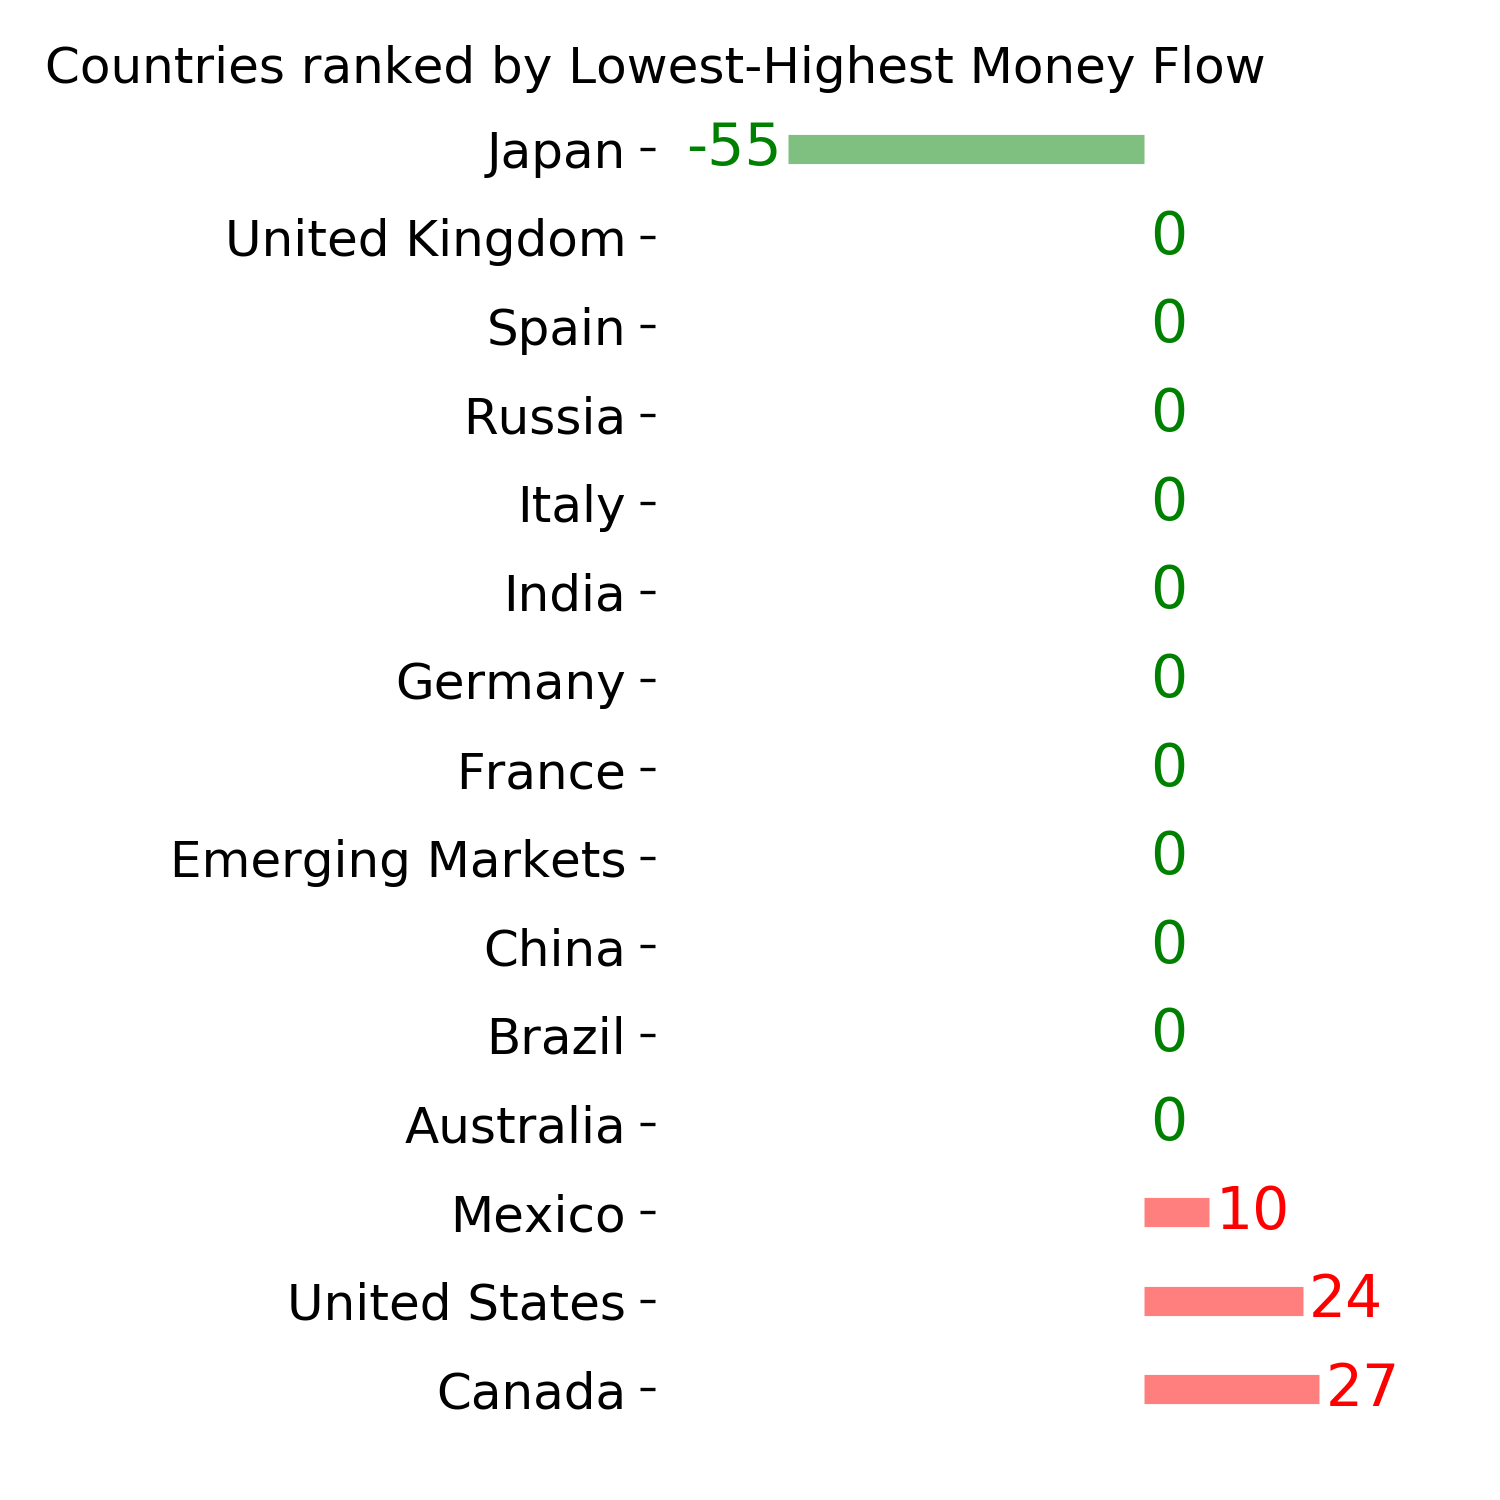
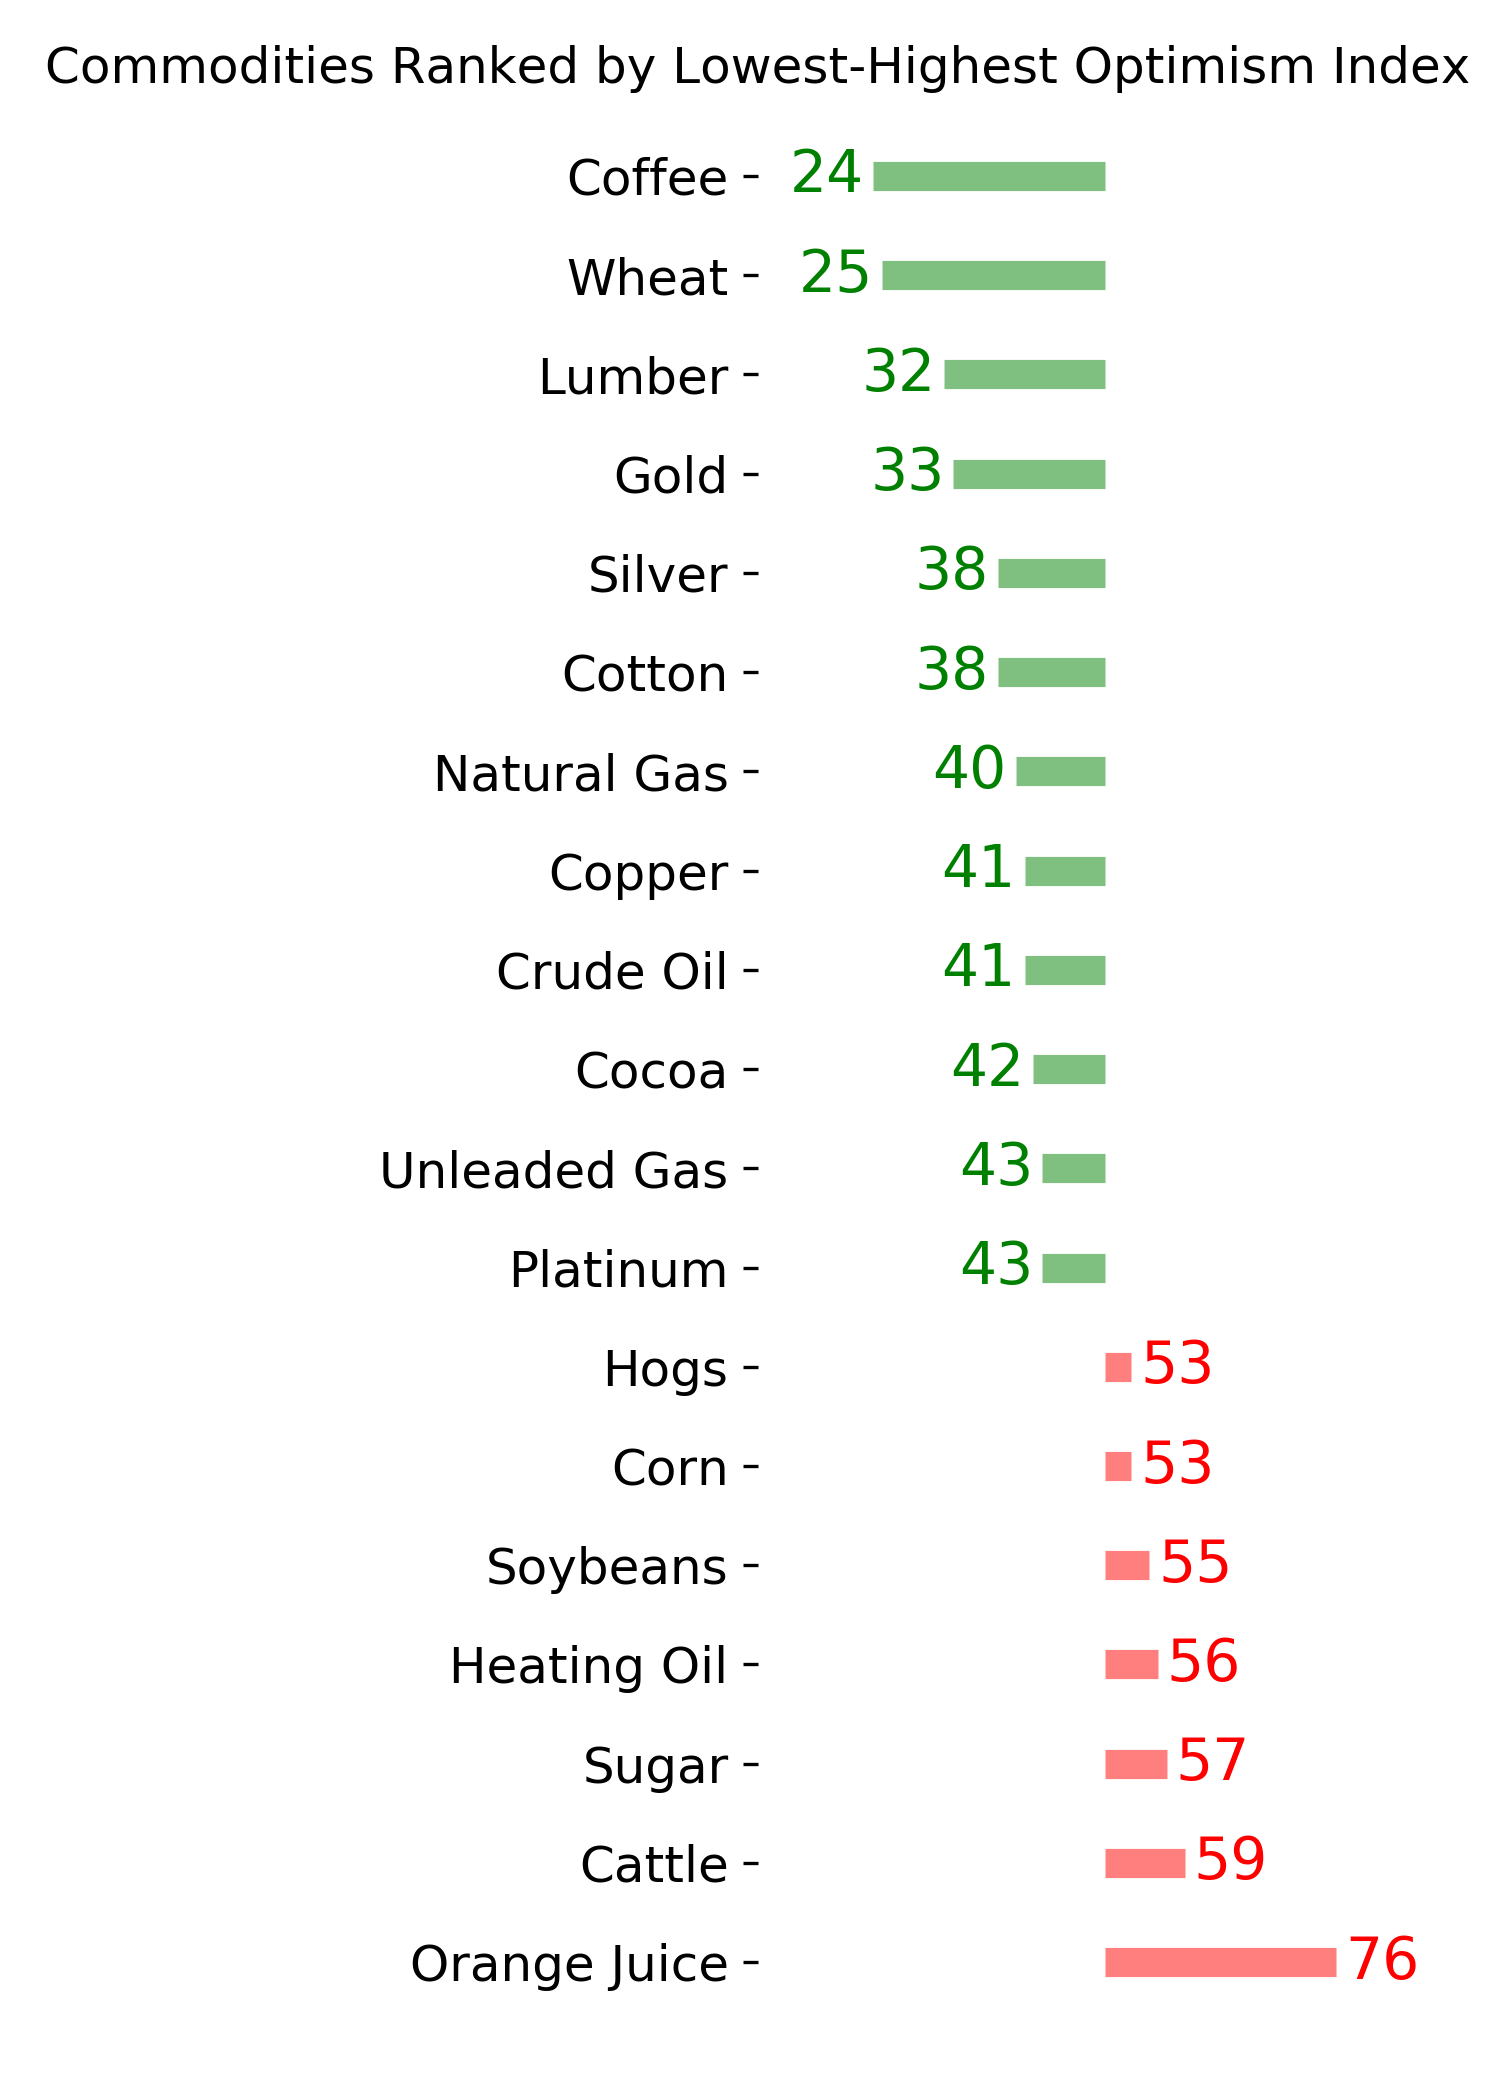
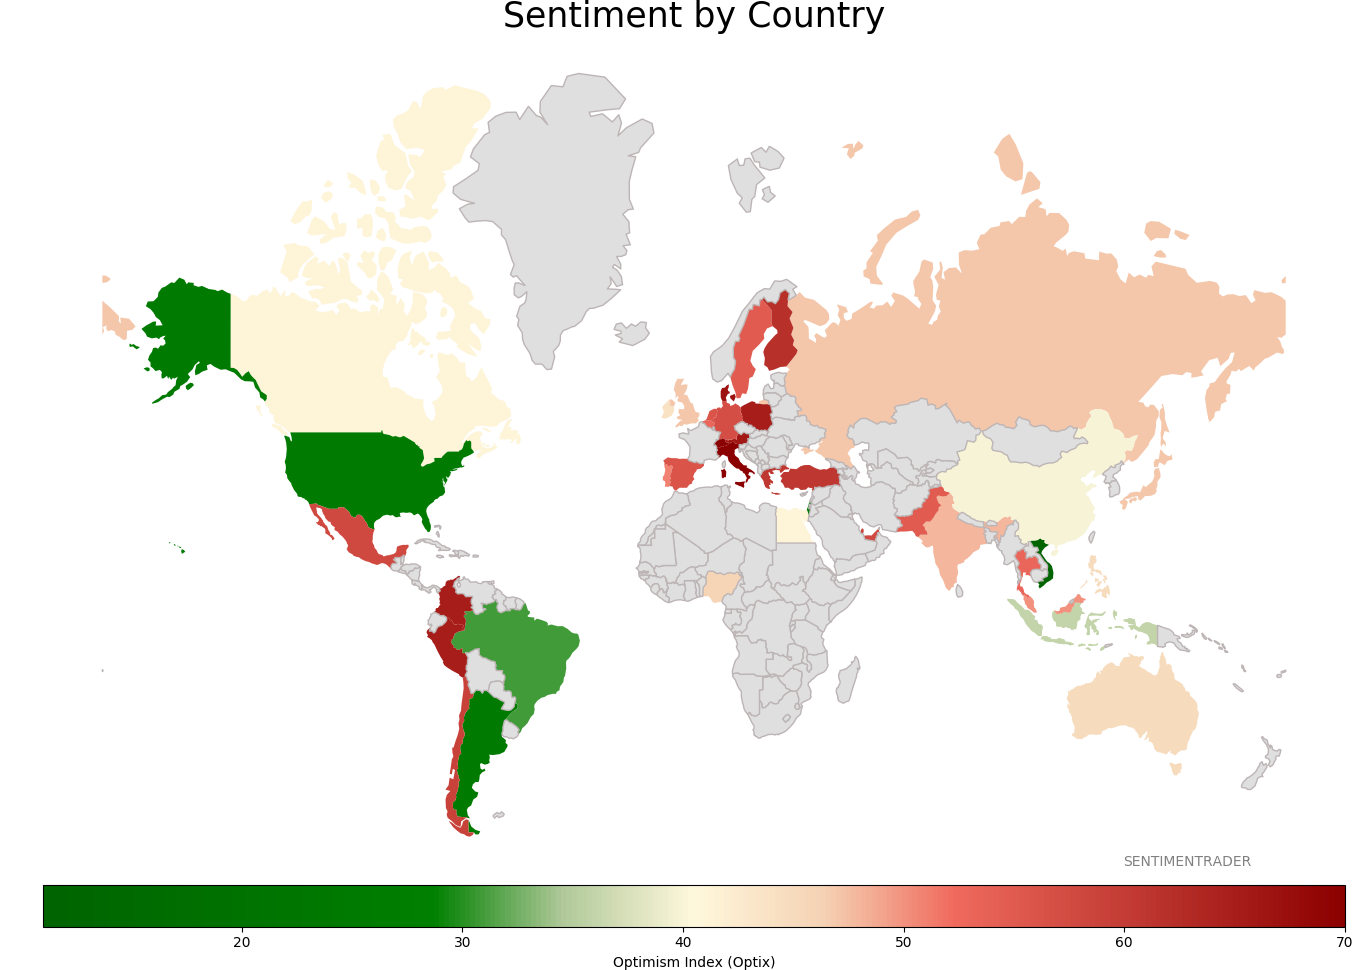
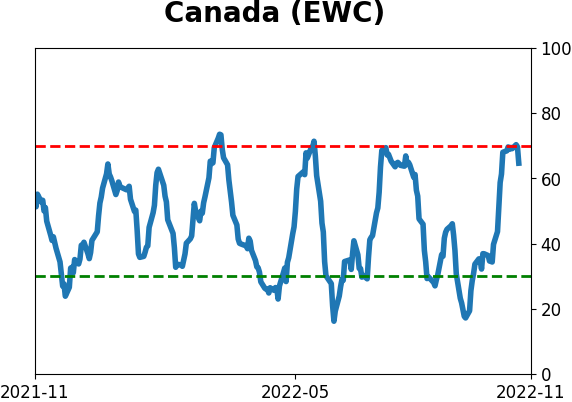
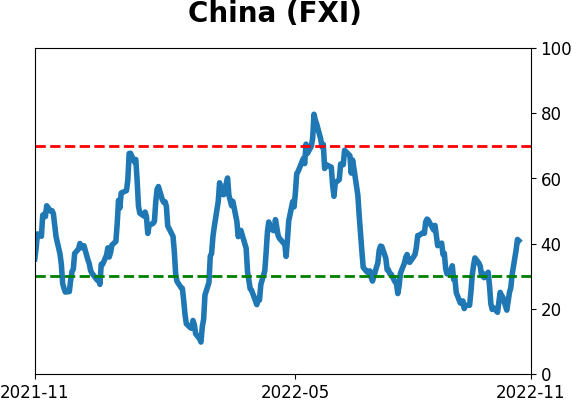
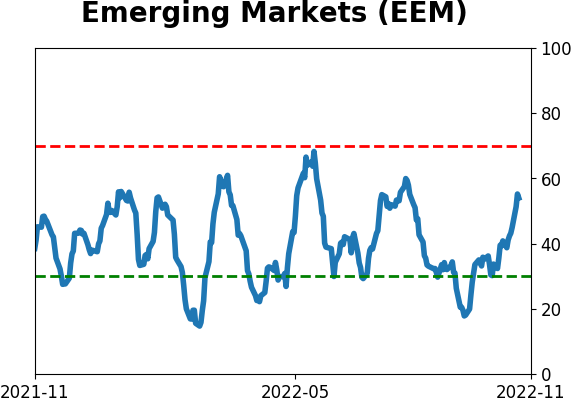
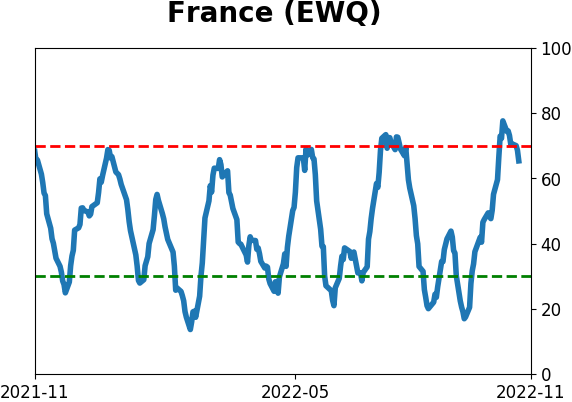
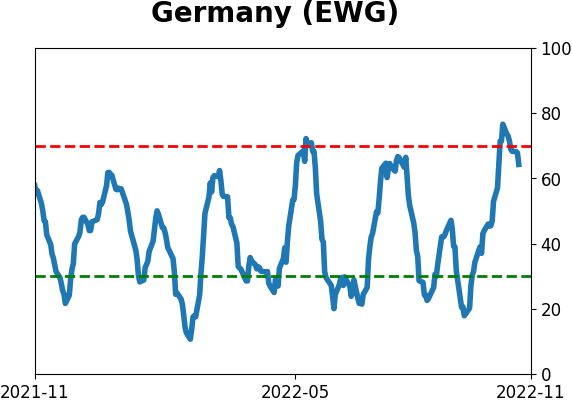
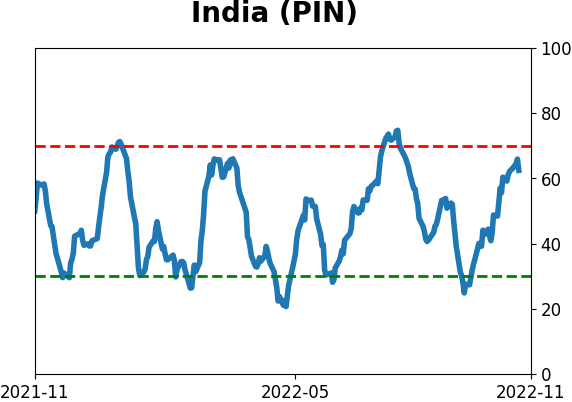
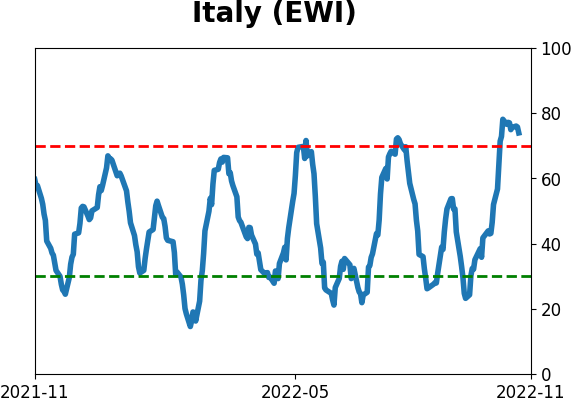
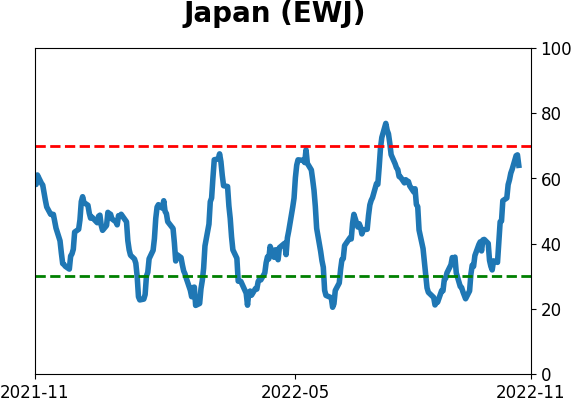
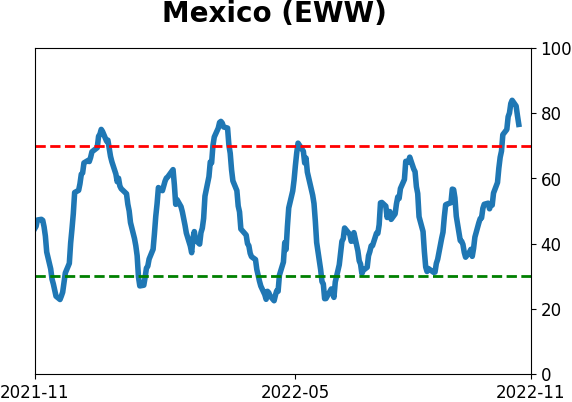
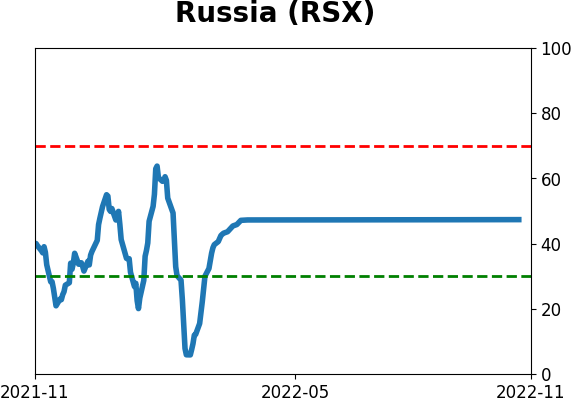
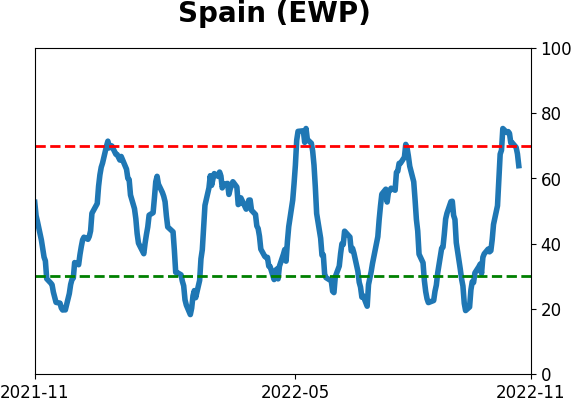
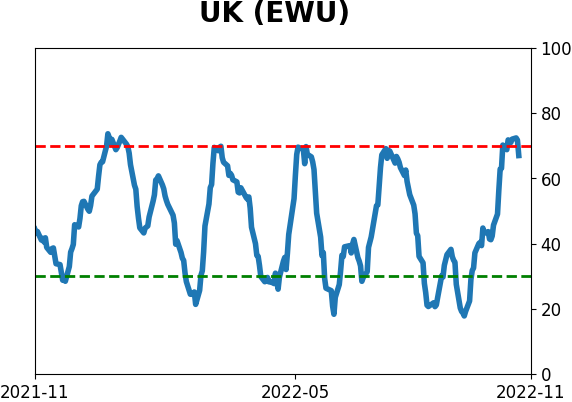
Sentiment Around The World
Optimism Index Thumbnails
|
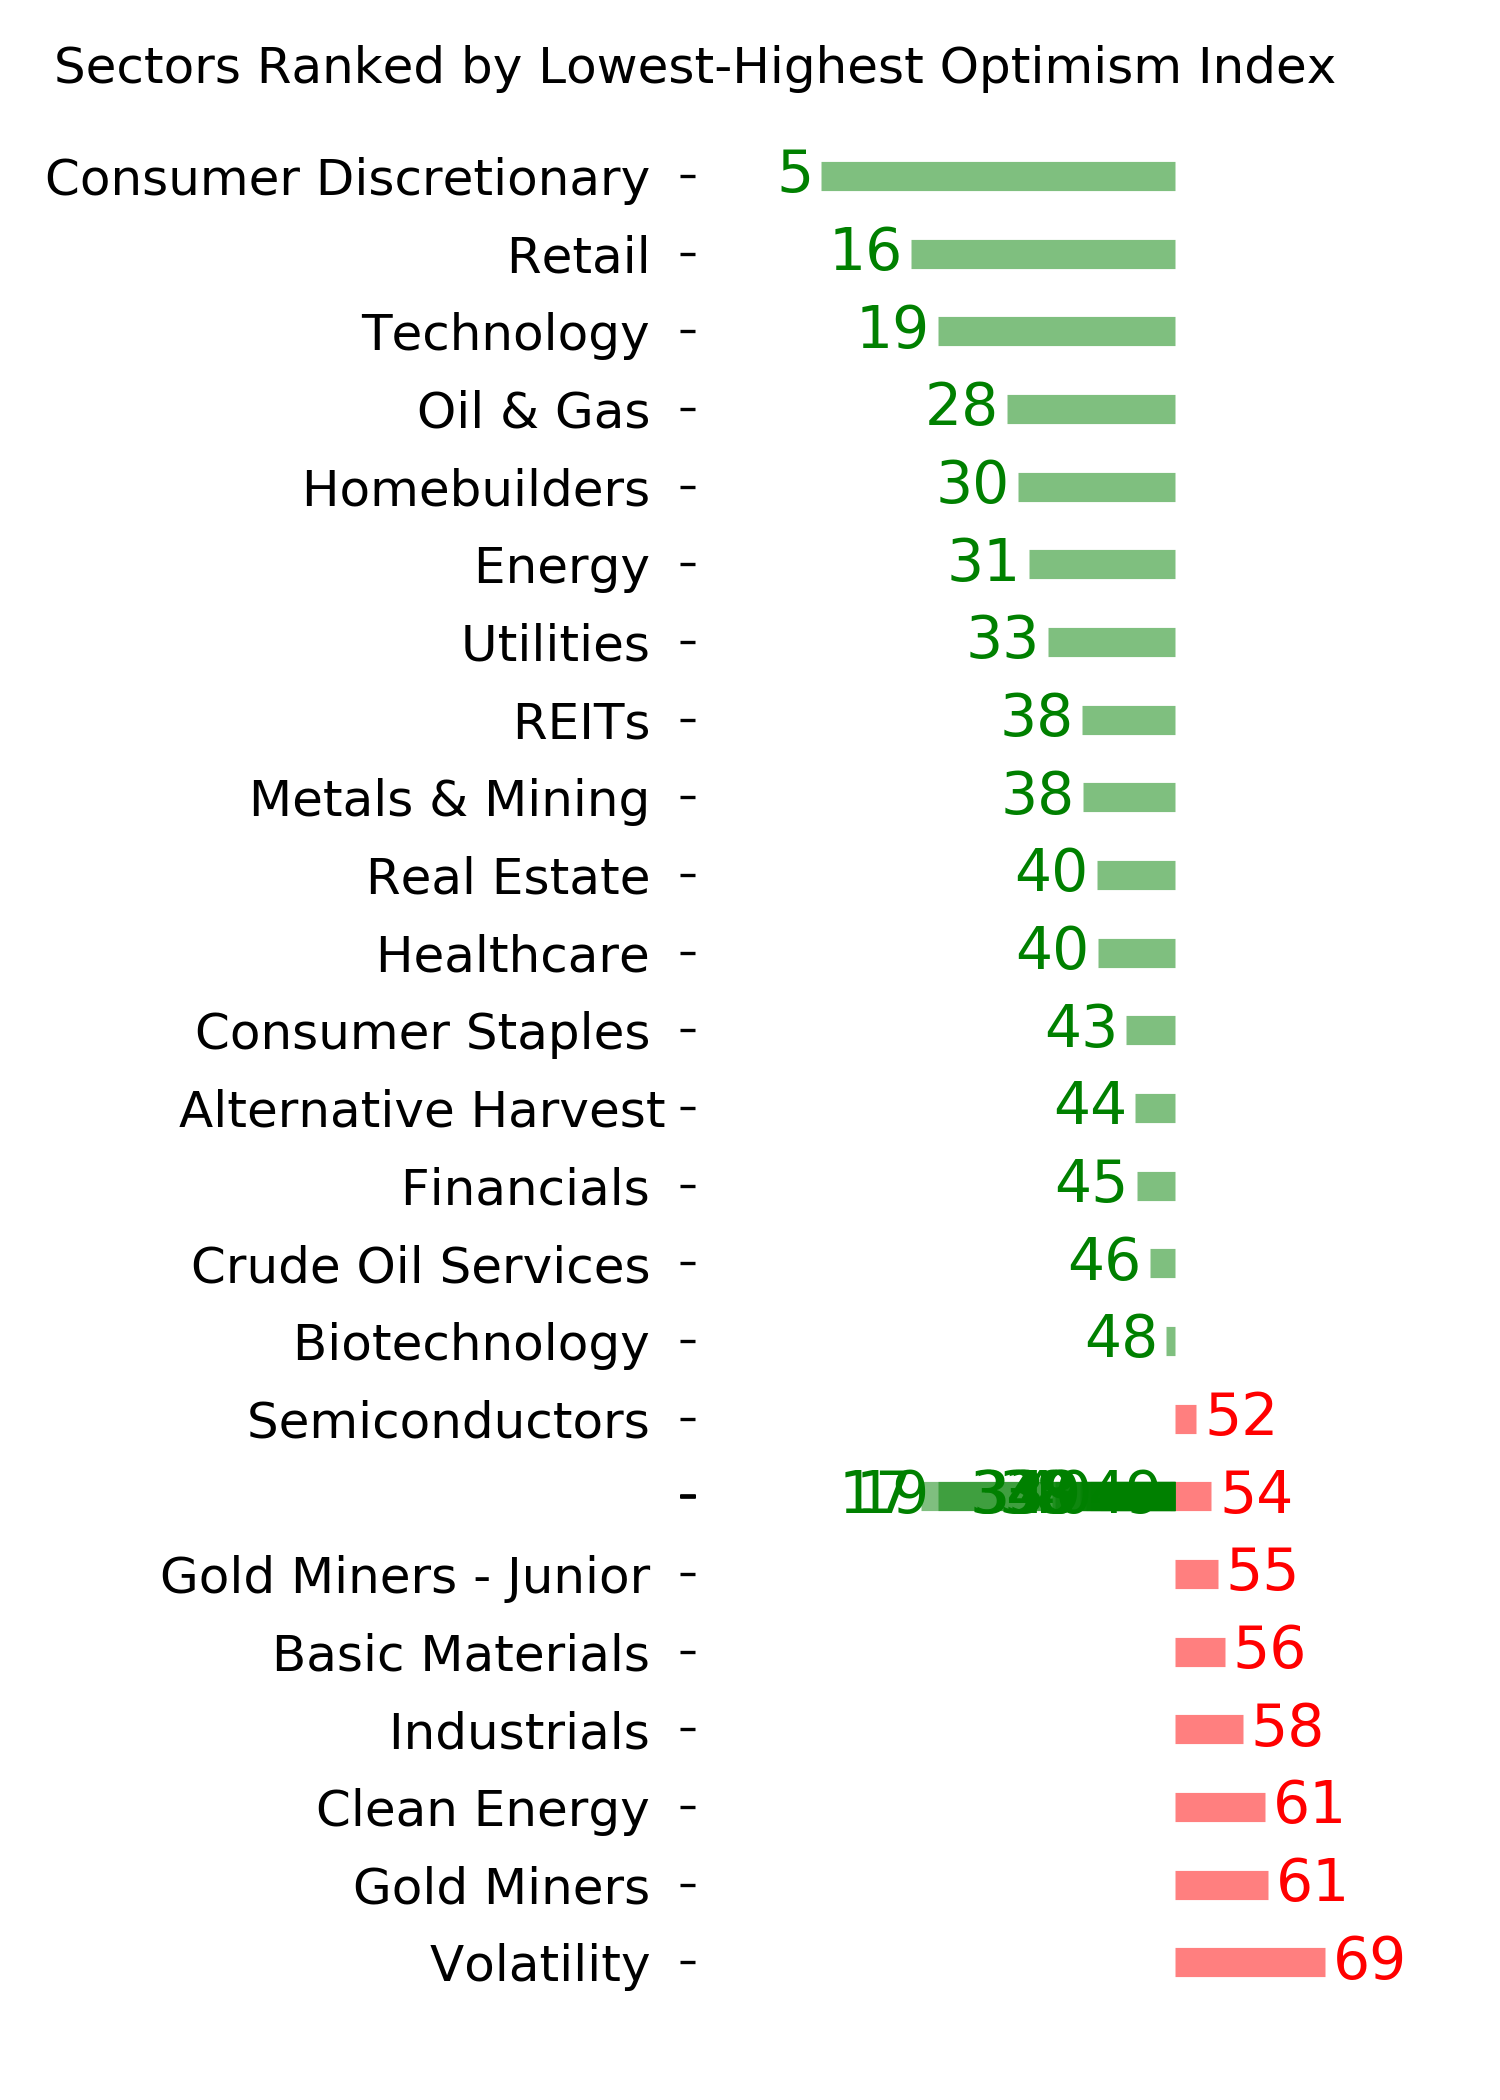
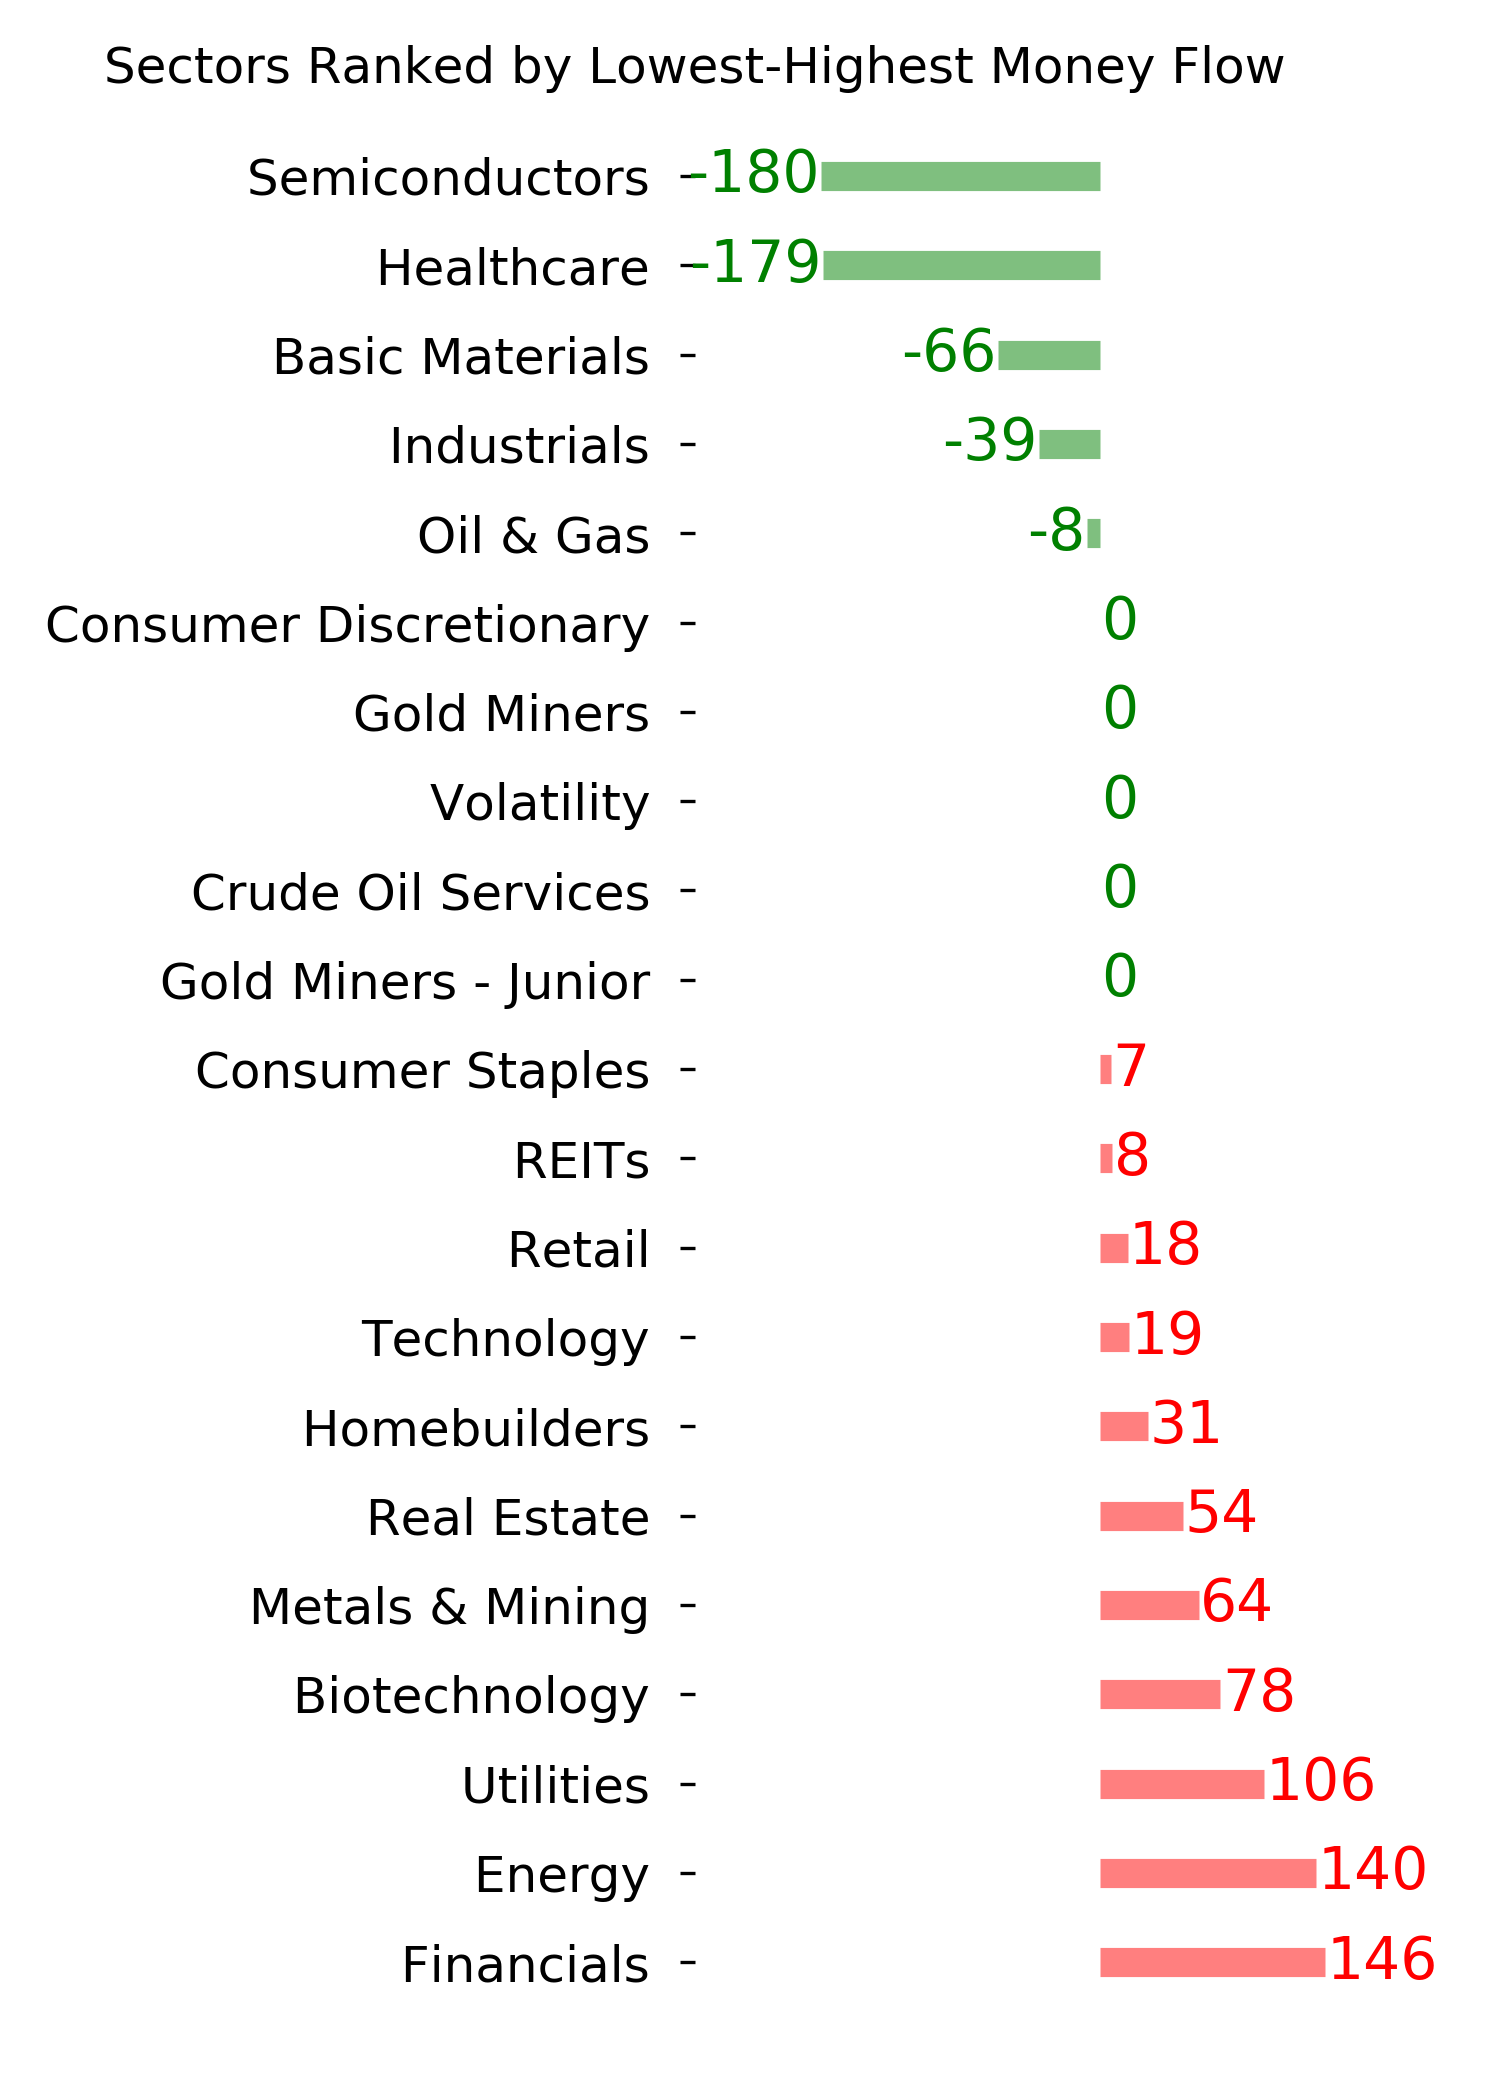
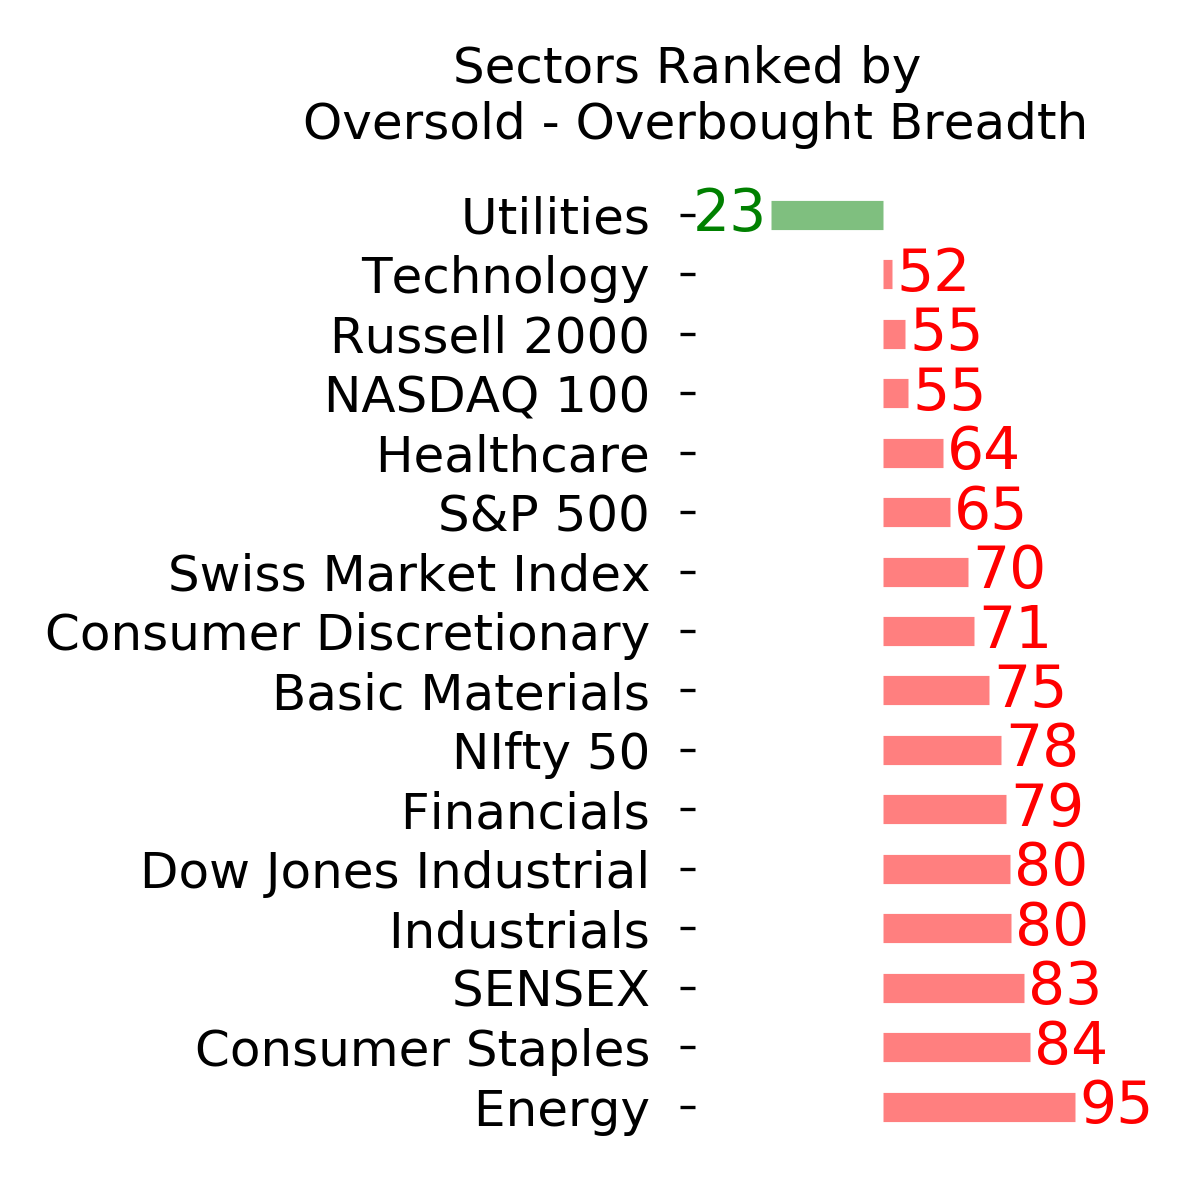
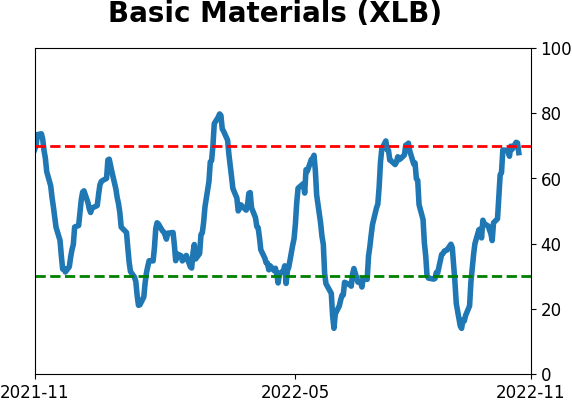
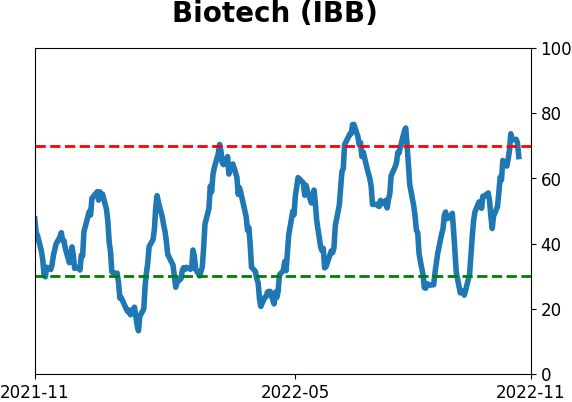
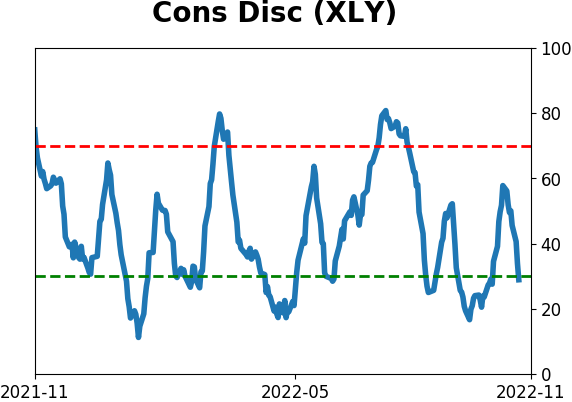
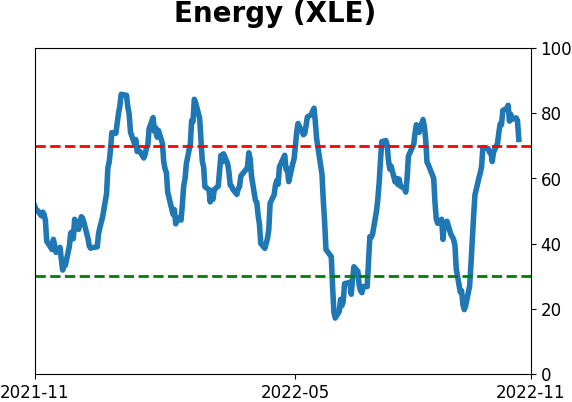
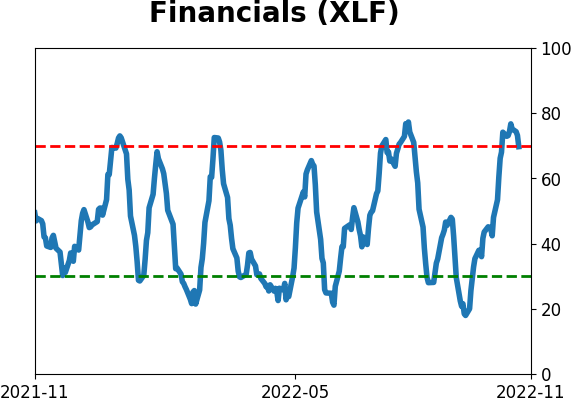
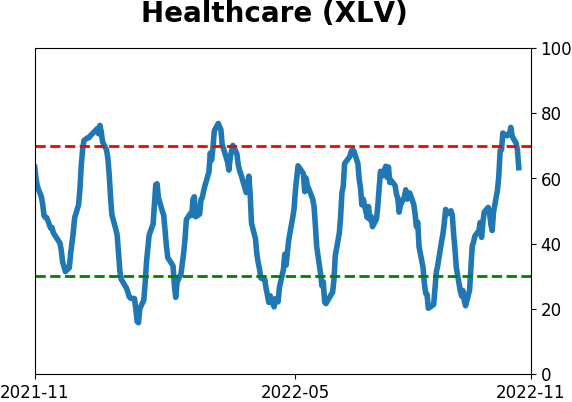
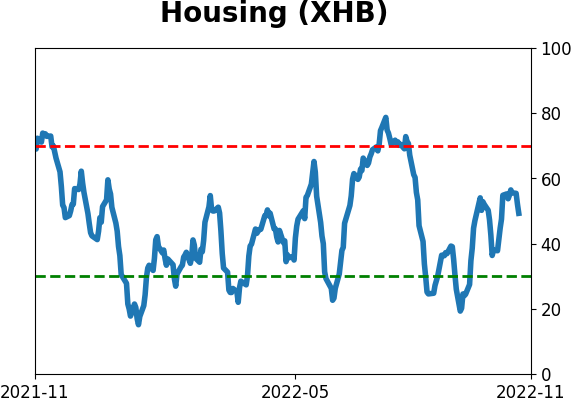
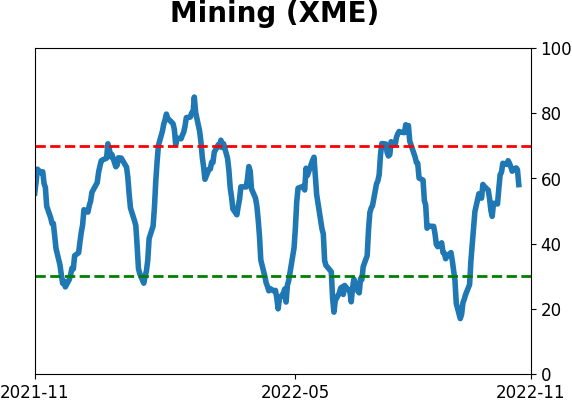
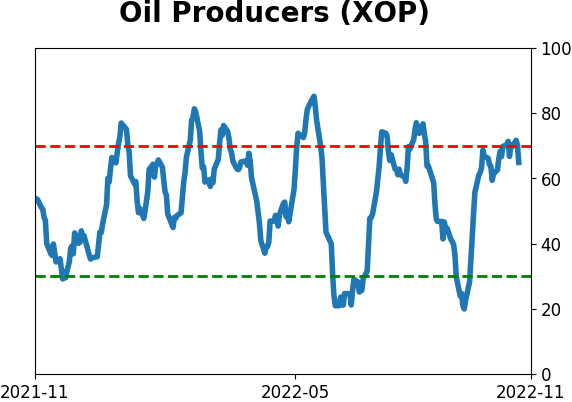
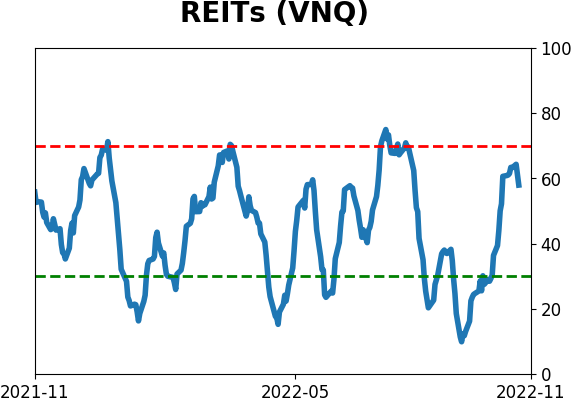
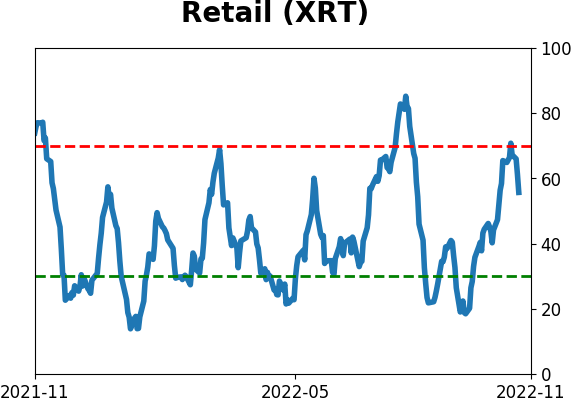
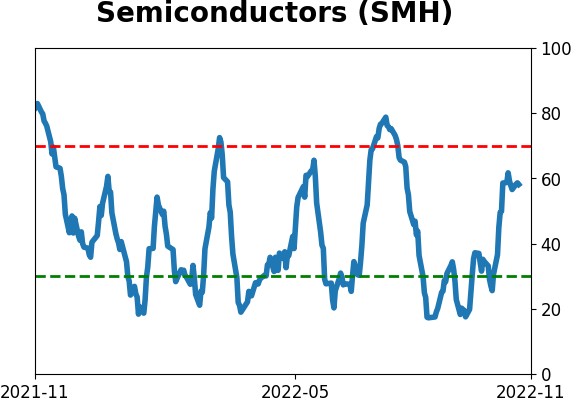
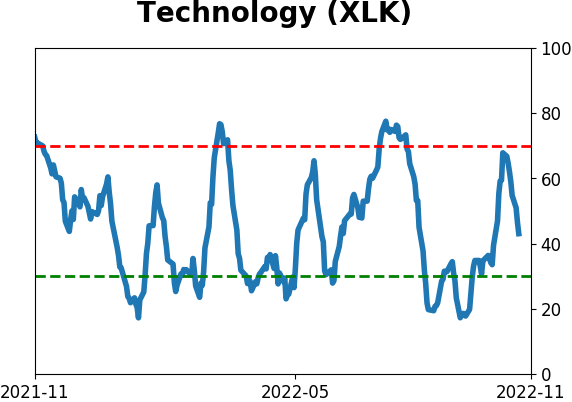
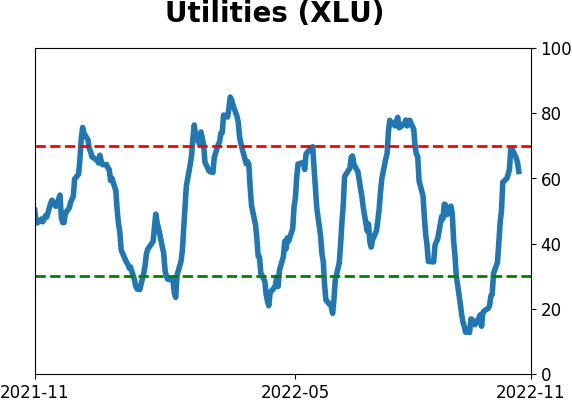
Sector ETF's - 10-Day Moving Average
|
|
|
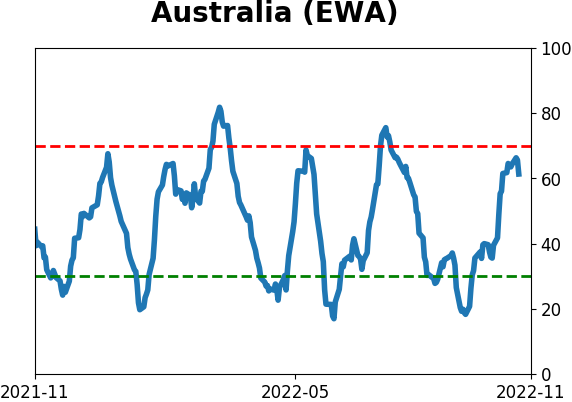
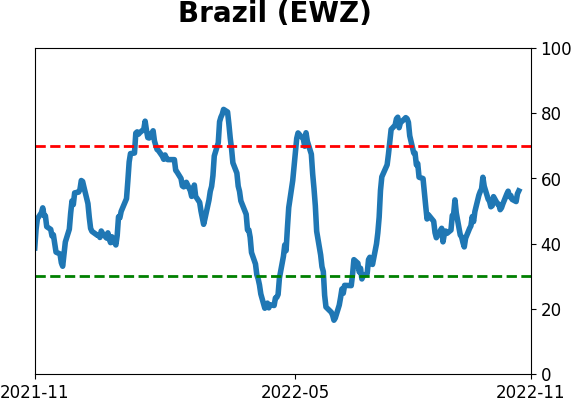
Country ETF's - 10-Day Moving Average
|
|
|
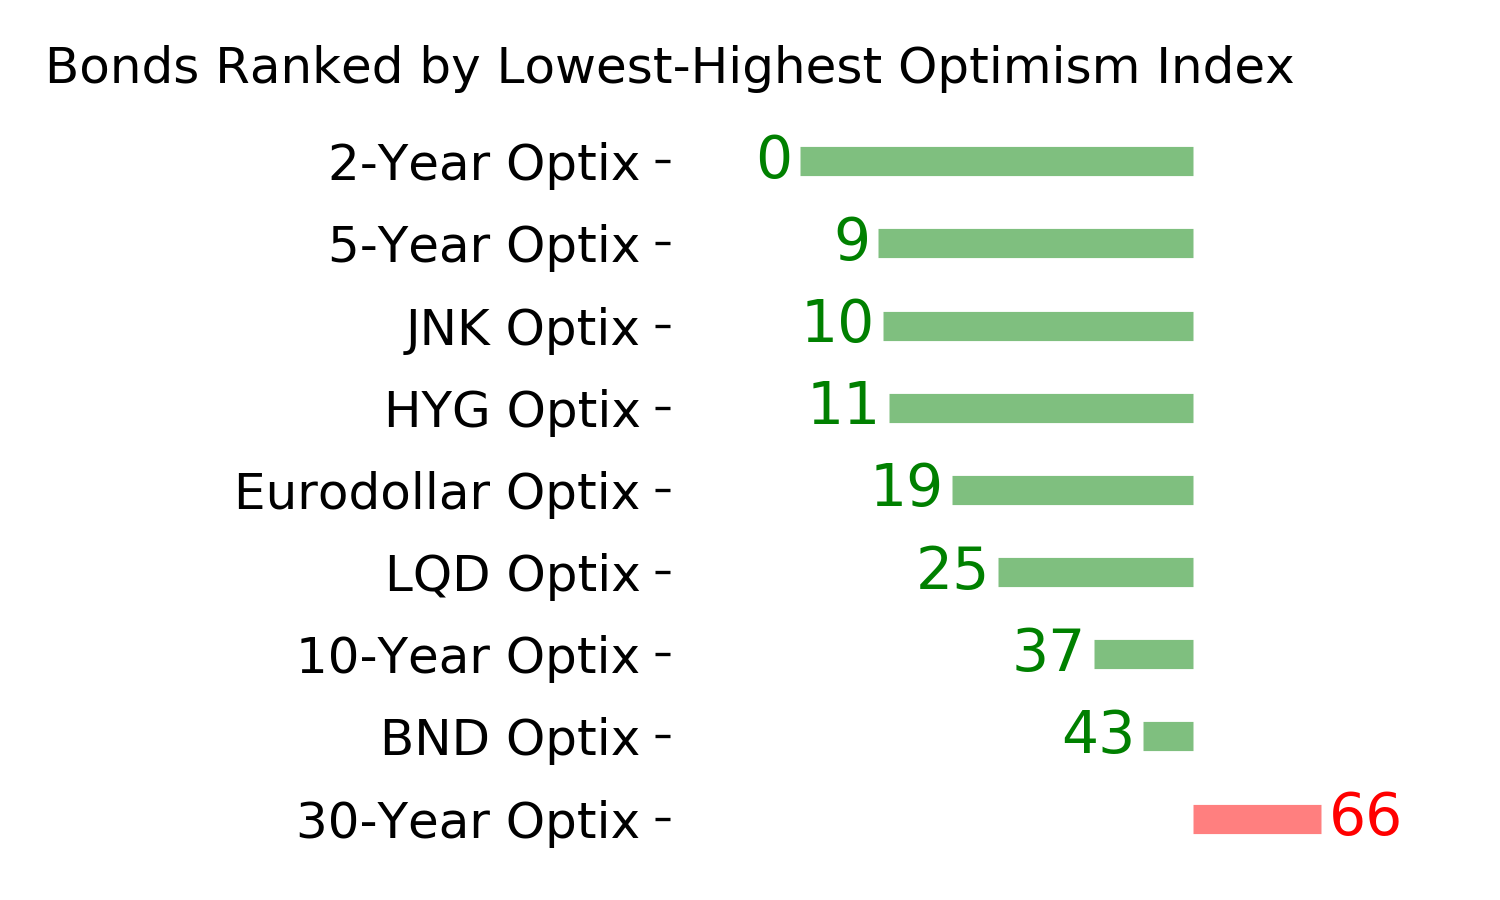
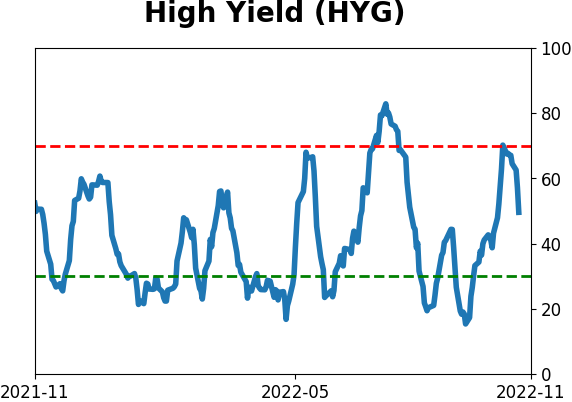
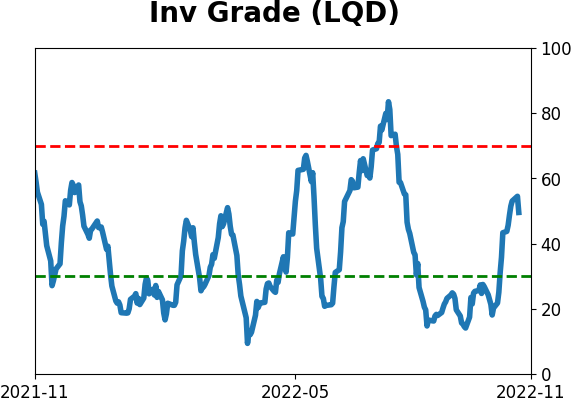
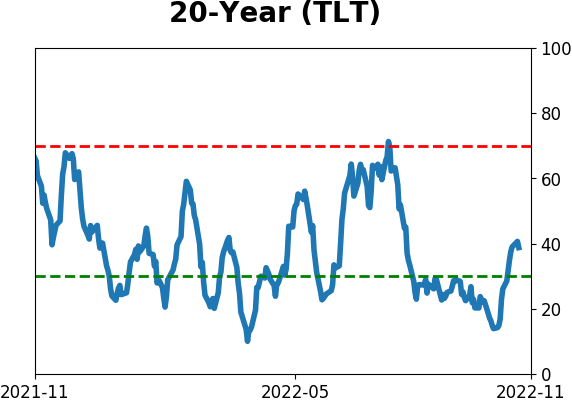
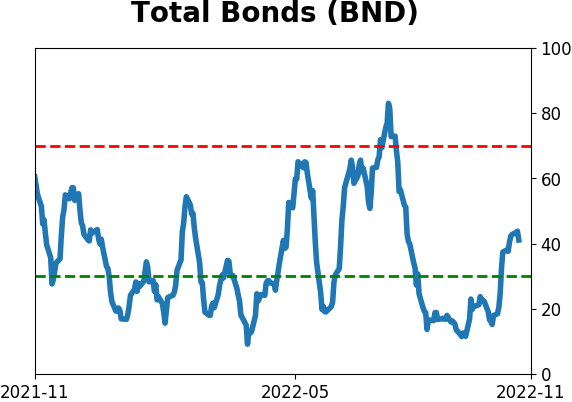
Bond ETF's - 10-Day Moving Average
|
|
|
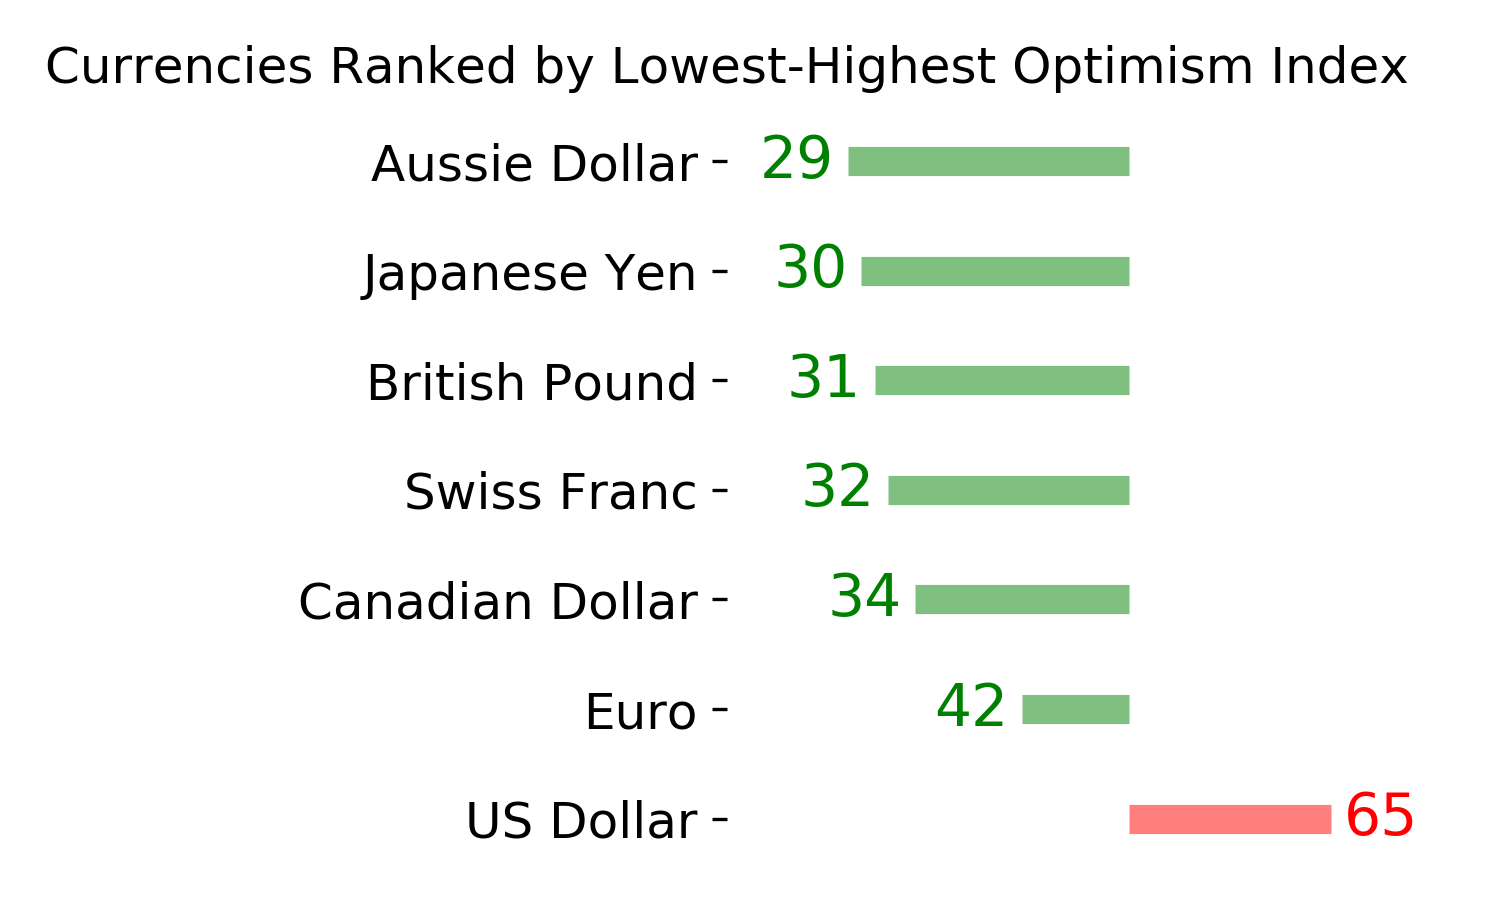
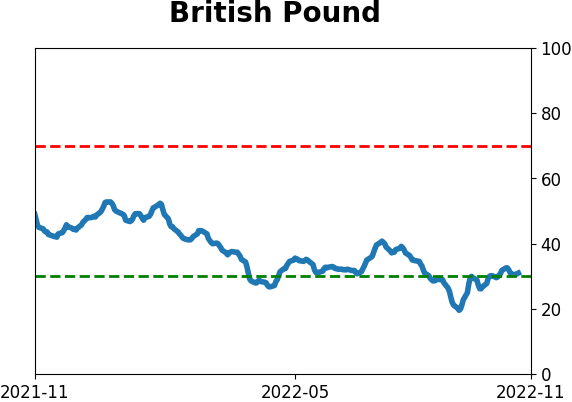
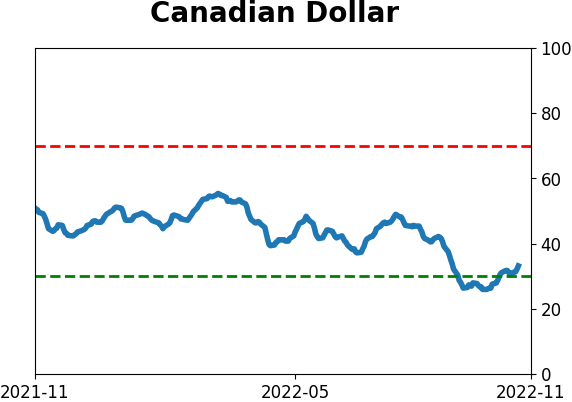
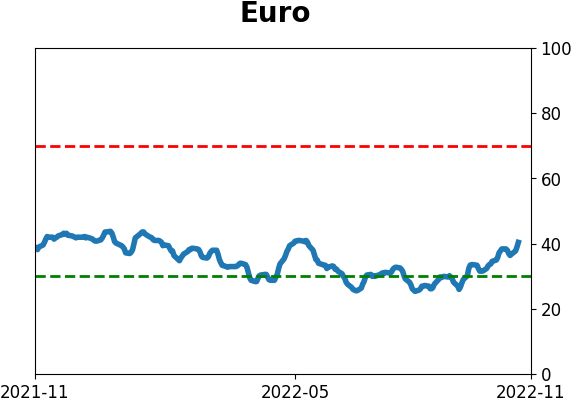
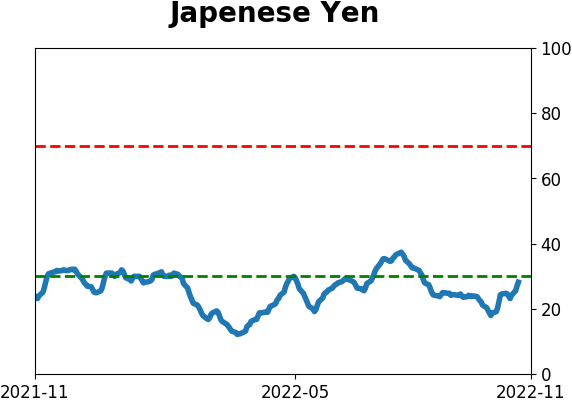
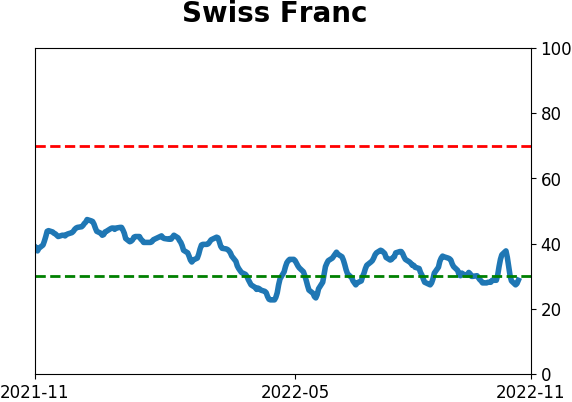
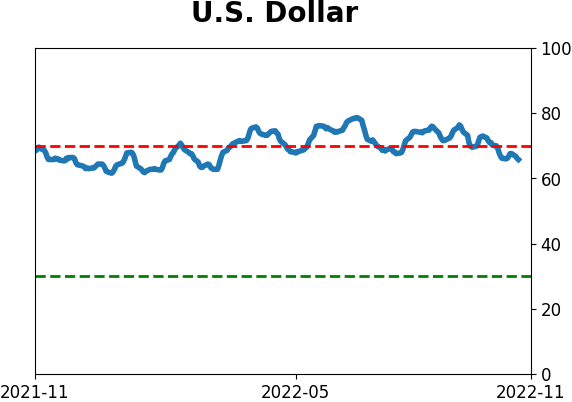
Currency ETF's - 5-Day Moving Average
|
|
|
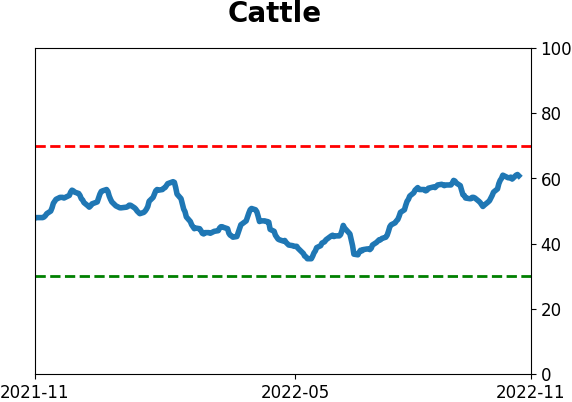
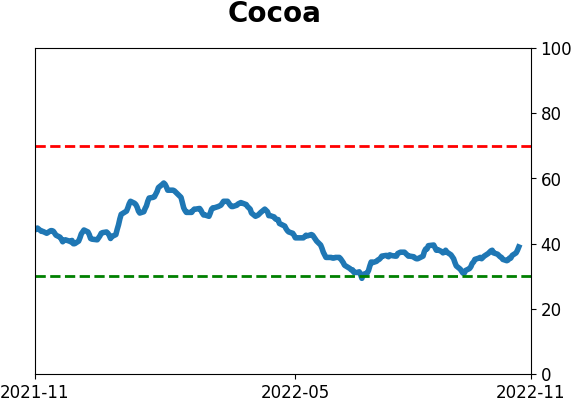
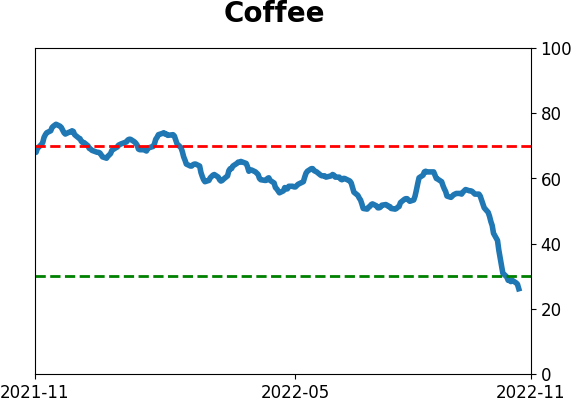
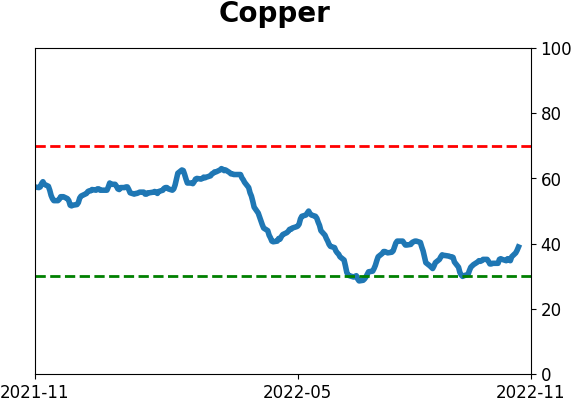
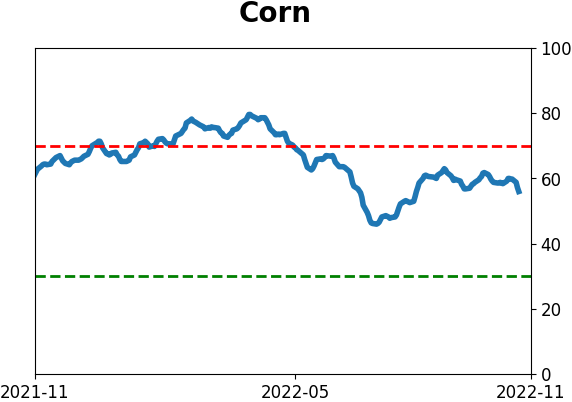
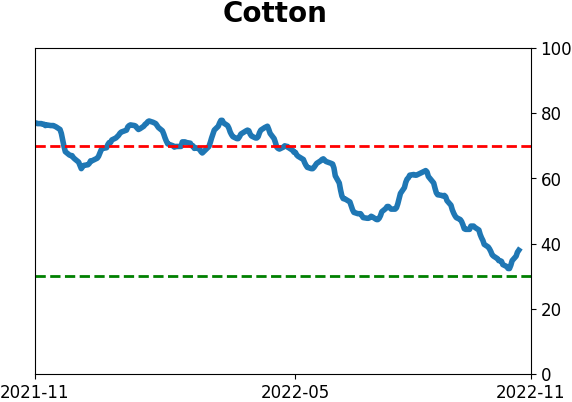
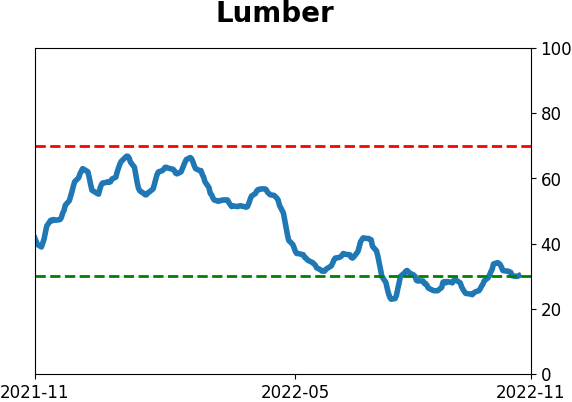
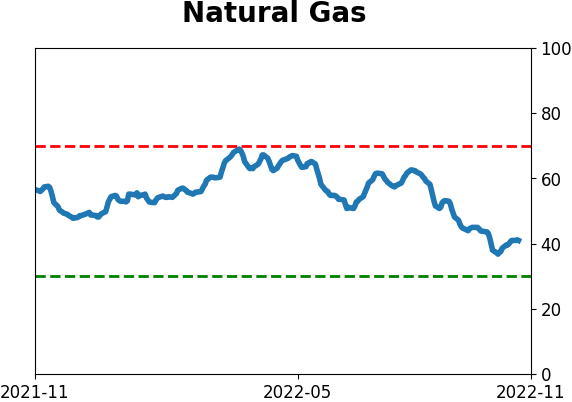
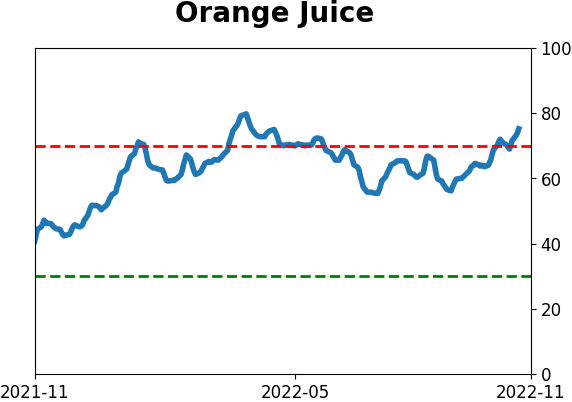
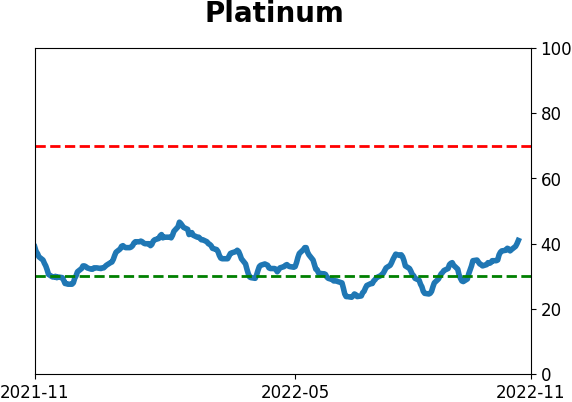
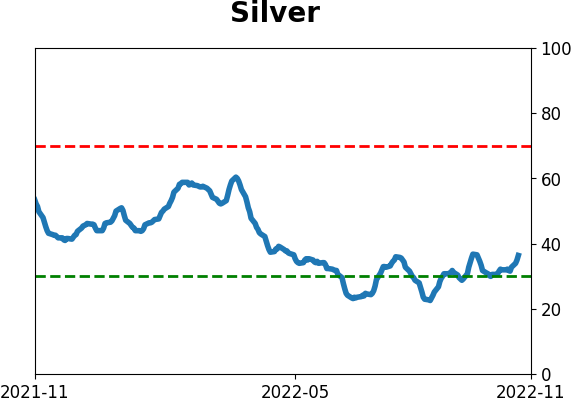
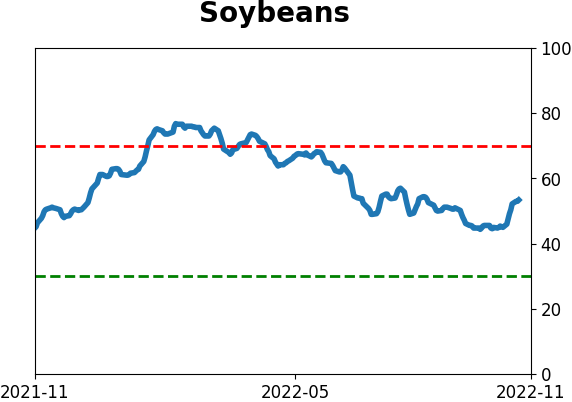
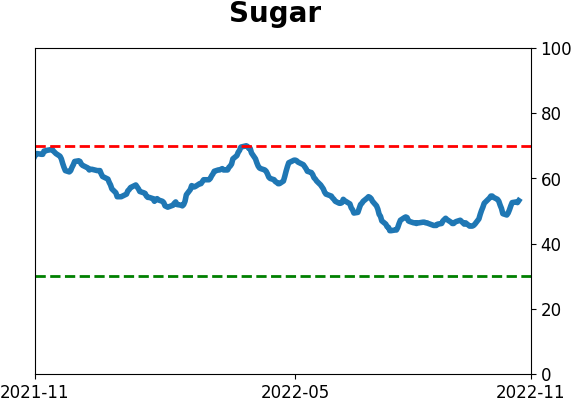
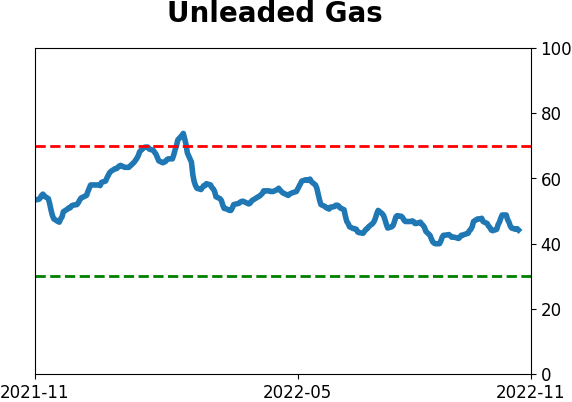
Commodity ETF's - 5-Day Moving Average
|
|