Headlines
|
|
A bevy of breadth bursts:
The small-cap Russell 2000 index saw so many stocks decline and then advance, in such a quick fashion, that it triggered its own Zweig Breadth Thrust. Other thrusts preceded gains for Small Caps and especially for the S&P 500. Several S&P sectors also triggered ZBT signals, adding to a positive environment.
|
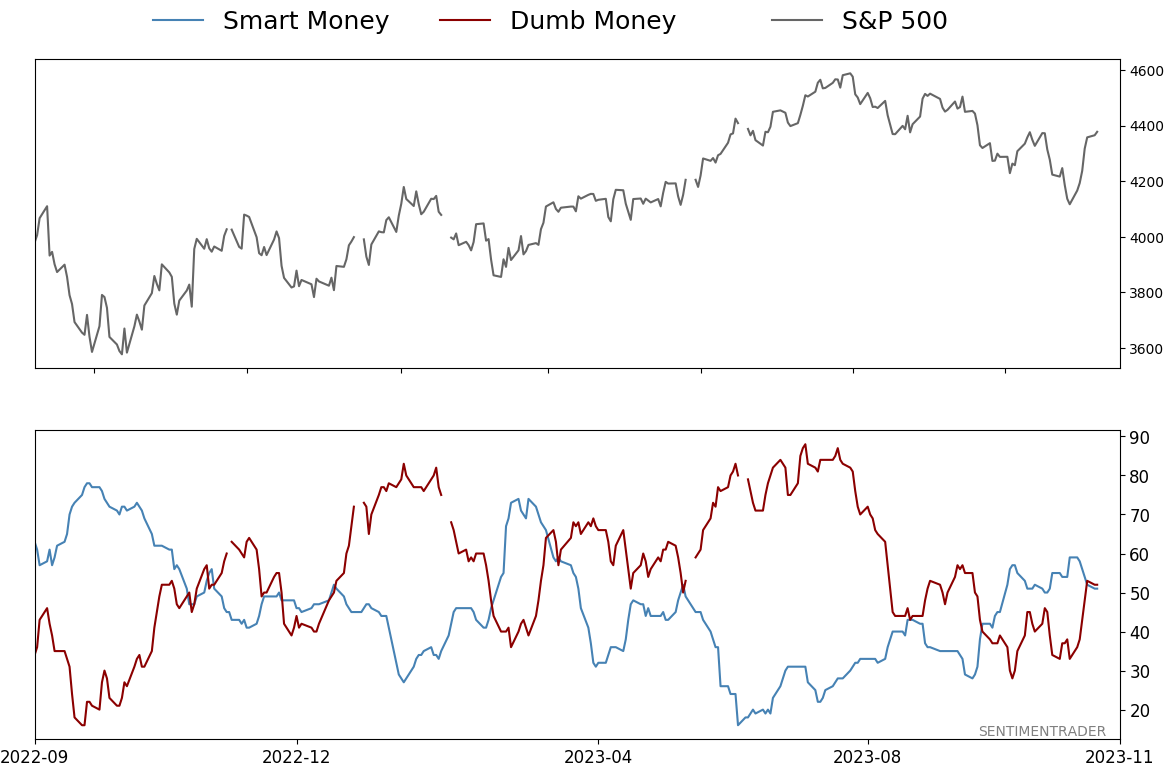
Smart / Dumb Money Confidence
|
Smart Money Confidence: 51%
Dumb Money Confidence: 52%
|
|
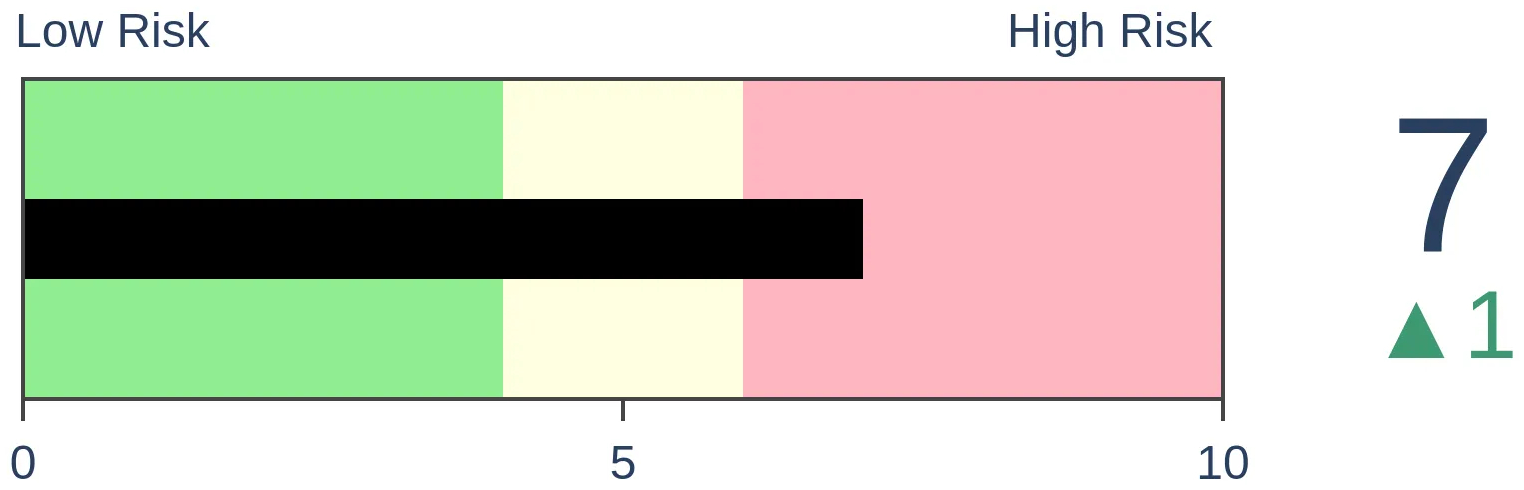
Risk Levels
Stocks Short-Term
|
Stocks Medium-Term
|
|
Bonds
|
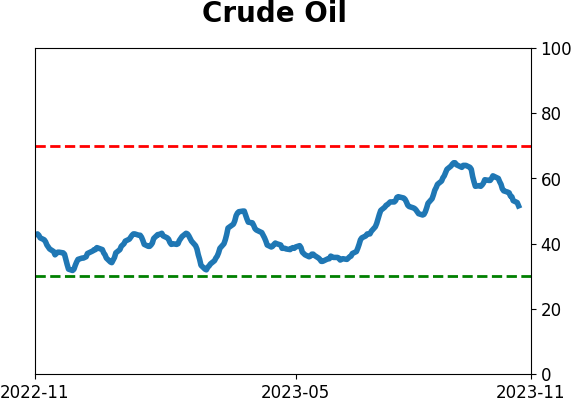
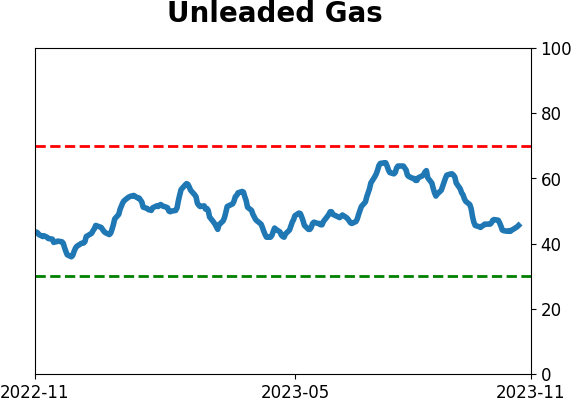
Crude Oil

|
|
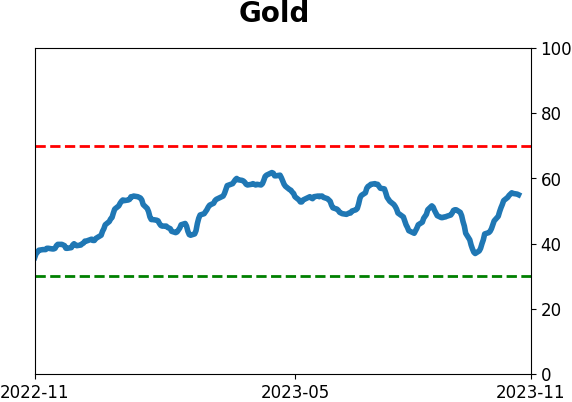
Gold
|
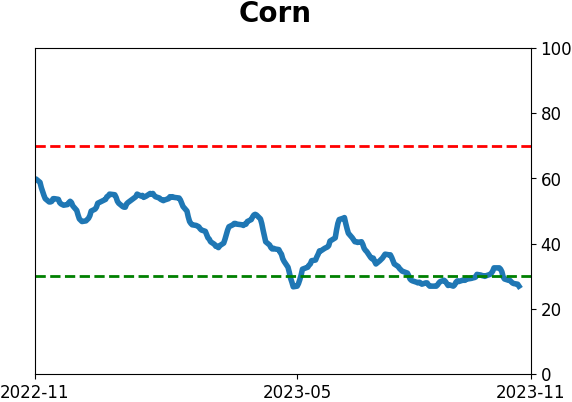
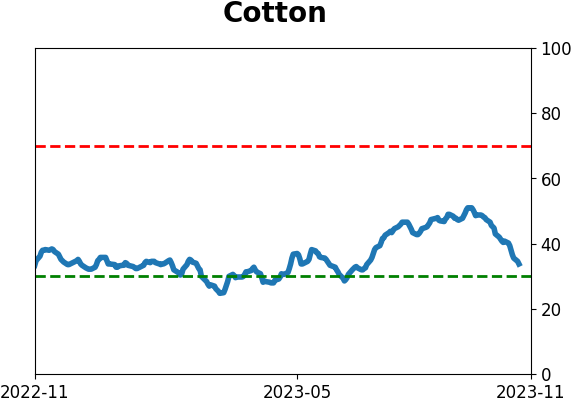
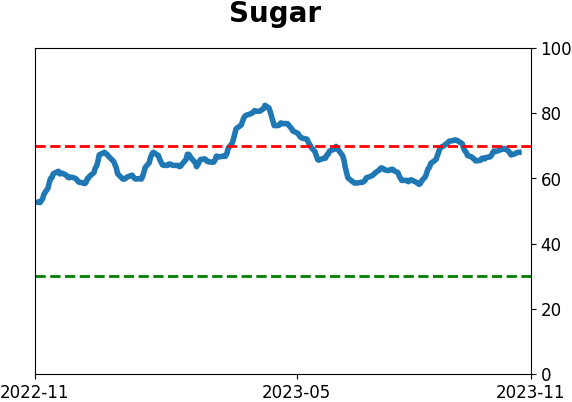
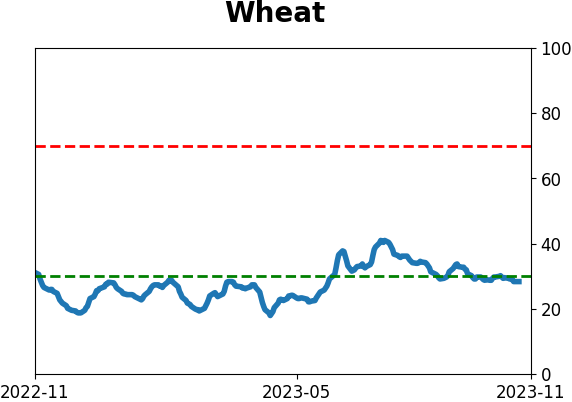
Agriculture

|
|
Research
By Jason Goepfert
BOTTOM LINE
The small-cap Russell 2000 index saw so many stocks decline and then advance, in such a quick fashion, that it triggered its own Zweig Breadth Thrust. Other thrusts preceded gains for Small Caps and especially for the S&P 500. Several S&P sectors also triggered ZBT signals, adding to a positive environment.
FORECAST / TIMEFRAME
None
|
Key points:
- The Russell 2000 saw so many stocks cycle from oversold to overbought that it triggered its own Zweig Breadth Thrust
- Other signals preceded solid gains for the index and even more so for the S&P 500
- Several S&P sectors also triggered ZBT signals, again a very positive sign for forward returns
Small Caps enjoyed a significant thrust for the first time in 3 years
Yesterday, we saw that the Zweig Breadth Thrust (ZBT) triggered for stocks traded on the NYSE. Among stocks and sectors, the thrusts were fairly broad-based, thanks partly to participation among one of the year's laggards - small-cap stocks.
As we saw with the broader NYSE data, Small Caps narrowly missed the parameters for a ZBT throughout the 2022 bear market. It either reached the necessary extremes but didn't cycle fast enough or cycled fast enough but didn't quite exceed the upper or lower extremes. Thanks to Dean for pointing out that this time, Small Caps met the necessary conditions for the first time since October 2020.
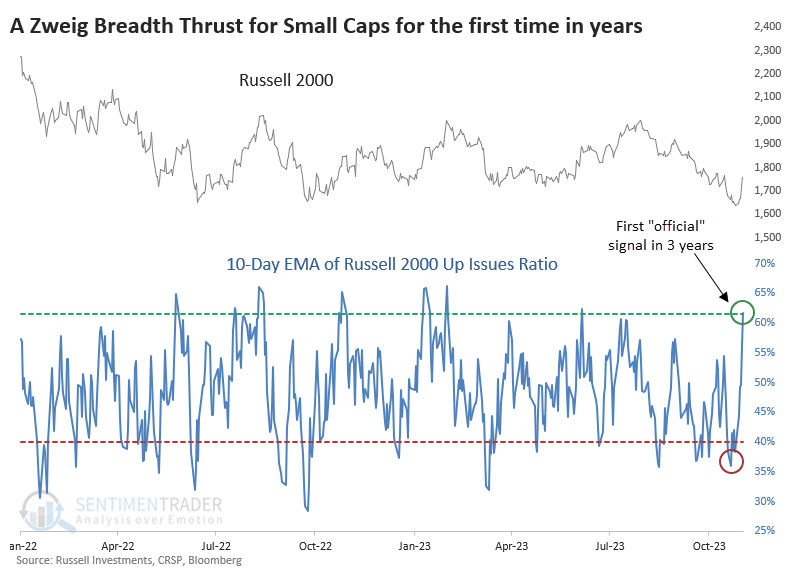
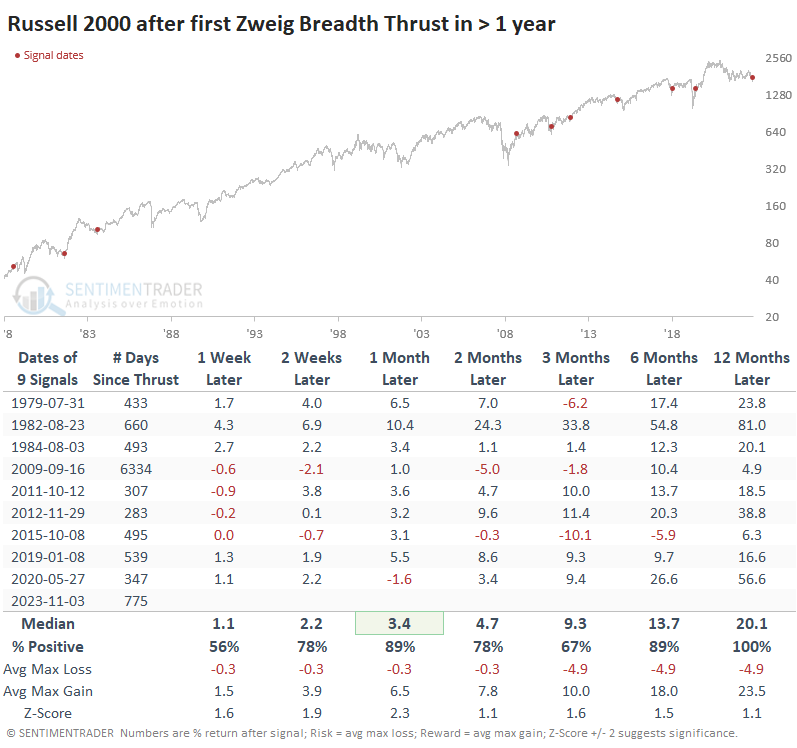
This was the 2nd-longest stretch between thrusts in the index's history, next to the long dry spell after the 2008 financial crisis. It took 775 days since breadth among Small Caps met the ZBT criteria, and the wait was worth it. Forward returns were consistent after these signals, though the sample size was small, so the usual caveats apply.
Over the next year, the Russell 2000 showed a positive return each time, averaging more than +20%, and enjoyed more than a 4-to-1 reward-to-risk ratio. The only signal that would have likely shaken out an investor occurred in 2015 when the index suffered more than a -10% pullback before rallying strongly.
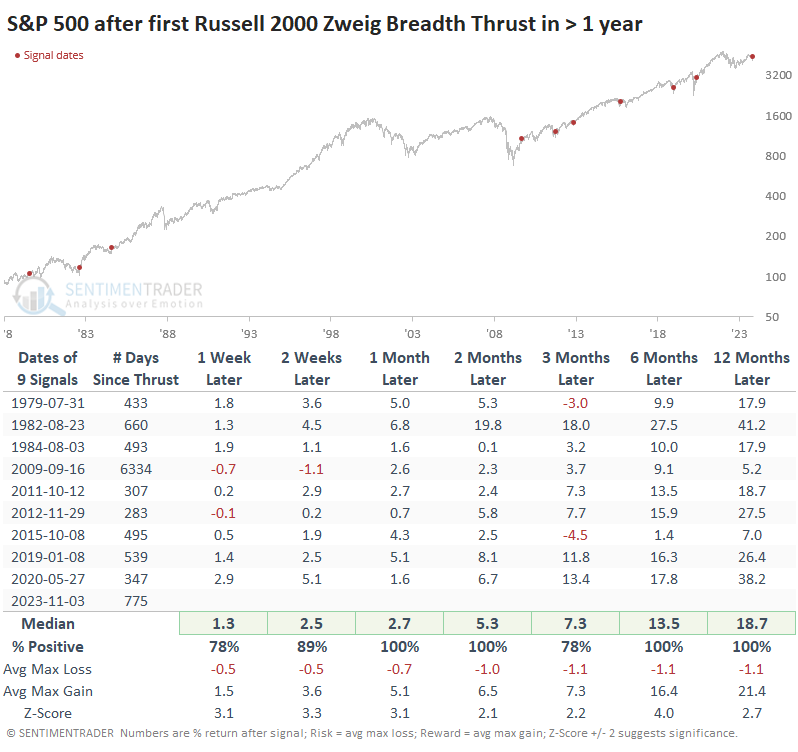
When Small Caps do well, the S&P 500 often does even better, and that was the case here. It was unusual to see a loss in any time frame after any signal, and none were meaningful. The ratio of maximum gains to maximum losses was ridiculously skewed to the positive side. None of the signals saw the S&P pull back more than -9.2% at any point within the following year.
Thrusts have triggered across sectors
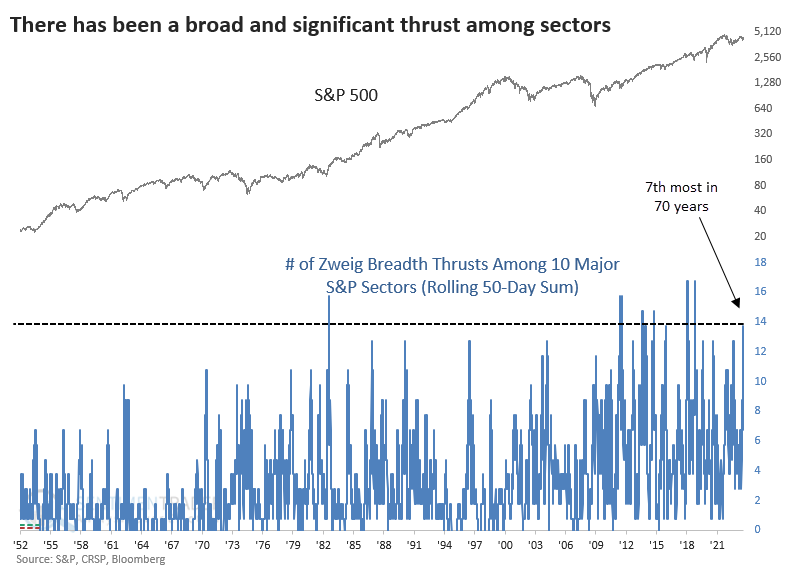
Thanks to more volatile trading behavior and generally higher correlations among stocks, breadth figures among sectors have become whippier than in prior decades. We can see that below, which looks at the total number of ZBT signals across the ten major S&P 500 sectors over a rolling 50-day period.
The Discretionary and Technology sectors triggered Zweig Breadth Thrust signals on Friday. Thanks to some signals in August and another surge last week, we've now seen 14 total Thrusts across sectors, one of the highest readings in 70 years.
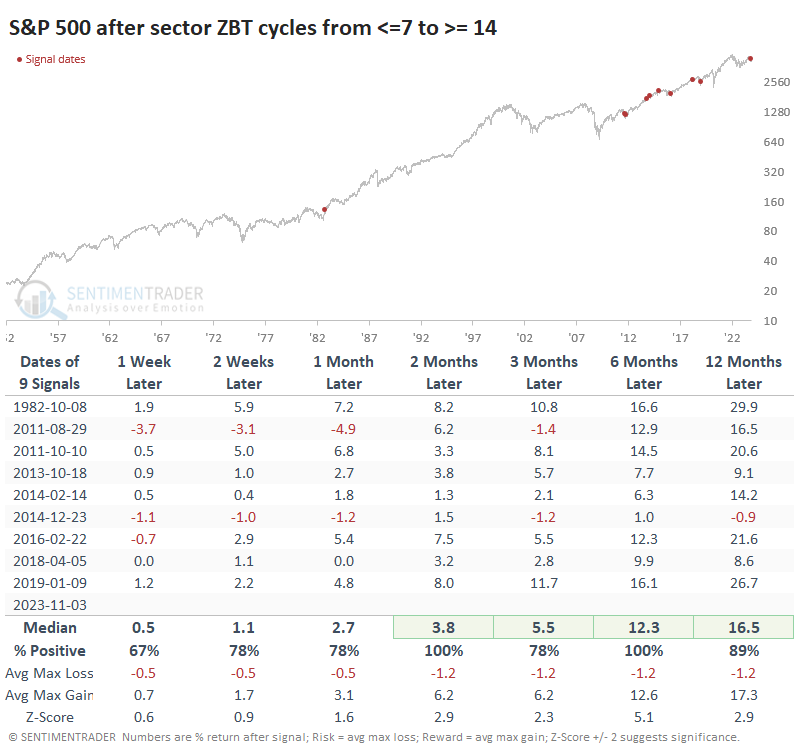
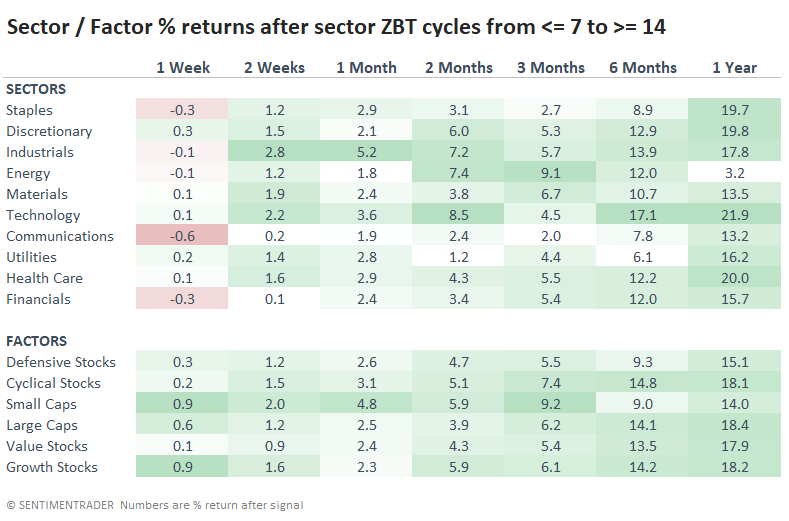
When the count of ZBT sector signals cycled from 7 or fewer to 14 or more, it was again an excellent sign for the broader S&P 500. The index showed a gain across most time frames and signals, with no significant losses. A reasonable argument against weighting this too heavily is that all but one signal triggered since the financial crisis, so we don't have a wide variety of market environments in the sample.
It's not a big surprise that among sectors and factors, higher-beta ones tended to show better returns after these cycles, but it was kind of an embarrassment of riches as they all tended to rise.
What the research tells us...
Nothing is infallible in auction markets, and breadth thrusts are no exception, even ones with a long history of real-time success. Still, it's hard to find fault with the thrusts from last week, as they were impressive, persistent, and broad.
Similar behavior has always preceded higher prices across almost all time frames for the S&P 500 and its major sectors. While it's wise to be cautious of "always," this is one of those signals upon which we place a heavy weight, as it has helped many times in recent decades.
Indicators at Extremes
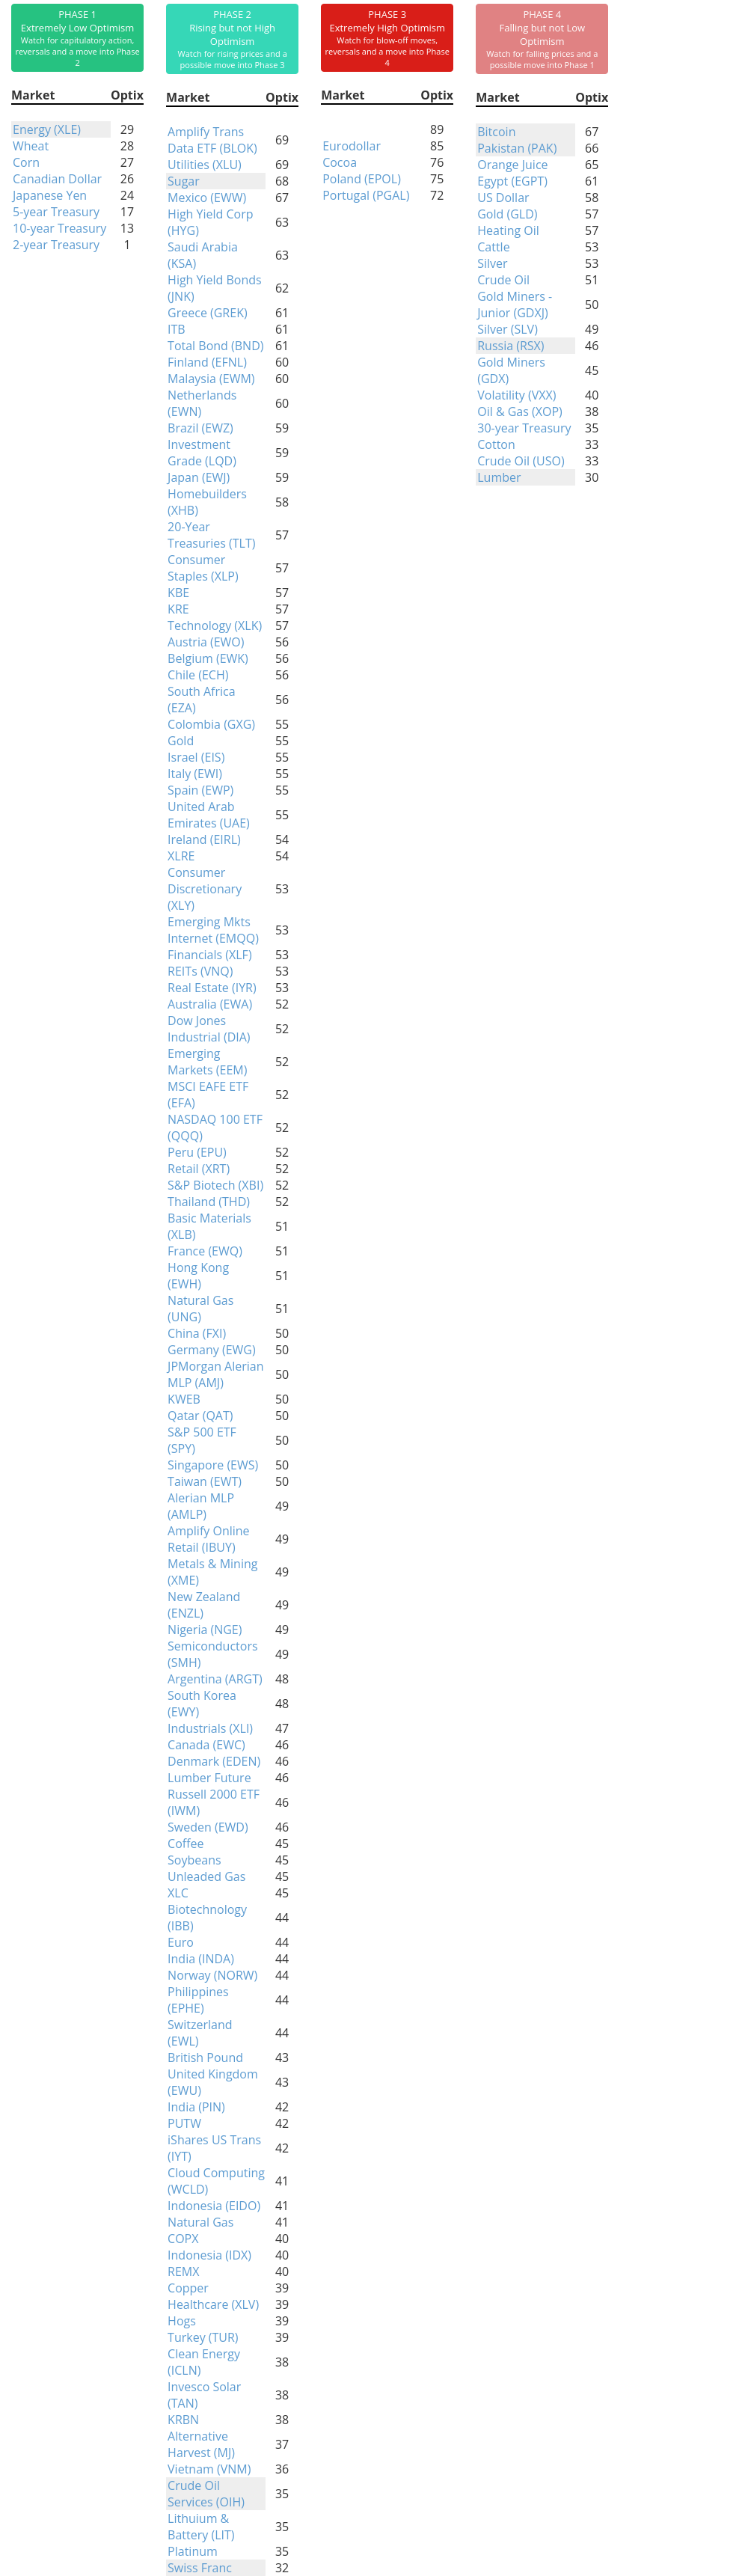
Phase Table
Ranks
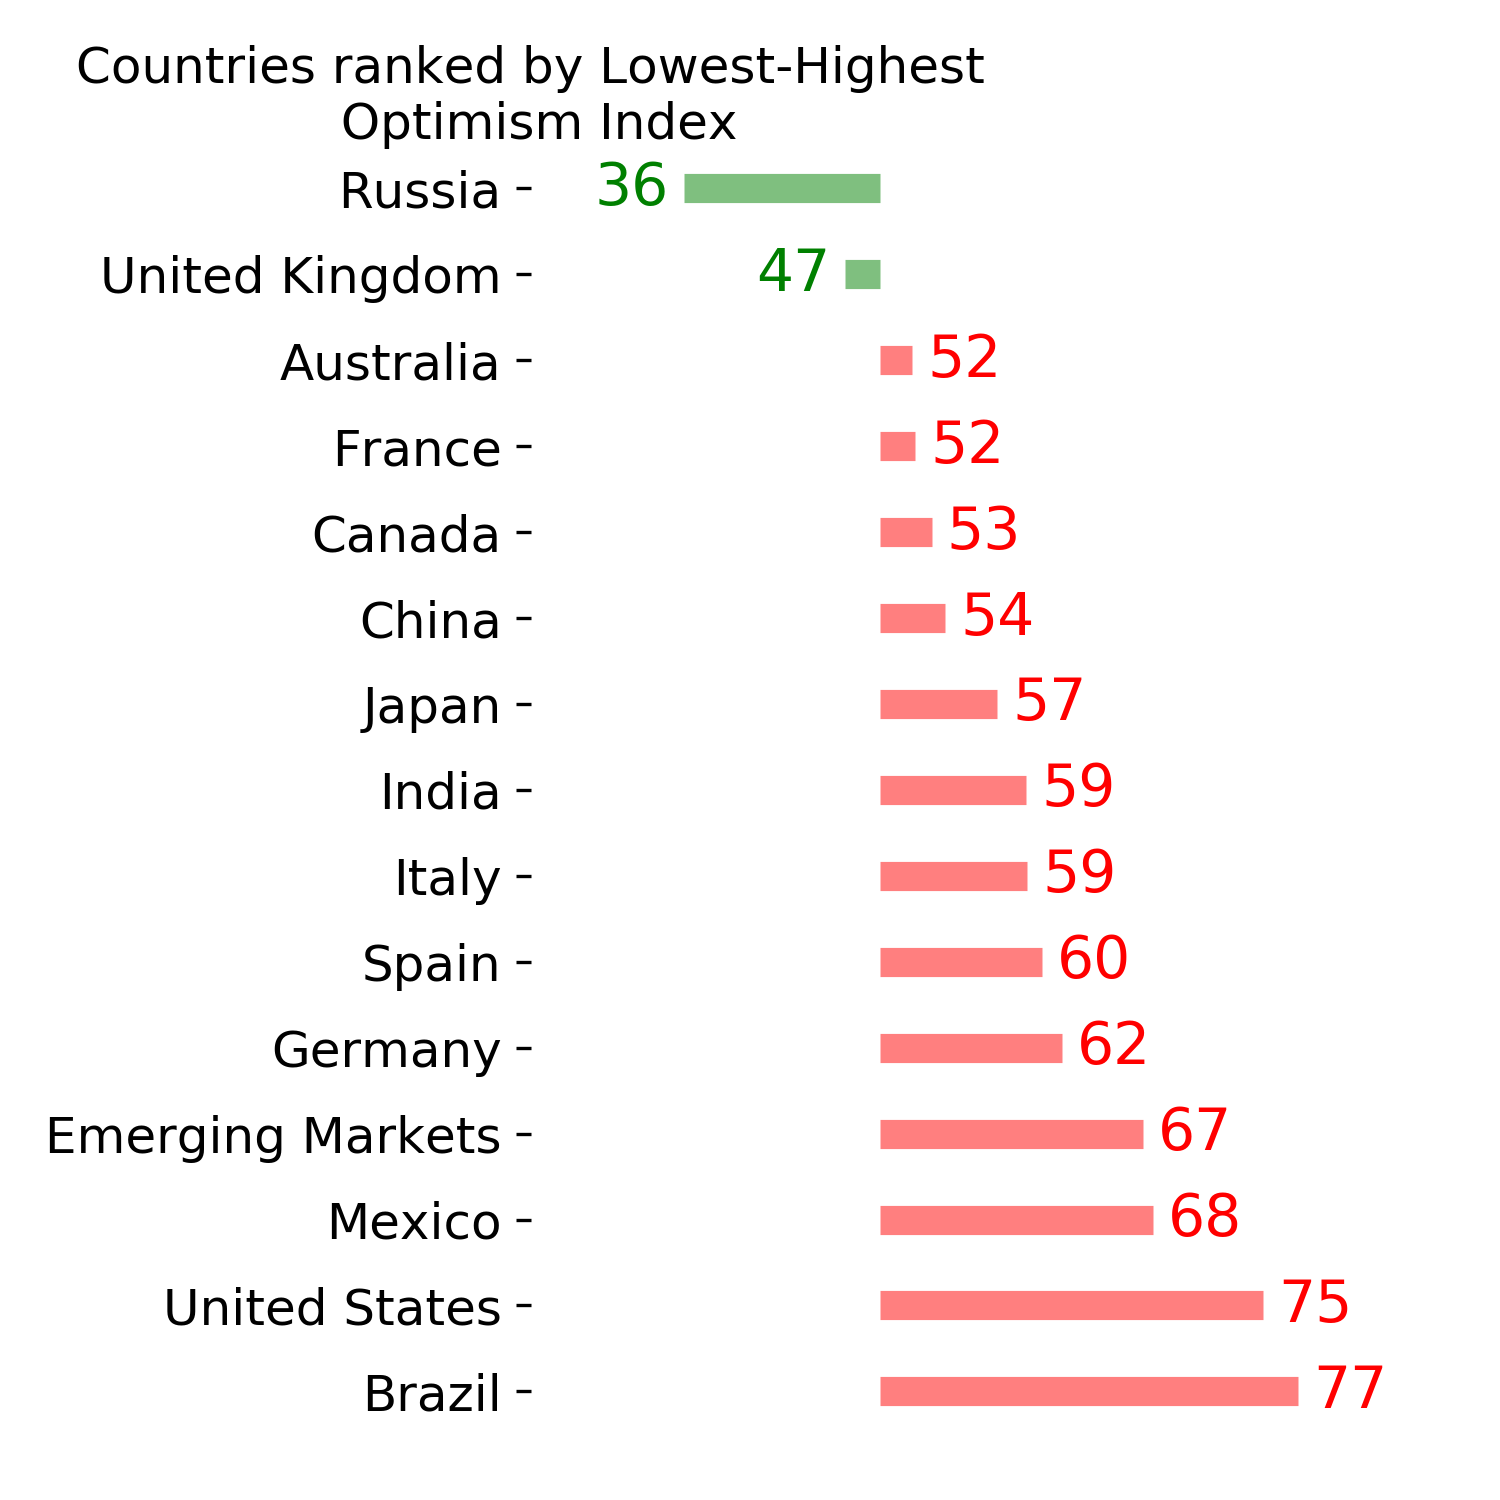
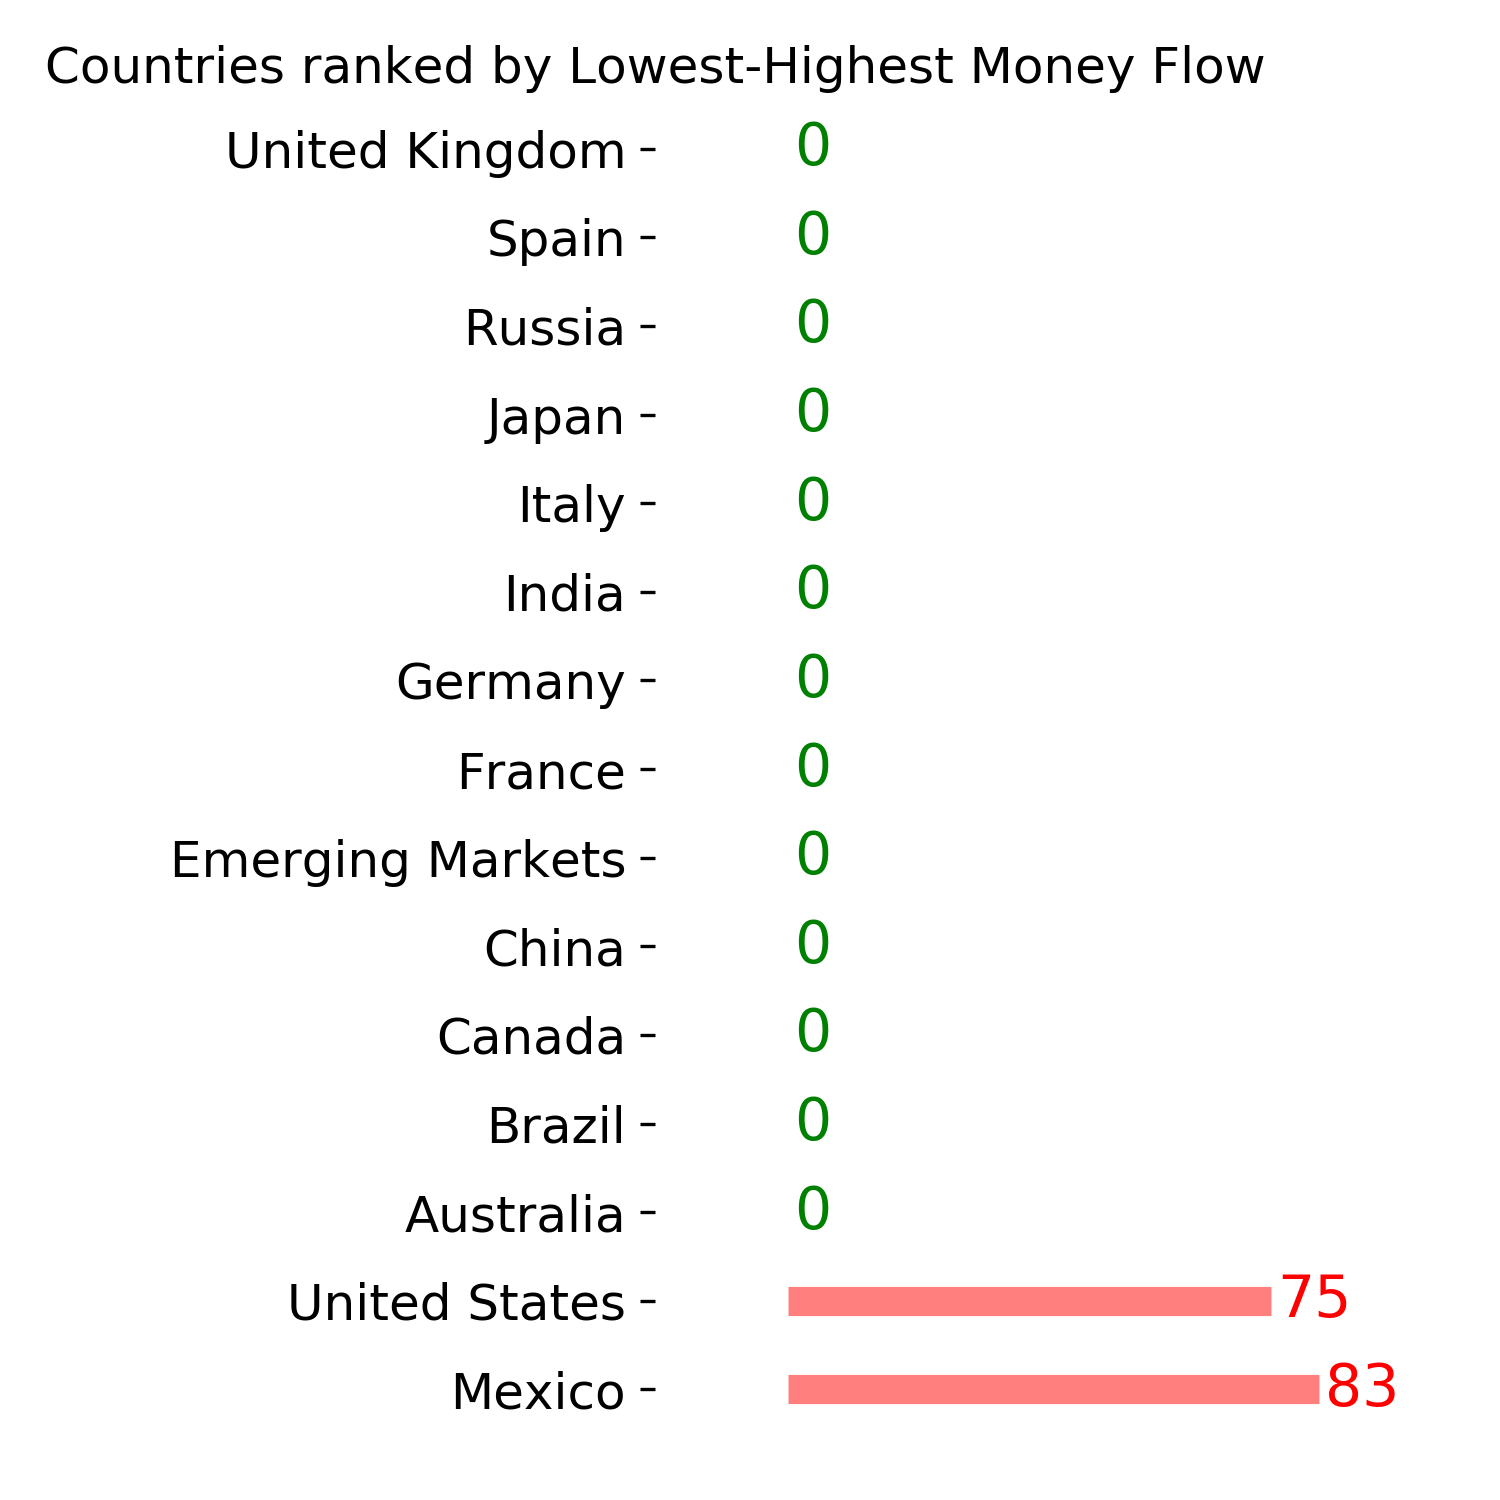
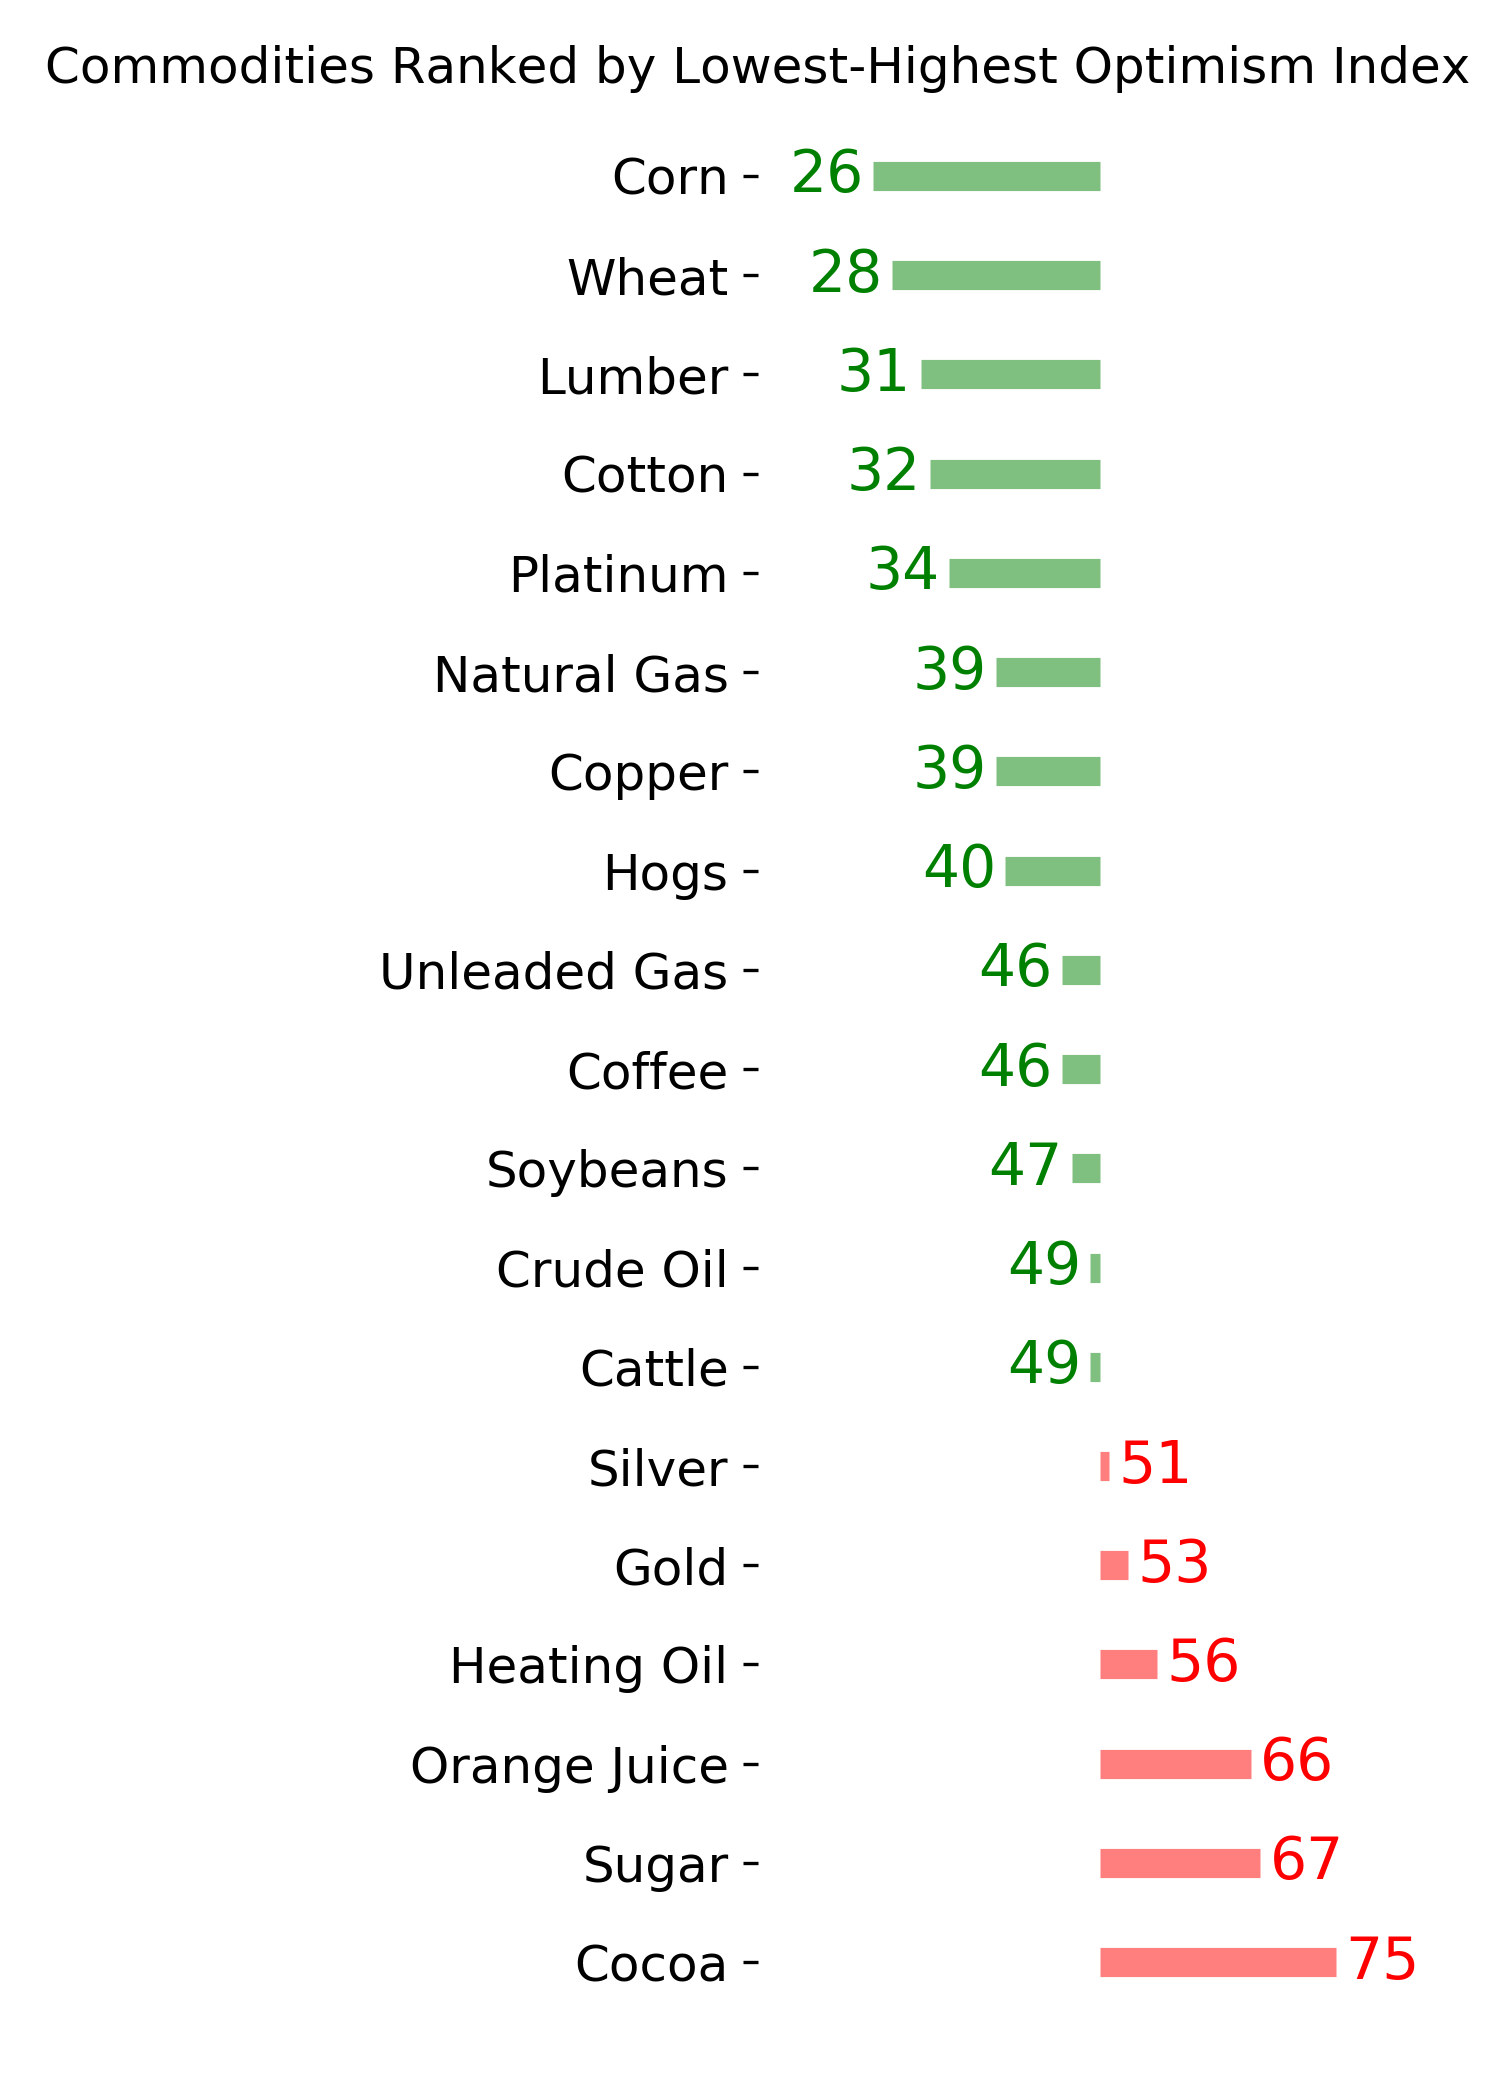
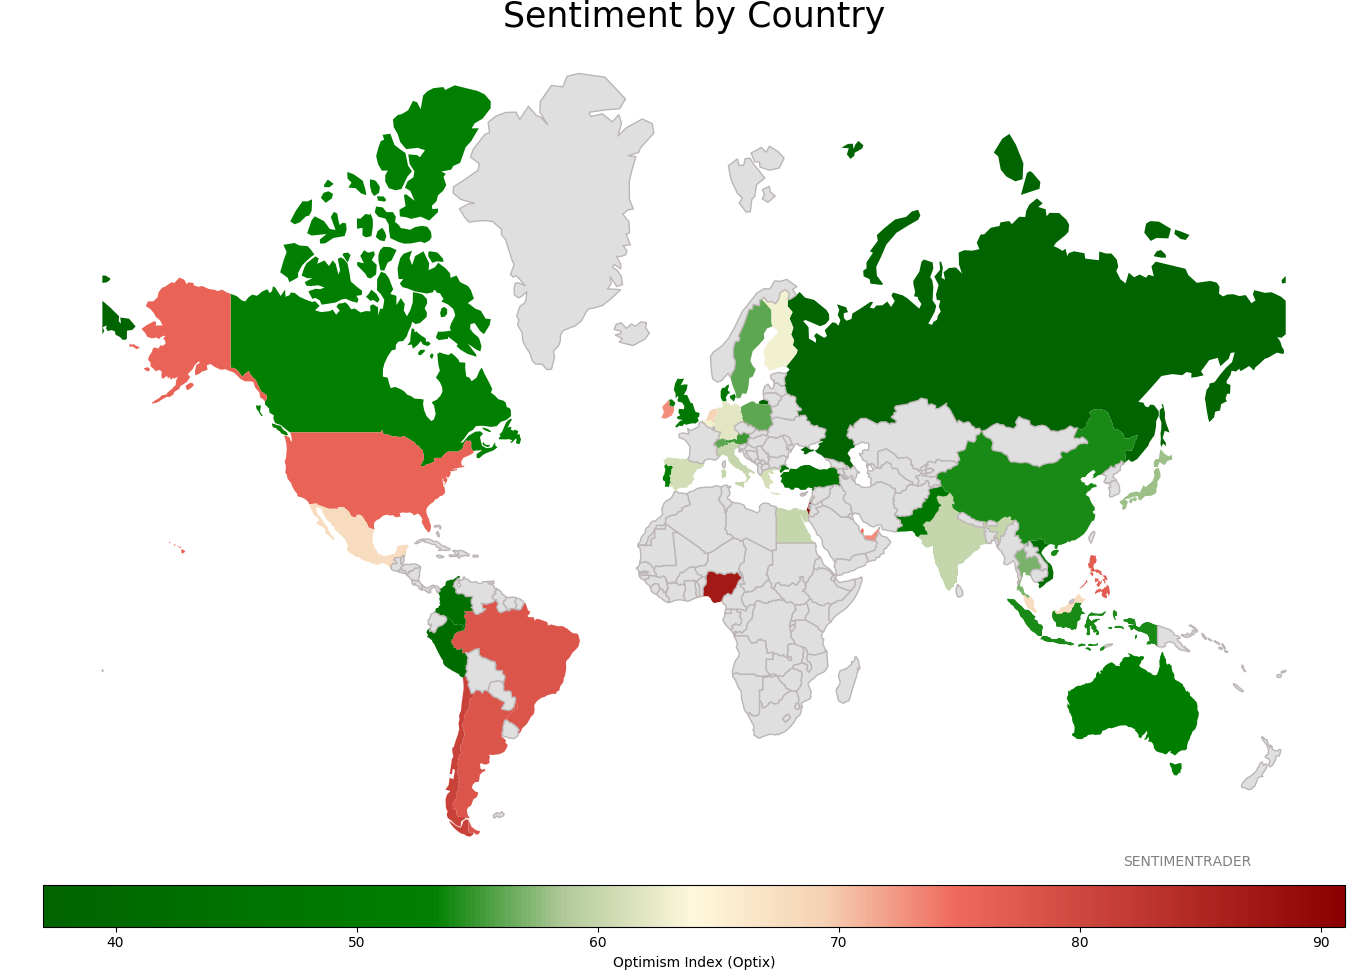
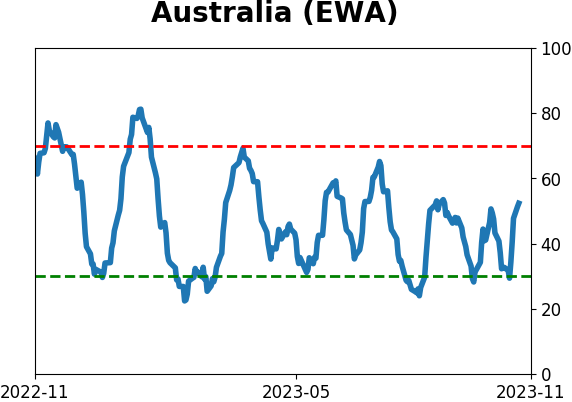
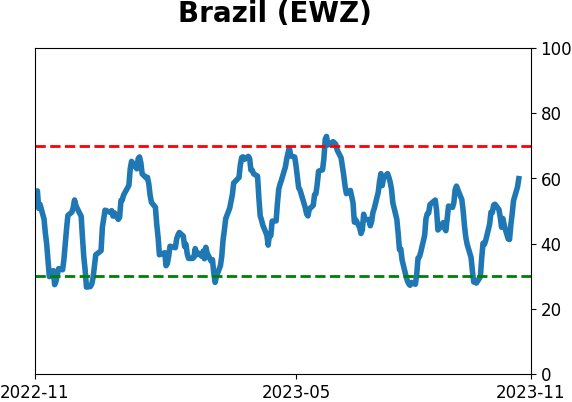
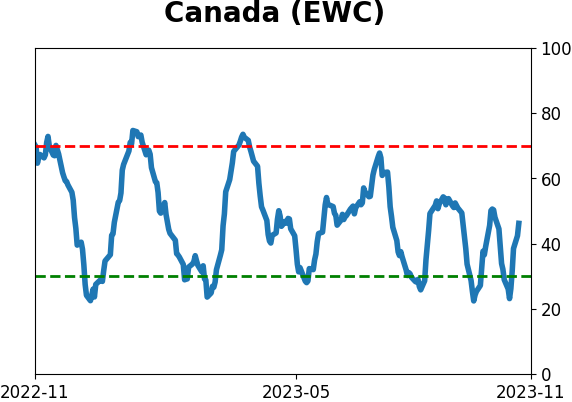
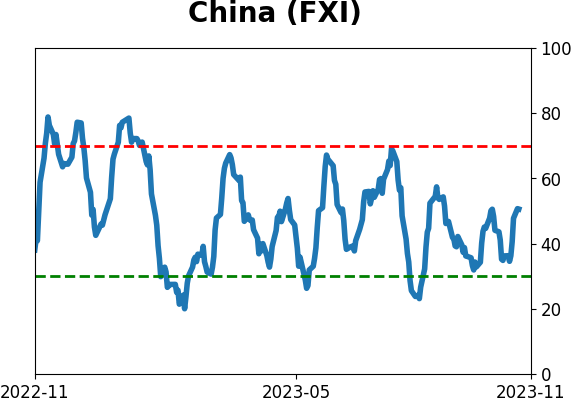
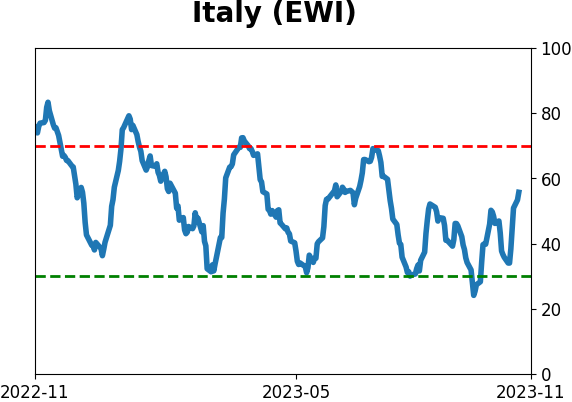
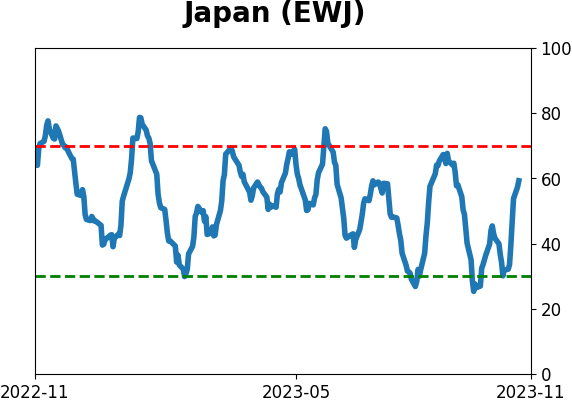
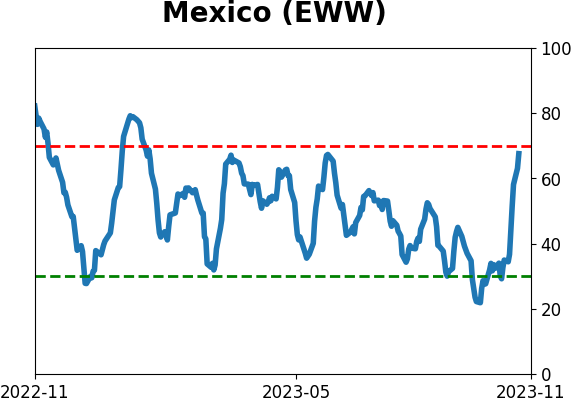
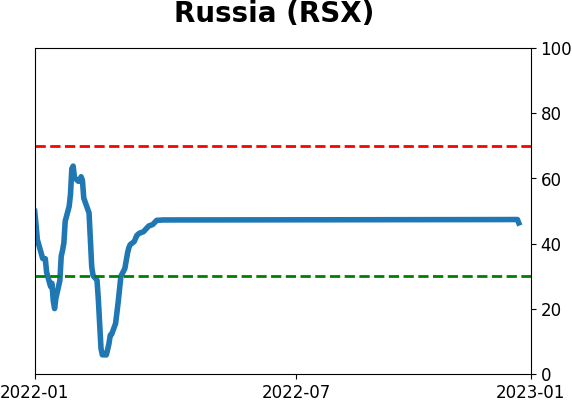
Sentiment Around The World
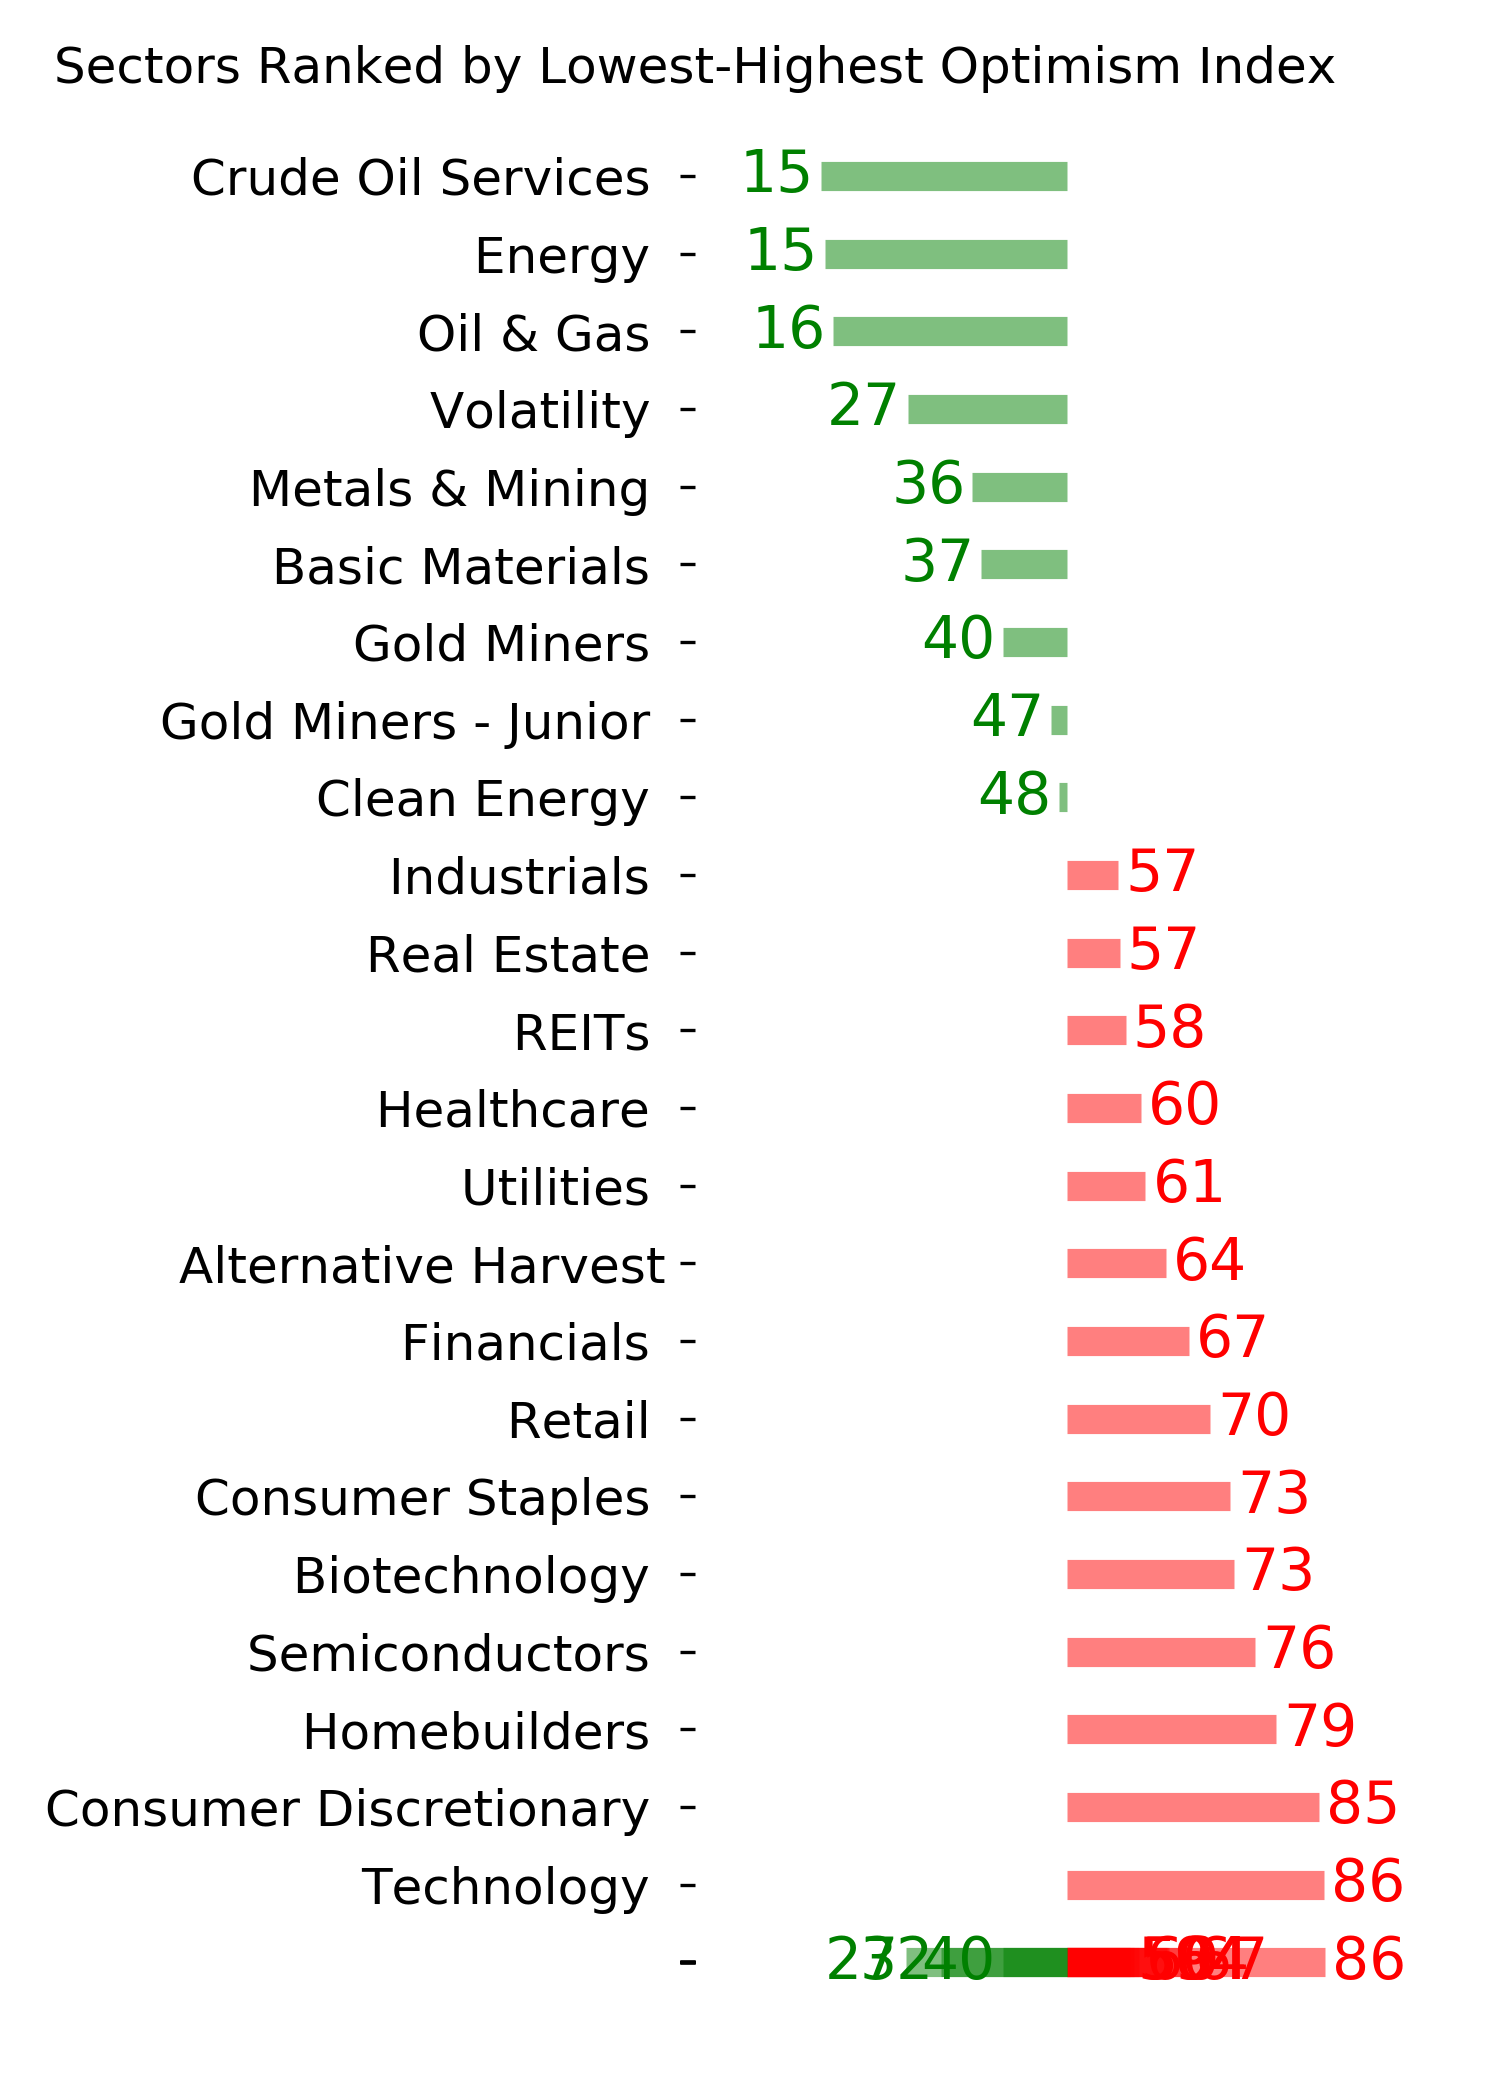
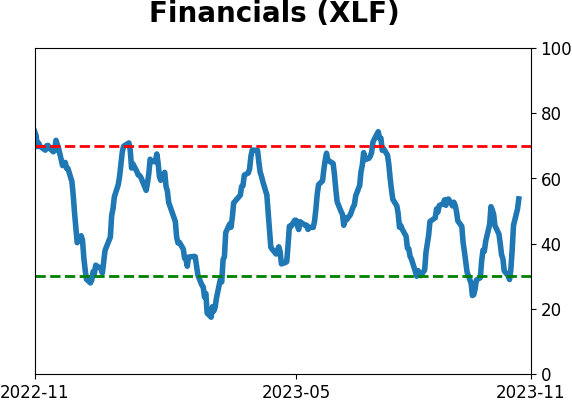
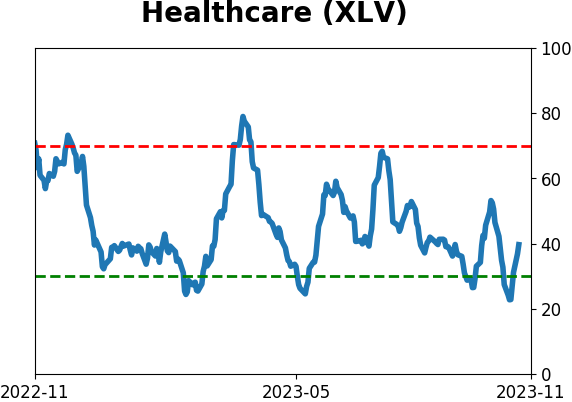
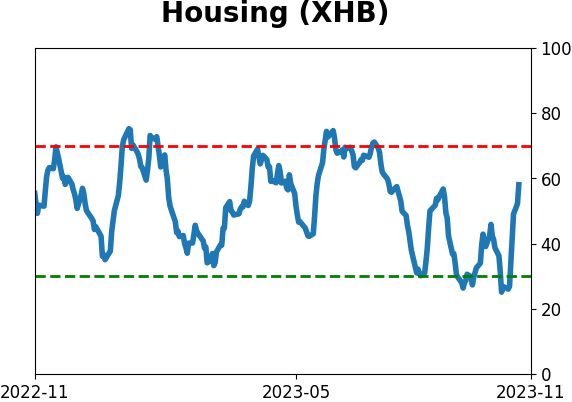
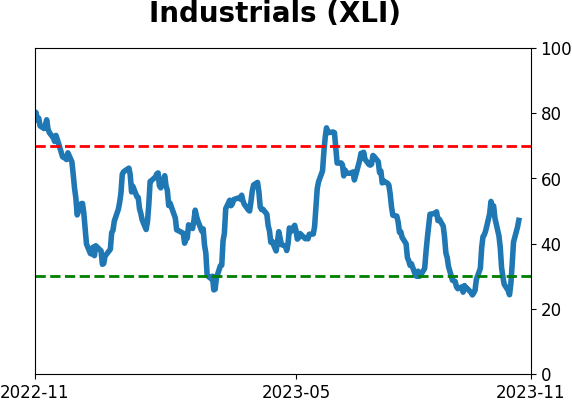
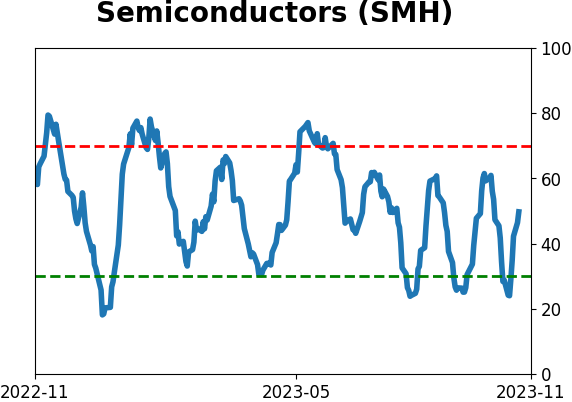
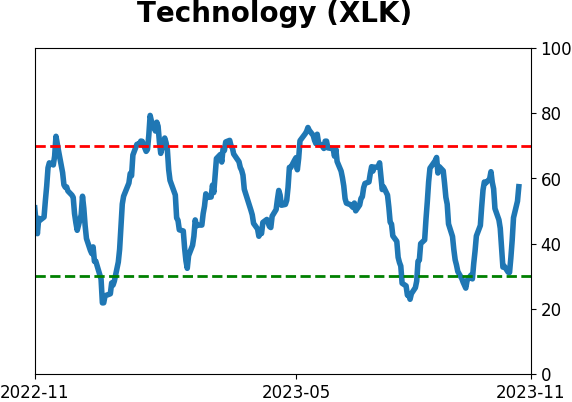
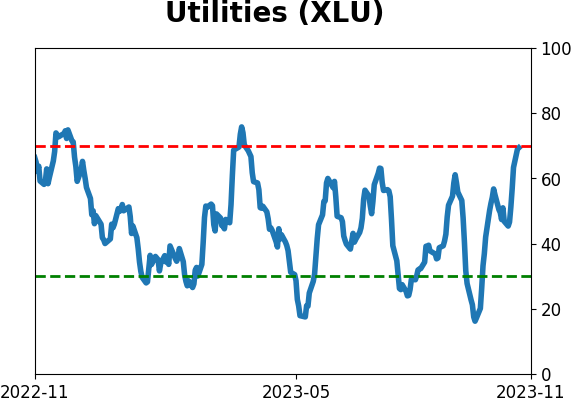
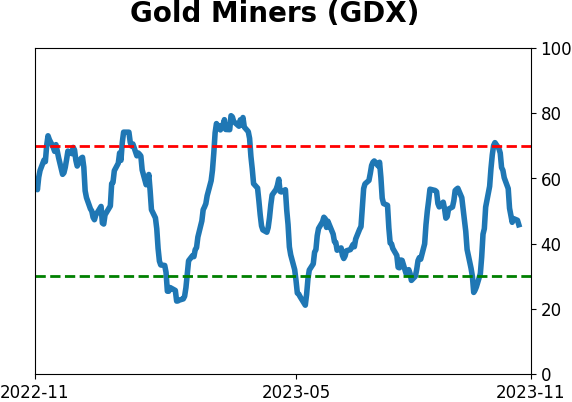
Optimism Index Thumbnails
|
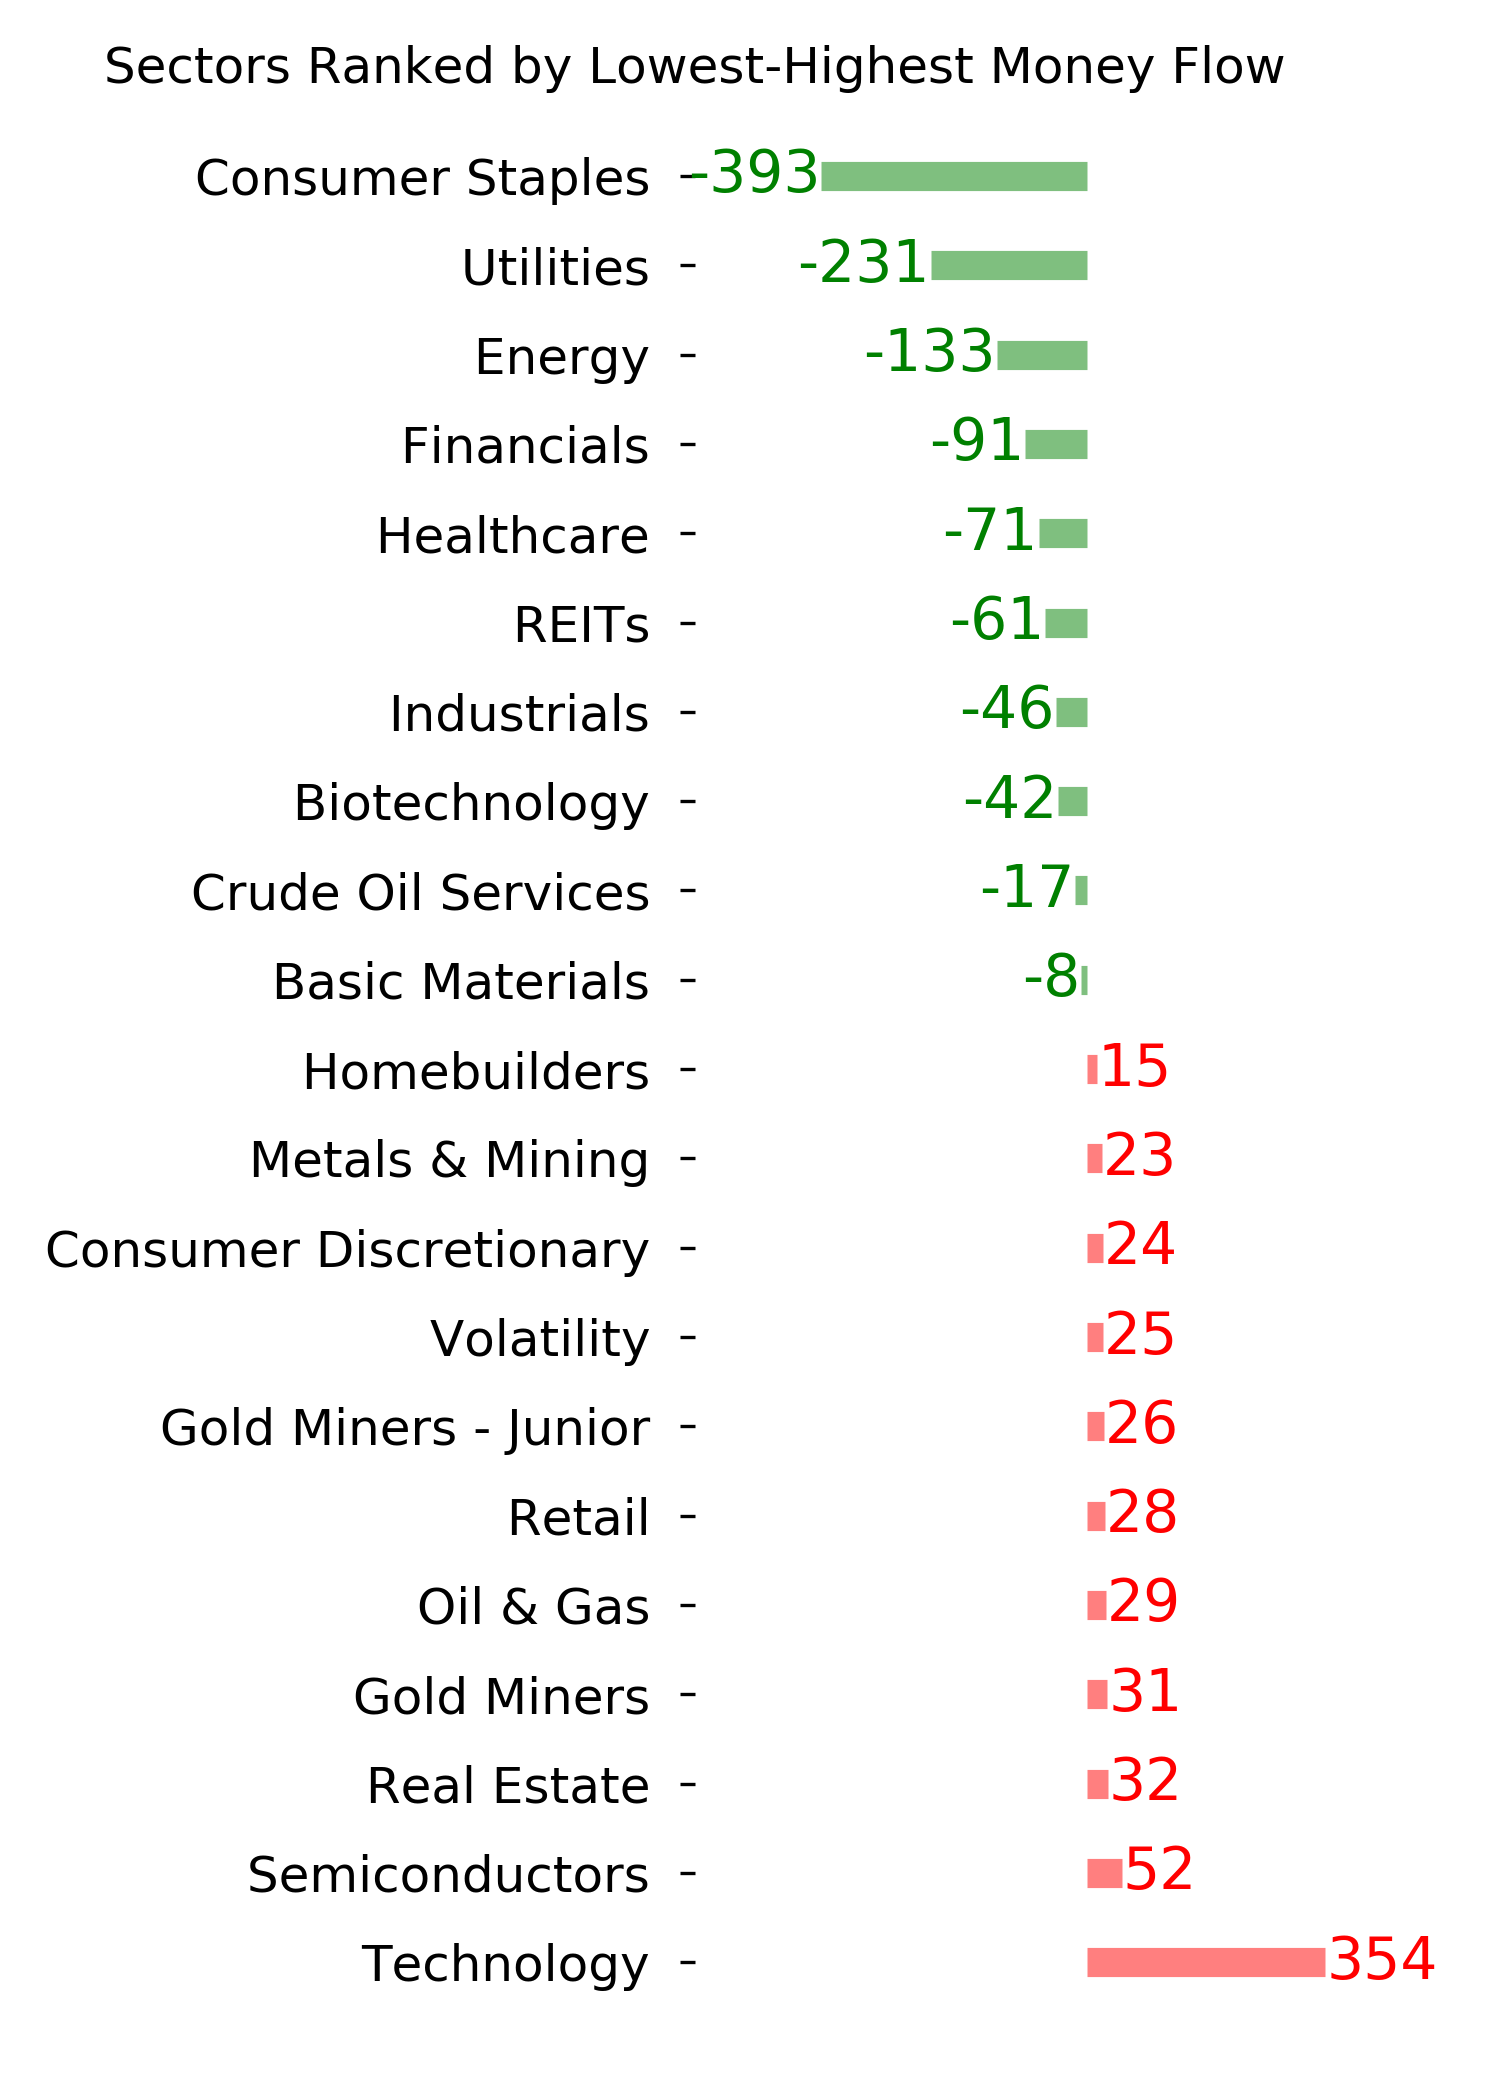
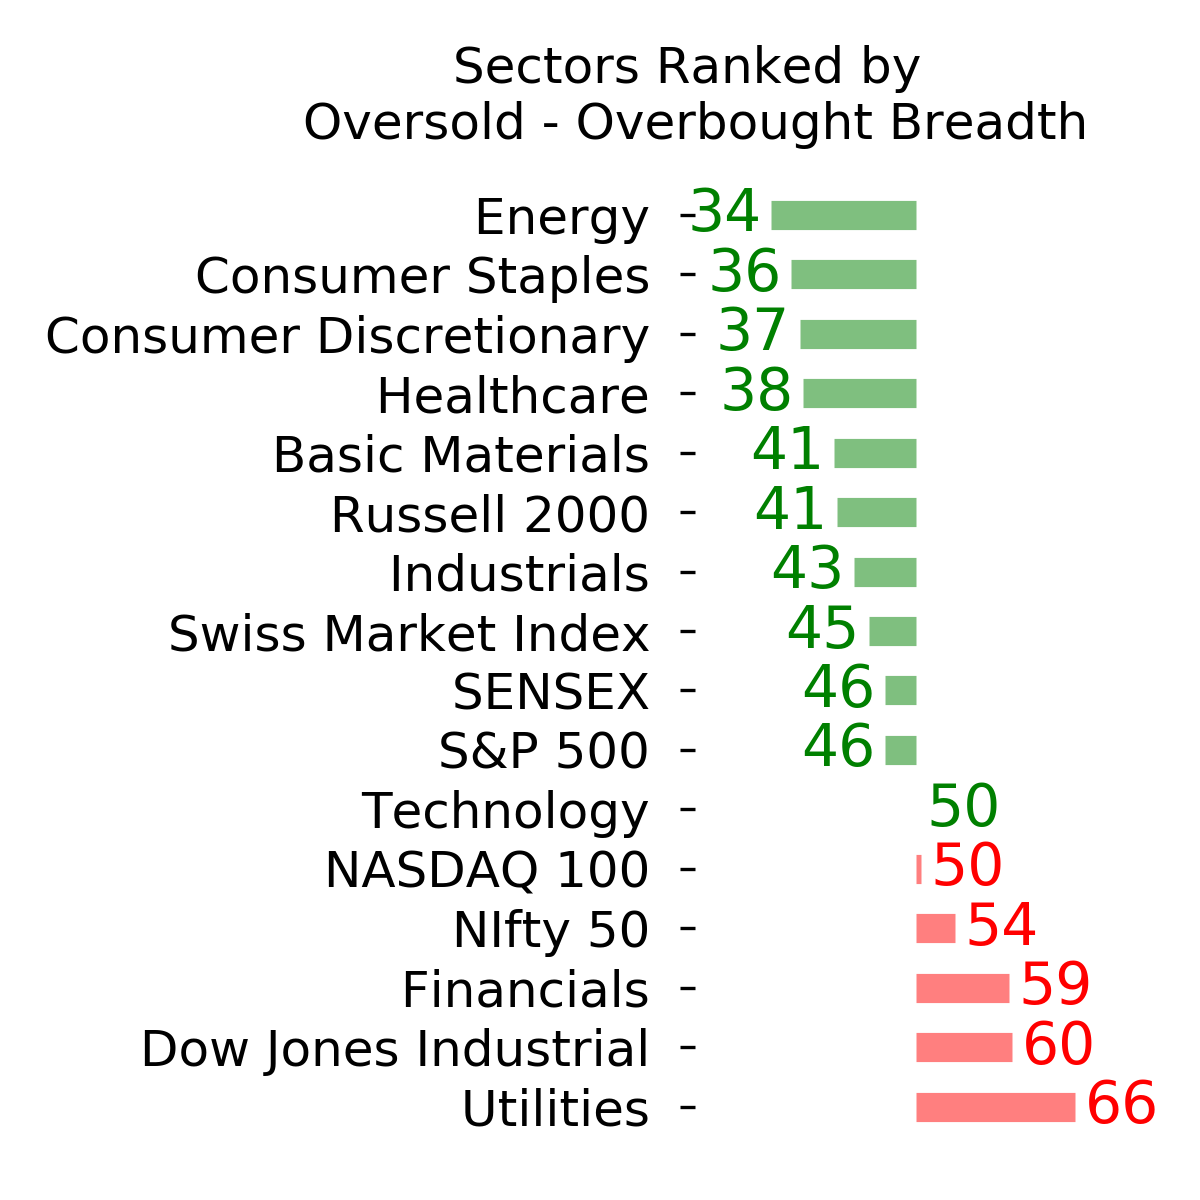
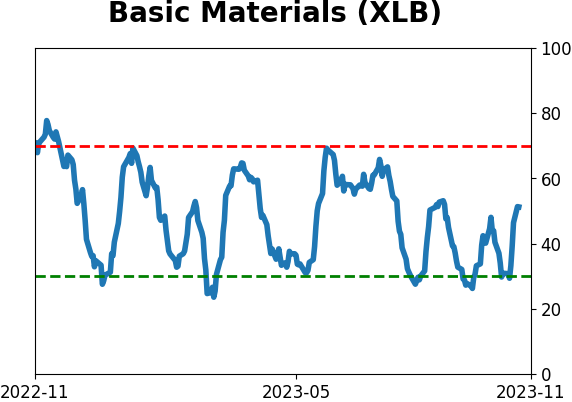
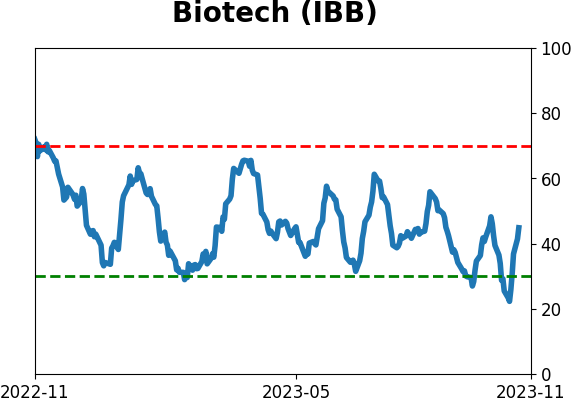
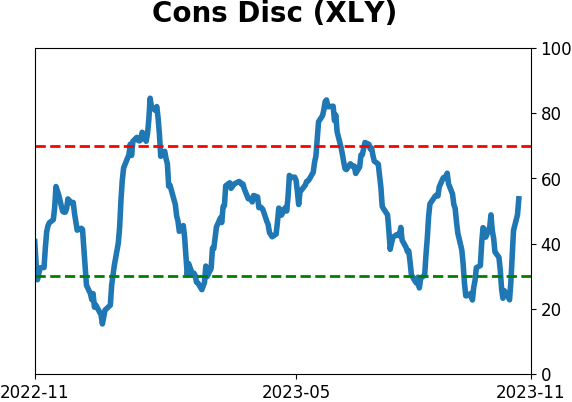
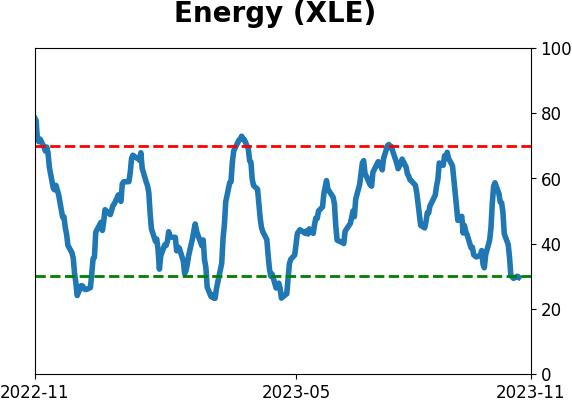
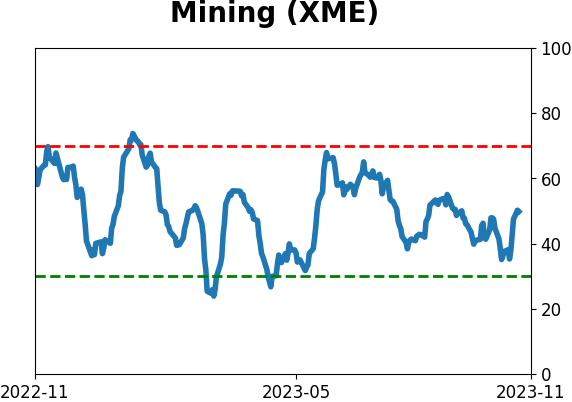
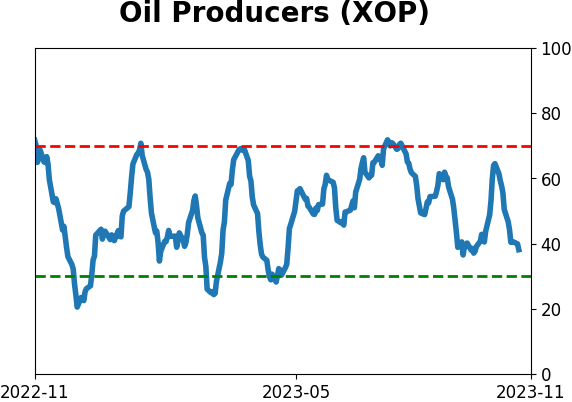
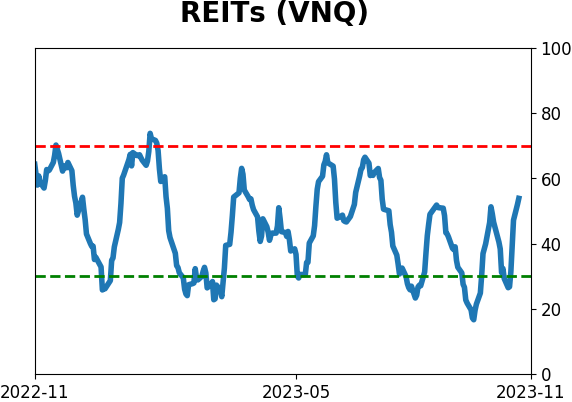
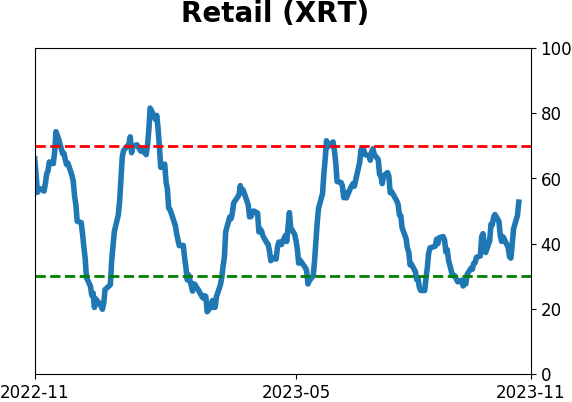
Sector ETF's - 10-Day Moving Average
|
|
|
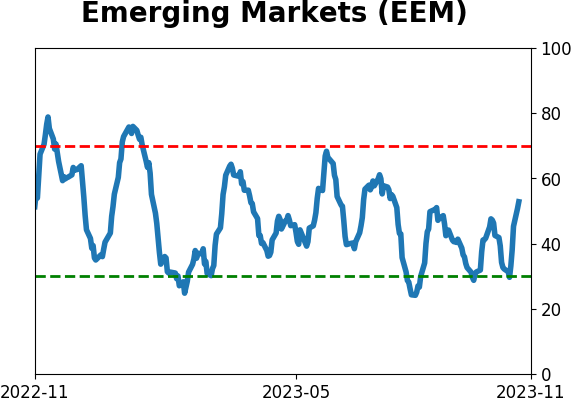
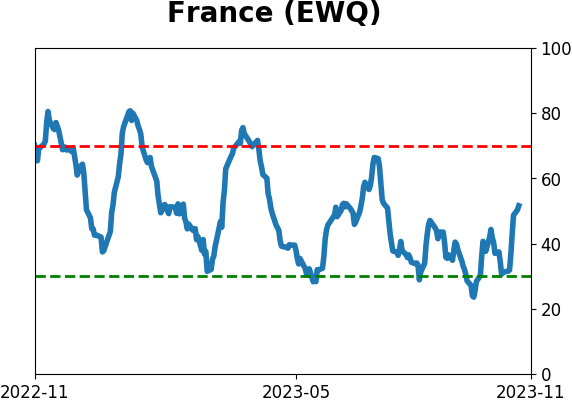
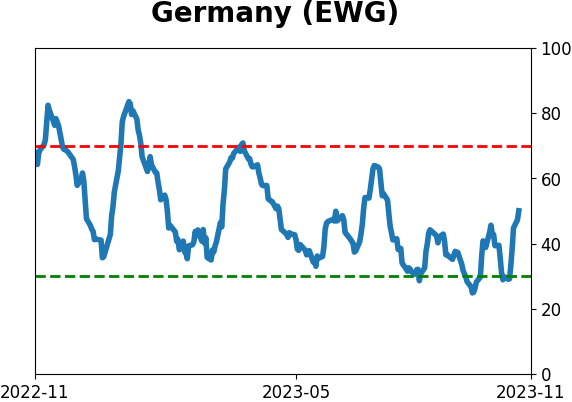
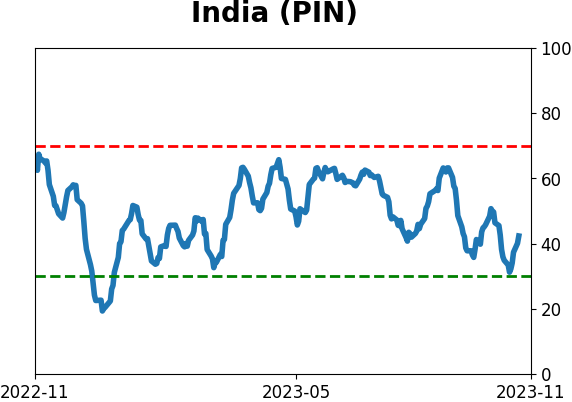
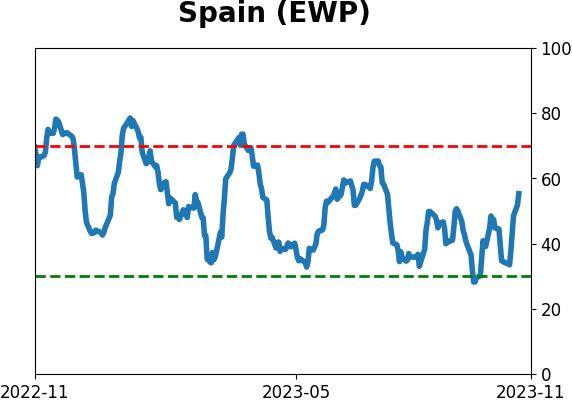
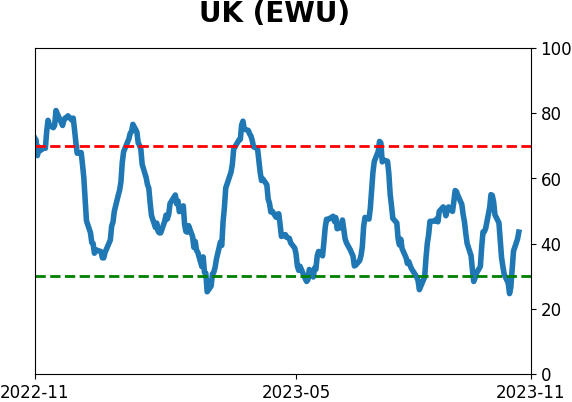
Country ETF's - 10-Day Moving Average
|
|
|
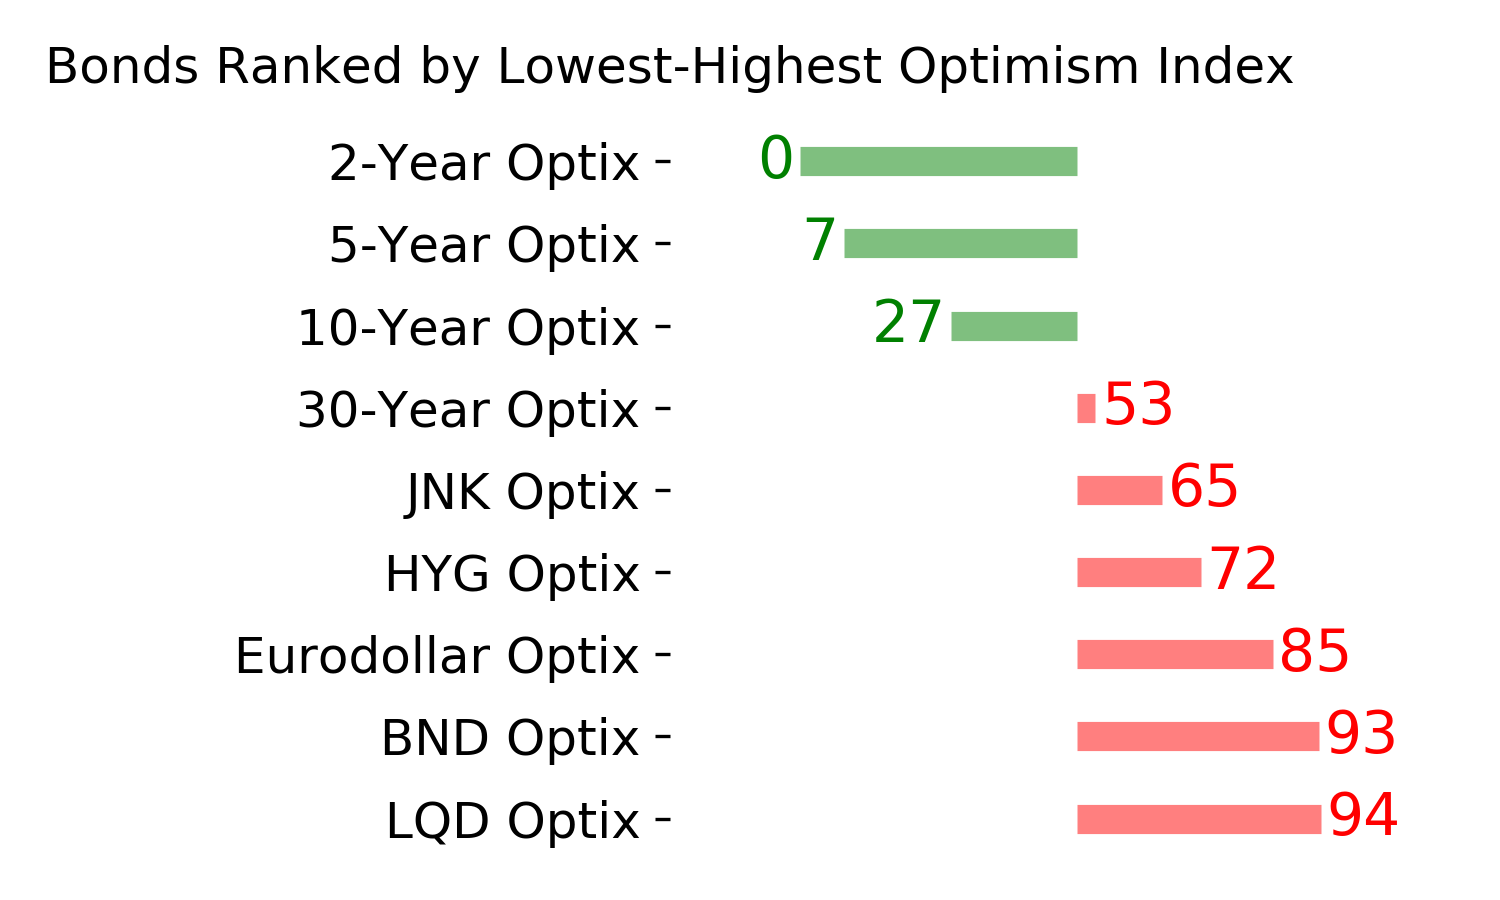
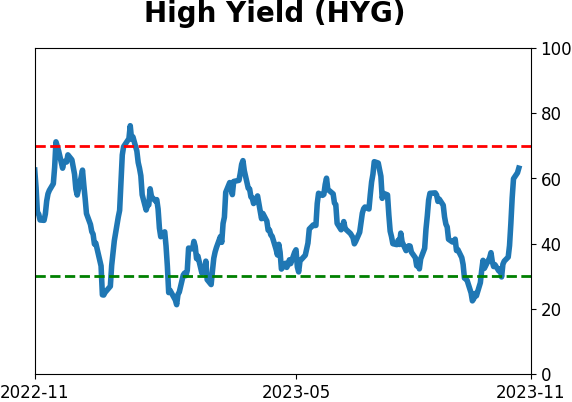
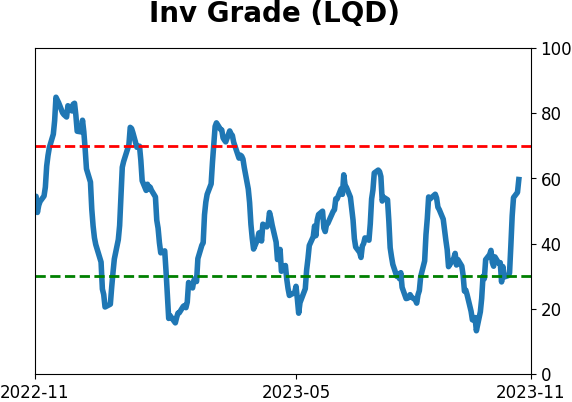
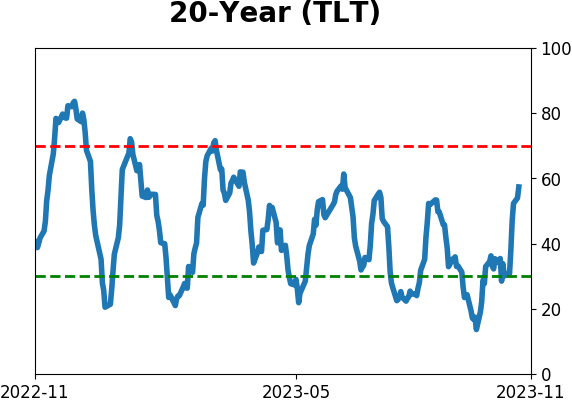
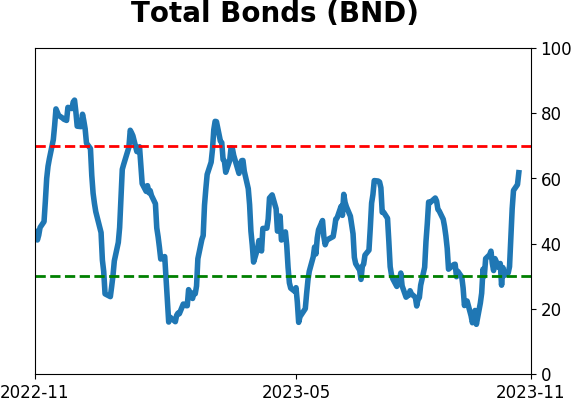
Bond ETF's - 10-Day Moving Average
|
|
|
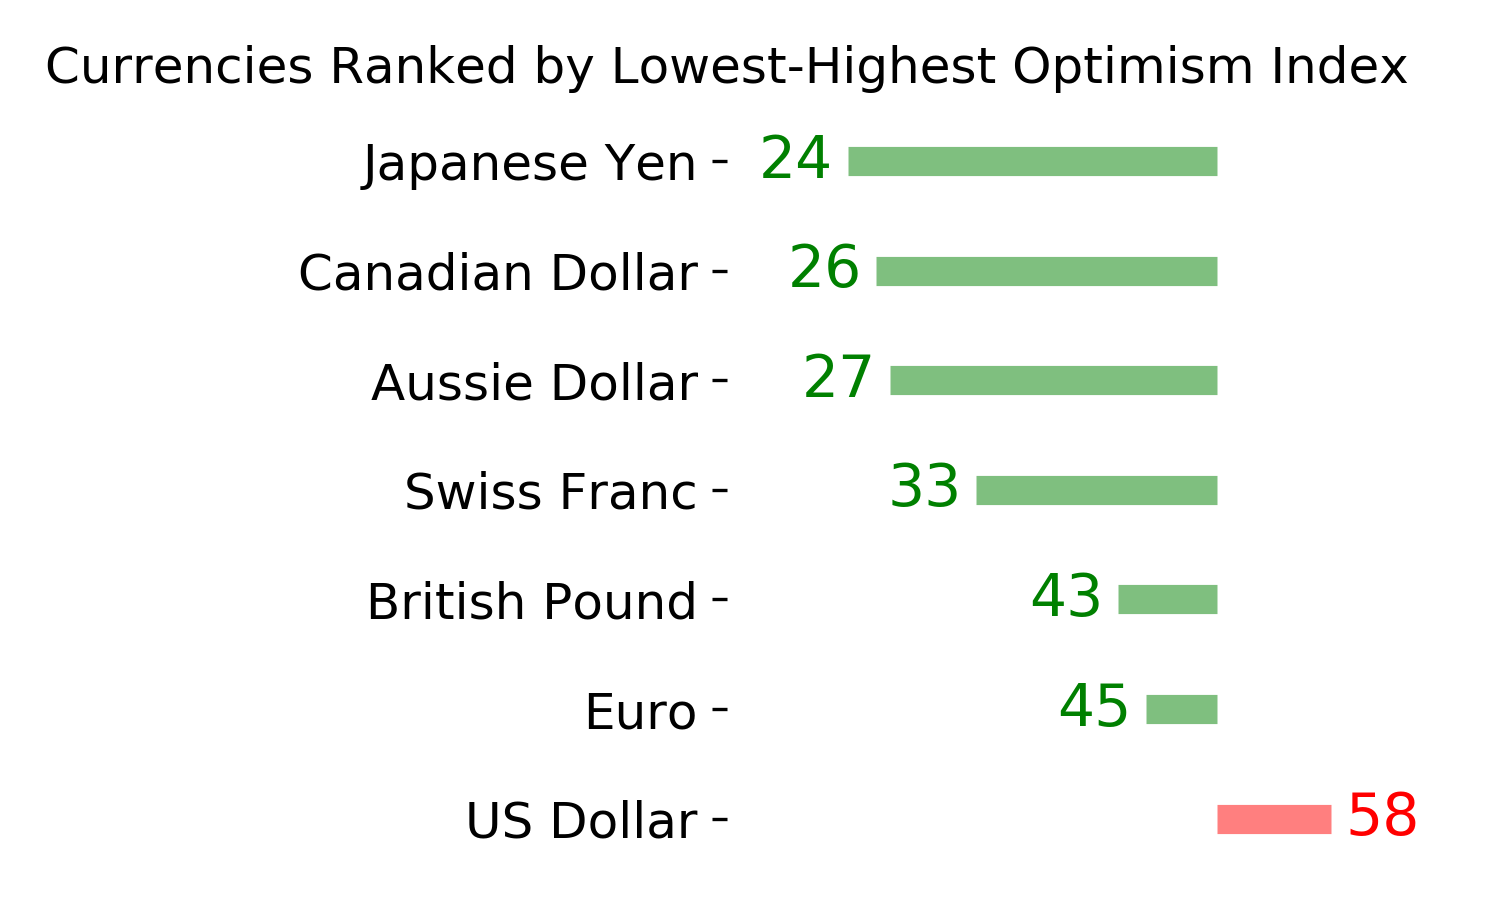
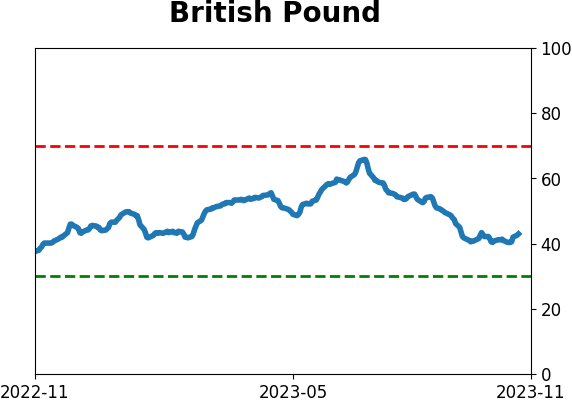
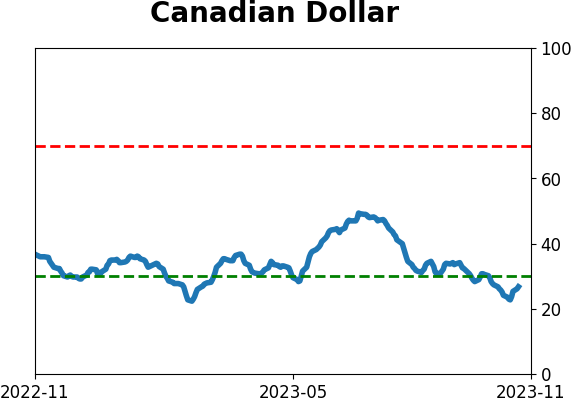
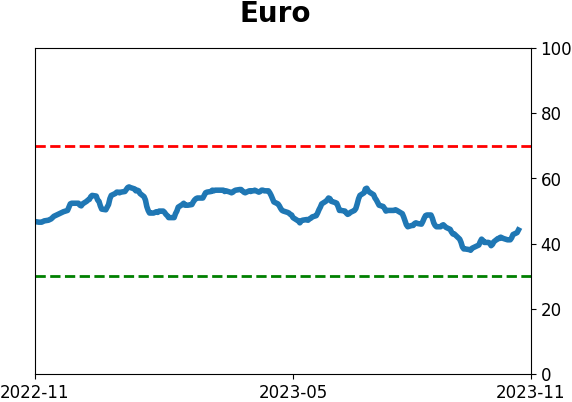
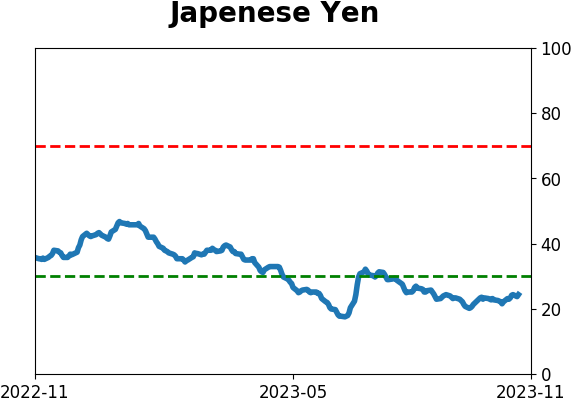
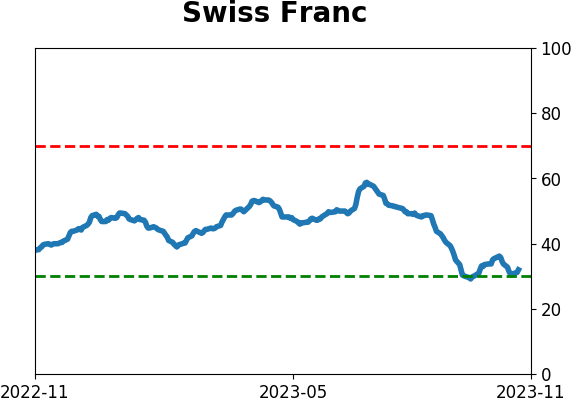
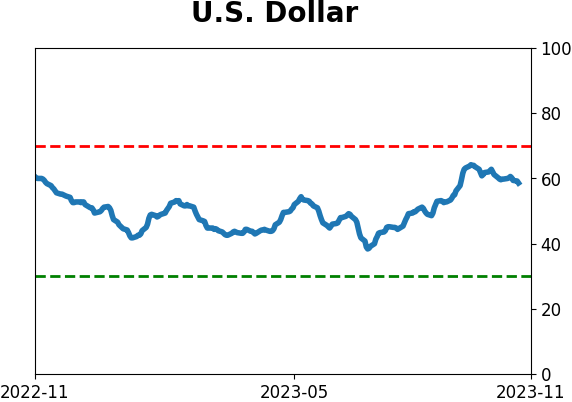
Currency ETF's - 5-Day Moving Average
|
|
|
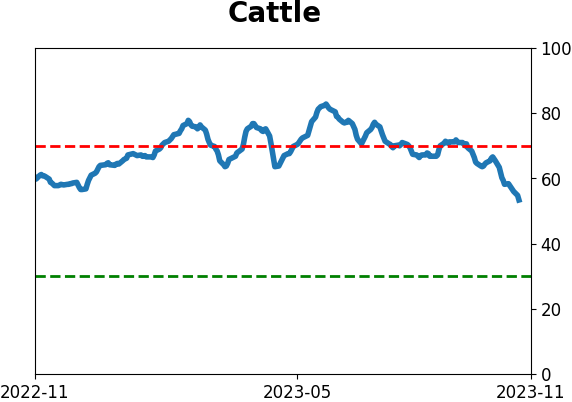
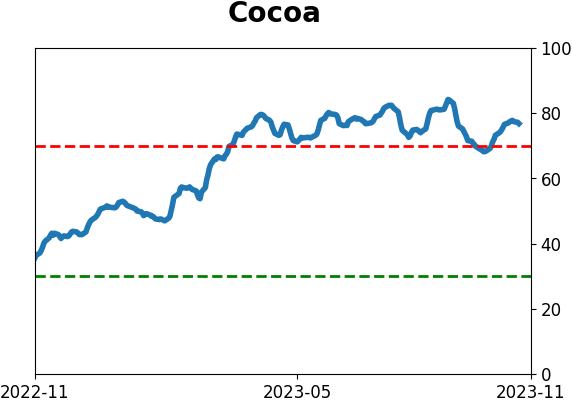
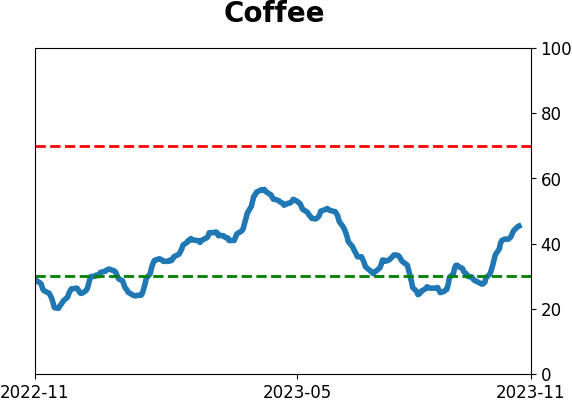
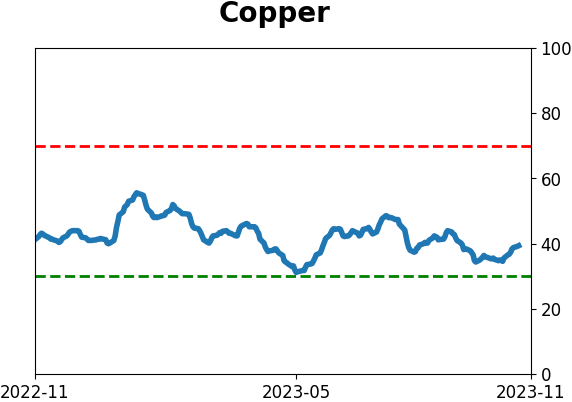
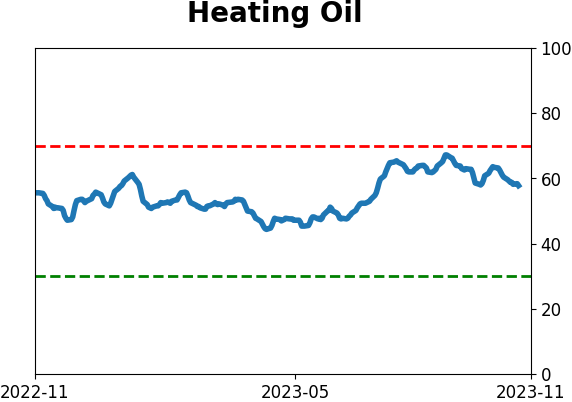
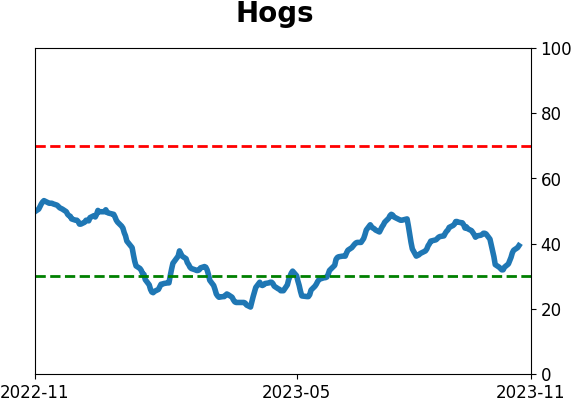
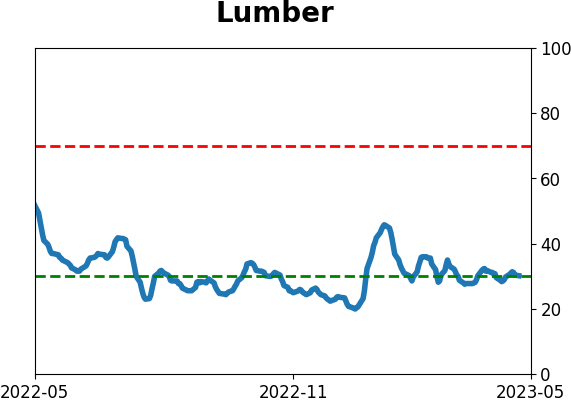
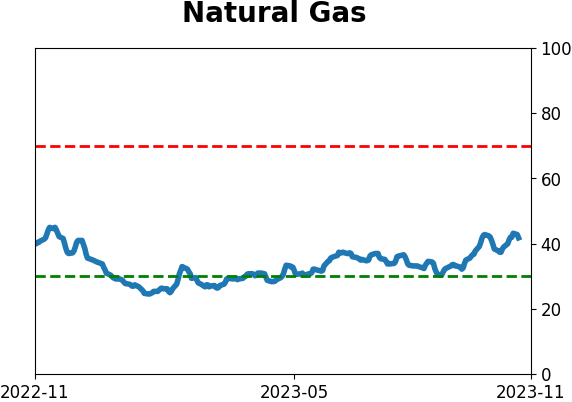
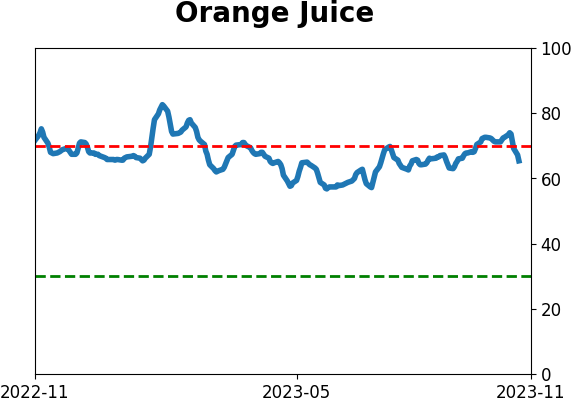
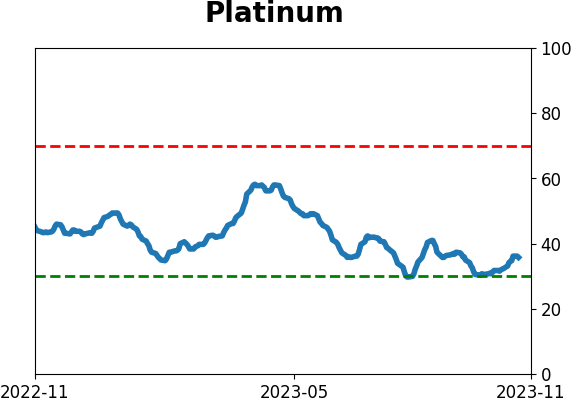
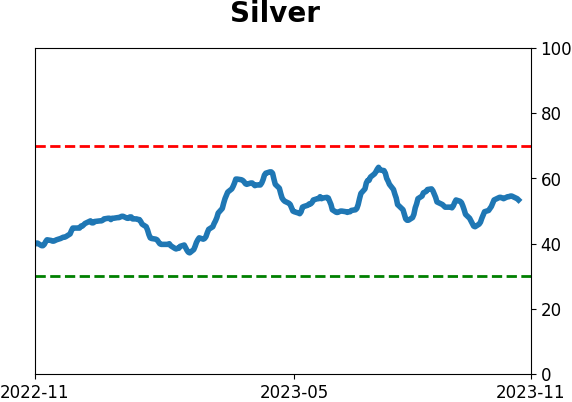
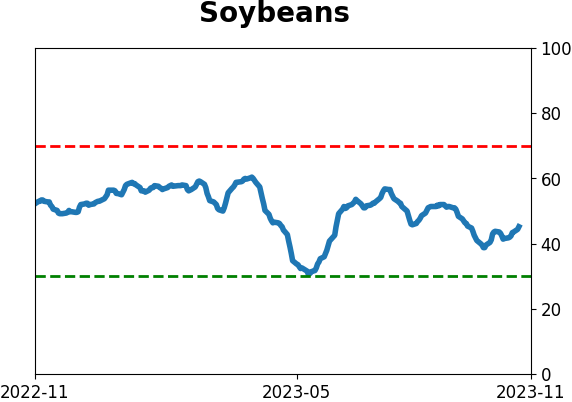
Commodity ETF's - 5-Day Moving Average
|
|