Daily Report : TradingEdge Weekly for Nov 3 - A temporary correction, calendar tailwinds, earnings recovery

| View/Print a PDF version of this Report |
Headlines
|
TradingEdge Weekly for Nov 3 - A temporary correction, calendar tailwinds, earnings recovery: This week, we saw that the S&P 500 entered a correction, and it has generated a significant amount of fear as investors give up on positive seasonality. Banks have pulled back on business lending, but earnings are still on track to grow for the first time in 3 quarters. Using credit spreads to trade floating rate bonds. |
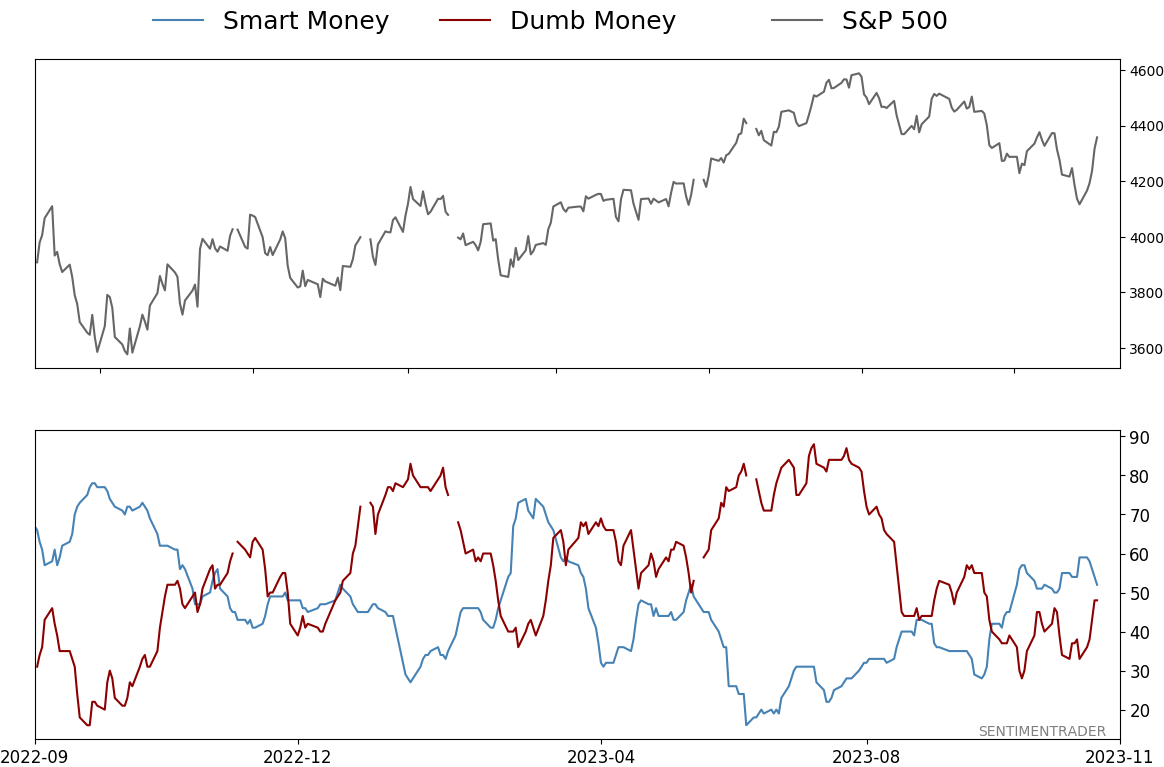
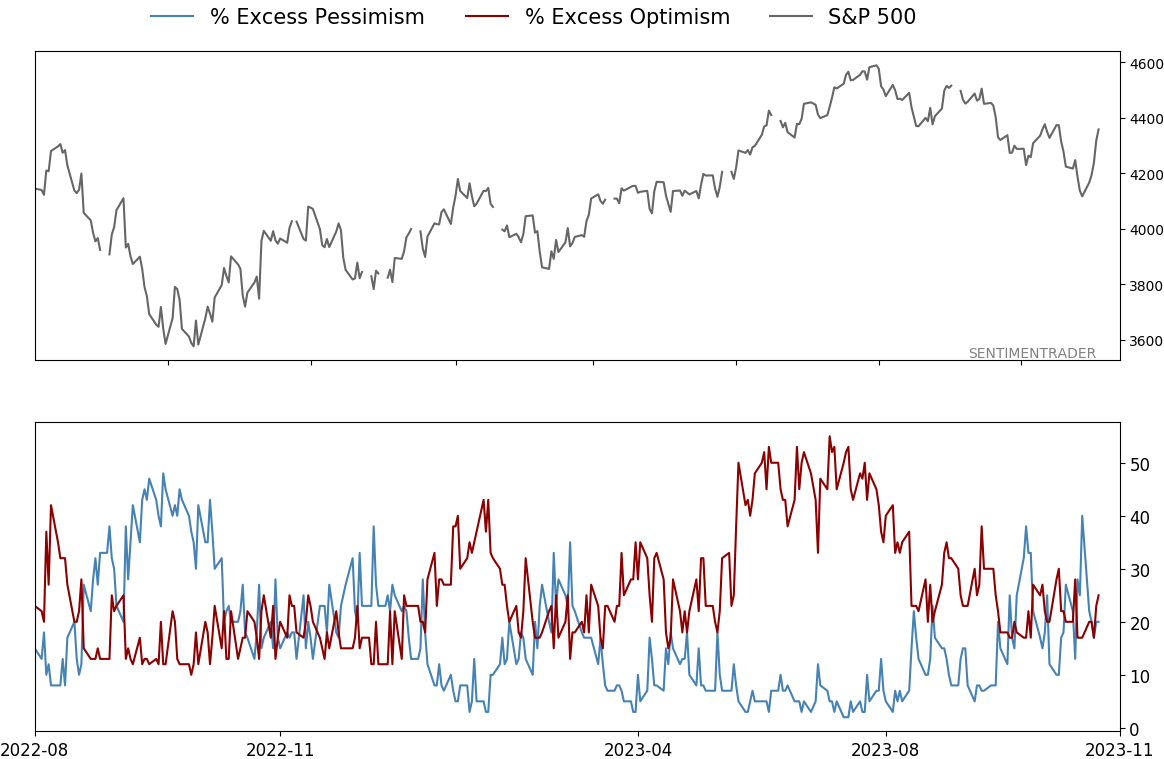
Smart / Dumb Money Confidence
|
|
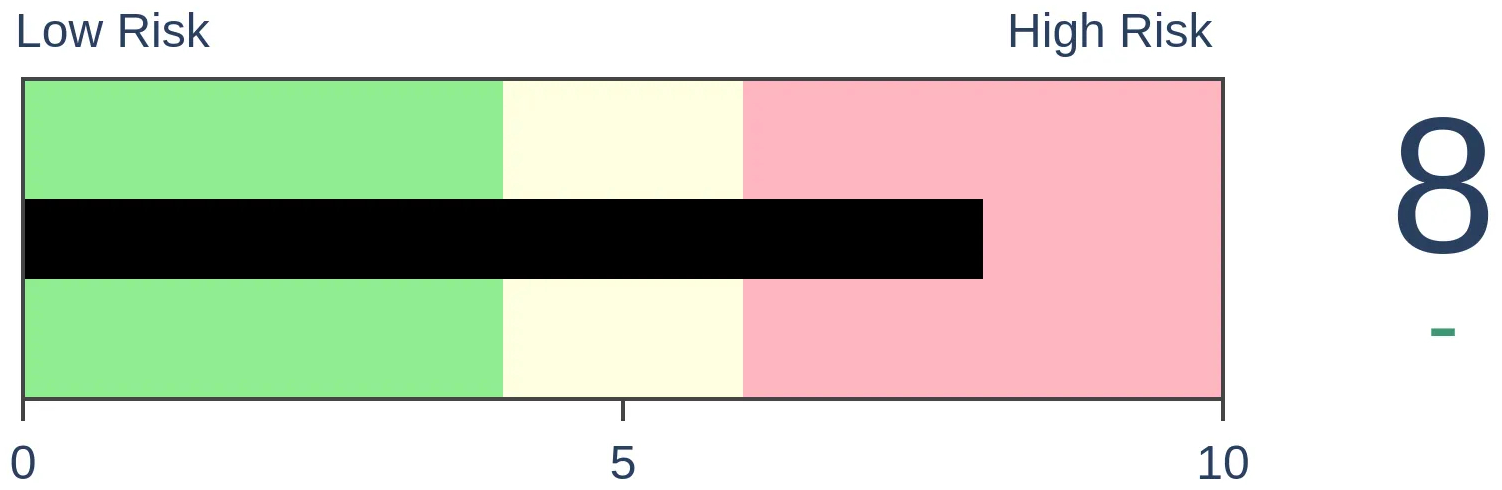
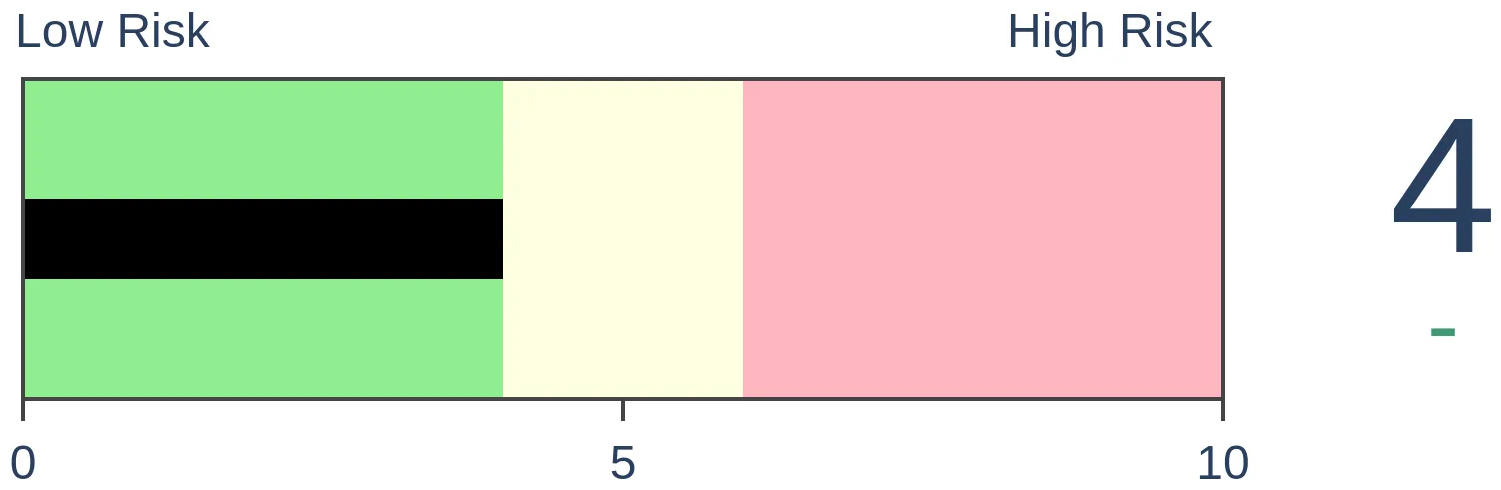
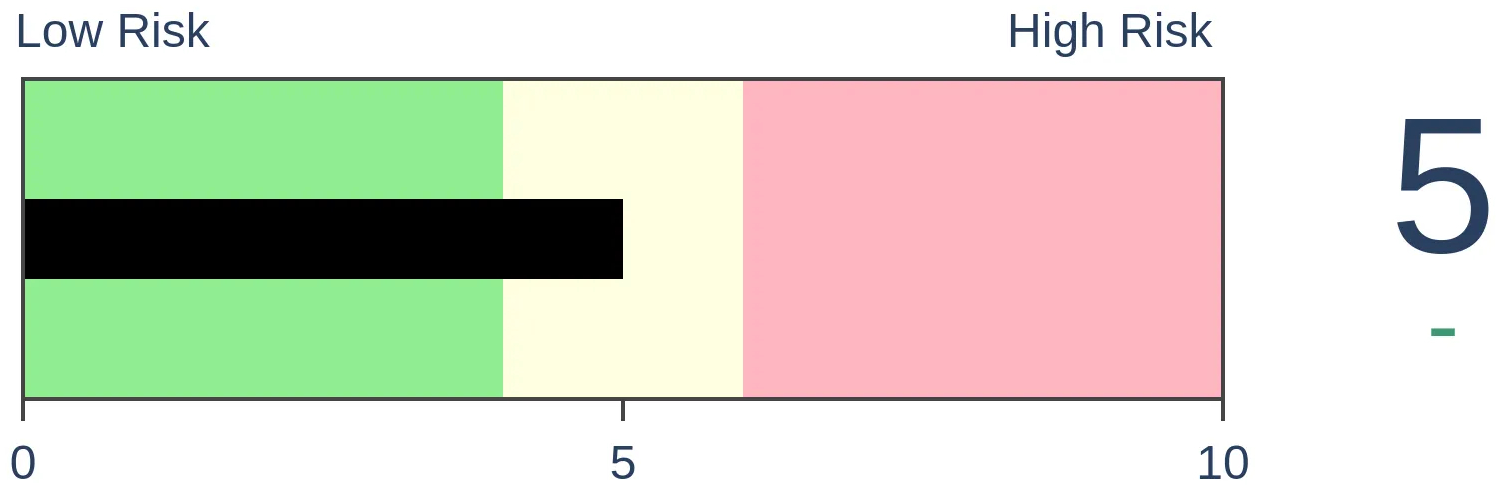
Risk Levels
|

|


|
Research
TradingEdge Weekly for Nov 3 - A temporary correction, calendar tailwinds, earnings recoveryBy Jason GoepfertBOTTOM LINEThis week, we saw that the S&P 500 entered a correction, and it has generated a significant amount of fear as investors give up on positive seasonality. Banks have pulled back on business lending, but earnings are still on track to grow for the first time in 3 quarters. Using credit spreads to trade floating rate bonds. FORECAST / TIMEFRAME |
Key points:
- The S&P 500 "officially" entered a correction
- It has been enough to generate a significant amount of fear
- Tech stocks generated volatility reversal buy signals
- There is a last gasp of potentially positive seasonality
- Winter is an especially good time for the equal-weight S&P 500
- Banks have pulled back on lending to businesses
- Even so, earnings among S&P 500 companies are on track to grow for the first time in 3 quarters
- Using credit spreads to trade floating rate bonds
- A quick shift to bulls in bonds
- Soybean prices also show positive seasonality this time of year
An "official" correction
The S&P 500 suffered losses in ten of the past twelve trading sessions, pushing the prominent large-cap benchmark into correction territory as of Friday. Dean noted that since 1928, there have been 44 other precedents of a -10% drop from a 252-day high.
Following a -10% drop, history shows that in 55% of cases, the index fell a total of -15%. On a more positive note, the likelihood of a severe -20% decline decreases, with just 39% of historical cases experiencing an additional -10% drop, pushing them into the loosely characterized bear market classification.
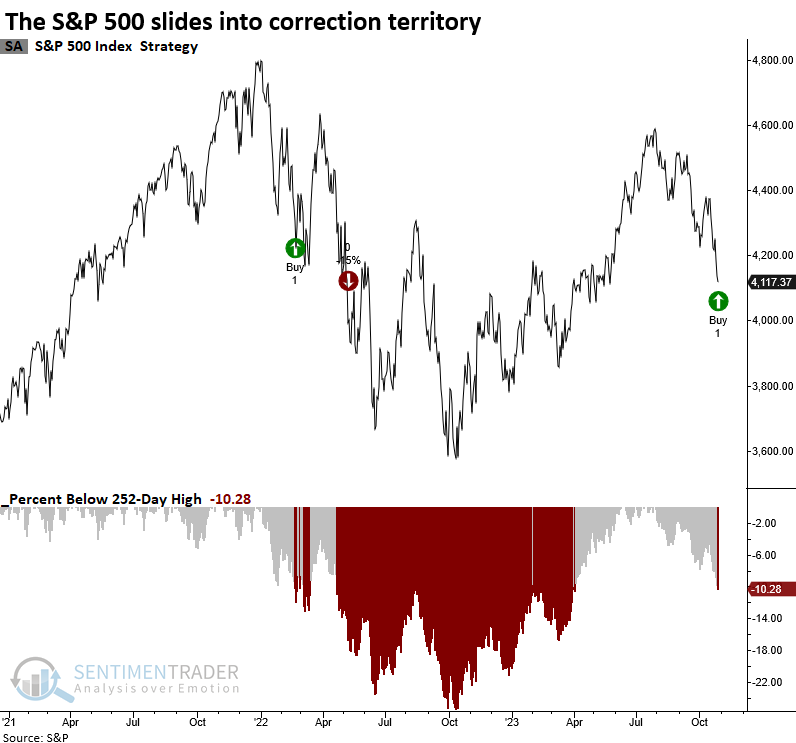
Whenever the S&P 500 declines by -10% from a 252-day high, the bellwether large-cap index tends to bounce back over the subsequent week with a 70% win rate and a median gain of 1.4%. Since 1997, correction signals have displayed a notable propensity to rebound in the first week, with a positive outcome observed in 10 out of 12 instances. However, it's worth noting that 8 out of those 12 precedents ultimately surpassed the -15% correction threshold.
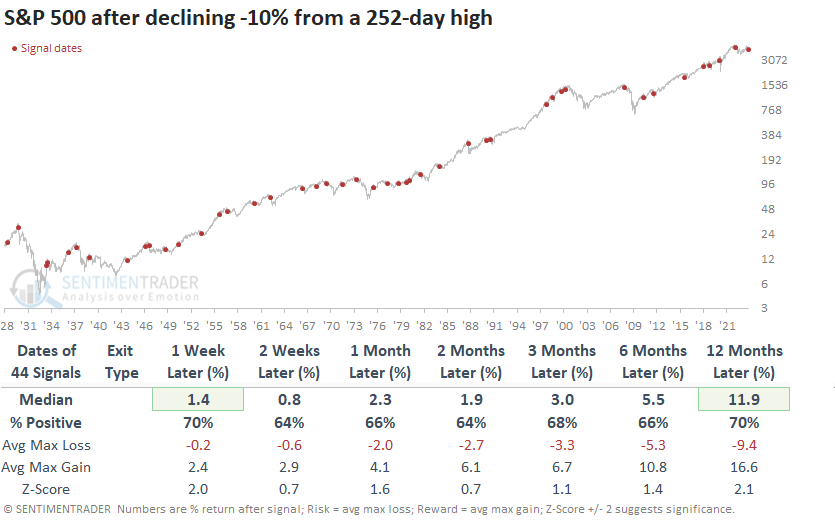
Since 1990, there has been a gain in the S&P 500 at some point in the first five trading sessions in all but one instance, albeit August 1990 was marginally profitable.
The correction is breeding fear
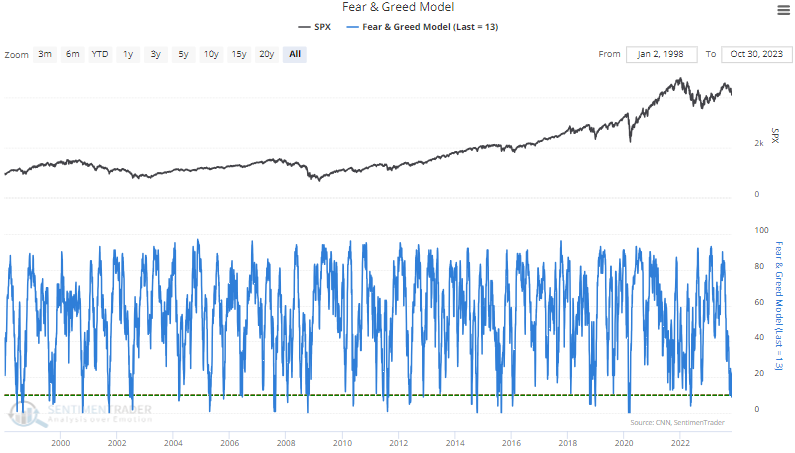
Dean further showed that sentiment measures are increasingly revealing a growing sense of pessimism in an environment that already exhibits a lack of confidence in the stock market's prospects. One of those indicators, the Fear & Greed Model, dropped below 10% for only the 25th time since 1999.
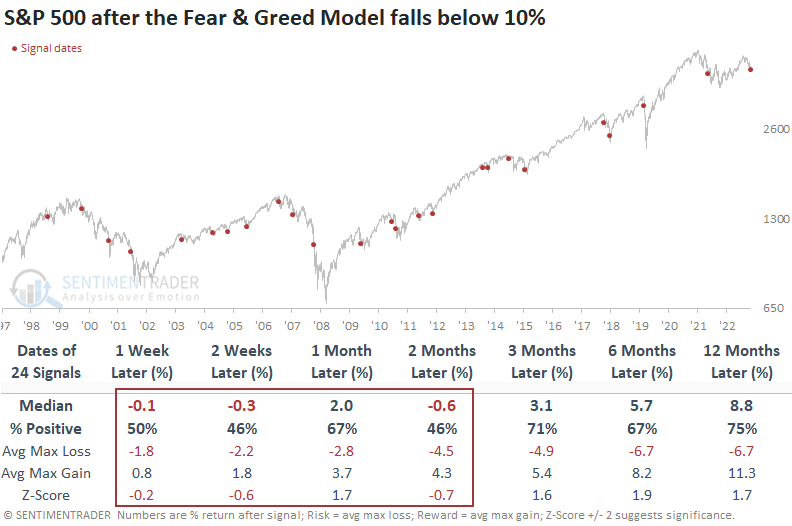
Whenever the Fear & Greed Model dips below 10%, the S&P 500 encounters difficulties in the following two months. At some point over that same time frame, the large-cap index was negative in 19 out of 24 precedents. Almost 60% of the signals occurred in a bear market or a correction that exceeded -14% from peak to trough.
Tech stock volatility reversal
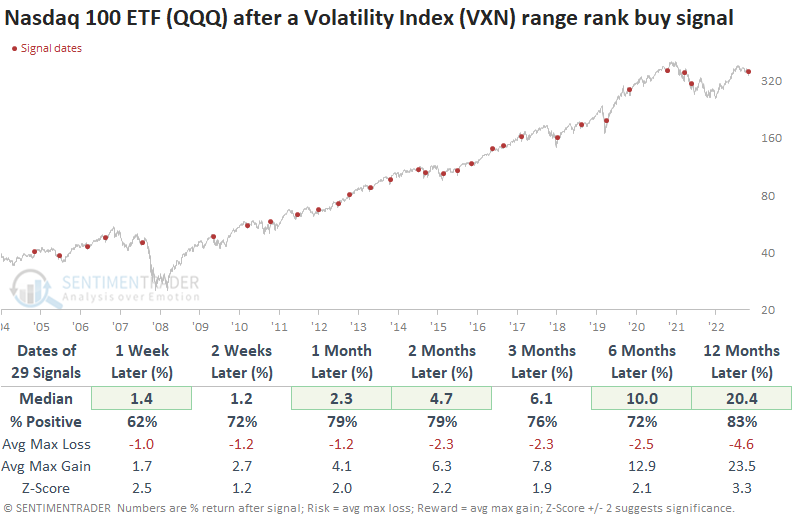
The Volatility Index (VXN) for the Nasdaq 100 reversed from a period of elevated volatility. Dean showed that similar shifts preceded a rally in the NDX 100 ETF (QQQ) 79% of the time over the subsequent two months. Alphabet and Amazon also triggered volatility reversal buy signals.
The CBOE Volatility Index (VXN) for the Nasdaq 100 Index increased to the highest level in 84 trading sessions. Subsequently, it reversed lower, triggering a buy signal for the Nasdaq 100, which one can conveniently trade using the QQQ ETF.
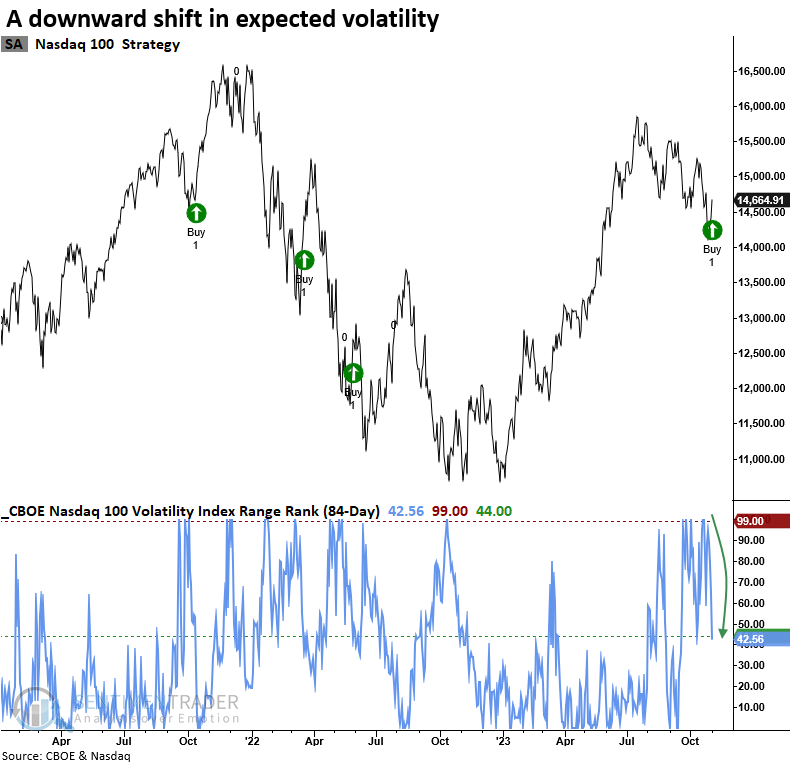
When the 84-day range rank of the Volatility Index (VXN) cycles from 100% to less than 44% and index momentum is positive, the downward shift in expected volatility tends to produce bullish outcomes for the Nasdaq 100 ETF (QQQ). Over the subsequent two and three-month periods, the heavily traded ETF was higher 79% of the time.
The CBOE provides volatility indexes for several popular stocks like Alphabet, Amazon, and Apple. On Wednesday, Alphabet triggered its first range rank buy signal since October 2021. Volatility signals in Alphabet tend to struggle in the first month. However, after the dust settled, the stock showed solid returns, win rates, and z-scores over the subsequent two and three-month time frames.
Whenever the range rank for Amazon's Volatility Index cycled from 100% to less than 58%, and price momentum was positive, the stock tended to trend upward. However, like the index signals, stocks are susceptible to whipsaw signals during protracted downtrends.
Seasonality, again, may be a nice tailwind...
Jay noted that the stock market has demonstrated a long-term tendency to perform well during the 4th quarter of the year, and our Annual Seasonal Trend chart suggests strength between Trading Day of the Year #208 and the end of the year.
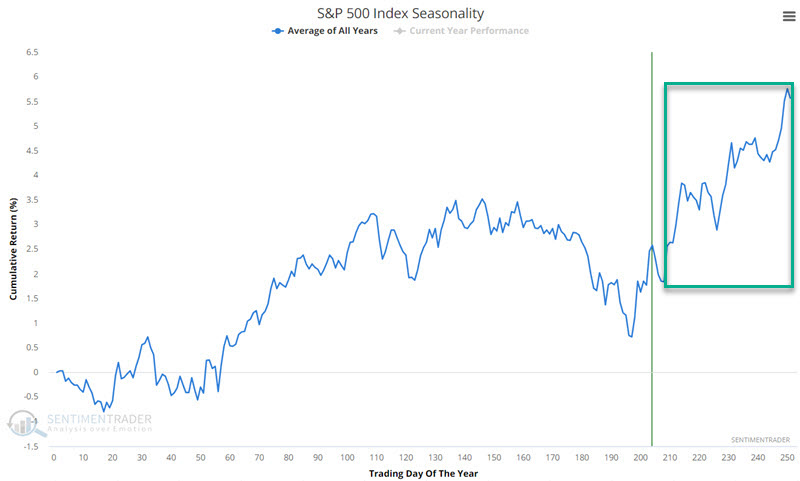
As you can see in the chart above, the market shows seasonal strength from Trading Day of Year #208 through the end of the year. We will start our test in 1953 (because before 1953, the NYSE was open for a few hours on Saturday, so there were technically more trading days in a year before 1953). For 2023, this period begins at the close of trading on 2023-10-30 and extends through the close on 2023-12-29.
The chart below displays the day-to-day equity curve and the hypothetical growth of $1 held in the S&P 500 Index (price-performance only) ONLY during this favorable period.
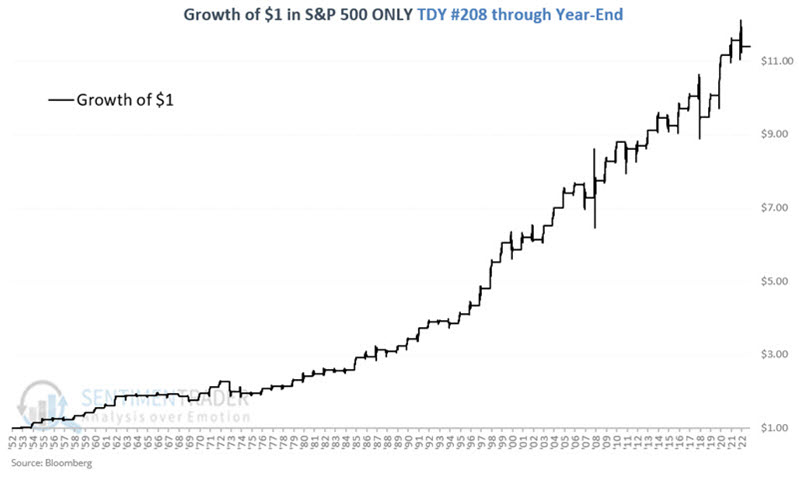
These seasonal windows showed a gain 76% of the time, with a median return more than twice the median loss. More importantly, the S&P gained more than +5% during 29 years but suffered a loss of more than -5% during only 3 years.
...especially for the average stock
Jay further showed that over many decades, the S&P 500 Equal Weight Index has outperformed from November through April.
The S&P 500 Index is a cap-weighted index. This means that the price of each component stock is multiplied by the number of shares outstanding for that stock to calculate the overall index average. It's been a boon for investors in recent years as mega-cap stocks such as Apple, Amazon, Nvidia, and Microsoft have outperformed.
The S&P 500 Equal Weight Index applies equal weight to all stocks in the index. Each company in the S&P 500 Equal Weight Index is assigned a weight of 0.20% as of the pricing reference date, so the smallest stock in the index can influence the index price movement just as much as the largest stock.
The following test assumes that separate investments are made in both the standard (cap-weighted) S&P 500 Index (SPX) and the equal-weighted version (SPXE). For this test, we will hold both indexes only from the close on October 31st each year through the close on April 30th the following year.
Since 1957, SPXE has gained +27,666% from November through April versus +4,959% for SPX.
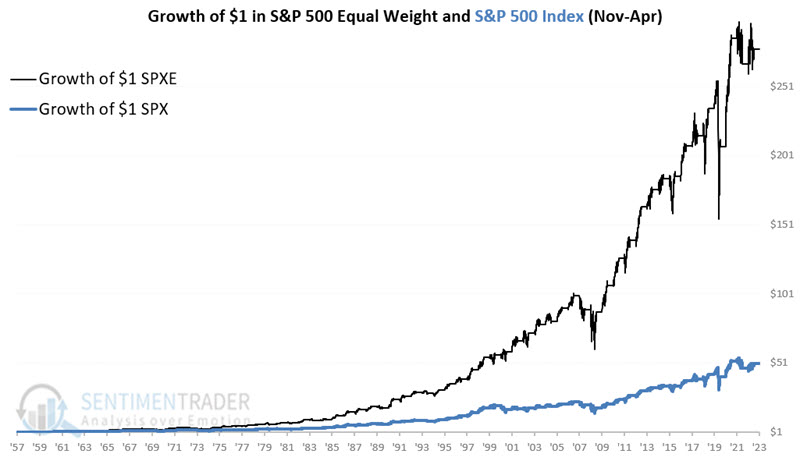
Based on the overall numbers, the SPXE appears to be the clear choice from November through April. That said, the chart below displays the cumulative growth for SPXE relative to SPX during November through April since 1957.
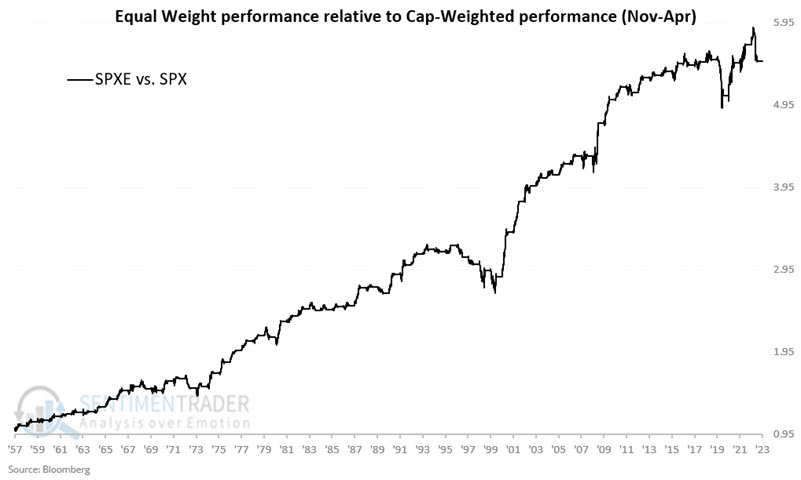
Note that since 2016, there has been no advantage to holding SPXE rather than SPX during November through April. There is precedence. From 1968 through 1973 and again from 1996 through 2000, SPXE underperformed SPX during this purportedly "better for equal weight" period. Nothing (legal) is ever a sure thing in markets.
One worry (?) is that banks aren't lending to businesses
As stocks continue to decline, many hitting new lows for the year, worries are increasing. We've discussed many seemingly existential threats since the October 2022 bottom, and few have a reliable historical track record of consistently preceding further declines.
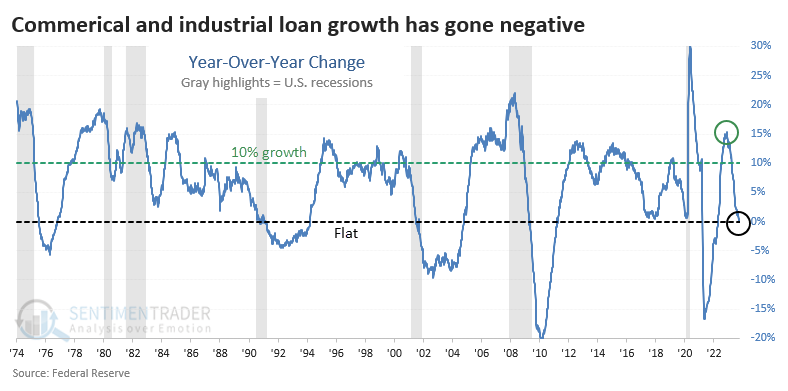
We can add a lack of bank loan growth to businesses to the potential reasons for angst. According to the Federal Reserve, bank lending to businesses has stagnated over the past year after a robust post-pandemic recovery.
We can clearly see the slowdown via the year-over-year rate of change in Commercial & Industrial (C&I) loans. After spiking above a 15% growth rate, it has since plunged and just turned negative, meaning banks have issued fewer C&I loans than they did a year ago.
For the S&P 500, when C&I loan growth turned negative after rising more than 10% year-over-year, it was not a sign of impending doom. Four out of five times, it lagged what had already been a substantial decline in stock prices, for future long-term returns were good. The only time it preceded a significant decline was following the internet bubble.
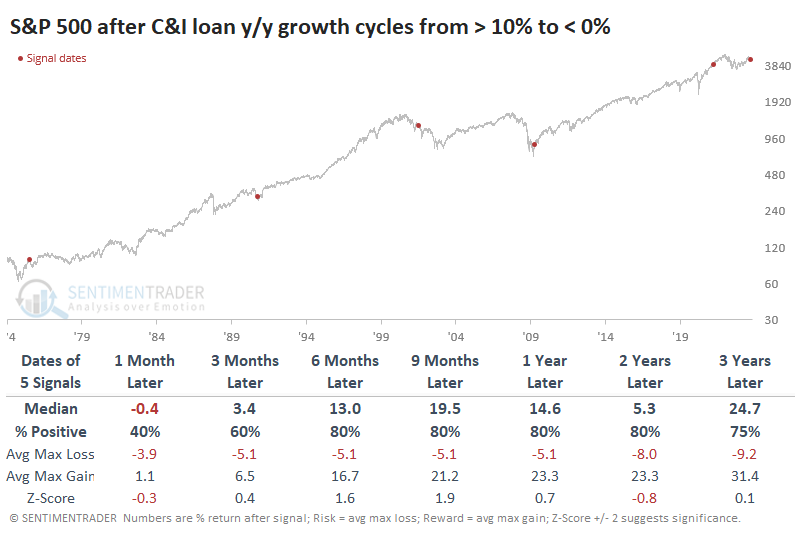
For Financials, the risk was higher, but so was the reward. There was an additional loss scattered among the time frames, but overall returns in the sector from 1-3 years later were more robust than those for the S&P 500.
Interestingly, the best-performing index over the next 6-9 months was the small-cap Russell 2000. It rose after all five signals, averaging a very healthy +18.3% six months later. Typically, when loan growth turns negative, we'd be inundated about how this is a sign of a stagnating business environment, most likely to hit the smallest companies. We're certainly seeing many of those headlines today.
Even without as much access to credit, earnings are growing
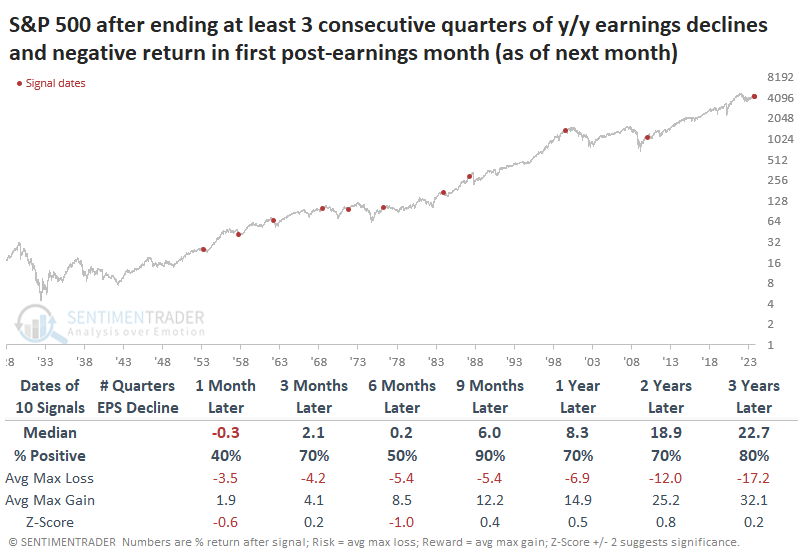
It might not seem like it, given how the average stock has performed over the past few months, but their underlying fundamentals are improving. For the first time in several quarters, earnings among S&P 500 companies are on track to show growth.
According to S&P Global Data, as-reported 12-month earnings per share for S&P 500 companies are estimated to total $189.20 for the quarter ending September 30. That's a little more than 1% higher than Q3 2022 and would mark the first actual earnings growth after three consecutive declines.
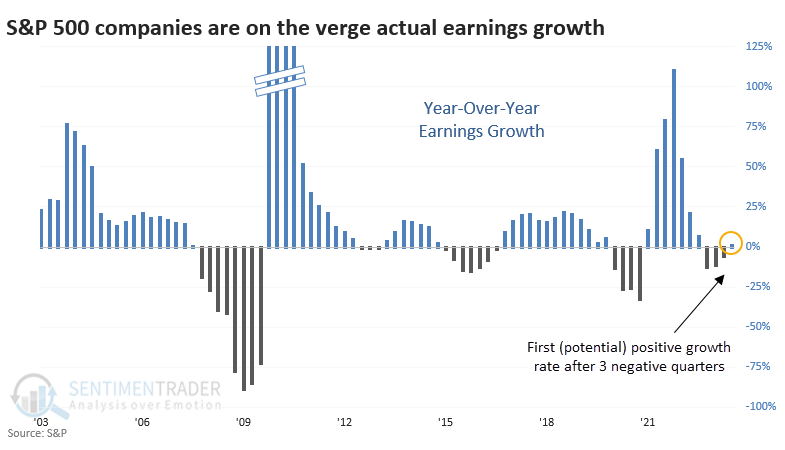
There is a dubious relationship between stock prices and fundamentals, or the economy. That's not to say forward S&P returns were poor; they were just...fine. Cycles over the past 50 years have led to excellent returns, except for that little interruption called Black Monday in October 1987.
One interesting wrinkle is that since the quarter ended, the S&P has continued to decline, and we're almost guaranteed this time to have an adverse reaction in the first month after quarter-end. The table below represents what investors would experience going forward in real-time. Nine months later, there was only one negative return (that pesky '87 crash).
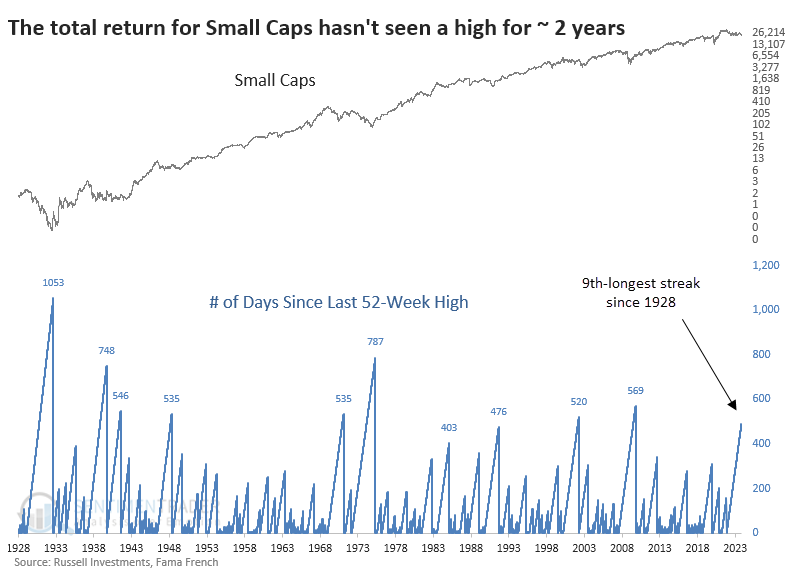
Small Caps suffer a historic drought
Smaller stocks just can't catch a break. In the coming week, the Russell 2000 will have gone 500 trading days, nearly two full years, since it last closed at a 52-week high.
That's the 3rd-longest streak in the index's history, and it's almost sure to set a record - it would have to rally nearly 50% in fewer than 75 days to end the streak. We use a total return index going back to 1928 for the Small Cap factor, and that one is showing similar behavior. It is now mired in the 9th-longest streak in 95 years, with only three of them going much beyond 500 days.
The table below shows the total return in Small Caps after 500 days without setting a 52-week high. The table shows the percentage loss and number of days until the index troughed at its lowest point for at least the next year. For bulls, this is distressing news. Two times, Small Caps had already bottomed. But on average, the other six signals suffered a further 36% loss, and it took 379 days to reach the bottom - that's a year and a half.
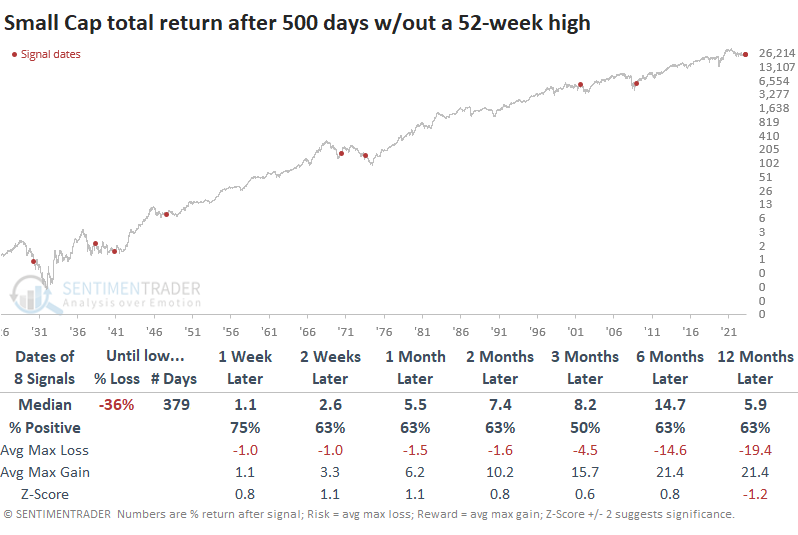
The table of maximum losses and gains across time frames shows that the two signals in the 1930s were brutal, with intense selling in the months ahead. After that, though, none of the signals showed maximum losses of more than -7% up to two months later, and four rallied more than +15% at some point. So, maybe some relief rebound tendencies.
A barely positive environment for floating rate bonds
Jay showed that using credit spreads - which measure the yield gap between lower-graded and higher-graded debt securities - can serve as a helpful timing tool for investing in floating-rate bond funds.
As the name implies, a floating rate bond (or variable or adjustable rate bond) is a bond whose interest rate is adjusted periodically according to a predetermined formula; it is usually linked to an interest rate index such as LIBOR. This is different from a typical fixed-rate bond that has an interest rate that doesn't fluctuate. Floating-rate bonds can be very attractive in a rising interest-rate environment.
A credit spread measures the difference in the current yield for a lower-rated security versus a higher-rated security. The lower the rating for a given debt instrument, the higher the likelihood the issuer will default and be unable to repay all of the promised interest and principal. By monitoring the level and trend of credit spreads, an investor can get a sense of the amount of fear in the market.
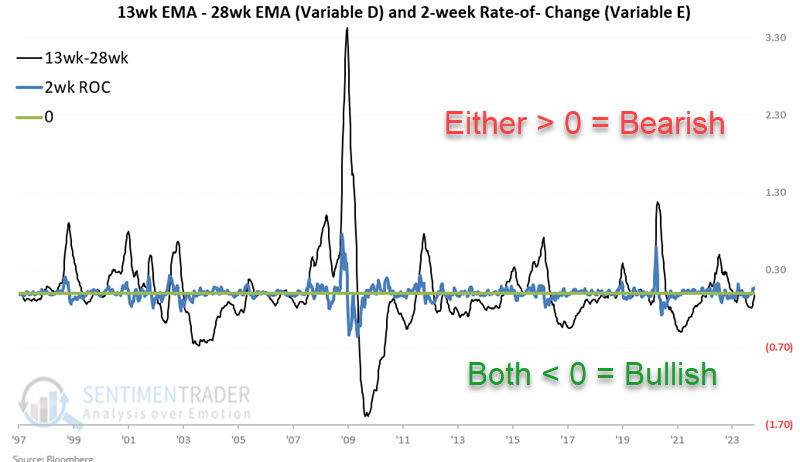
For the test below, we will use the ICE BofA US High Yield Index Option-Adjusted Spread that appears in the chart below. The spikes in the chart below almost invariably coincide with above-average stock market volatility.
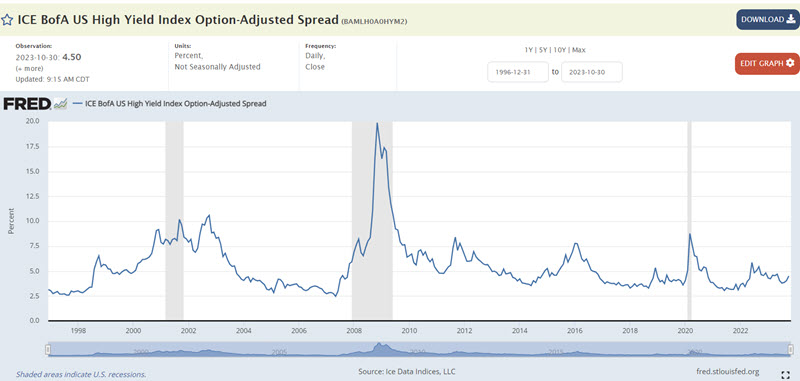
It is generally considered a negative for financial instruments when credit spreads rise and vice versa. To designate credit spreads as rising or falling, we will use the following calculations.
- A = Latest ICE BofA US High Yield Index Option-Adjusted Spread
- B = 13-week exponential moving average (EMA) of A
- C = 28-week exponential moving average (EMA) of A
- D = B - C (i.e., 13-week EMA minus 28-week EMA)
- E = D this week minus D two weeks ago
- If BOTH D and E are positive, then F = 0; else, F = +1
In plain English, iF the 13-week EMA is below the 28-week EMA AND the difference between the two averages is below its level of two weeks ago, THEN it's favorable.
The chart below displays both Variable D and Variable E. If BOTH are negative, that is considered favorable for floating rate bonds.
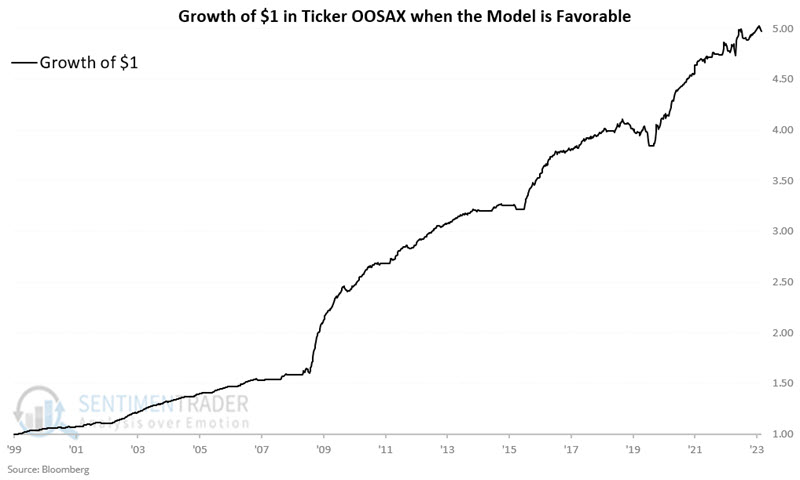
If F = +1, then we will hold the Oppenheimer Senior Floating Rate mutual fund (ticker OOSAX). If F = 0, then we will exit floating rate securities and be flat (for this test, no interest earned is assumed when out of floating rate securities).
The chart below displays the growth of $1 invested in ticker OOSAX only when Variable F = +1. From 1998-03-27 to 2020, the hypothetical cumulative return was +397.6%.
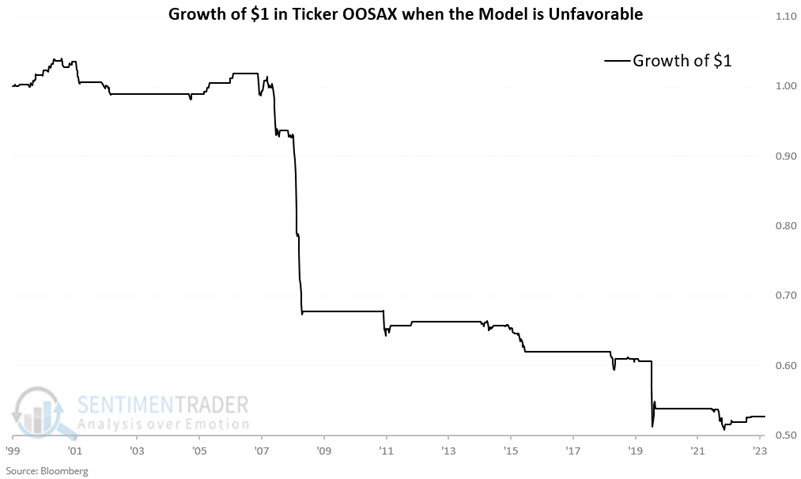
Now, let's look at floating rate bond performance when the model is unfavorable. The chart below displays the growth of $1 invested in ticker OOSAX only when Variable F = 0. From 1998-03-27 to 2020, the hypothetical cumulative return was -47.3%.
As of 2023-10-27, the Variable stands as follows:
- A = 4.50
- B = 4.19
- C = 4.21
- D = -0.02
- E = +0.07
- F = +1
Variable E is greater than zero, but Variable D is less than 0. Since the indicator is only deemed unfavorable when BOTH D and E are positive, then Variable F is equal to +1, and the model is still considered favorable for floating rate bonds. However, note that Variable D could flip to positive as early as 2023-11-03, which would flip this model to unfavorable for floating rate bonds.
Quick bulls in bonds
Jay noted that traders rushed to the bullish side during the latest bond market bounce. A handful of indicators suggest that further consolidation and testing may be in the offing before any sustained upturn unfolds.
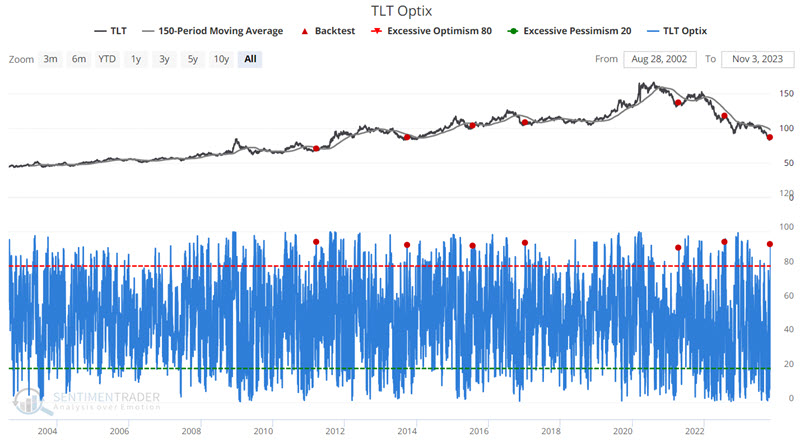
The long-term treasury bond had gotten so oversold that many assumed it had to bounce at some point. Thus, at the first sign of an upturn, the pent-up bullishness often reveals itself in our Optix calculations. The chart below displays the last five years of iShares 20 Plus Year Treasury Bond ETF (ticker TLT) performance. Traders wasted little time piling onto the bullish bandwagon when TLT showed the faintest signs of life.
Unfortunately for bond traders, historically, when this spike in bullish sentiment occurs while prices are still in a downtrend, it tends to be premature. The chart below highlights those rare occasions when TLT Optix crossed above 90% while ticker TLT was below its 150-day moving average.
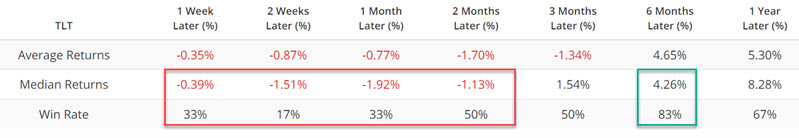
Typically, TLT has struggled during the 1-week to 2-month periods following previous signals. Interestingly, six-month returns were positive 83% of the time. This would seem to argue for bond traders to remain patient and look for another buying opportunity in the weeks ahead rather than plunging in immediately.
Jay also looked at a couple of indicators that analysts wouldn't typically consider for bonds. That includes the percentage of consumers expecting the stock market to decline, as well as the relationship between the copper and gold. When those indicators are at where they are now, bonds tended to struggle.
Seasonality is also a boon for soybeans
Jay suggested that due to the planting cycle in the U.S. soybeans are one of the most reliable seasonal markets and have shown a tendency to advance late in the year.
In a nutshell:
- Late fall to early spring: There are no soybeans in the ground (there is doubt about next year's crop, price tend to rise)
- Early spring to late summer: Bean seeds are planted and grow (there are clues regarding the current year's crop, price typically rise)
- Late summer to late fall: Beans are harvested (the crop is known, price tend to decline as doubts are eliminated)
The chart below displays the annual seasonal trend for soybean futures. The green box in the chart highlights the period from Trading Day of Year (TDY) #209 and TDY #249. For 2023, this period extends from the close on 2023-10-31 through 2023-12-28.
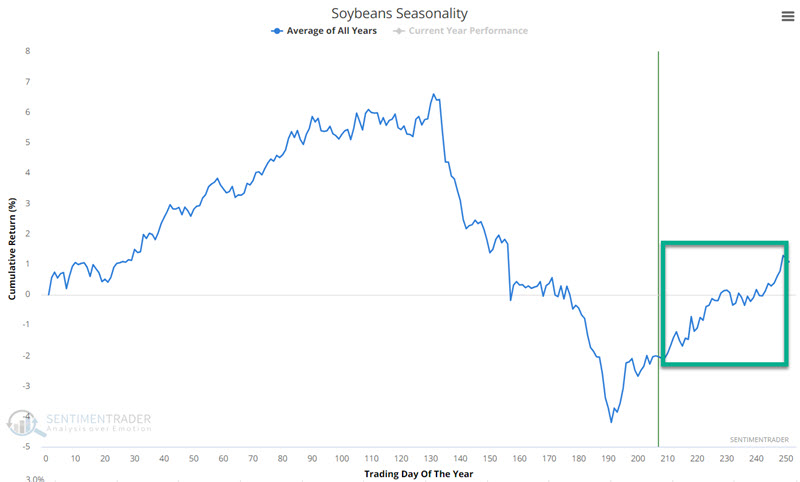
As you can see, soybeans tend to show strength late in the year. The chart below displays the hypothetical cumulative $ gain/loss achieved by holding long one soybean futures contract during the TDY #209 through #249 period every year since 1937.
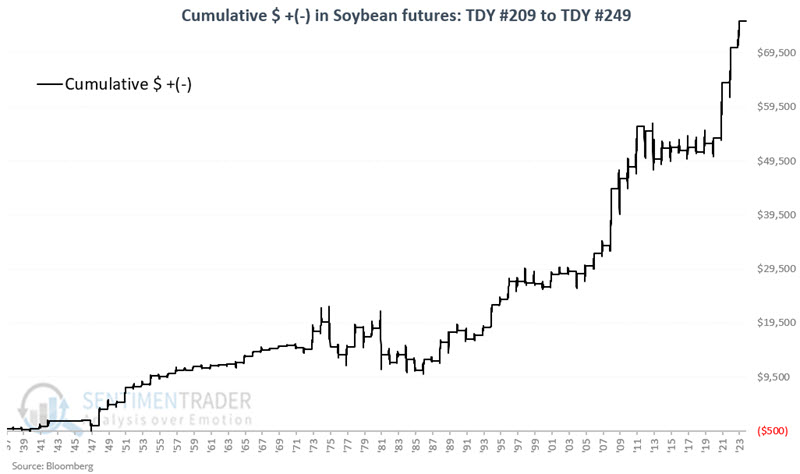
The Win Rate is not exceptional (66%). However, the Average and Median gains were significantly greater than the Average and Median losses, and moves over $3,000 skewed 10 to 2 in favor of winners.
Non-futures traders who wish to consider gaining exposure to the soybean market can buy shares of the Teucrium Soybean Fund (ticker SOYB) in a standard stock brokerage account. Shares of SOYB can be bought and sold just like shares of stock. The fund is designed to track the S&P GSCI Soybeans Index.
A bigger-picture look at soybean seasonality finds that the year can be divided into two halves. The chart below displays the hypothetical cumulative $ gain/loss from holding long one soybean futures contract during the TDY #191 through #131 the following year (black line) versus holding long one soybean futures contract during the TDY #131 through TDY #191 period (blue line) every year since 1937. The difference is stark.
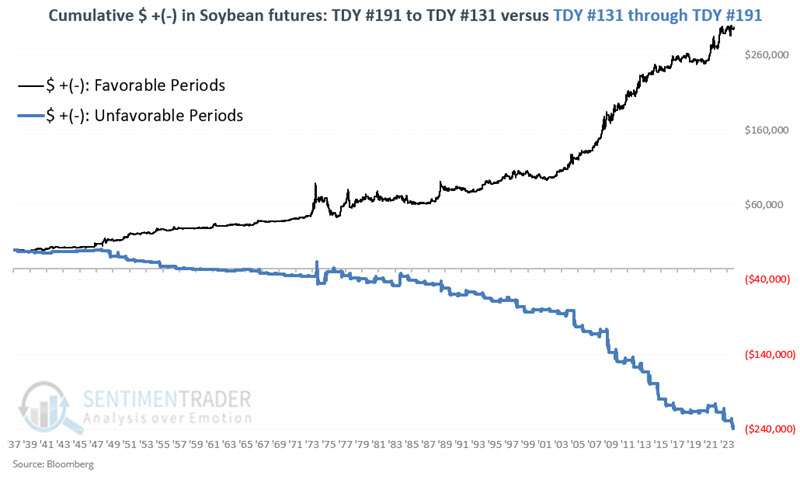
While favorable periods have witnessed some choppy action at times, the relevant point here is that a trader would have come out ahead being bullish during the favorable periods and bearish during the unfavorable periods.
About TradingEdge Weekly...
The goal of TradingEdge Weekly is to summarize some of the research published to SentimenTrader over the past week. Sometimes there is a lot to digest, and this summary highlights the highest conviction or most compelling ideas we discussed. This is NOT the published research; rather, it pulls out some of the most relevant parts. It includes links to the published research for convenience, and if you don't subscribe to those products, it will present the options for access.
Indicators at Extremes
|
|
|
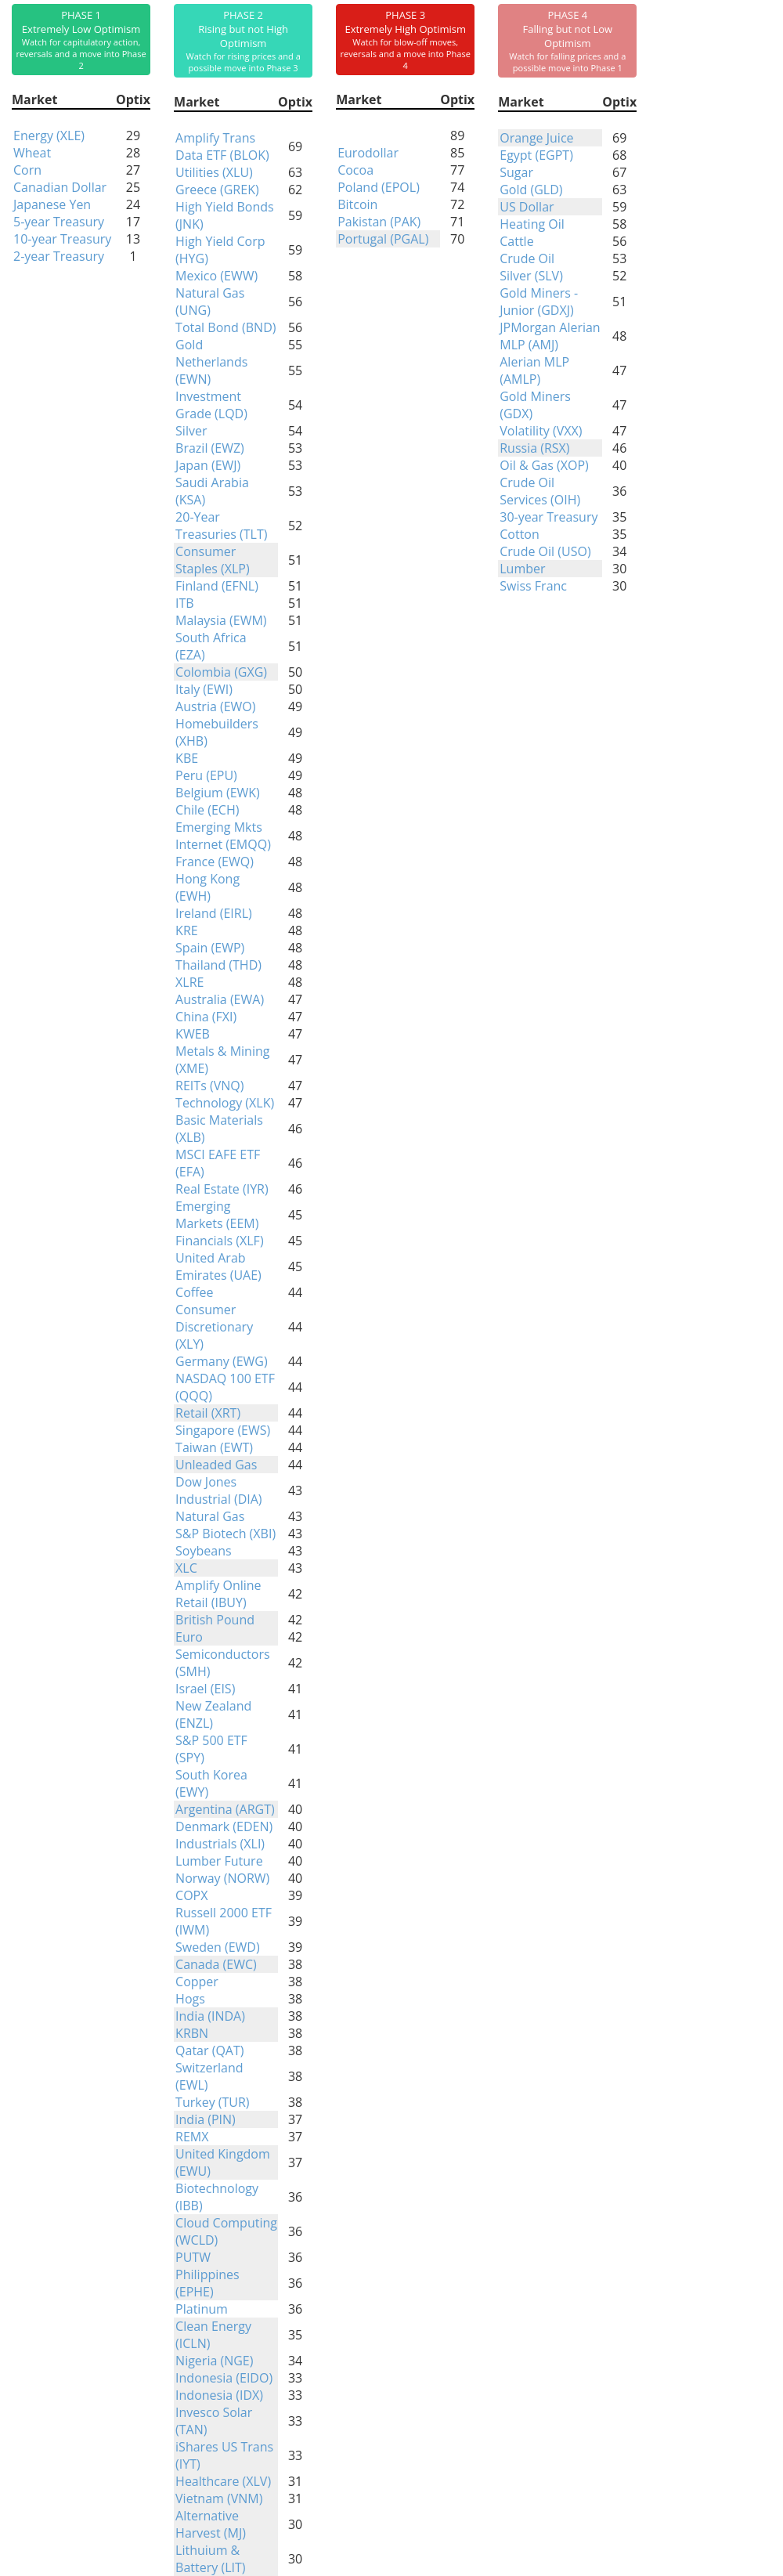
Phase Table
|
|
|
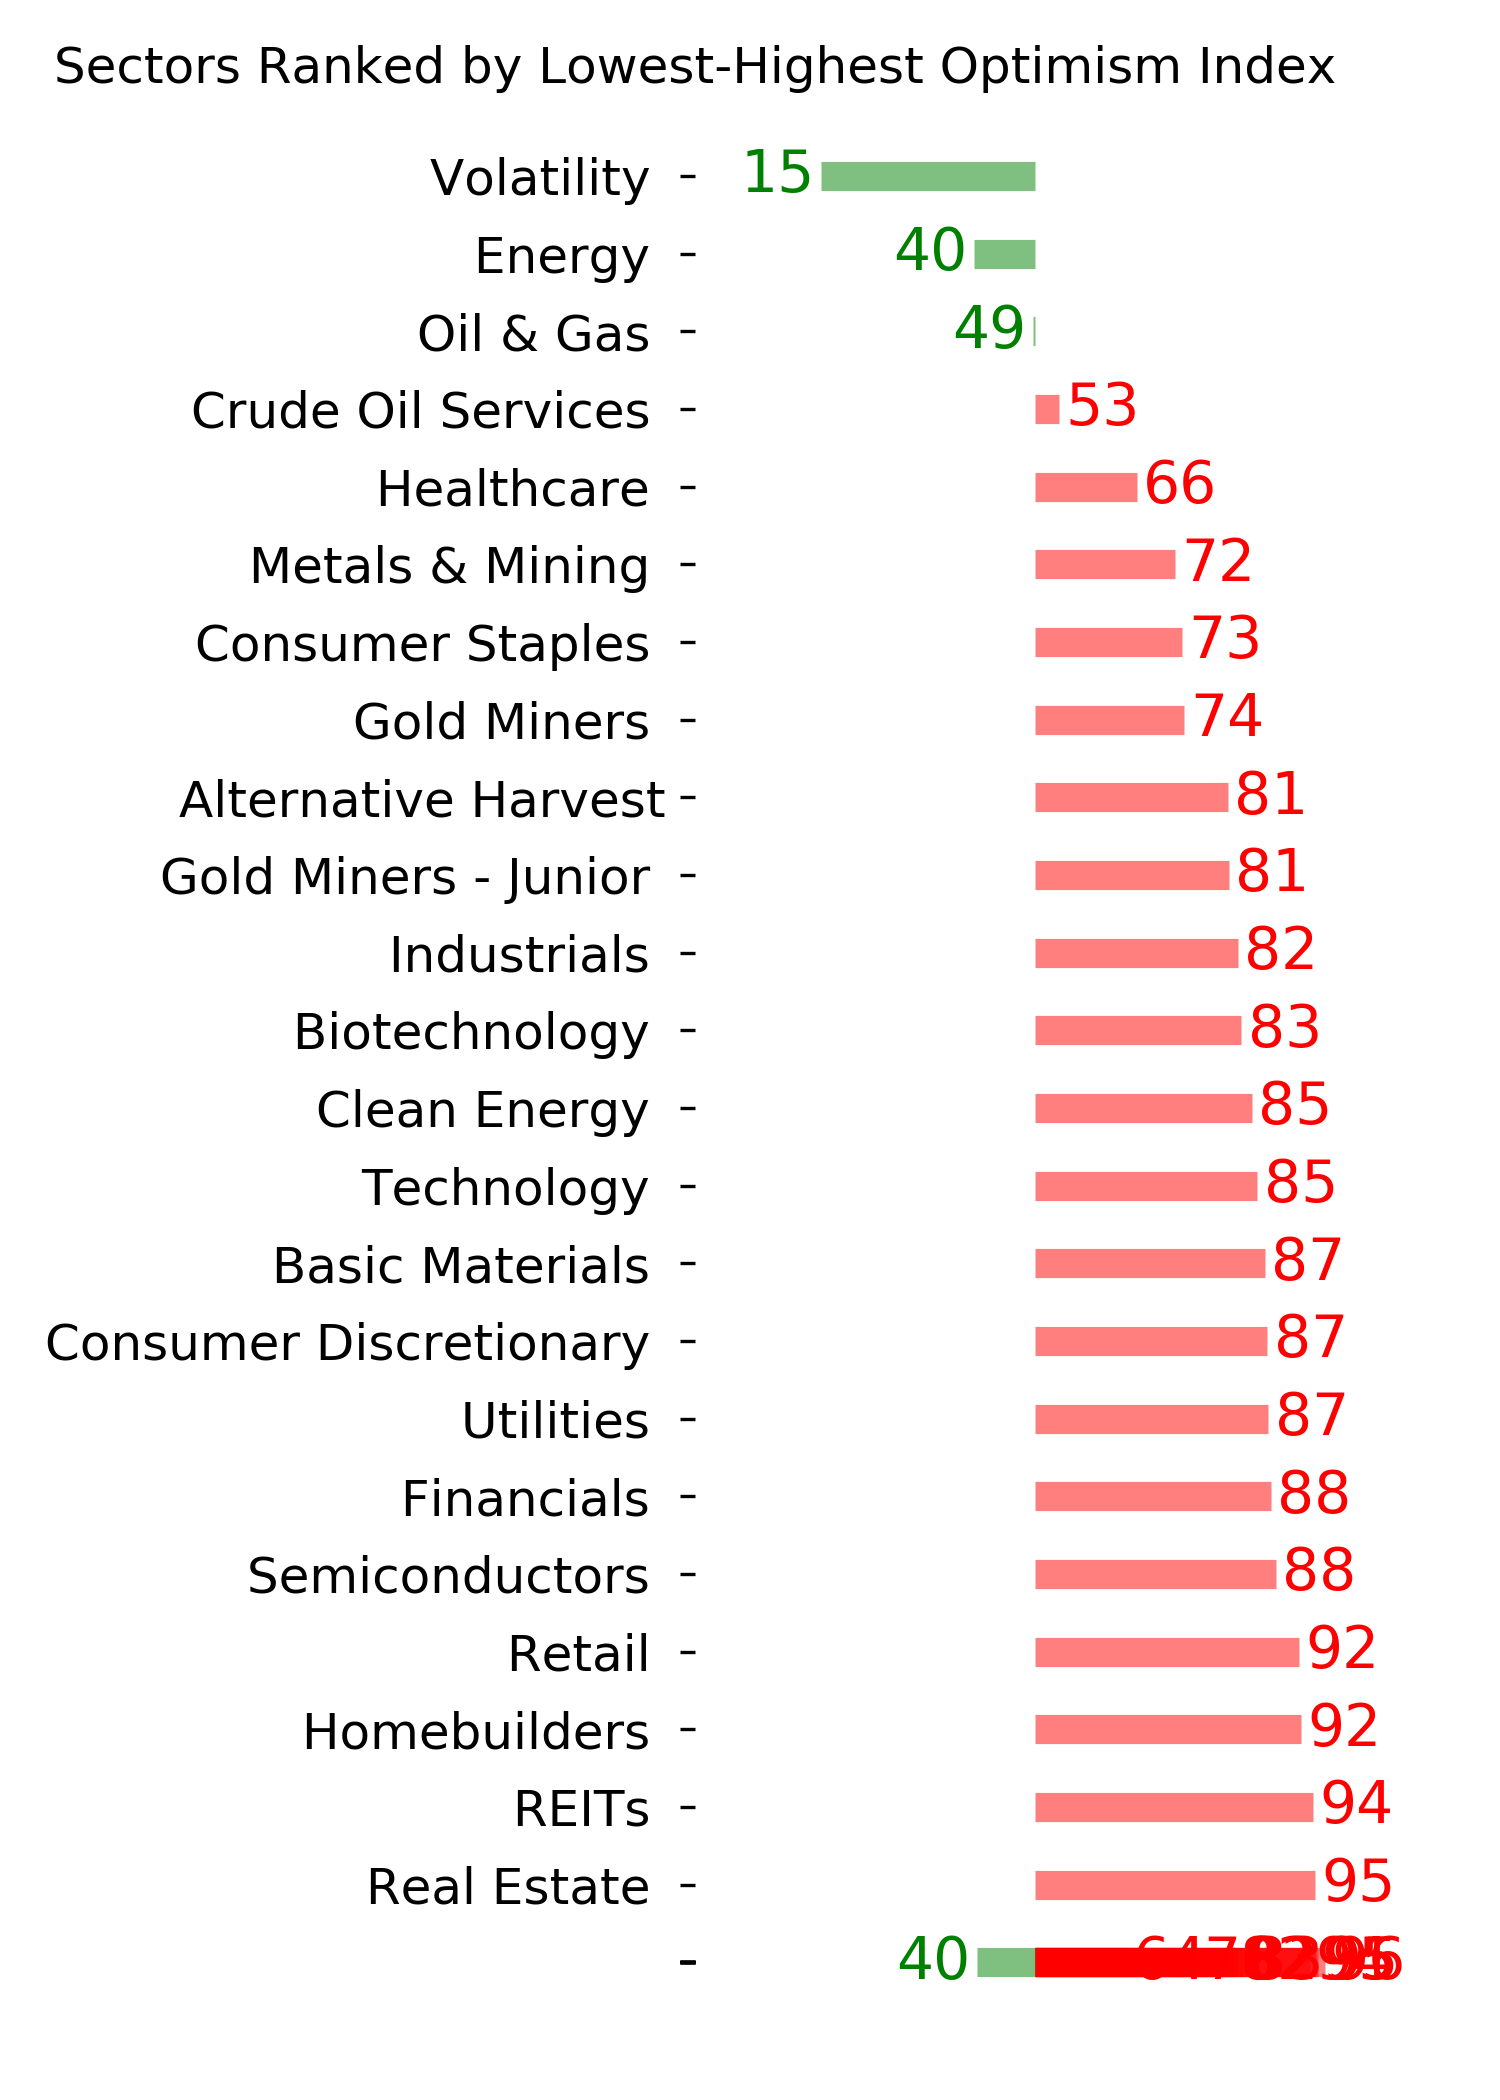
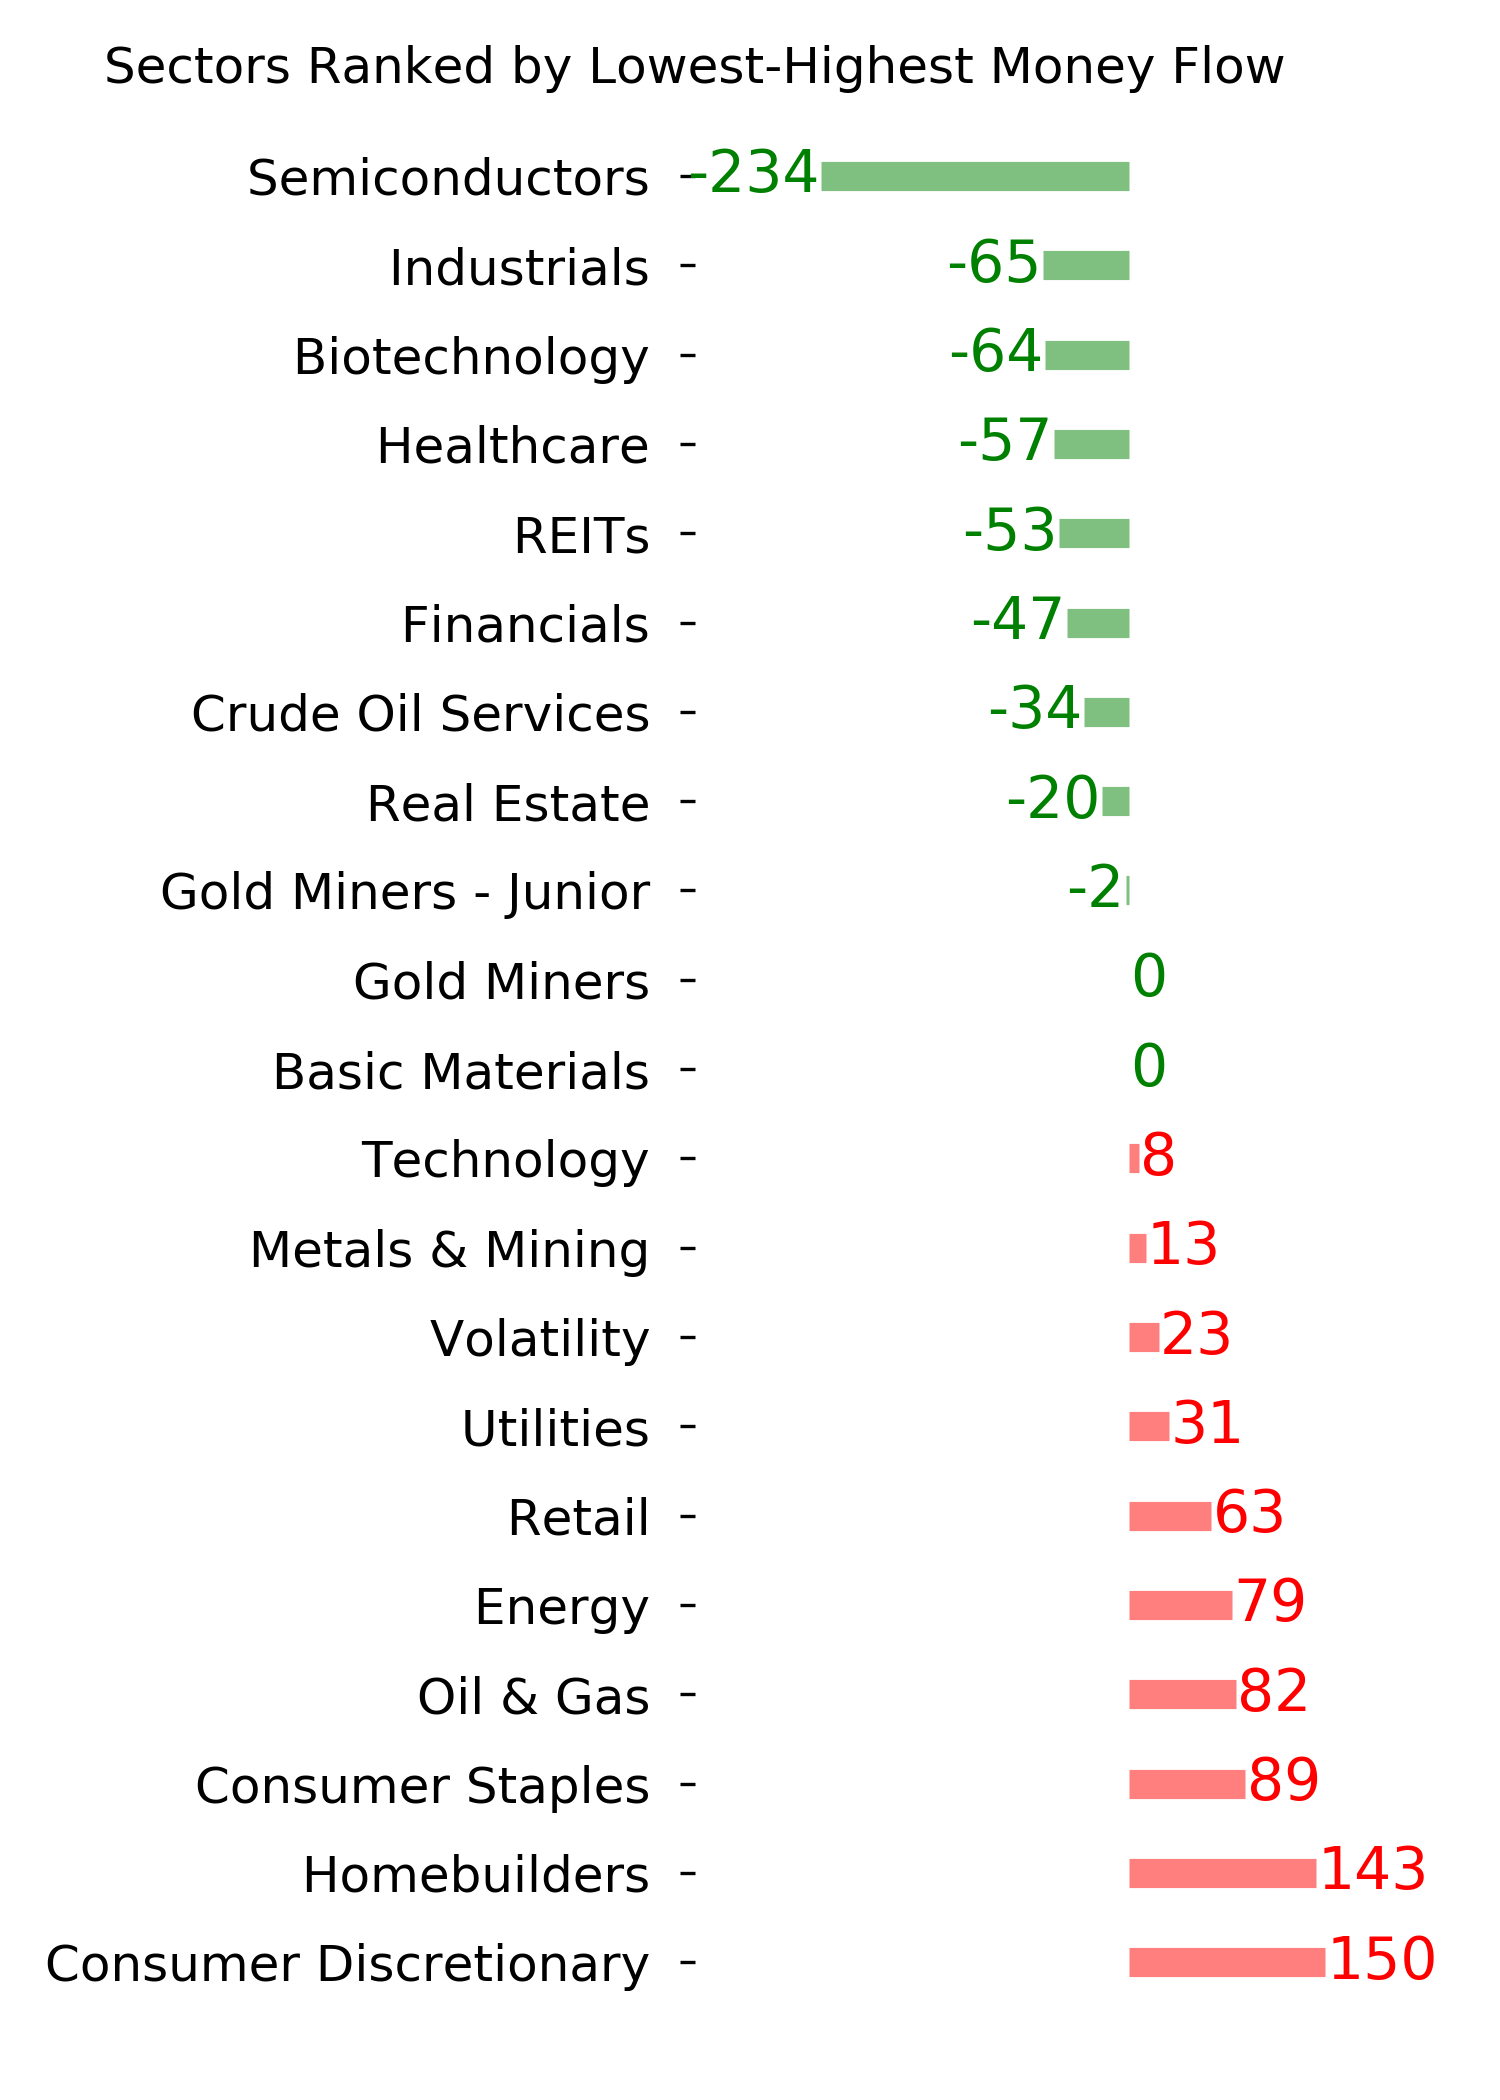
Ranks
|
|
|
|
|
|
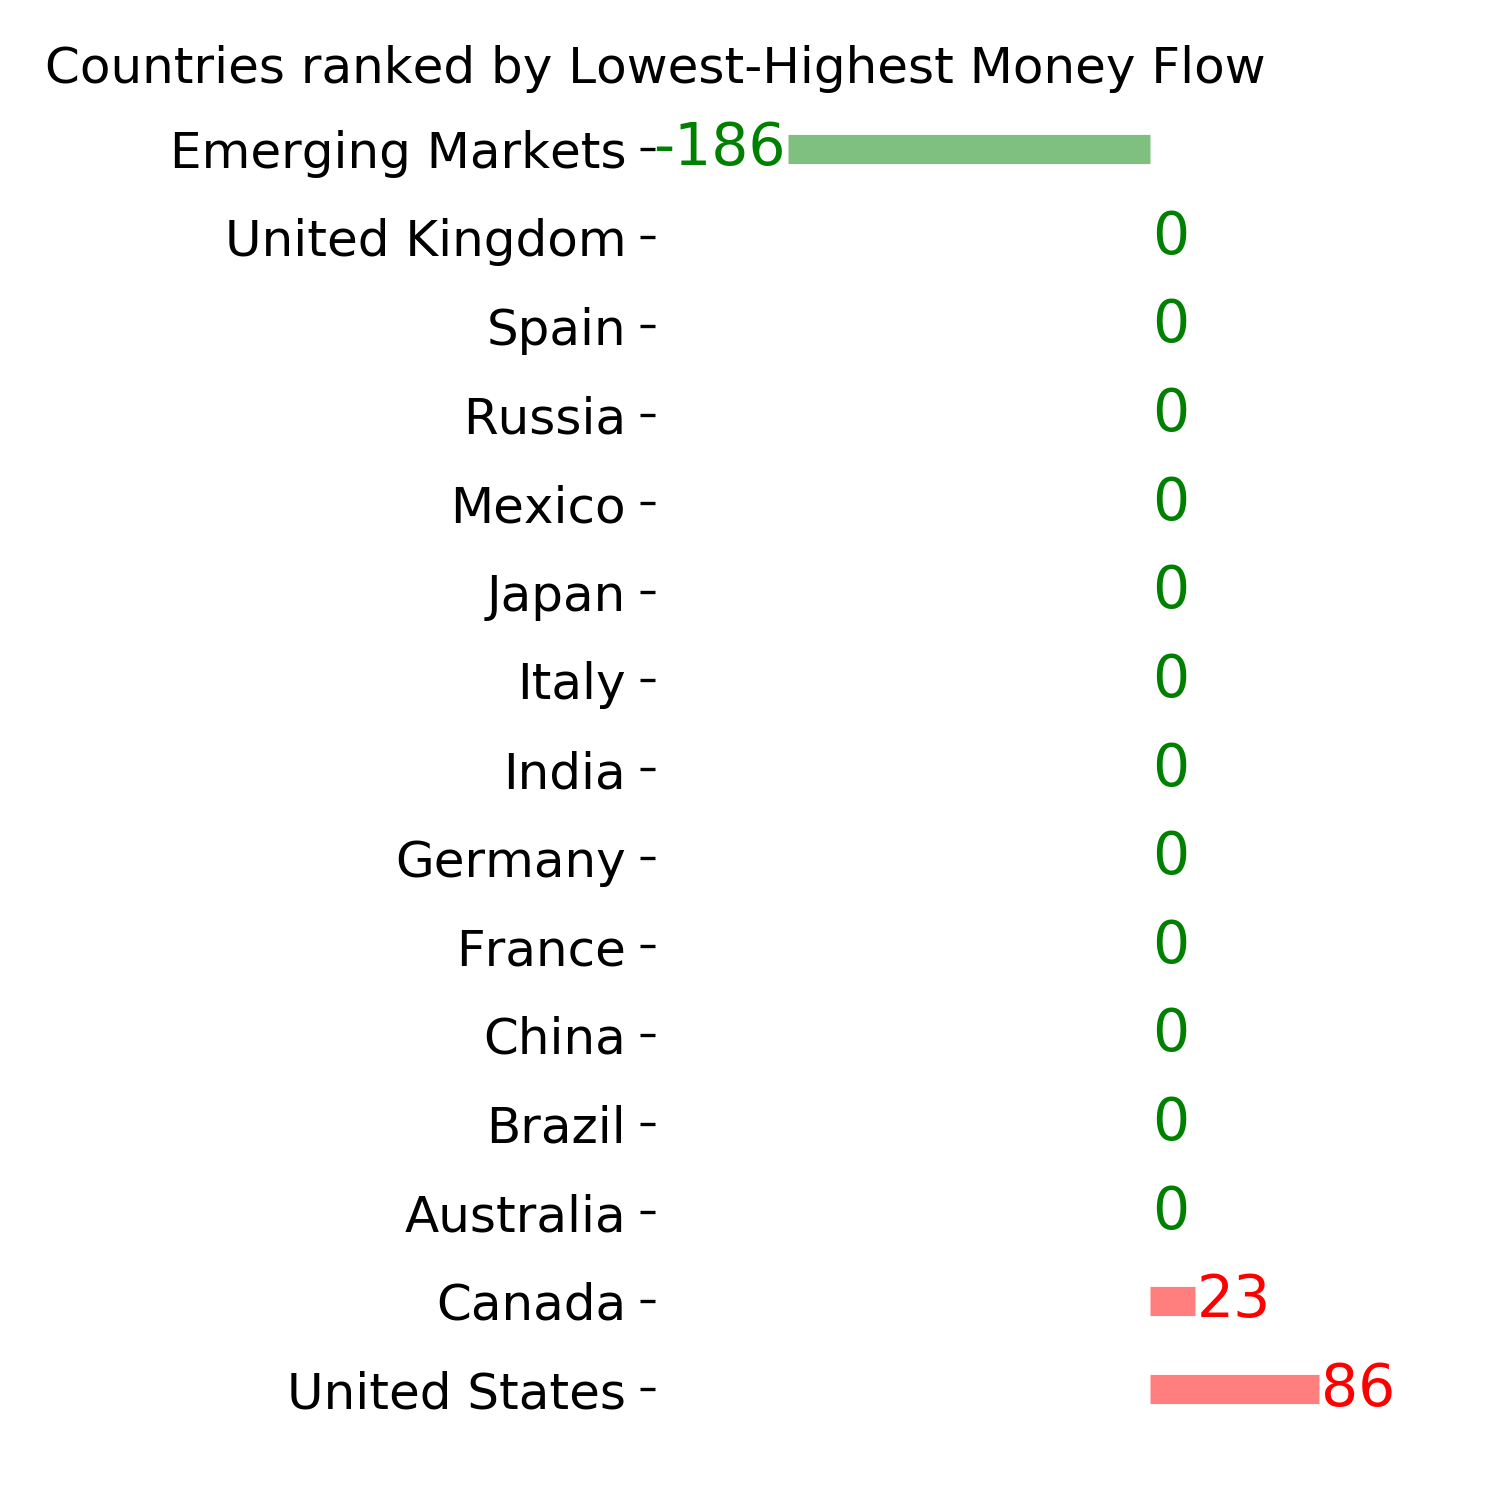
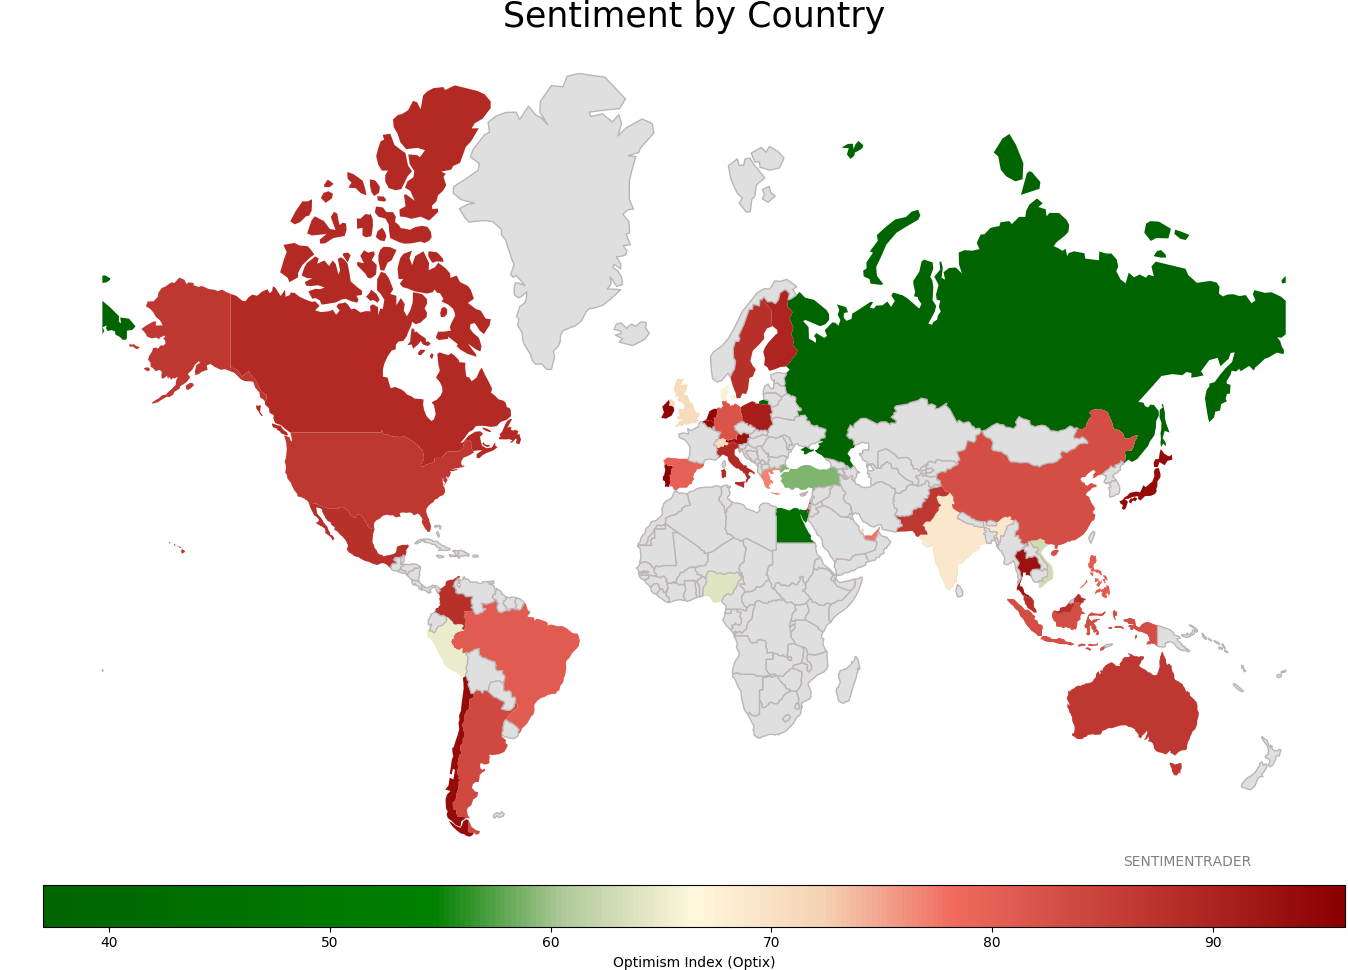
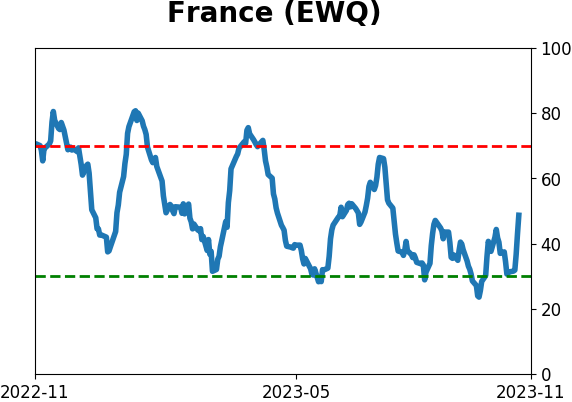
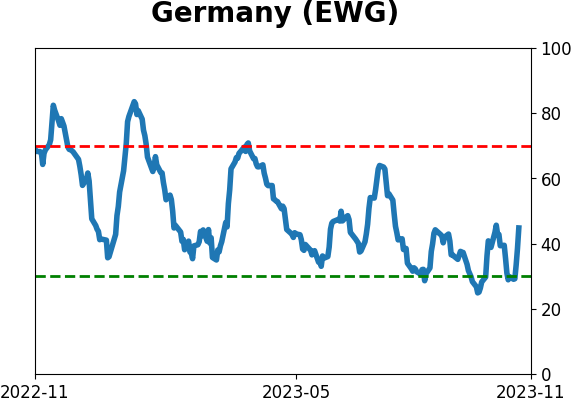
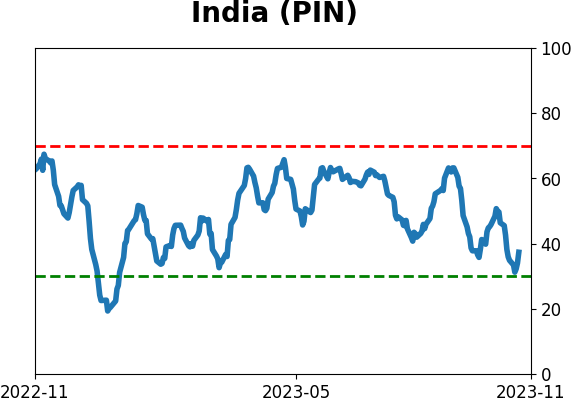
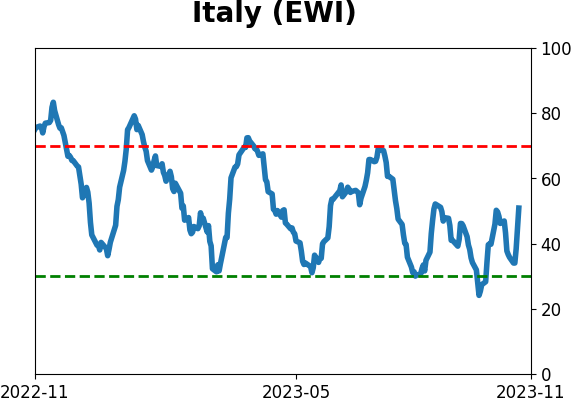
Sentiment Around The World
|
|
|
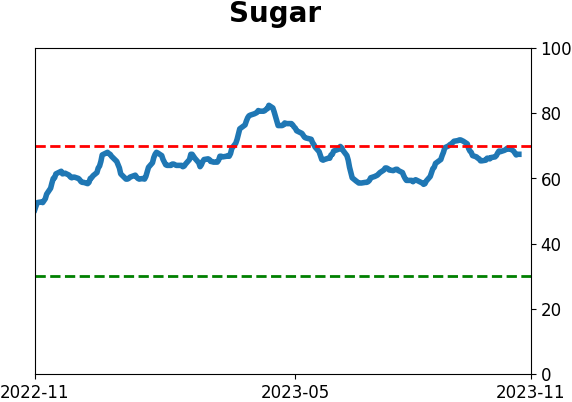
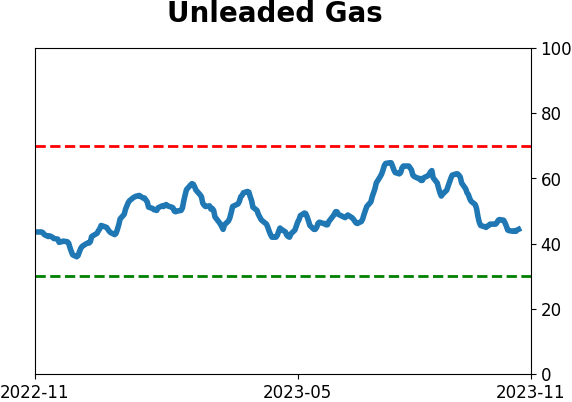
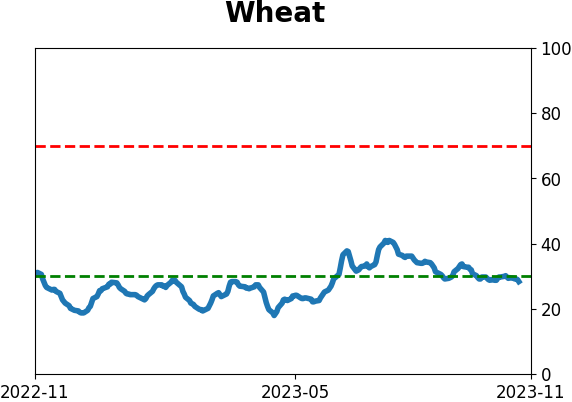
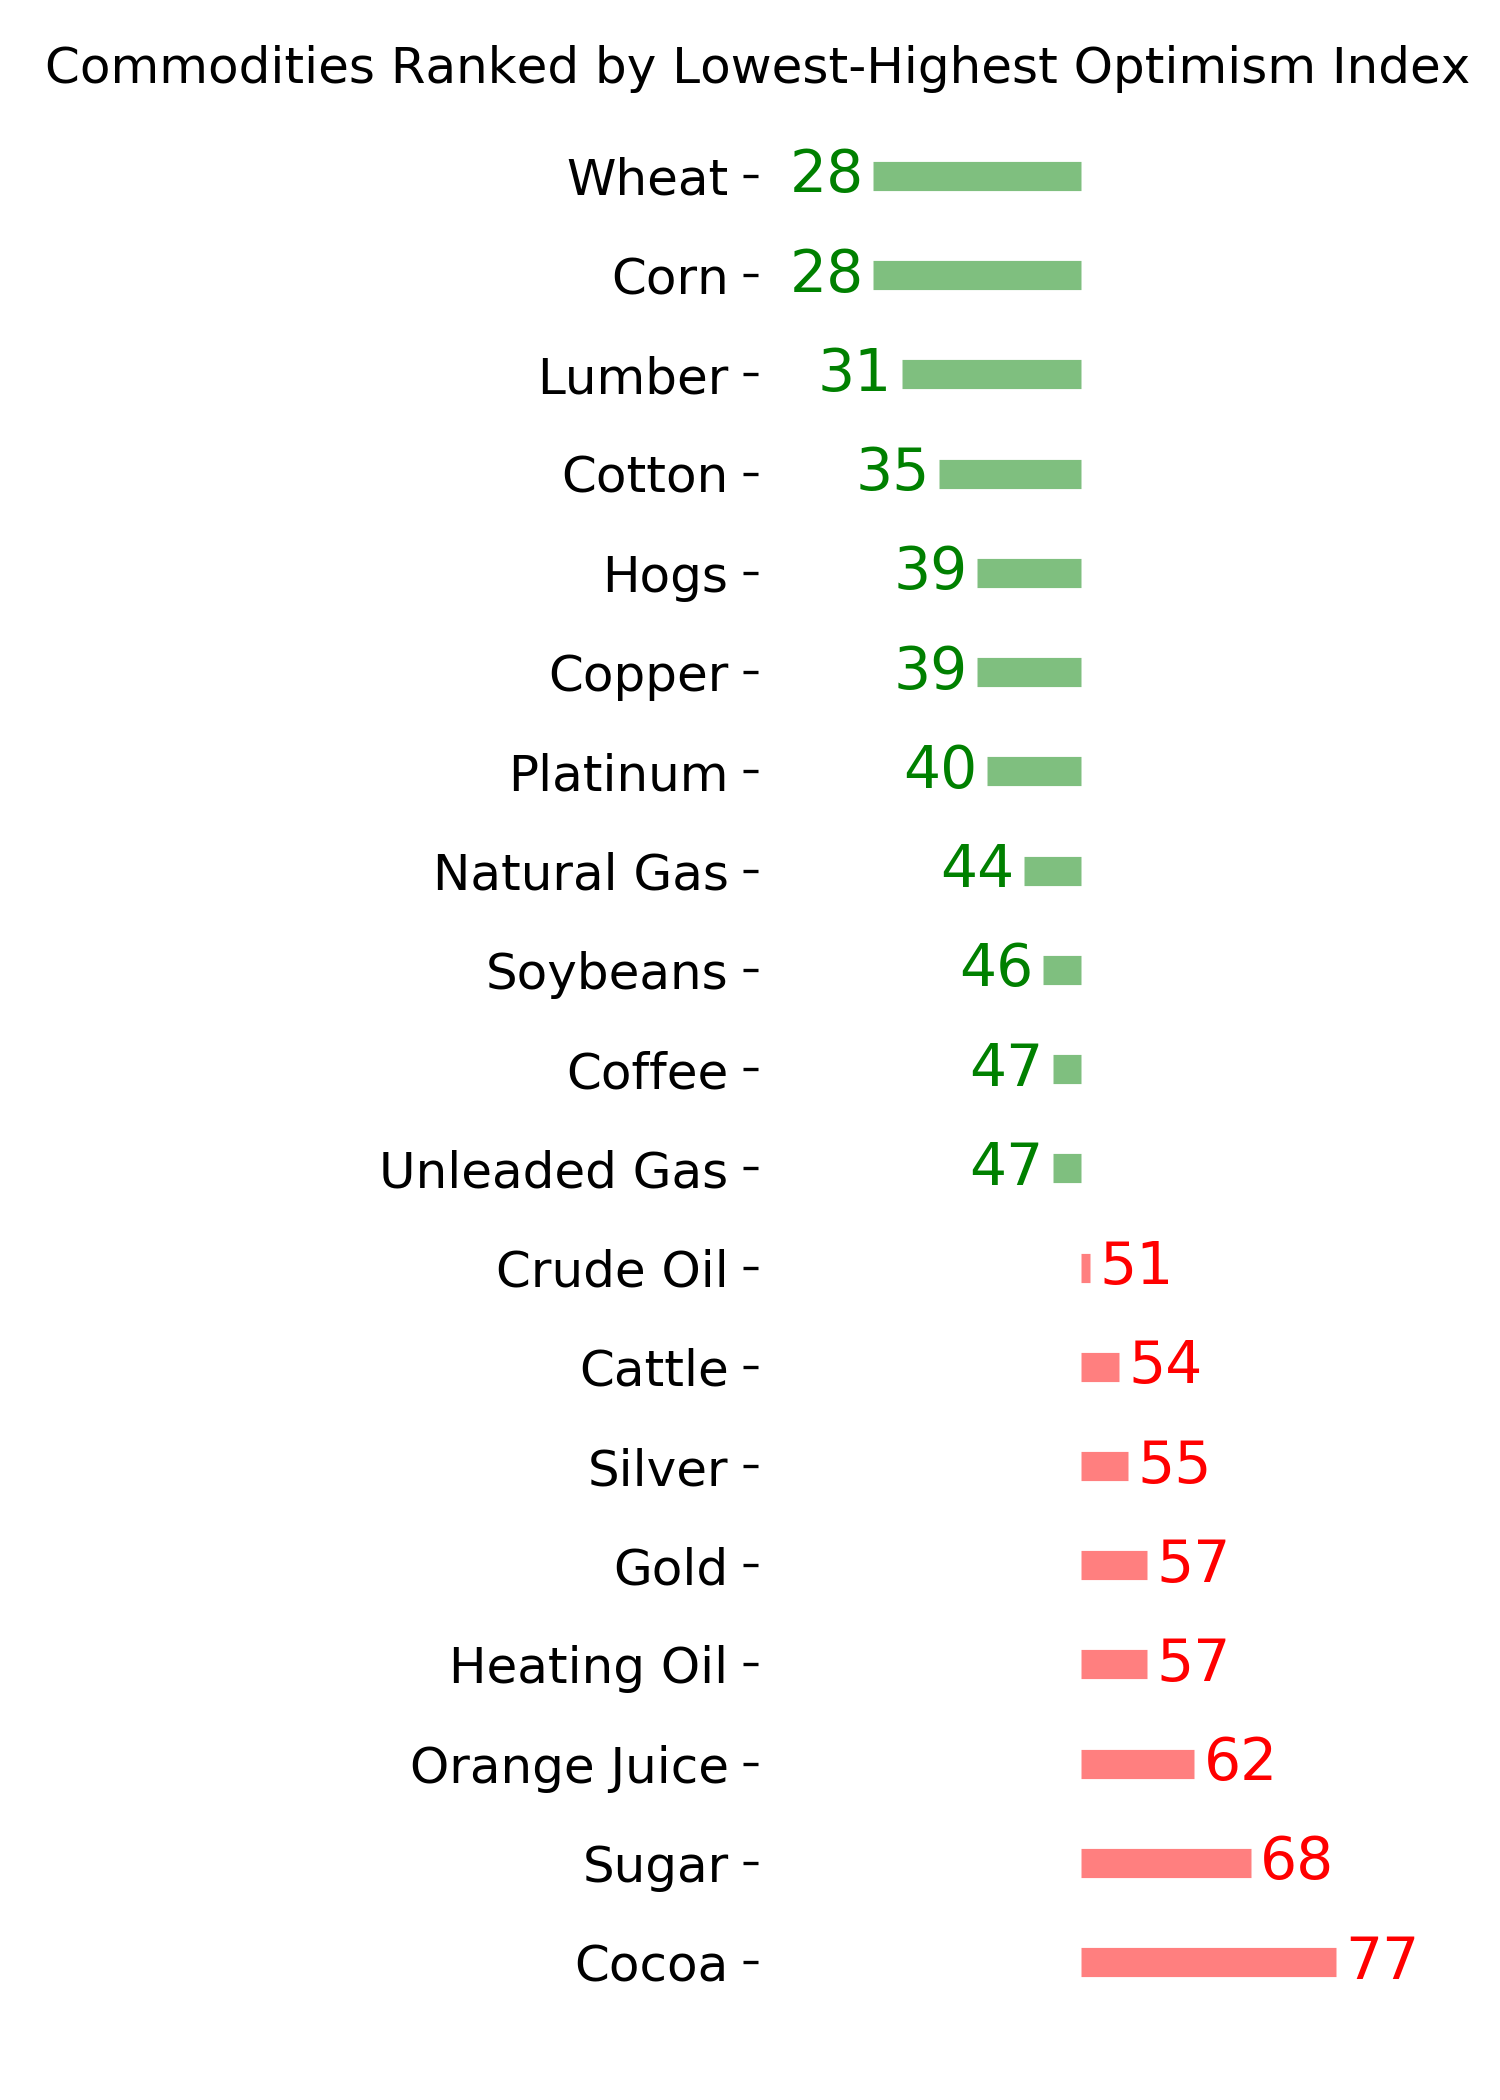
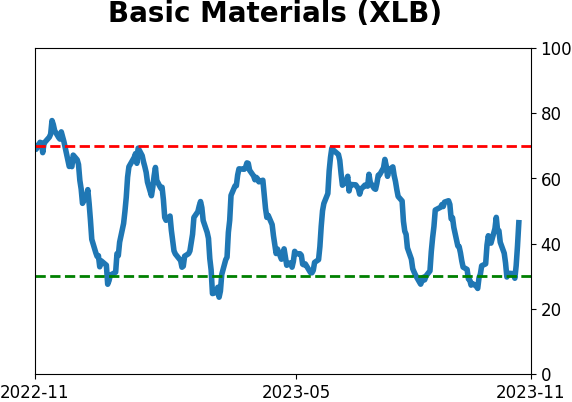
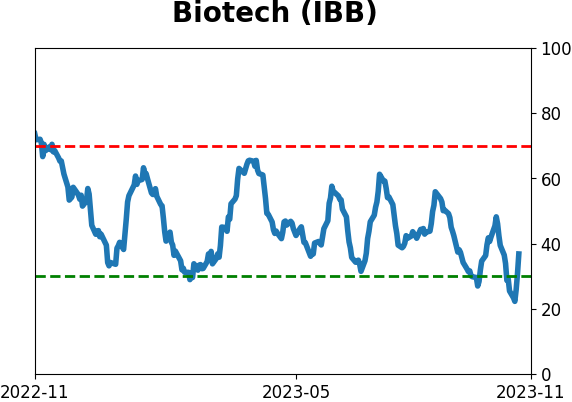
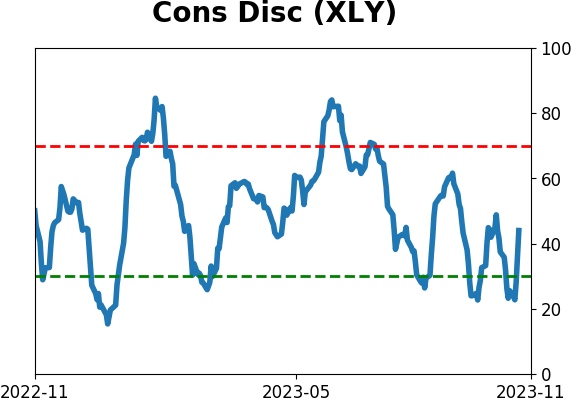
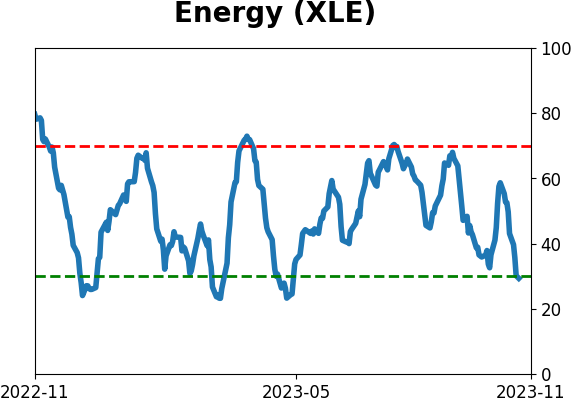
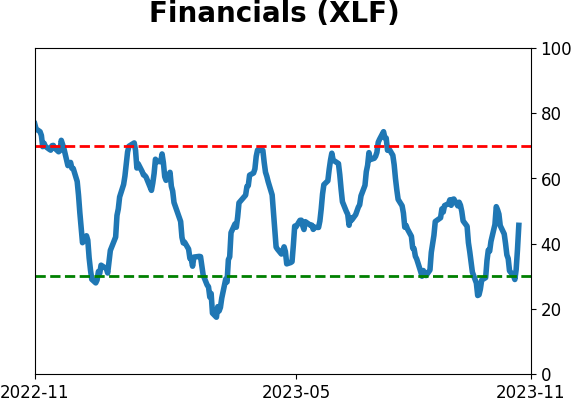
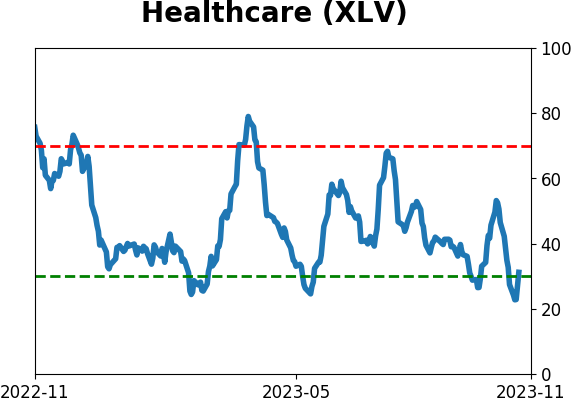
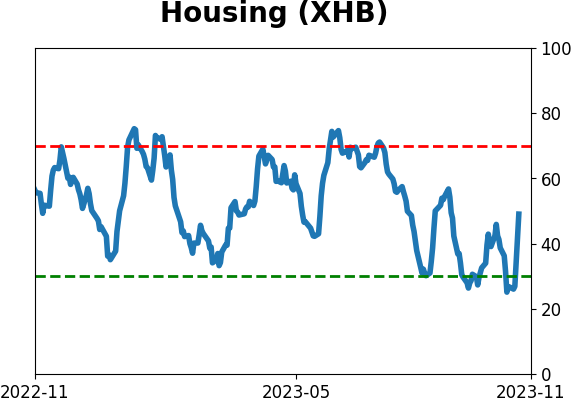
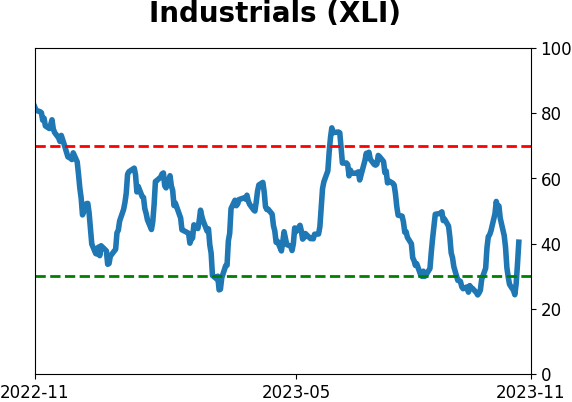
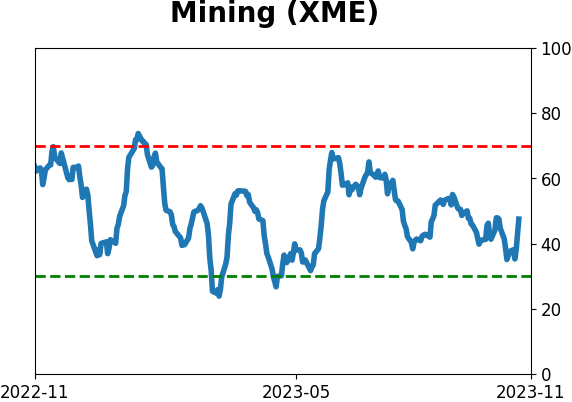
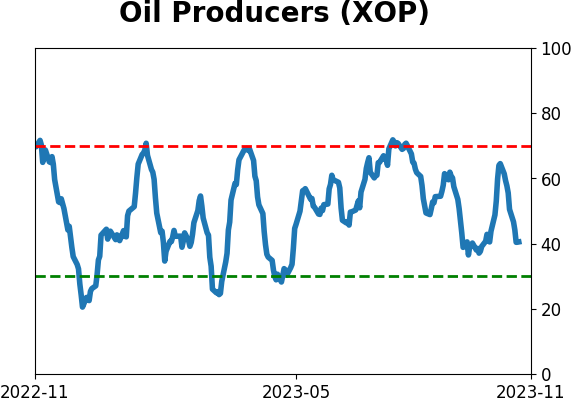
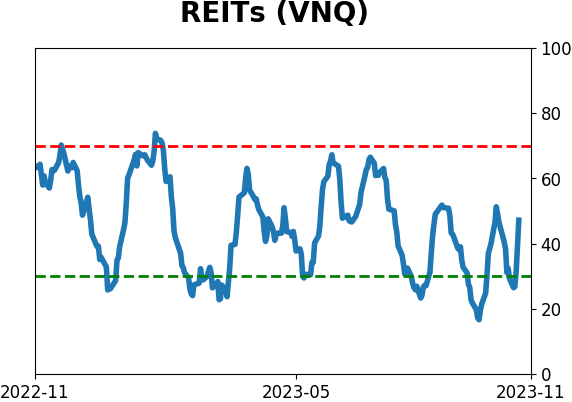
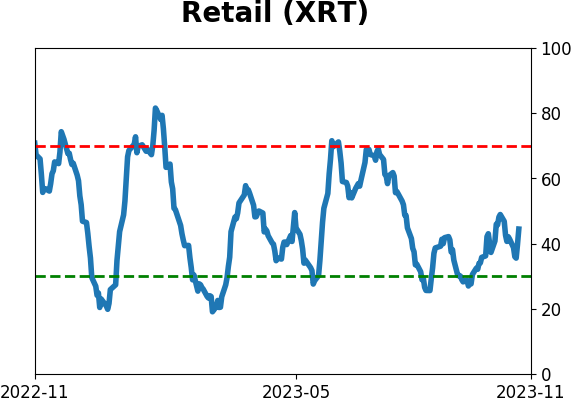
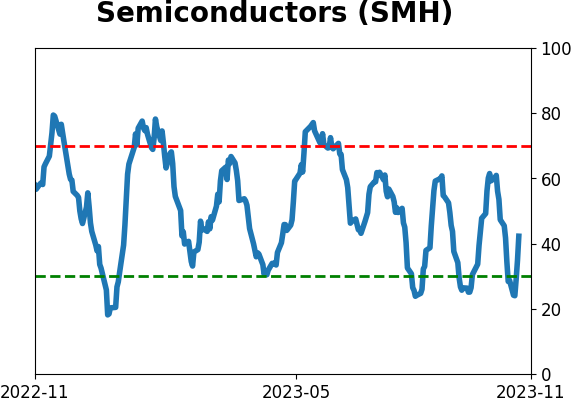
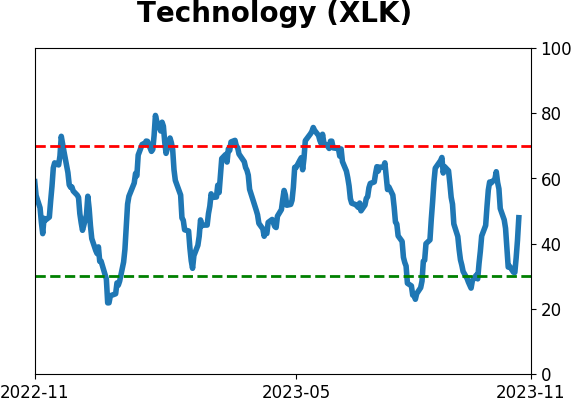
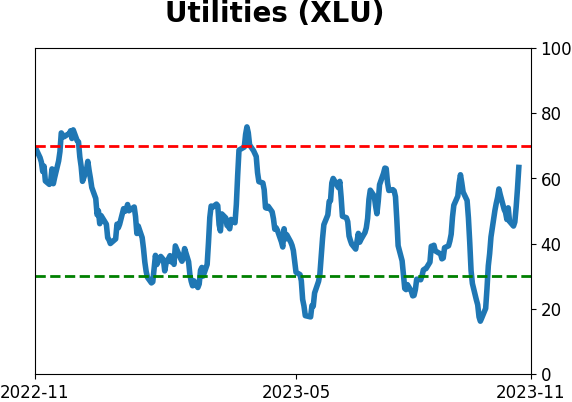
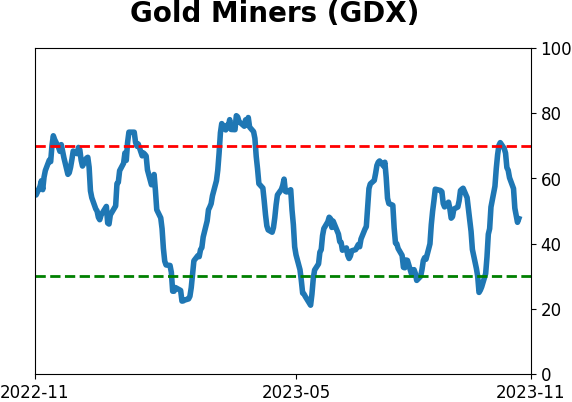
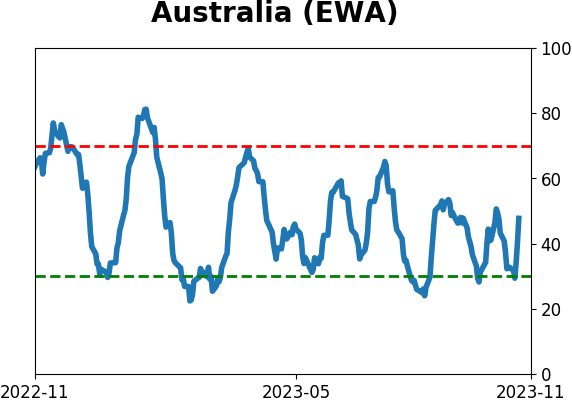
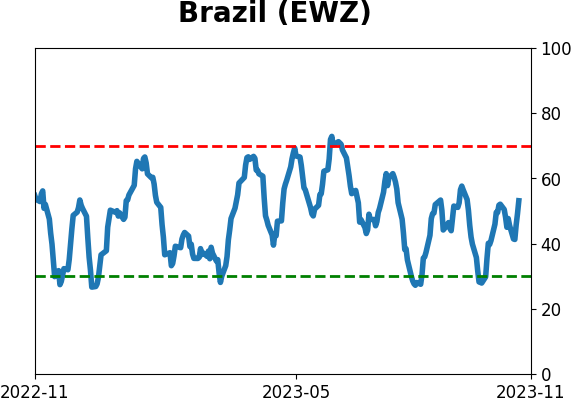
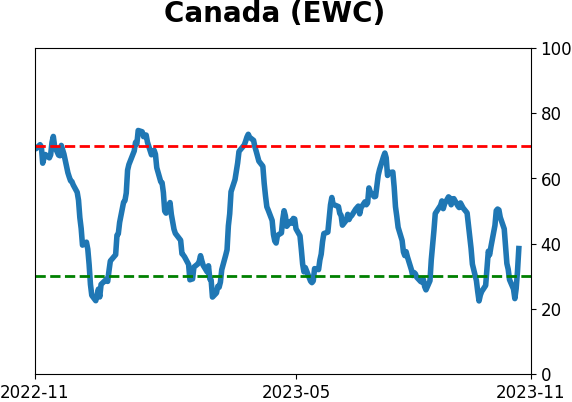
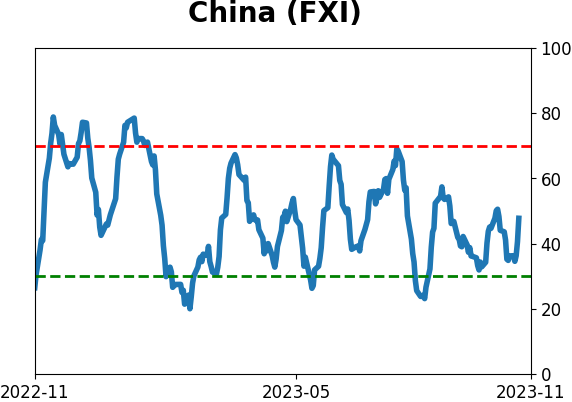
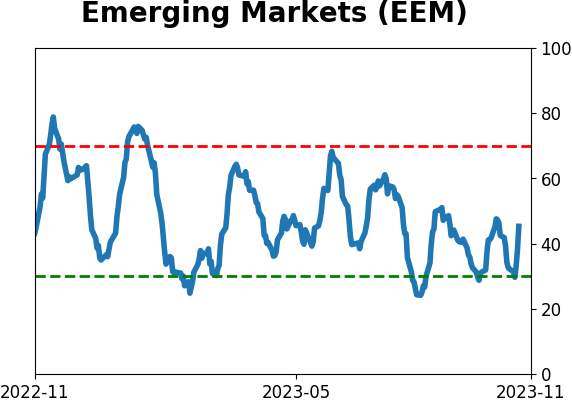
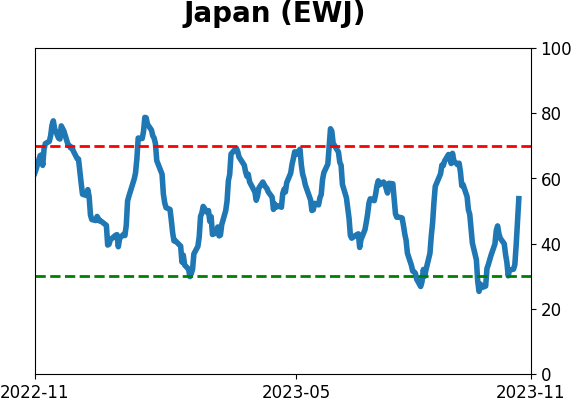
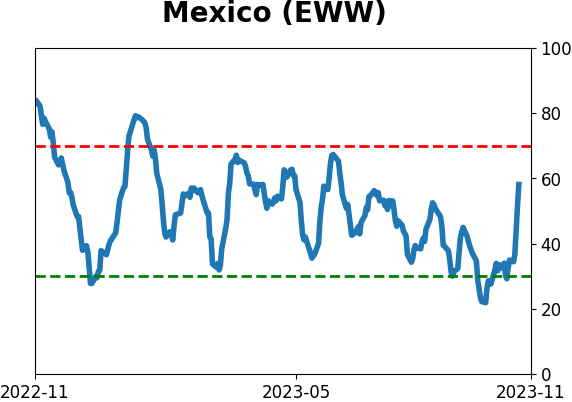
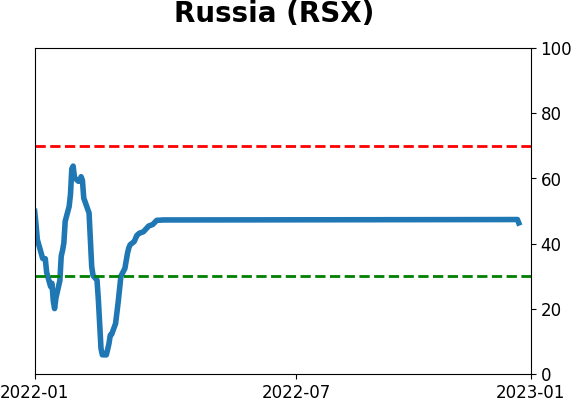
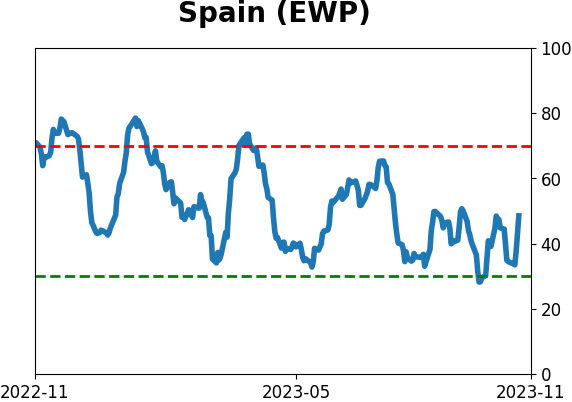
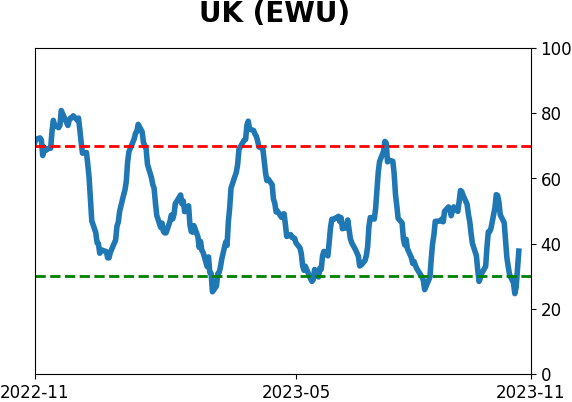
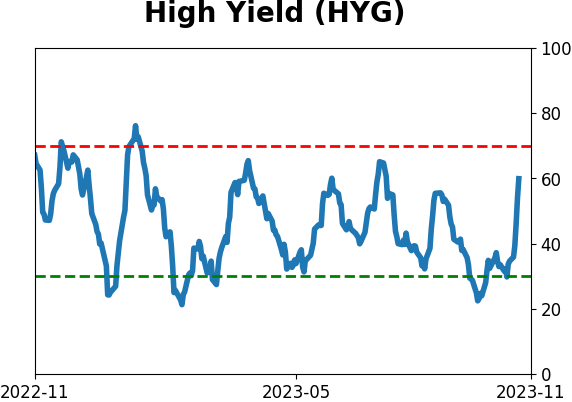
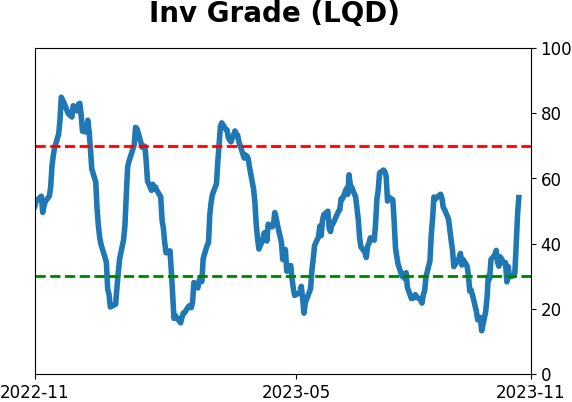
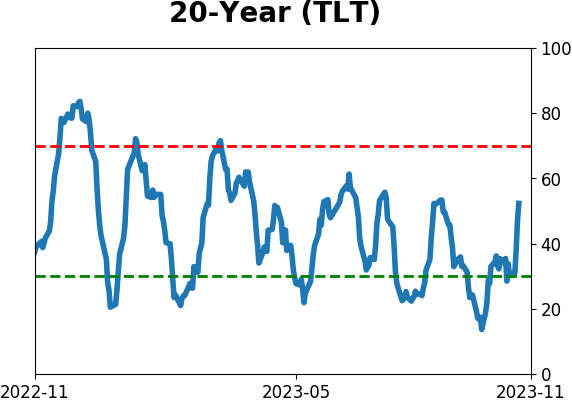
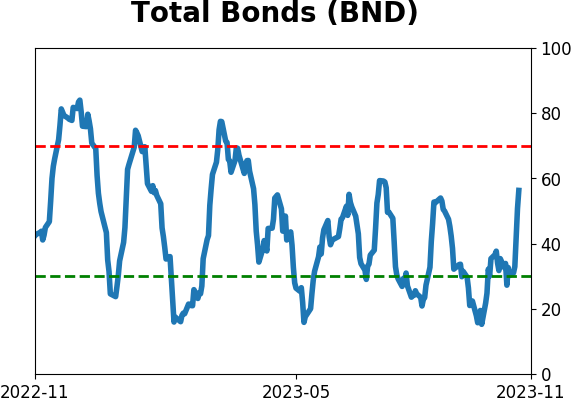
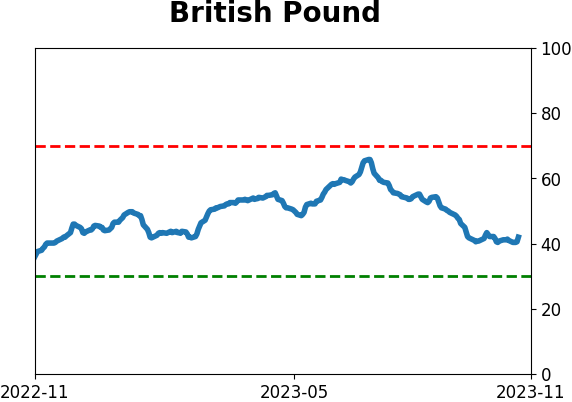
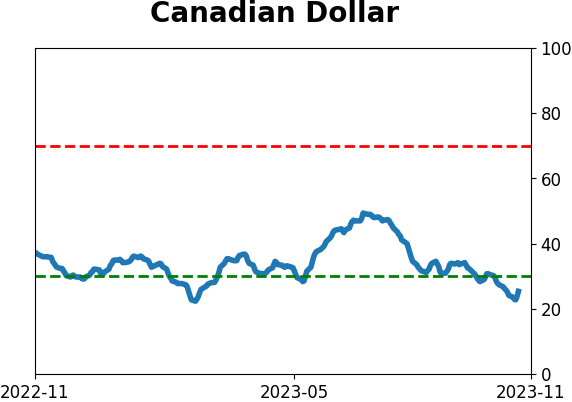
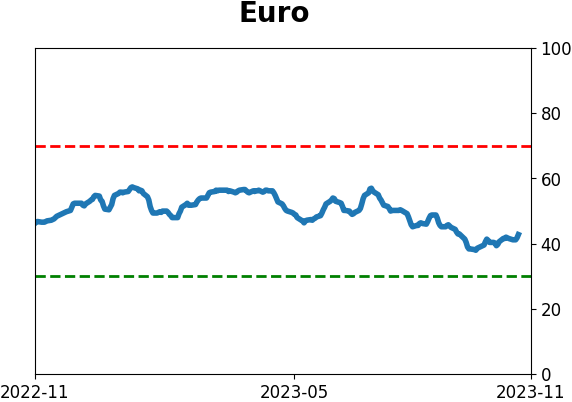
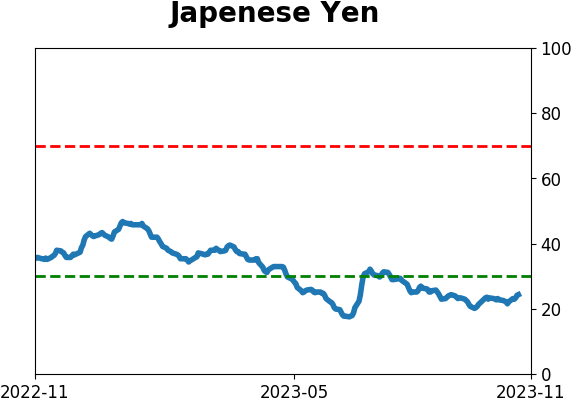
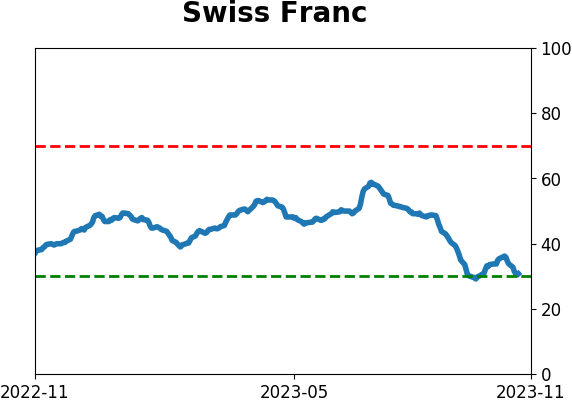
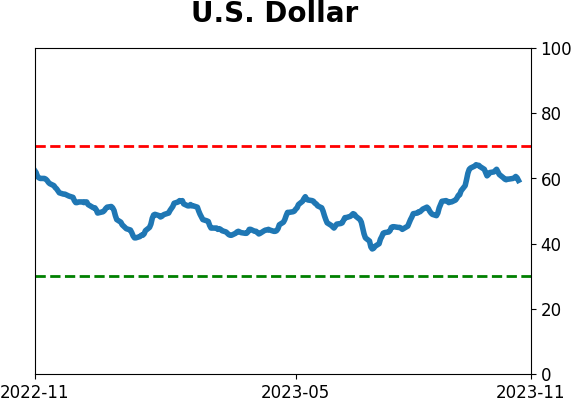
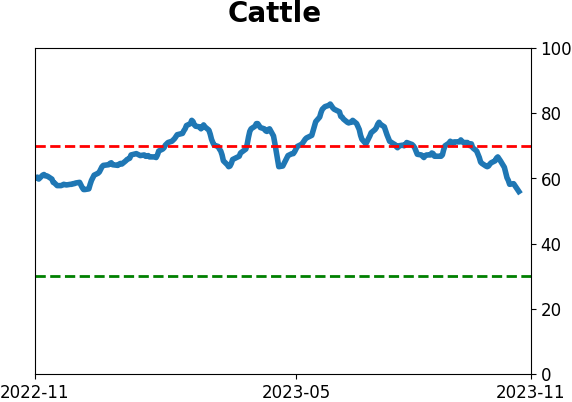
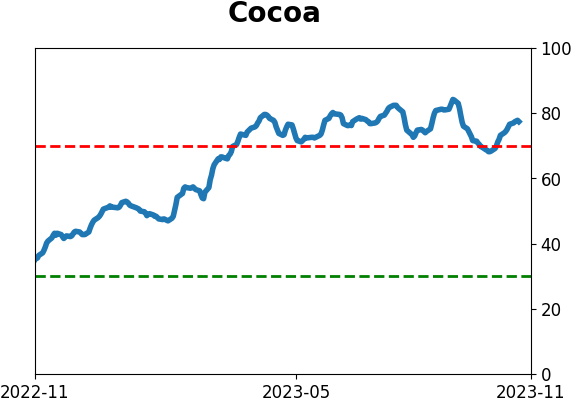
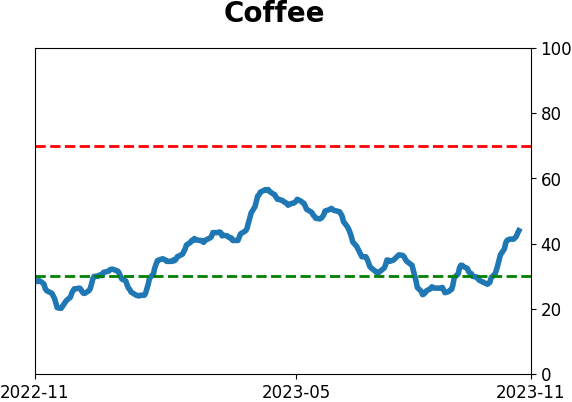
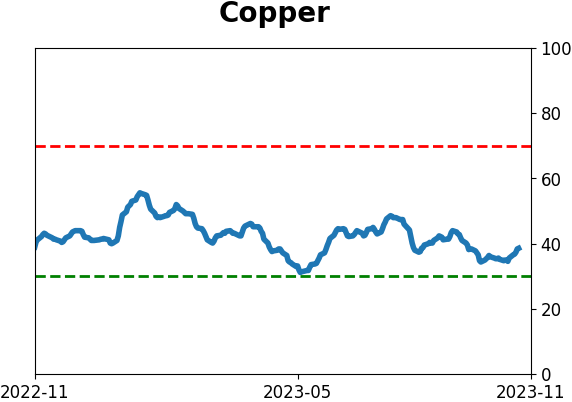
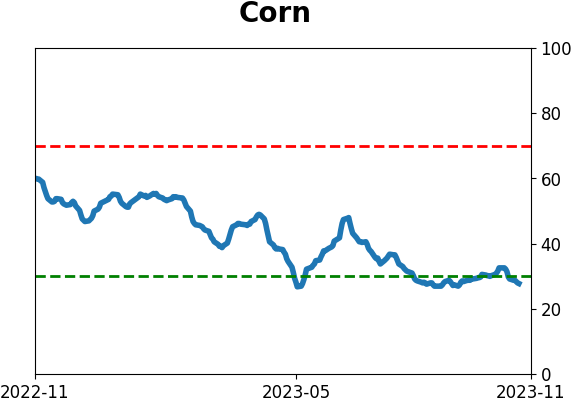
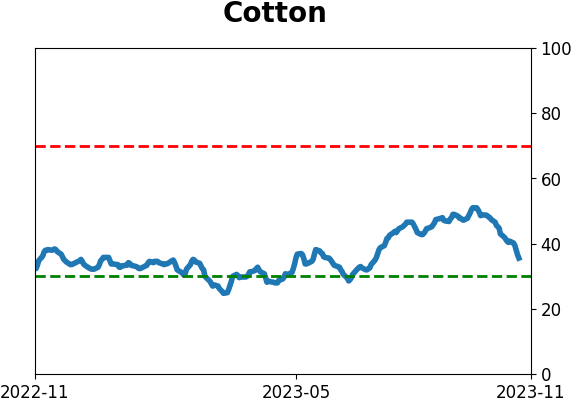
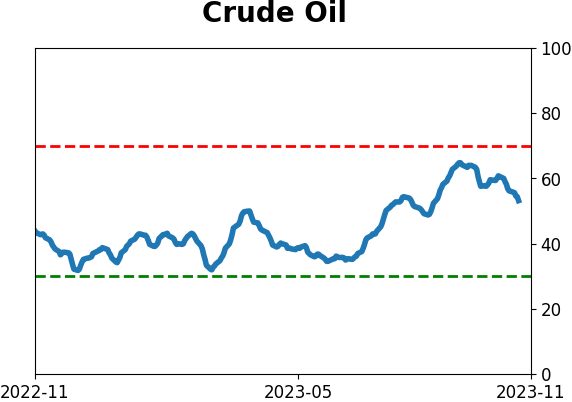
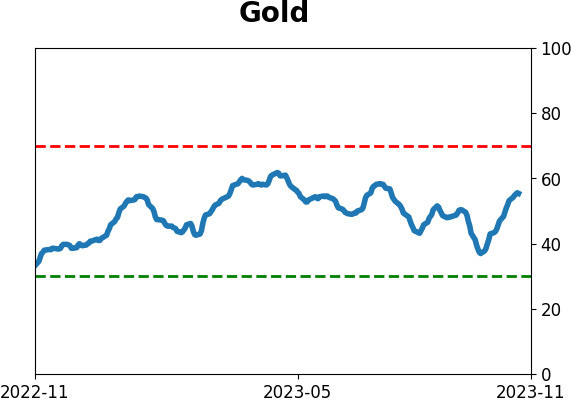
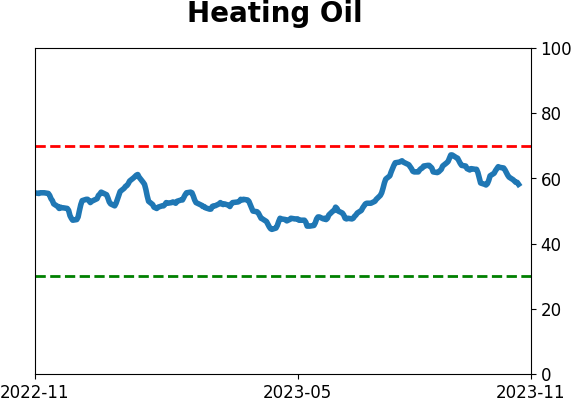
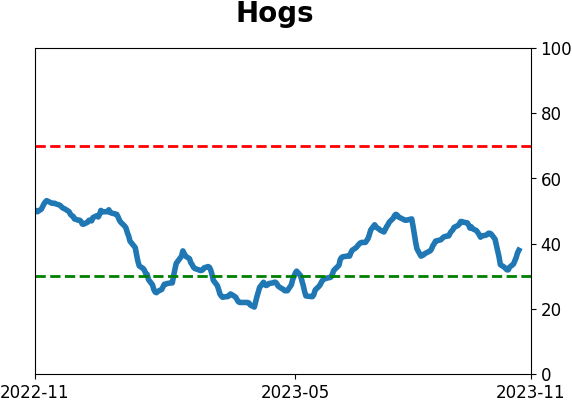
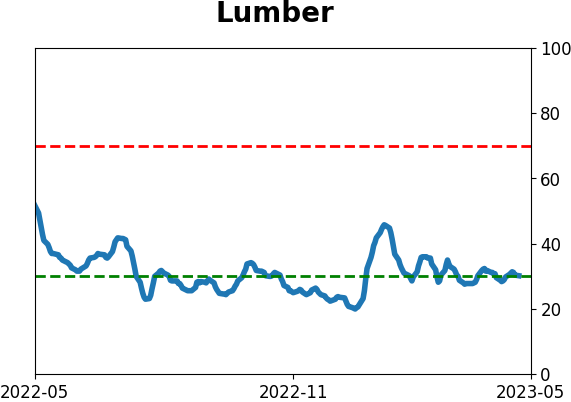
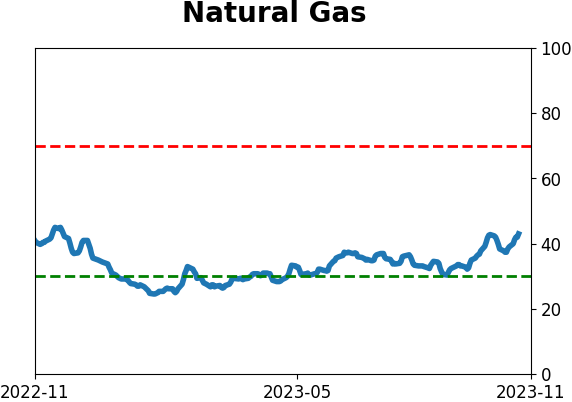
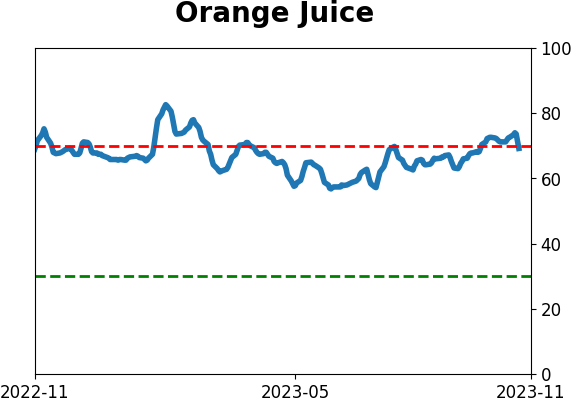
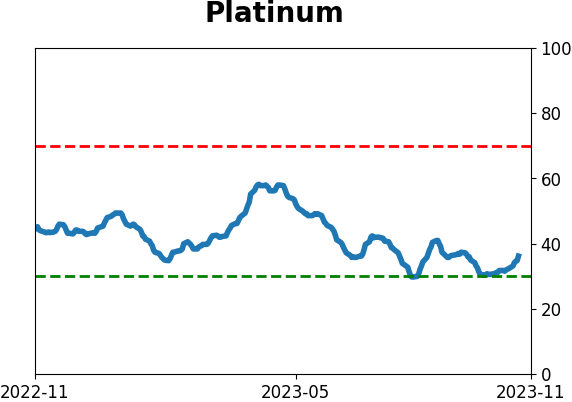
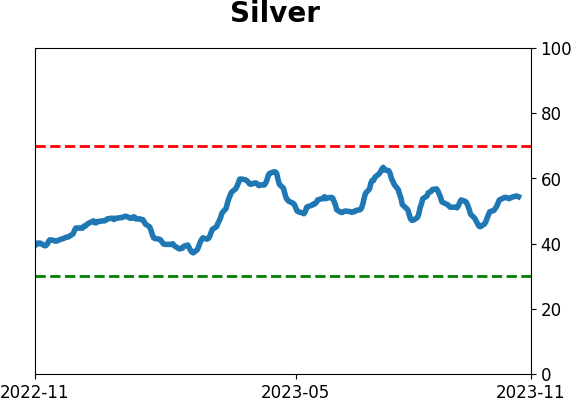
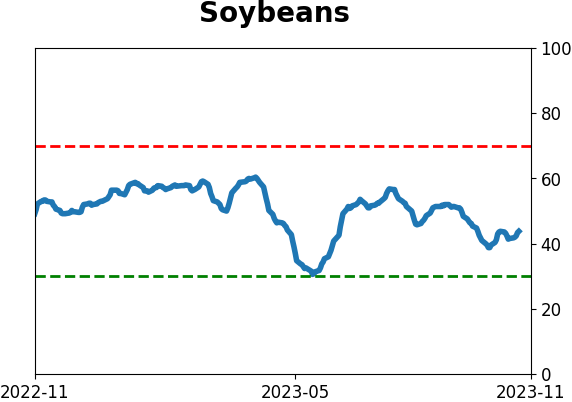
Optimism Index Thumbnails
|
|
|
|
|
|
|
|
|
|
|
|
|
|
|
|
|
|
|
|
|