Headlines
|
|
A tenuous sign the market environment might turn positive:
This week, more securities on the NYSE ticked at a 52-week high than fell to a 52-week low. This comes on the heels of what had been a been spike in stocks falling to new lows. It was even more pronounced on the big-tech Nasdaq 100 index. Similar behavior tended to precede long-term gains.
|
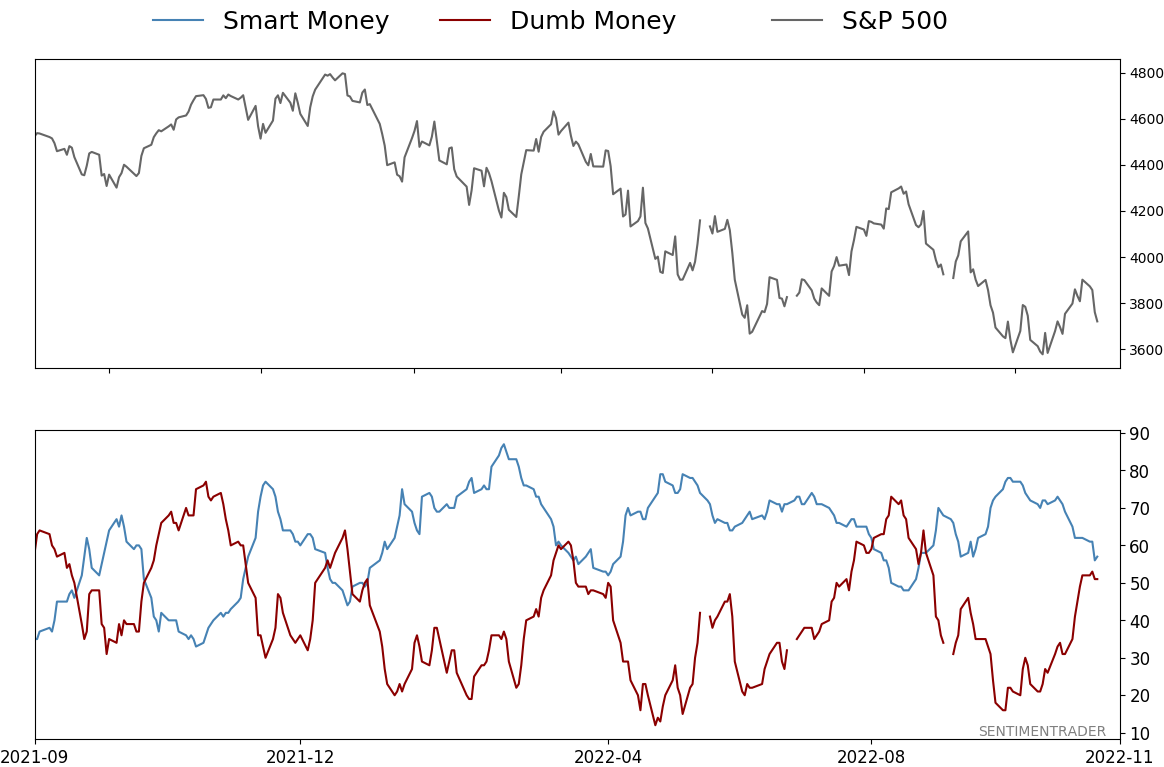
Smart / Dumb Money Confidence
|
Smart Money Confidence: 57%
Dumb Money Confidence: 51%
|
|
Risk Levels
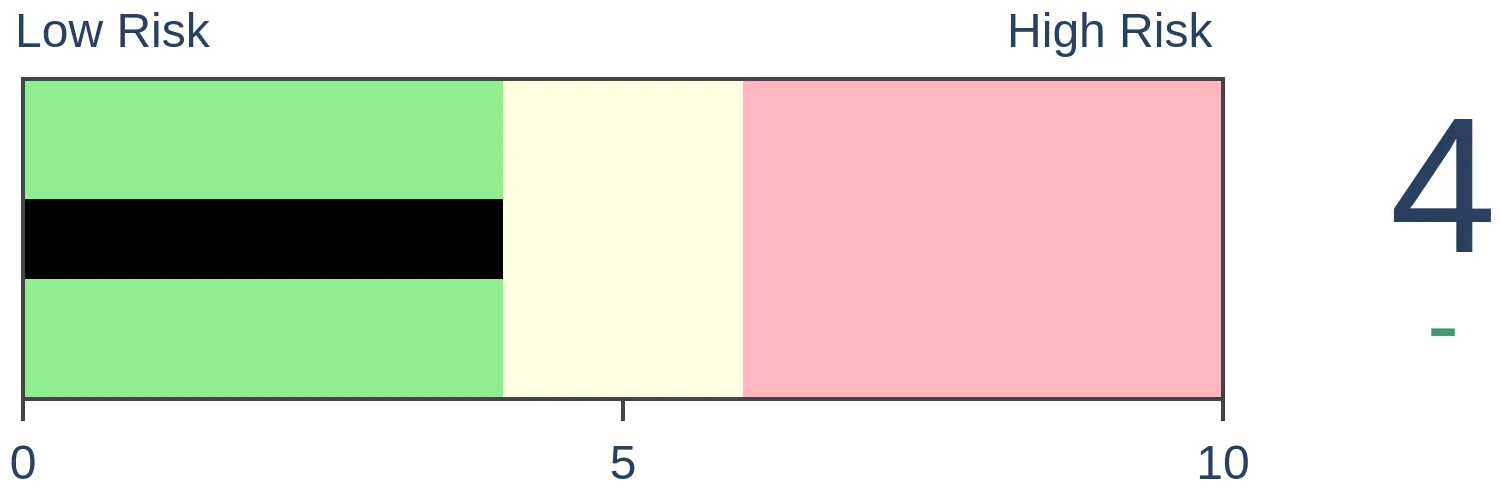
Stocks Short-Term
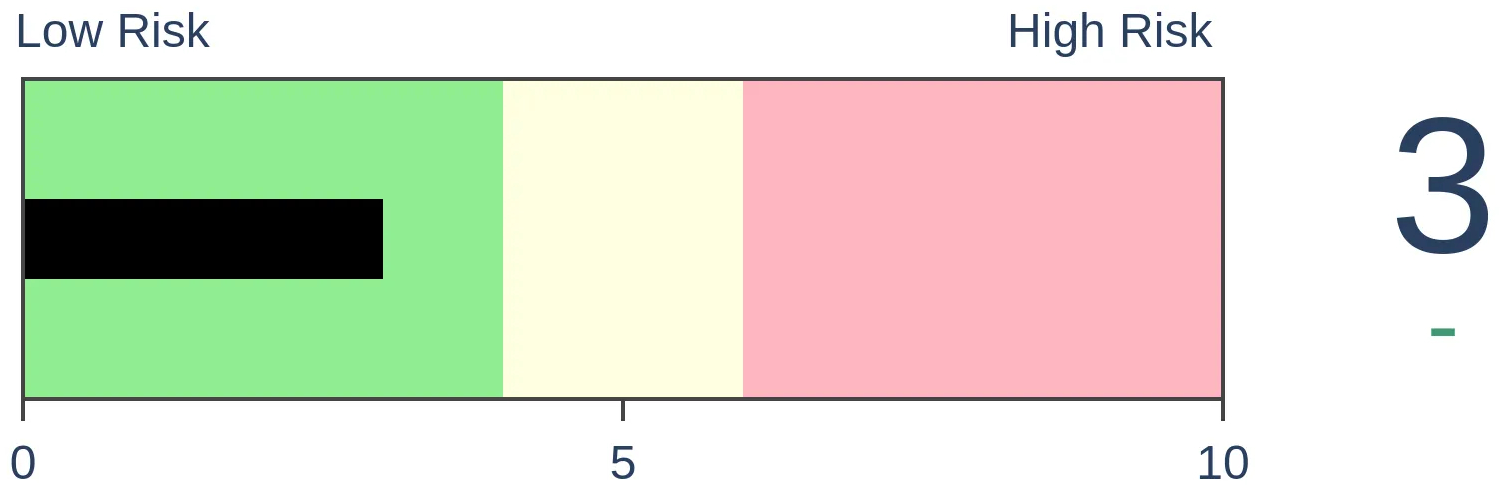
|
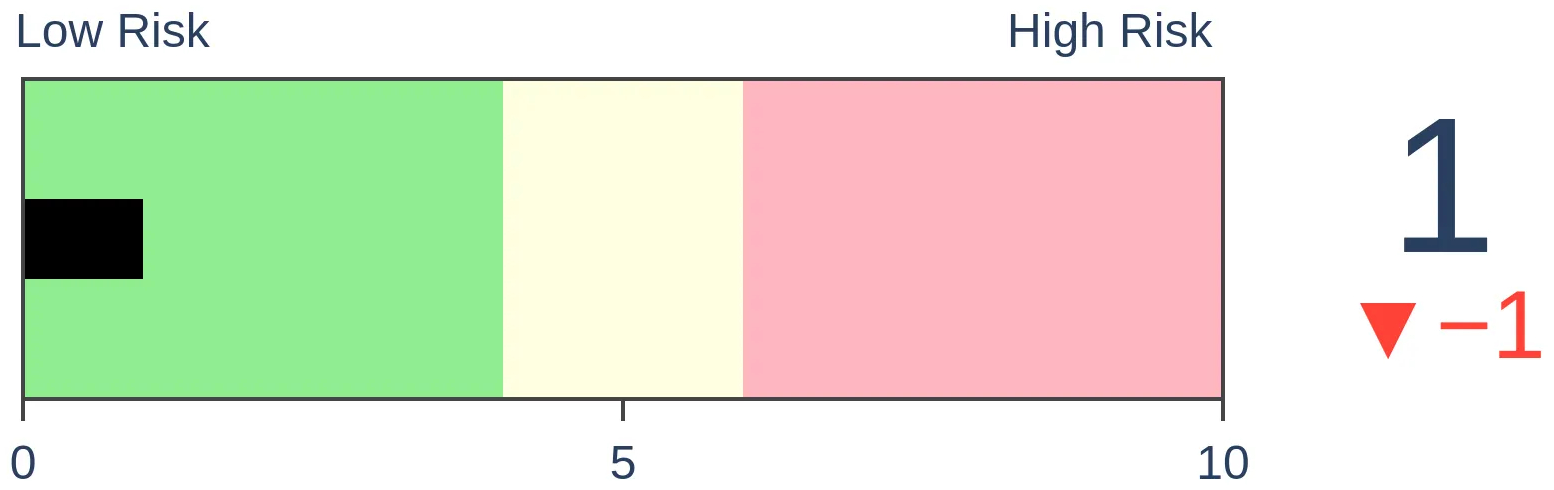
Stocks Medium-Term
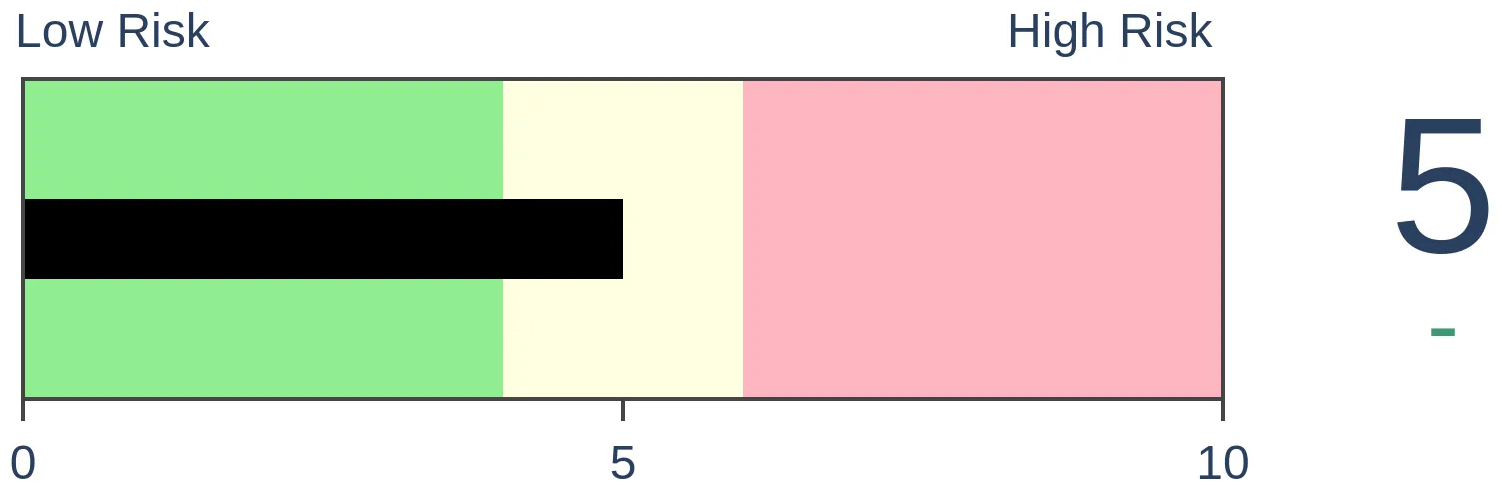
|
|
Bonds
|
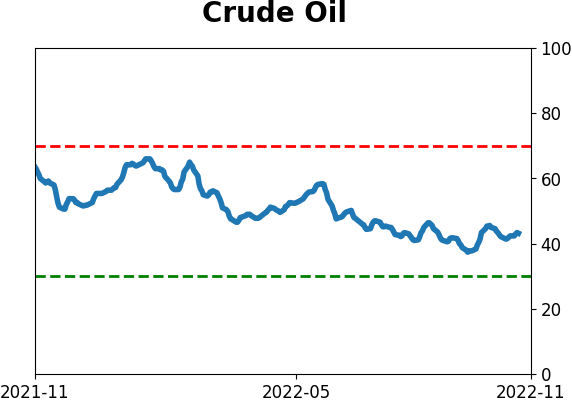
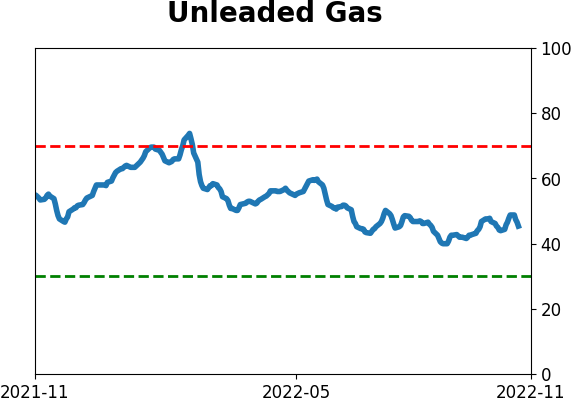
Crude Oil

|
|
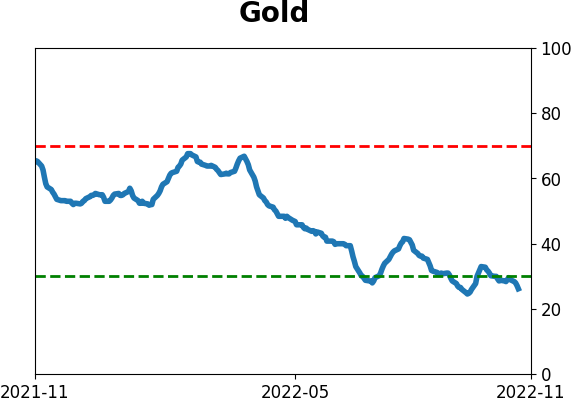
Gold
|
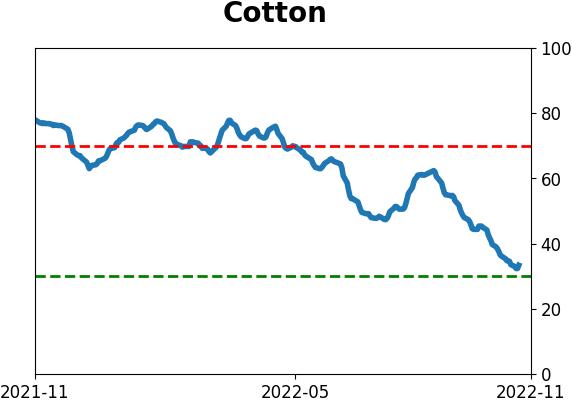
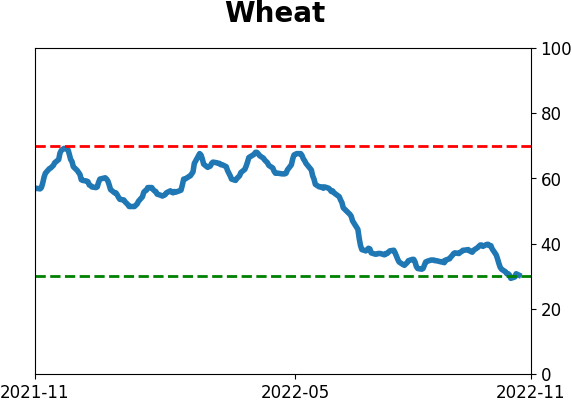
Agriculture

|
|
Research
By Jason Goepfert
BOTTOM LINE
This week, more securities on the NYSE ticked at a 52-week high than fell to a 52-week low. This comes on the heels of what had been a been spike in stocks falling to new lows. It was even more pronounced on the big-tech Nasdaq 100 index. Similar behavior tended to precede long-term gains.
FORECAST / TIMEFRAME
None
|
Key points:
- For the first time in a while, there were more 52-week highs than lows on the NYSE
- This was triggered after there was a massive jump in stocks falling to new lows
- Similar behavior preceded long-term gains; it was even more pronounced in the tech-dominated Nasdaq 100
For the first time in months, more highs than lows
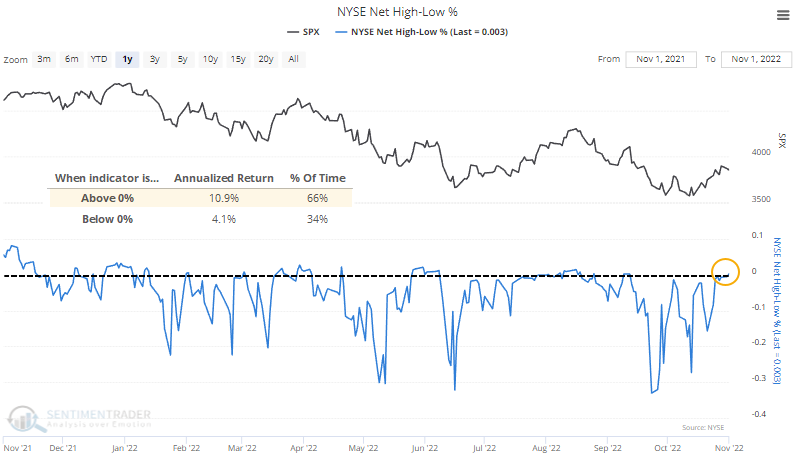
In September, there were 33% more securities on the NYSE trading at 52-week lows than 52-week highs. That was one of the lowest Net NYSE High-Low figures in nearly 60 years. The Backtest Engine shows that the S&P 500's median one-year return following similar extremes was almost 25%.
This week, the indicator turned positive, with more securities trading at a new high than new low. This is a welcome change in the market environment, as the S&P's annualized returns when this is above zero are more than twice as great as when it's below zero. For most of this year, it has struggled to hold above the zero line, and that's the case again, as Wednesday's reversal pushed the figure back into negative territory. We'll have to see how the coming days shake out.
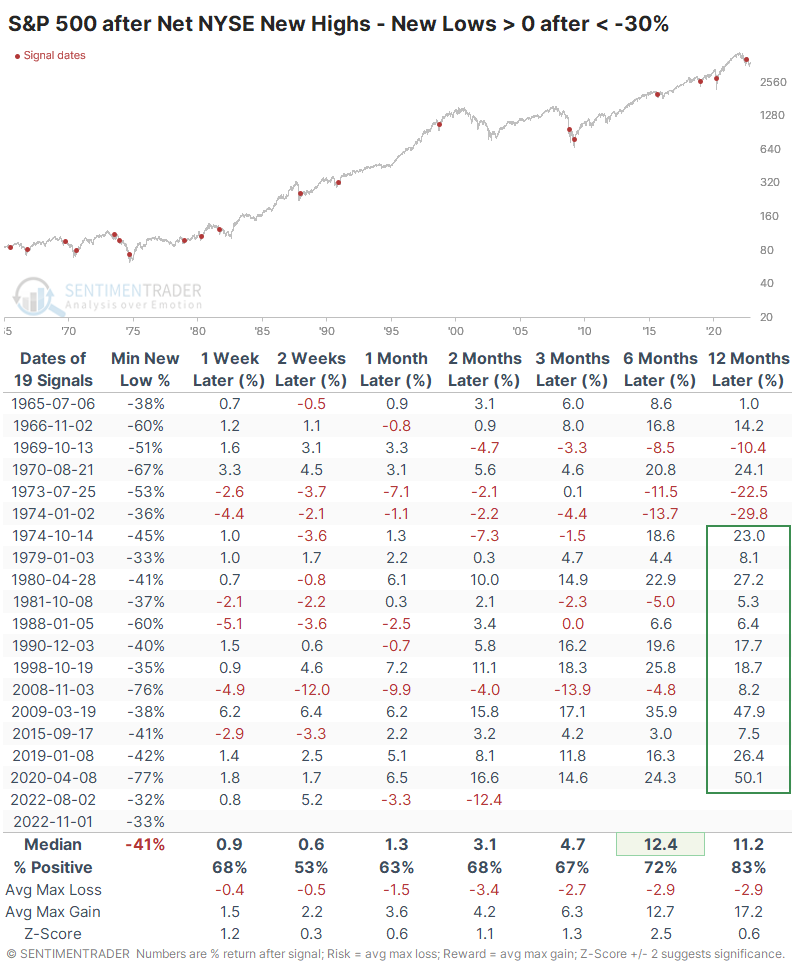
After a protracted time below zero and many net new lows, a pop above the zero line has tended to lead to positive long-term returns. The 1970s were a problem, with several false signals. Since late that decade, though, every signal has shown a positive one-year return. This also triggered in August, and the S&P is sporting its most negative two-month return ever. Maybe that's enough of a warning to discount this week's signal.
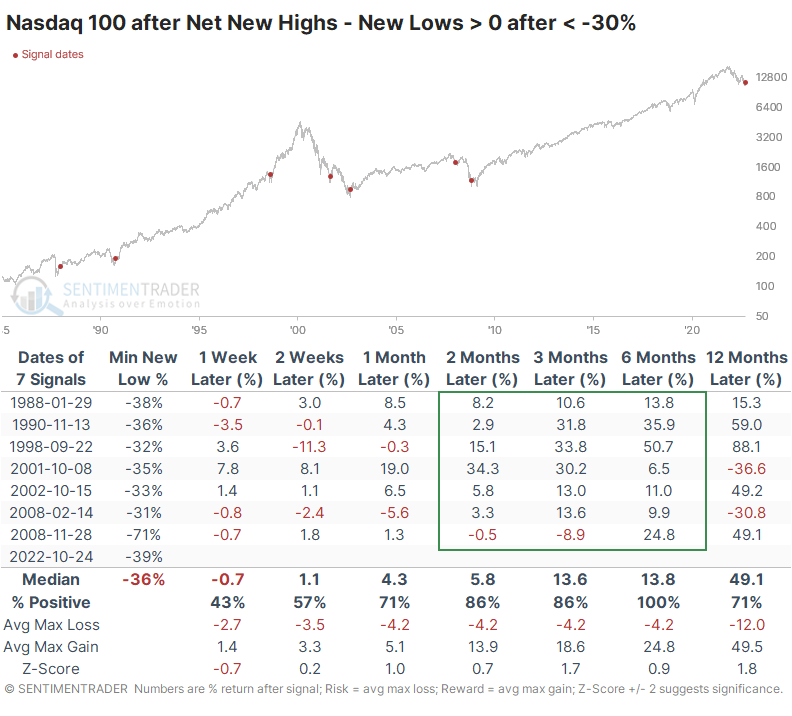
It's a similar situation among big tech stocks. While some of the most talked-about stocks have been hammered, there has been a quiet recovery among others. The net percentage of stocks at new highs minus new lows has turned positive after one of the most negative readings since the index's 1985 inception.
After similar behavior, the Nasdaq 100 showed a positive return over the next six months every time, though with the usual caveats about small sample sizes. The index enjoyed an average gain of nearly 25% at its best point within the next six months, versus an average decline of only about -4% during its worst point.
What the research tells us...
With Wednesday's post-FOMC pullback, there were once again more 52-week lows than highs on the NYSE. This has been a recurring pattern in 2022 and isn't what bulls want to see. That said, some short-term reversal of the gains isn't unusual, and this is best used as a medium- to long-term sign of recovery from extreme selling pressure.
Indicators at Extremes
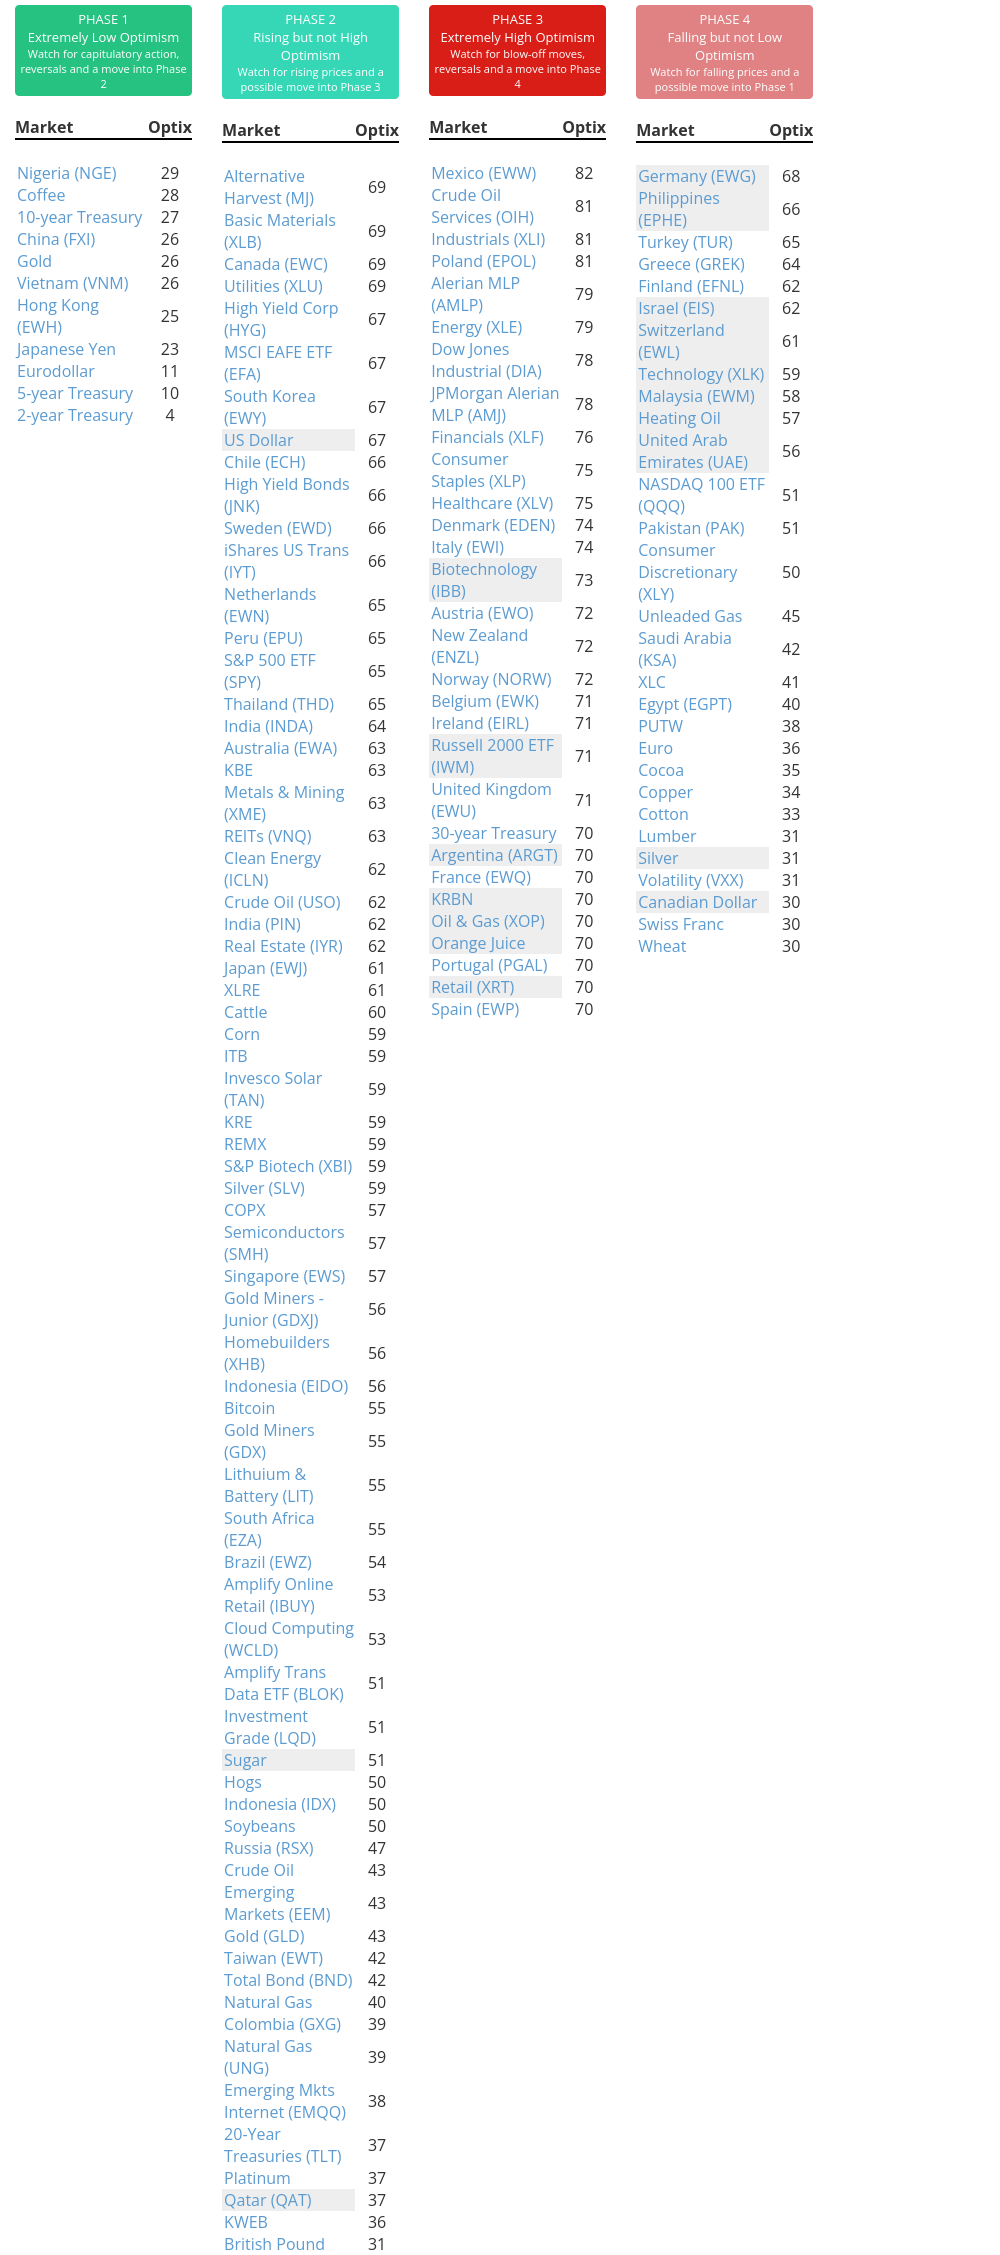
Phase Table
Ranks
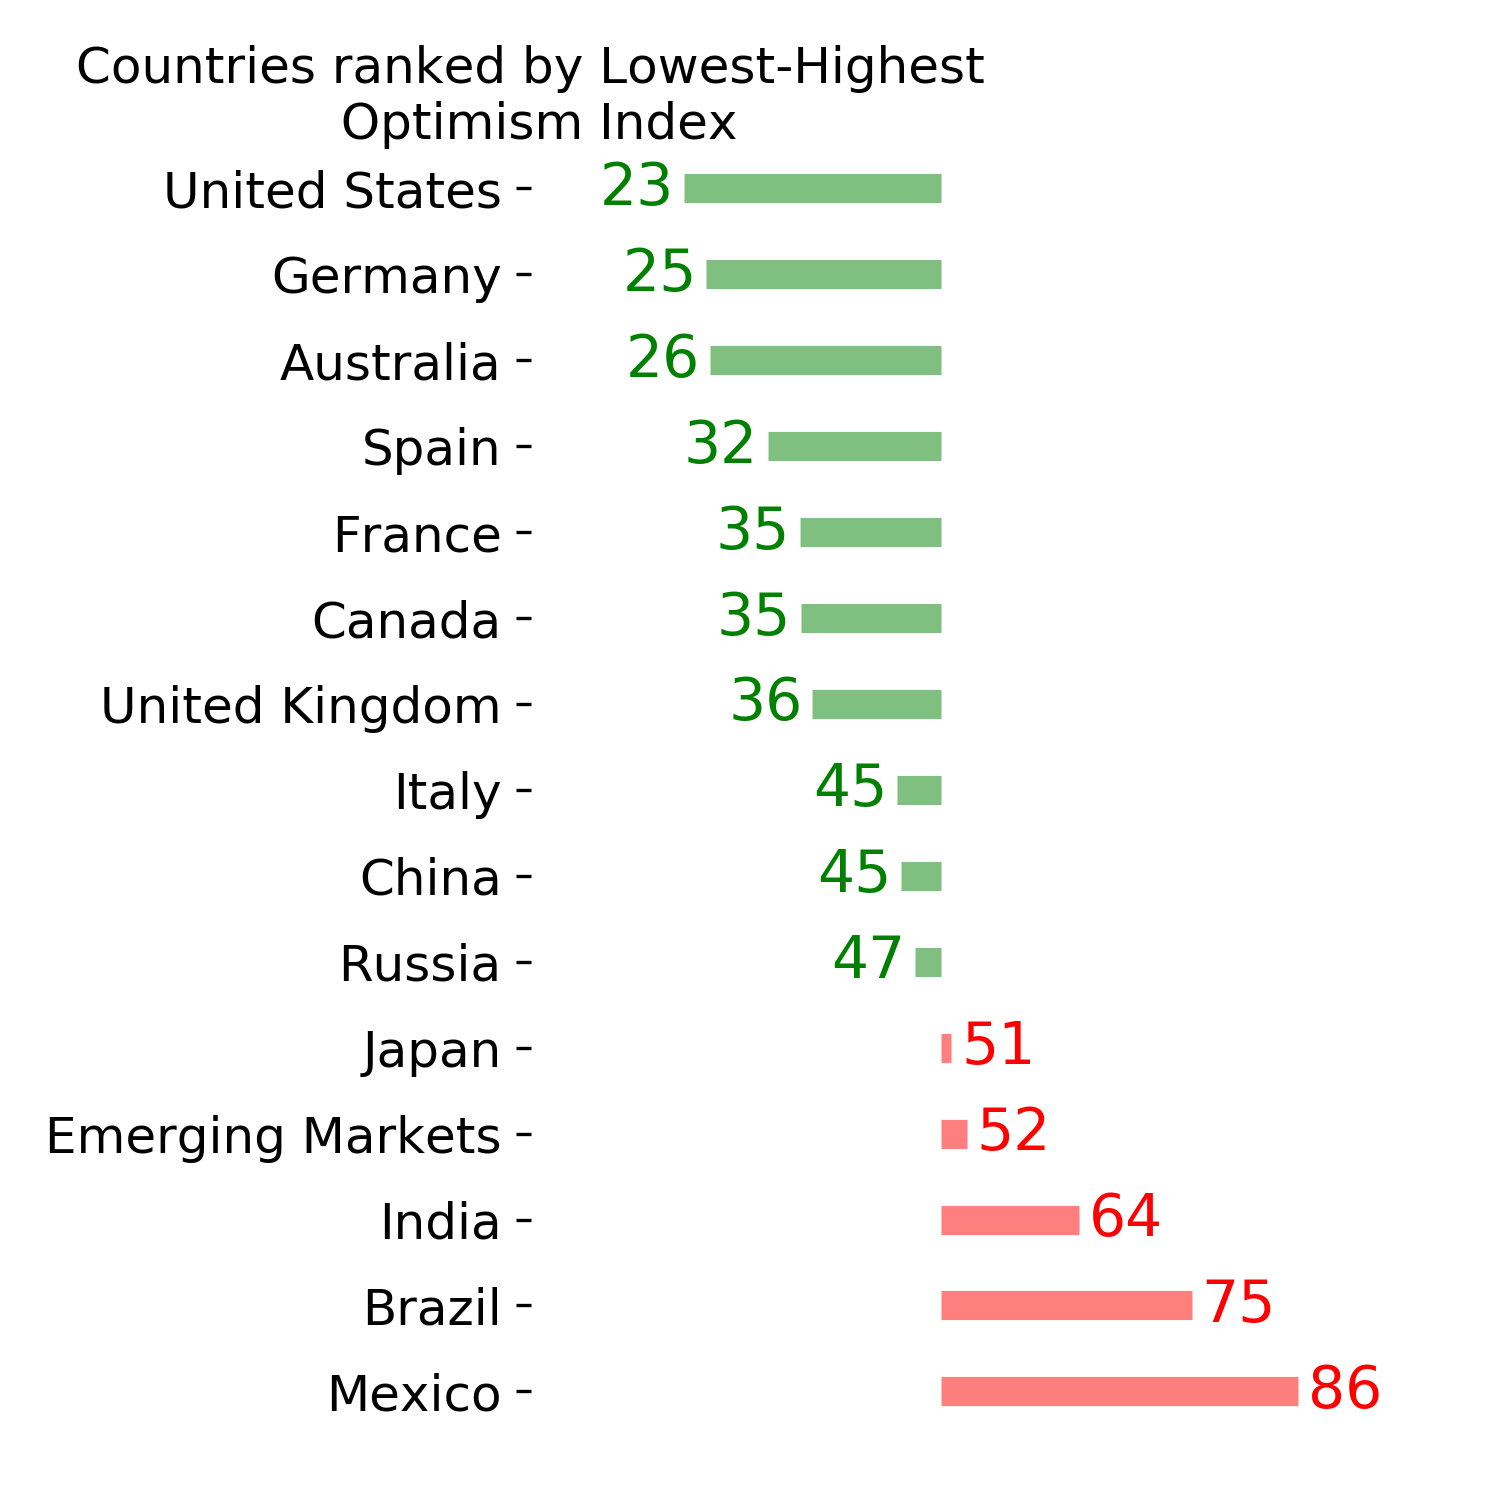
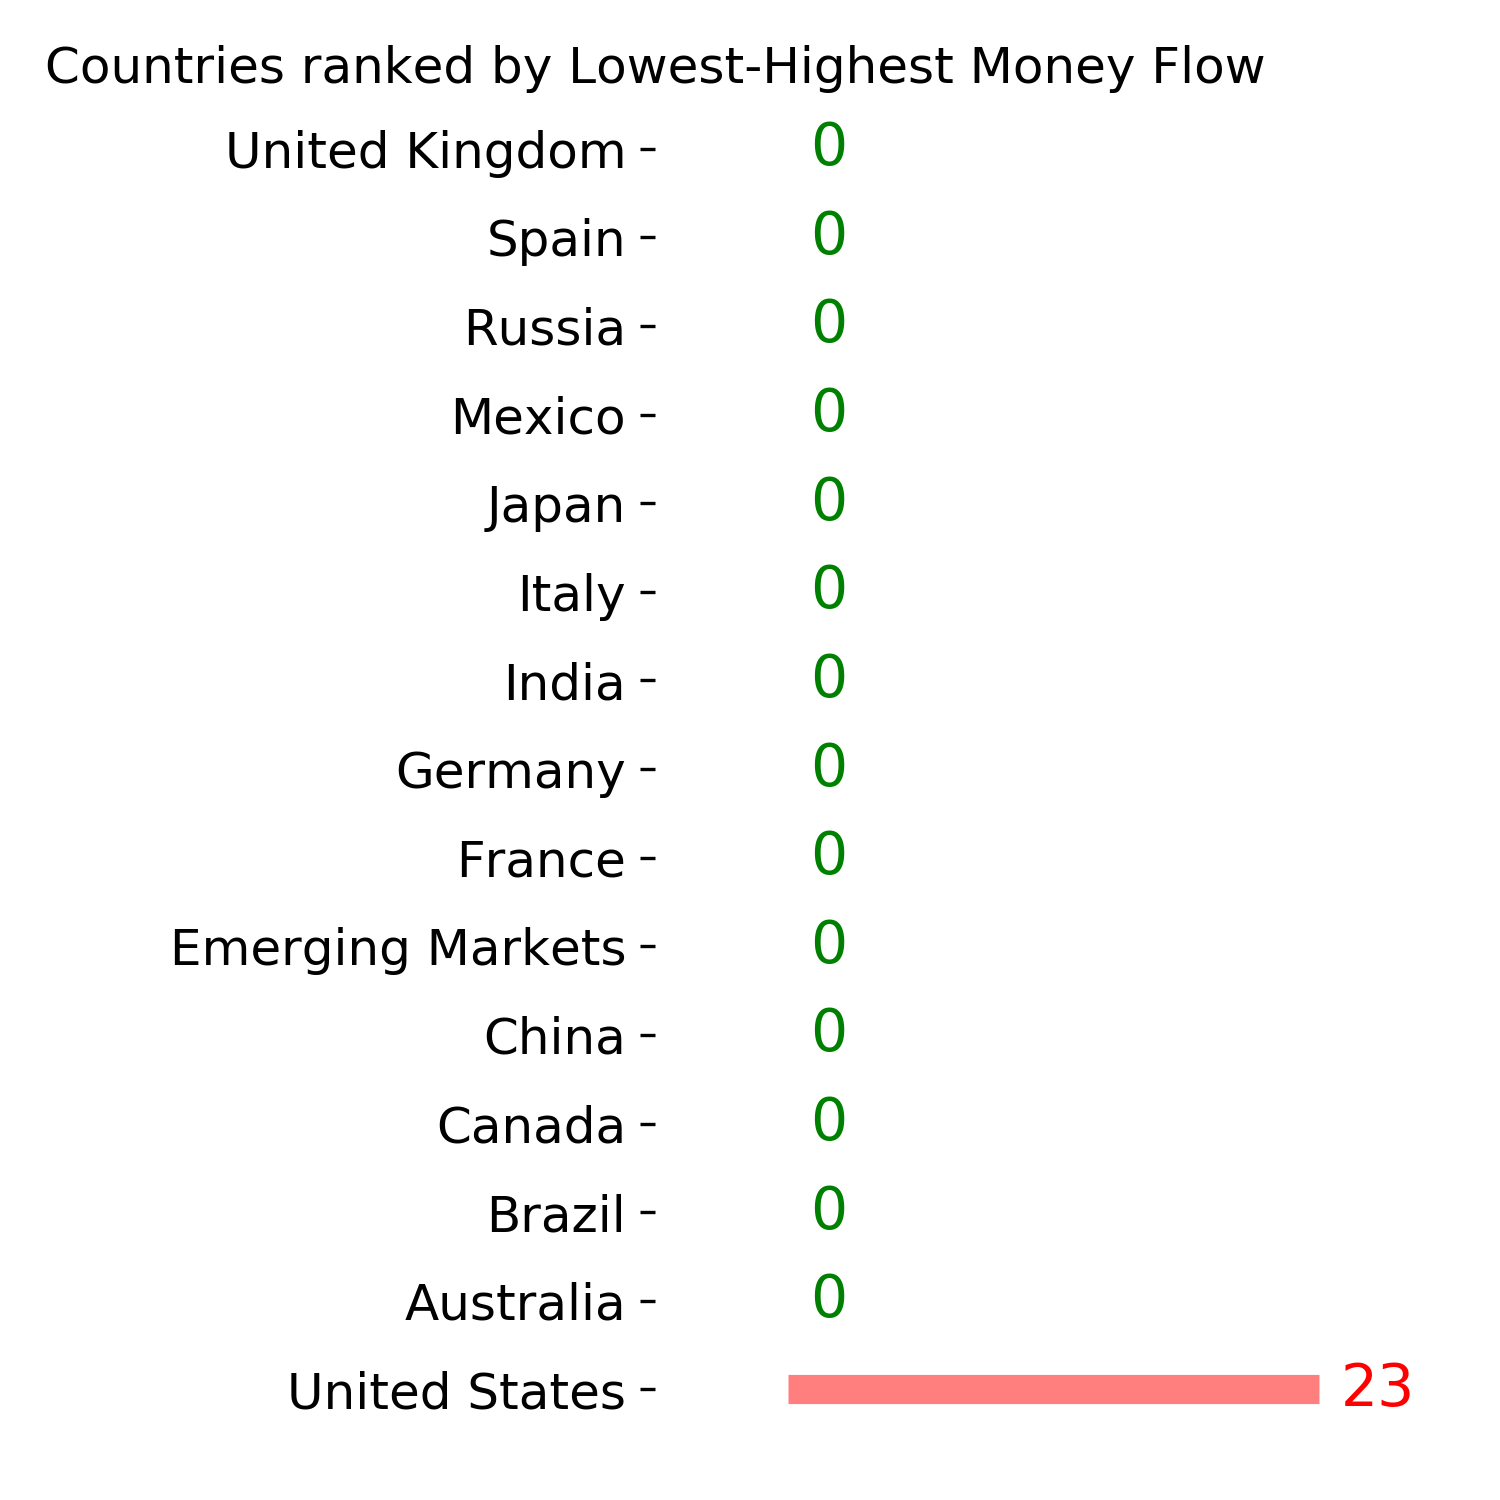
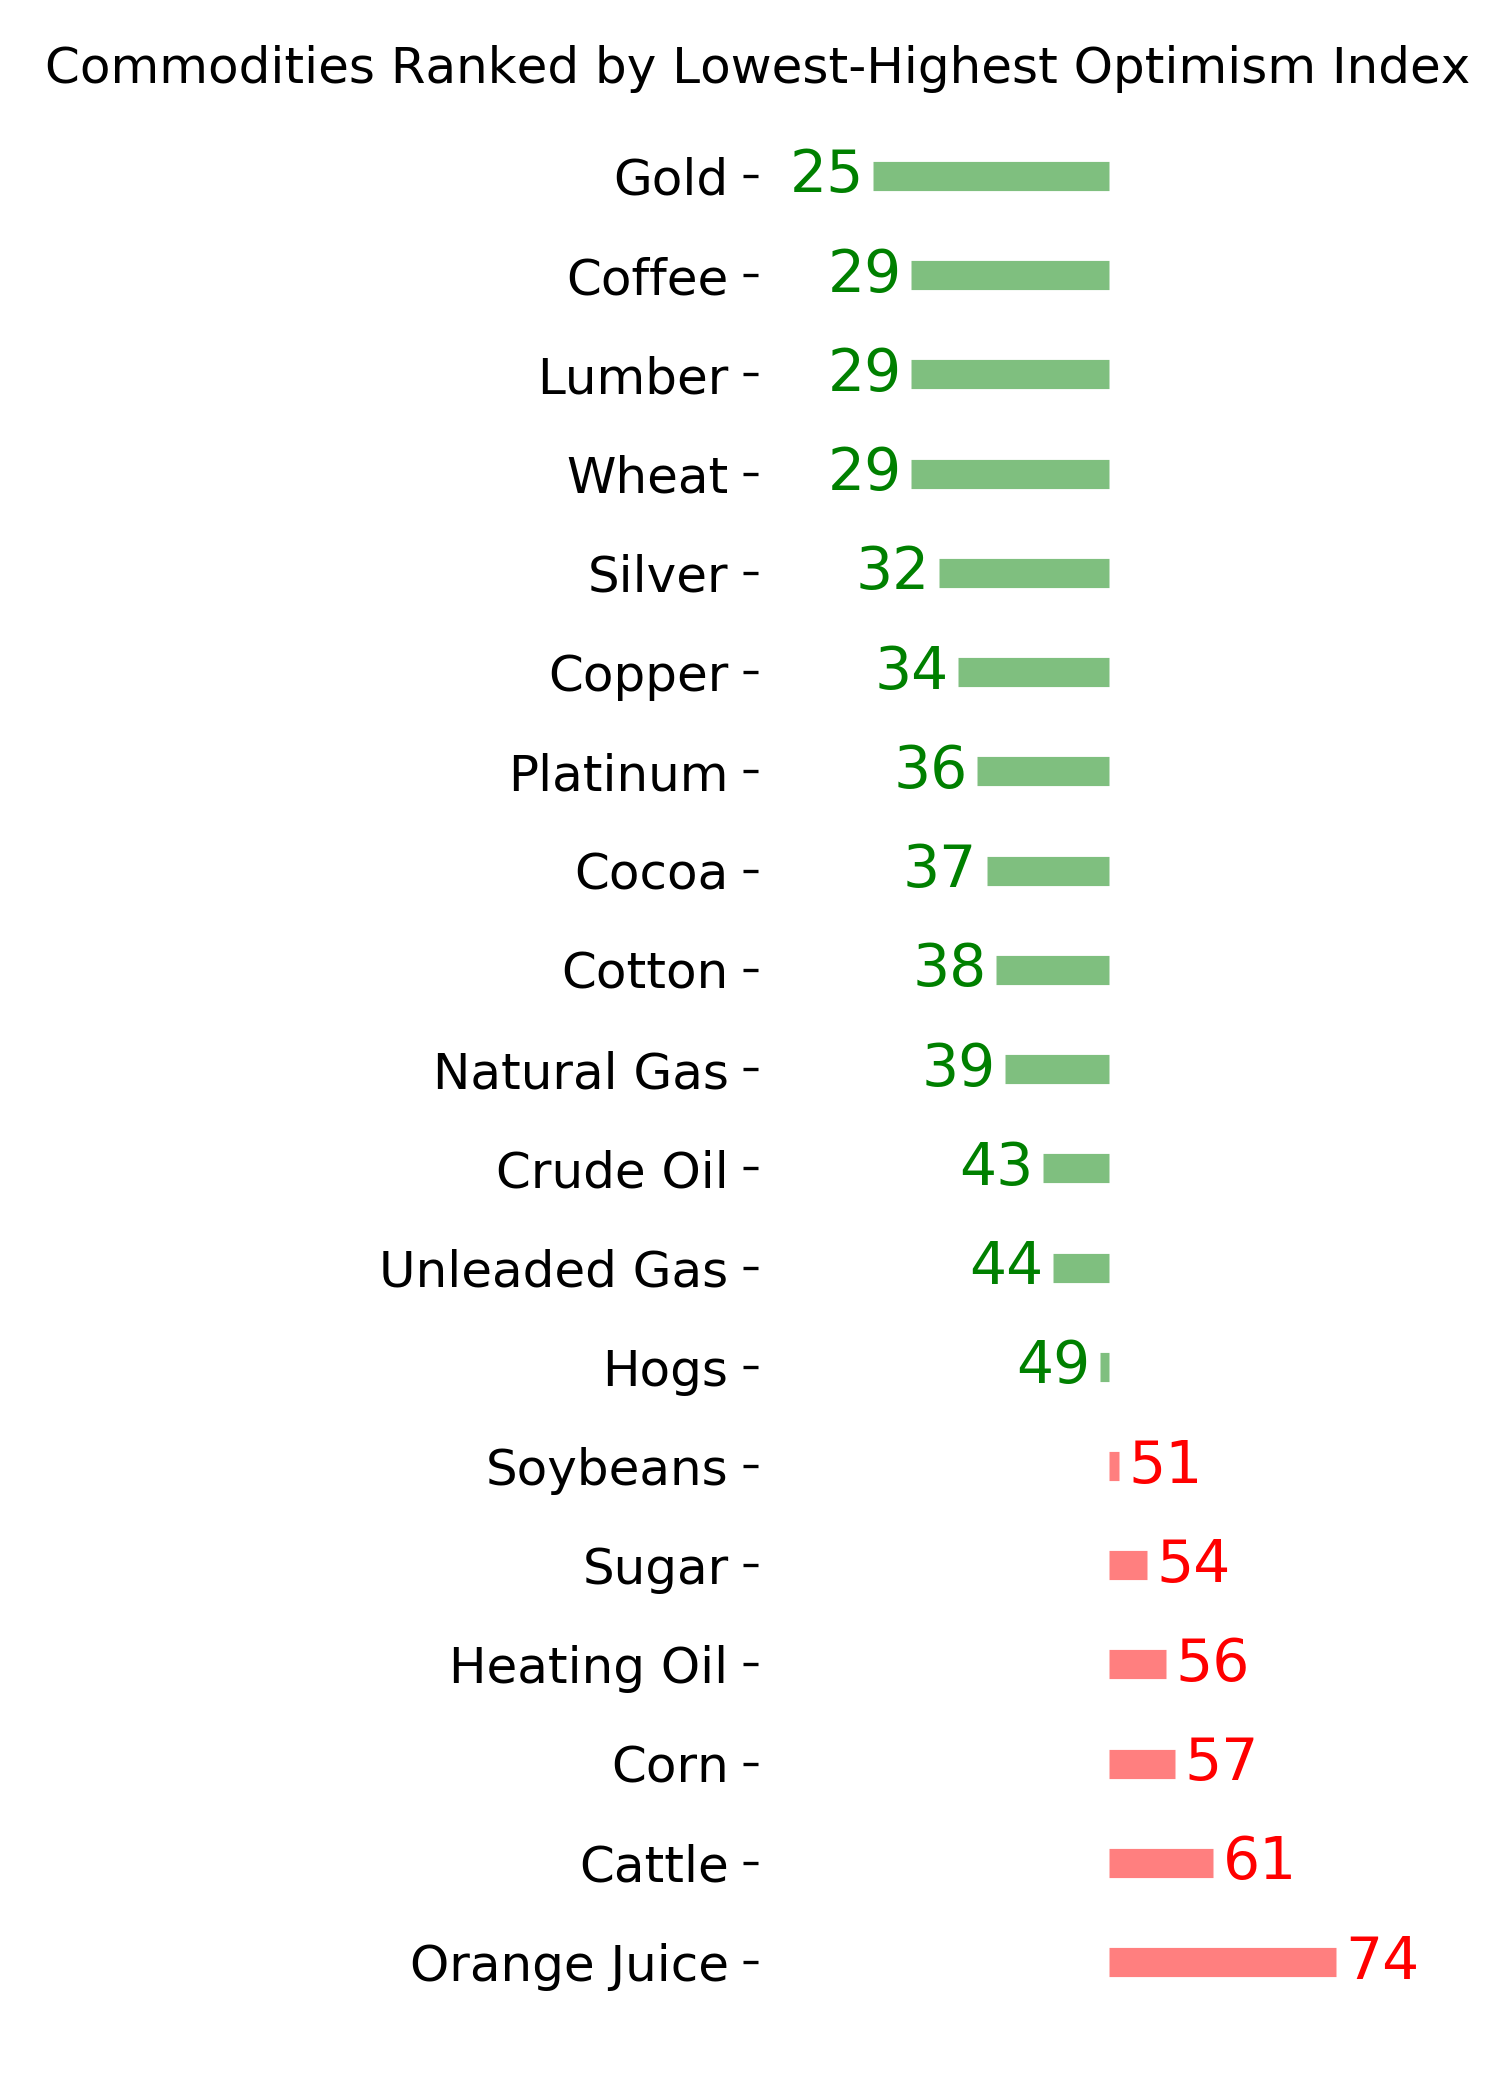
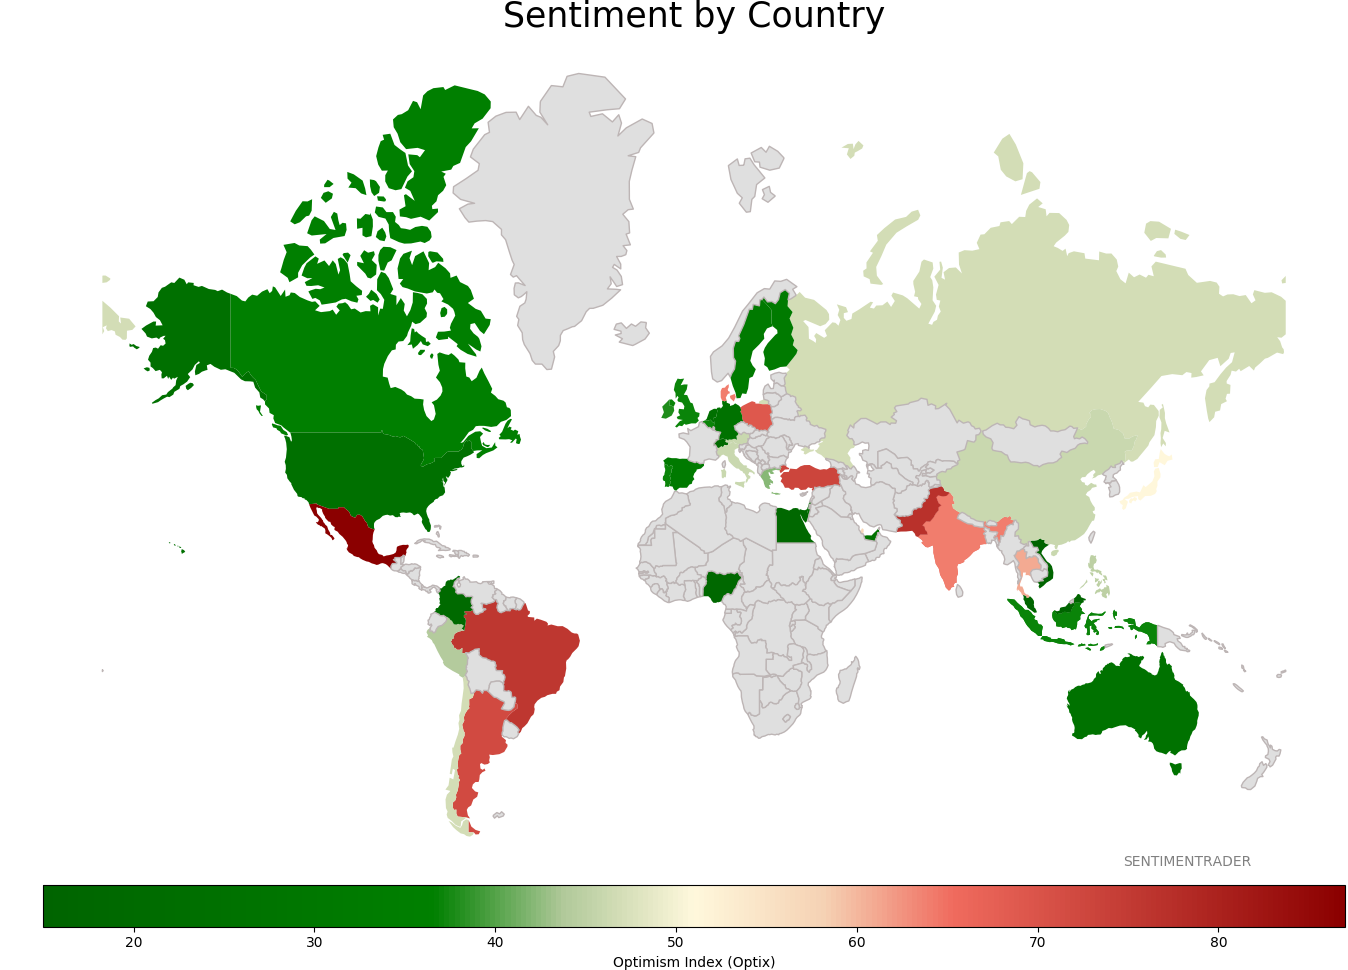
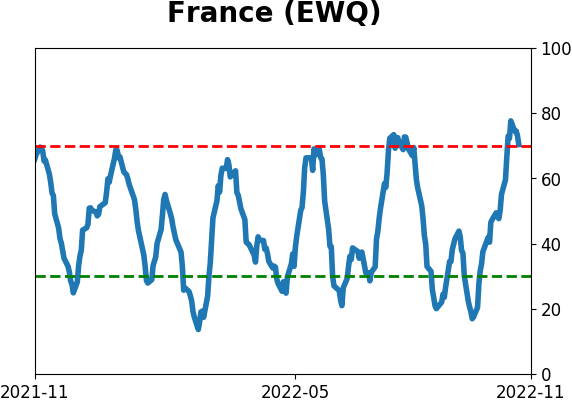
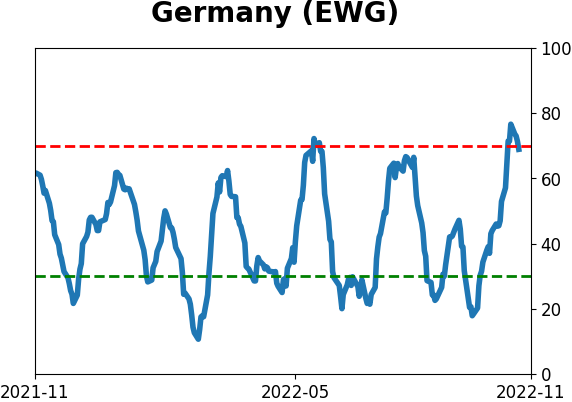
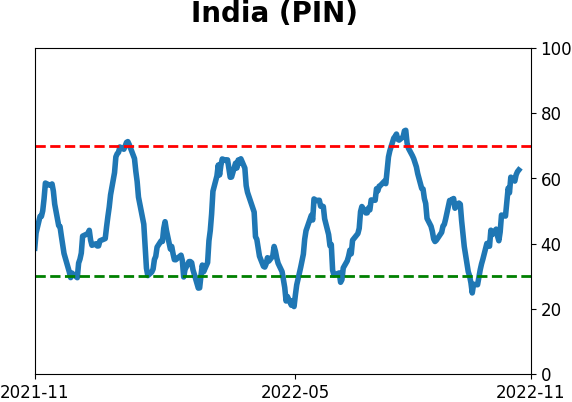
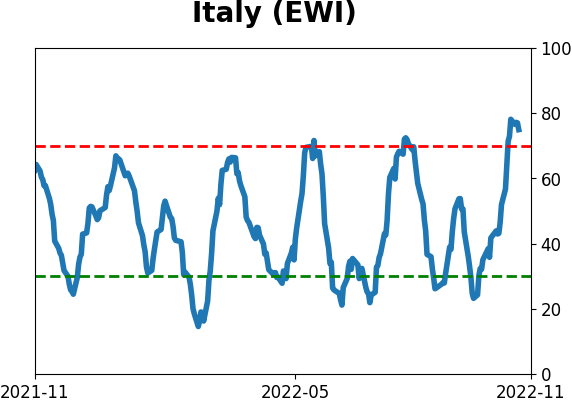
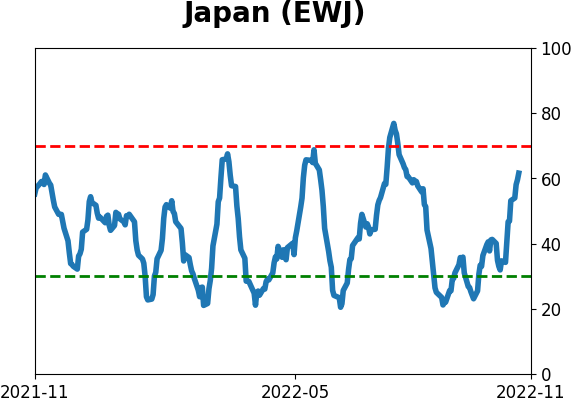
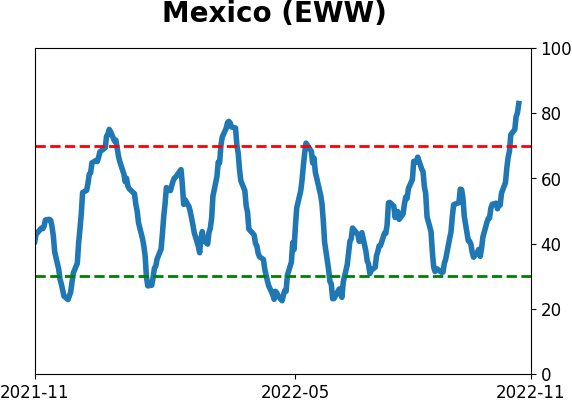
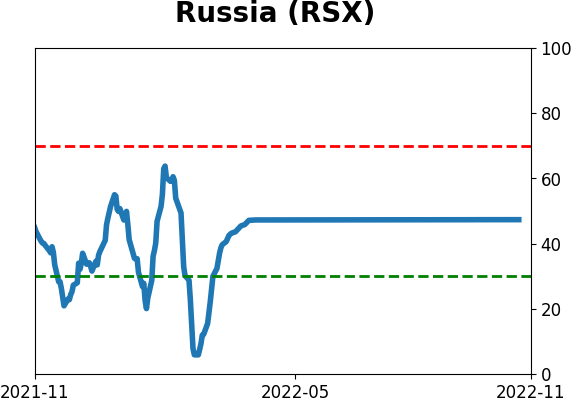
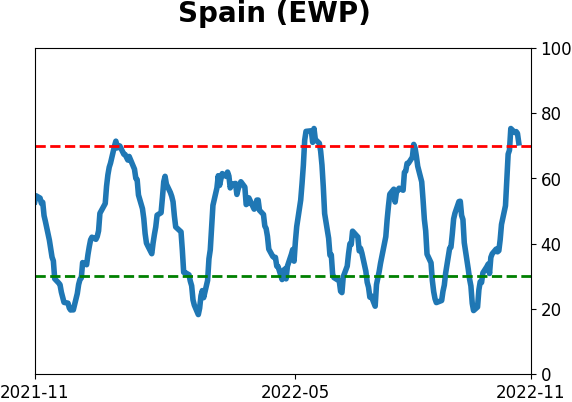
Sentiment Around The World
Optimism Index Thumbnails
|
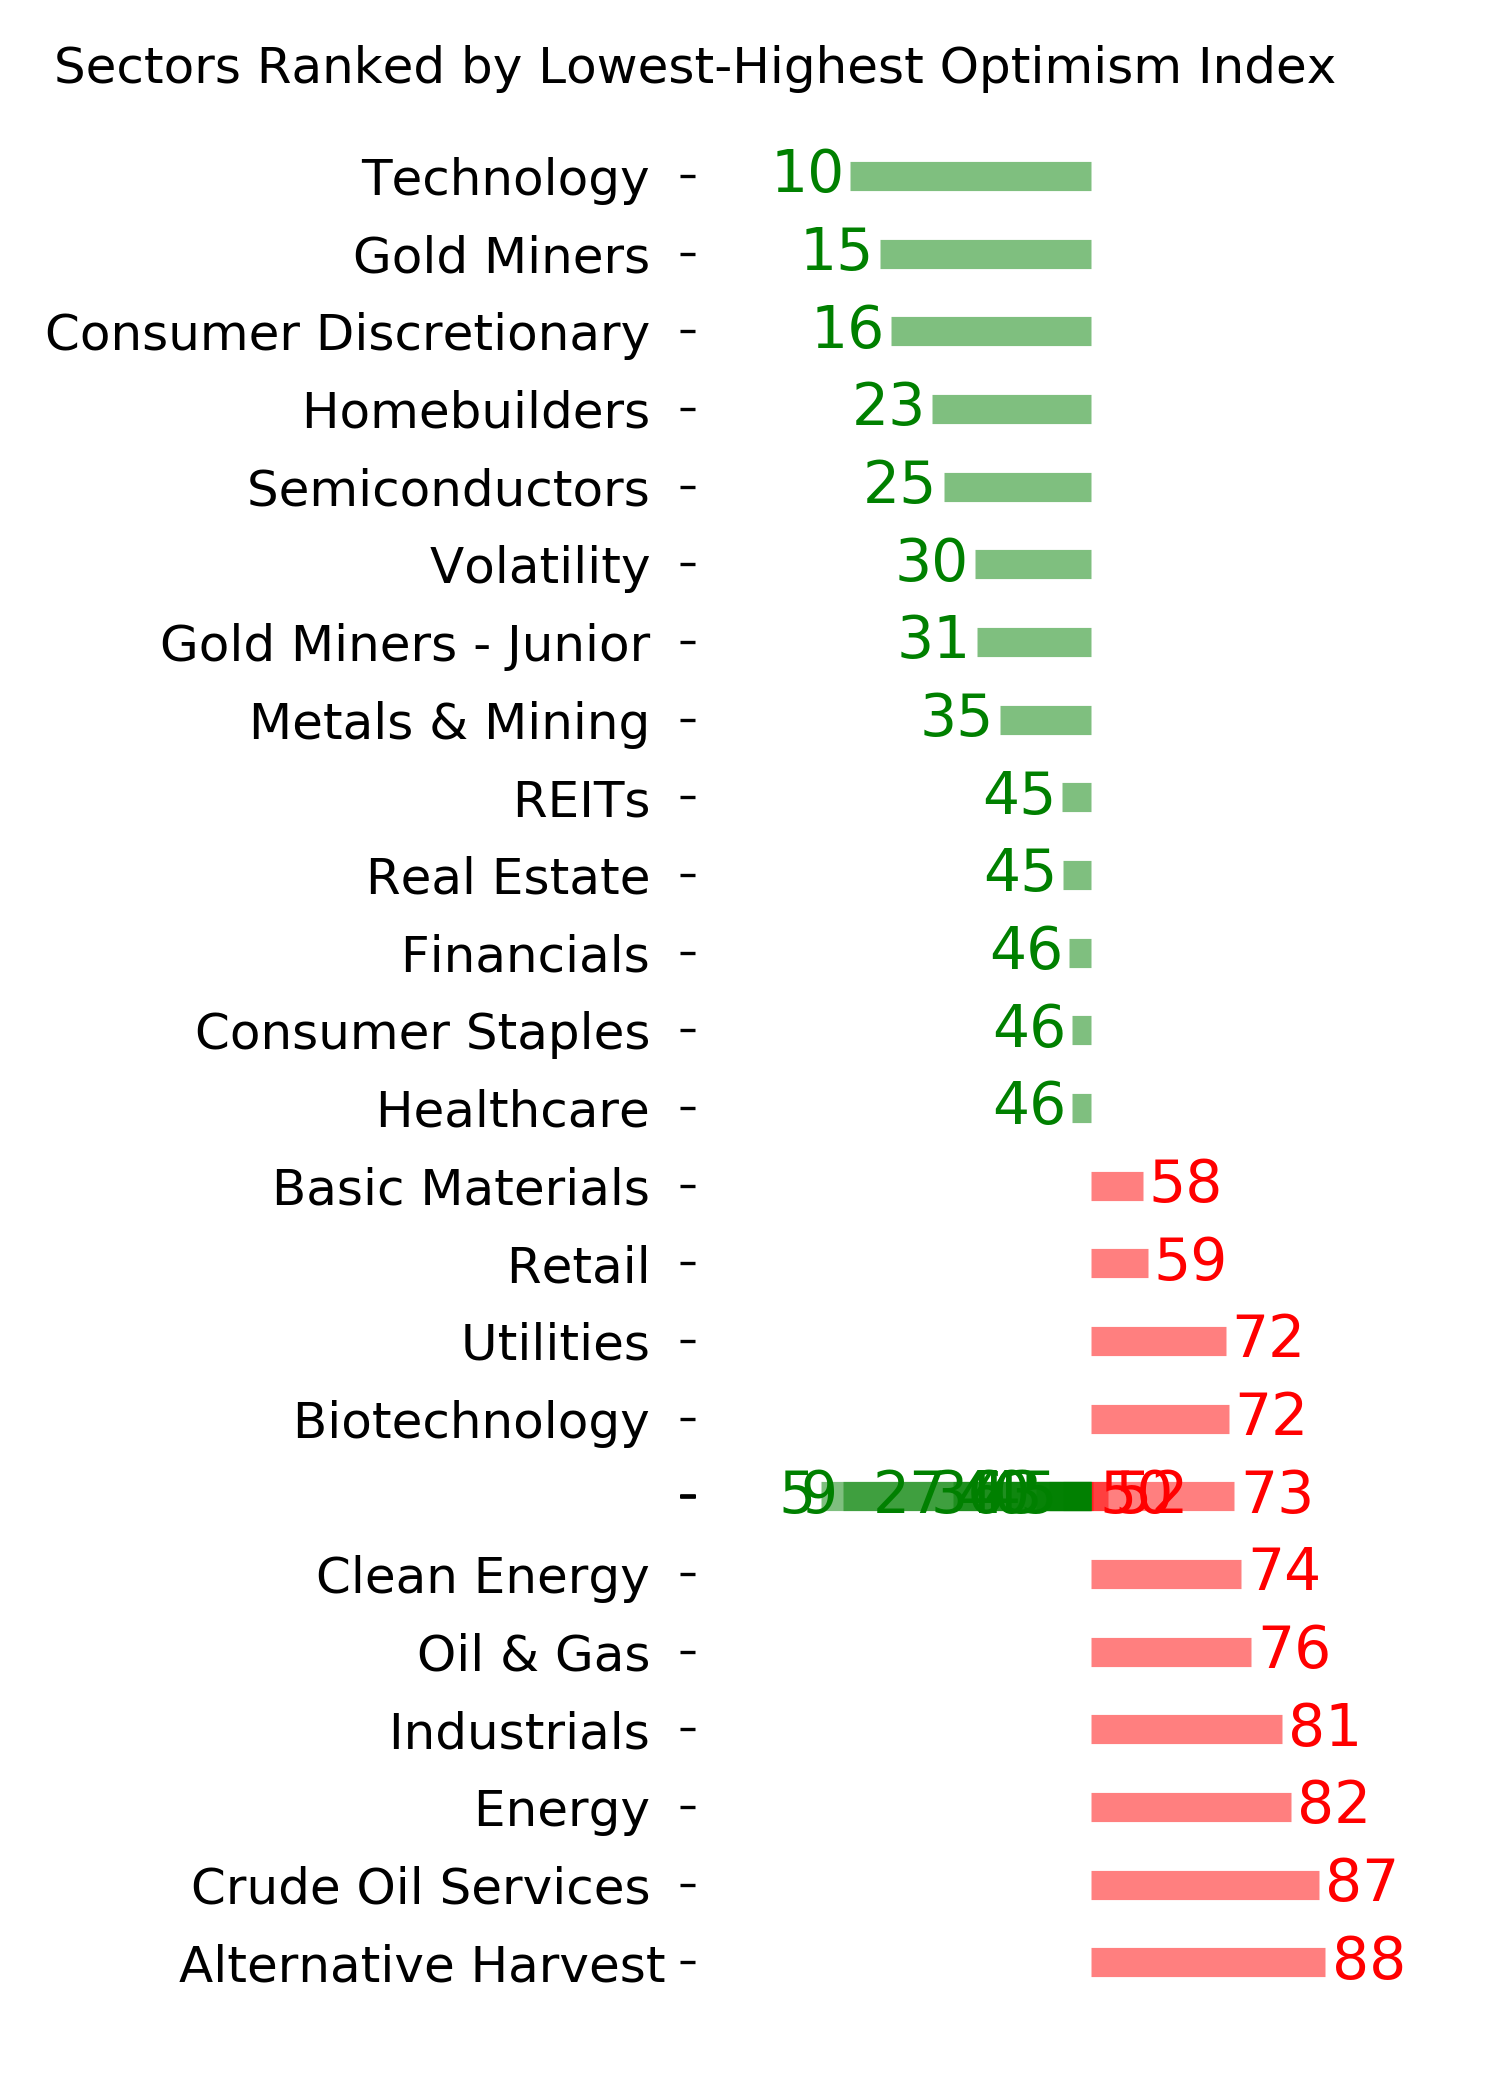
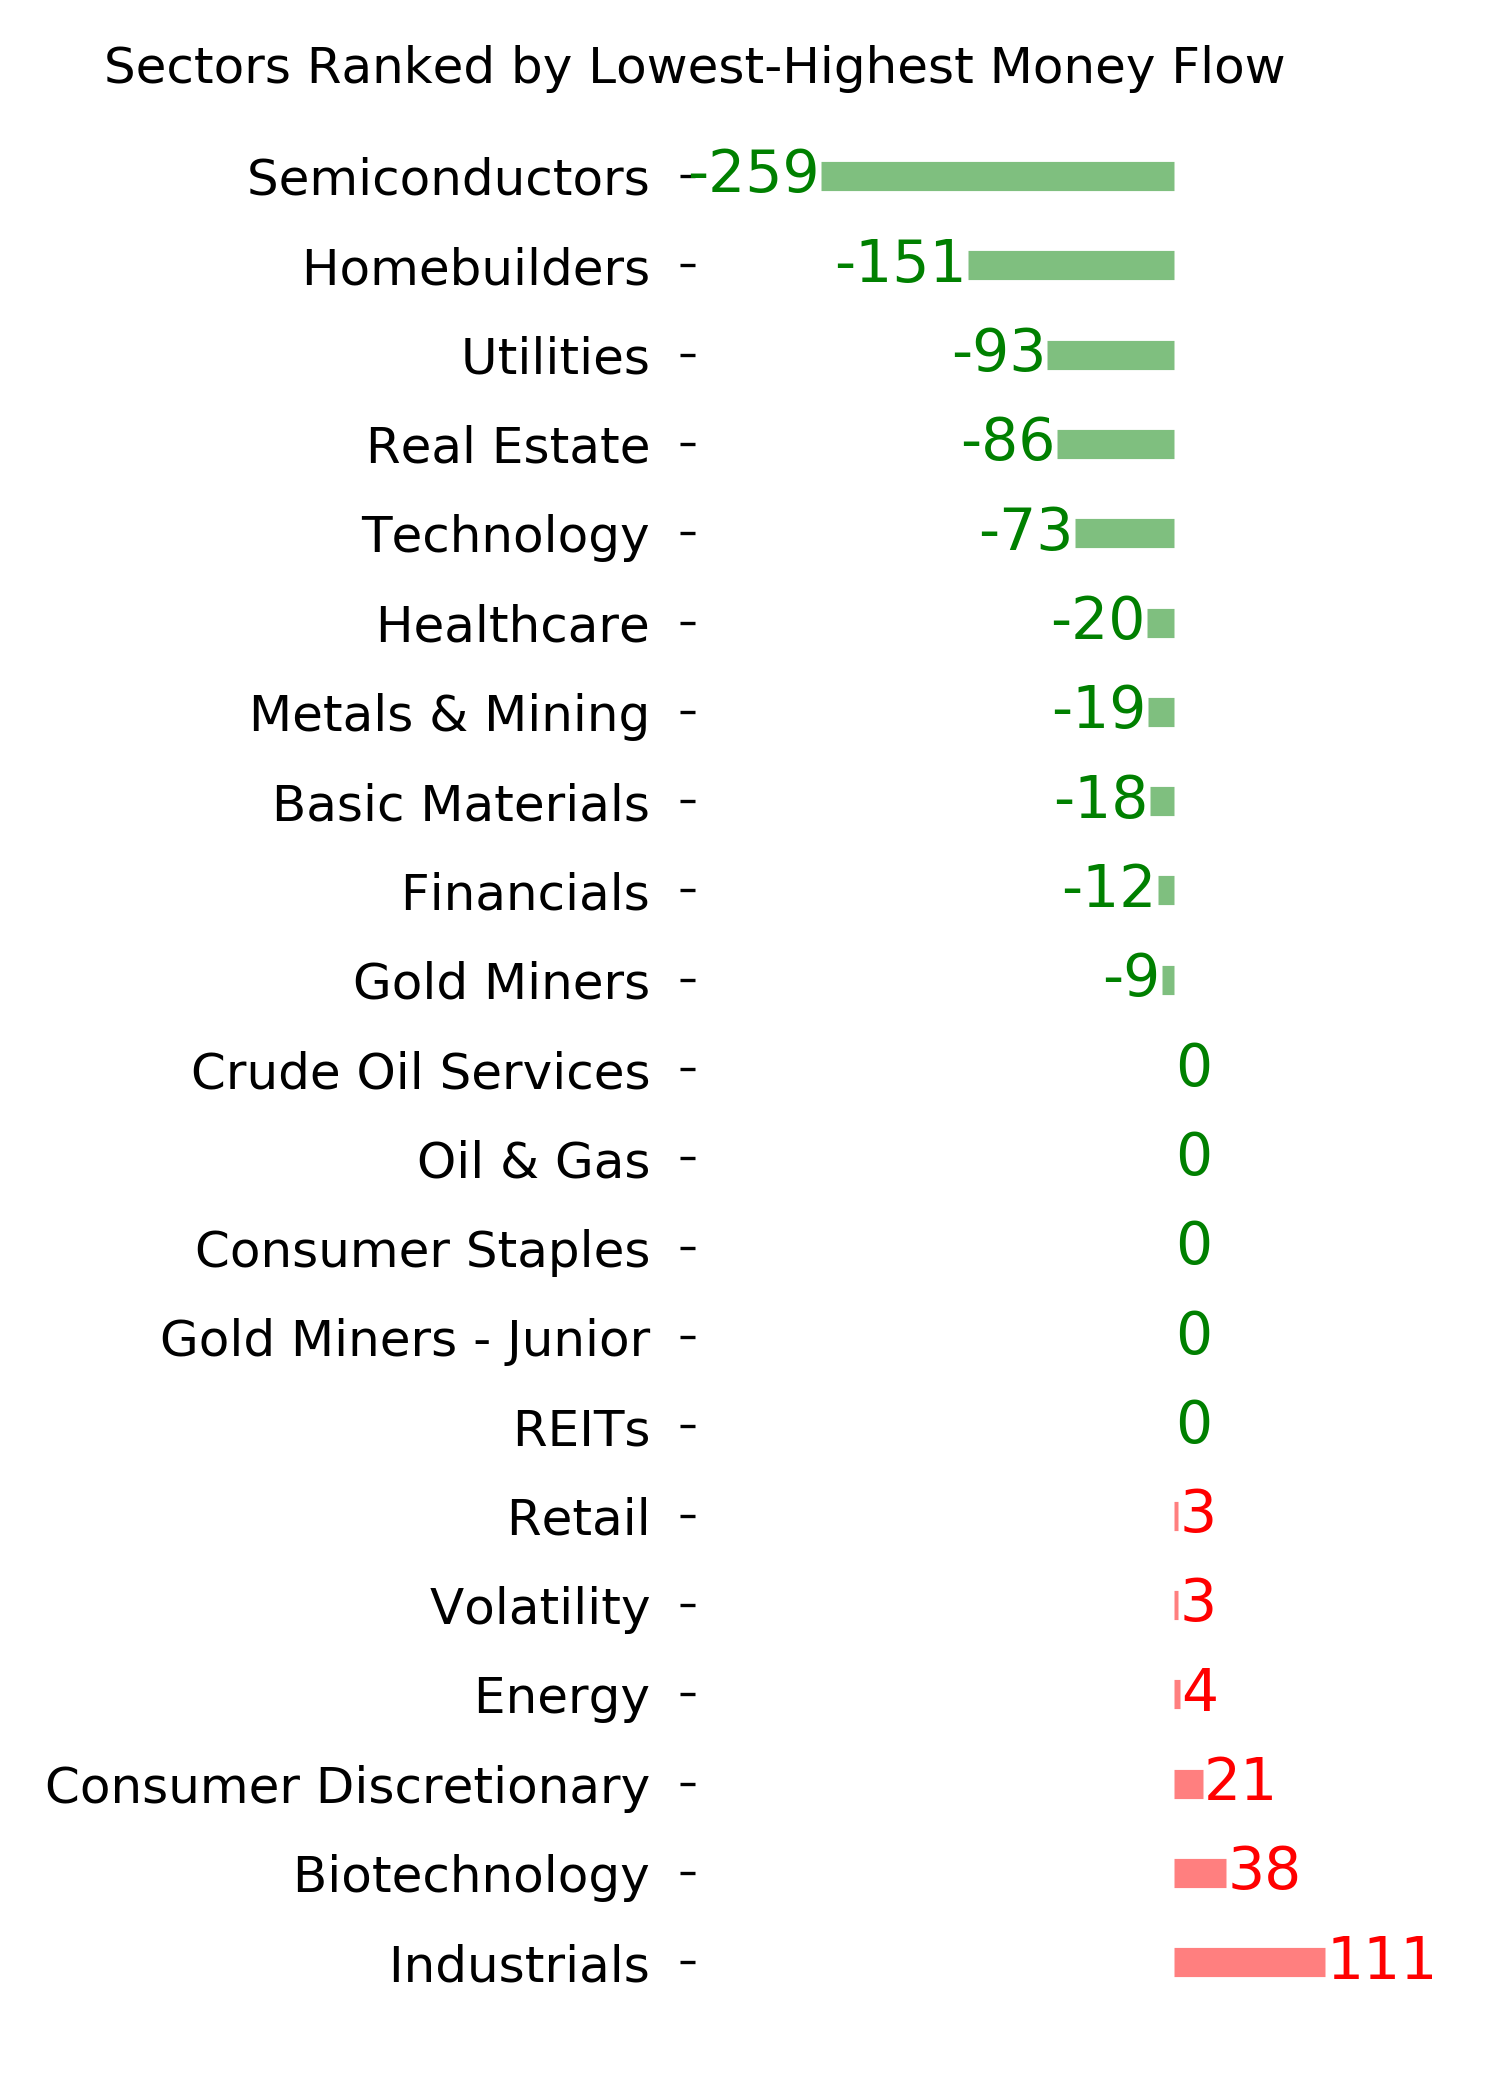
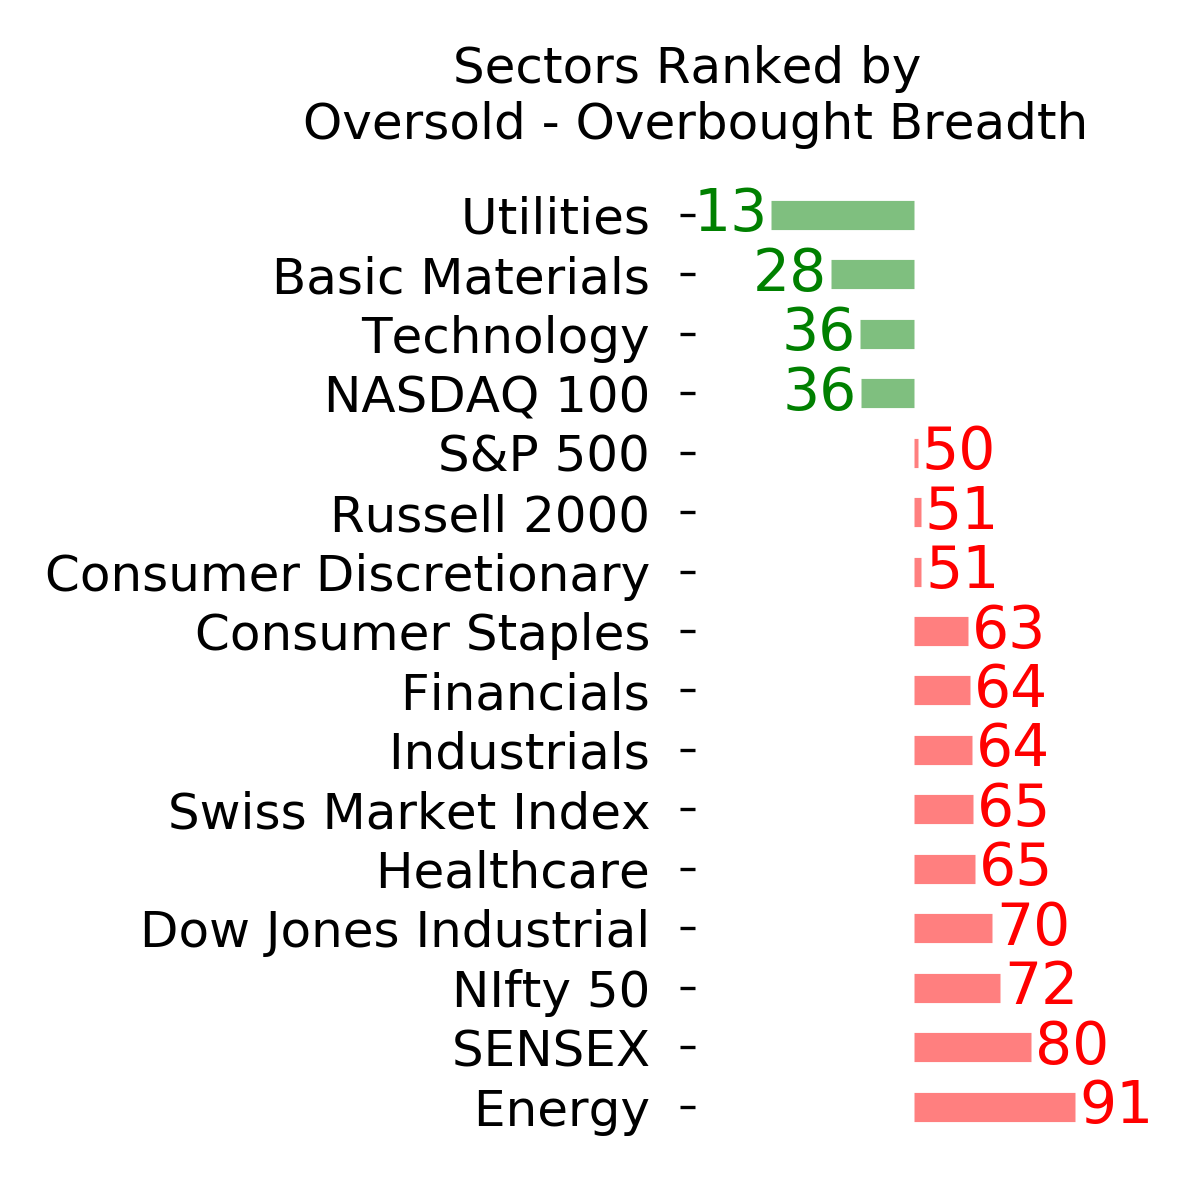
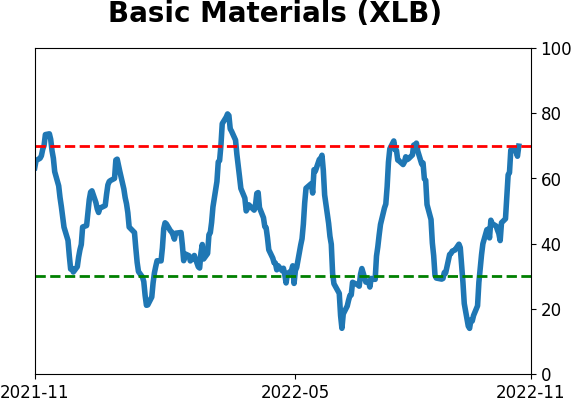
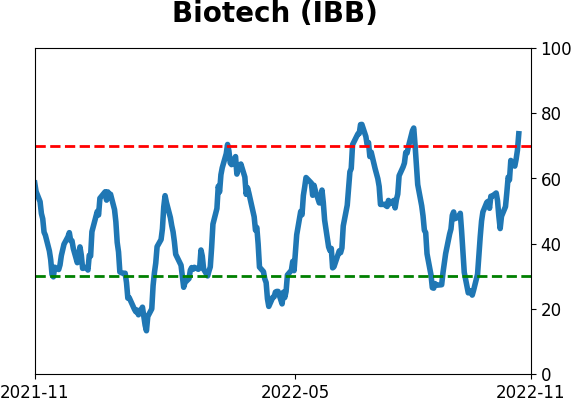
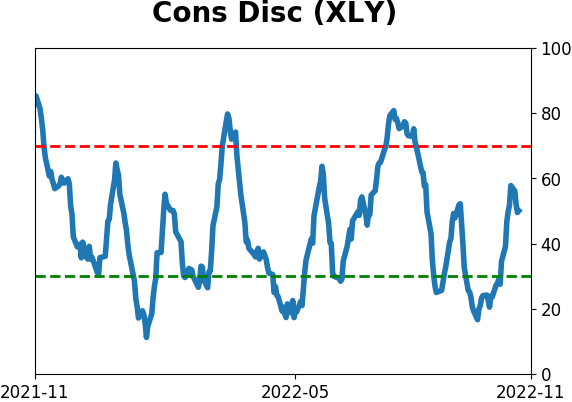
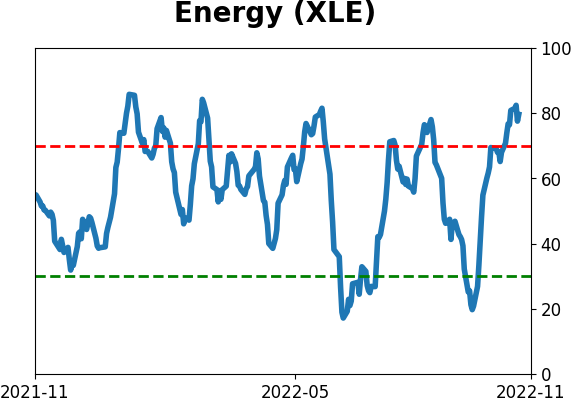
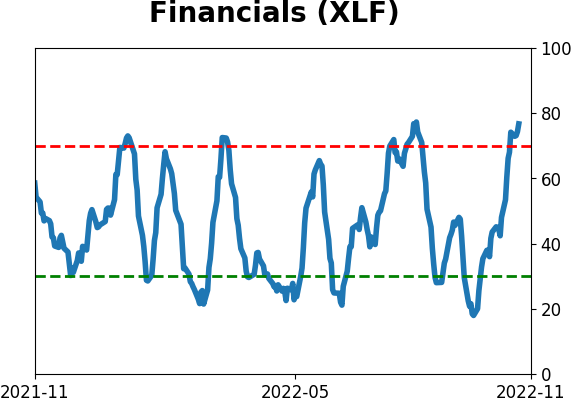
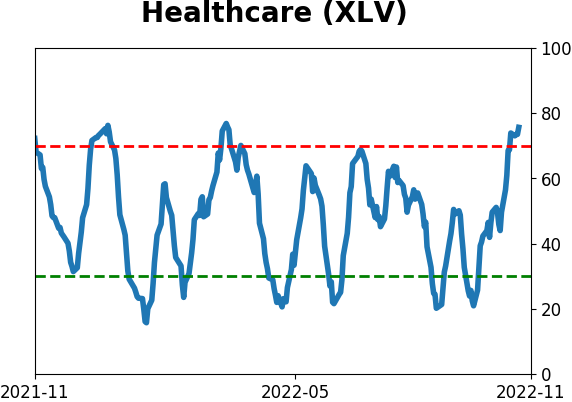
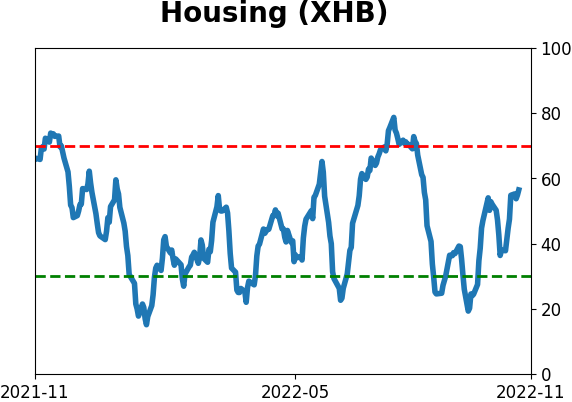
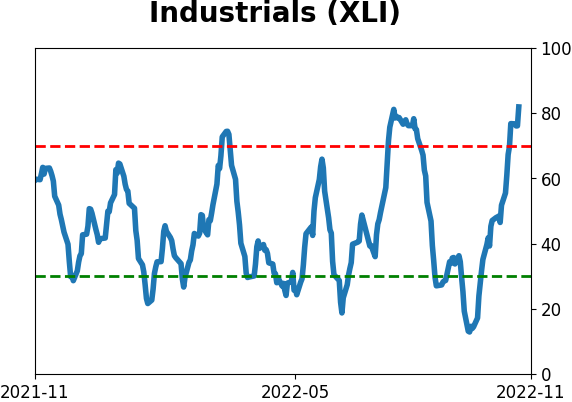
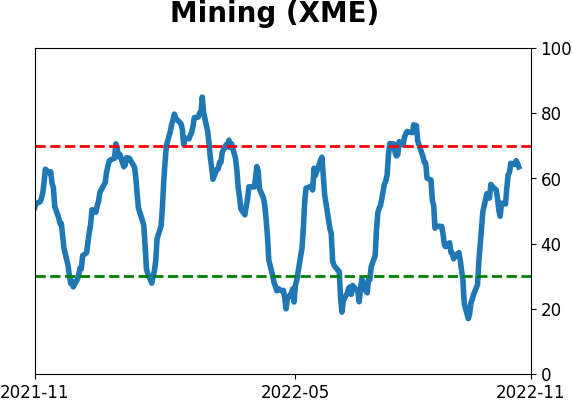
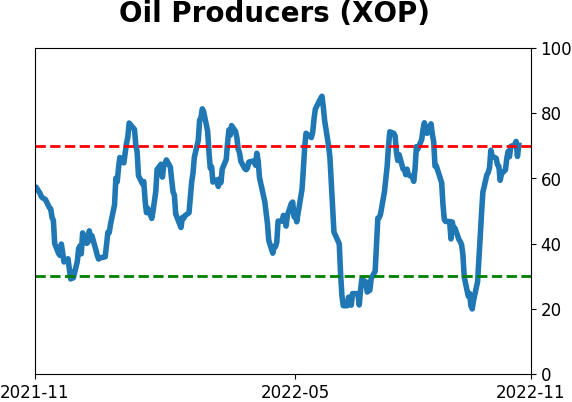
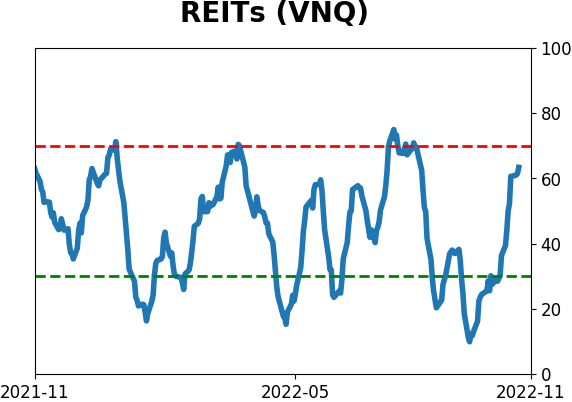
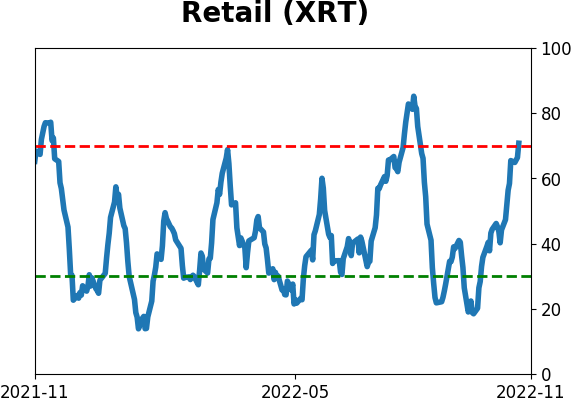
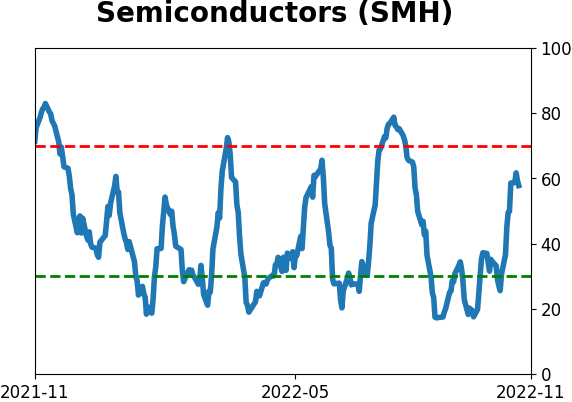
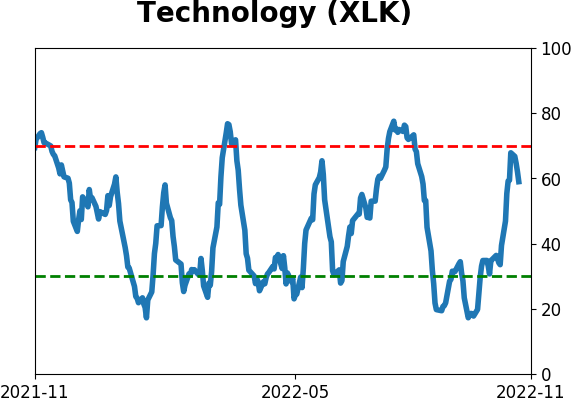
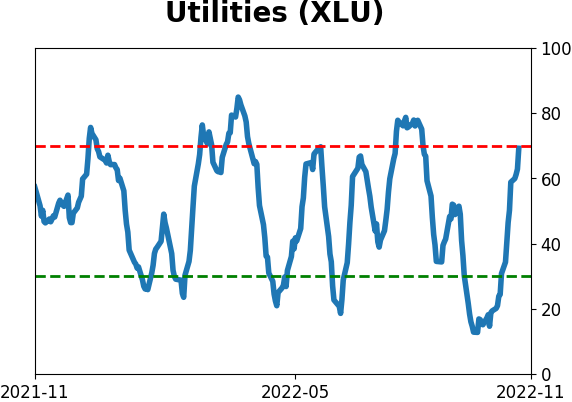
Sector ETF's - 10-Day Moving Average
|
|
|
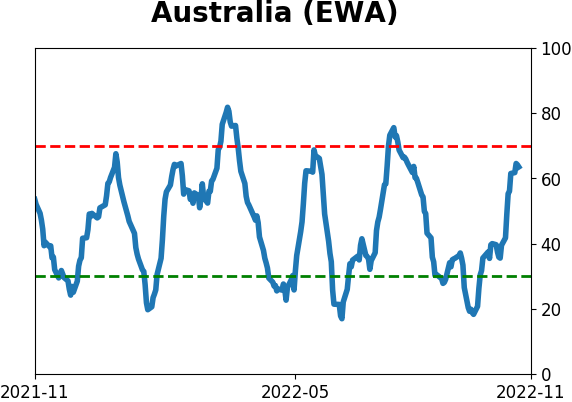
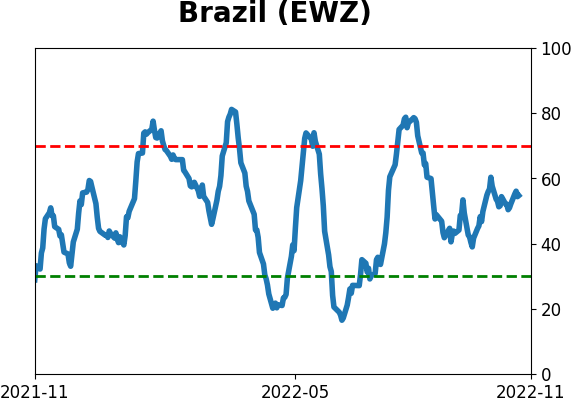
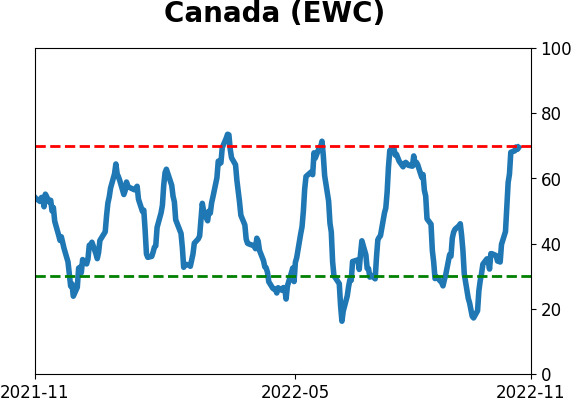
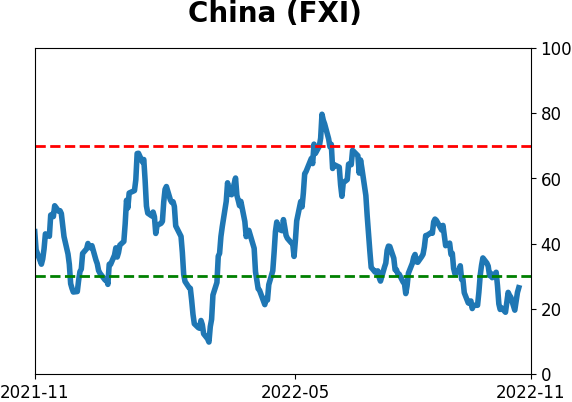
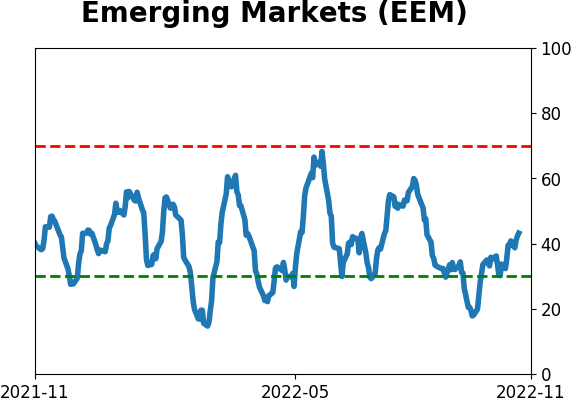
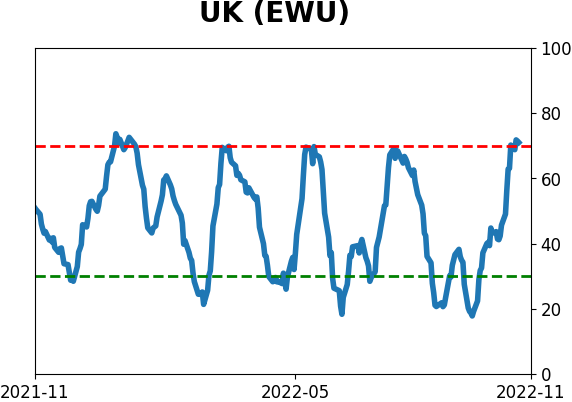
Country ETF's - 10-Day Moving Average
|
|
|
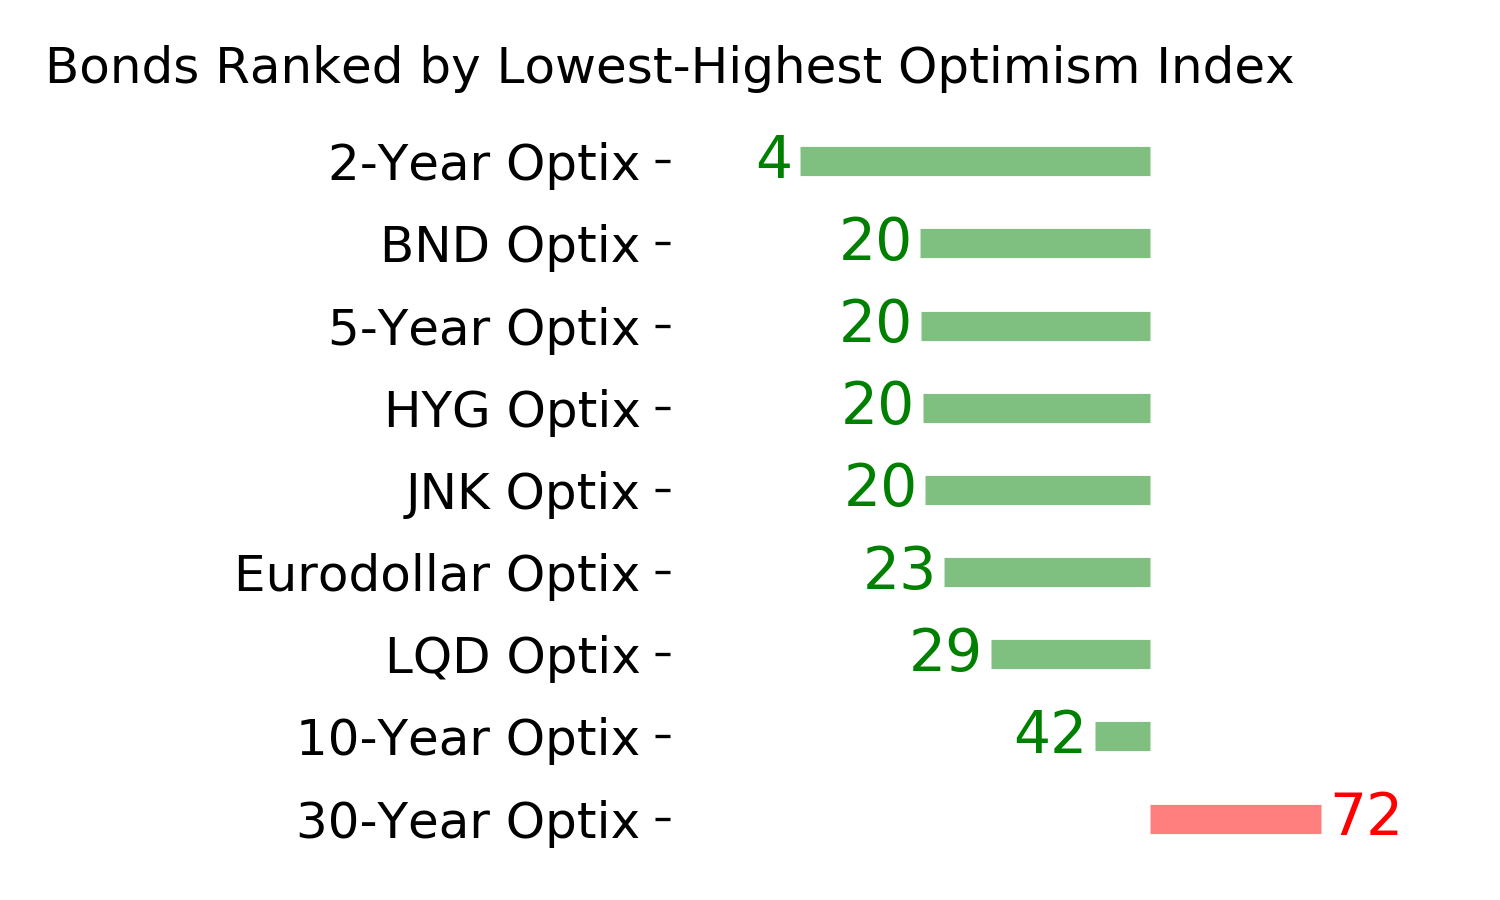
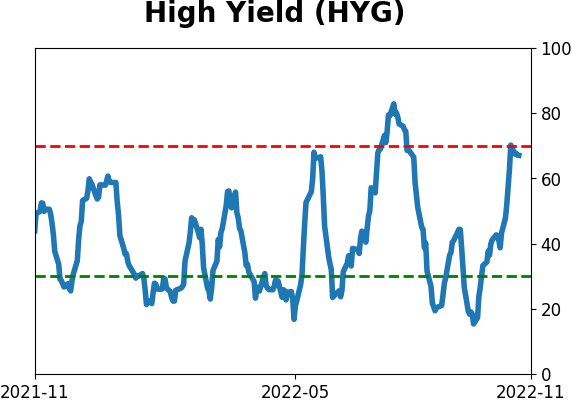
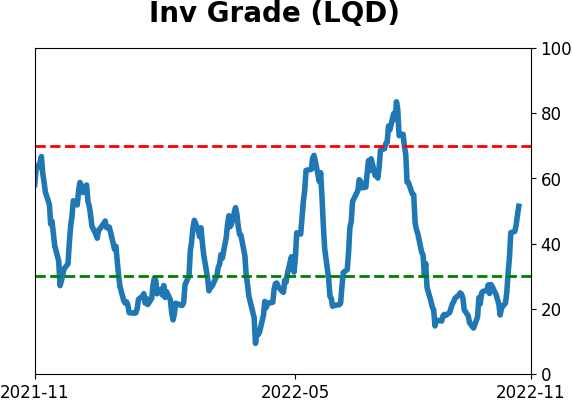
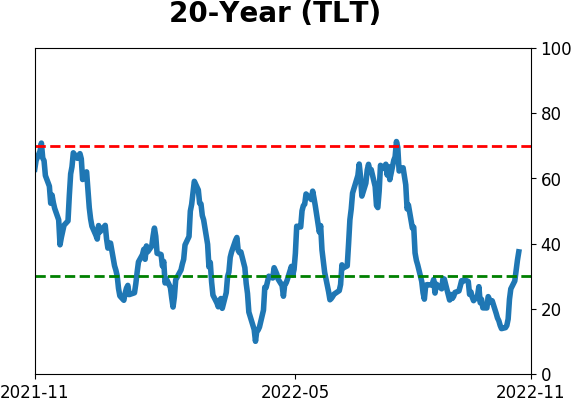
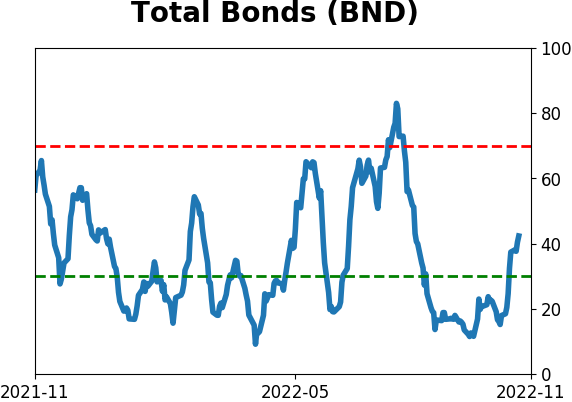
Bond ETF's - 10-Day Moving Average
|
|
|
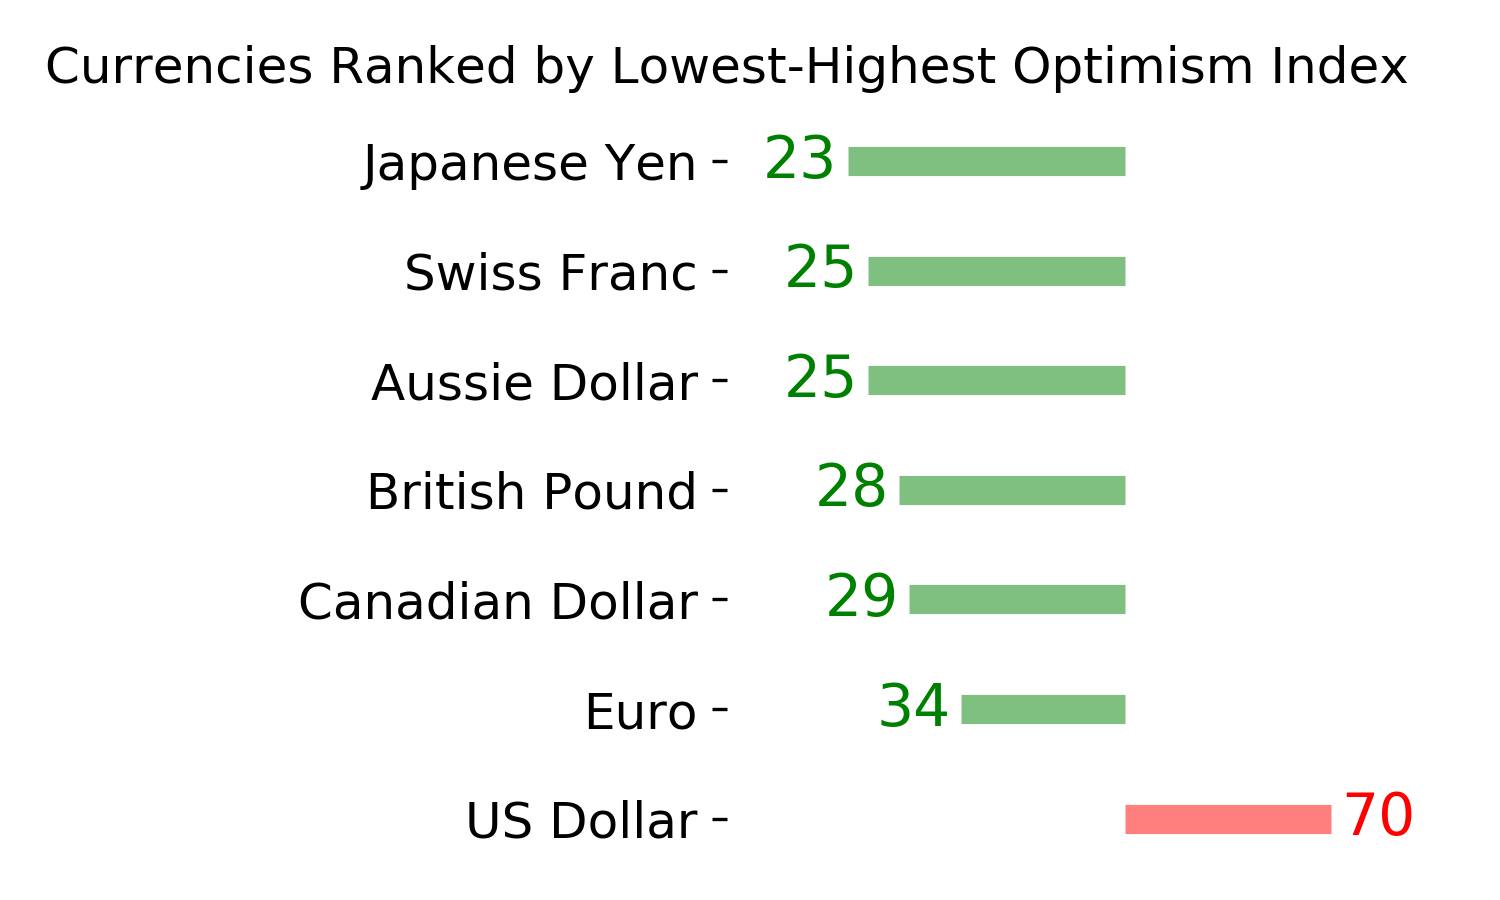
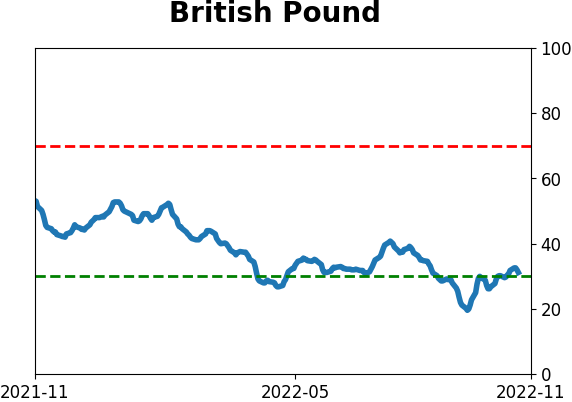
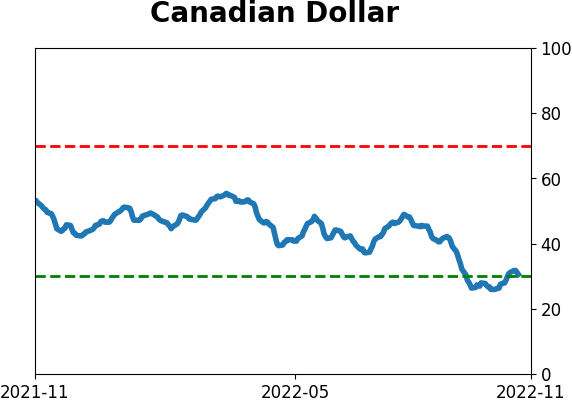
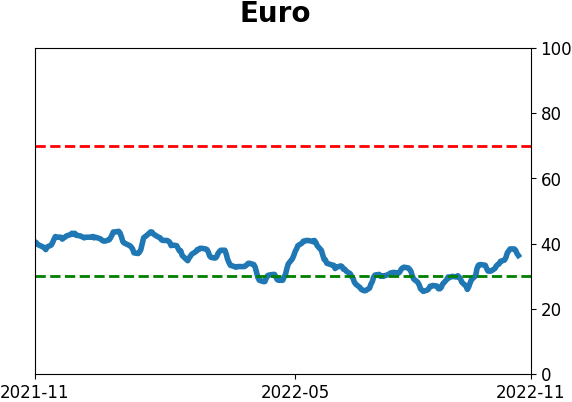
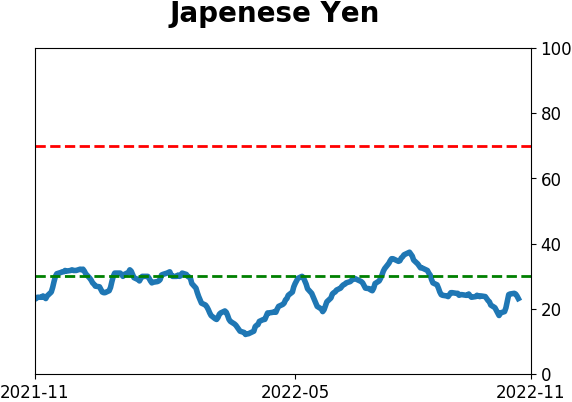
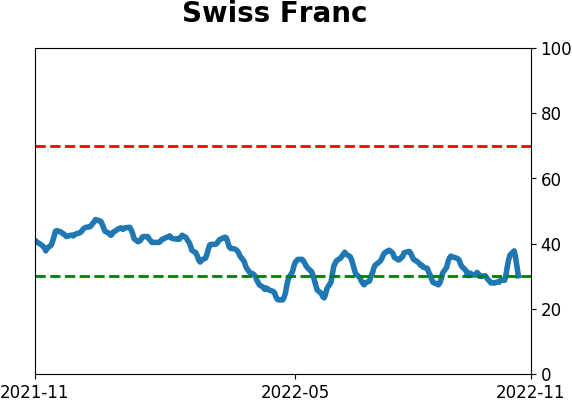
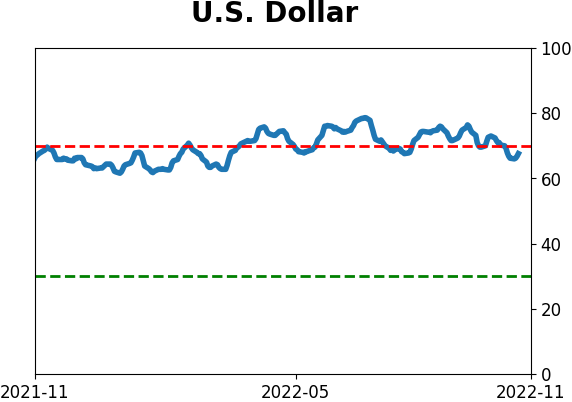
Currency ETF's - 5-Day Moving Average
|
|
|
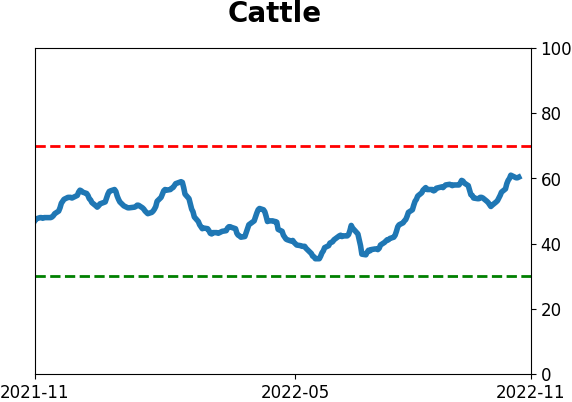
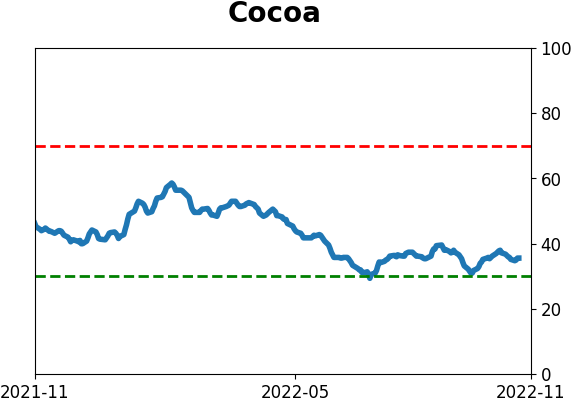
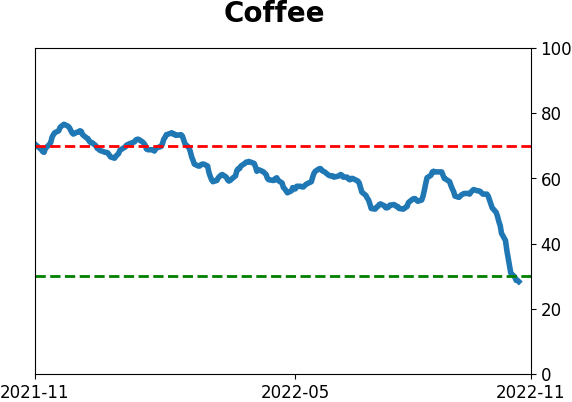
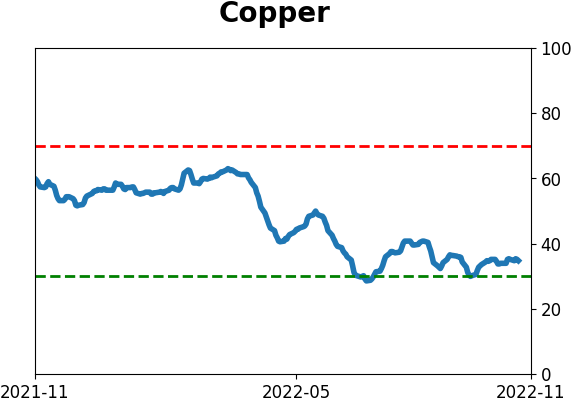
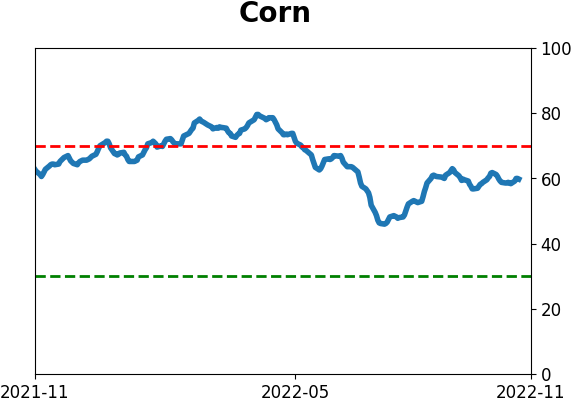
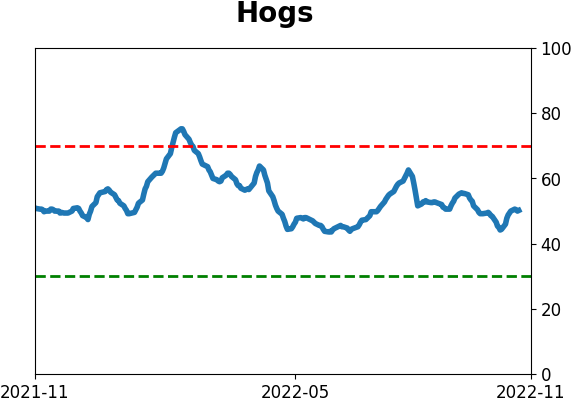
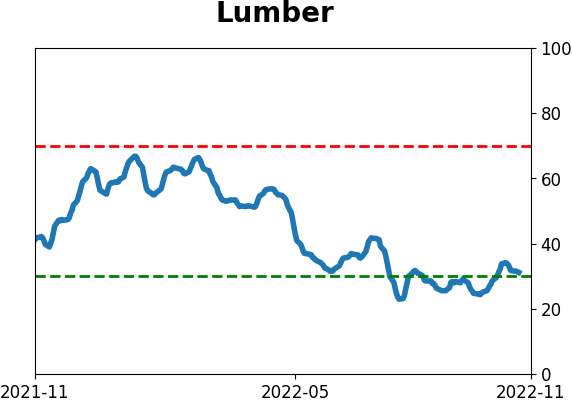
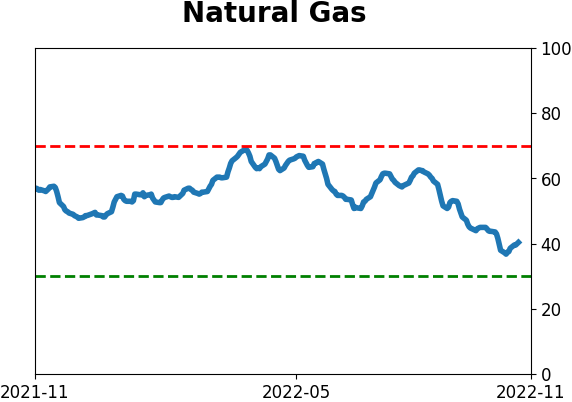
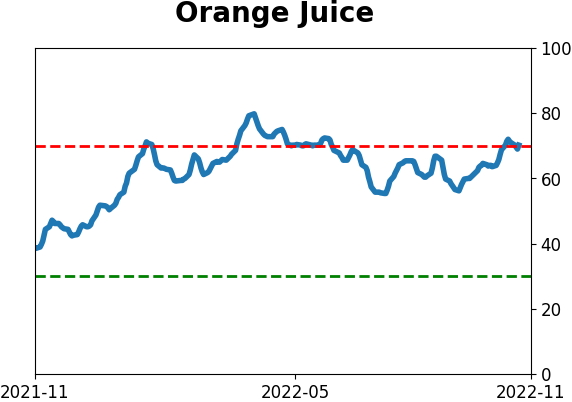
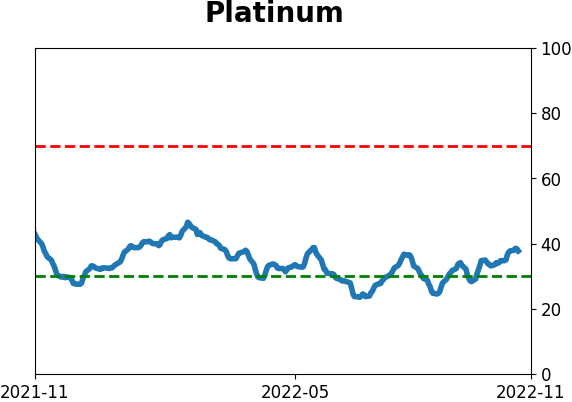
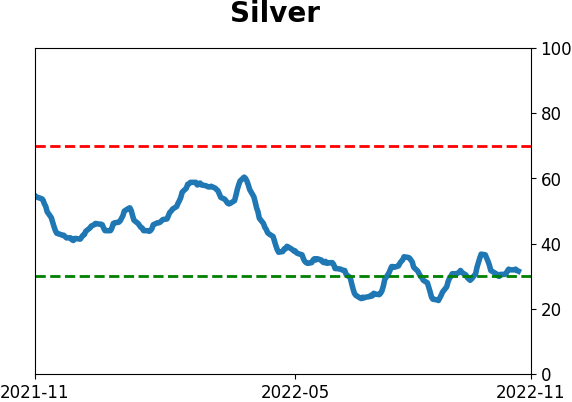
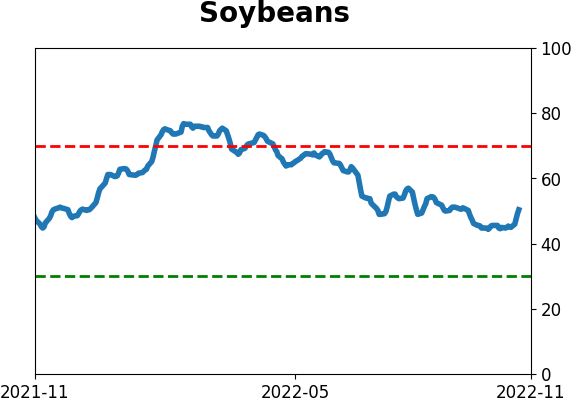
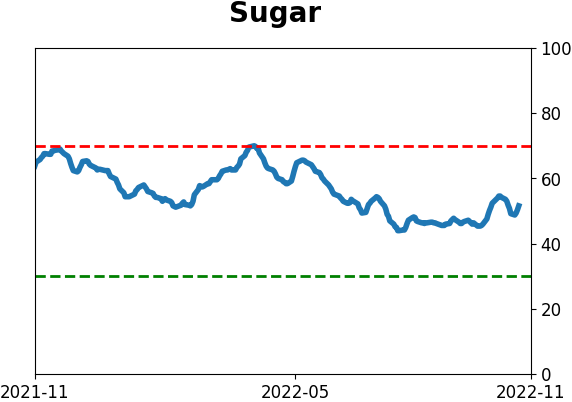
Commodity ETF's - 5-Day Moving Average
|
|