Headlines
|
|
A shift in volatility triggers a buy signal for the Nasdaq 100:
The Volatility Index for the Nasdaq 100 Index increased to an elevated level and subsequently reversed lower, triggering a buy signal for the Nasdaq 100. After similar signals, the QQQ ETF was higher 79% of the time over the following two months.
|
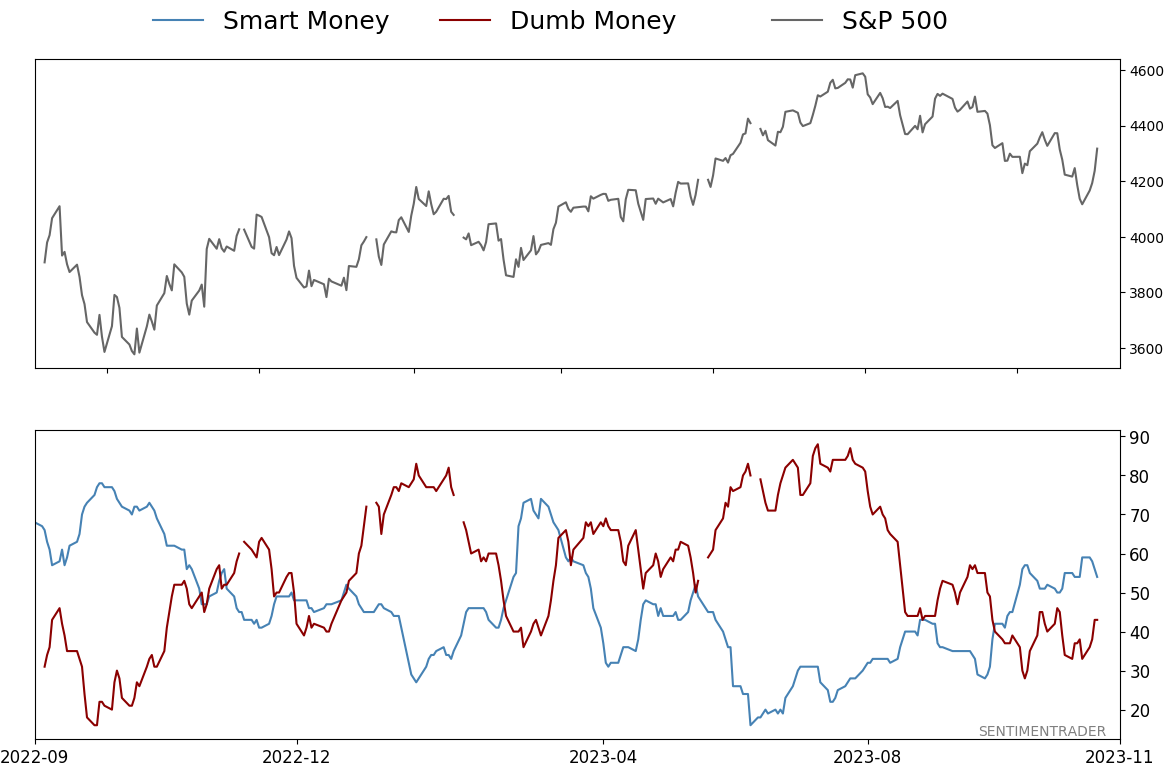
Smart / Dumb Money Confidence
|
Smart Money Confidence: 54%
Dumb Money Confidence: 43%
|
|
Risk Levels
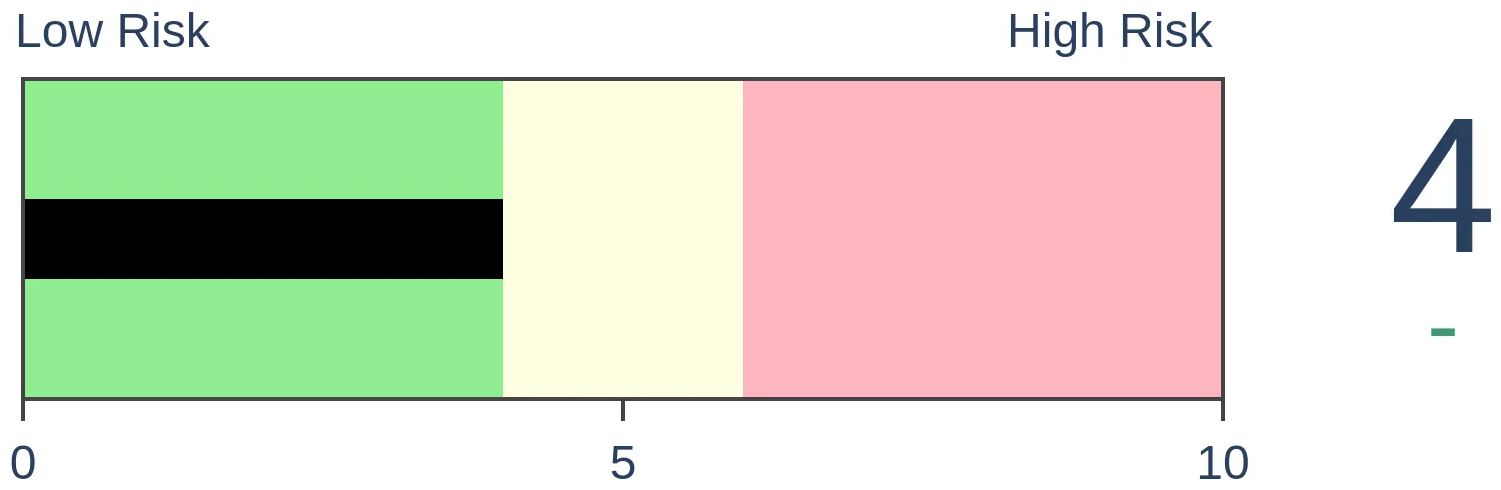
Stocks Short-Term
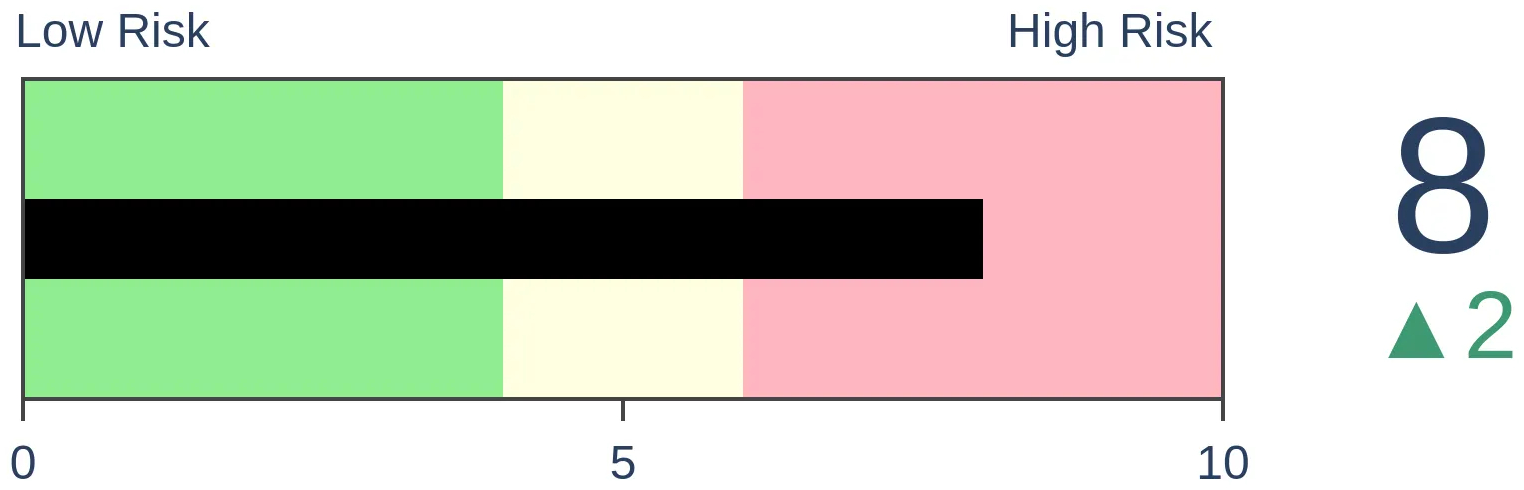
|
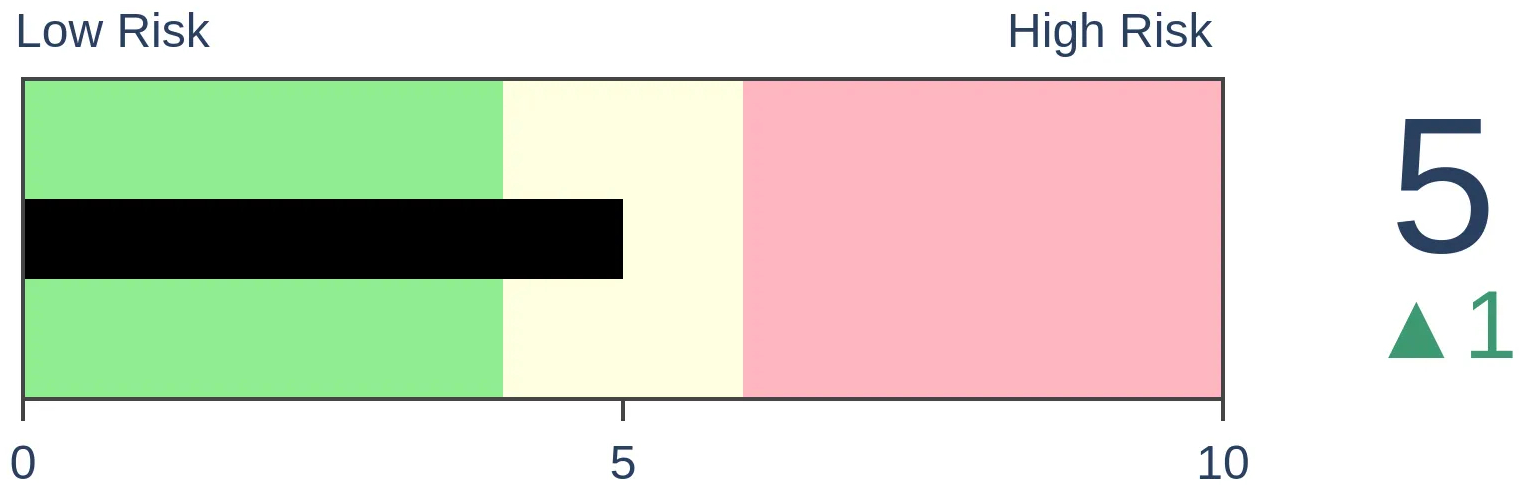
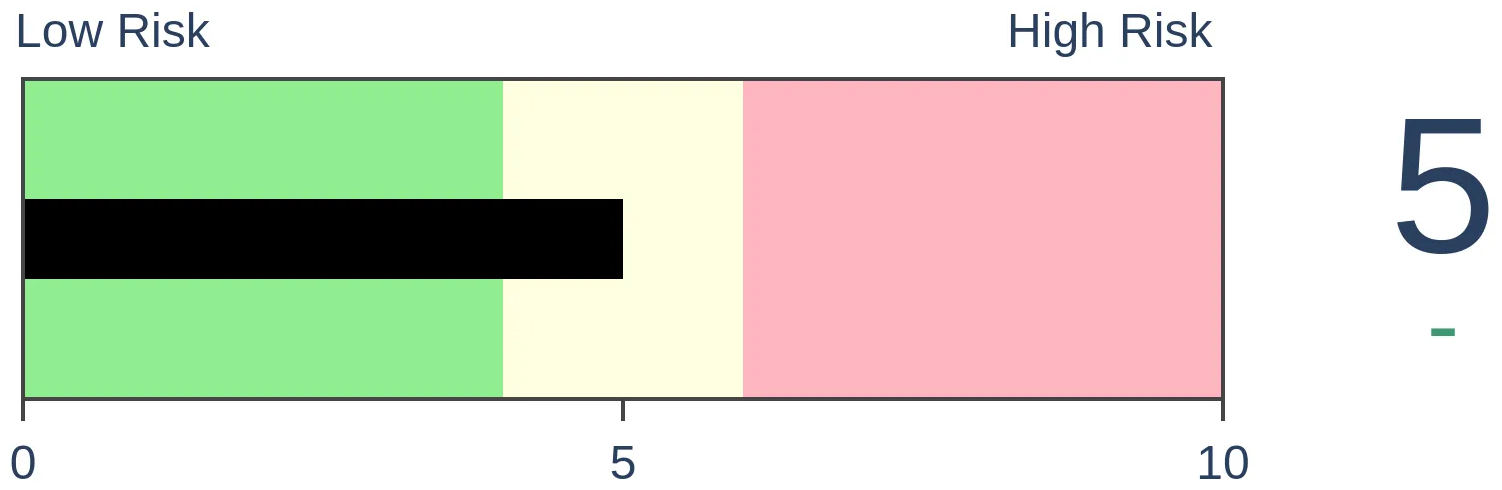
Stocks Medium-Term

|
|
Bonds
|
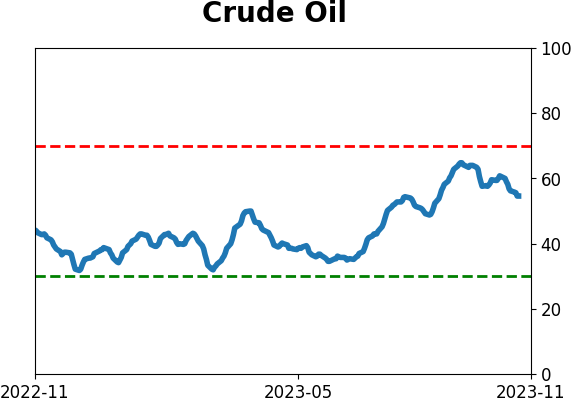
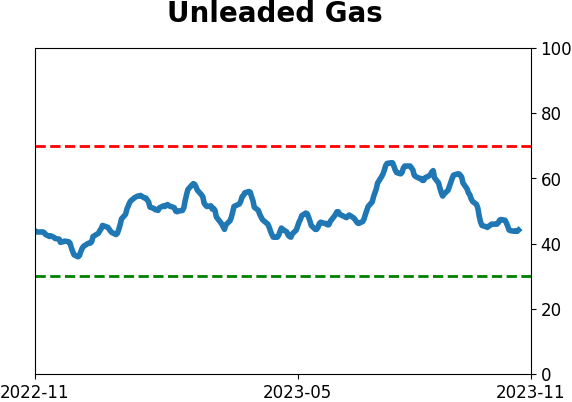
Crude Oil

|
|
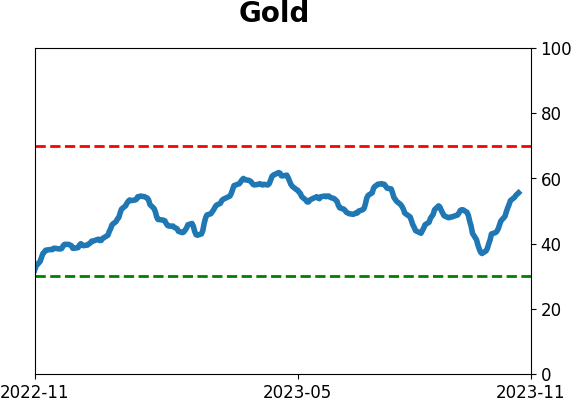
Gold
|
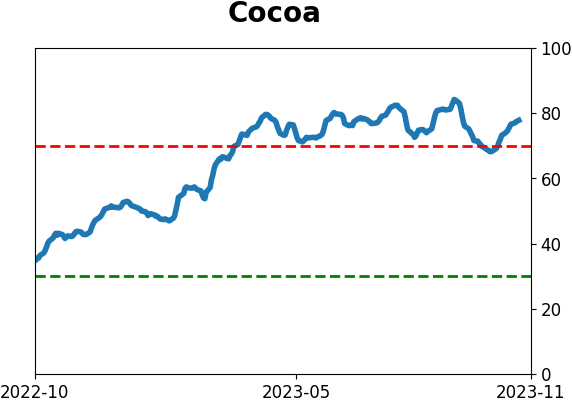
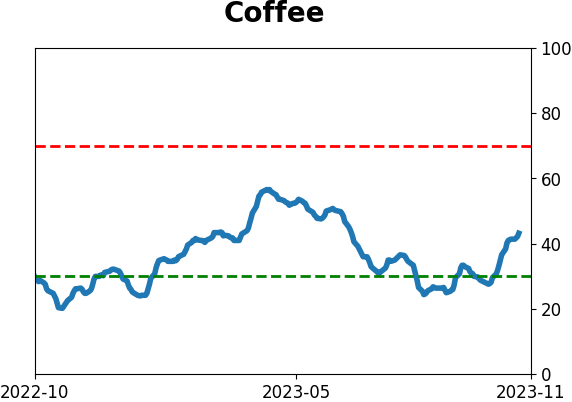
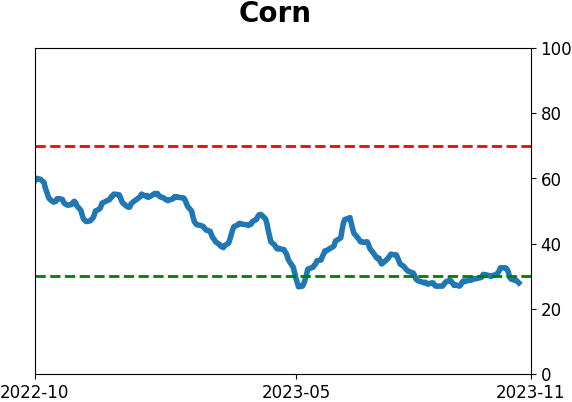
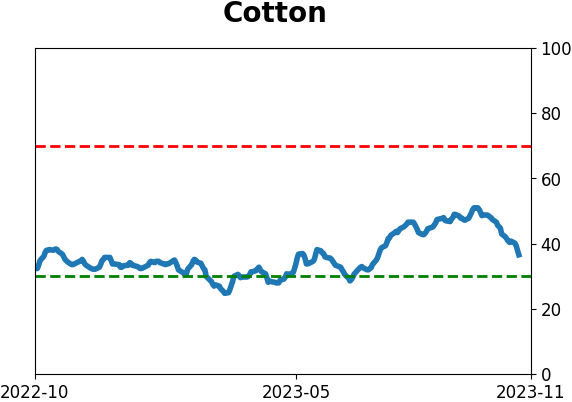
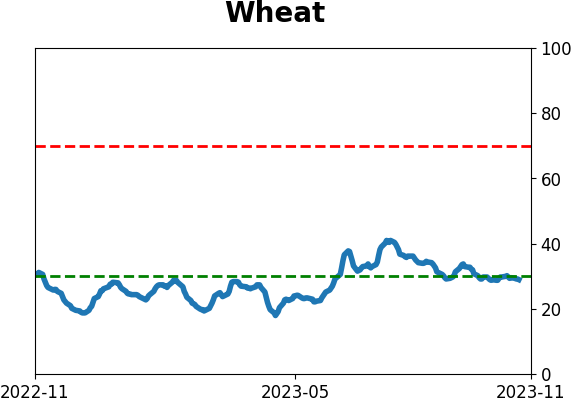
Agriculture
|
|
Research
By Dean Christians
BOTTOM LINE
The Volatility Index for the Nasdaq 100 Index increased to an elevated level and subsequently reversed lower, triggering a buy signal for the Nasdaq 100. After similar signals, the QQQ ETF was higher 79% of the time over the following two months.
FORECAST / TIMEFRAME
QQQ -- Up, Medium-Term
|
Key points:
- The Volatility Index (VXN) for the Nasdaq 100 reversed from a period of elevated volatility
- Similar shifts preceded a rally in the NDX 100 ETF (QQQ) 79% of the time over the subsequent two months
- Alphabet and Amazon also triggered volatility reversal buy signals
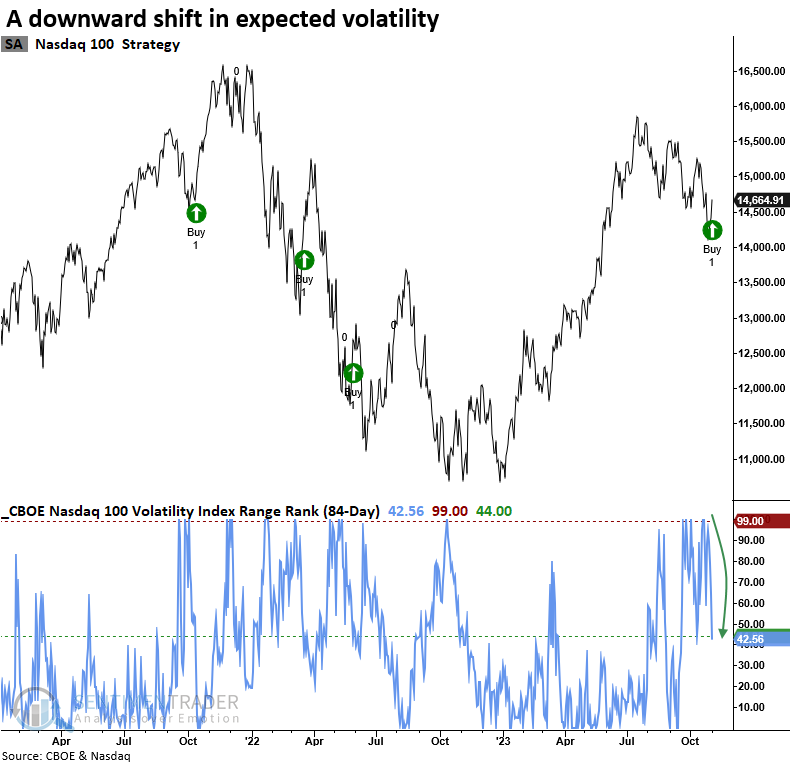
A bullish shift in volatility for a popular Nasdaq index
In a recent note, I shared a buy signal for a trading model that uses the CBOE Volatility Index (VIX) to assess when 30-day expected volatility increases, indicating fear, and subsequently shifts downward. While that alert was premature, other volatility indexes are now confirming a potential lower expected volatility regime.
The CBOE Volatility Index (VXN) for the Nasdaq 100 Index increased to the highest level in 84 trading sessions. Subsequently, it reversed lower, triggering a buy signal for the Nasdaq 100, which one can conveniently trade using the QQQ ETF.
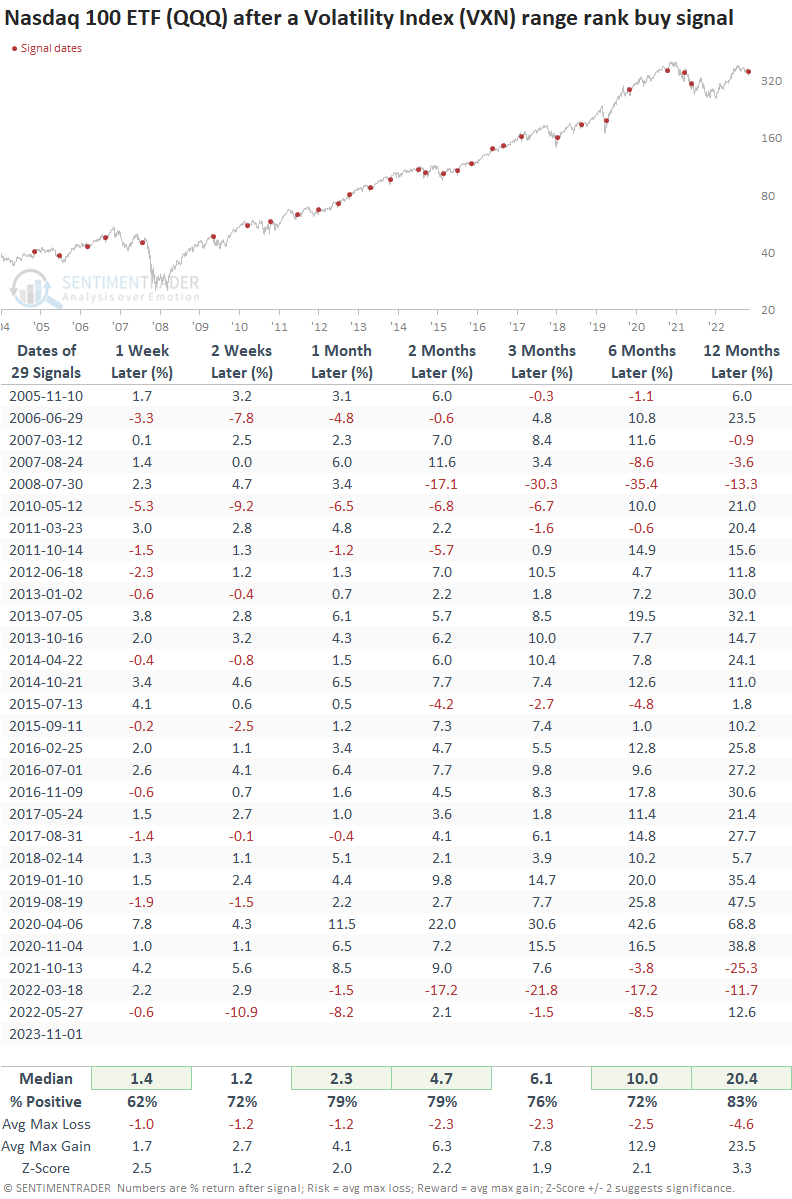
Similar volatility reversals preceded positive returns
When the 84-day range rank of the Volatility Index (VXN) cycles from 100% to less than 44% and index momentum is positive, the downward shift in expected volatility tends to produce bullish outcomes for the Nasdaq 100 ETF (QQQ). Over the subsequent two and three-month periods, the heavily traded ETF was higher 79% of the time.
While it's true that volatility alerts like this one can encounter difficulties in prolonged bear markets, they have consistently shown their profit potential in countertrend rallies. In 2008 and 2022, the signals produced gains within the first two months.
Other volatility signals
The CBOE provides volatility indexes for several popular stocks like Alphabet, Amazon, and Apple. On Wednesday, Alphabet triggered its first range rank buy signal since October 2021.
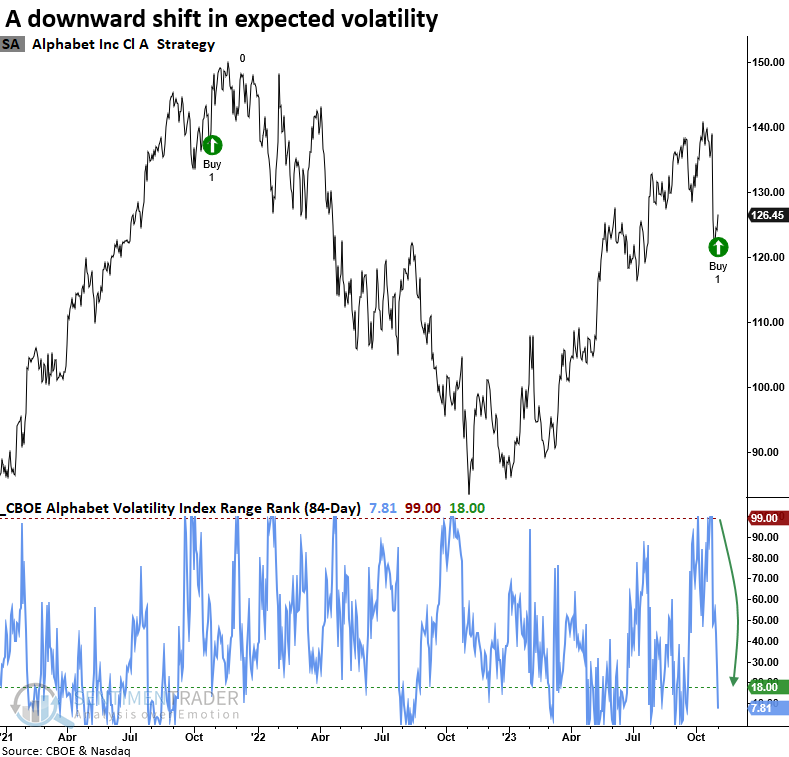
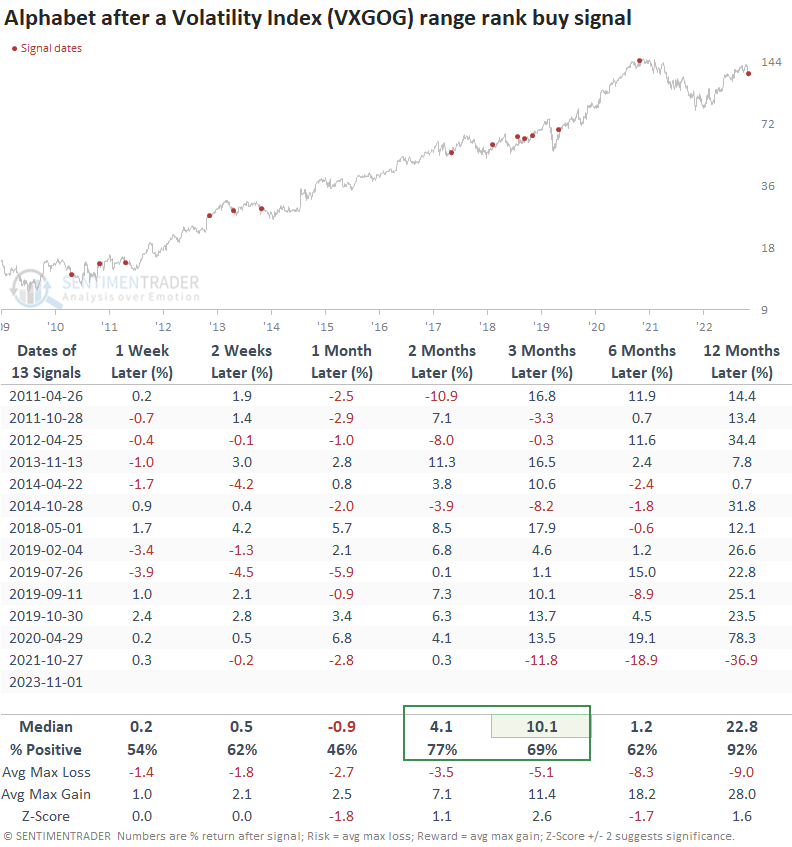
Volatility signals in Alphabet tend to struggle in the first month. However, after the dust settled, the stock showed solid returns, win rates, and z-scores over the subsequent two and three-month time frames.
The range rank system initiated a buy signal for Amazon last Friday after its volatility index reversed from an elevated level.
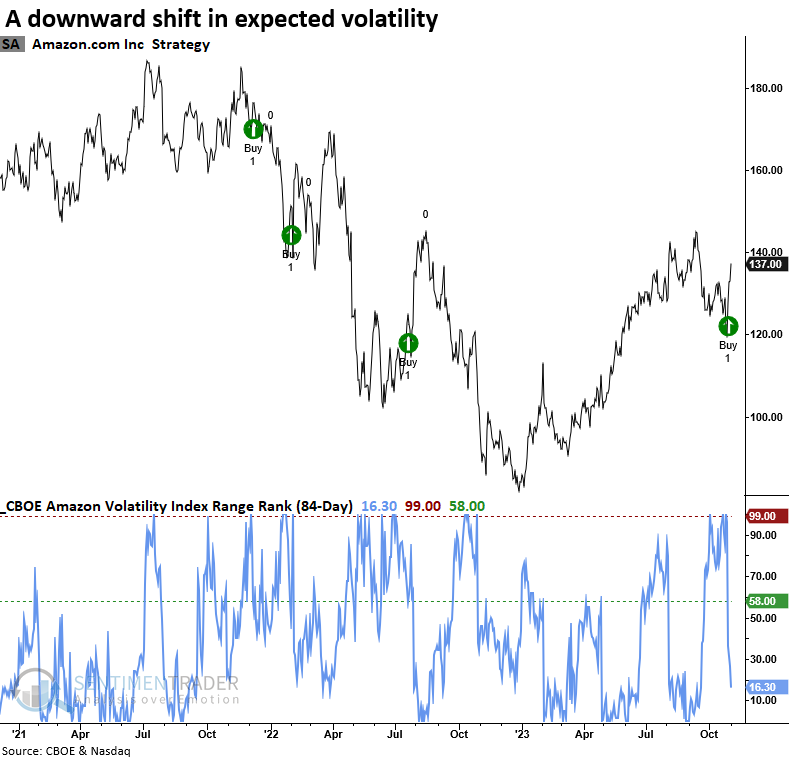
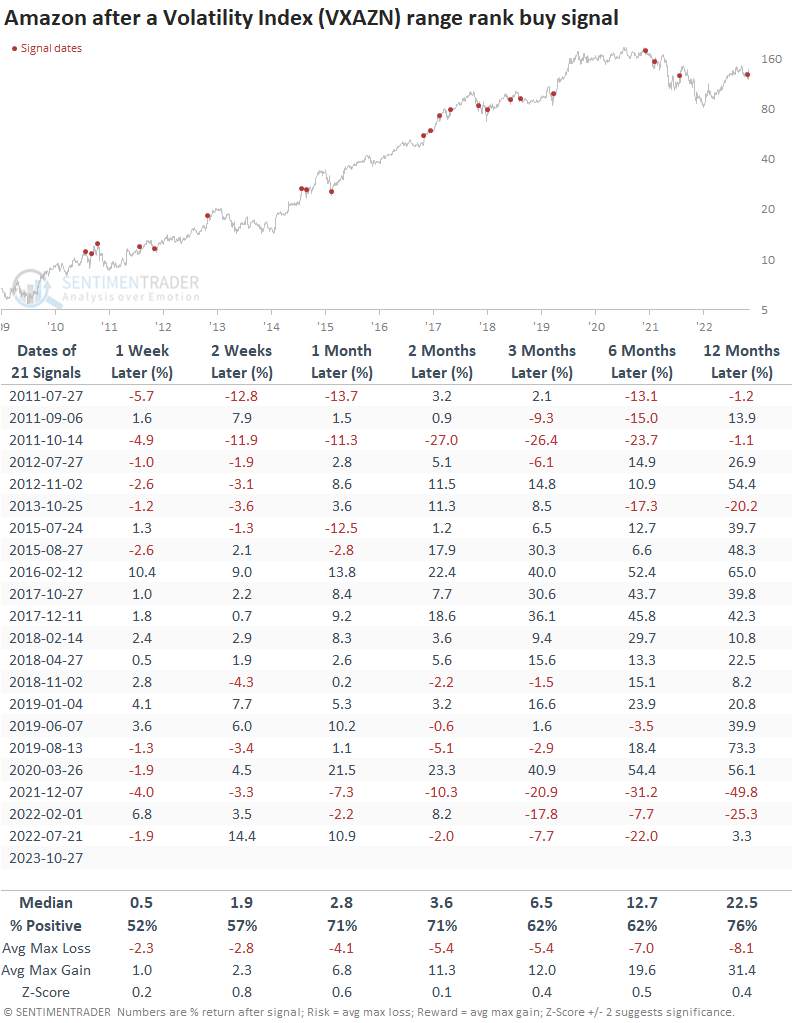
Whenever the range rank for Amazon's Volatility Index cycled from 100% to less than 58%, and price momentum was positive, the stock tended to trend upward. However, like the index signals, stocks are susceptible to whipsaw signals during protracted downtrends.
What the research tells us...
As markets transition from bearish to bullish conditions, volatility is typically one of the first indicators to flash a potential turning point, given its mean-reverting nature. However, because it's susceptible to whipsaws, traders should always incorporate other measures like breadth and price trend indicators into a weight-of-evidence approach. The Volatility Index (VXN) for the Nasdaq 100, a measure of 30-day expected volatility, increased to the top of its 84-day range and reversed lower, triggering a bullish signal for a Technology-oriented index. Similar alerts produced excellent outcomes for the Nasdaq 100 ETF (QQQ) over all time horizons. Volatility indexes for Alphabet and Amazon also reversed lower, triggering buy signals for two of the Big 7 stocks.
Indicators at Extremes
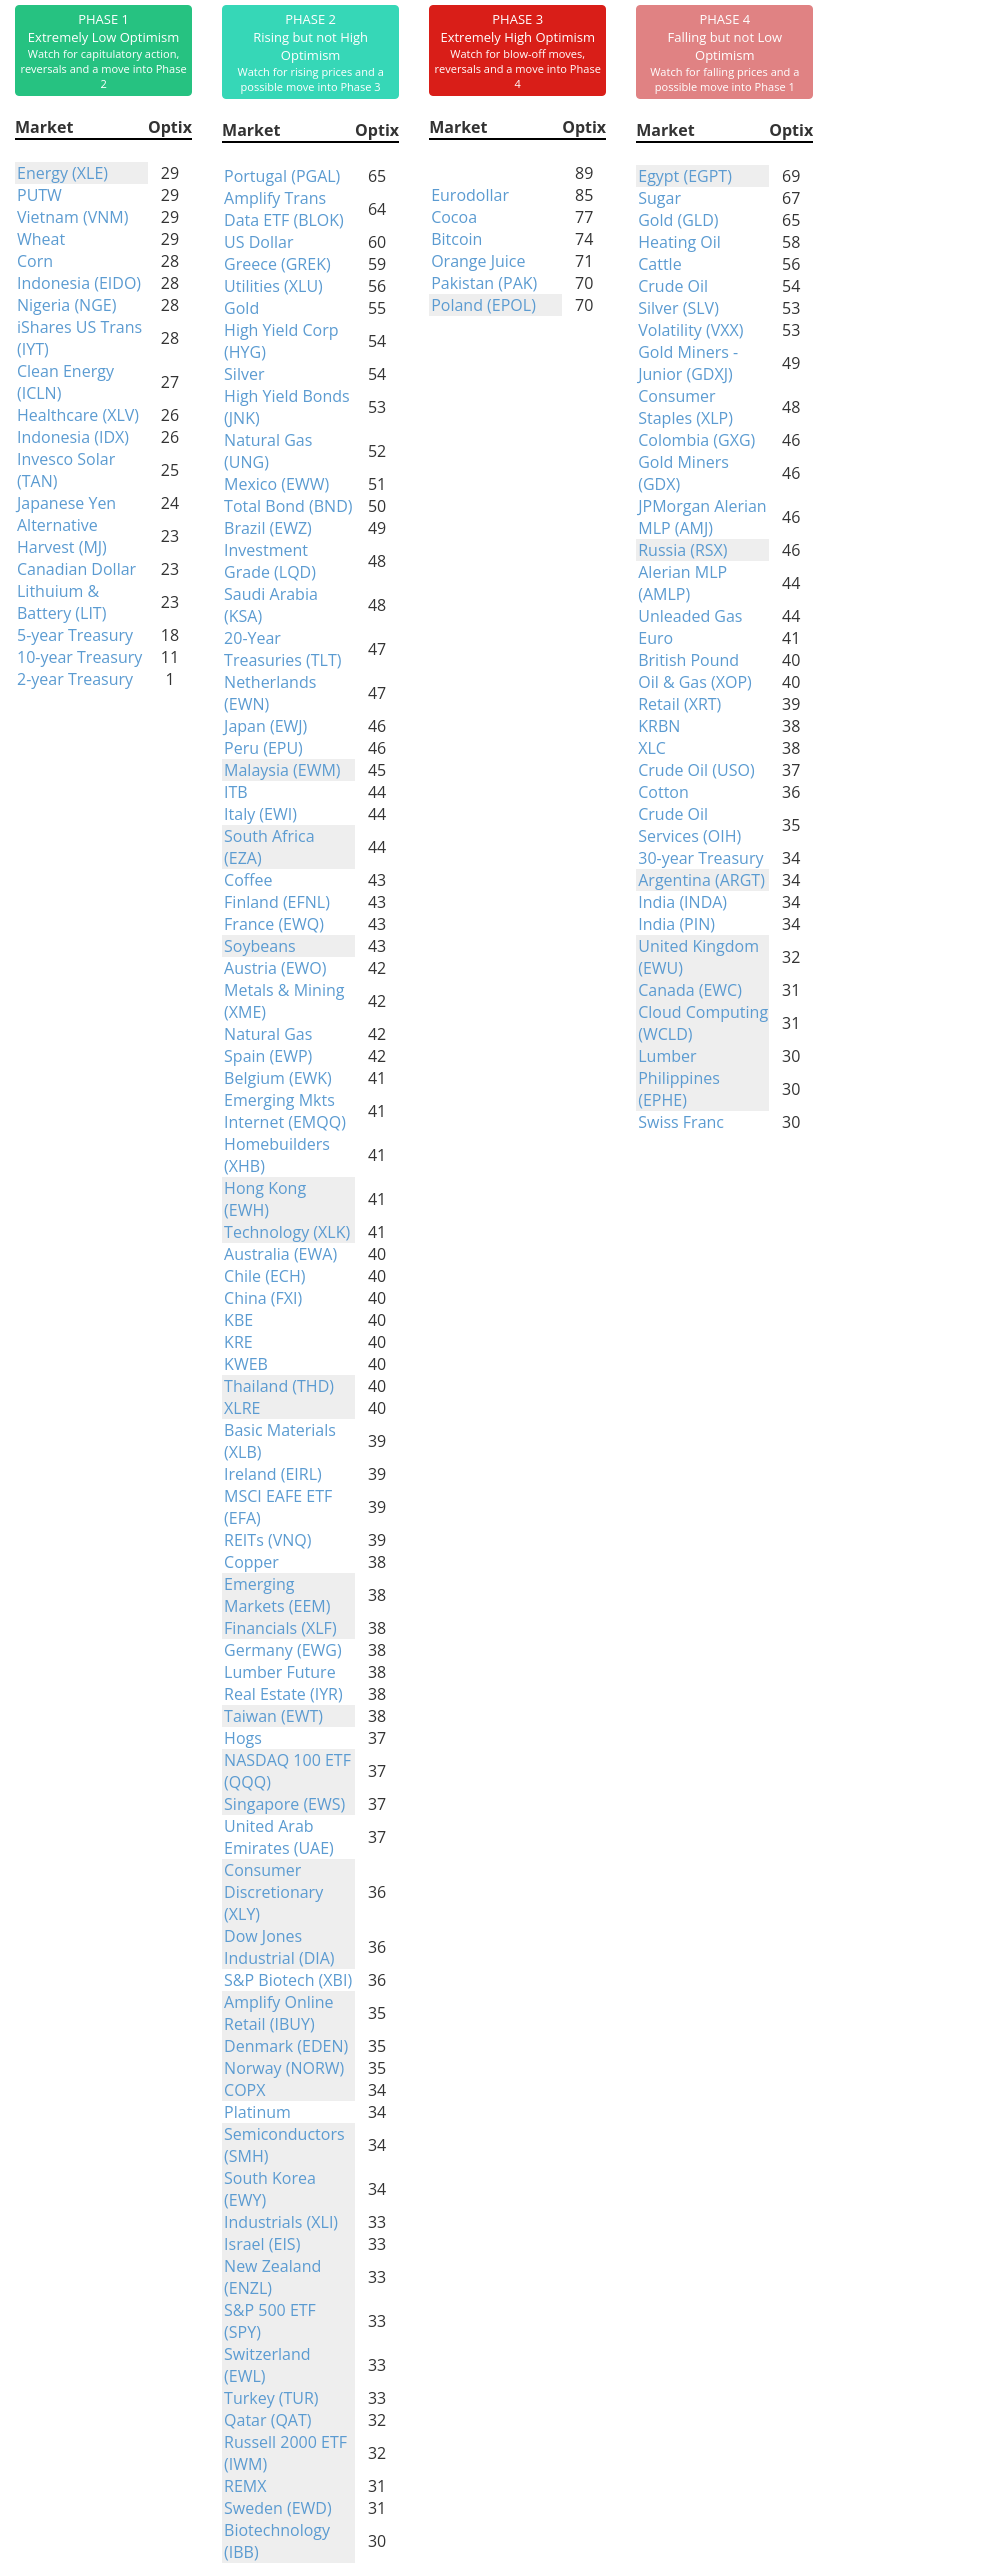
Phase Table
Ranks
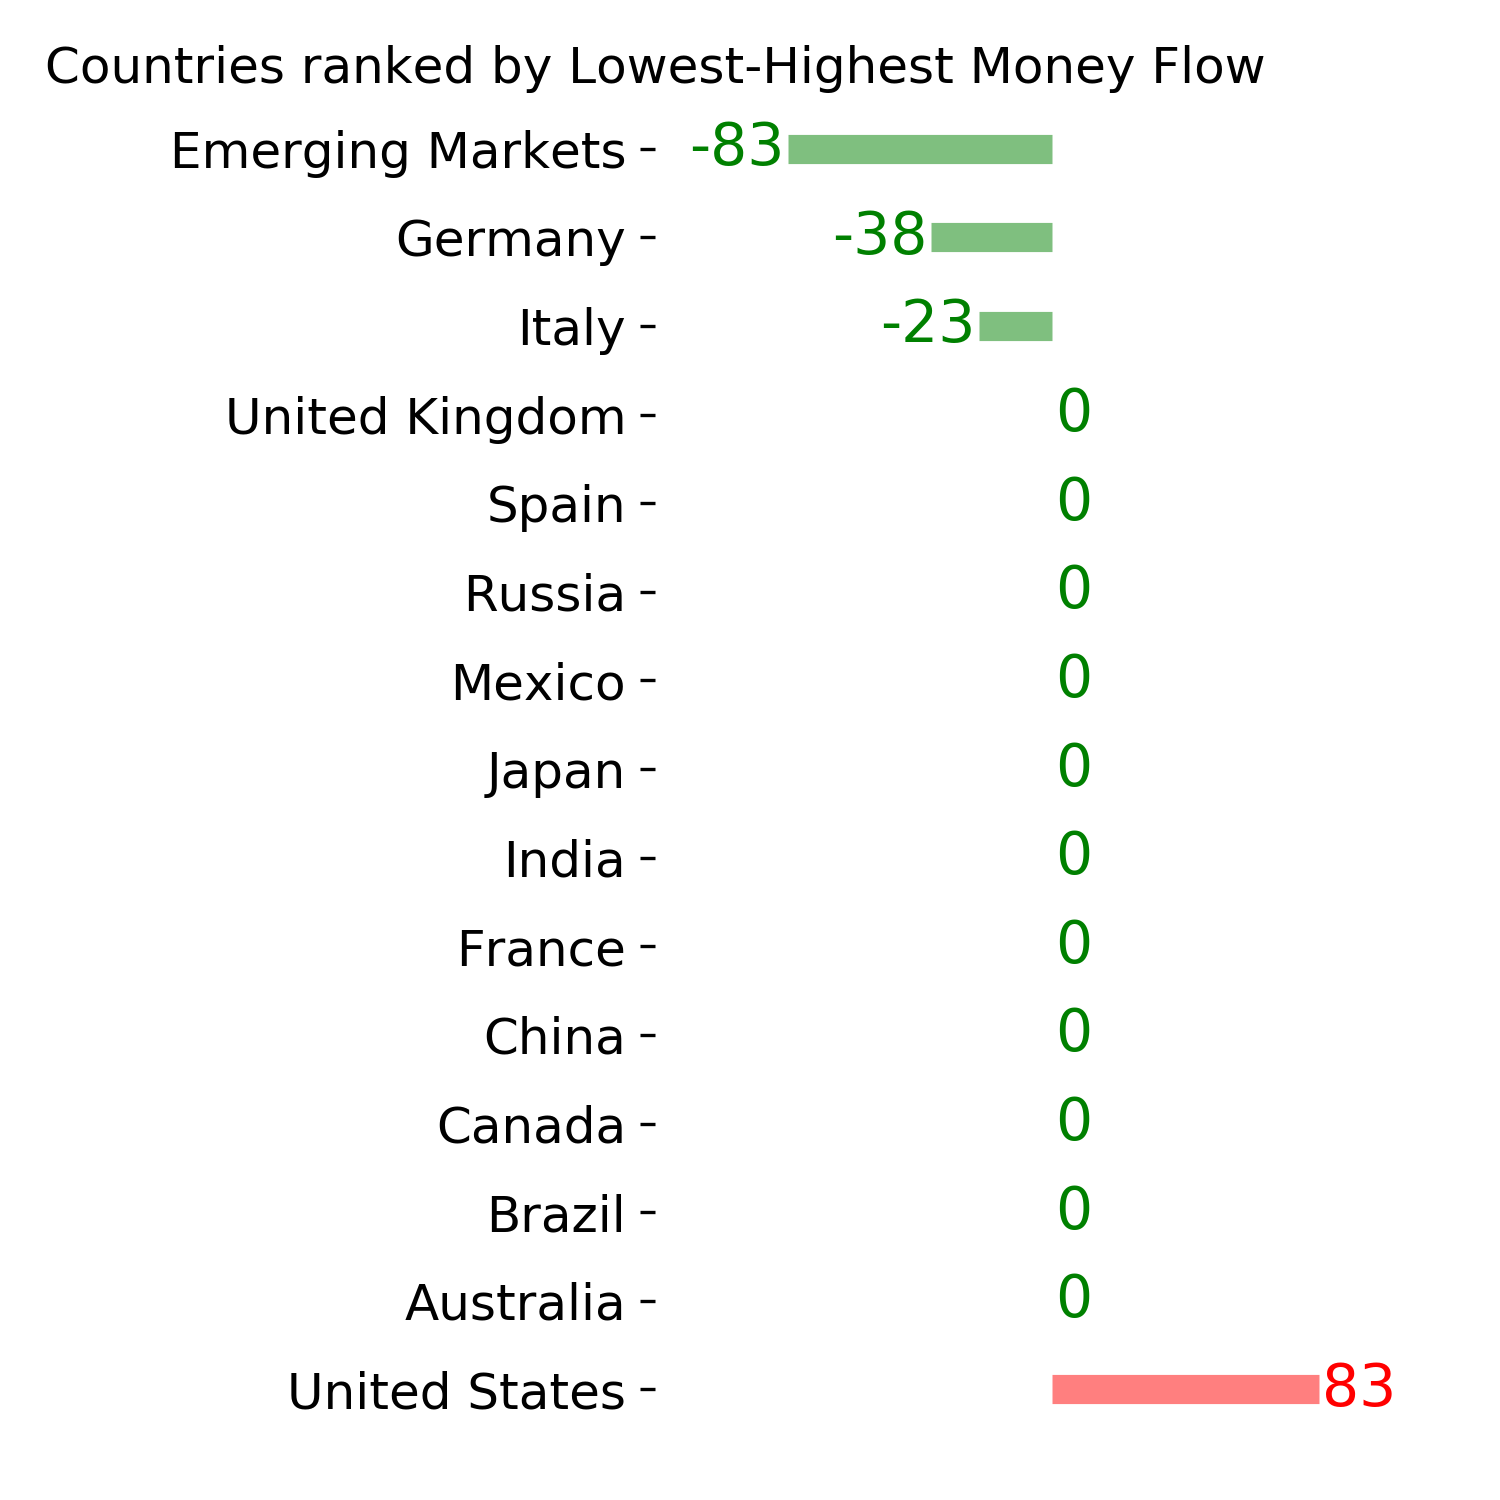
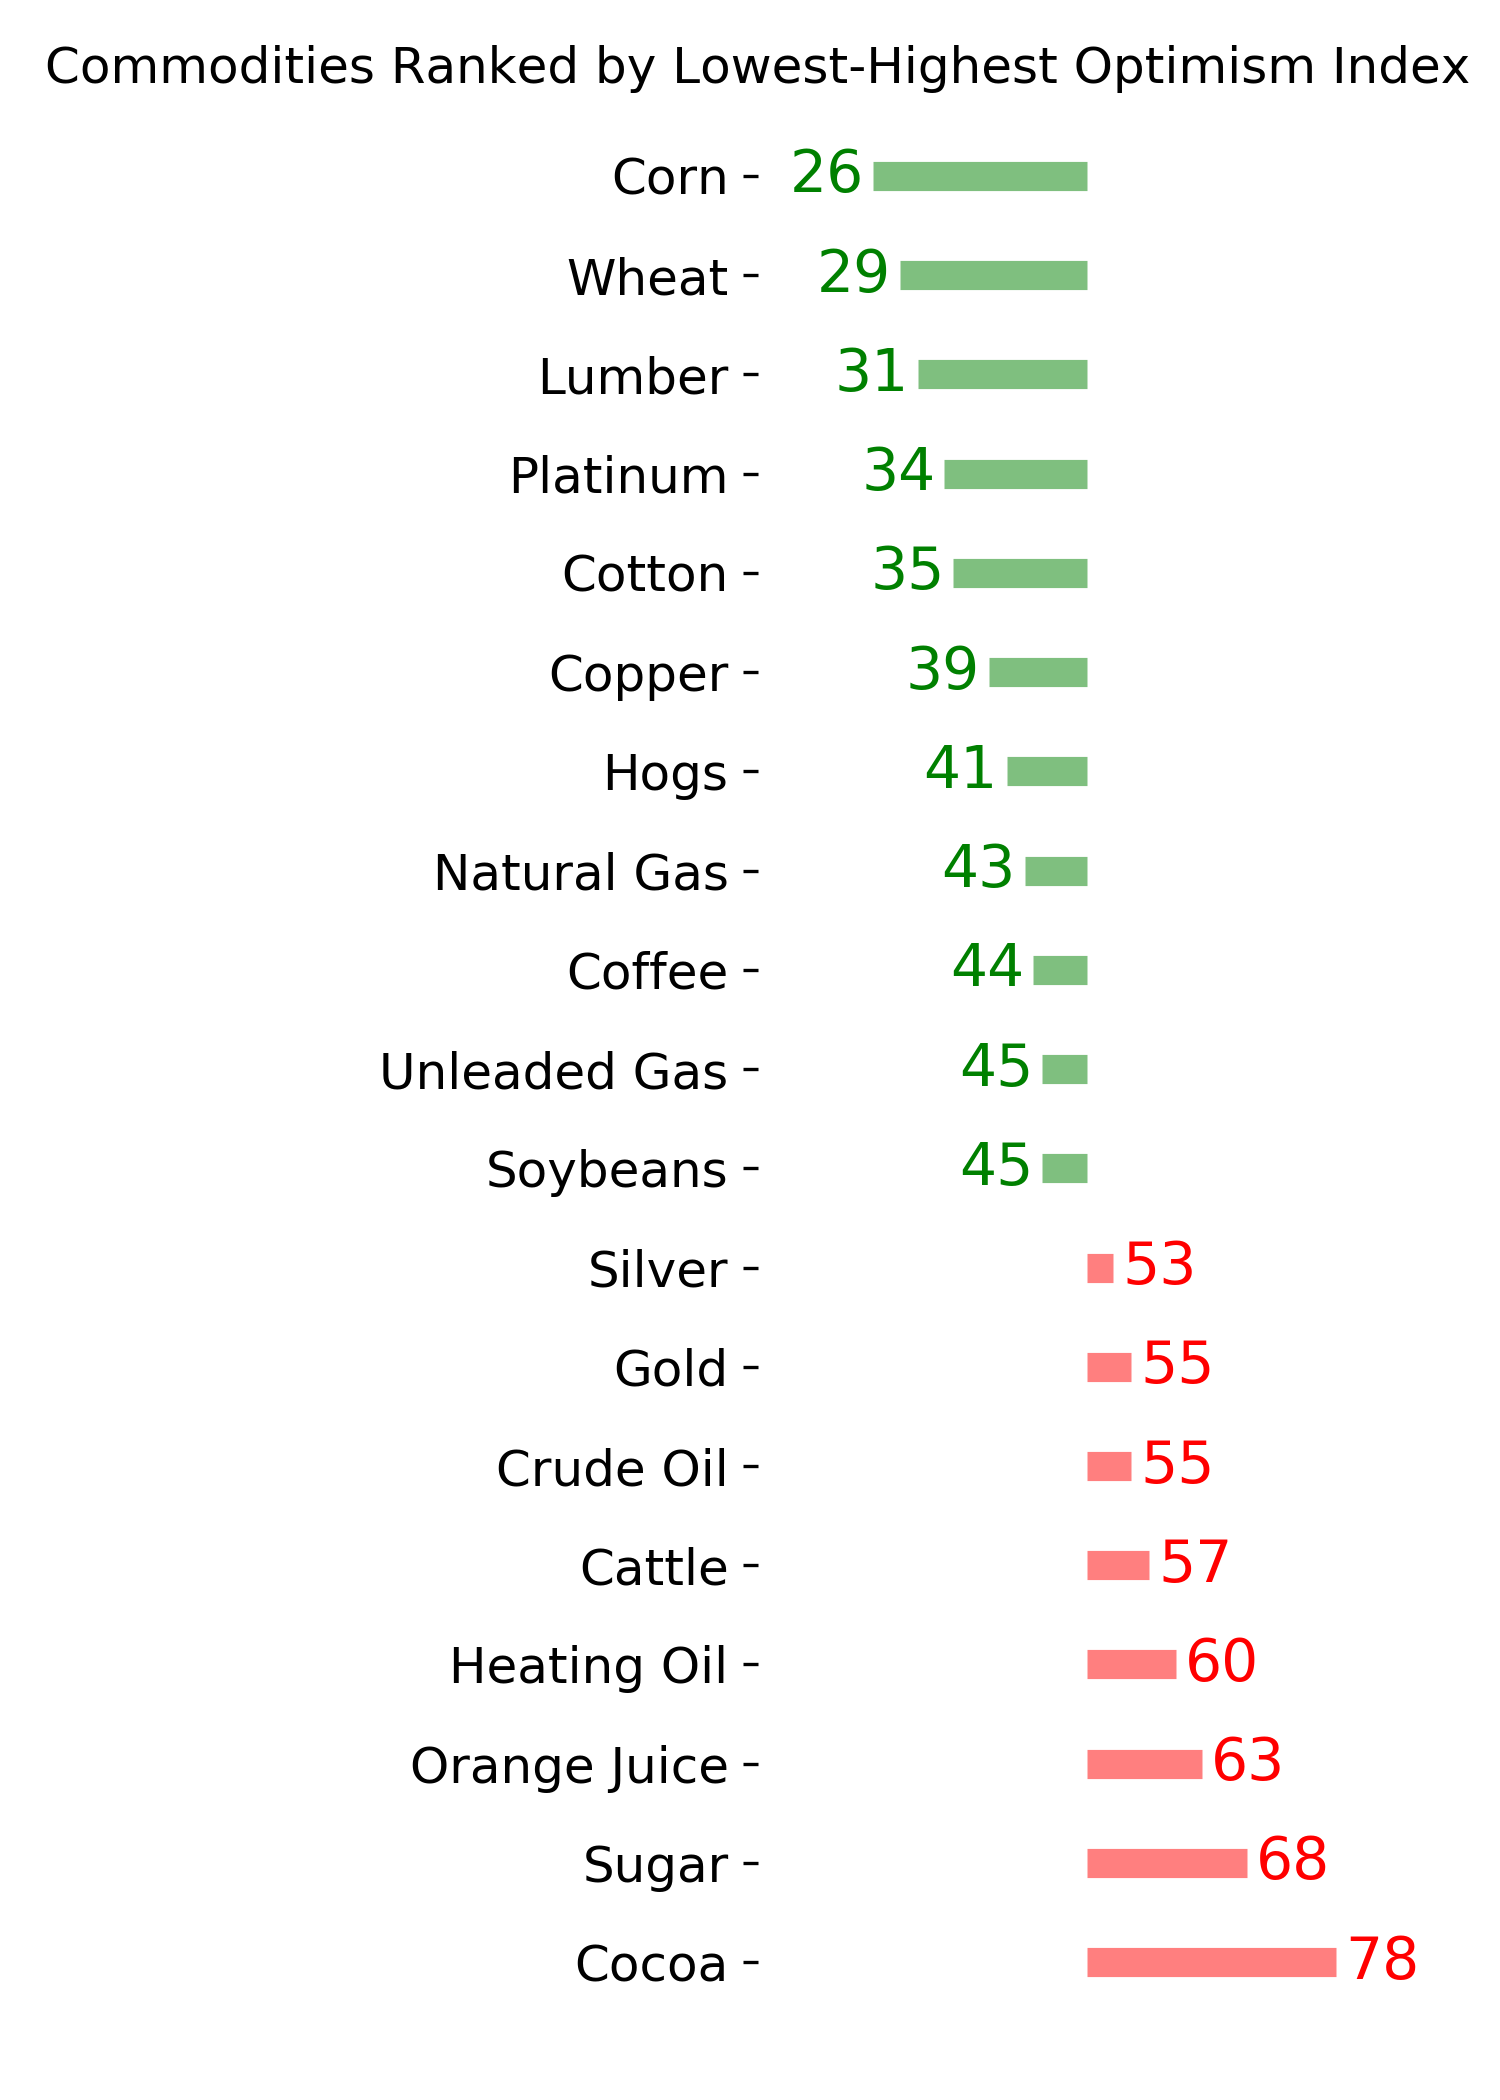
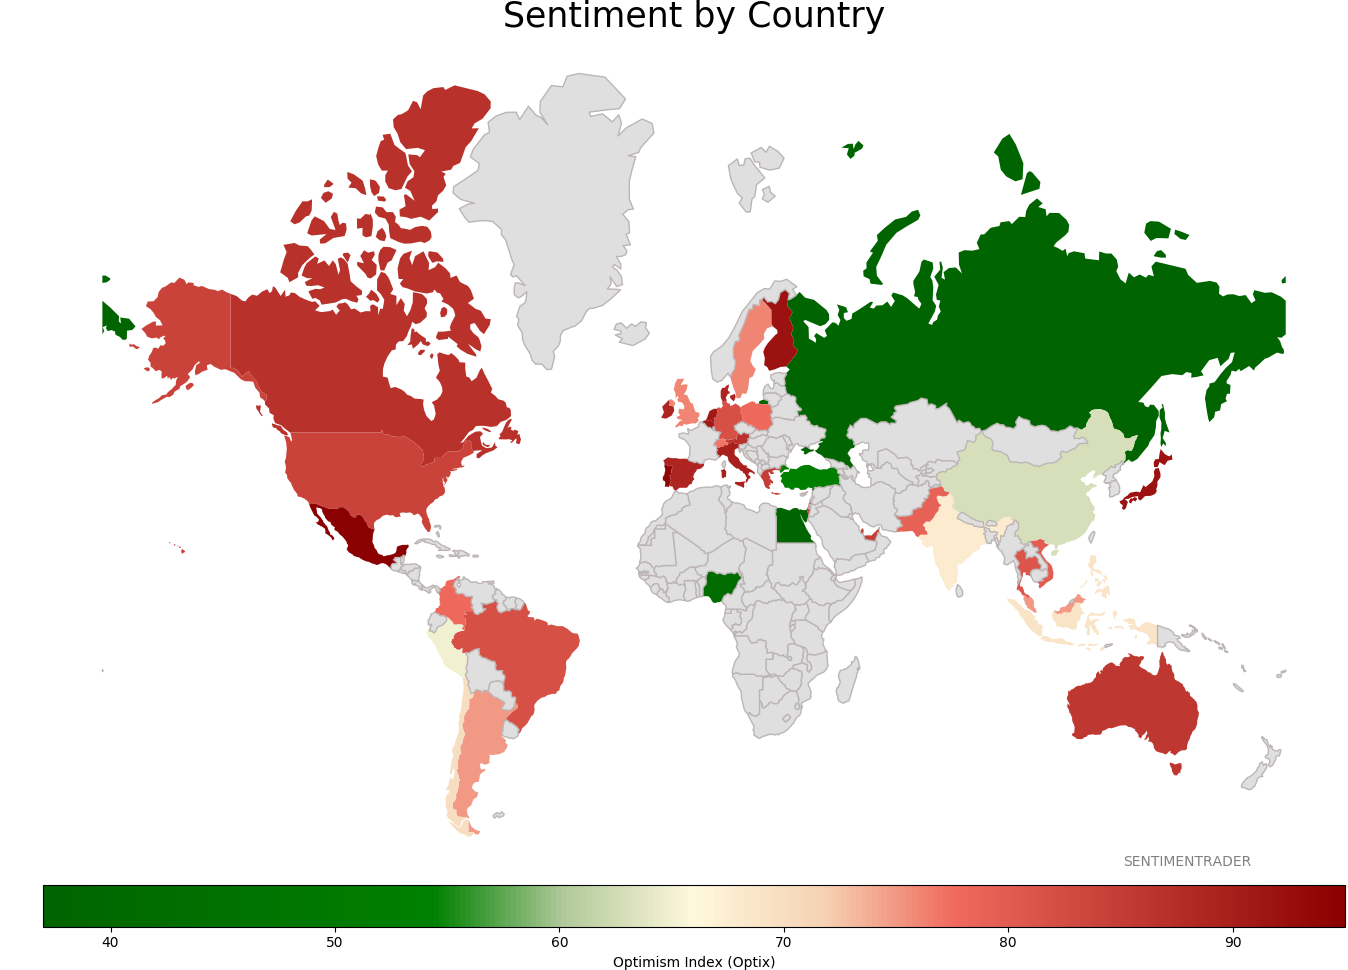
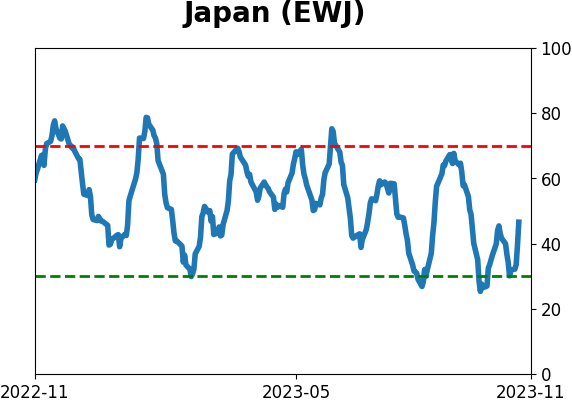
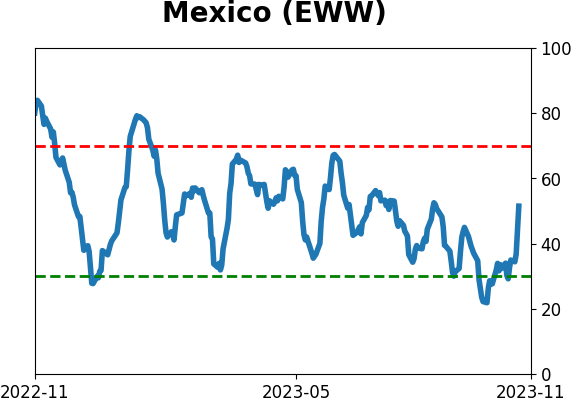
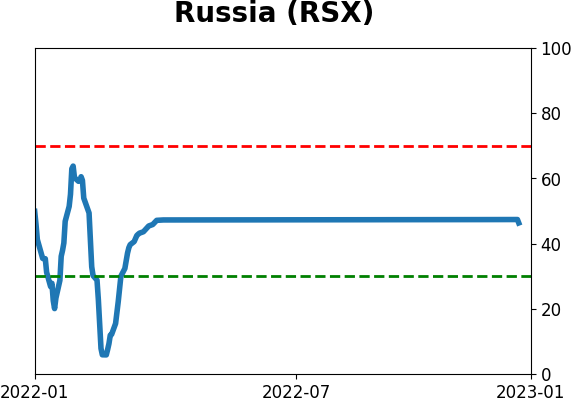
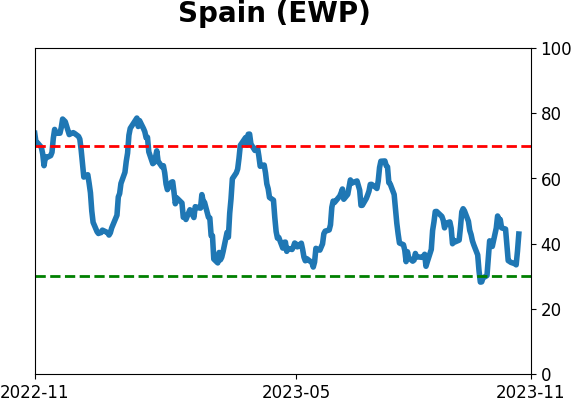
Sentiment Around The World
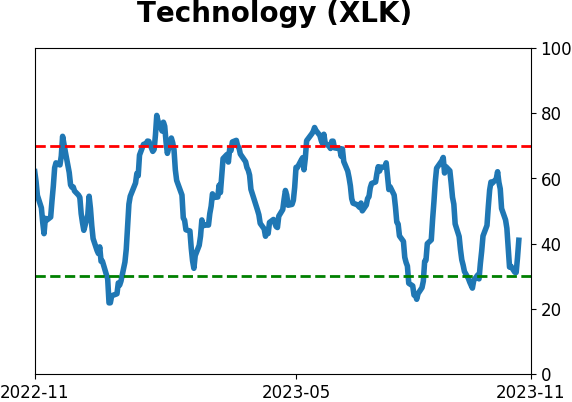
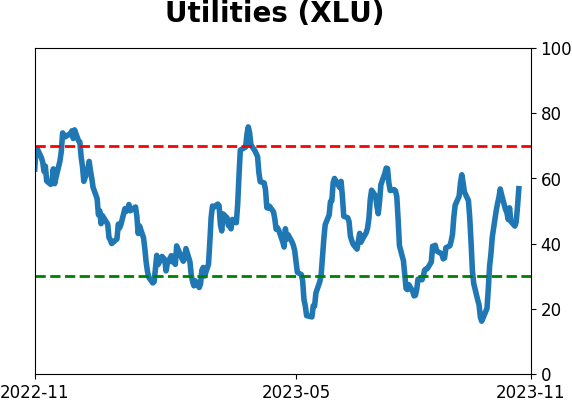
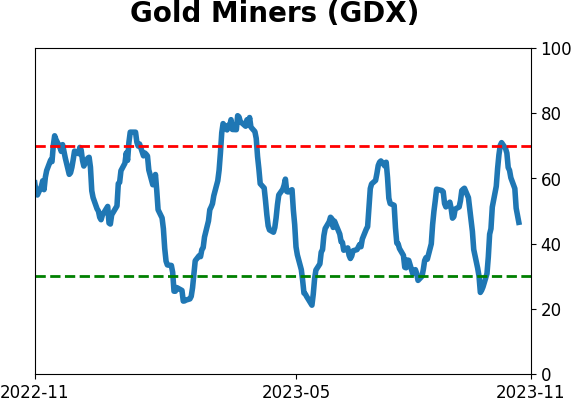
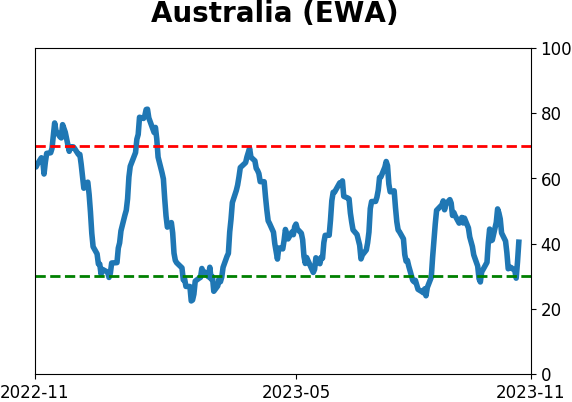
Optimism Index Thumbnails
|
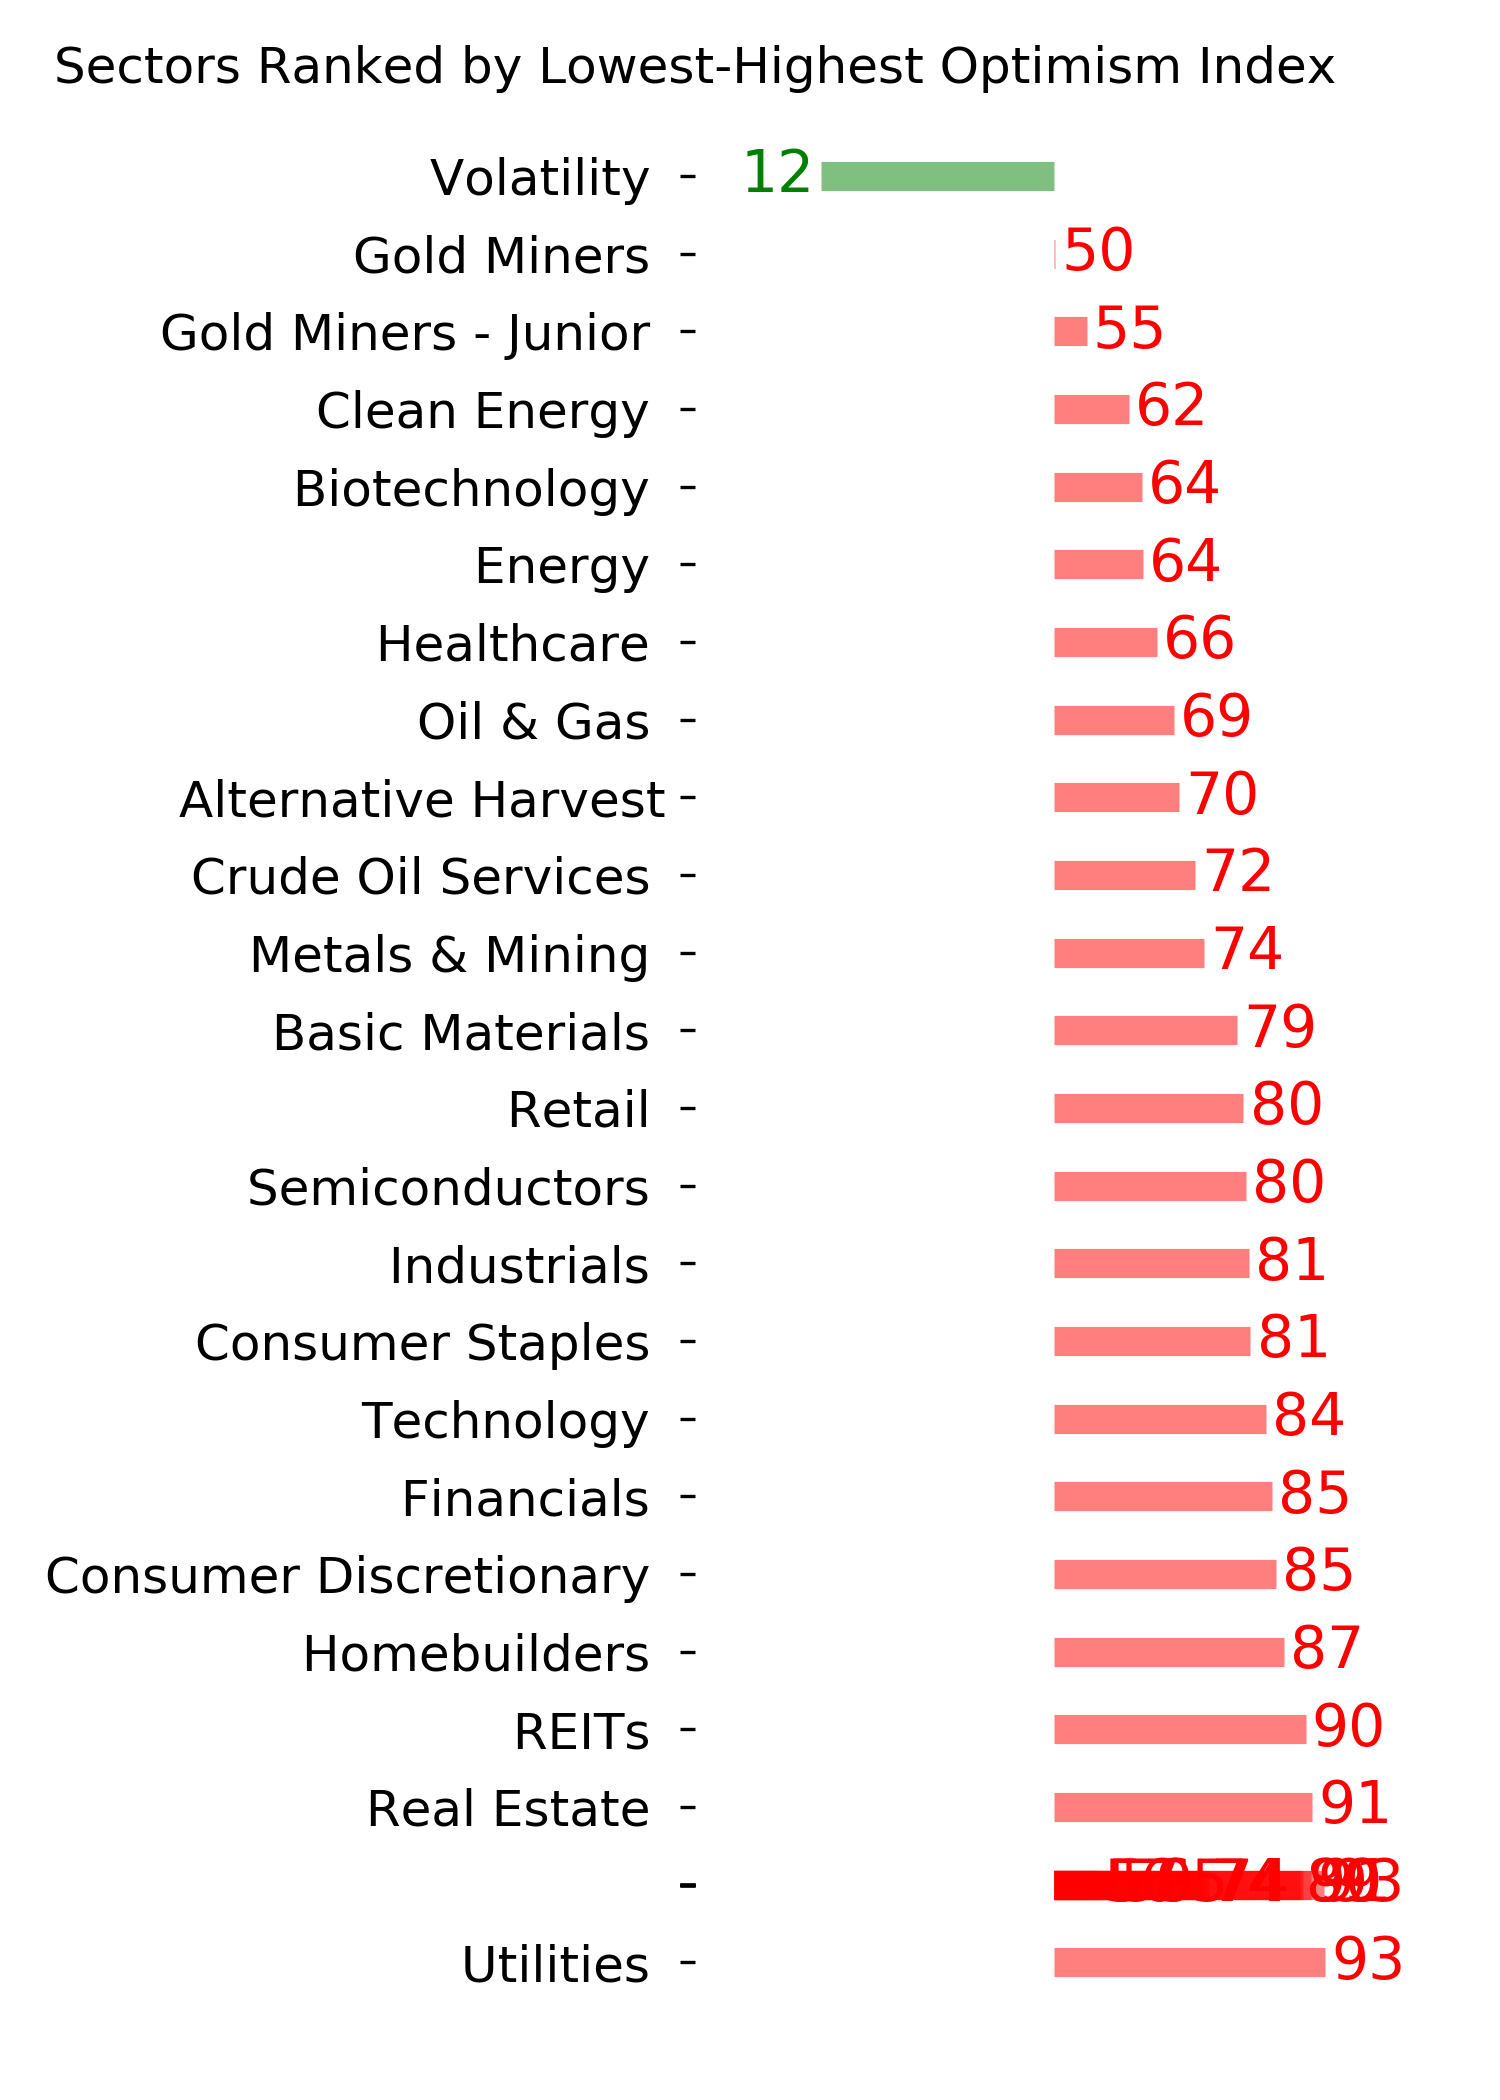
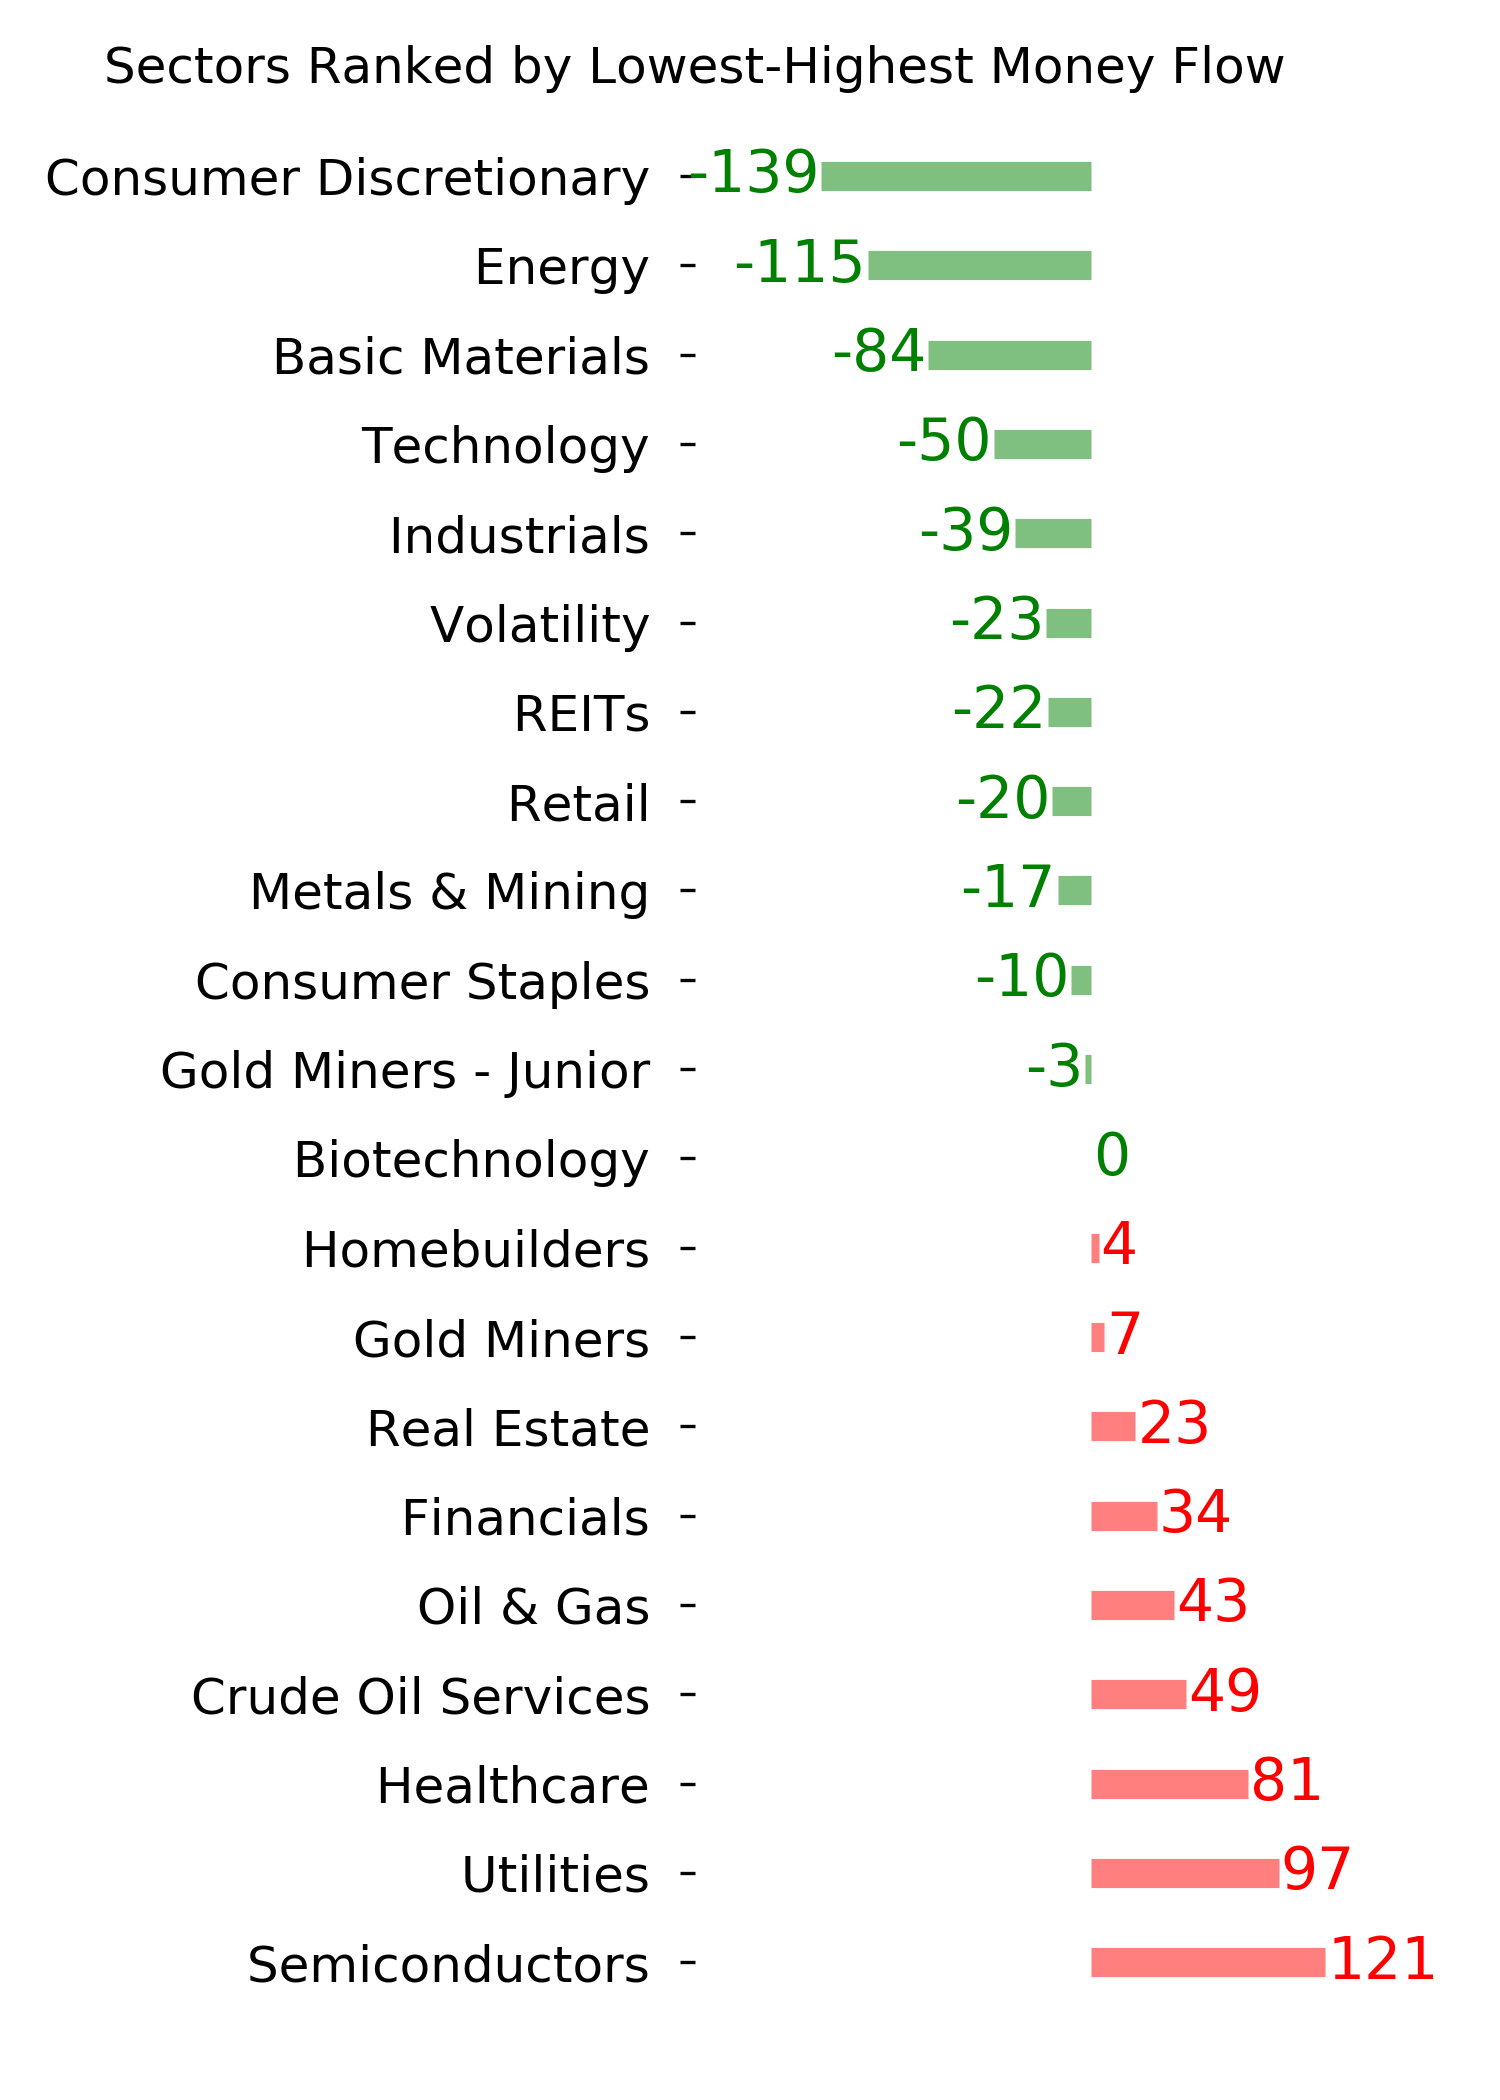
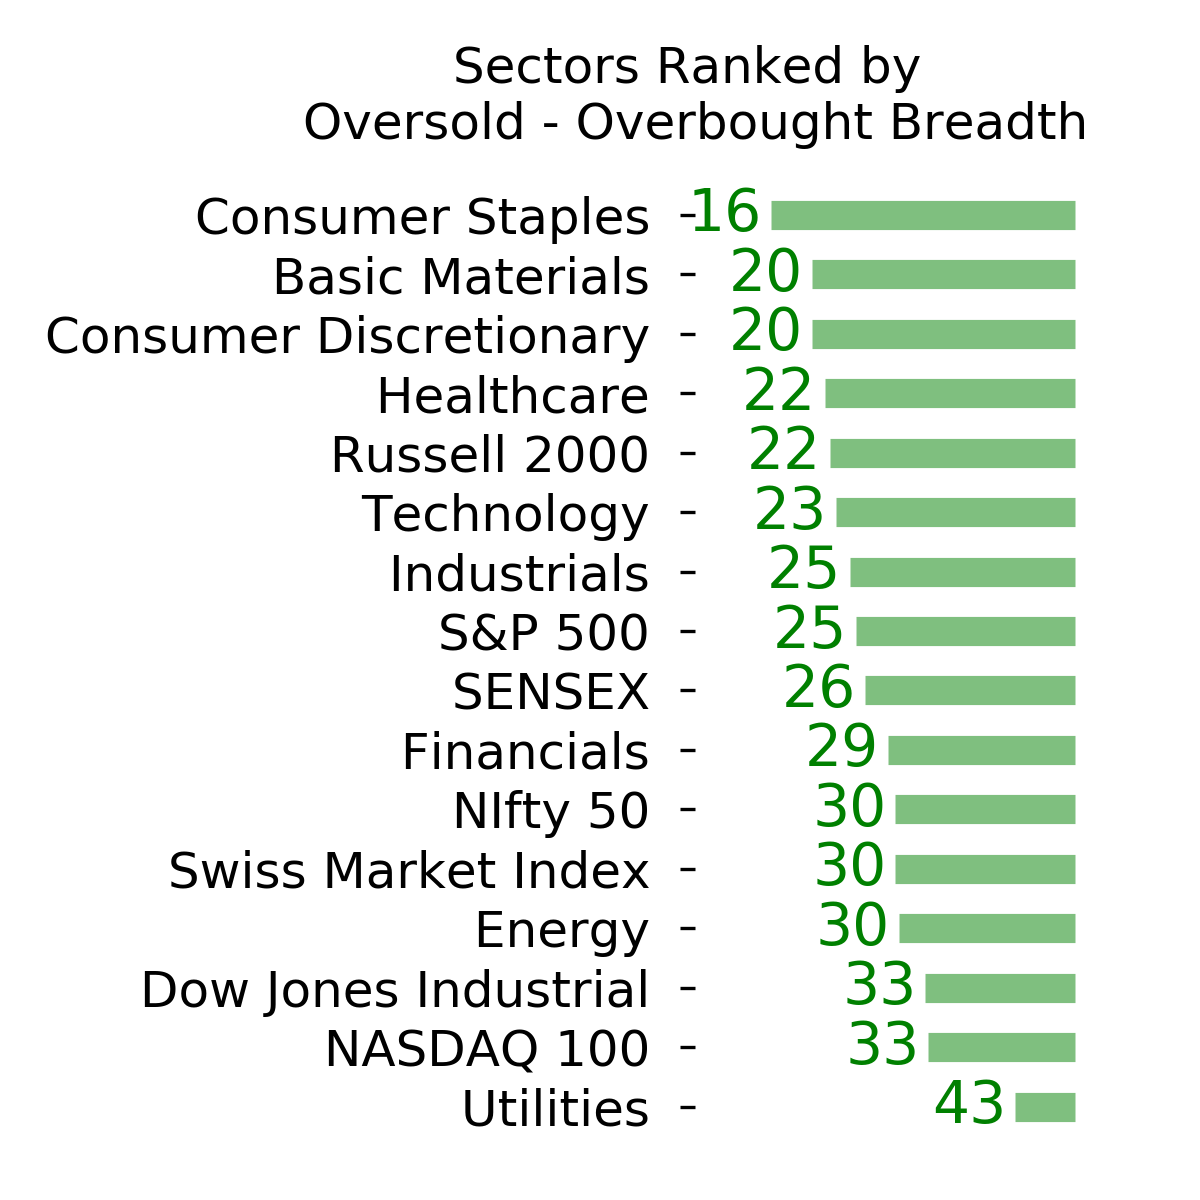
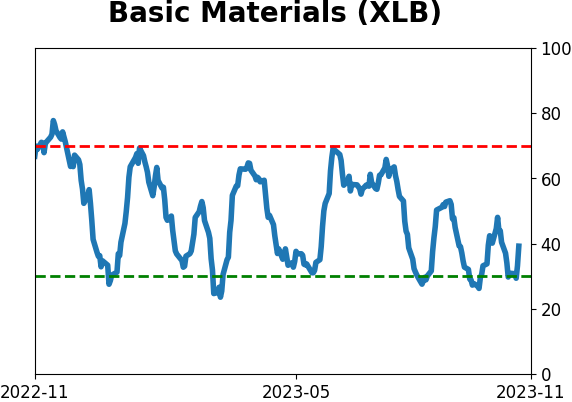
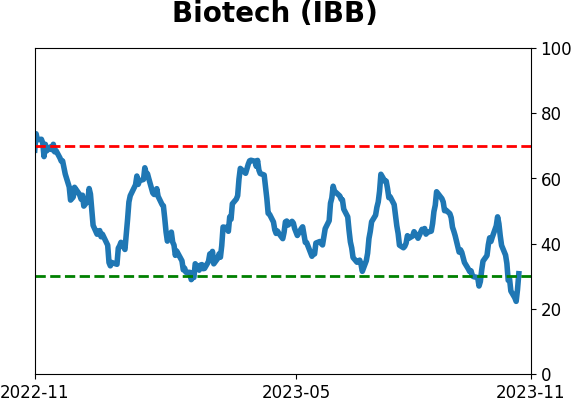
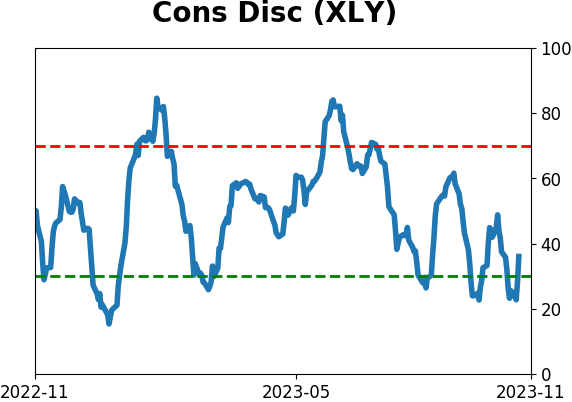
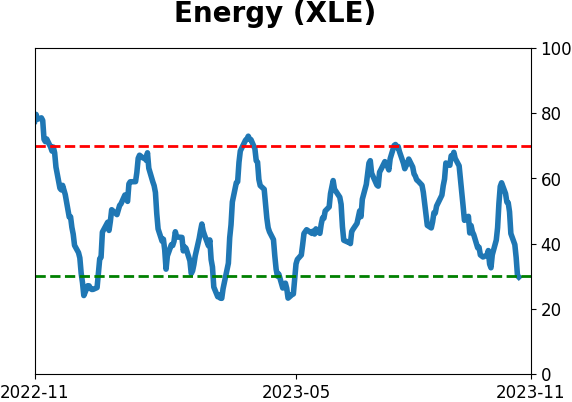
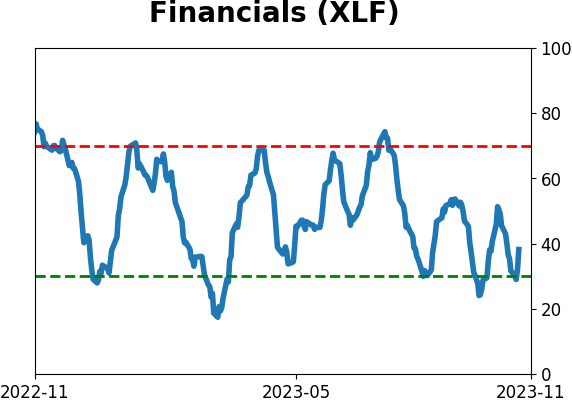
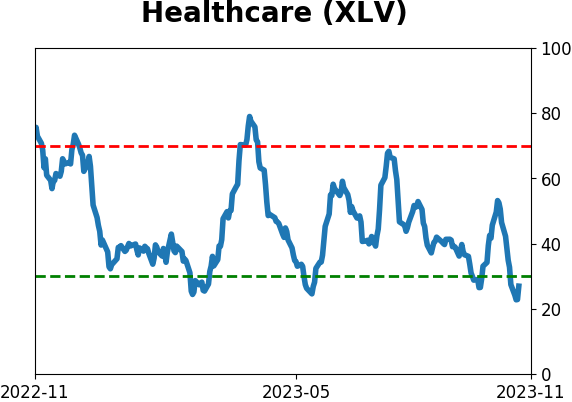
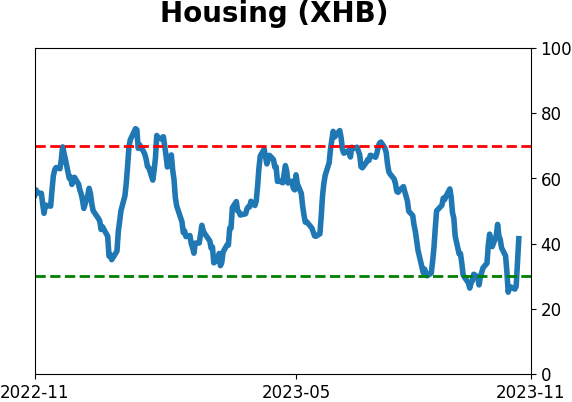
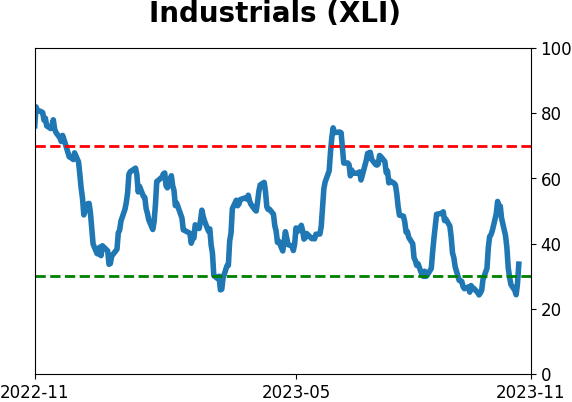
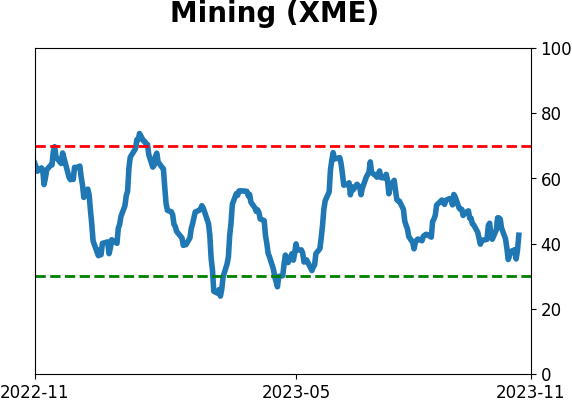
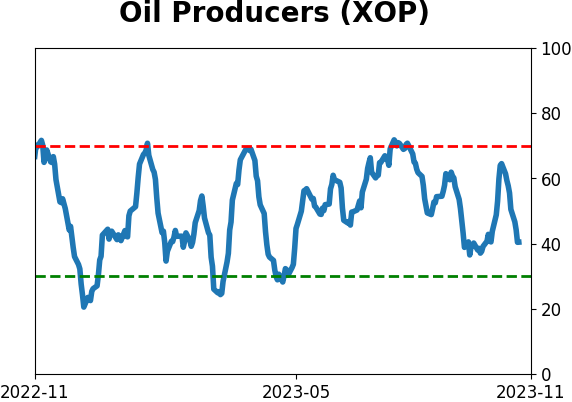
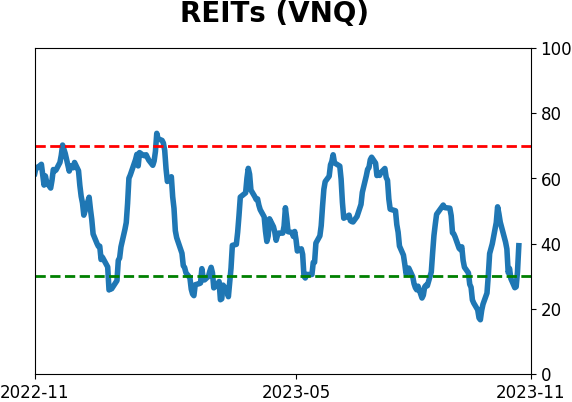
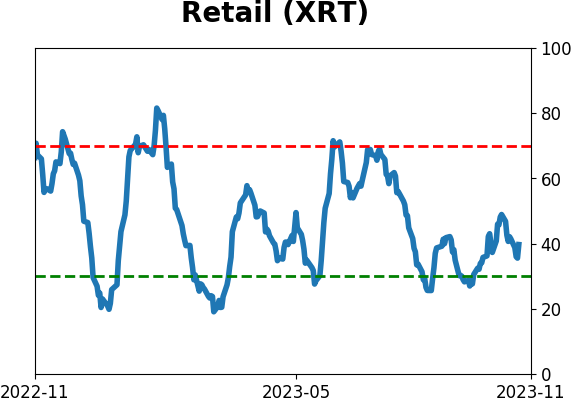
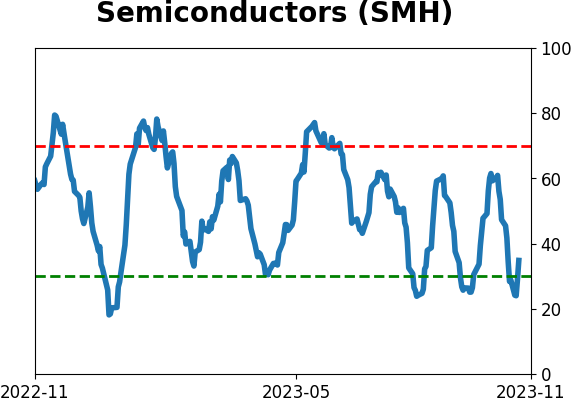
Sector ETF's - 10-Day Moving Average
|
|
|
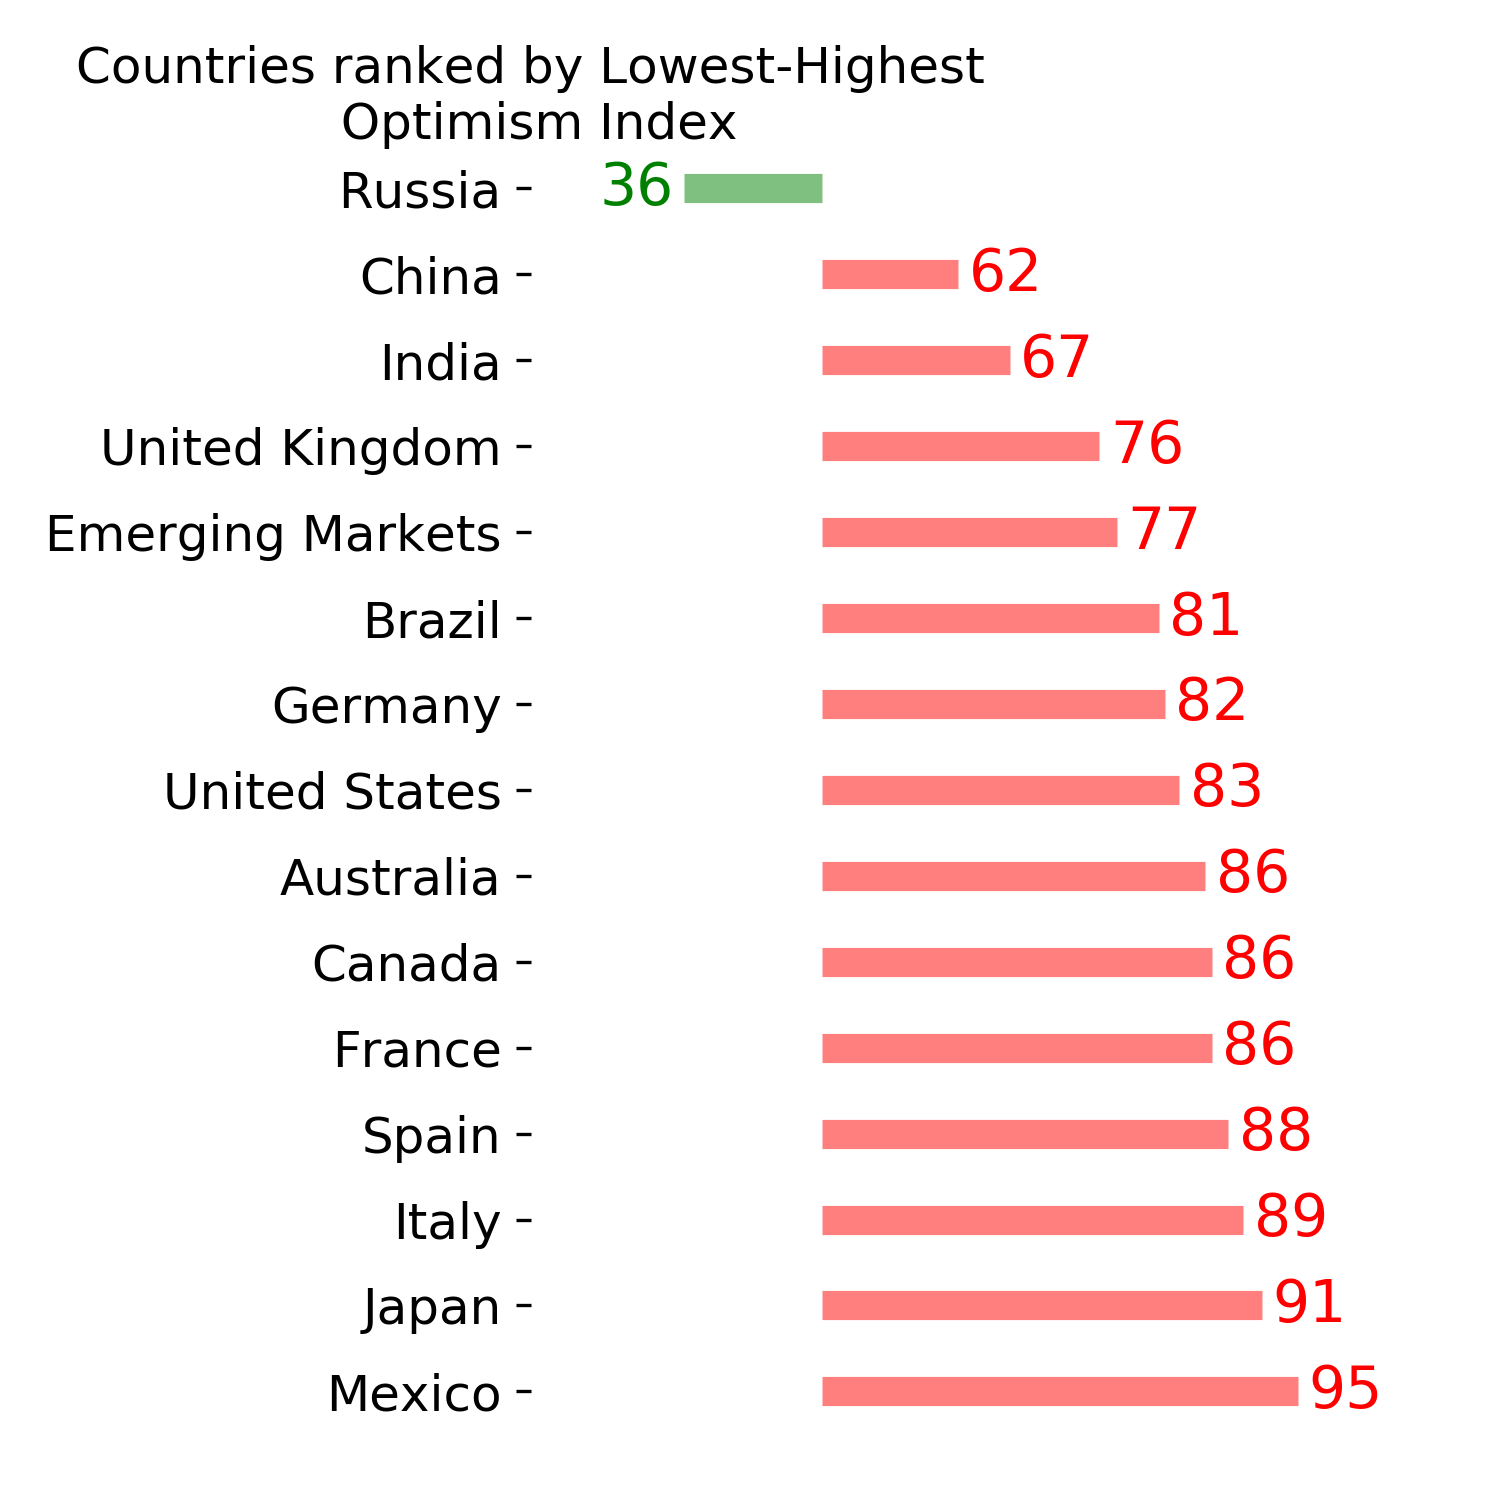
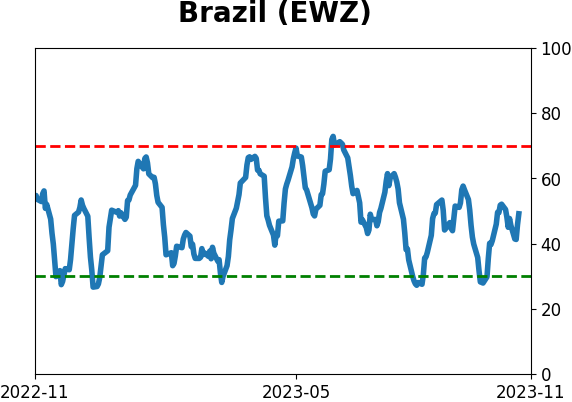
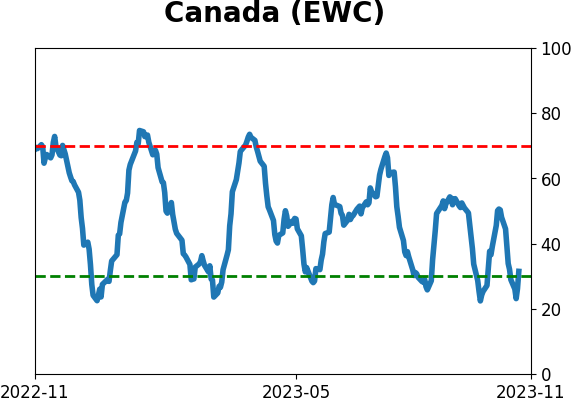
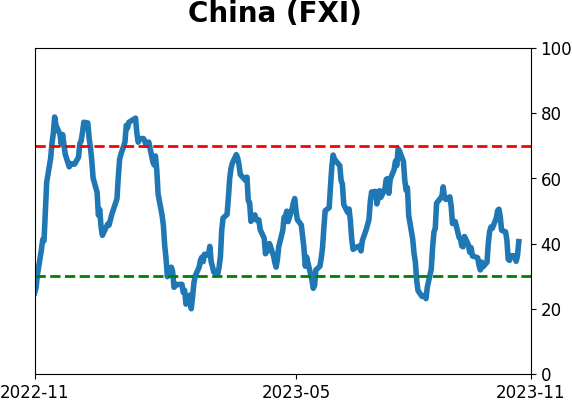
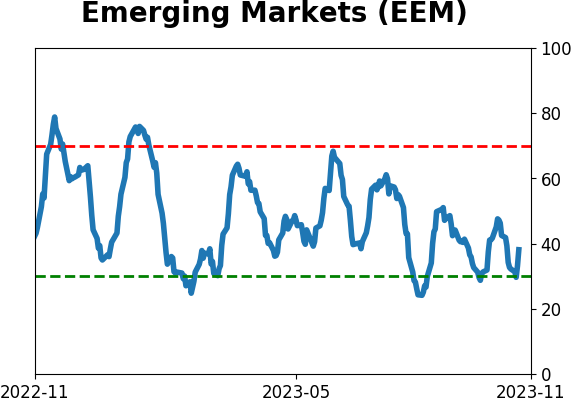
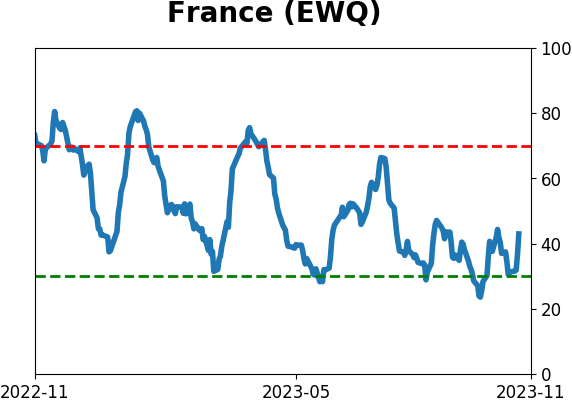
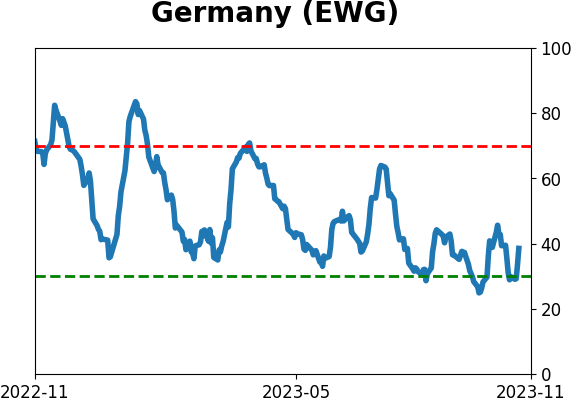
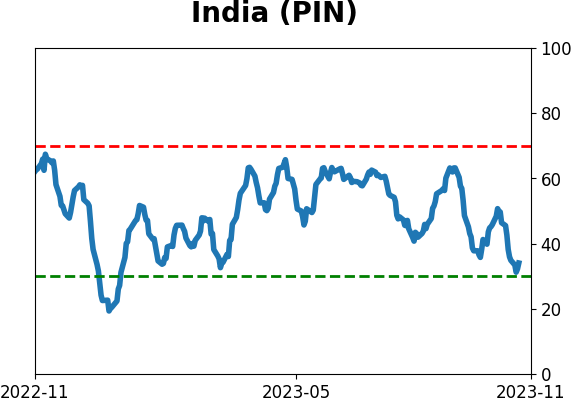
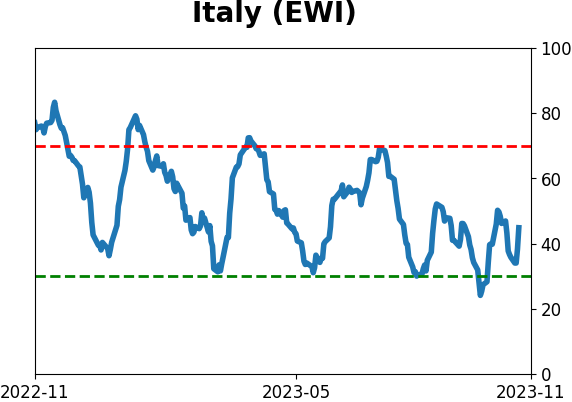
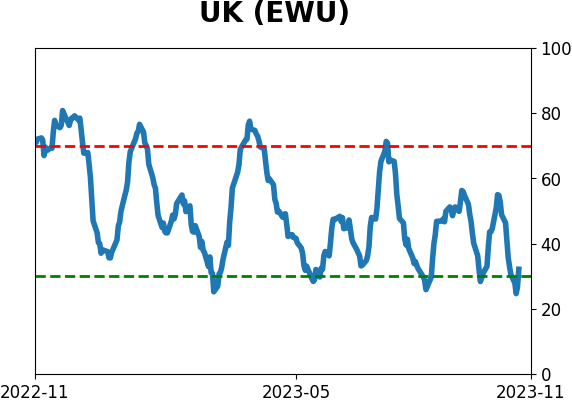
Country ETF's - 10-Day Moving Average
|
|
|
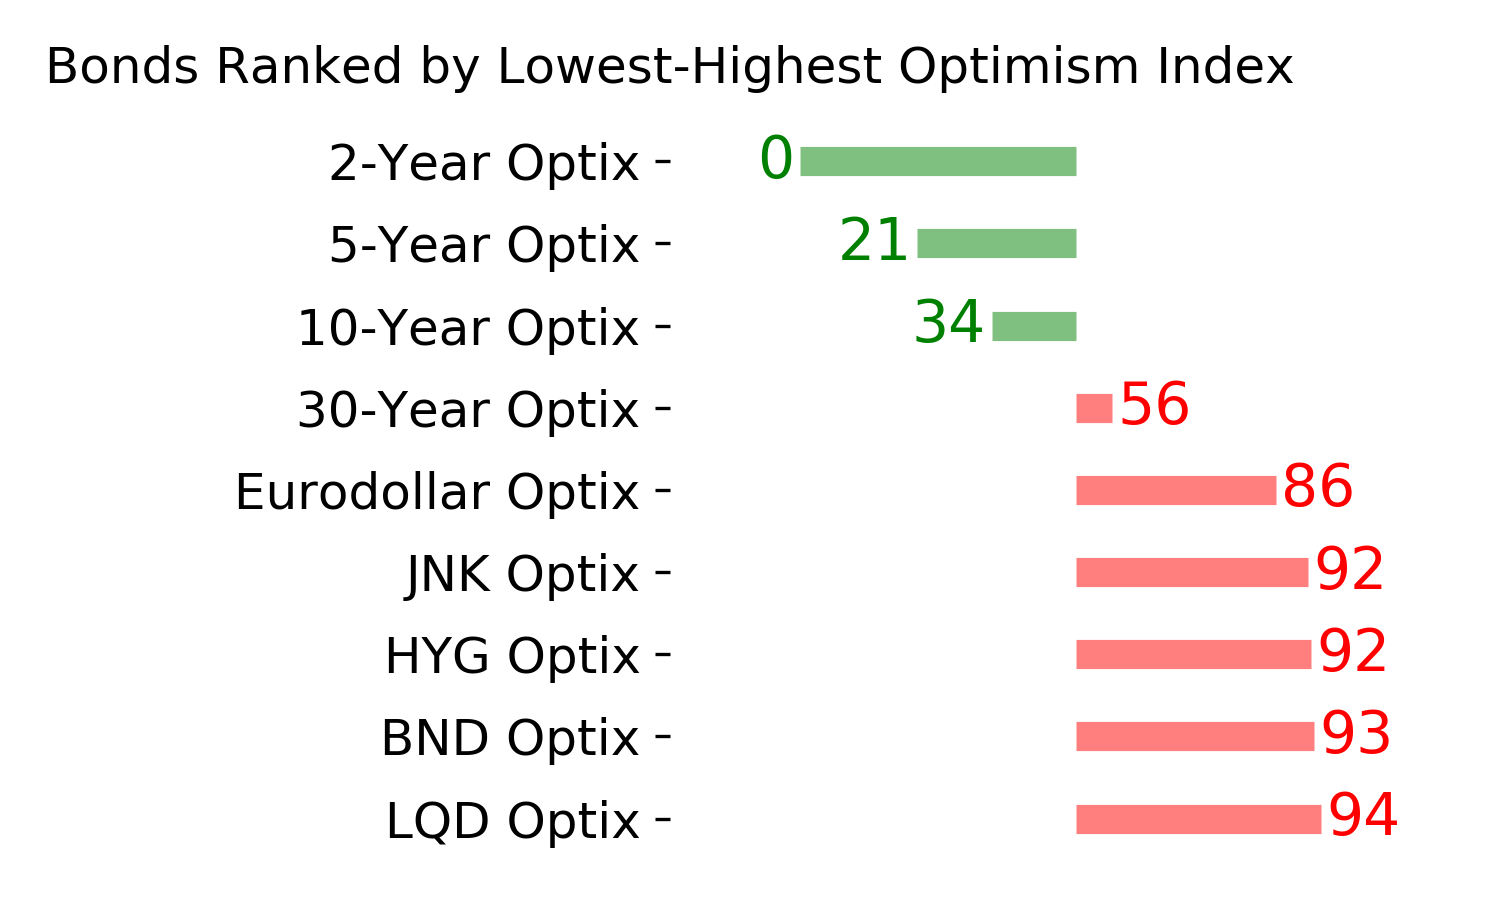
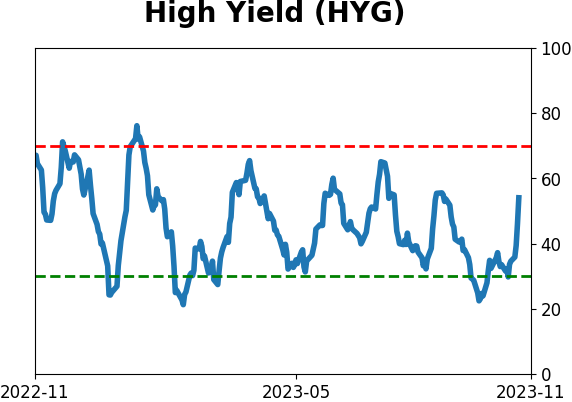
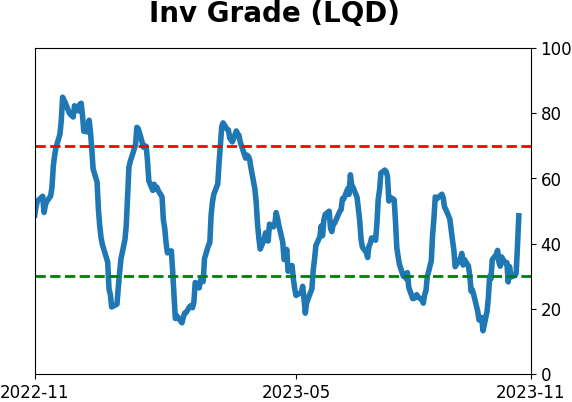
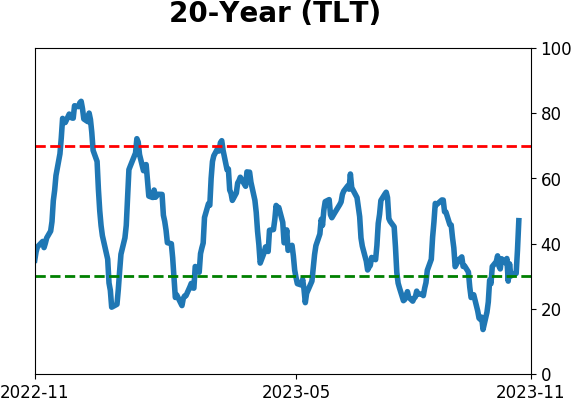
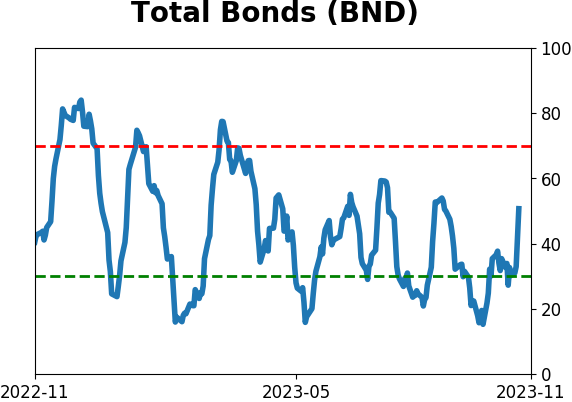
Bond ETF's - 10-Day Moving Average
|
|
|
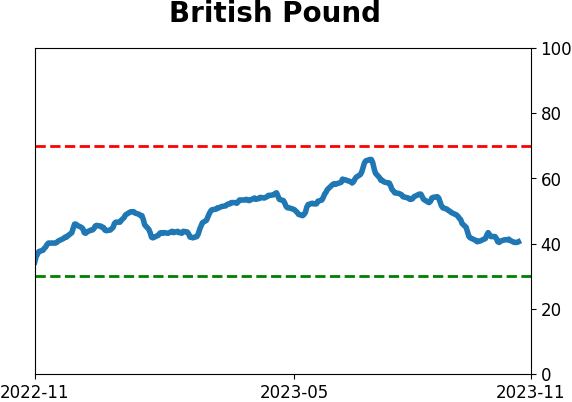
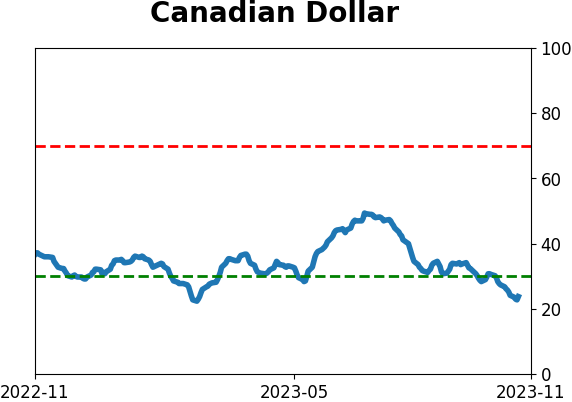
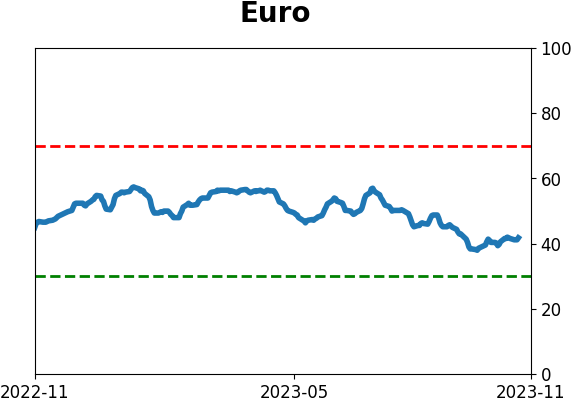
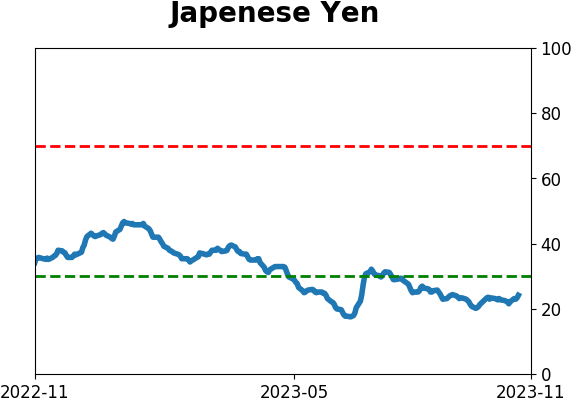
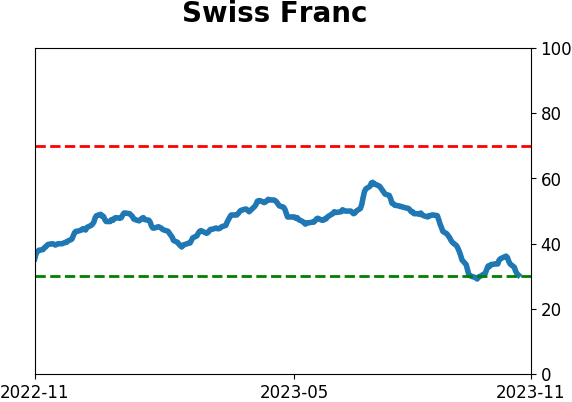
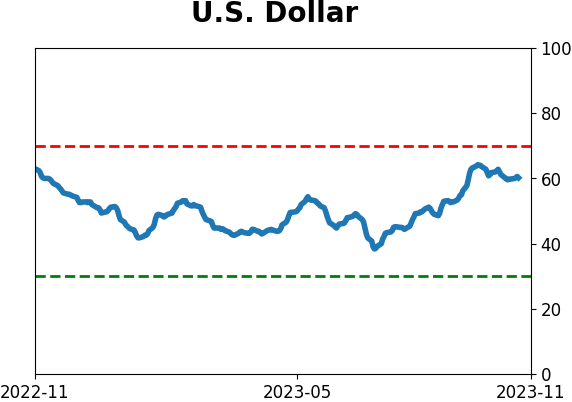
Currency ETF's - 5-Day Moving Average
|
|
|
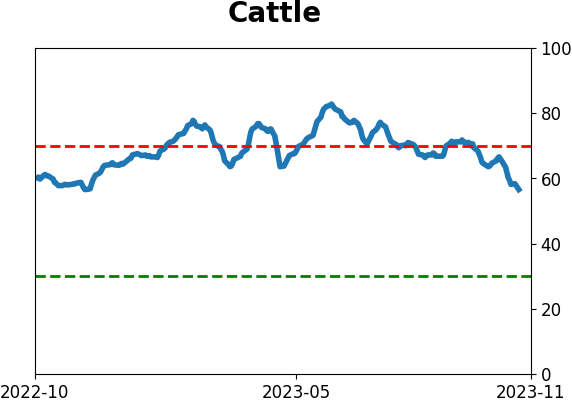
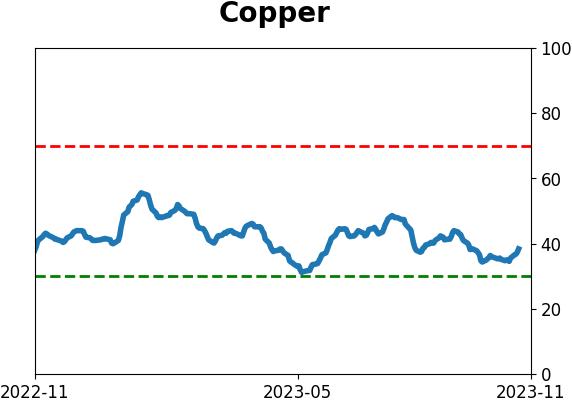
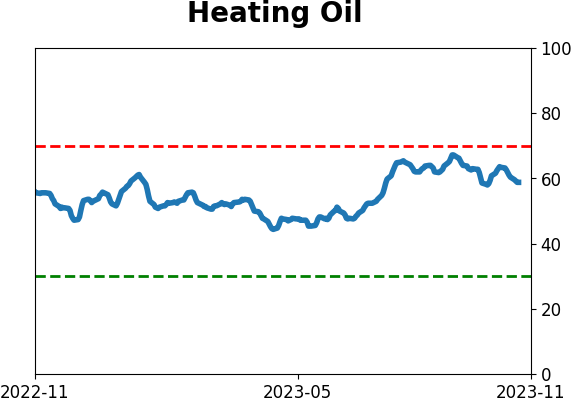
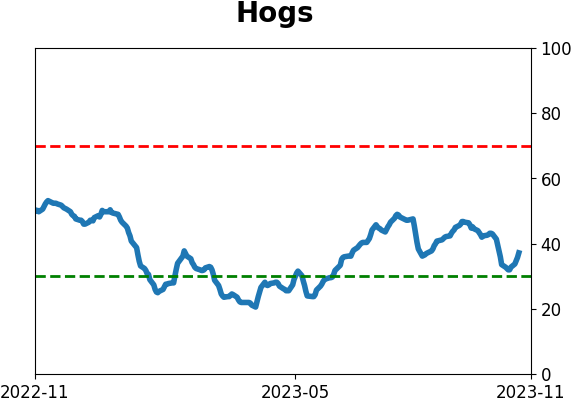
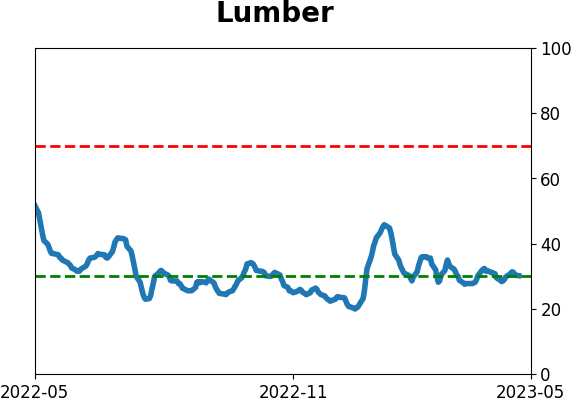
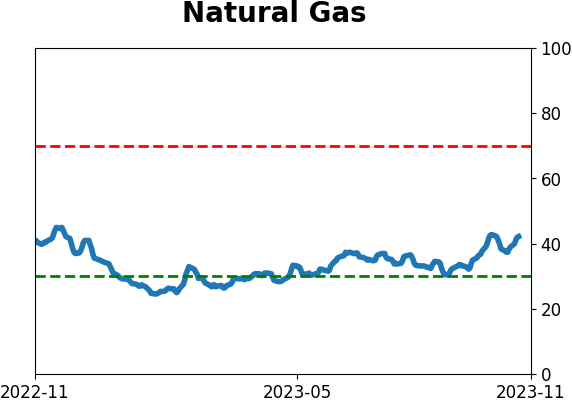
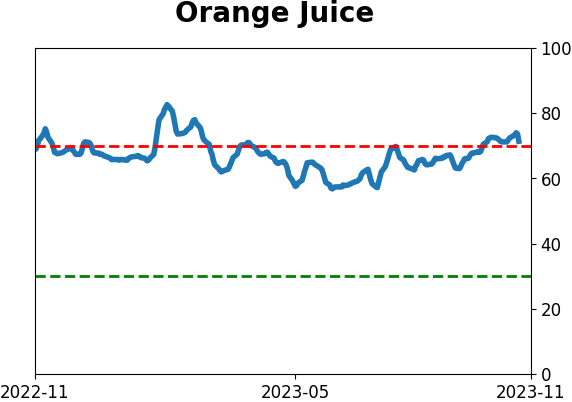
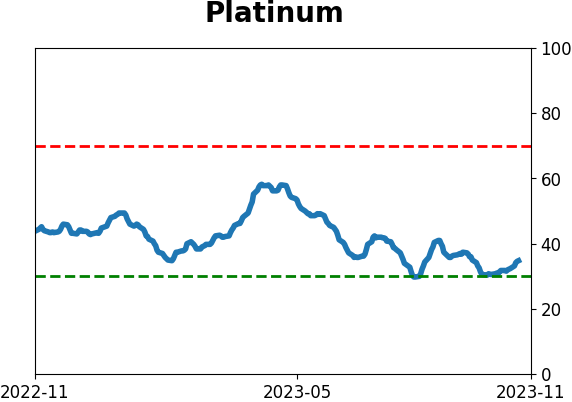
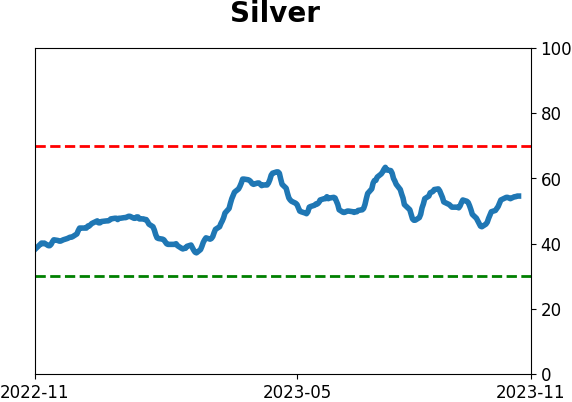
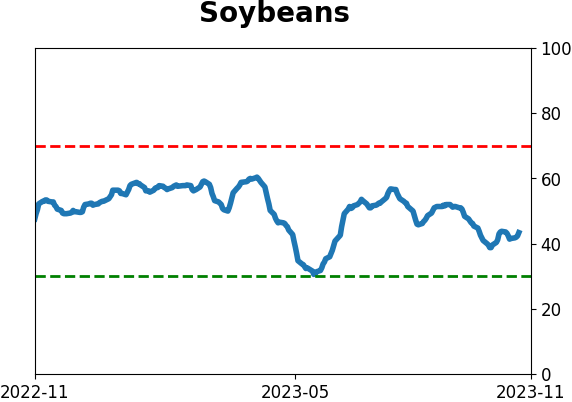
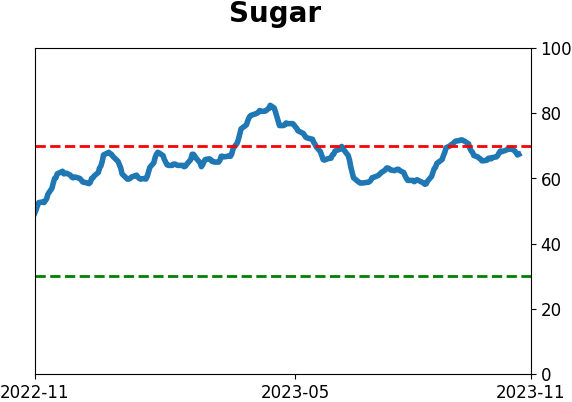
Commodity ETF's - 5-Day Moving Average
|
|