Headlines
|
|
The Dow has surged relative to the S&P and Nasdaq:
Over the past 30 days, the Dow Industrials index has surged more than 5% against the S&P 500, and more than 10% against the Nasdaq Composite. Similar bursts of outperformance tended to see the Dow relax against the other indexes in the short-term. In the case of the Nasdaq, the Dow struggled a lot more longer-term.
|
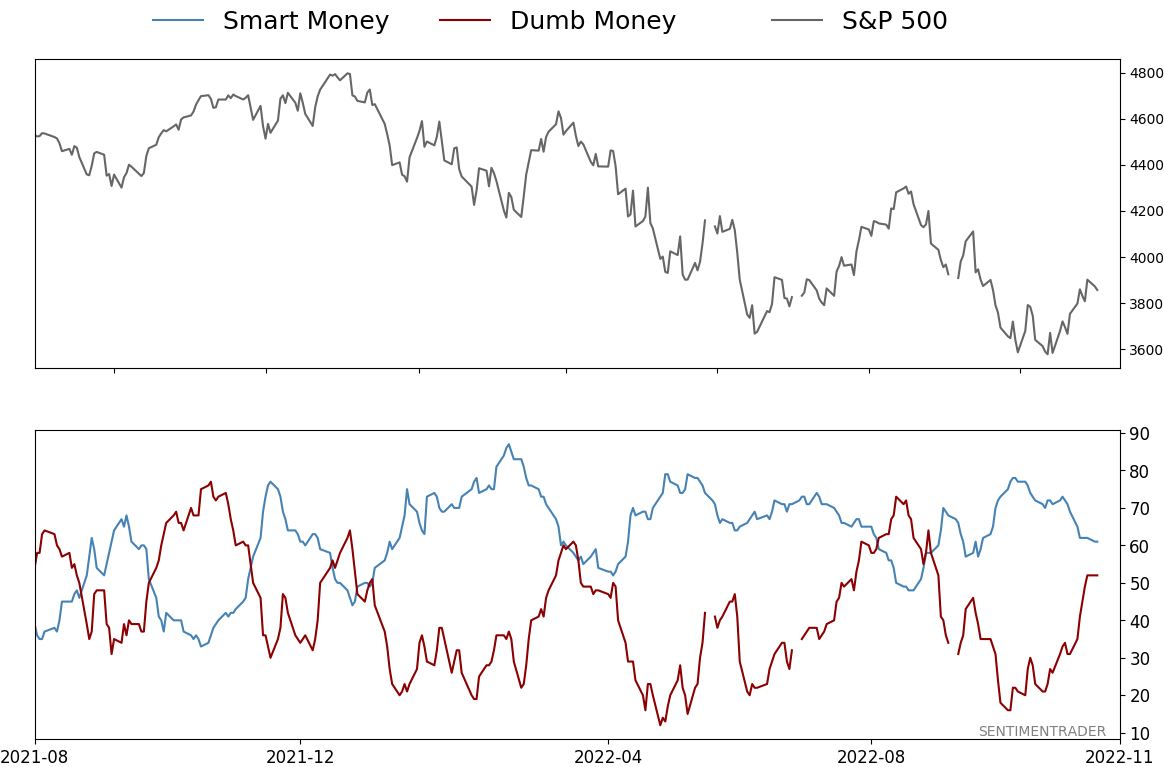
Smart / Dumb Money Confidence
|
Smart Money Confidence: 61%
Dumb Money Confidence: 52%
|
|
Risk Levels
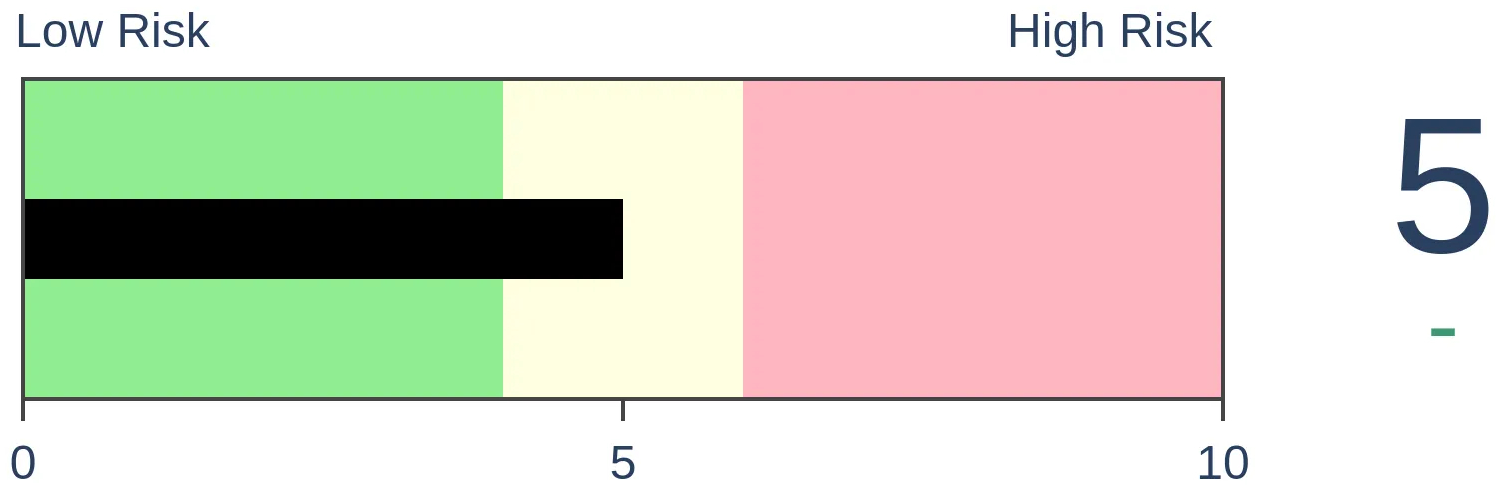
Stocks Short-Term

|
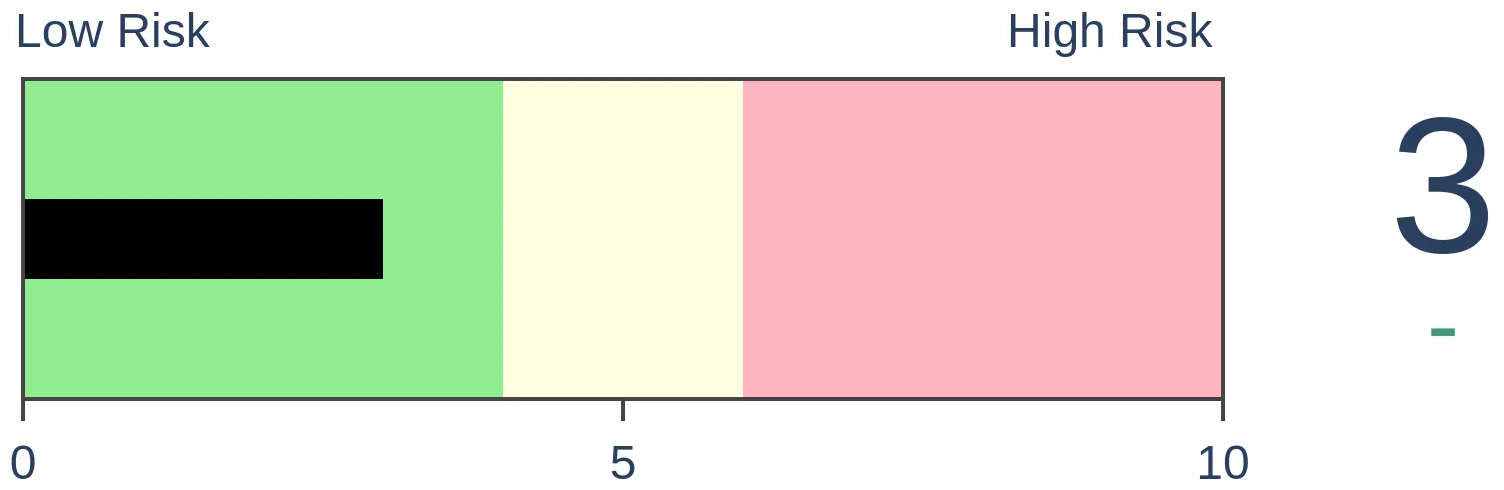
Stocks Medium-Term
|
|
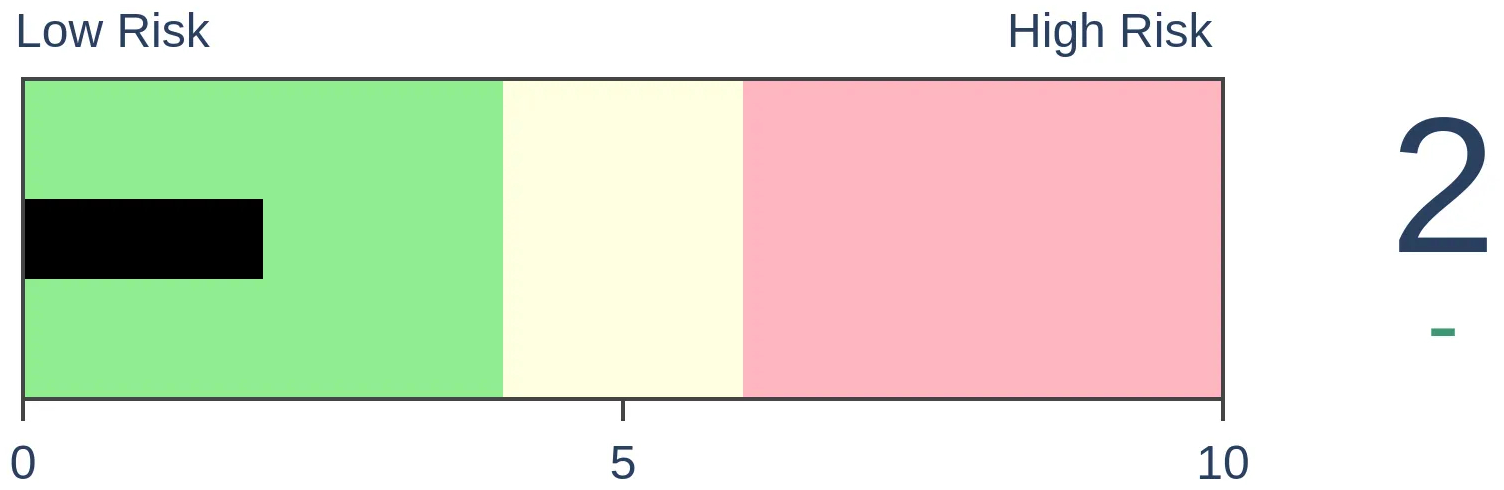
Bonds
|
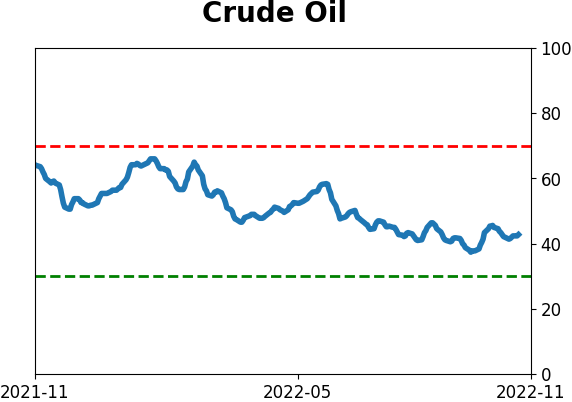
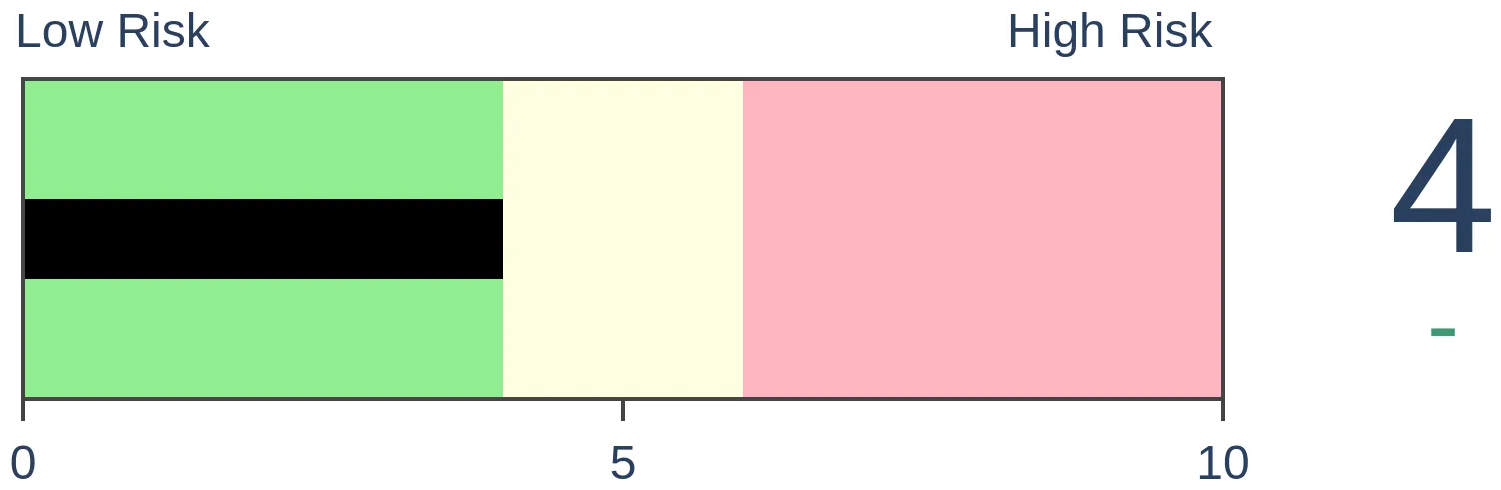
Crude Oil

|
|
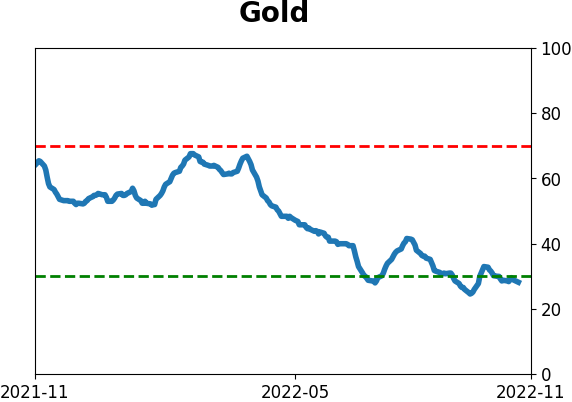
Gold
|
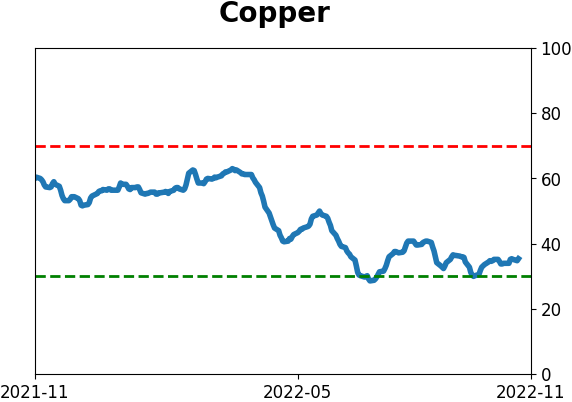
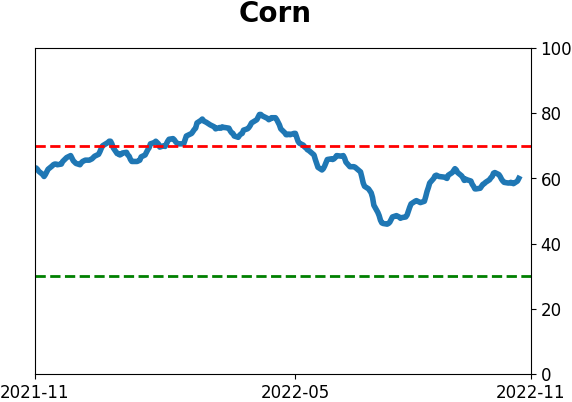
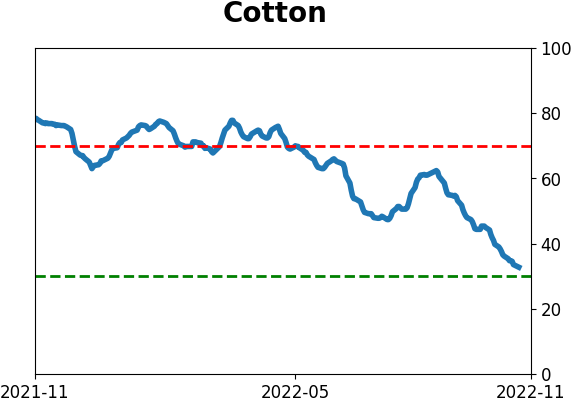
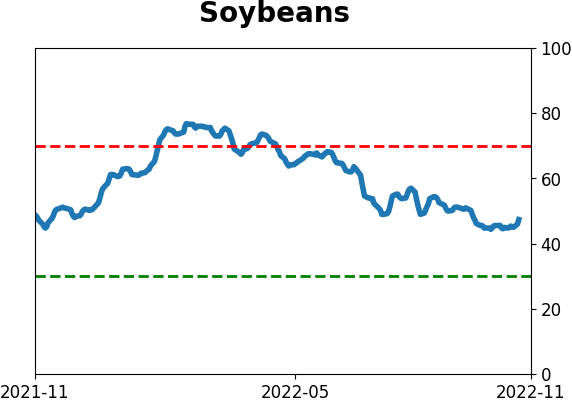
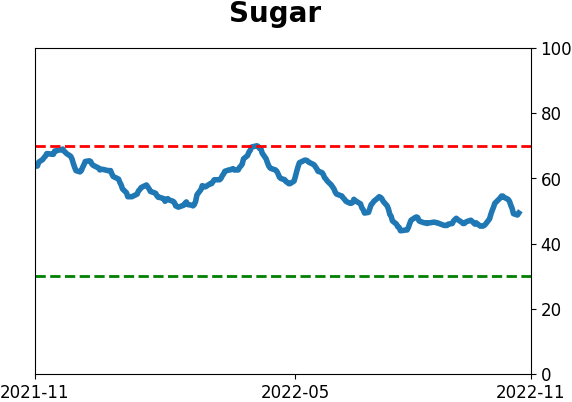
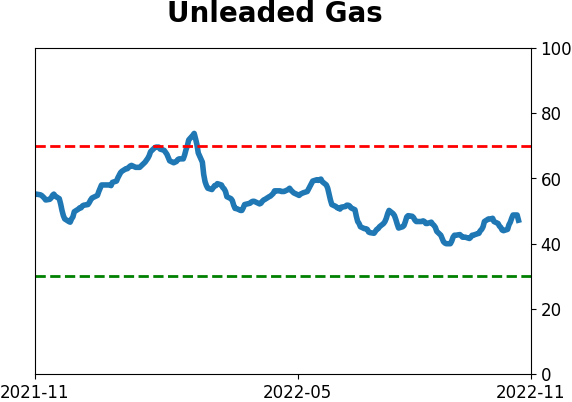
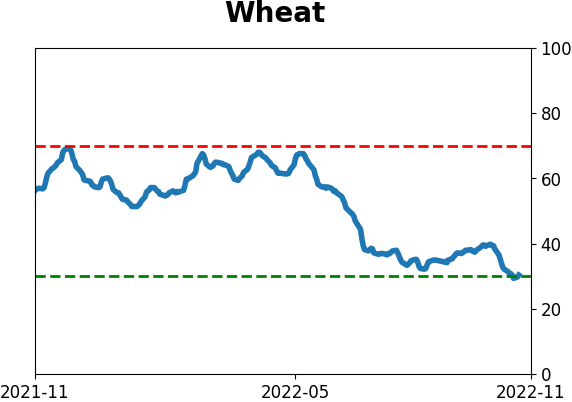
Agriculture
|
|
Research
By Jason Goepfert
BOTTOM LINE
Over the past 30 days, the Dow Industrials index has surged more than 5% against the S&P 500, and more than 10% against the Nasdaq Composite. Similar bursts of outperformance tended to see the Dow relax against the other indexes in the short-term. In the case of the Nasdaq, the Dow struggled a lot more longer-term.
FORECAST / TIMEFRAME
None
|
Key points:
- The Dow Industrials, known as an "old economy" index, has surged relative to the S&P 500
- It has outperformed tech-laden indexes like the Nasdaq Composite by even more
- Similar performance tended to lead to short-term pullbacks in the Dow relative to other indexes
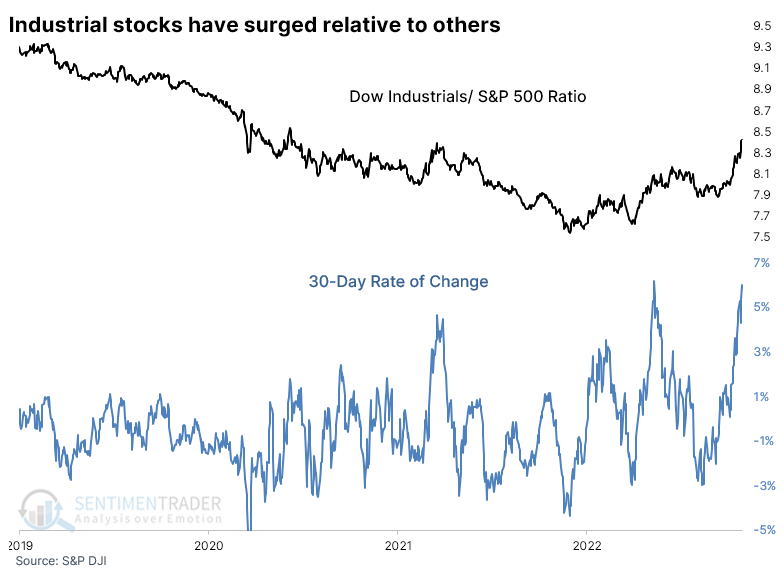
Old economy stocks surge against the broader market
On Monday, we saw that the jump in Industrial stocks was broad-based. The McClellan Oscillator for the sector surged to one of its highest levels in at least 70 years, which has preceded further long-term gains almost without fail.
The move in Industrial stocks has been unusual in another respect - it has far outpaced the broader market, defined as the S&P 500. The ratio of the Dow Jones Industrial Average to the S&P rallied more than 5% over the past 30 days, one of the most significant moves since 1928.
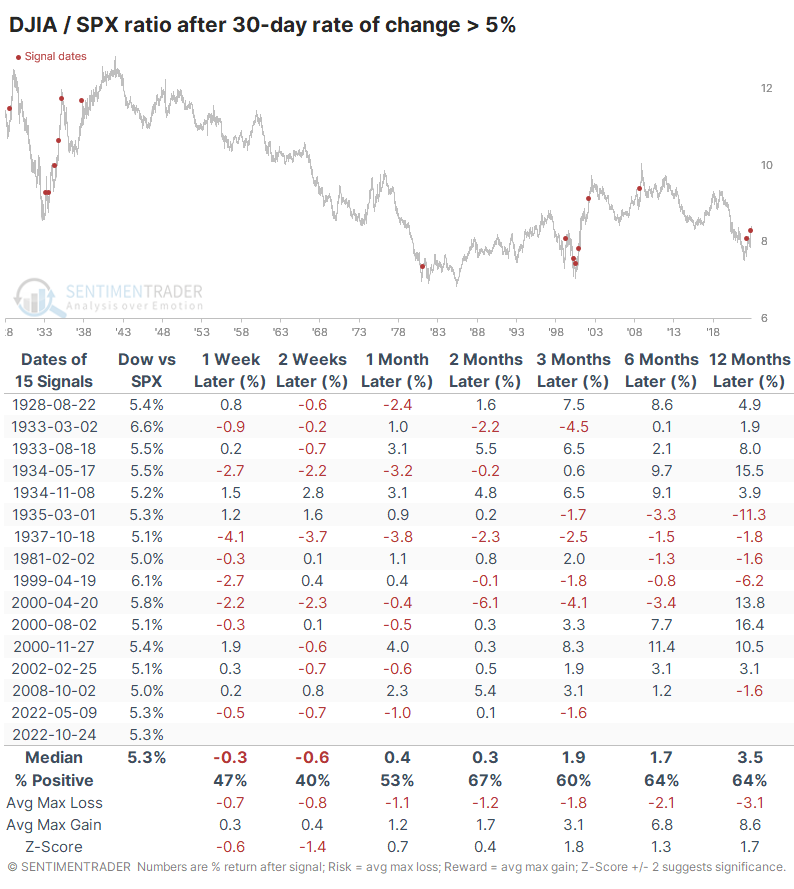
After other times when the ratio surged at least 5%, the Dow tended to settle back versus the S&P over the next couple of weeks. Only 3 out of 15 signals showed a positive return one and two weeks later. Most of the time, the ratio climbed back, and it rose most of the time from one month and beyond.
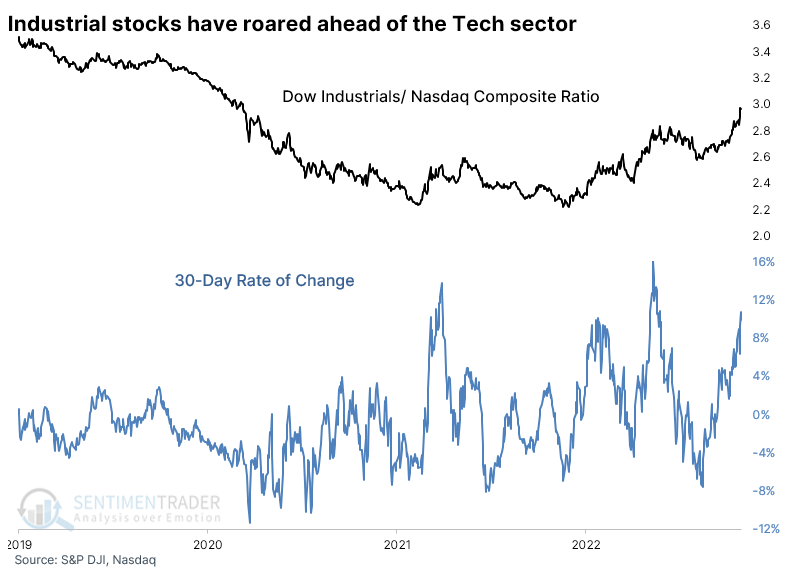
Gains against the Nasdaq are even more impressive
The Dow's gains have been especially notable relative to another major index, the Nasdaq Composite. Thanks to a heavy weighting of recently-crushed tech stocks, the Dow Industrials / Nasdaq Composite ratio jumped more than 10% over the past 30 days.
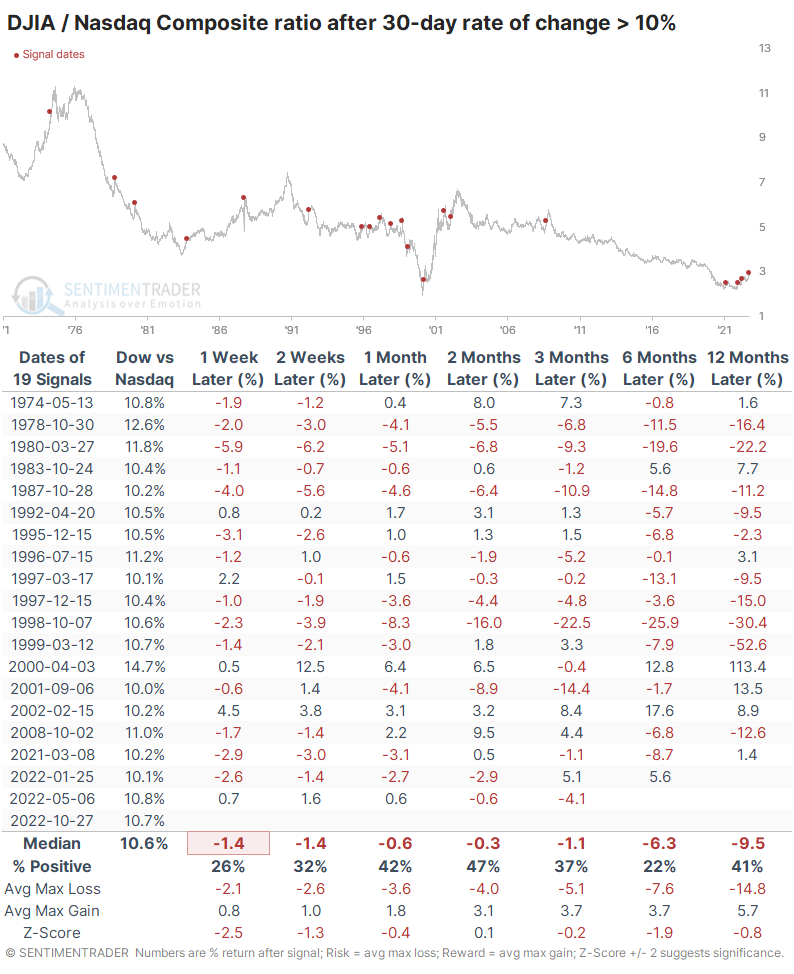
After surges like this, the Dow was even less likely to continue to outperform the denominator index. And after these, the Dow continued to underperform, unlike the S&P signals above. Over the next six months, the Dow kept outperforming only 22% of the time, or 4 out of 18 times.
What the research tells us...
Investors are suddenly excited again about the resiliency of old-economy stocks, which should be a warning sign to those who pay attention to such things. Stocks like that typically can't sustain high excitement levels for very long. While short-term returns after similar bursts tend to be poor, long-term ones tend to hold up well. However, the Dow has surged so much against the Nasdaq that the long-term relative value there is less defendable.
Indicators at Extremes
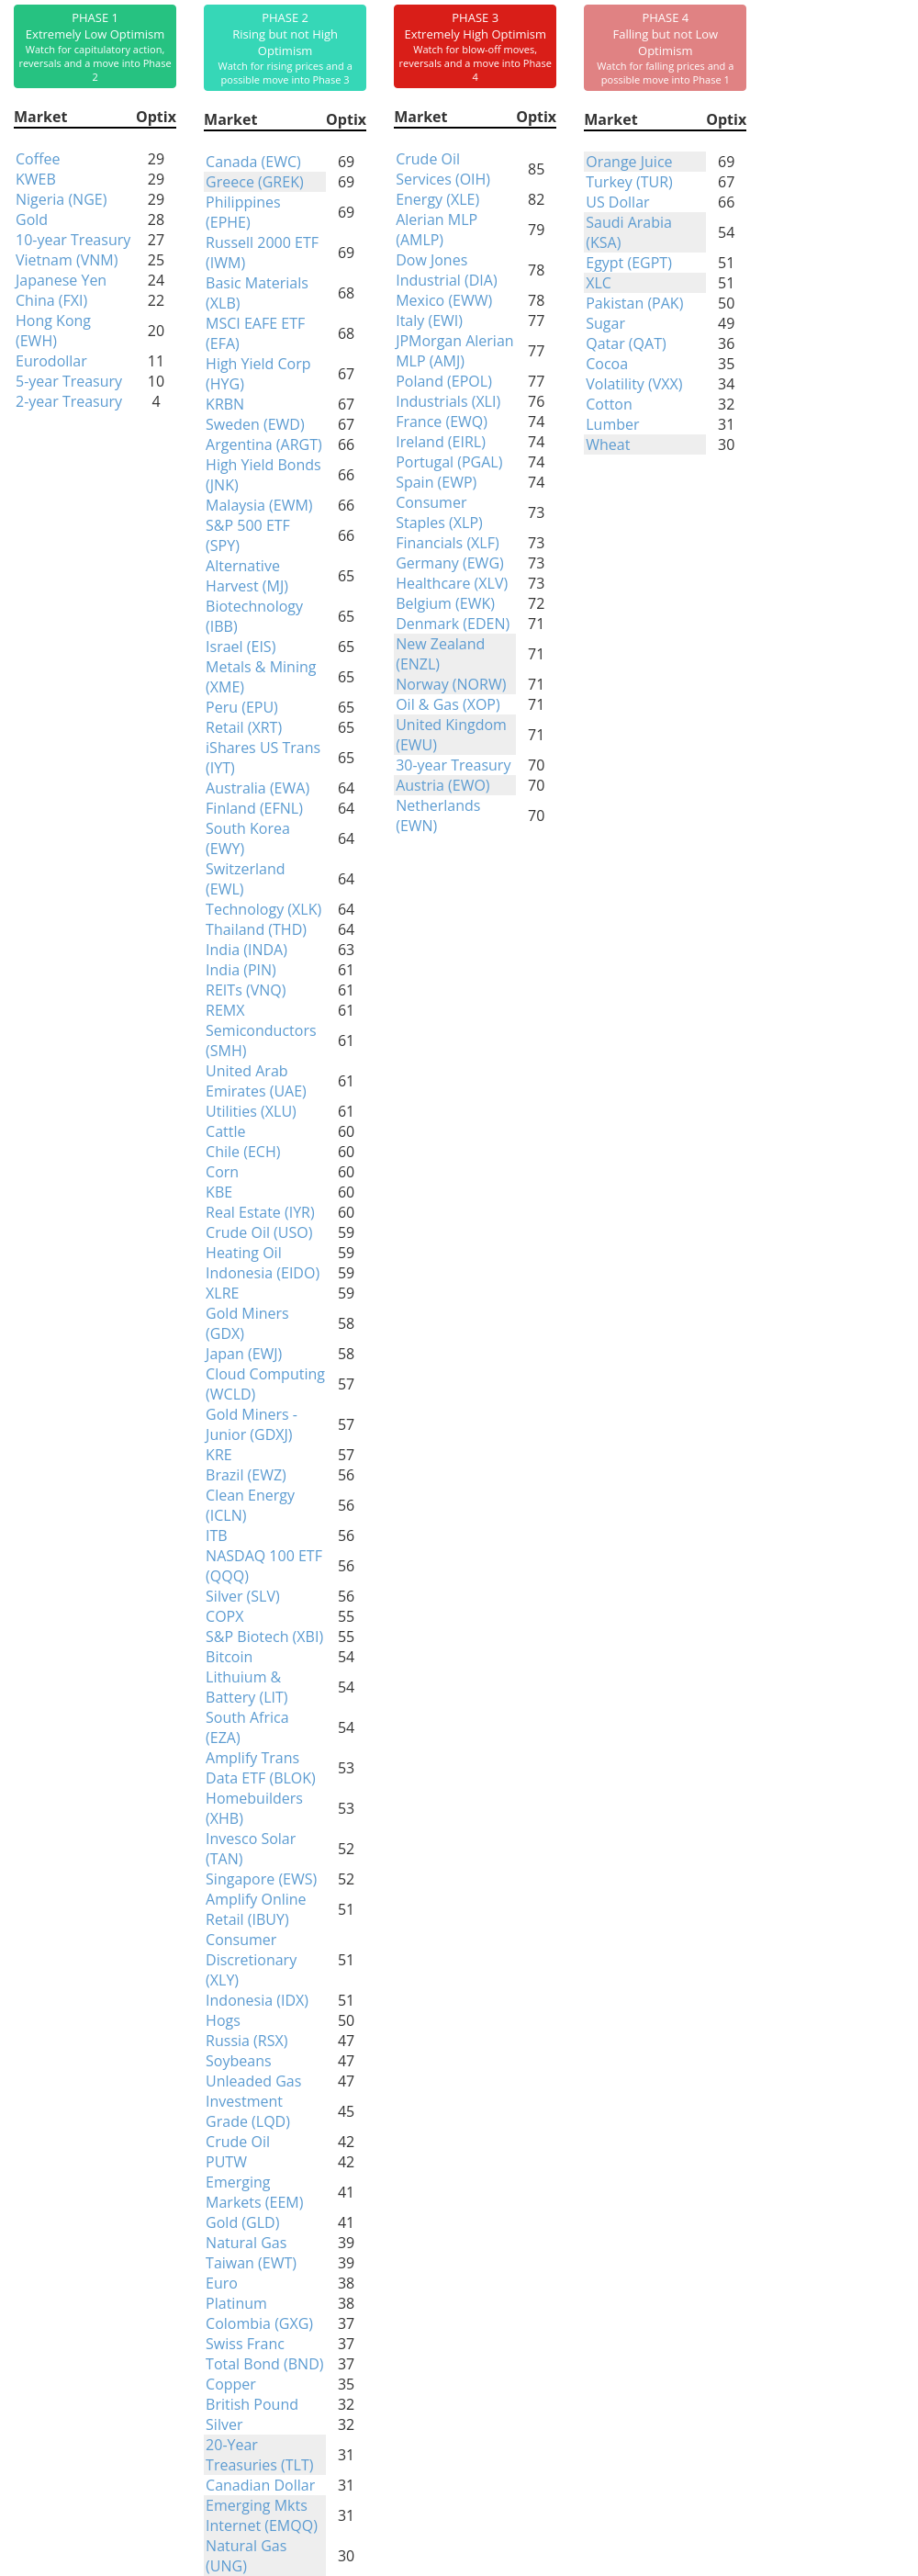
Phase Table
Ranks
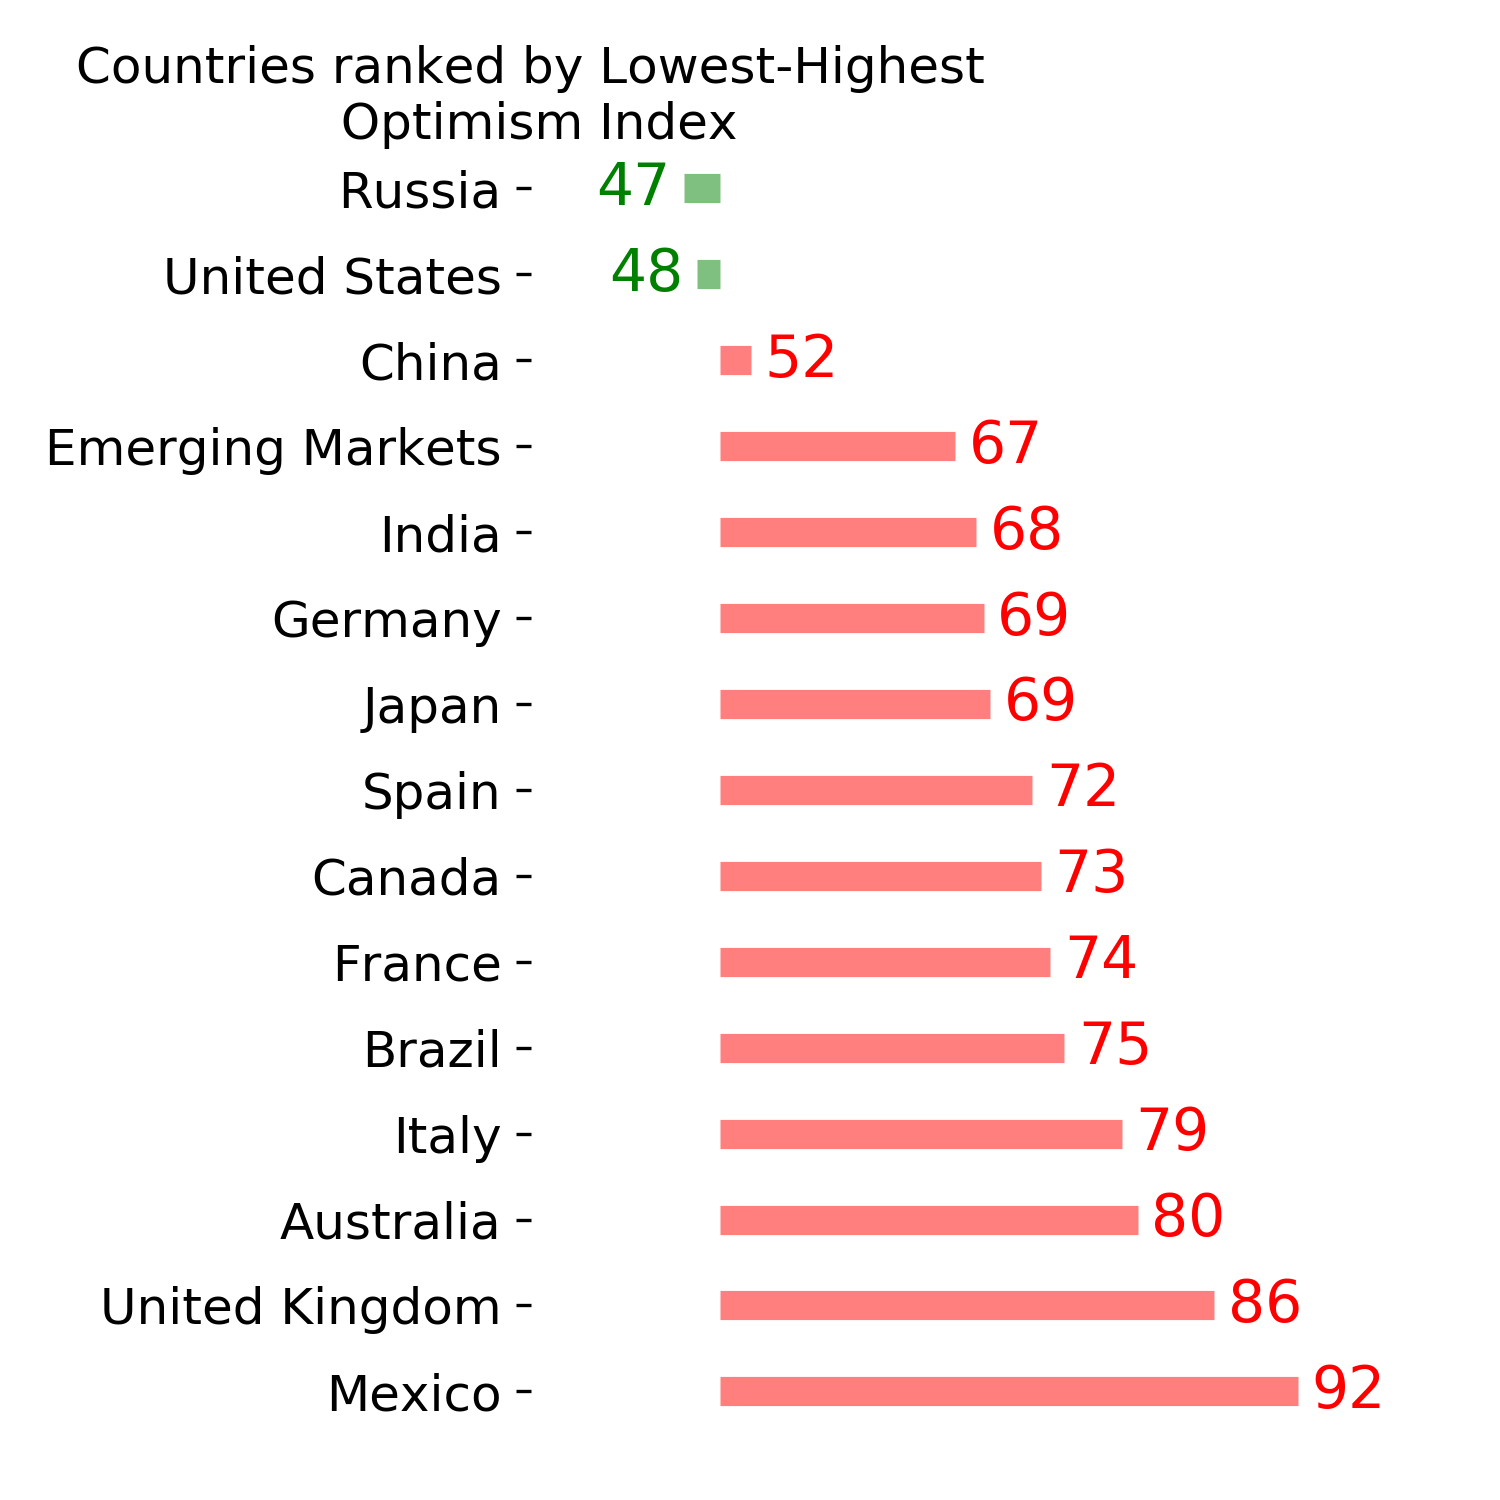
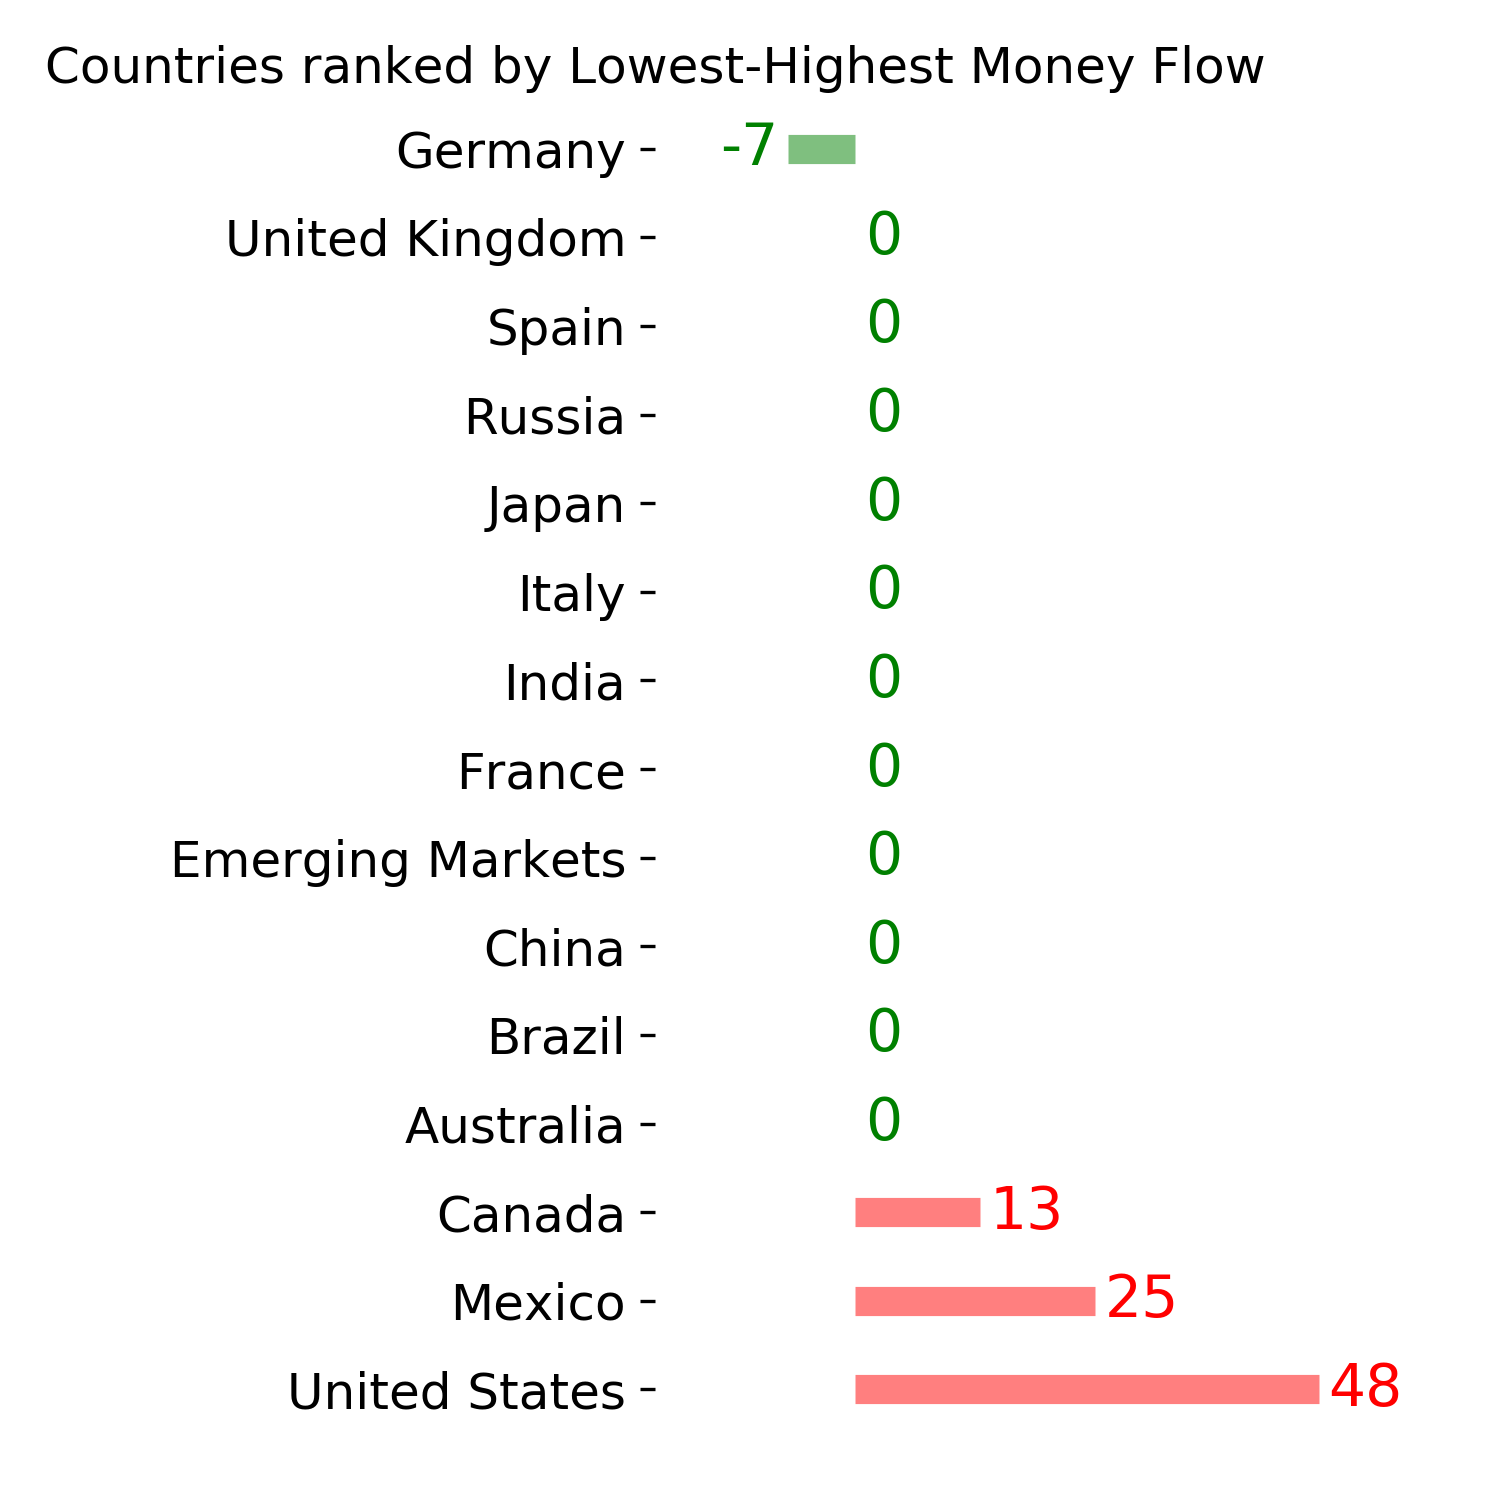
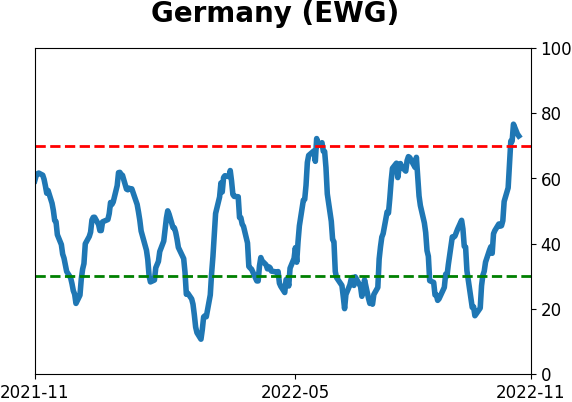
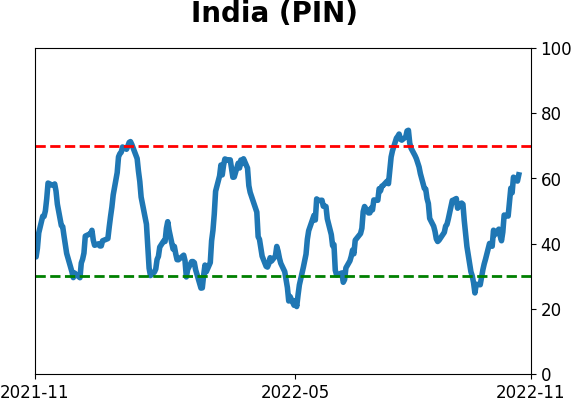
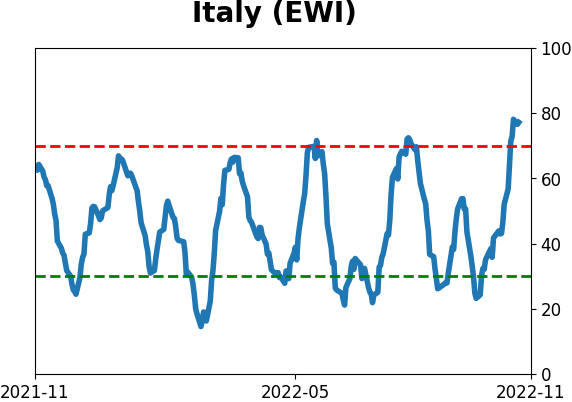
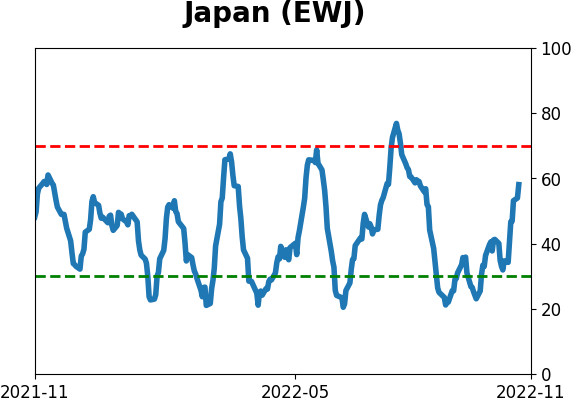
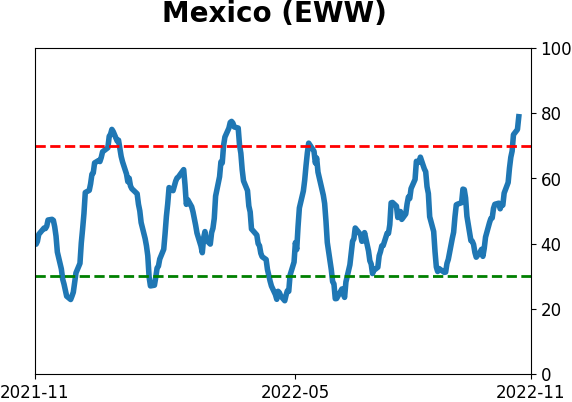
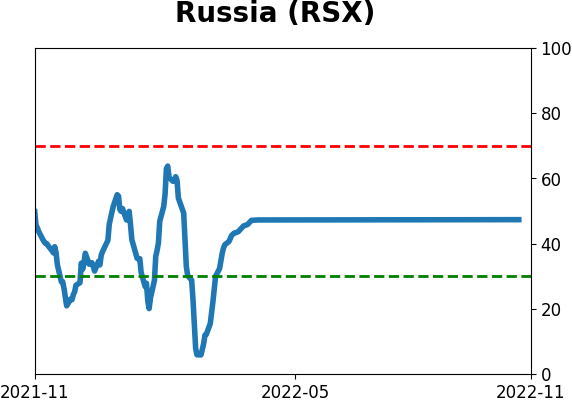
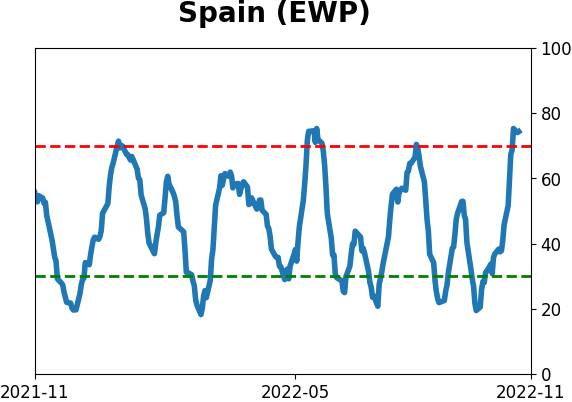
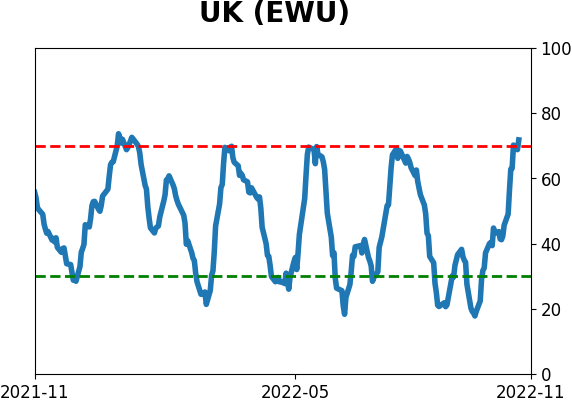
Sentiment Around The World
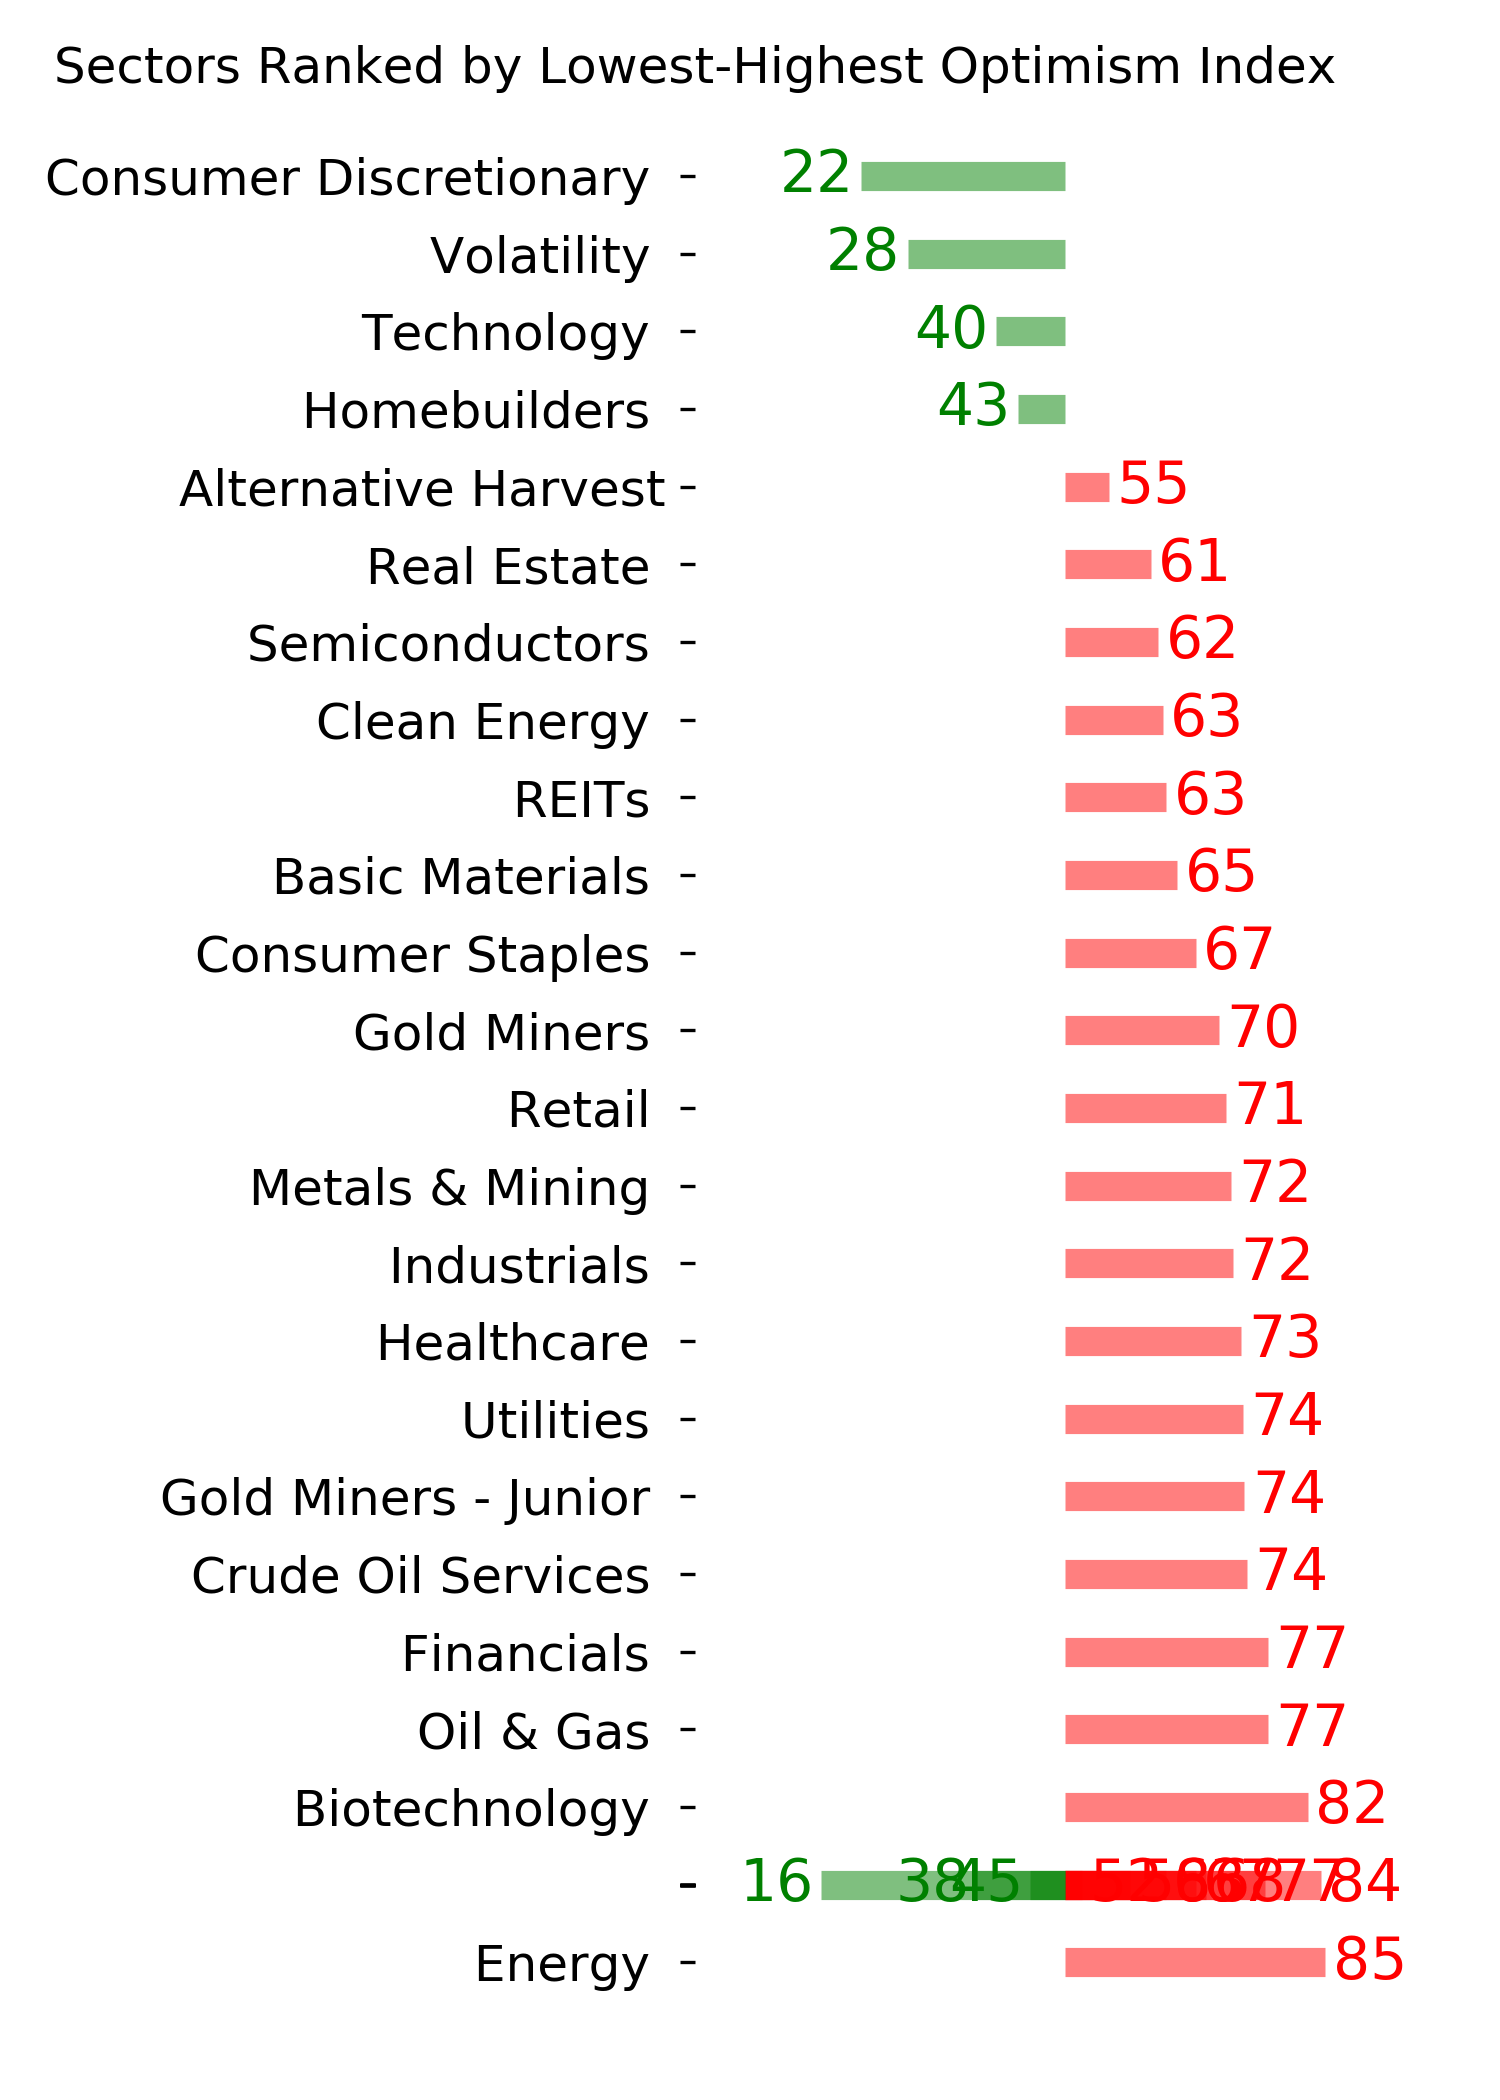
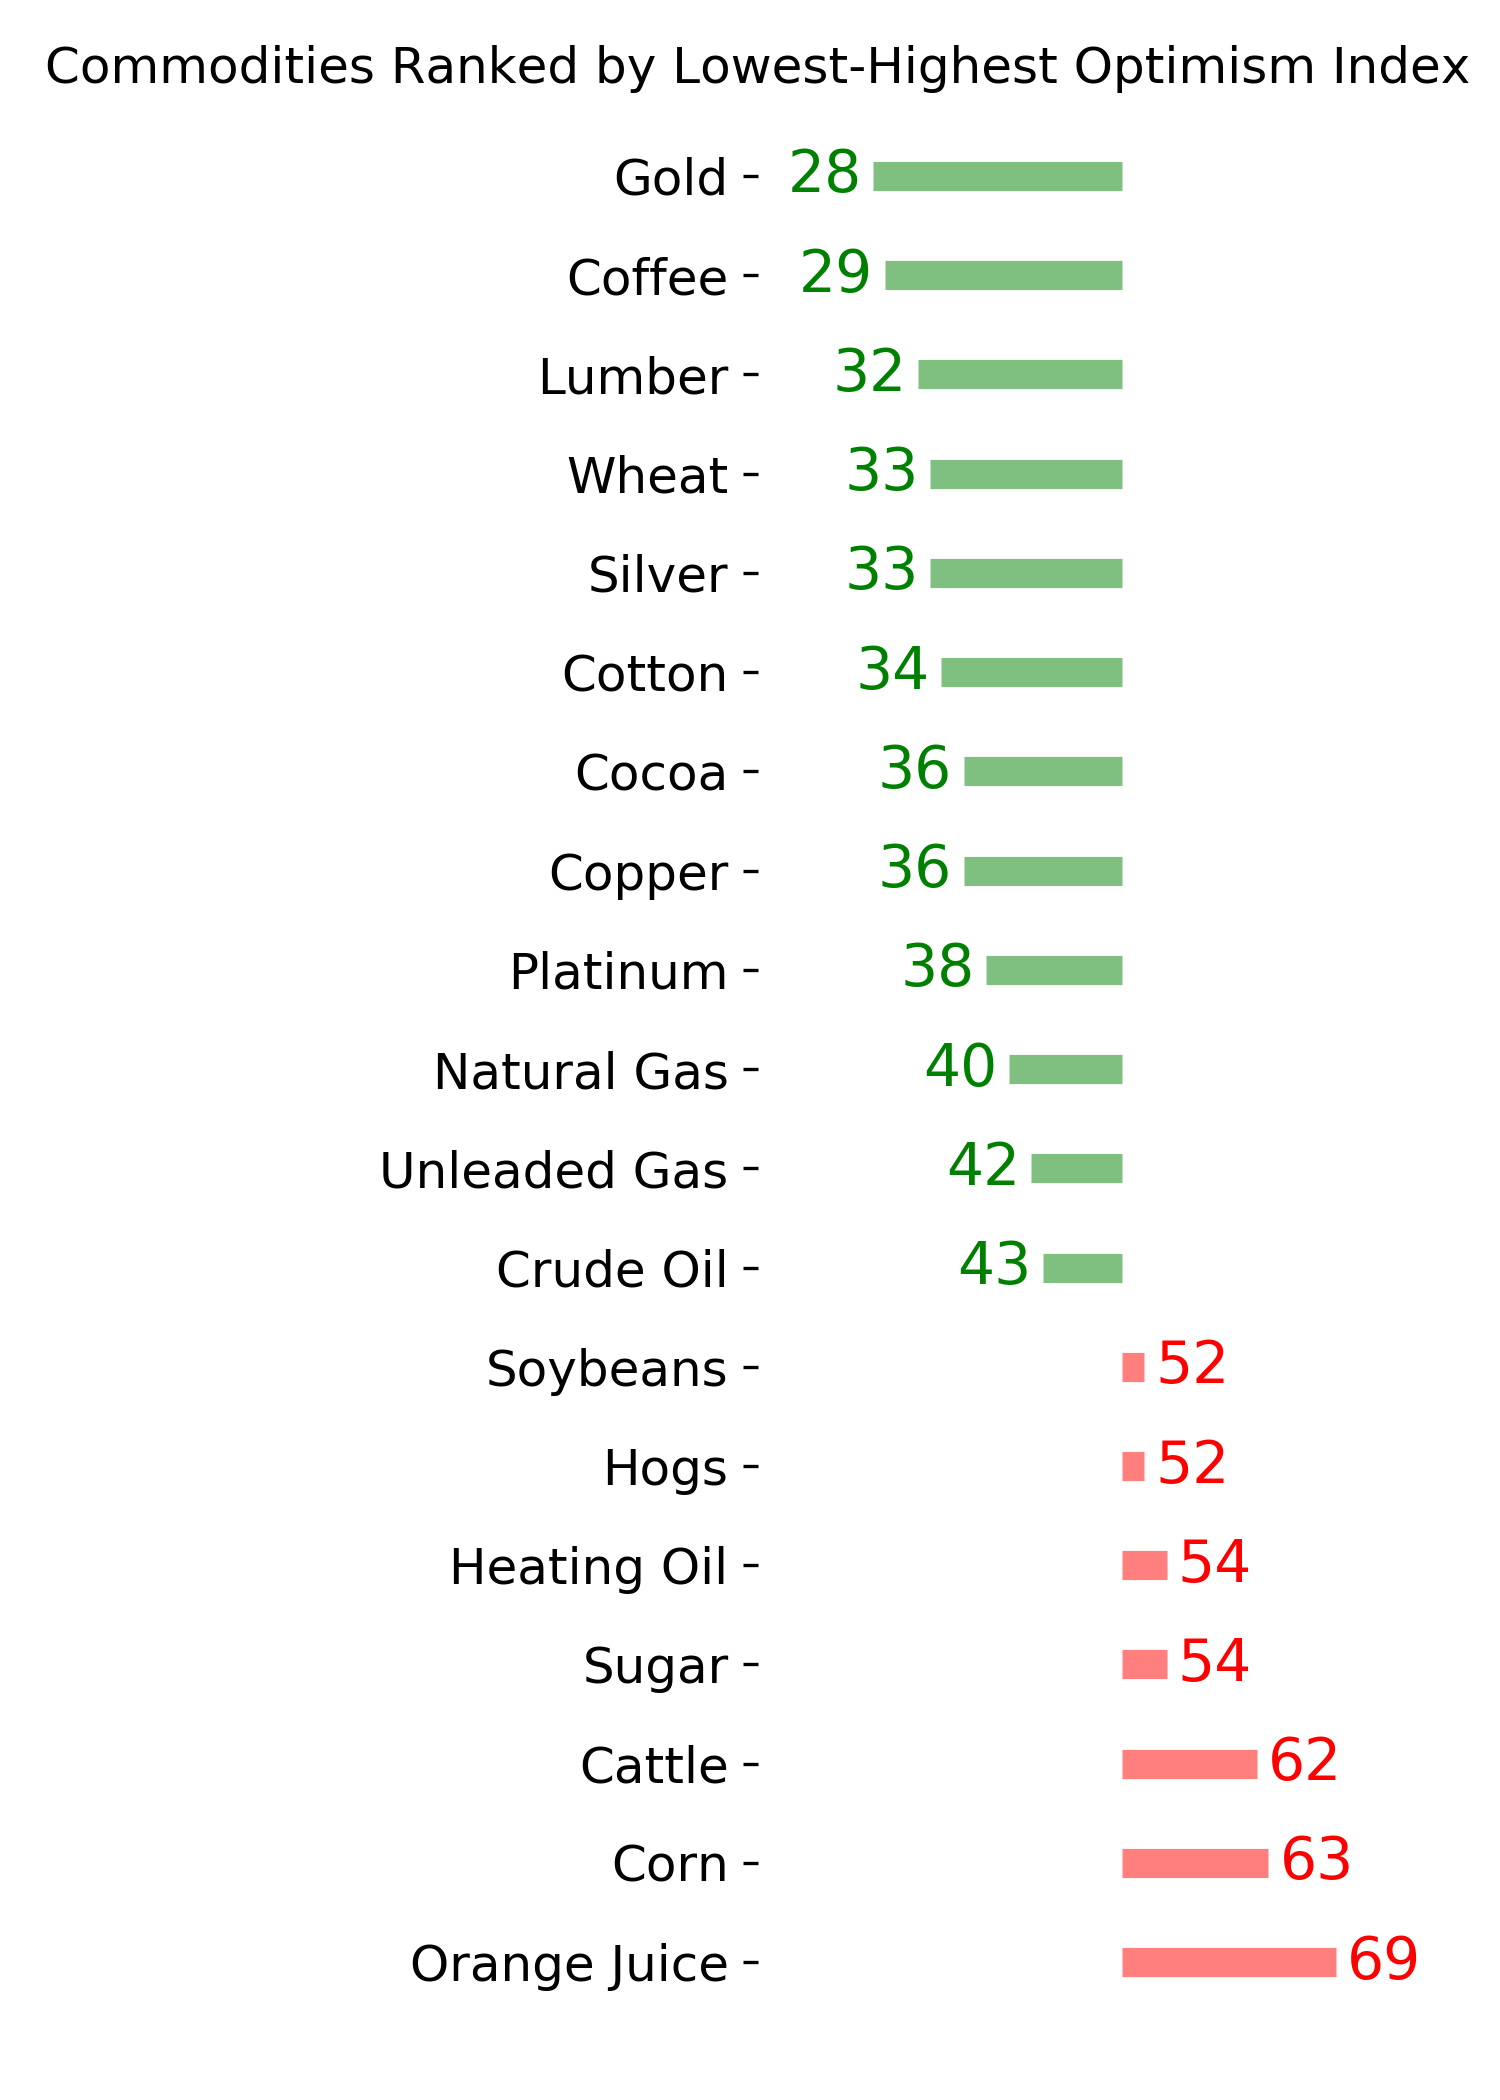
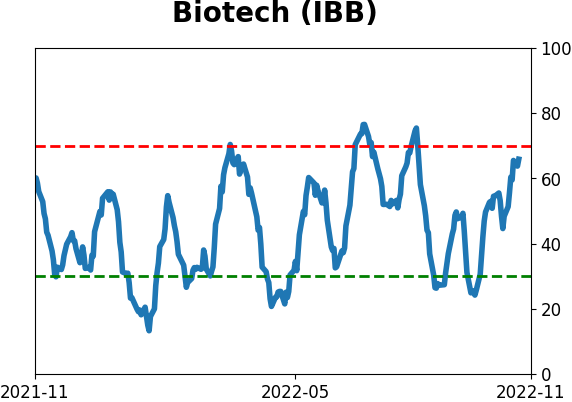
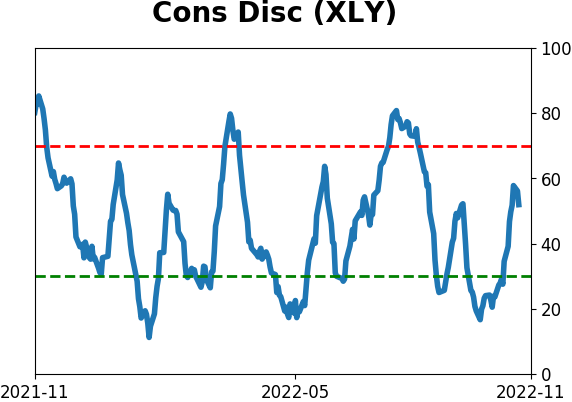
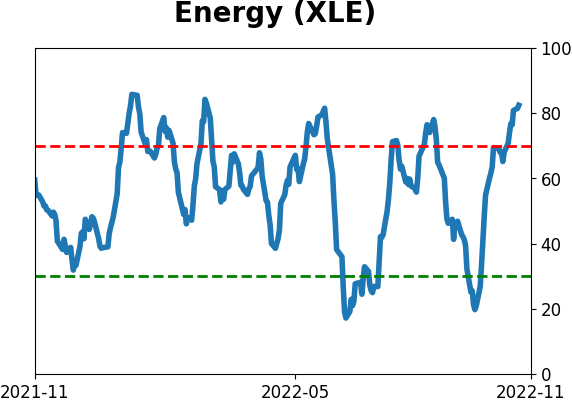
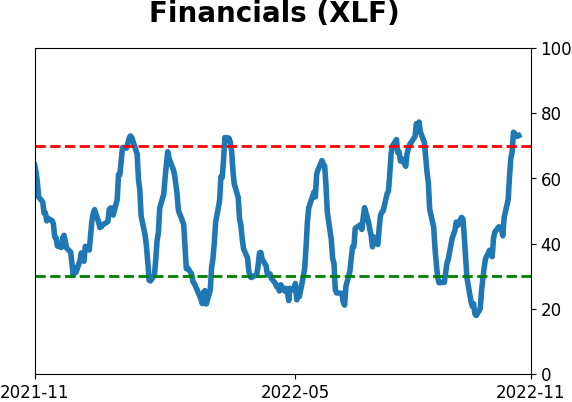
Optimism Index Thumbnails
|
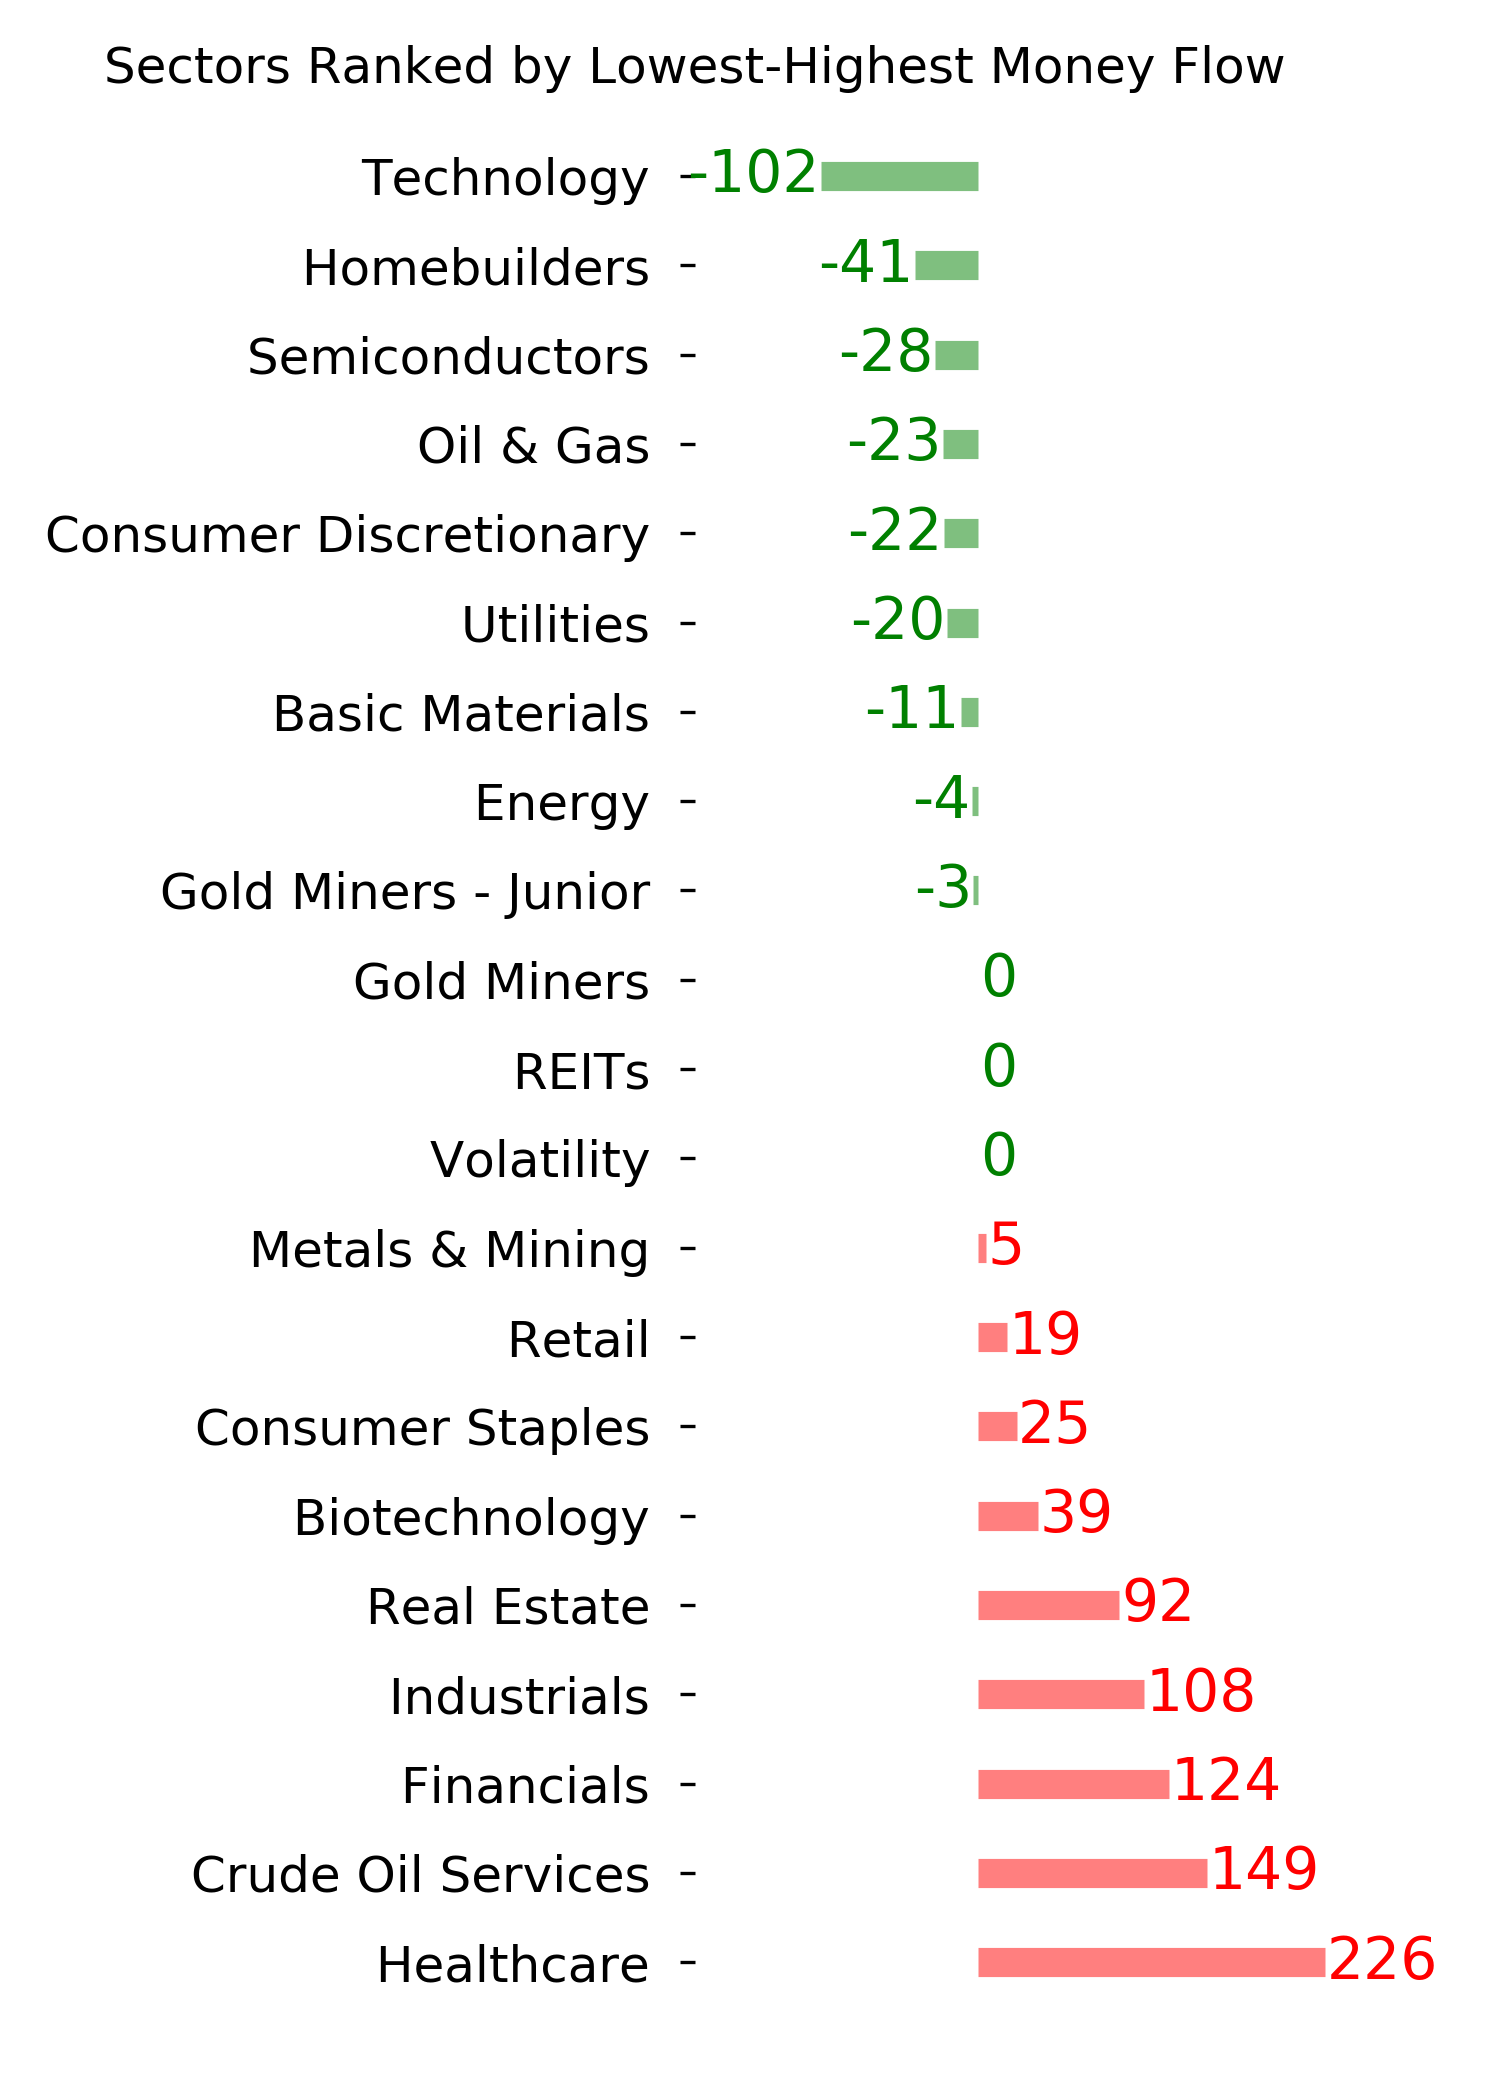
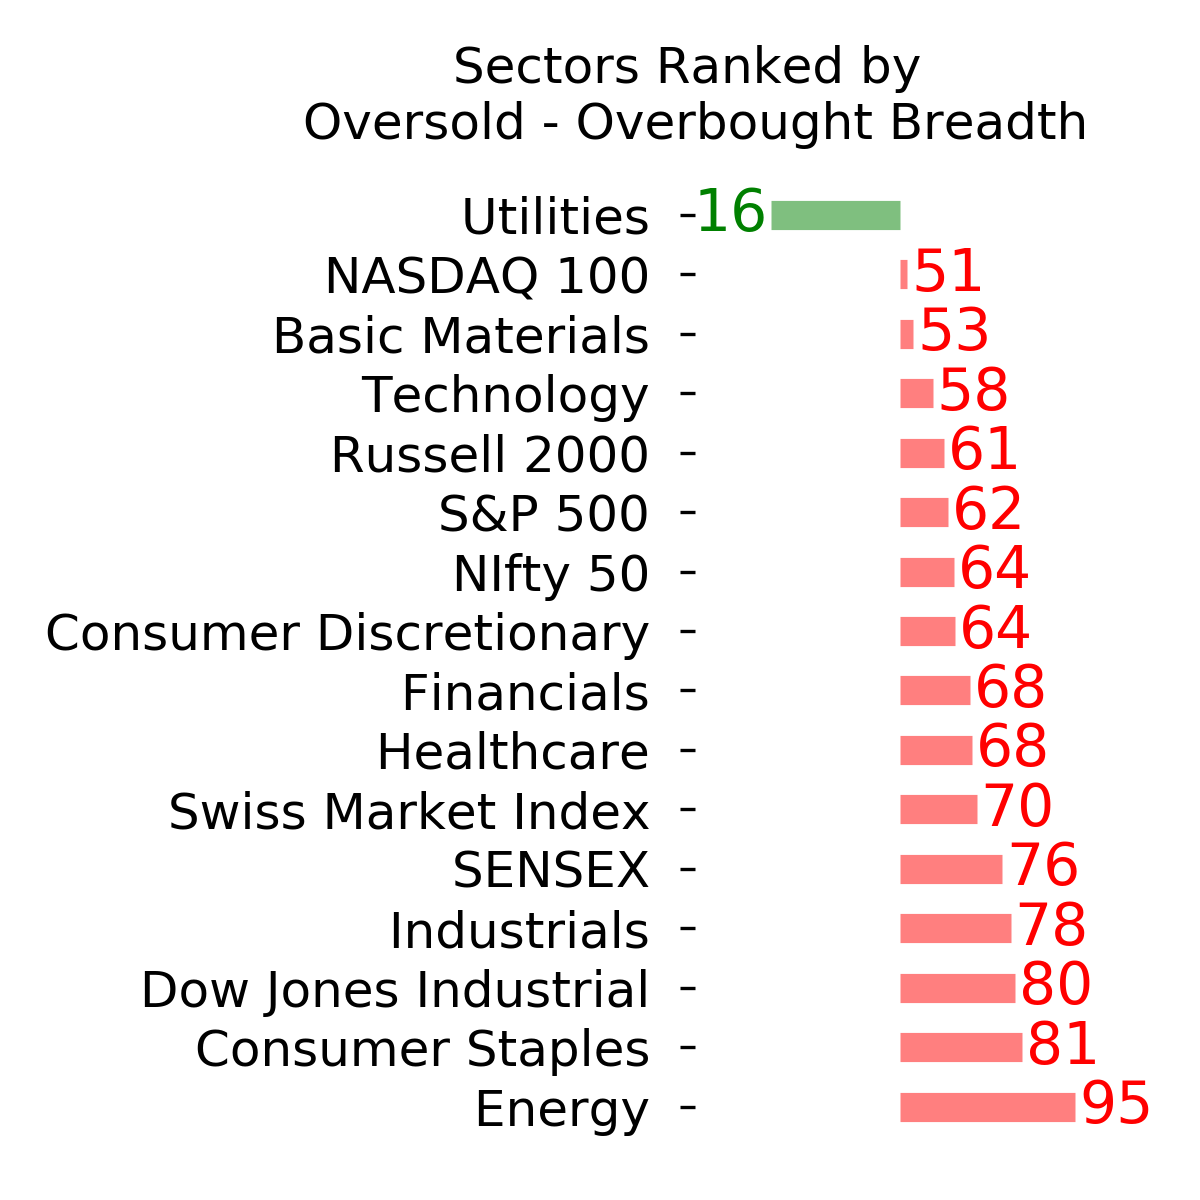
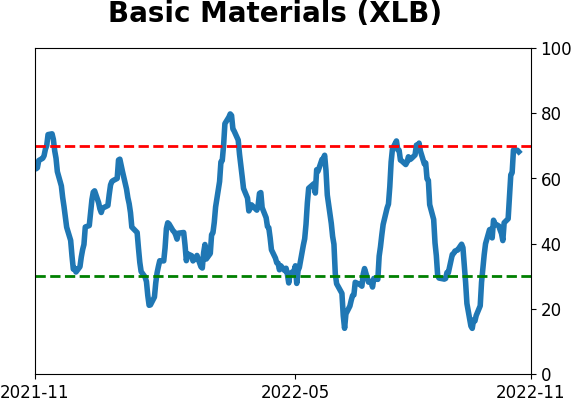
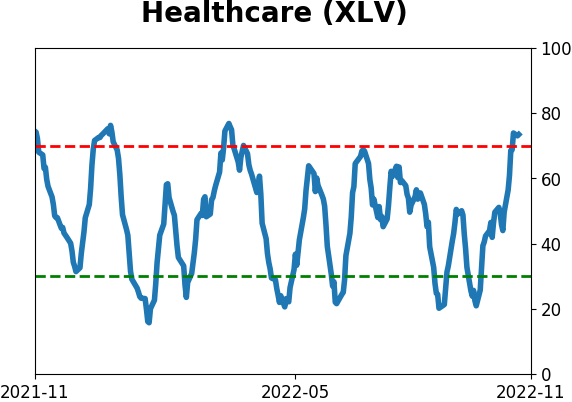
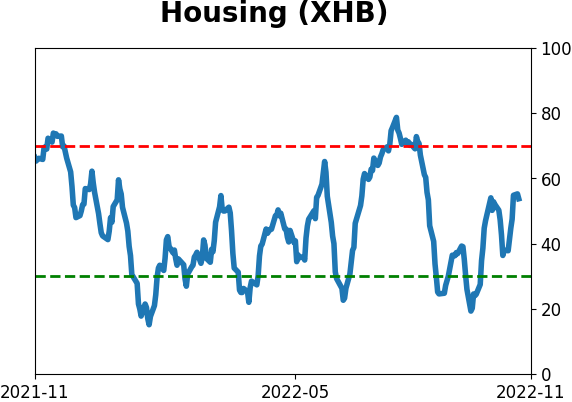
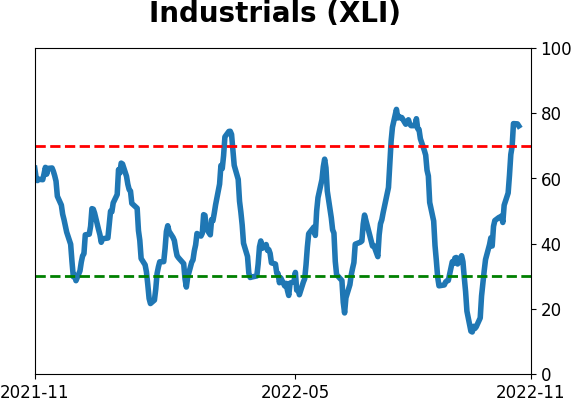
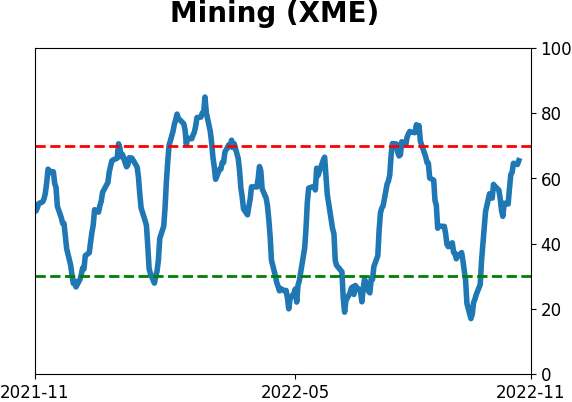
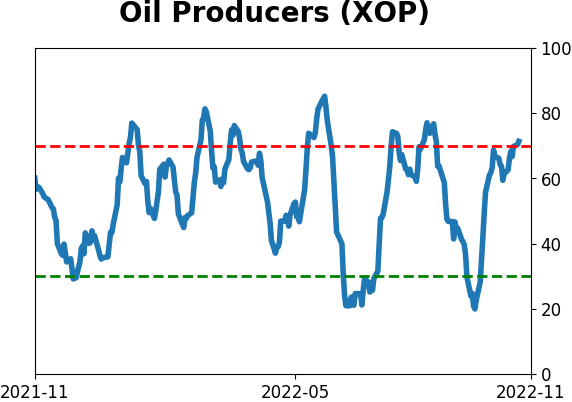
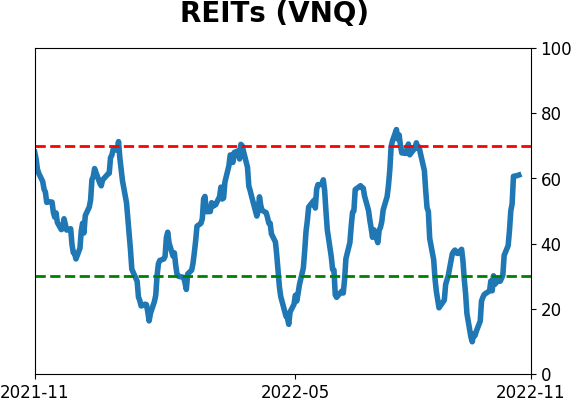
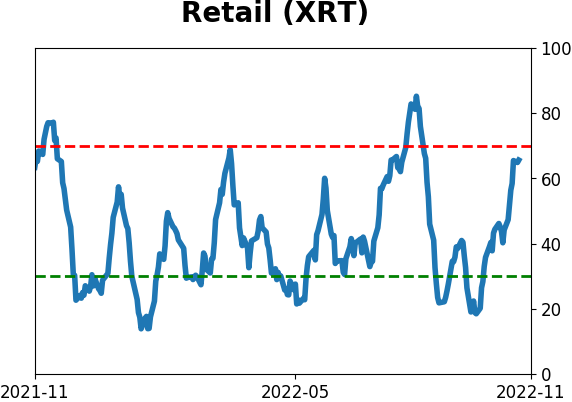
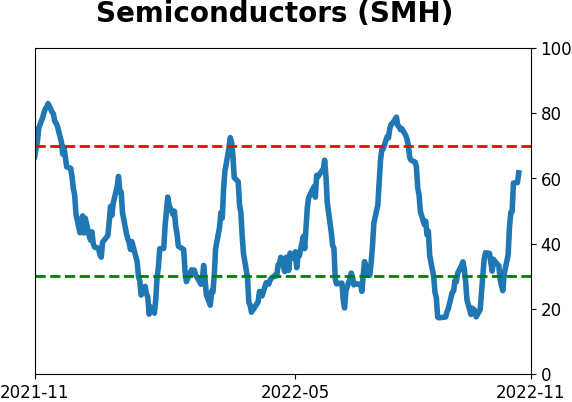
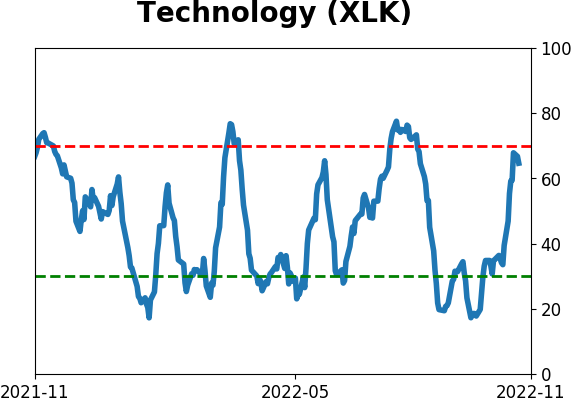
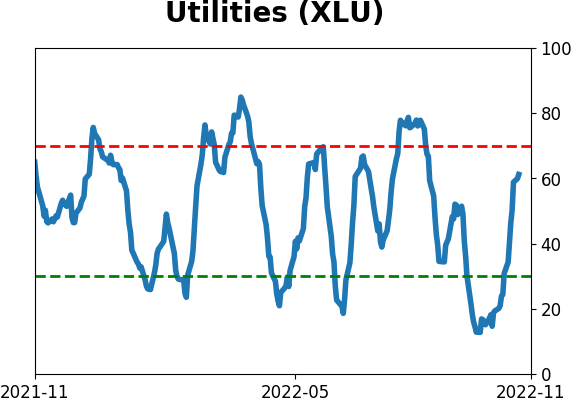
Sector ETF's - 10-Day Moving Average
|
|
|
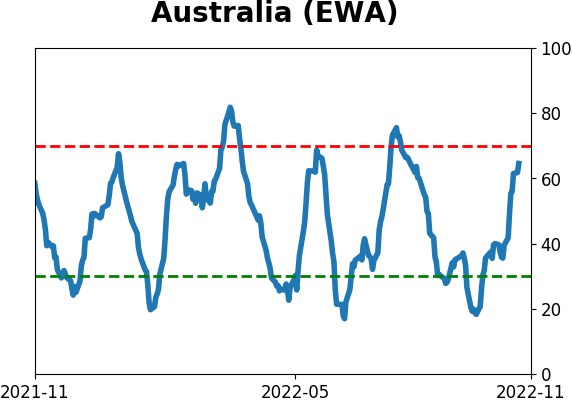
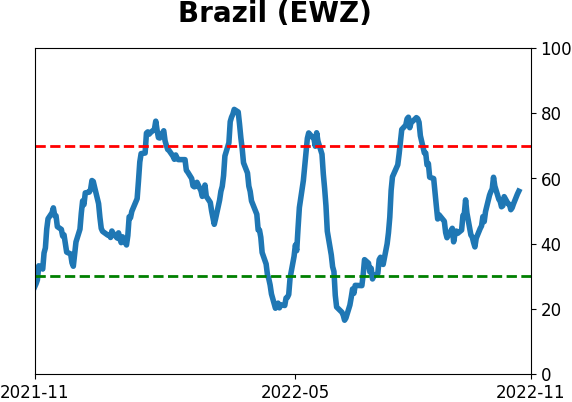
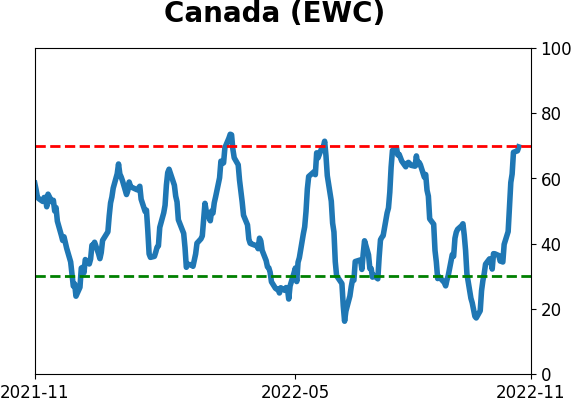
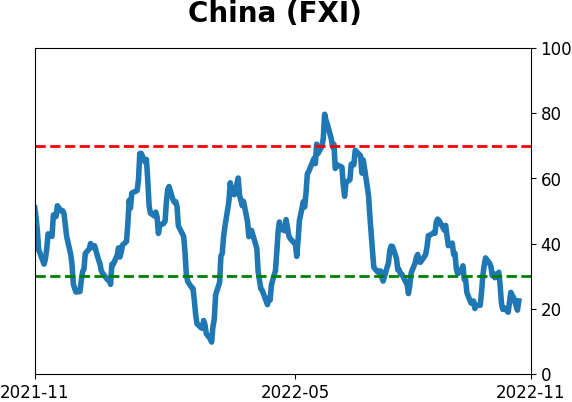
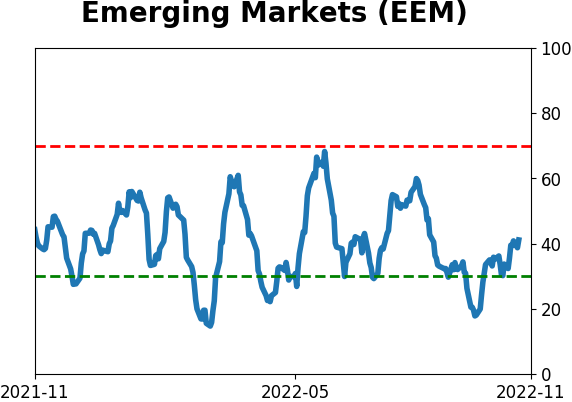
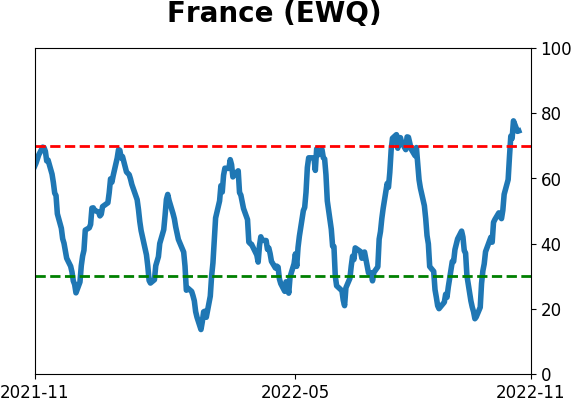
Country ETF's - 10-Day Moving Average
|
|
|
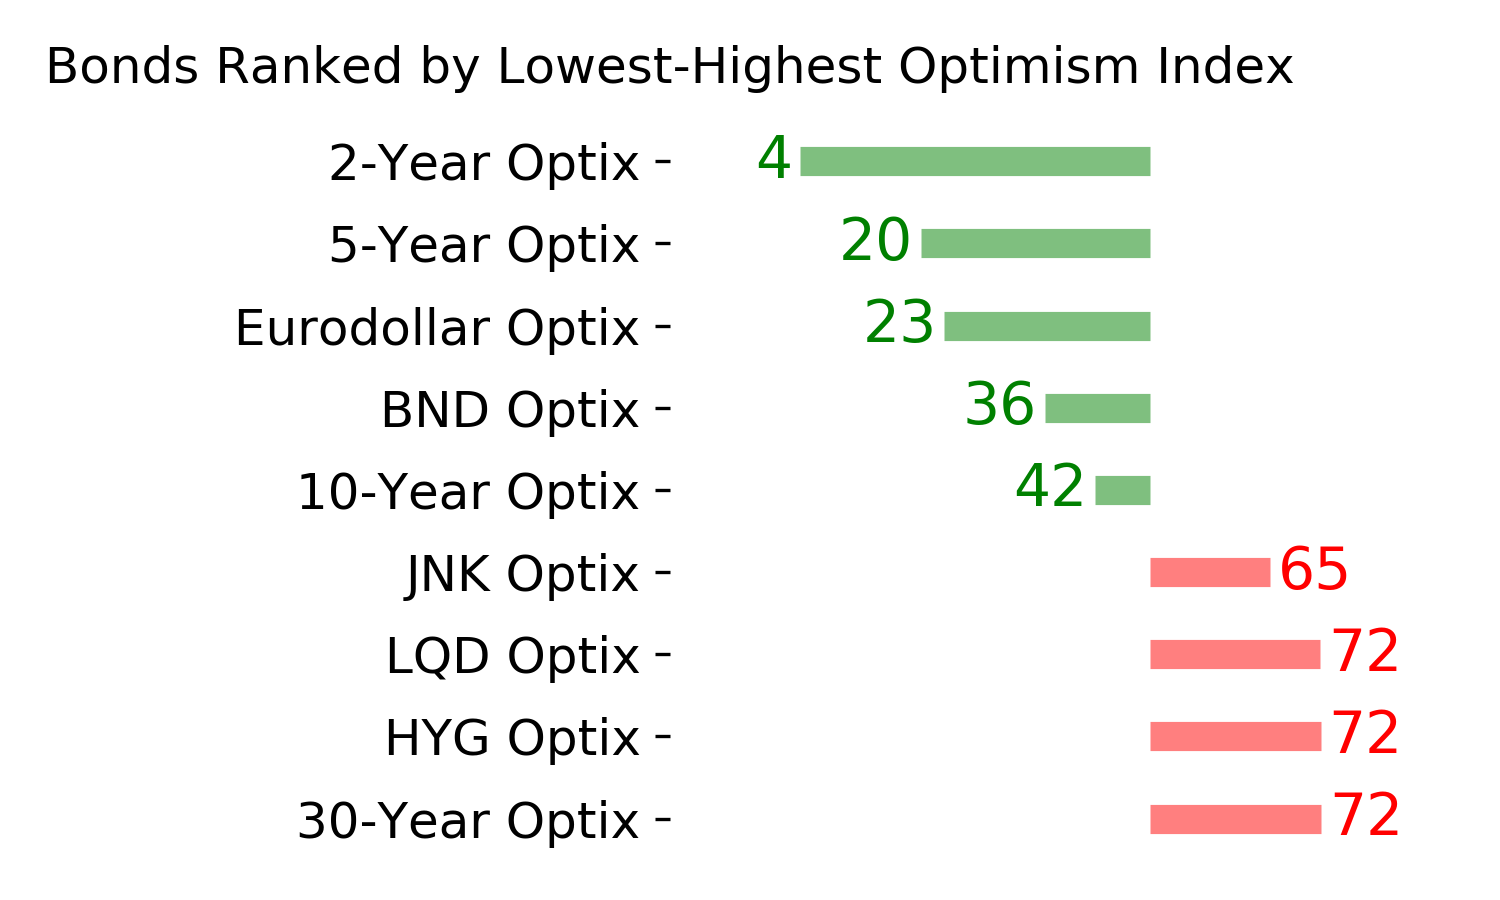
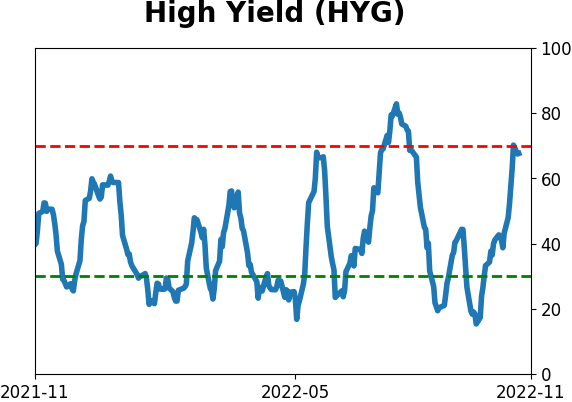
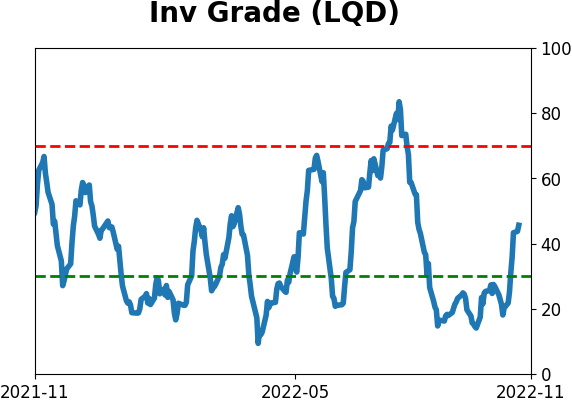
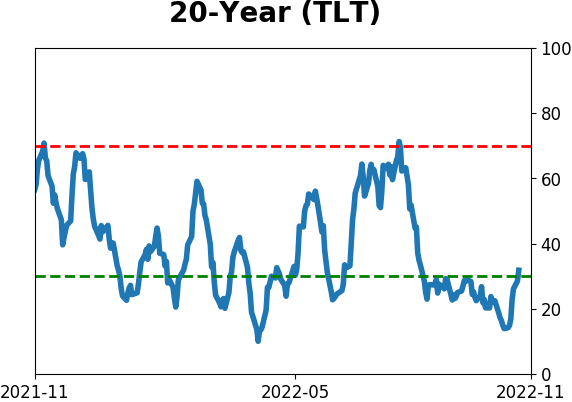
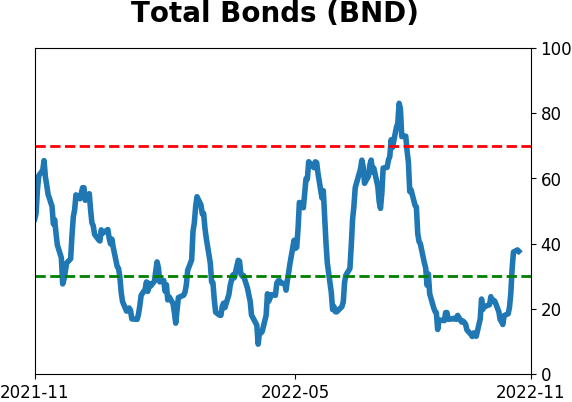
Bond ETF's - 10-Day Moving Average
|
|
|
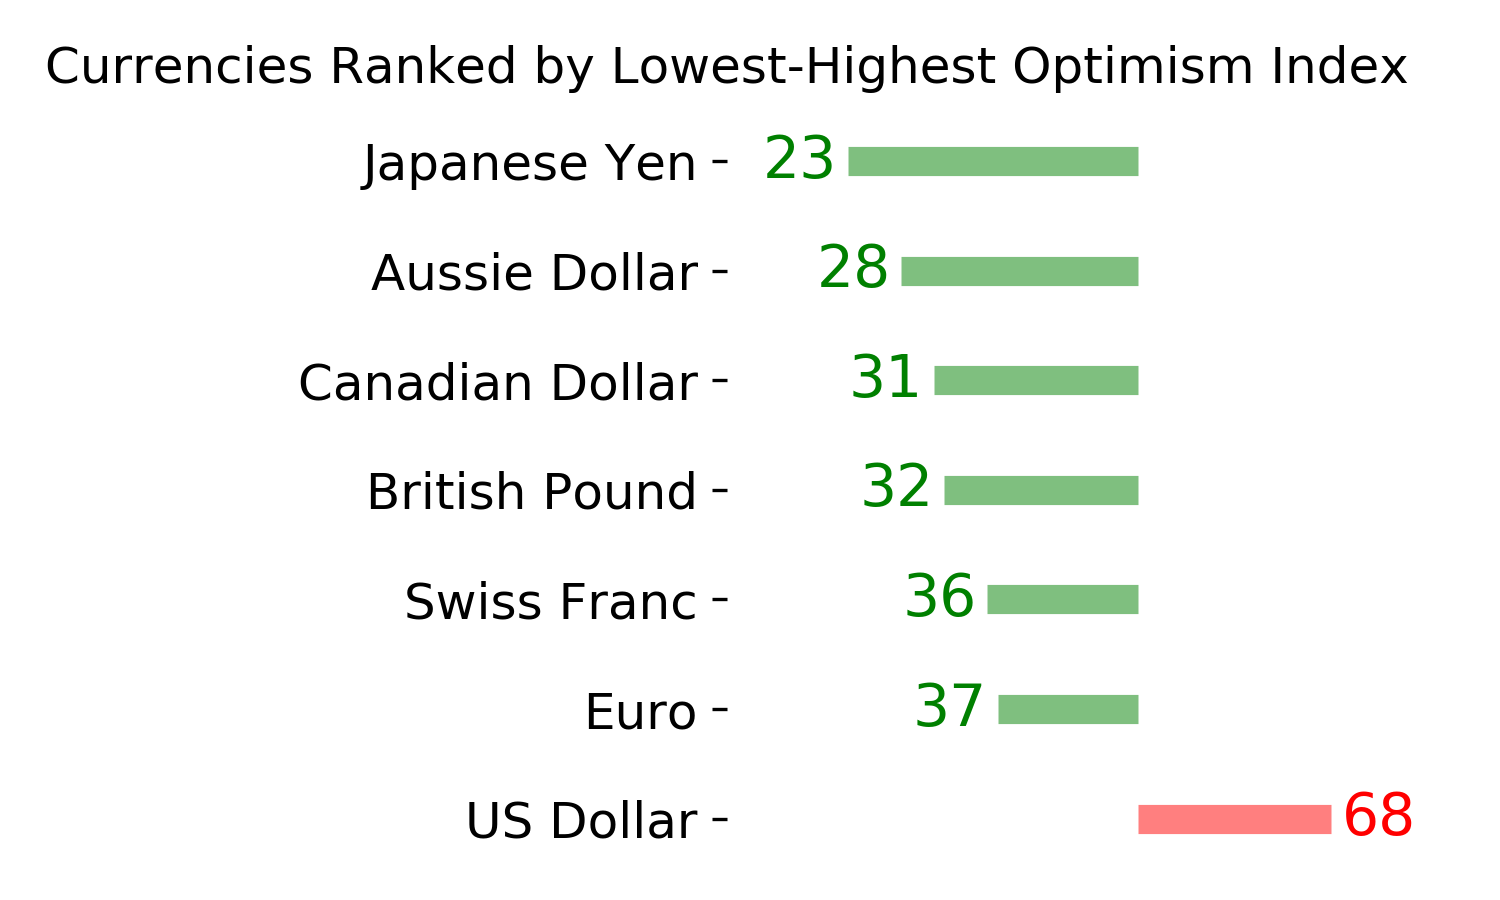
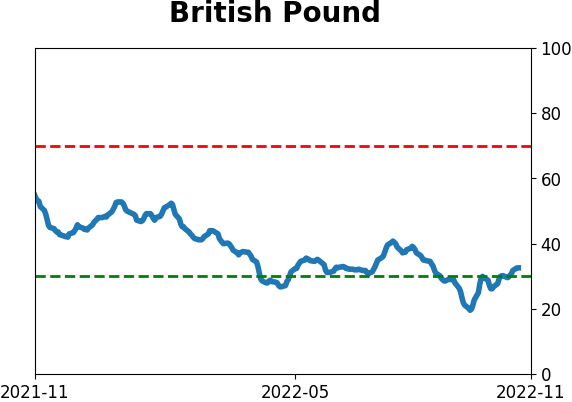
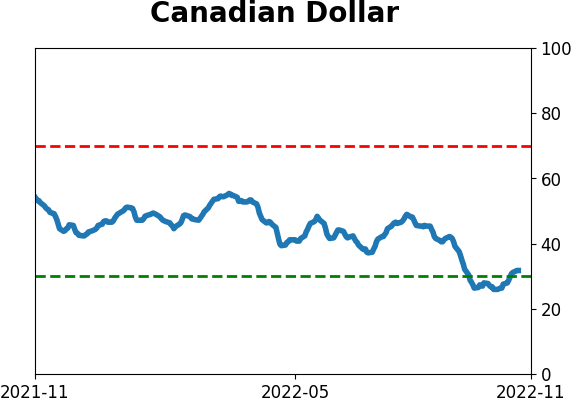
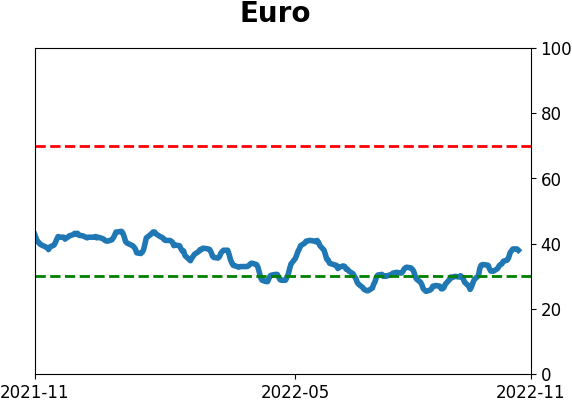
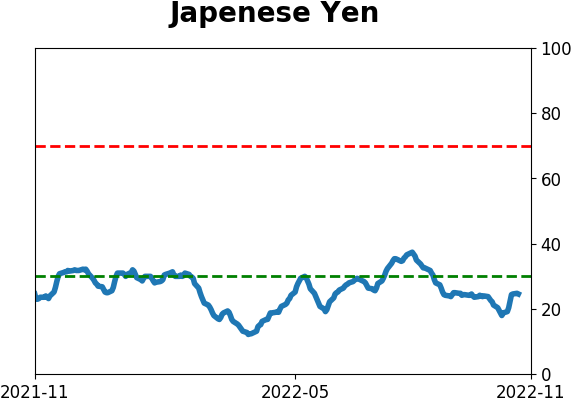
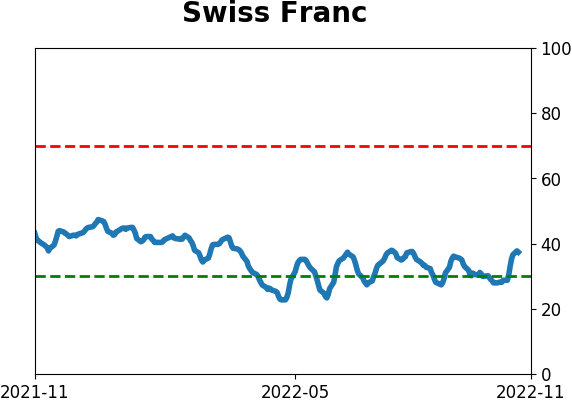
Currency ETF's - 5-Day Moving Average
|
|
|
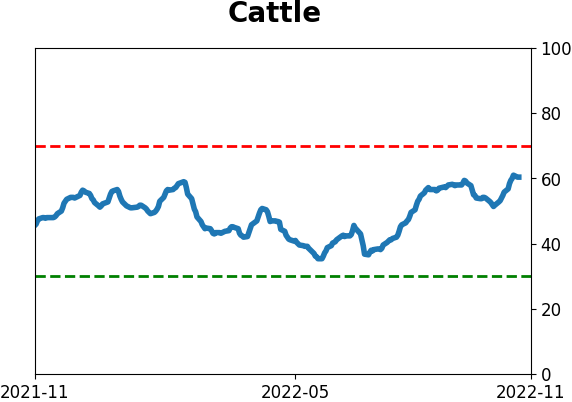
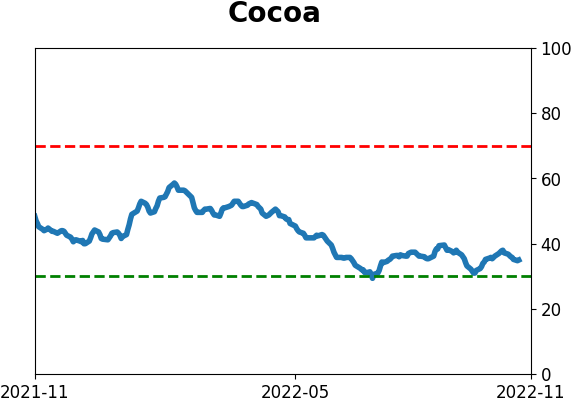
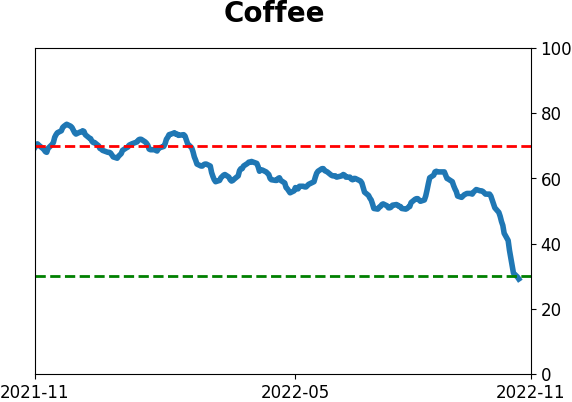
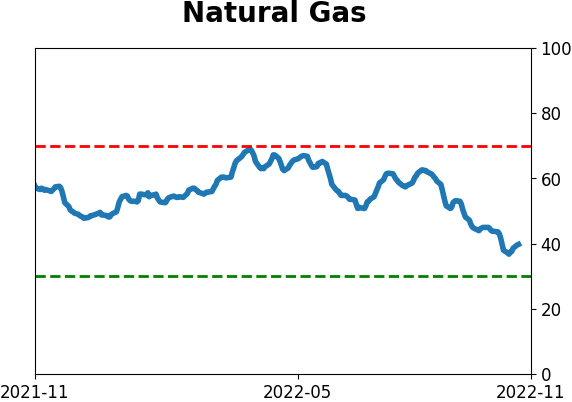
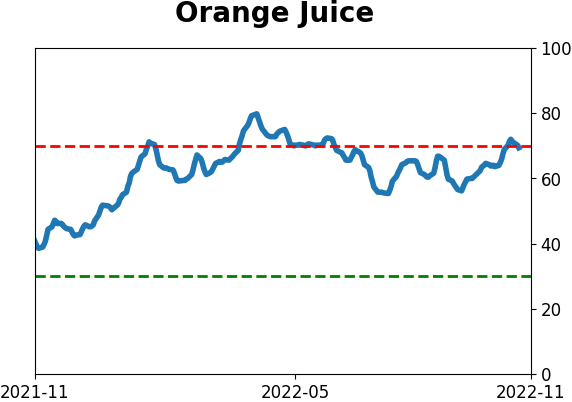
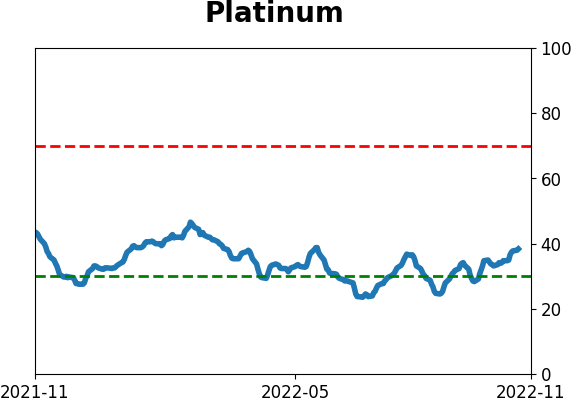
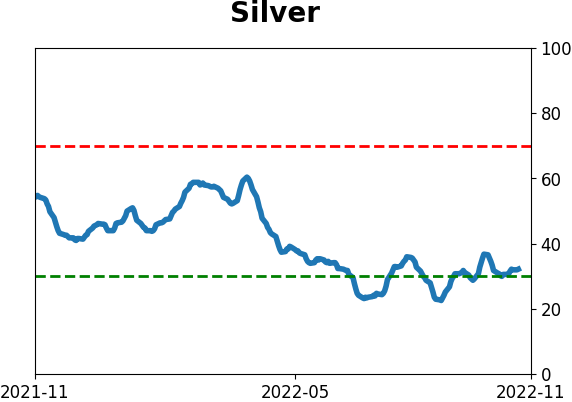
Commodity ETF's - 5-Day Moving Average
|
|