Headlines
|
|
Industrial stocks enjoy a historic breadth surge:
The surge in Industrial stocks pushed the McClellan Oscillator for the sector to one of the highest readings in 70 years. Other times it reached an extremely high level, the stocks tended to show strong 6-12 month returns. Corporate insiders have held off selling shares, another good sign.
|
Smart / Dumb Money Confidence
|
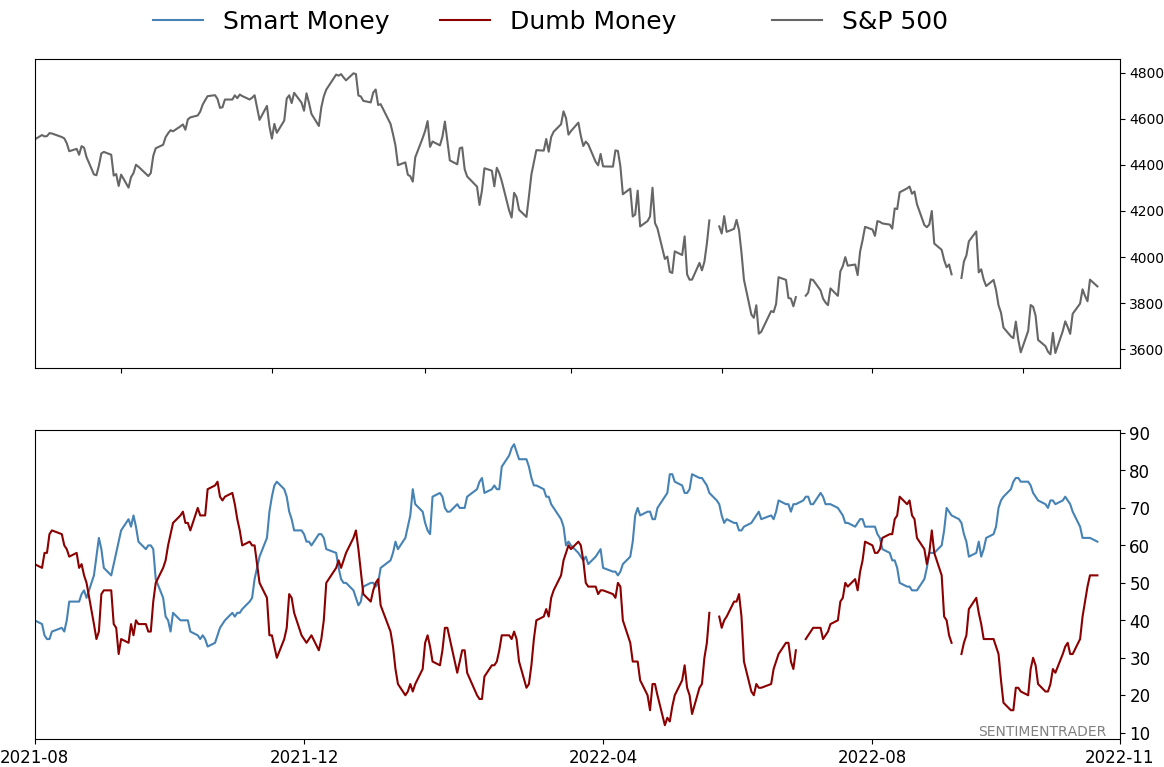
Smart Money Confidence: 61%
Dumb Money Confidence: 52%
|
|
Risk Levels
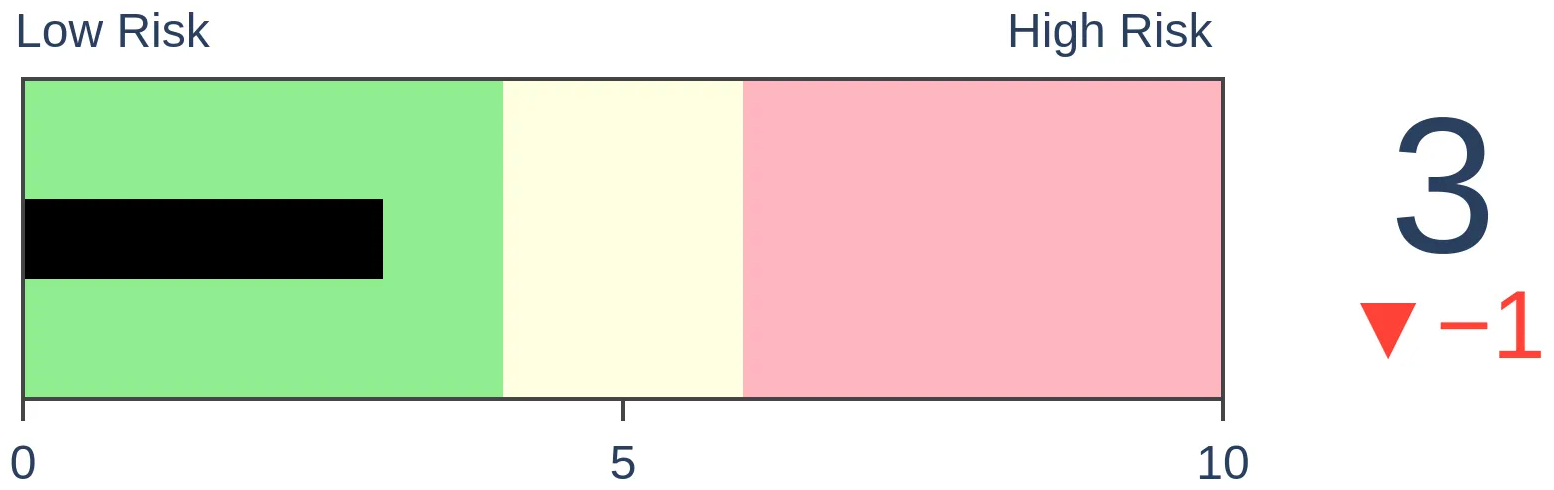
Stocks Short-Term
|
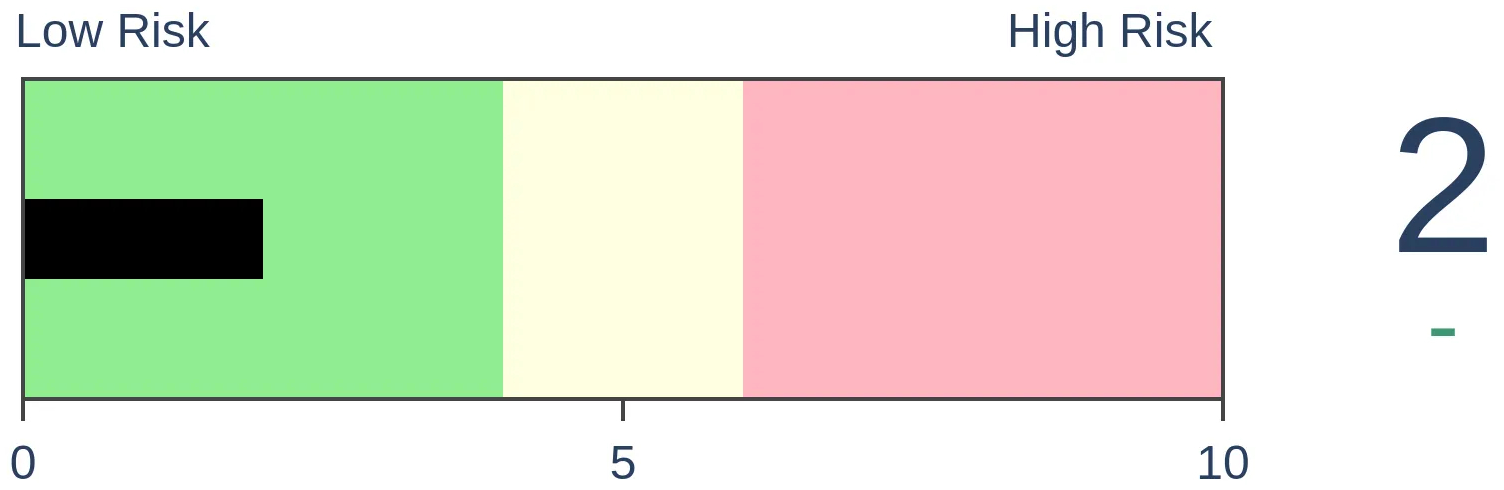
Stocks Medium-Term
|
|
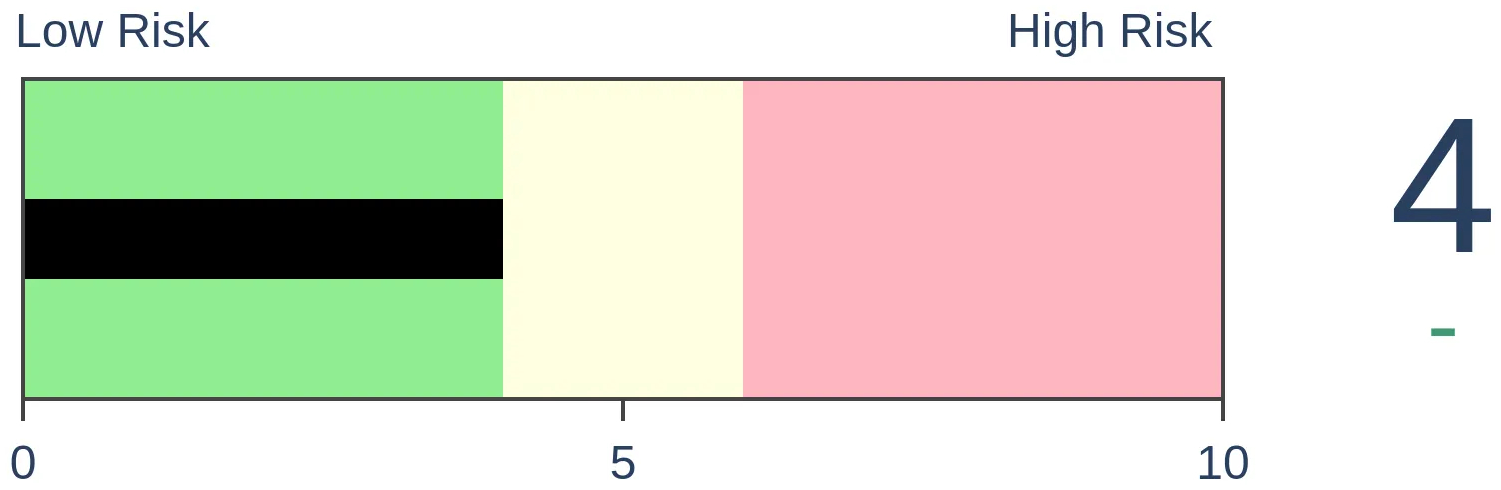
Bonds
|
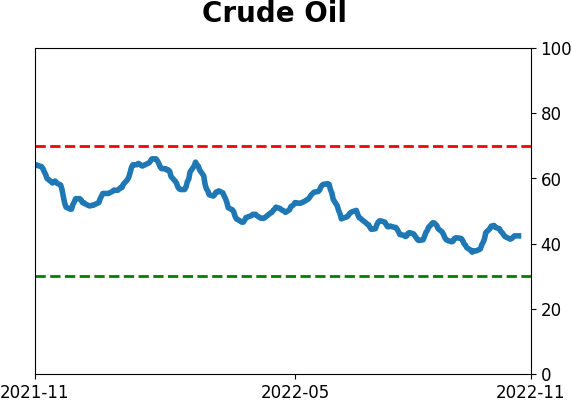
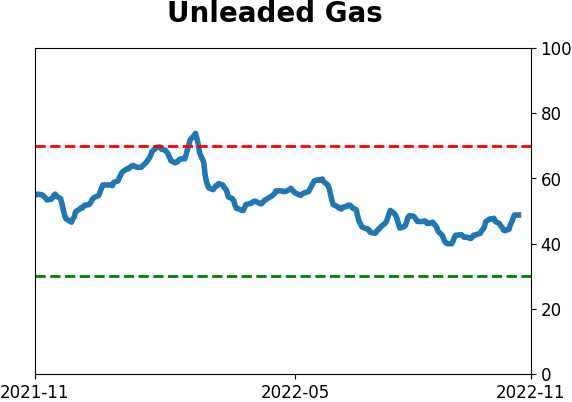
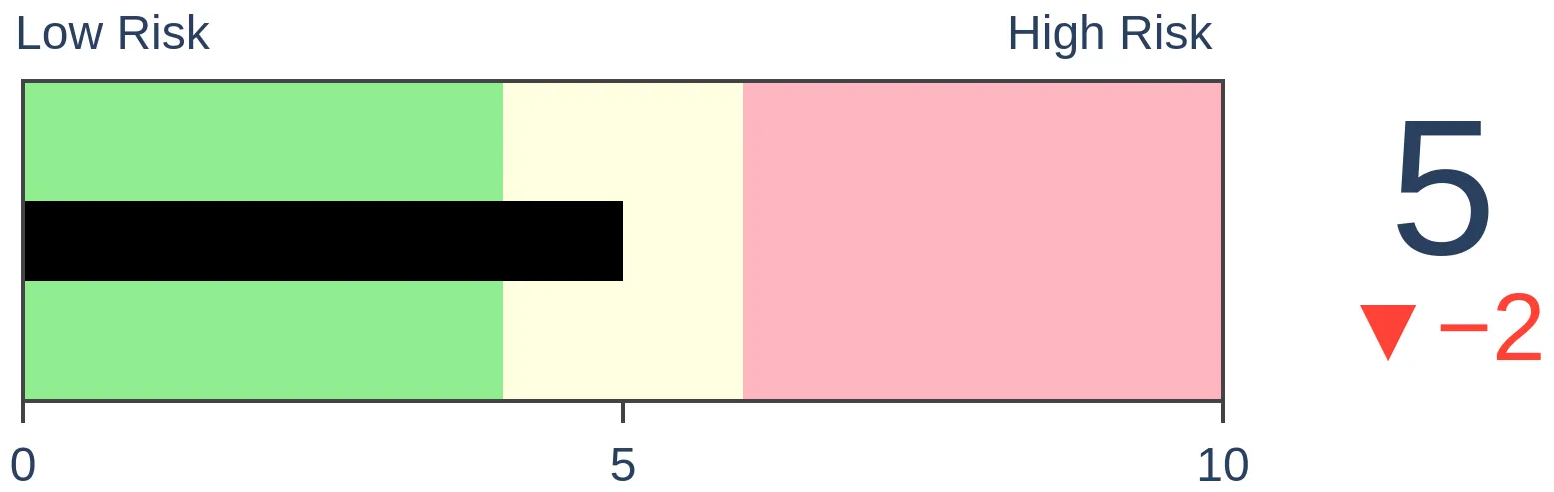
Crude Oil

|
|
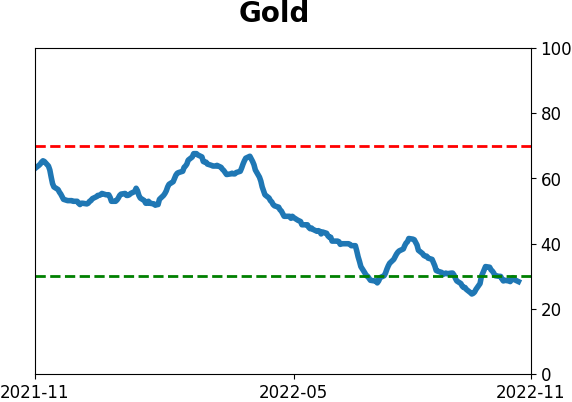
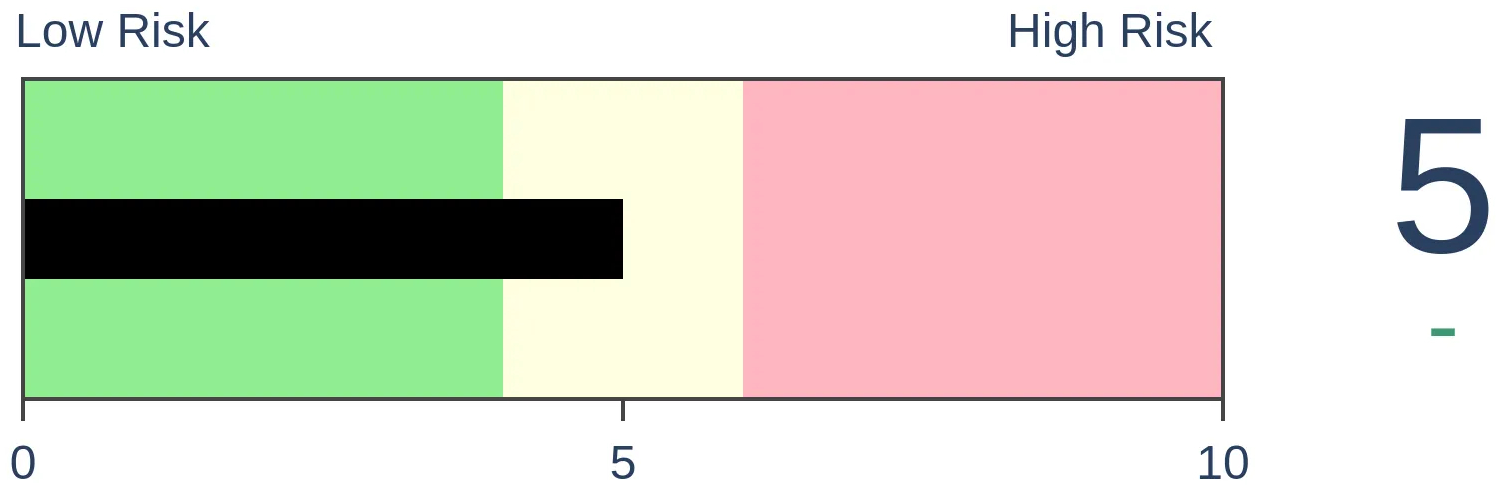
Gold
|
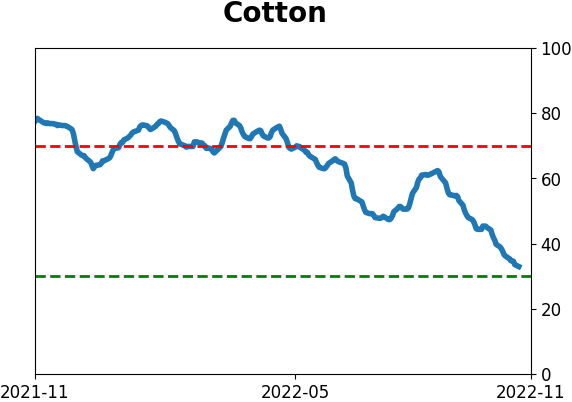
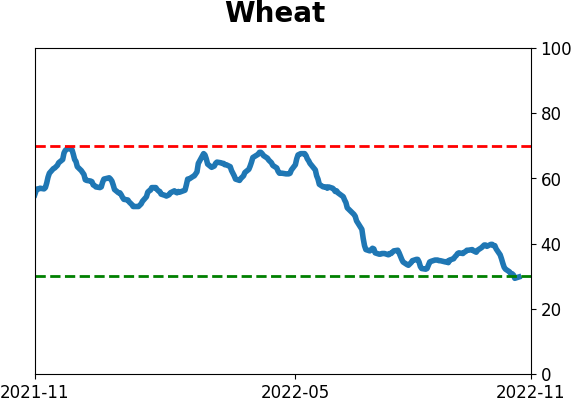
Agriculture
|
|
Research
By Jason Goepfert
BOTTOM LINE
The surge in Industrial stocks pushed the McClellan Oscillator for the sector to one of the highest readings in 70 years. Other times it reached an extremely high level, the stocks tended to show strong 6-12 month returns. Corporate insiders have held off selling shares, another good sign.
FORECAST / TIMEFRAME
DIA -- Up, Long-Term
|
Key points:
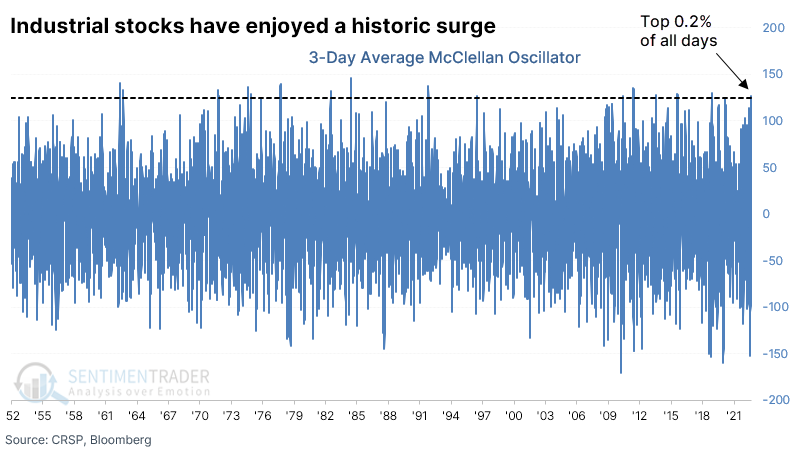
- Industrial stocks have enjoyed a historic surge, with the McClellan Oscillator among the highest levels ever
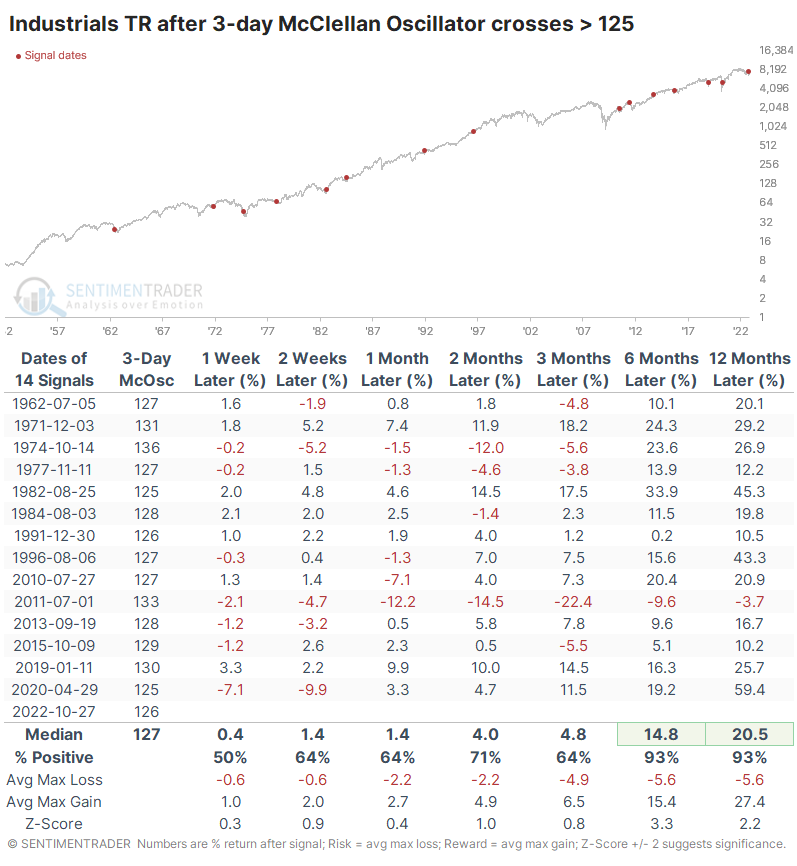
- Similar readings in the indicator over the past 60 years preceded solid long-term returns
- Corporate insiders have been loathe to sell the stocks, another positive sign
Industrial stocks enjoy a historic revival
It was a miserable week for big tech last week. But money's gotta go somewhere, and it flowed into Industrial stocks, for one.
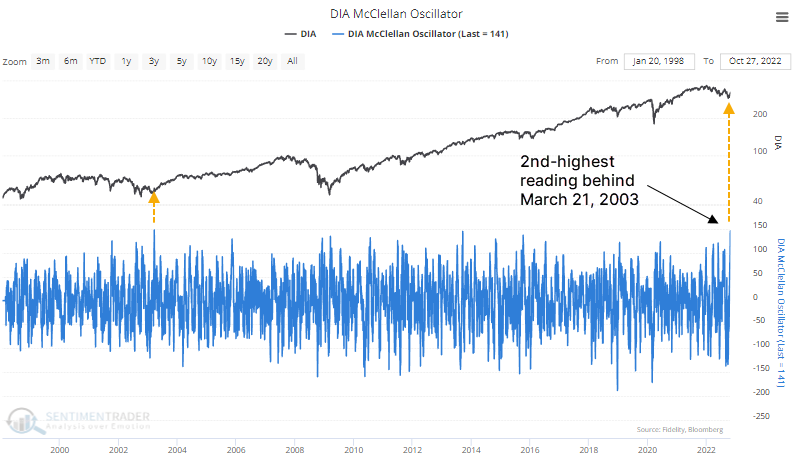
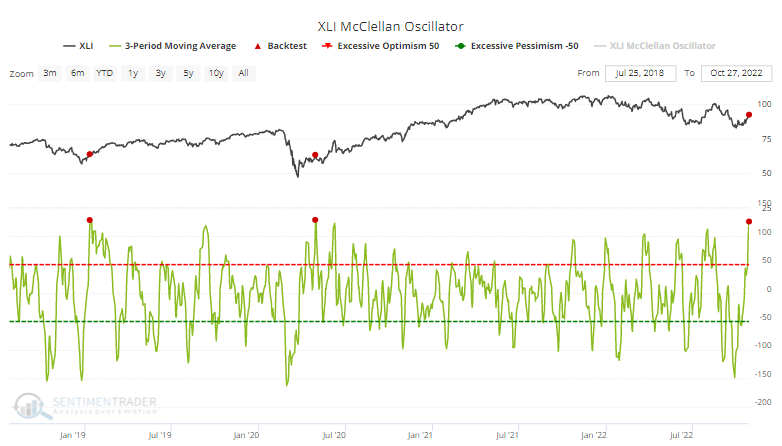
For the Dow Industrials, the number of advancing stocks has overwhelmed declining stocks so much that the McClellan Oscillator surged to its 2nd-highest level in our database. The only day to (barely) exceed it was in March 2003, as stocks emerged from the post-bubble bear market.
With only 30 stocks, breadth measures for the Dow can get kind of screwy. But even the broader Industrial sector has seen a similar surge. Over three sessions, the McClellan Oscillator for that sector exceeded an average of 125 for only the 3rd time in recent decades. Both occurred during the kick-off phases of new bull markets.
Using additional data sources, going back to 1952, the jump in the Oscillator for the Industrial sector ranks in the top 0.2% of all days.
After the 3-day Oscillator exceeded 125, Industrials showed excellent 6-12 month returns. There was only one loss out of the fourteen signals, it was relatively minor, and it was more than erased in subsequent months.
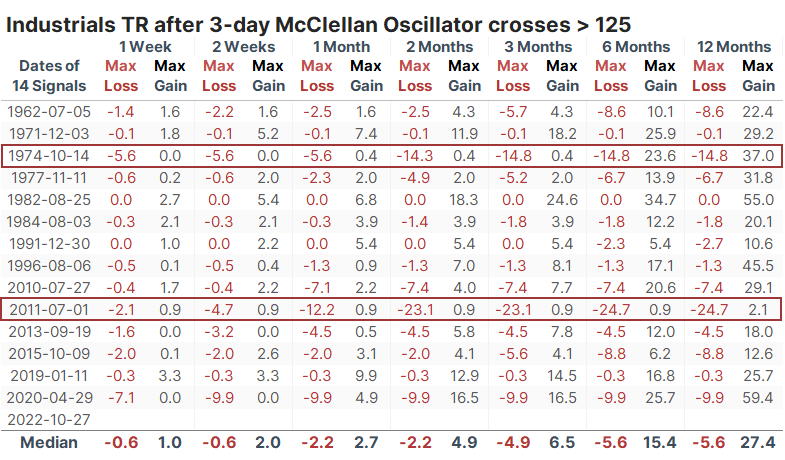
Within the next twelve months, only two signals suffered a drawdown exceeding -10%. The 2011 loss was an outlier because it was one of the very few times there was a surge like this while the sector was trading near a 52-week high. That is certainly not the case now.
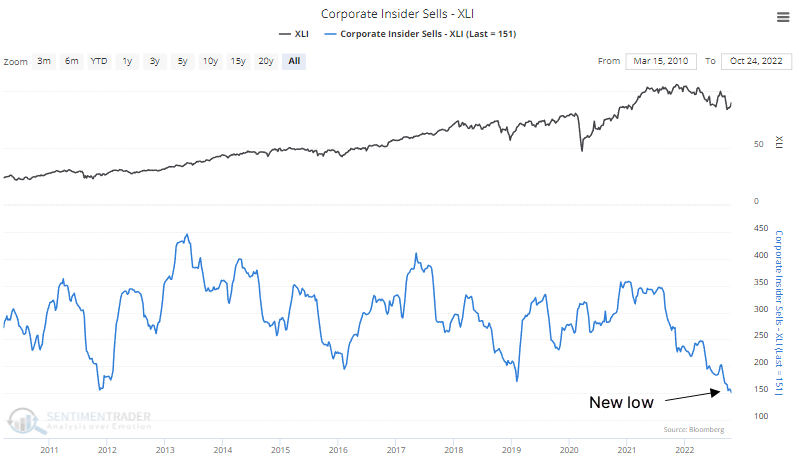
As we saw in the broader market, corporate insider selling transactions over the past six months have trailed off to the lowest since at least 2010.
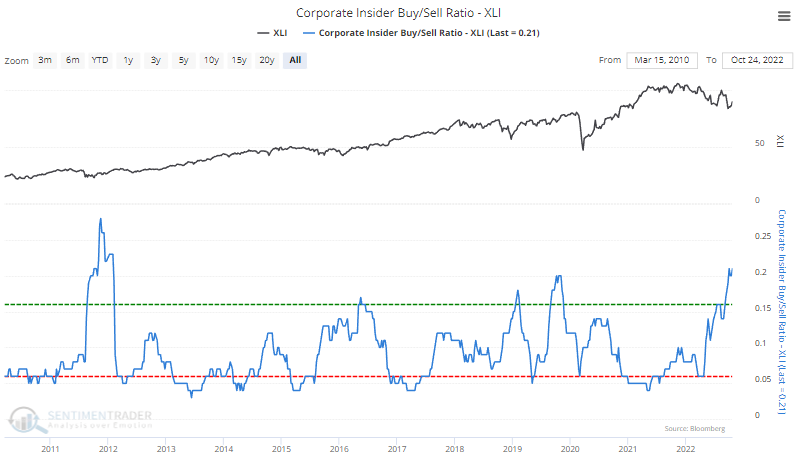
Combined with an increase in buying interest, the Buy/Sell Ratio among Industrial companies is at the 2nd-highest level since then.
Another potential tailwind is the calendar. The annual seasonal trend for Industrial stocks turns up this week.

What the research tells us...
There is often a short-term pause when there is a historic surge in a sector or index, particularly a less volatile one. Investors tend to take time to reassess their sudden love for stocks that typically don't undergo the volatility typical to more speculative investments. Signs of overwhelming buying interest, however, do tend to indicate longer-term shifts in priorities, and there are compelling signs that's what we've witnessed in recent sessions with Industrial stocks. It should bode well for them in the months ahead.
Indicators at Extremes
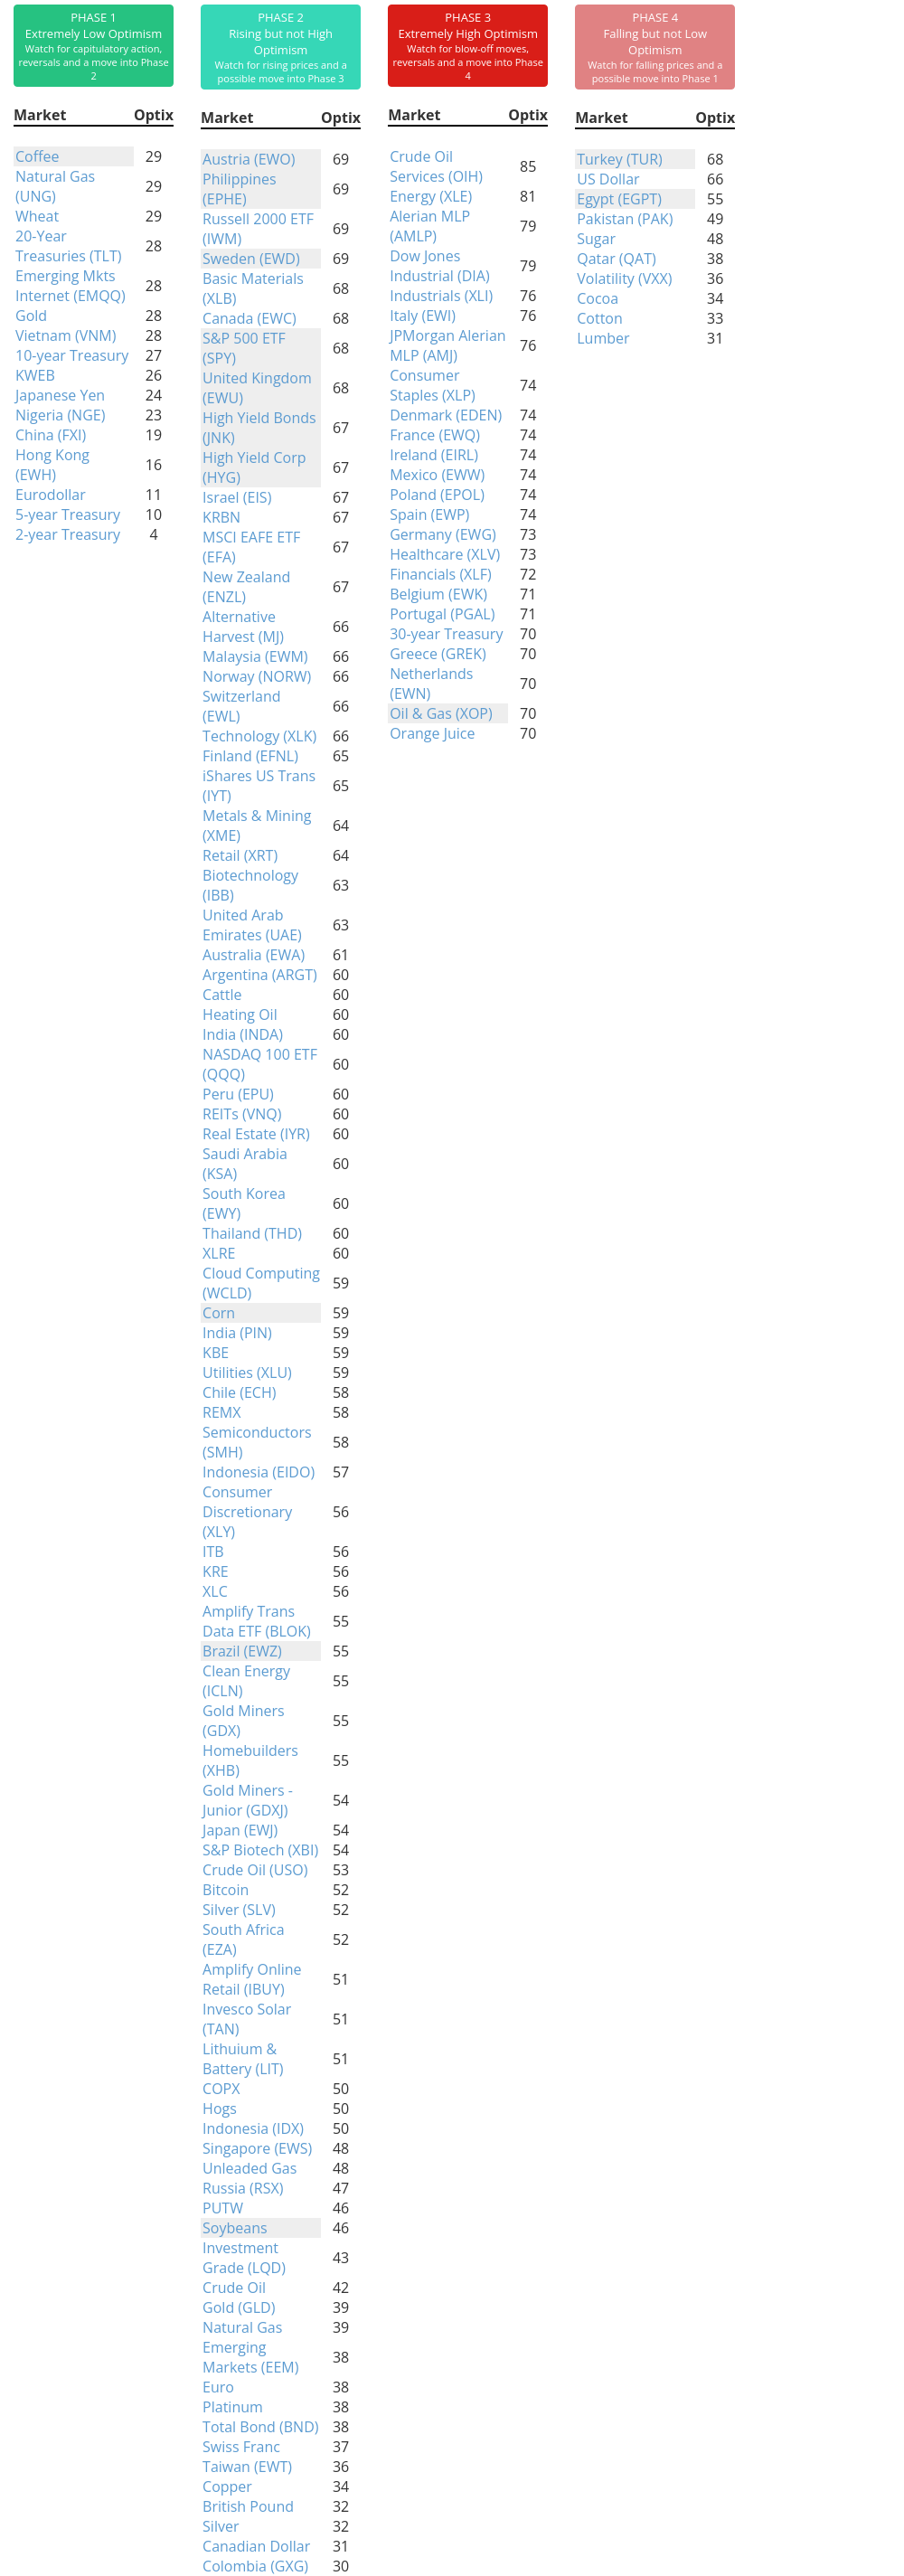
Phase Table
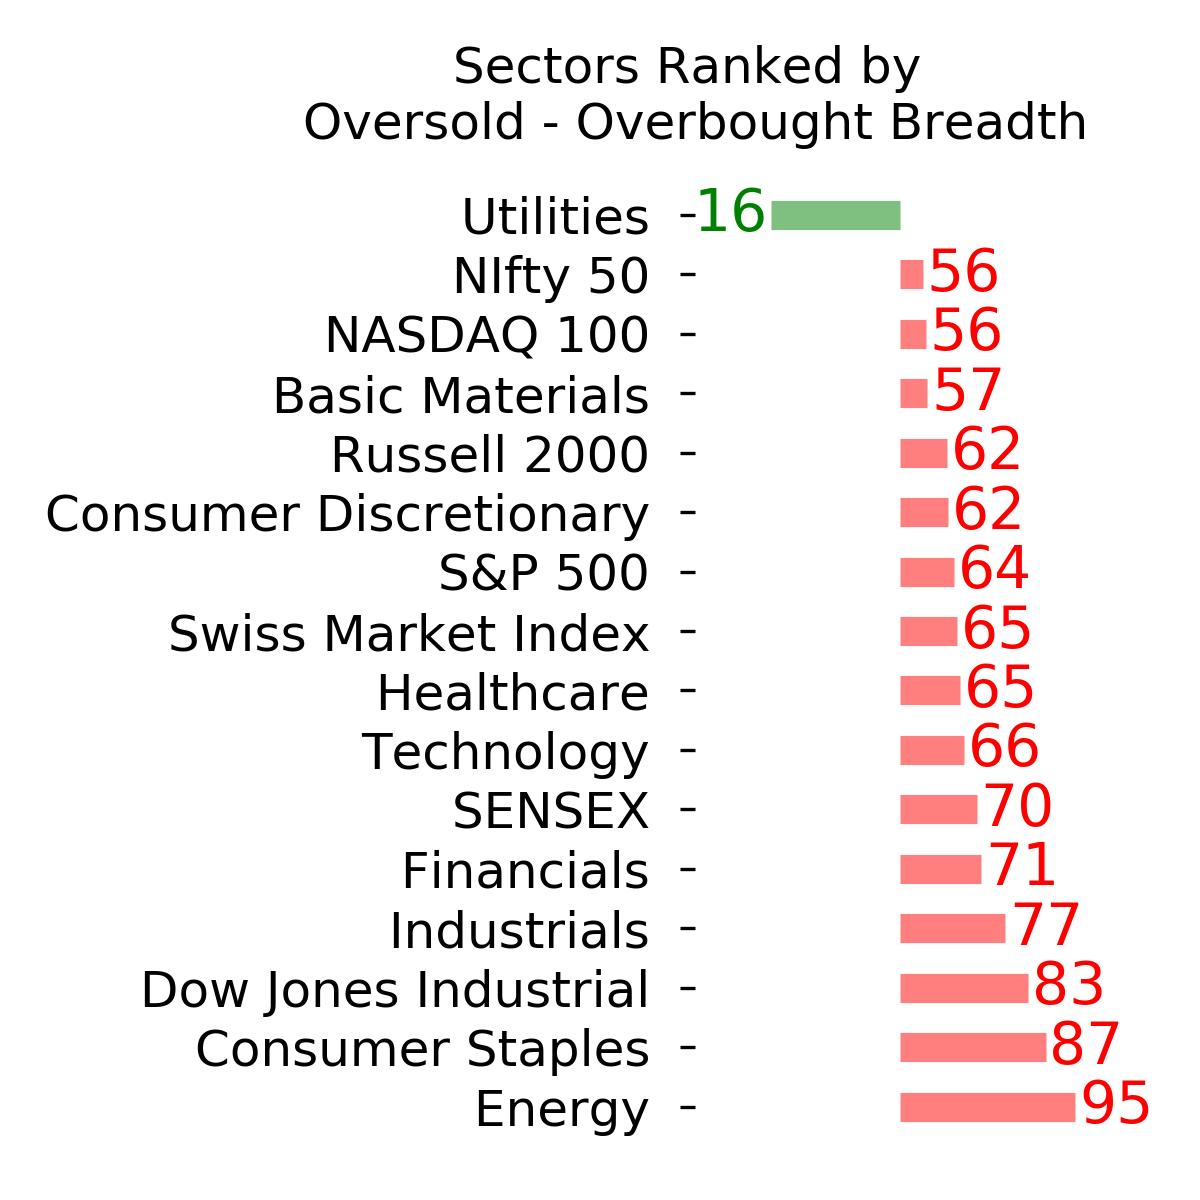
Ranks
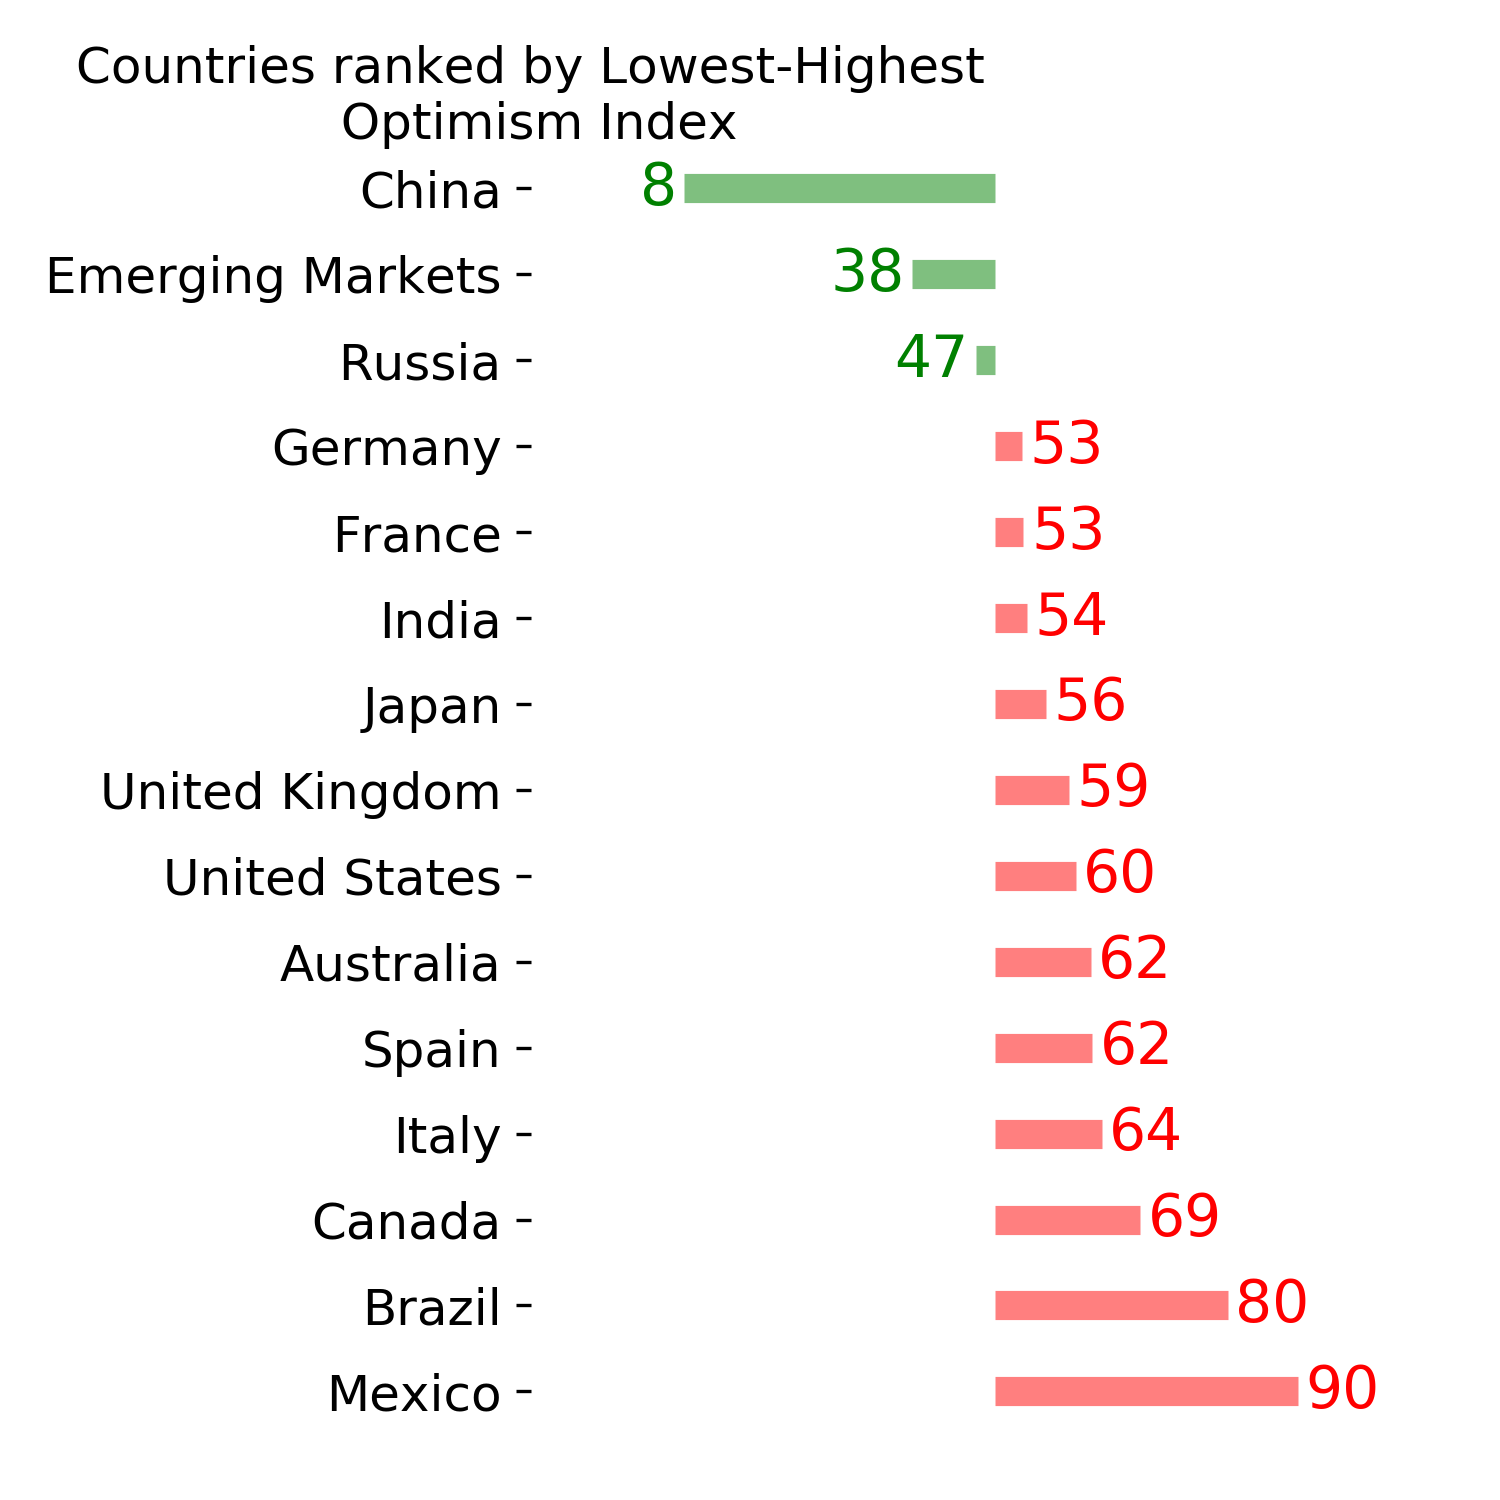
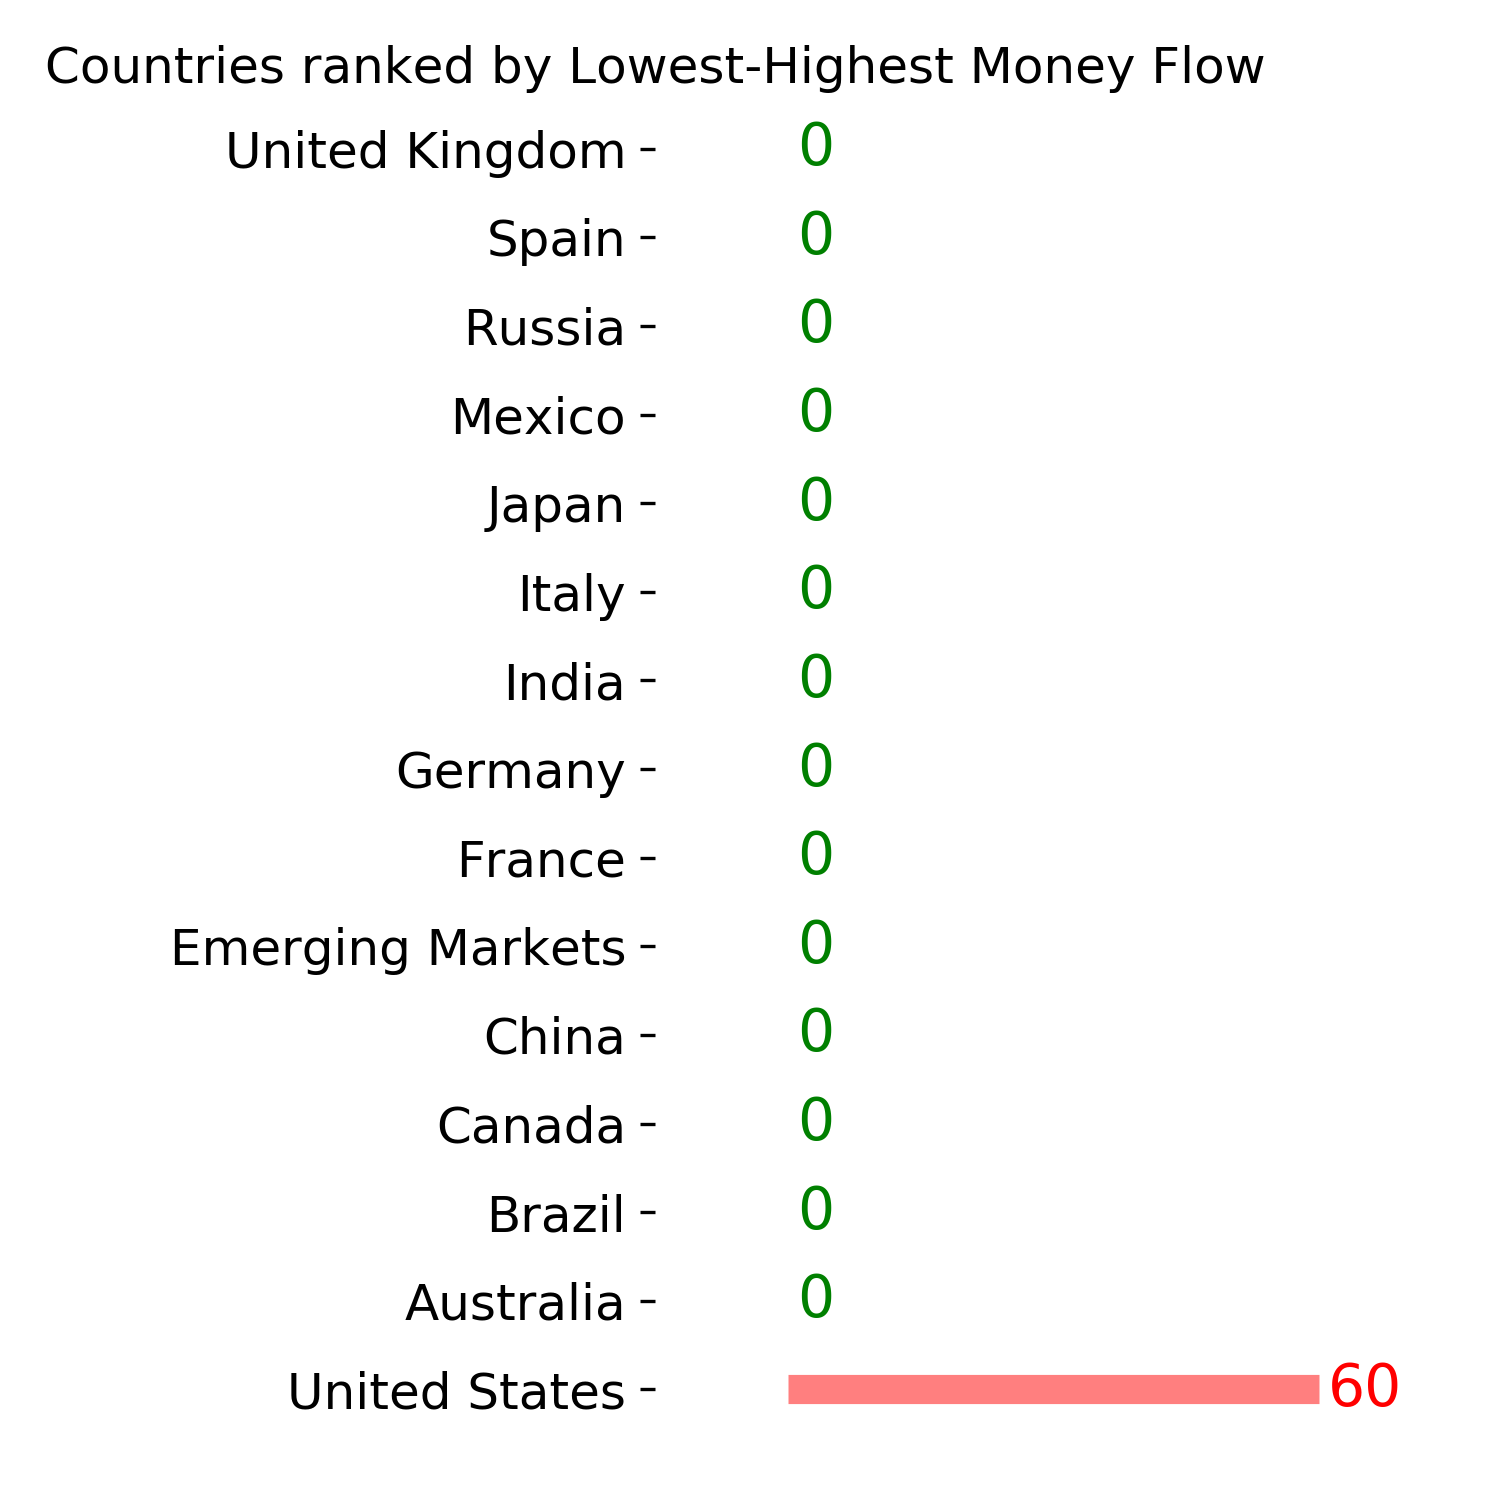
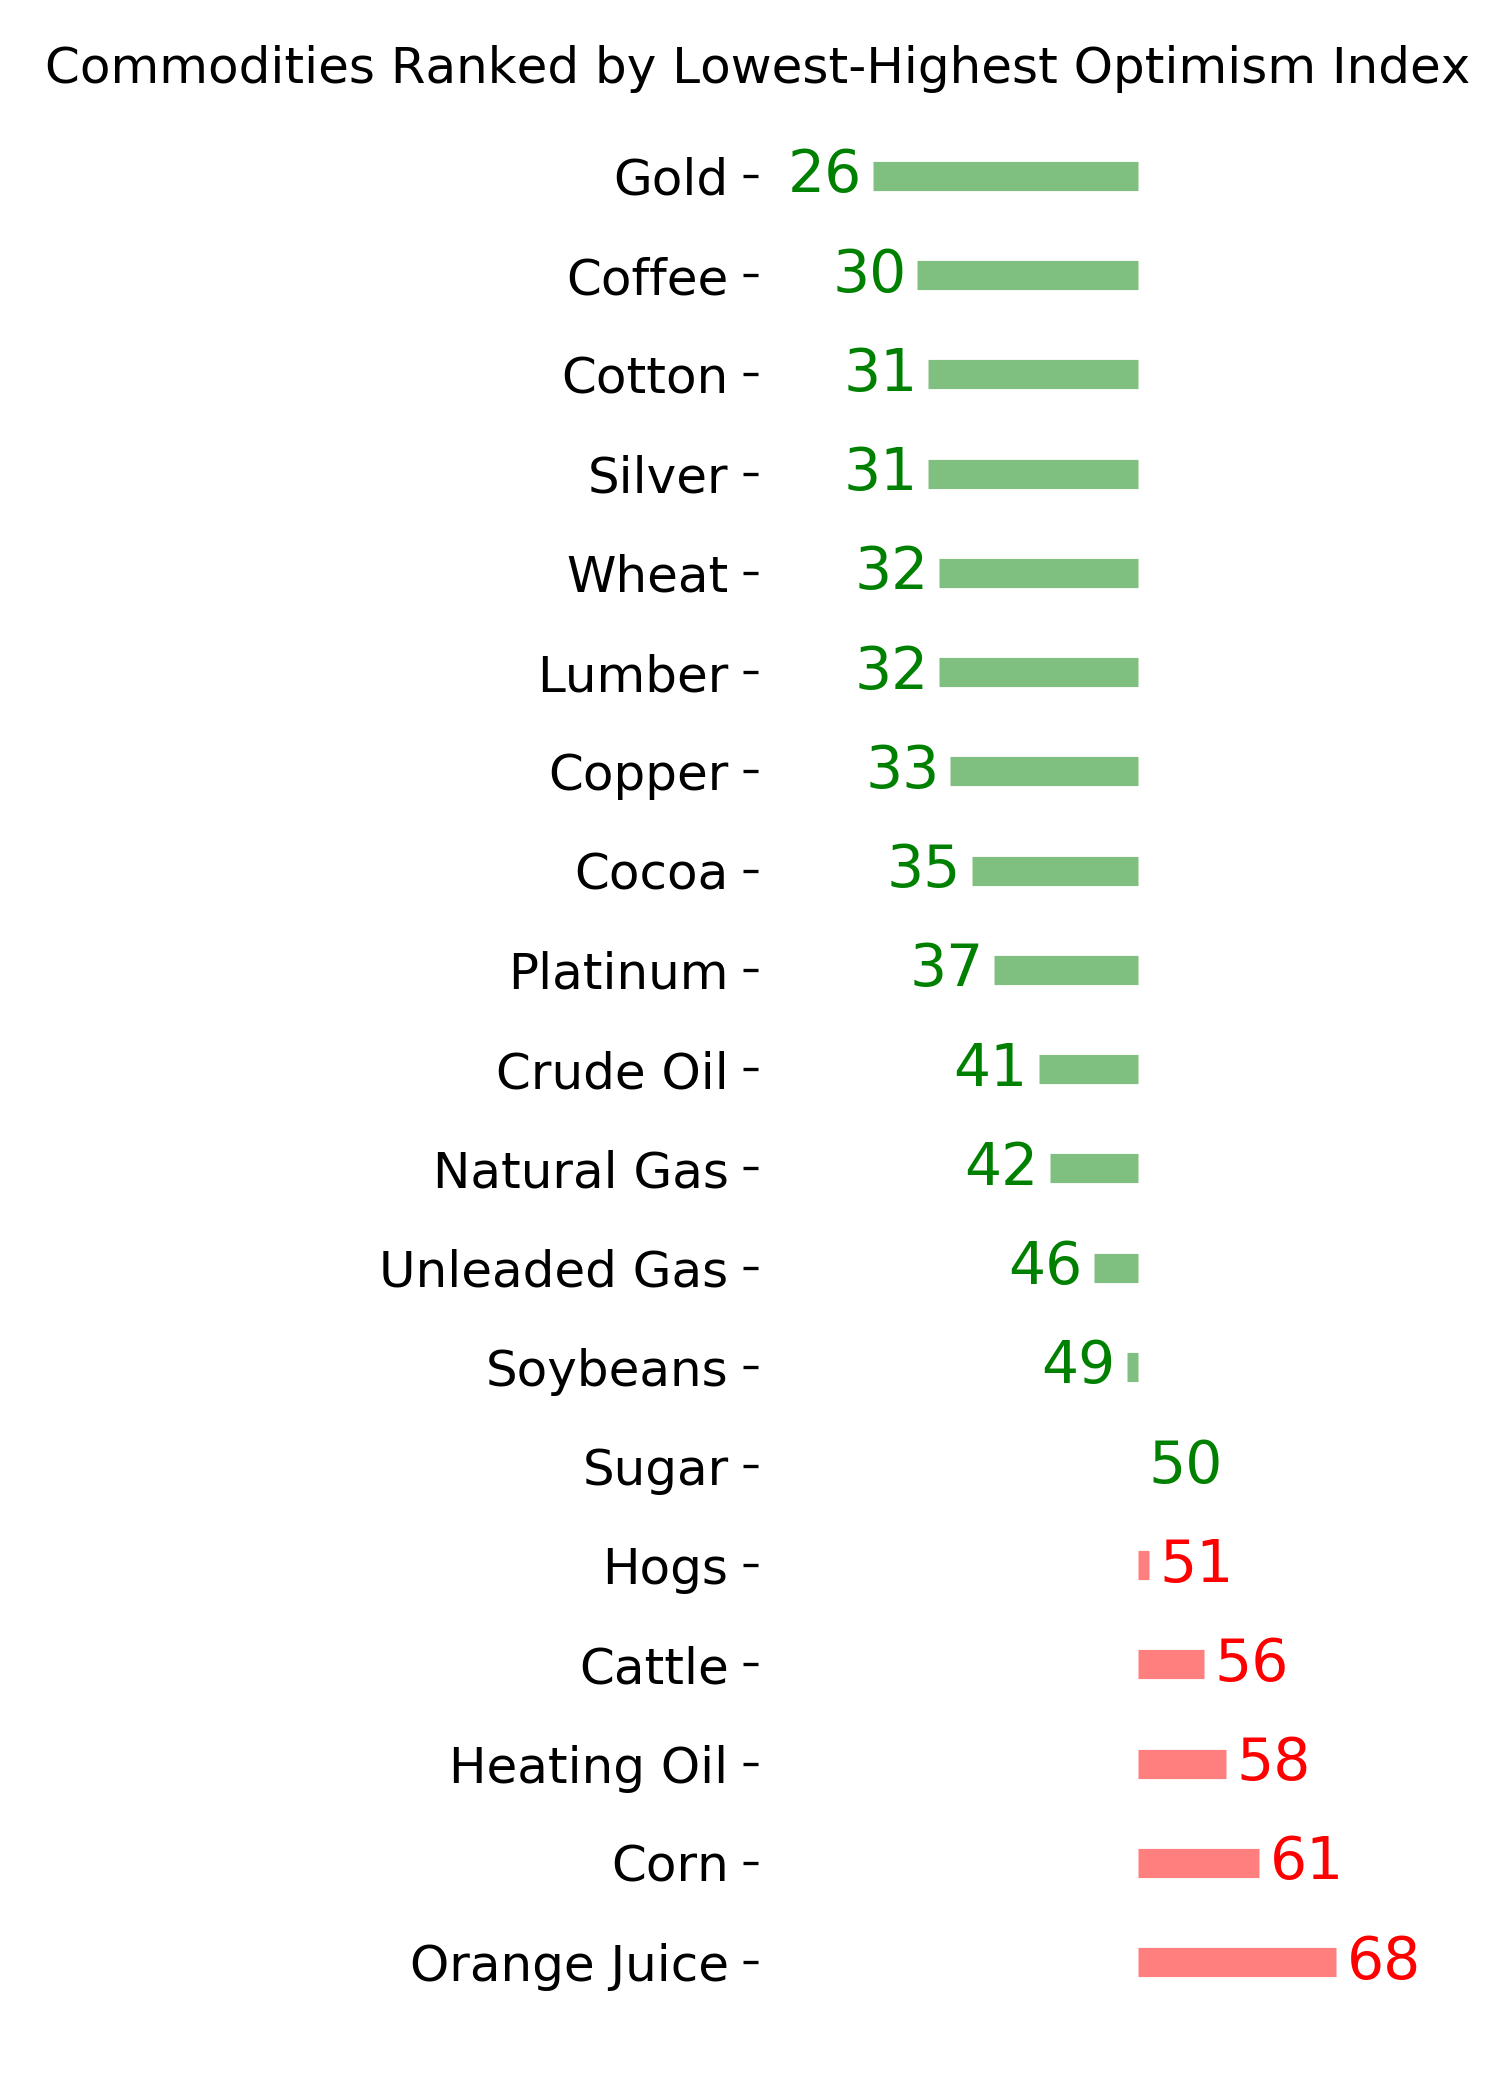
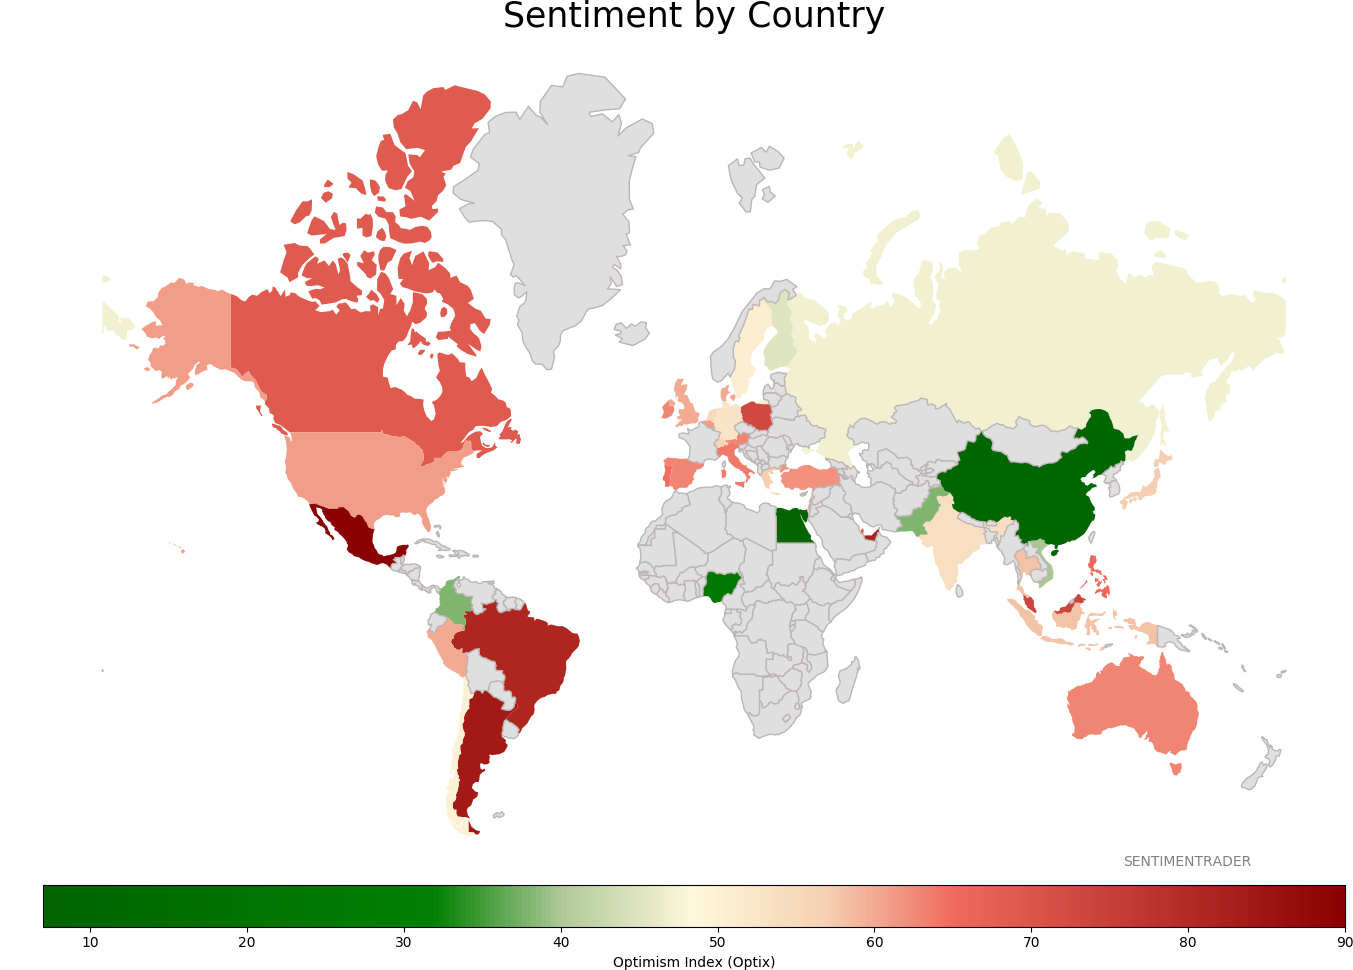
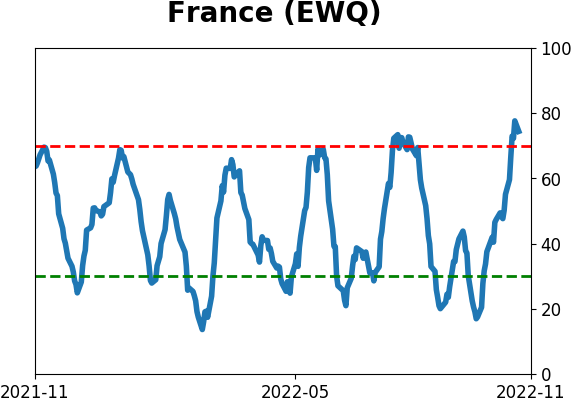
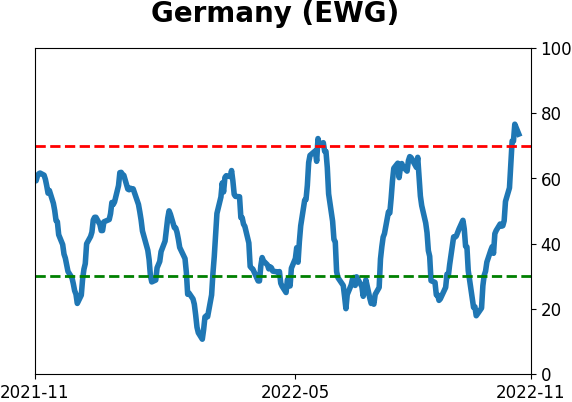
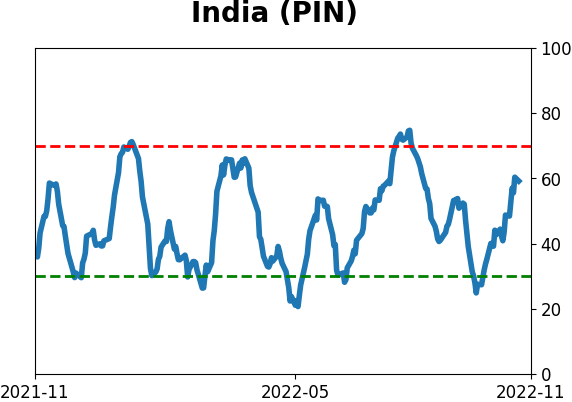
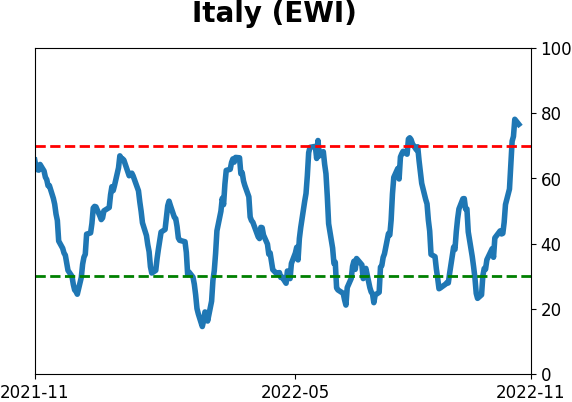
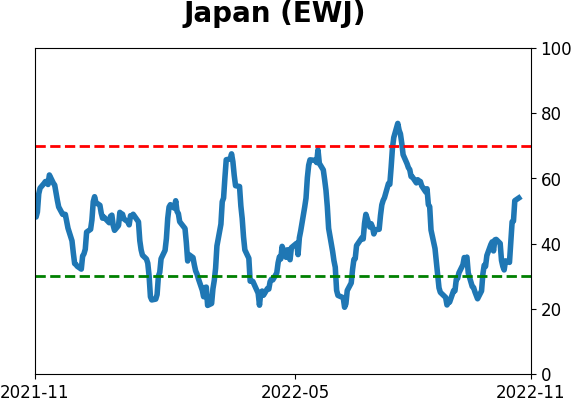
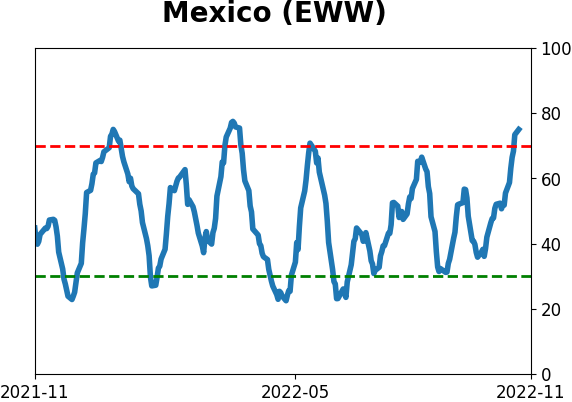
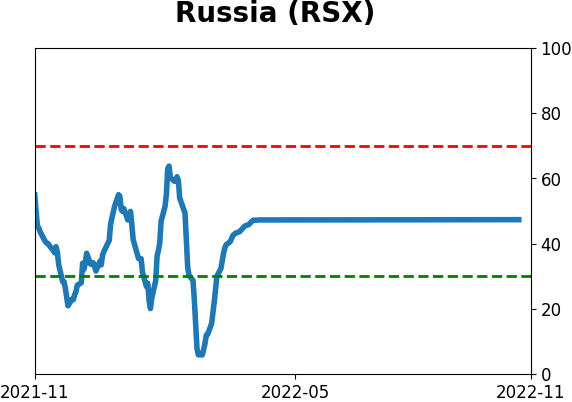
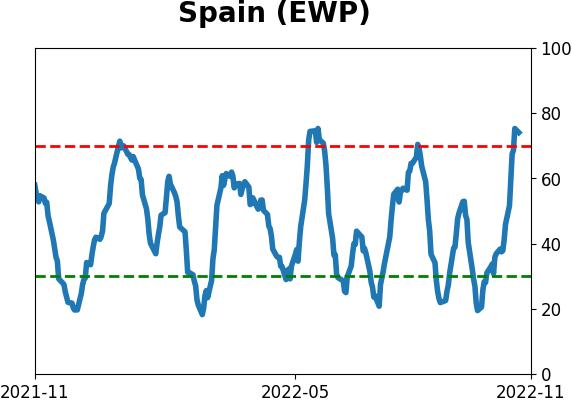
Sentiment Around The World
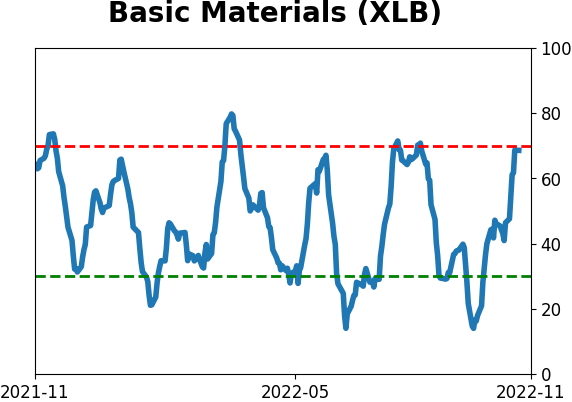
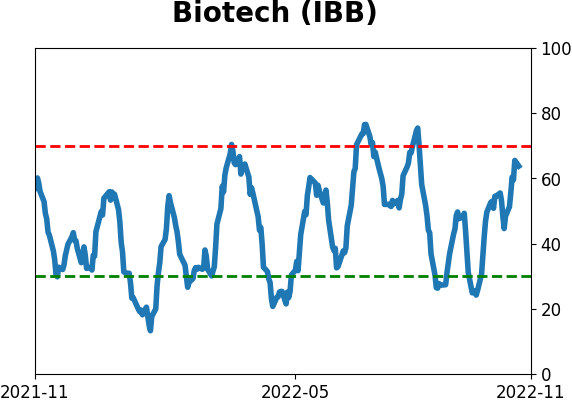
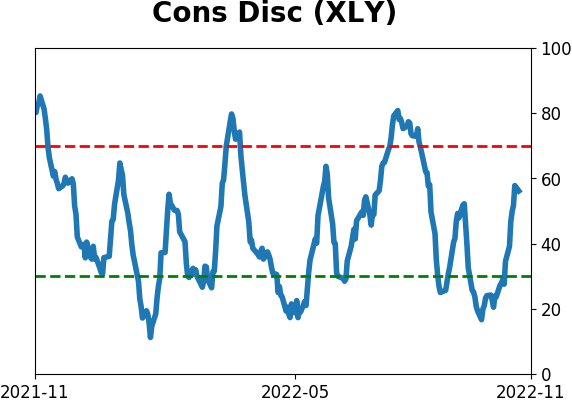
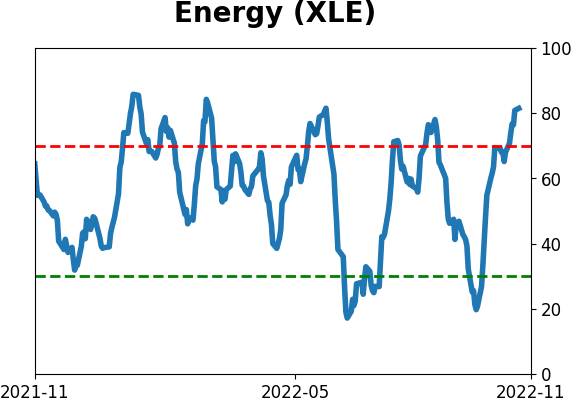
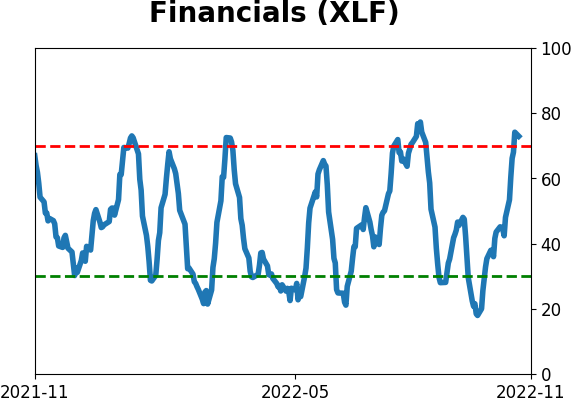
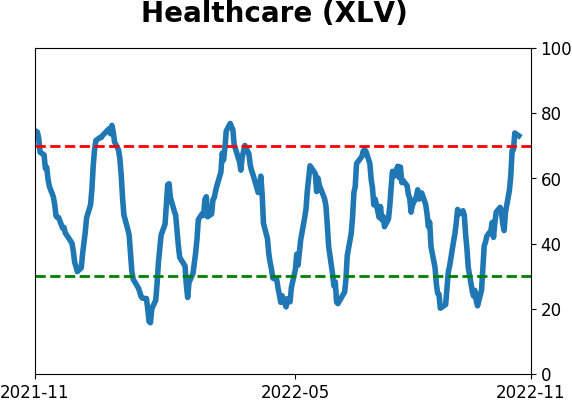
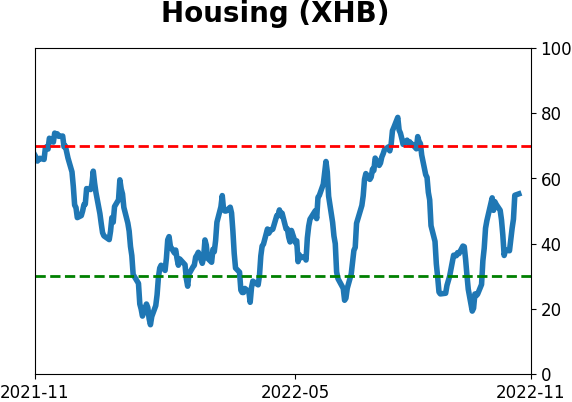
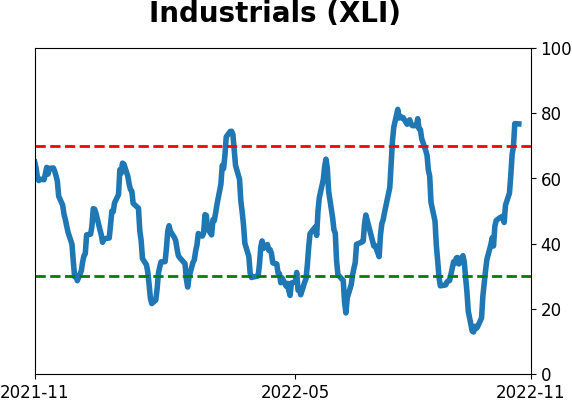
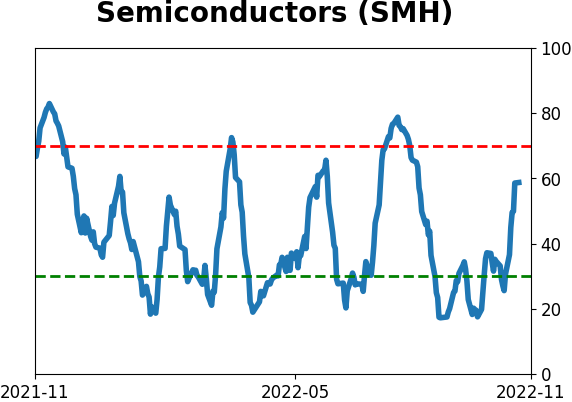
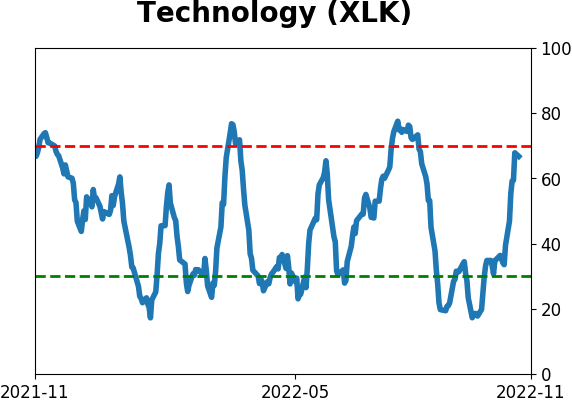
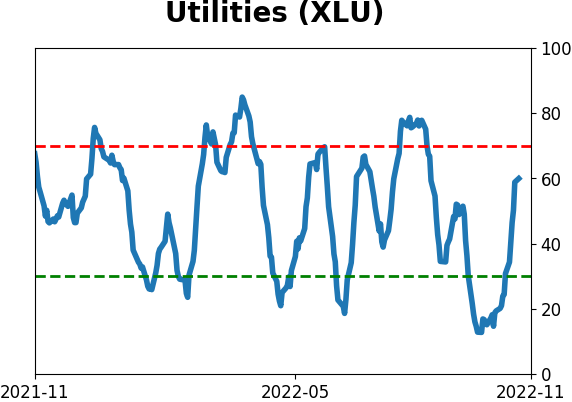
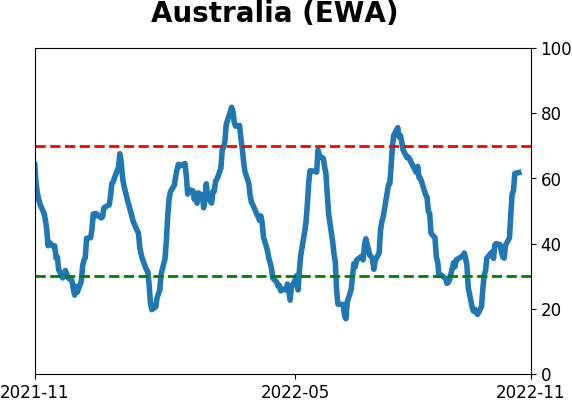
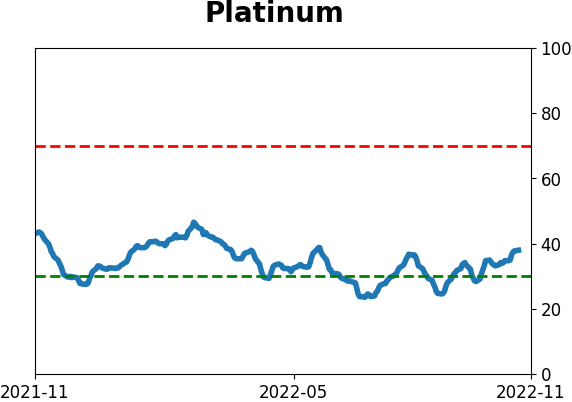
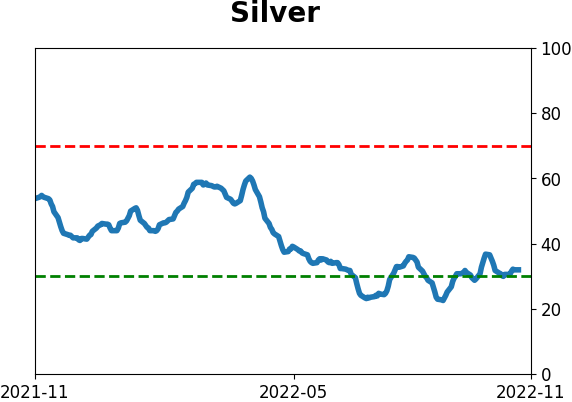
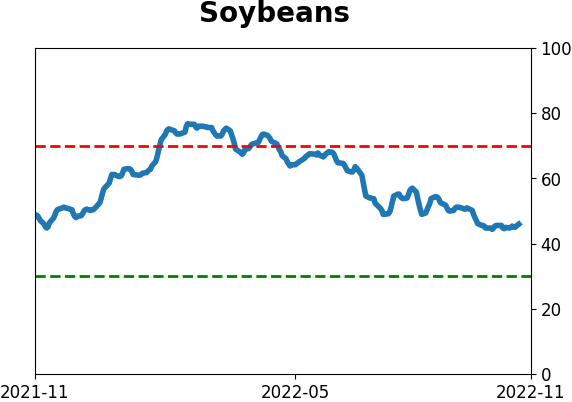
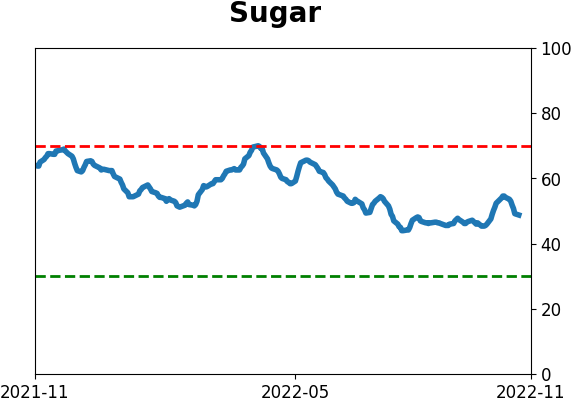
Optimism Index Thumbnails
|
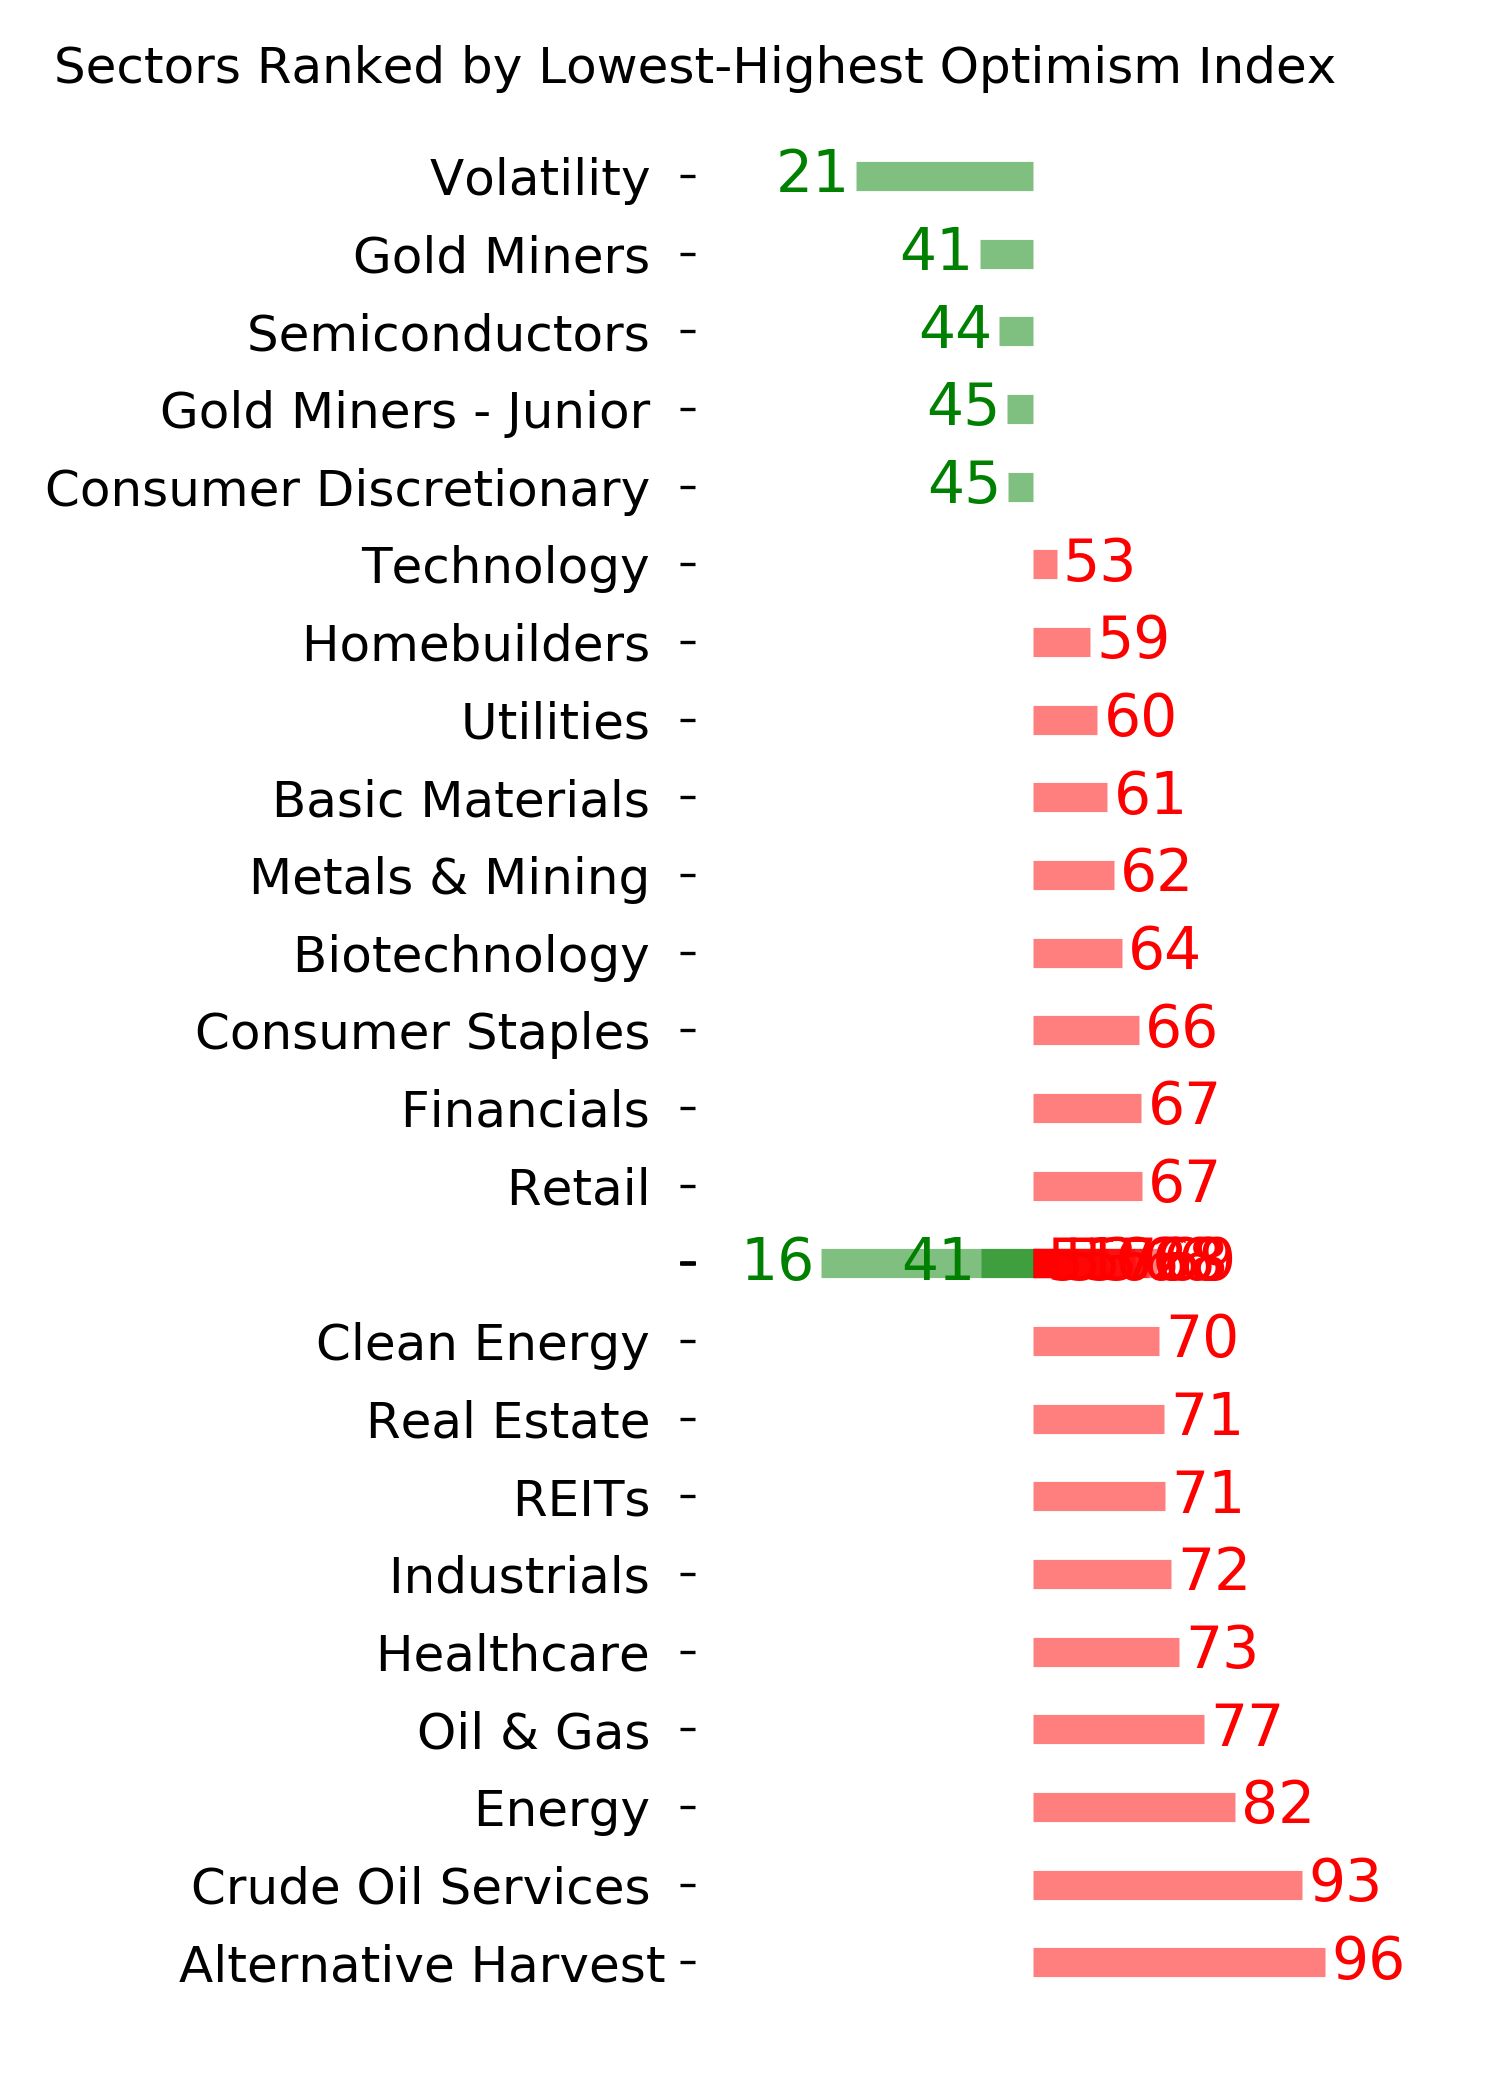
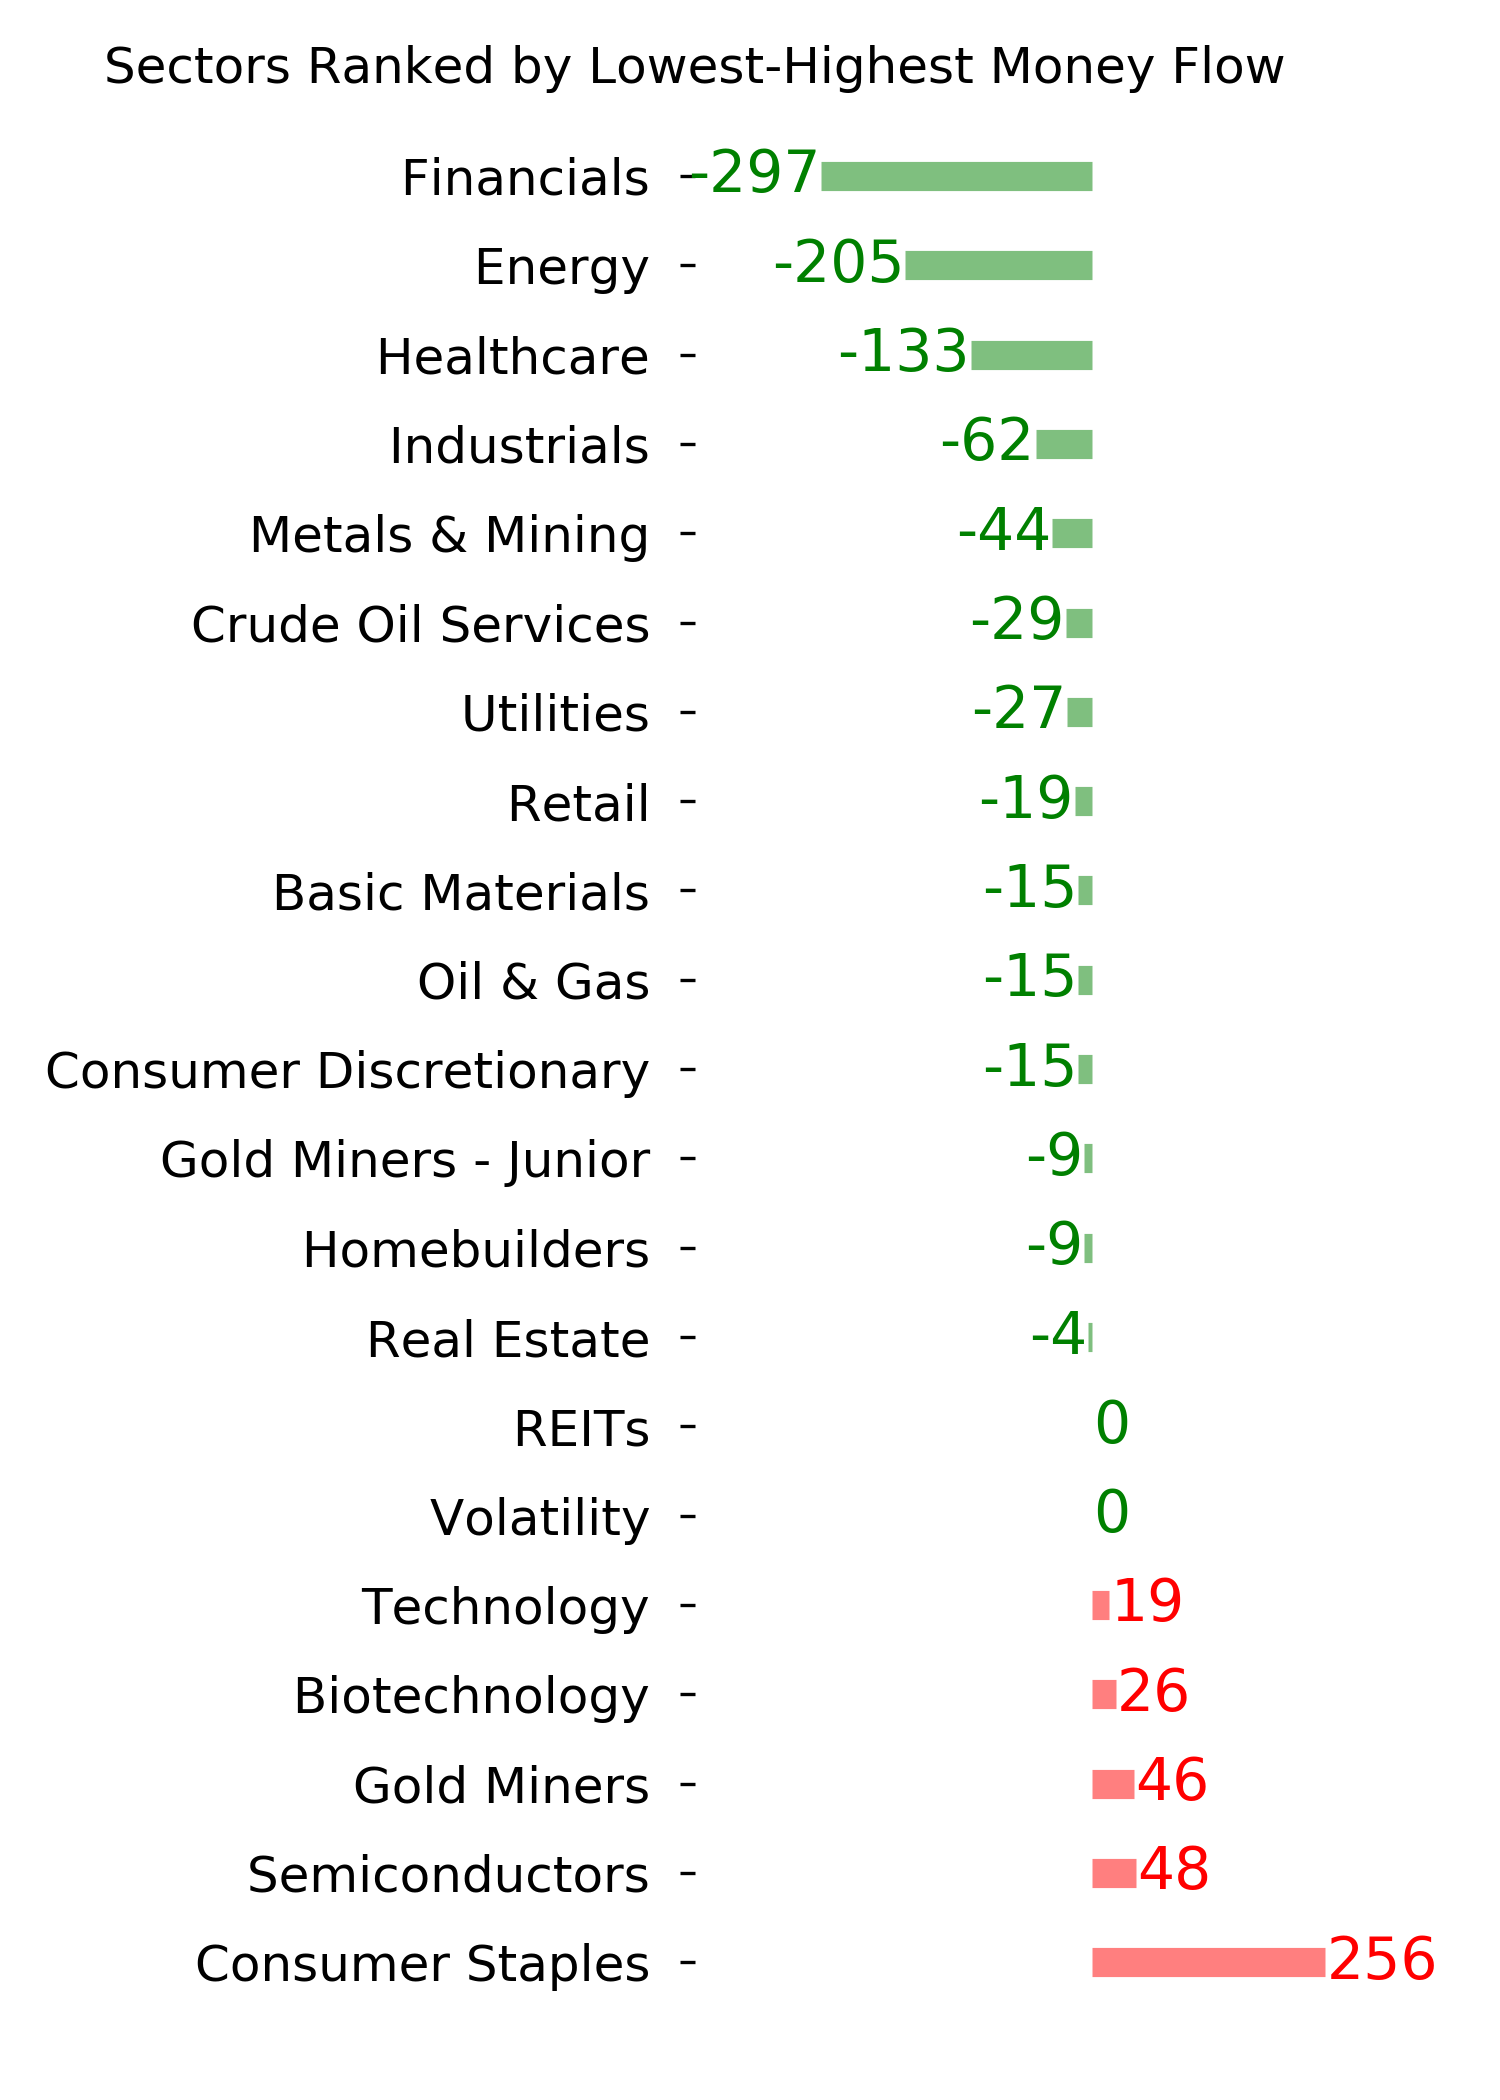
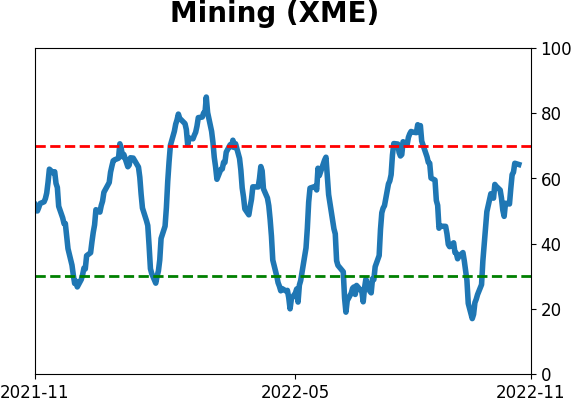
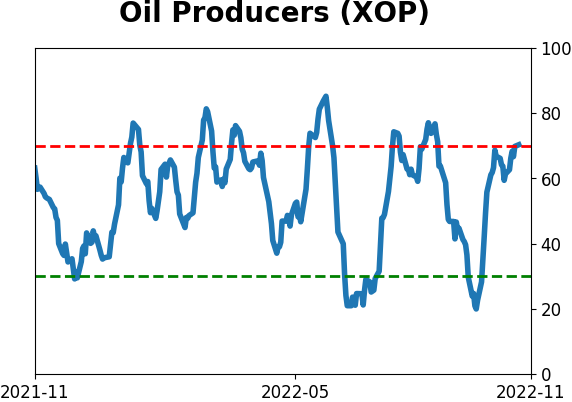
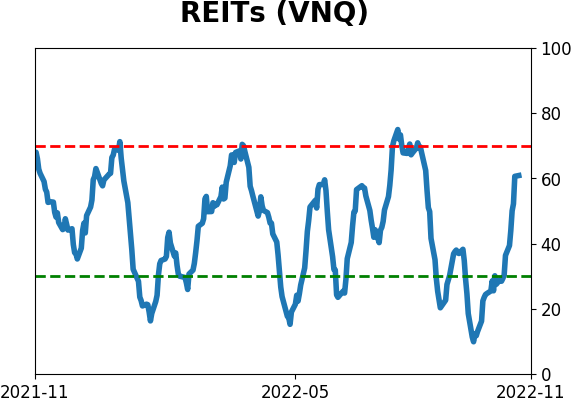
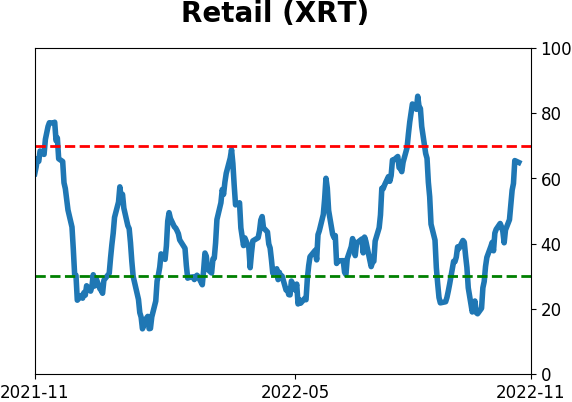
Sector ETF's - 10-Day Moving Average
|
|
|
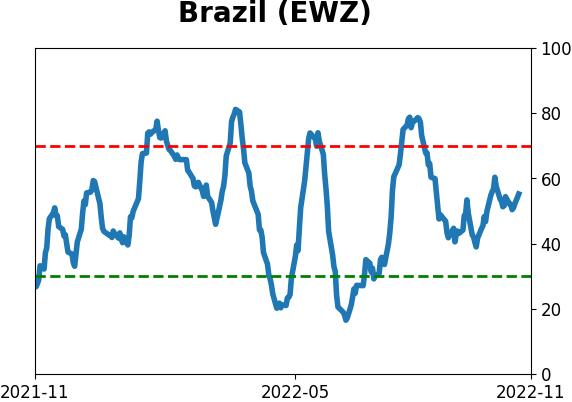
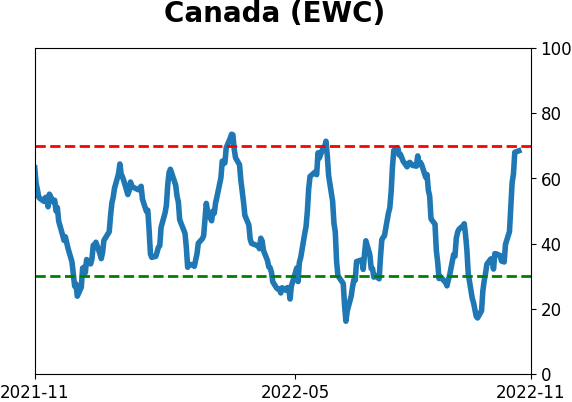
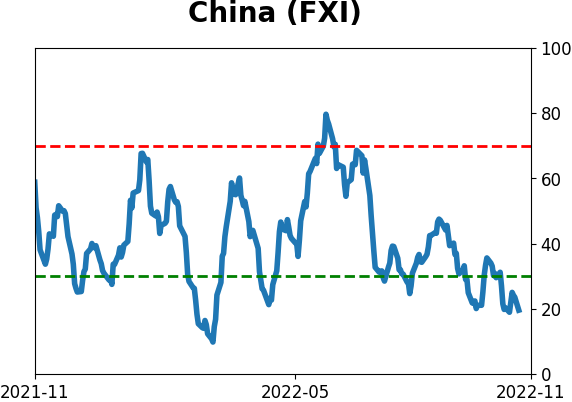
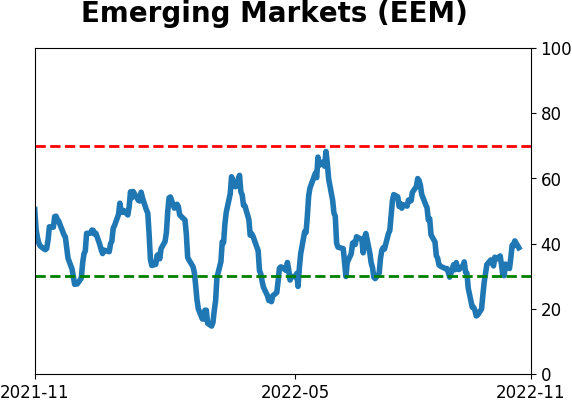
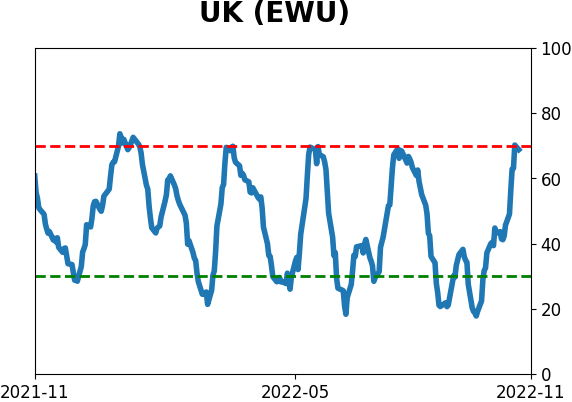
Country ETF's - 10-Day Moving Average
|
|
|
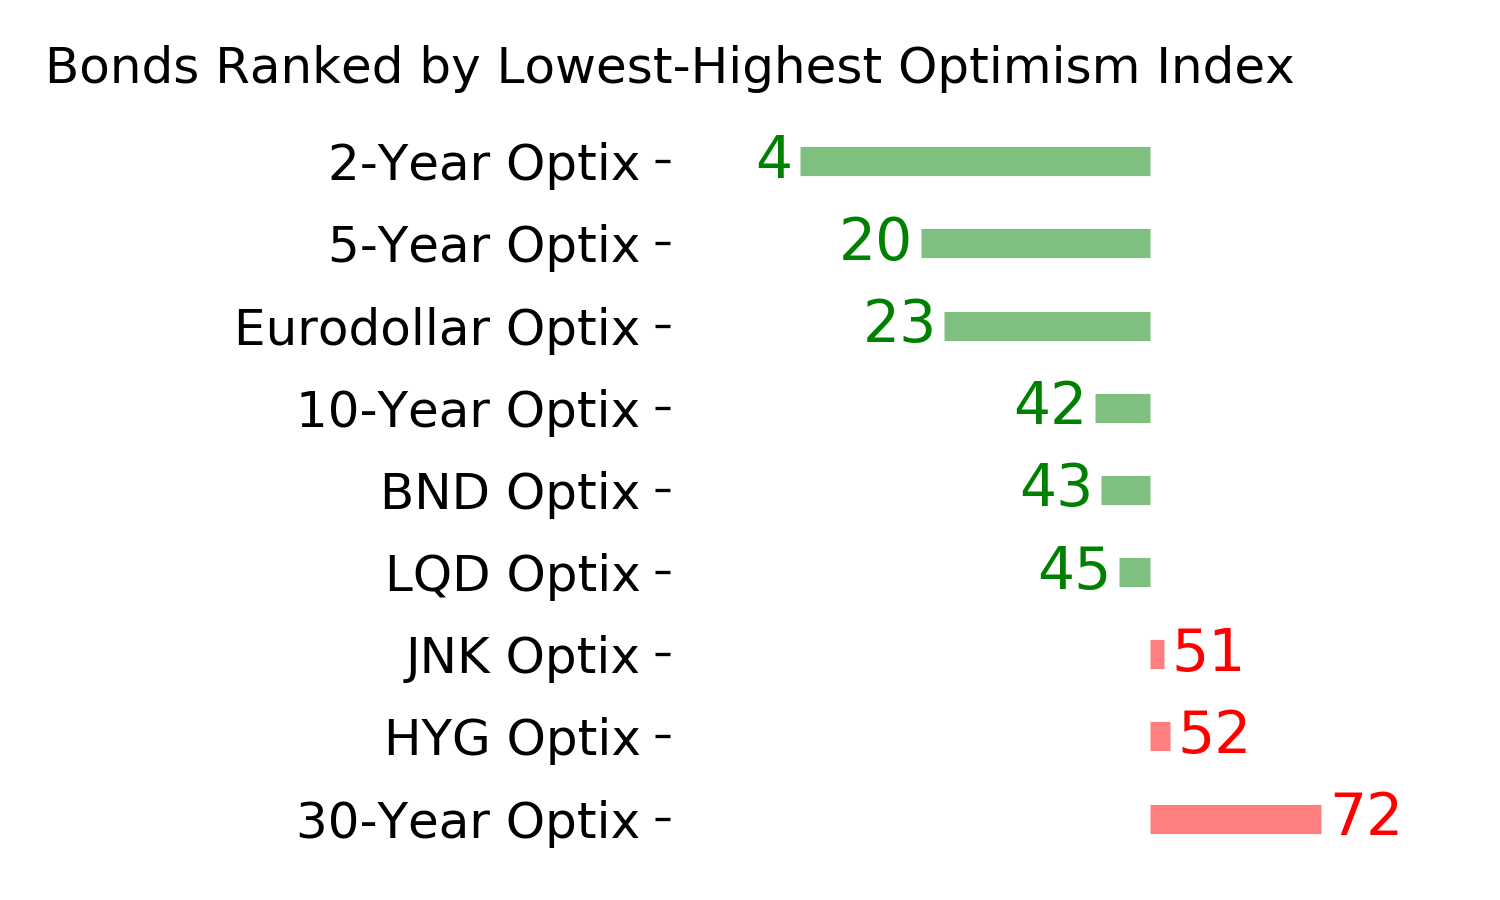
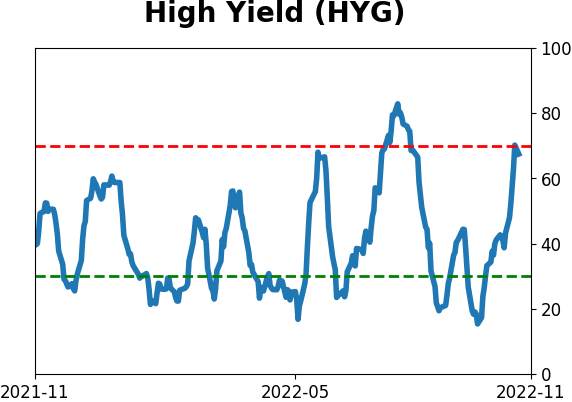
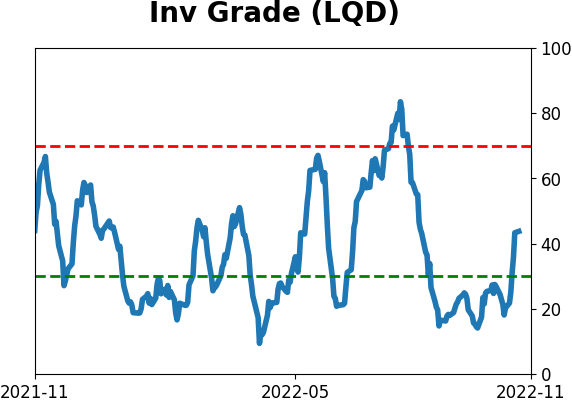
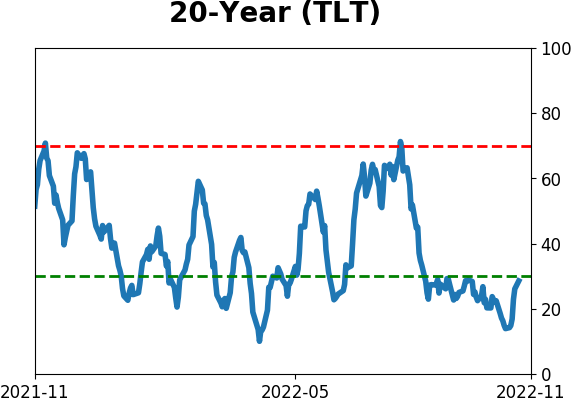
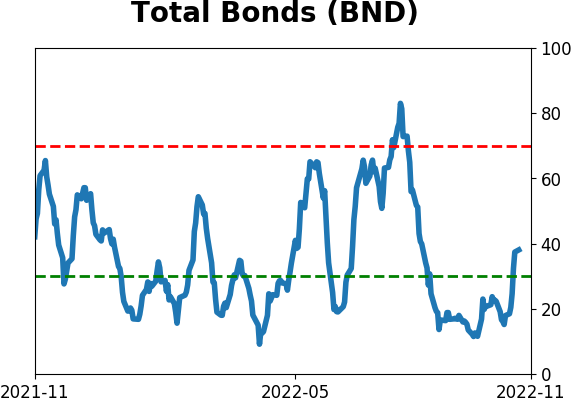
Bond ETF's - 10-Day Moving Average
|
|
|
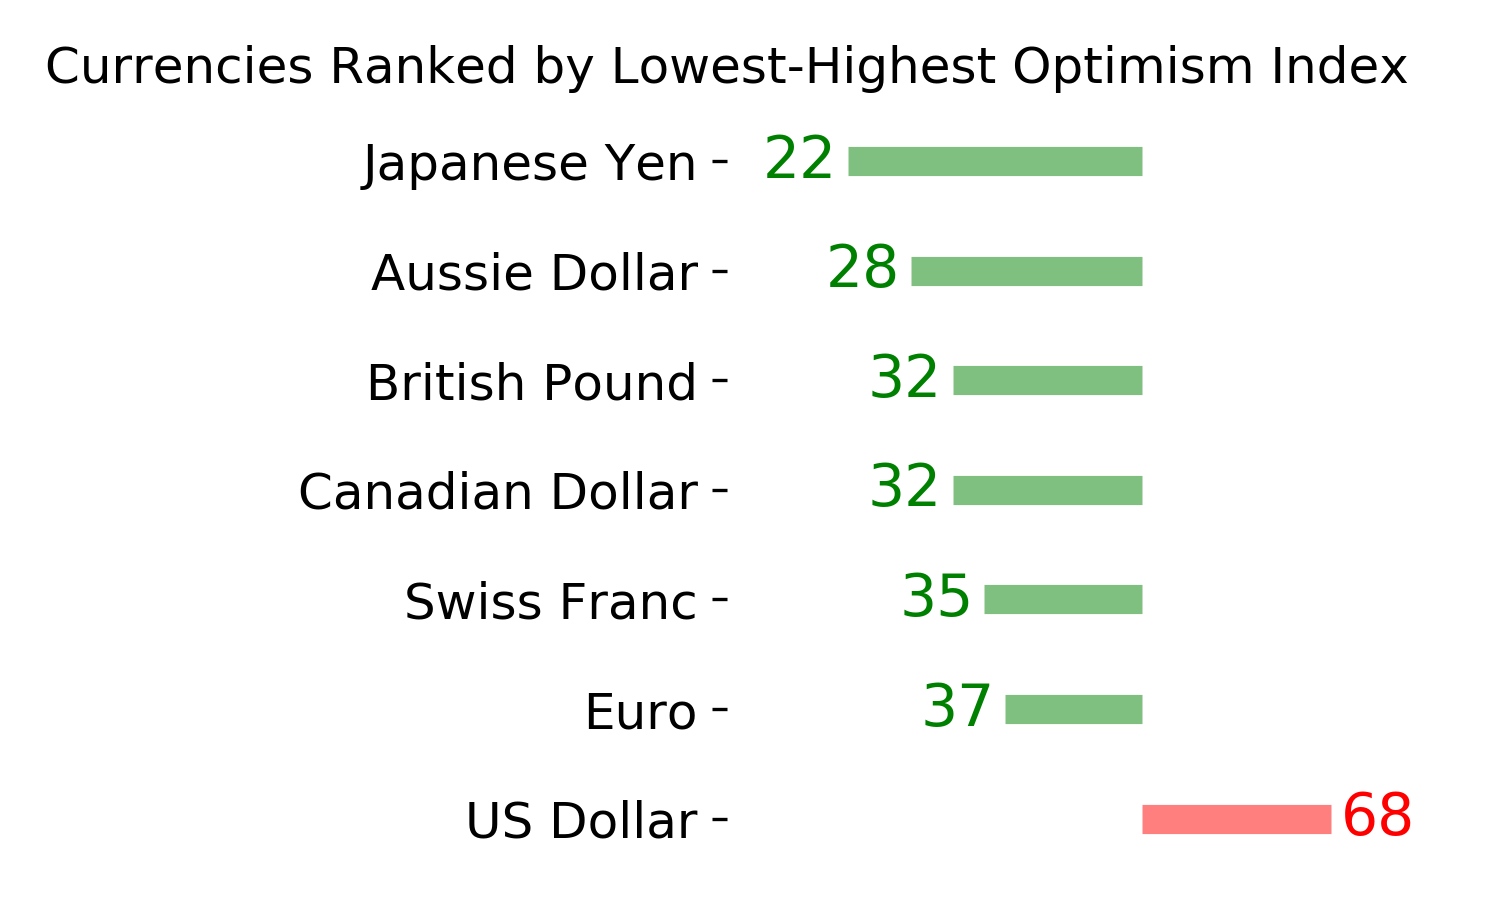
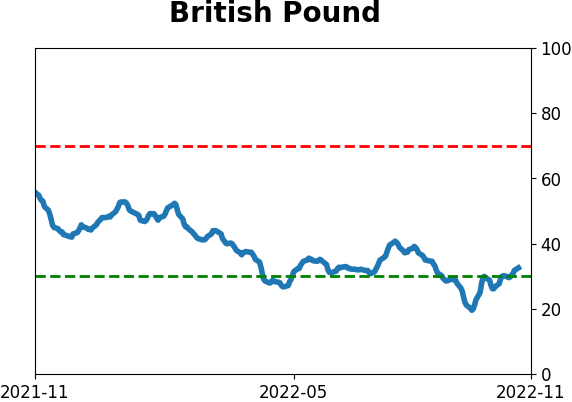
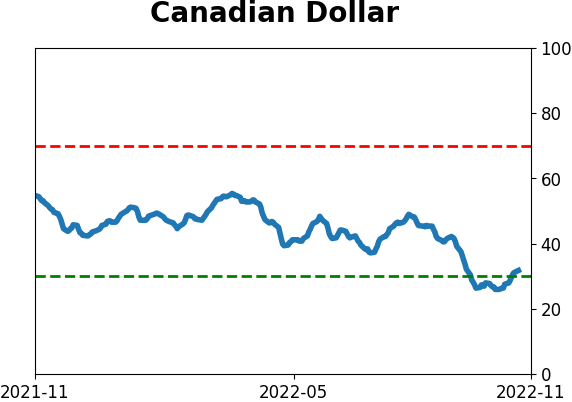
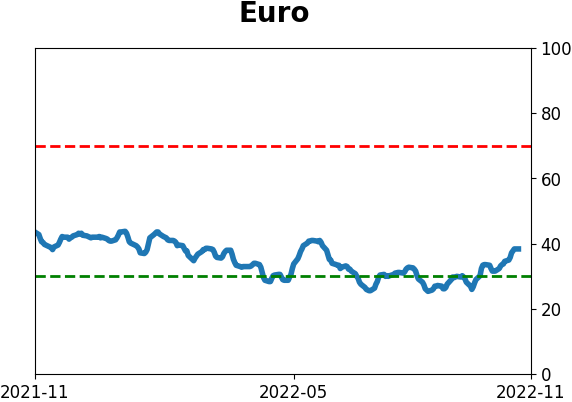
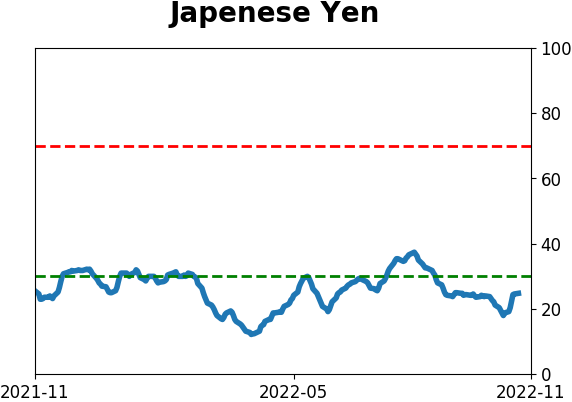
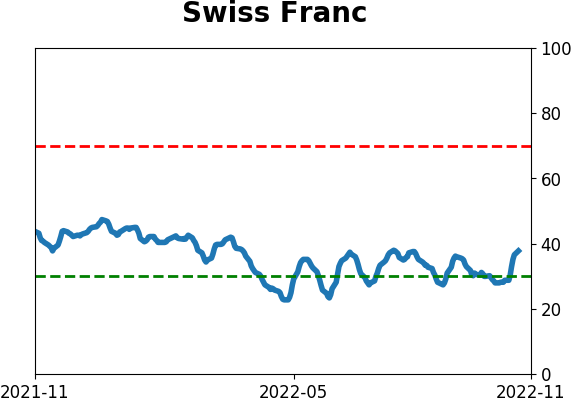
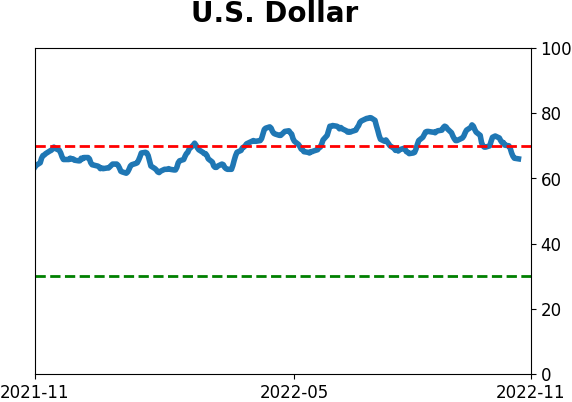
Currency ETF's - 5-Day Moving Average
|
|
|
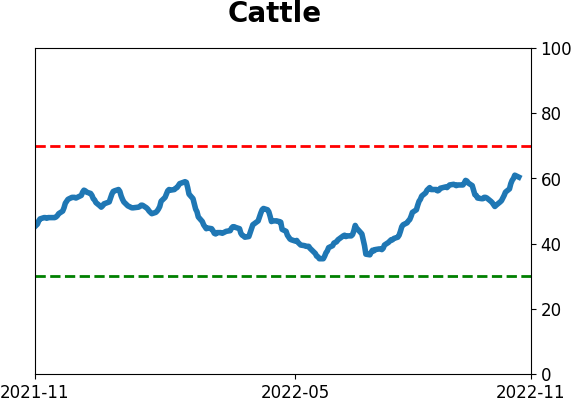
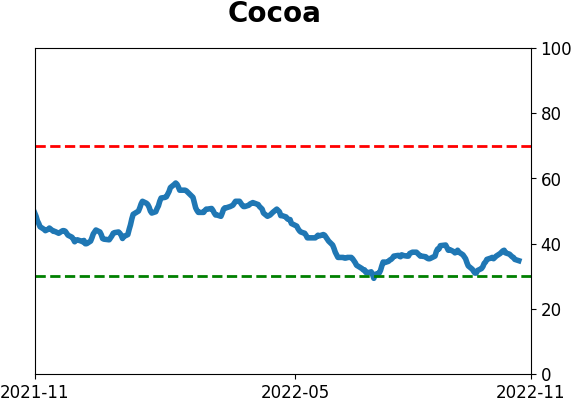
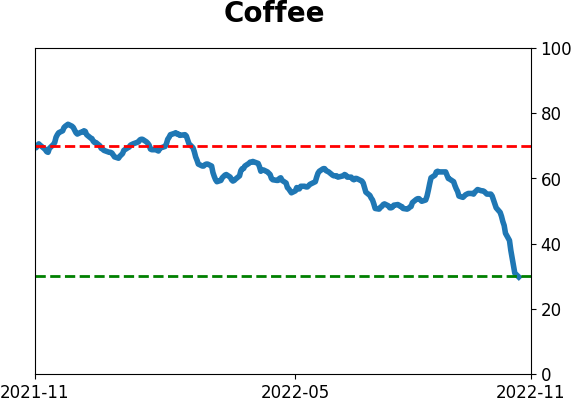
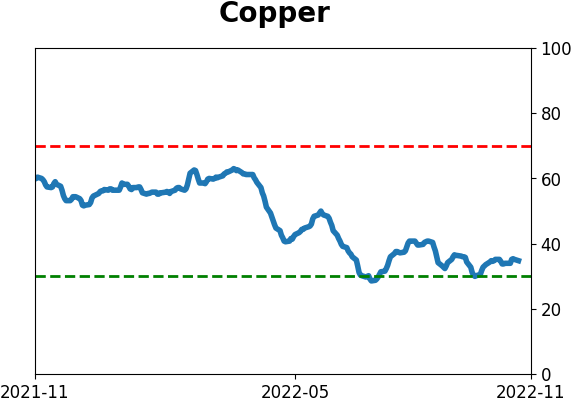
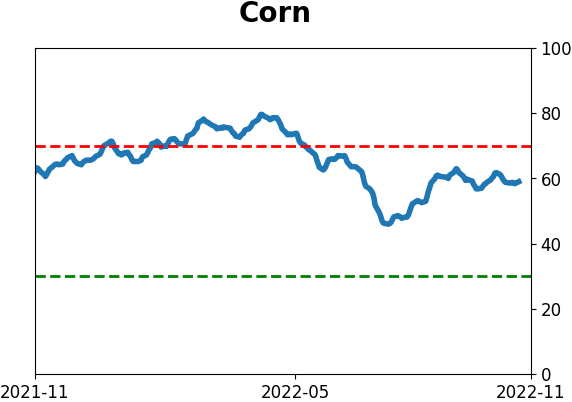
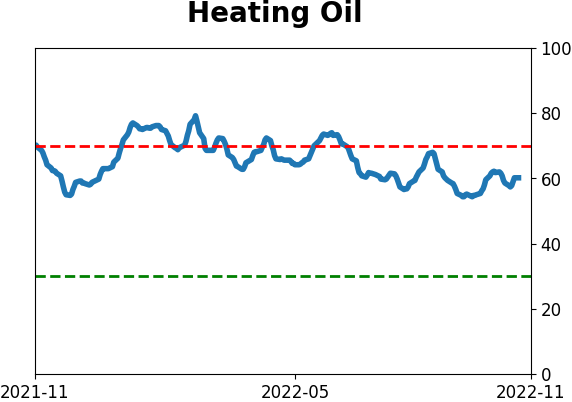
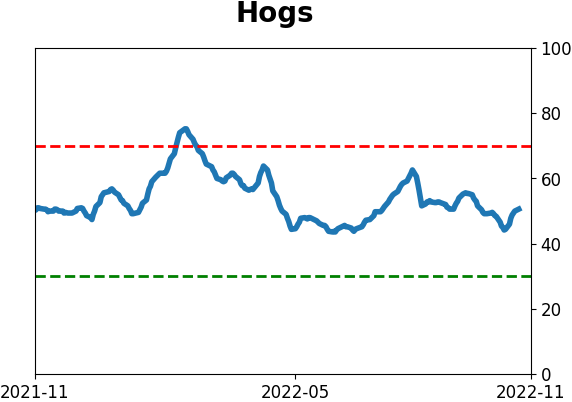
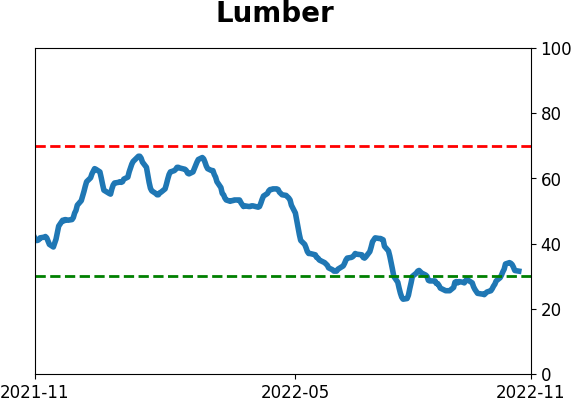
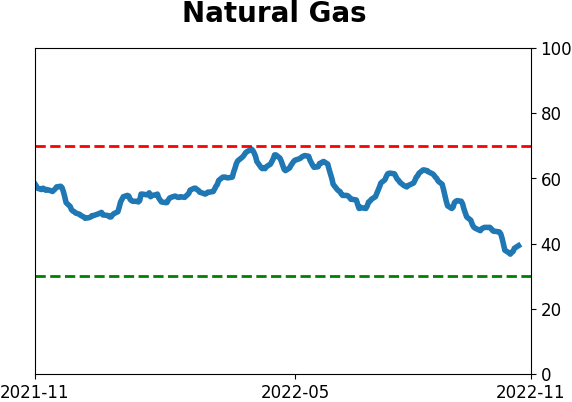
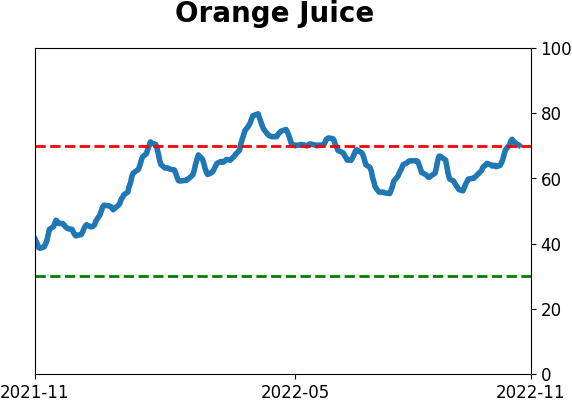
Commodity ETF's - 5-Day Moving Average
|
|