Headlines
|
|
Banks are pulling back from business exposure:
After a big jump in commercial and industrial lending, U.S. banks have pulled back, and C&I loan growth has turned negative. This is often cited as a pre-recessionary indicator, but it has not been effective in that way. It has also not been consistent in leading to declines in the Financial sector or broader S&P 500.
|
Smart / Dumb Money Confidence
|
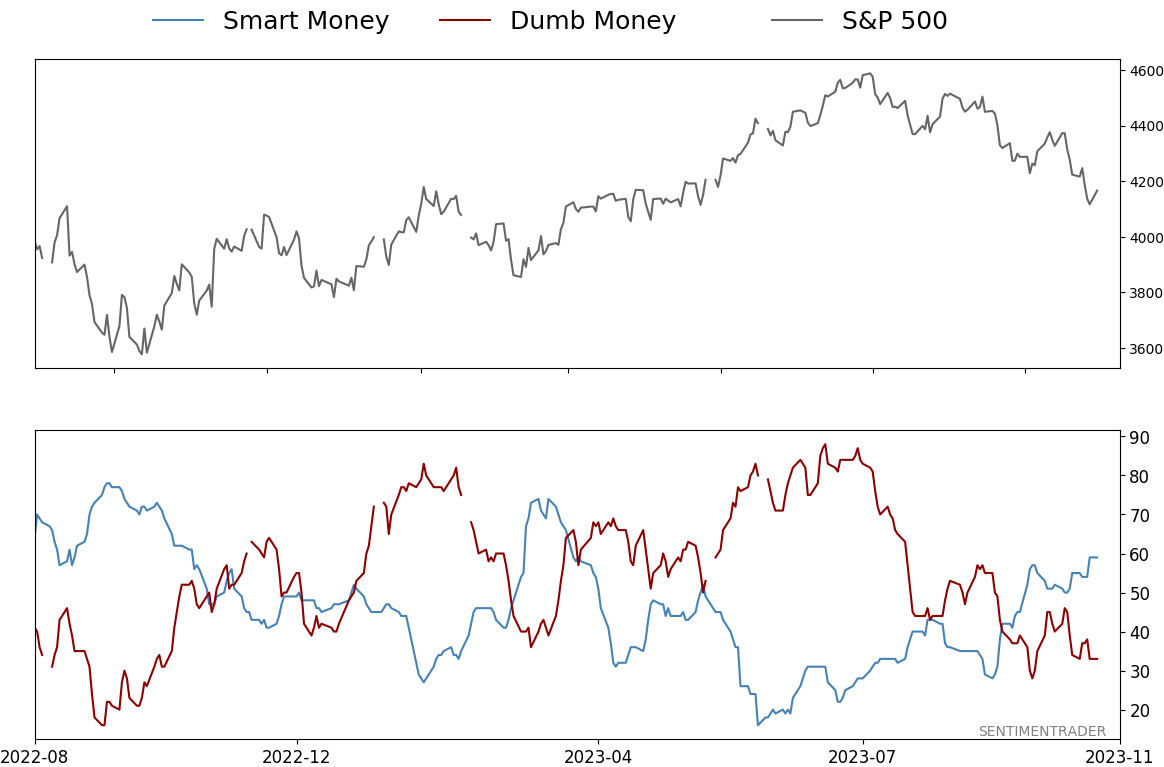
Smart Money Confidence: 59%
Dumb Money Confidence: 33%
|
|
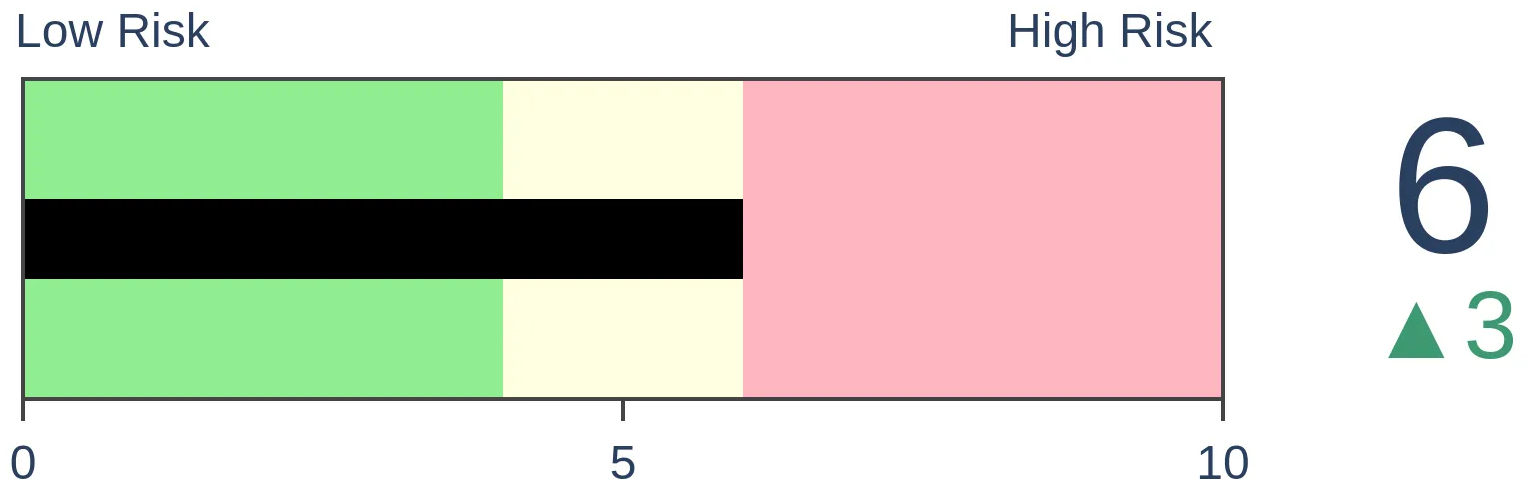
Risk Levels
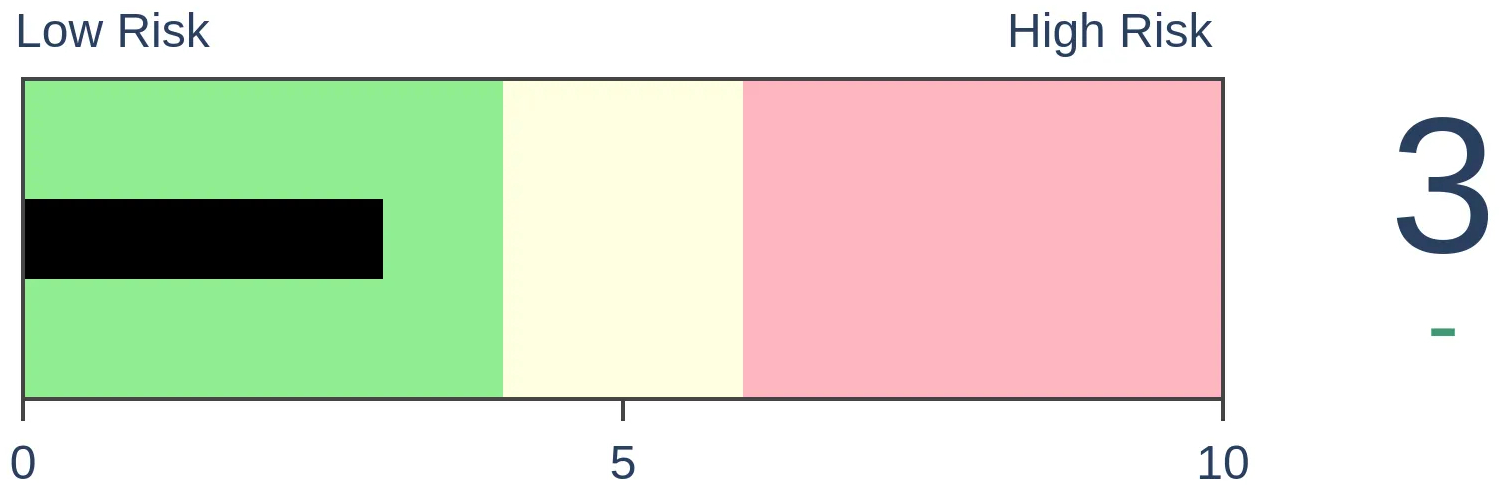
Stocks Short-Term
|
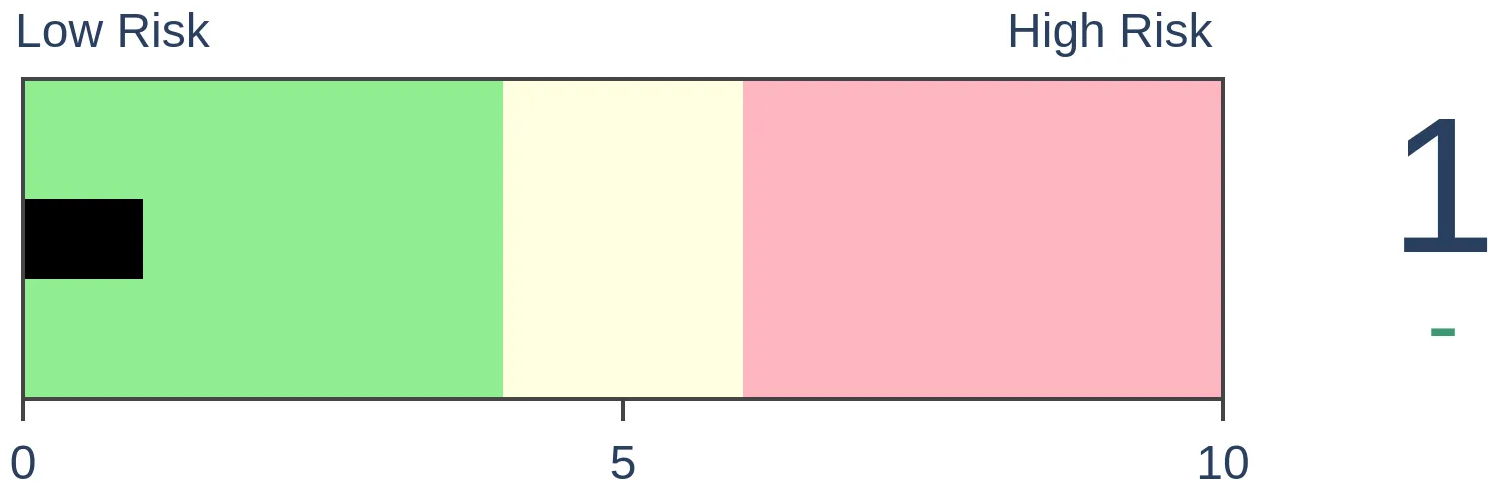
Stocks Medium-Term
|
|
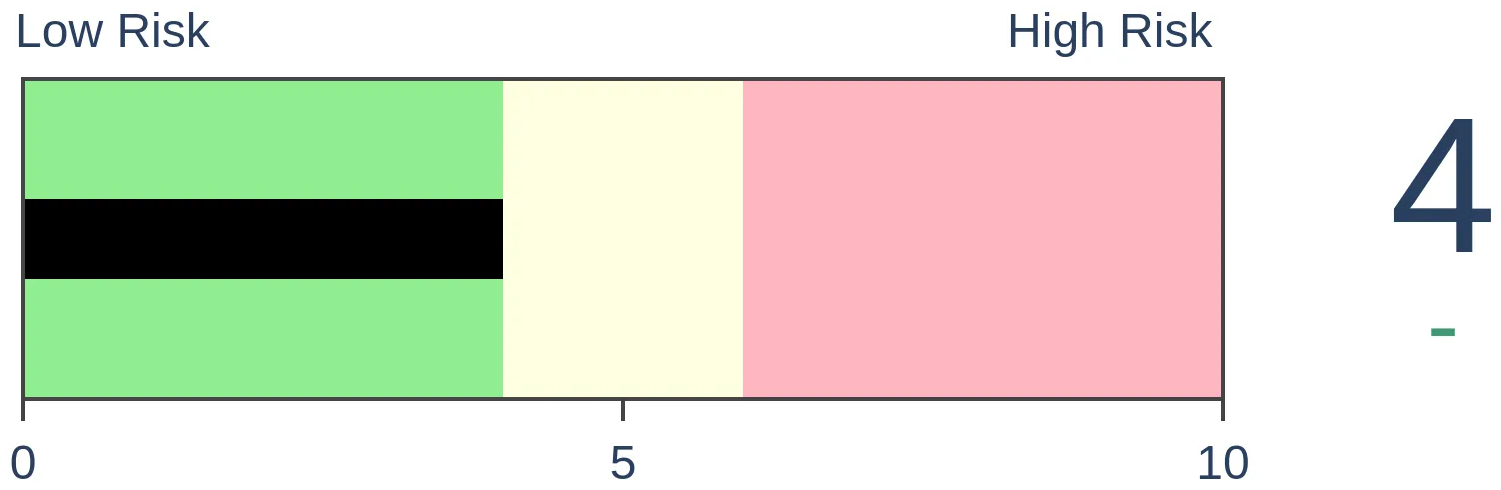
Bonds
|
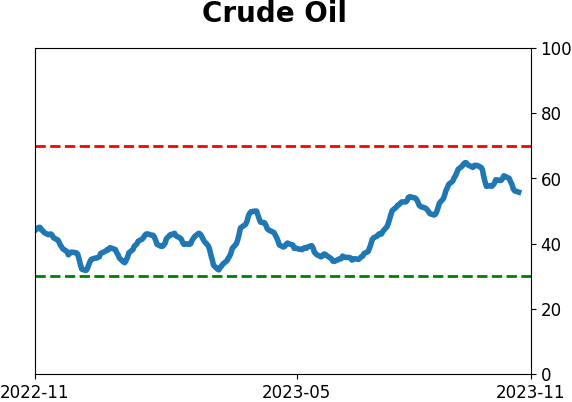
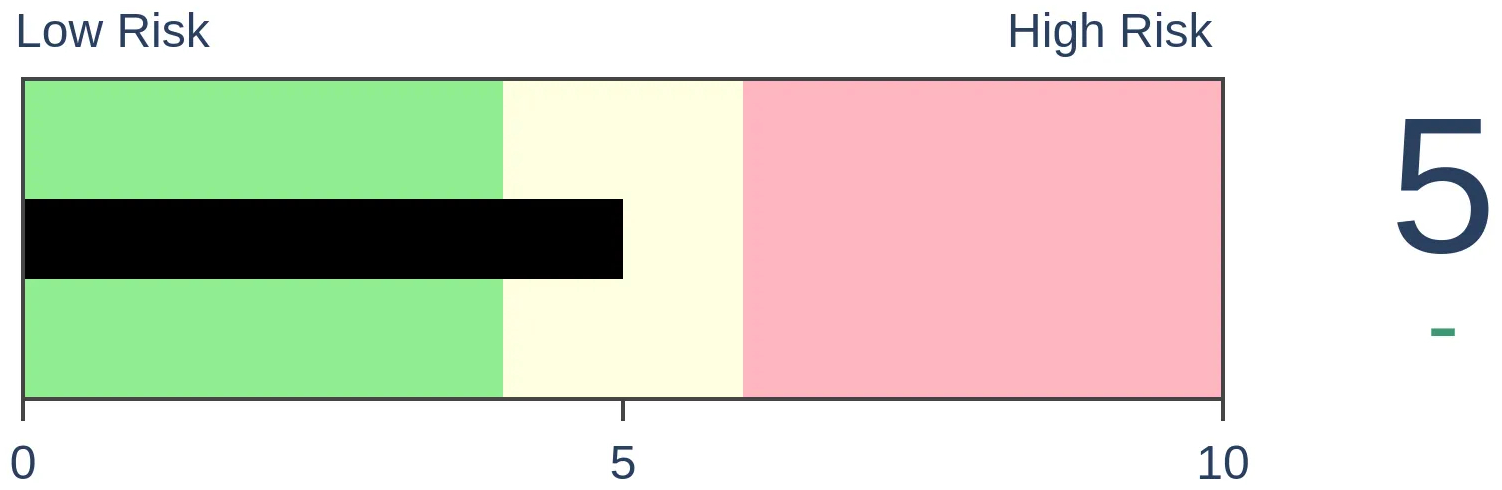
Crude Oil

|
|
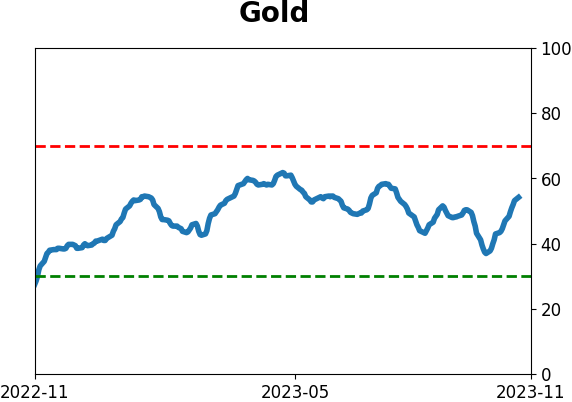
Gold
|
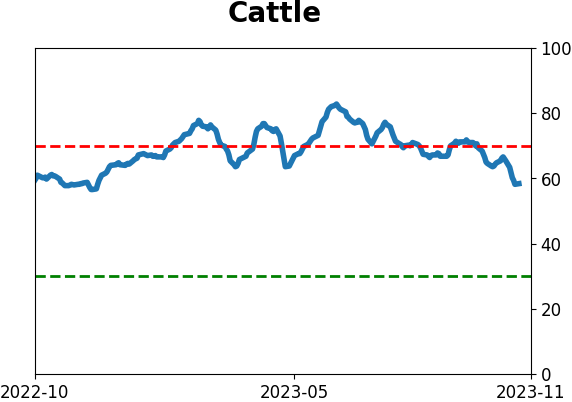
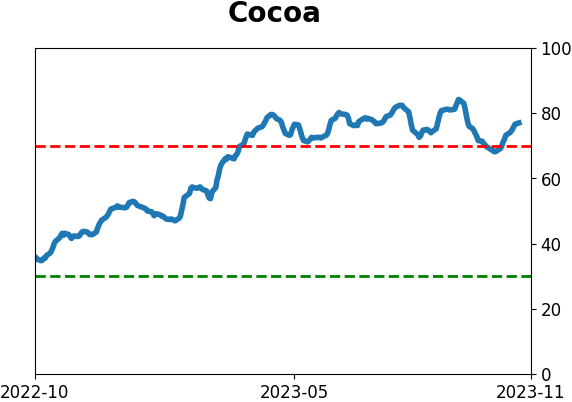
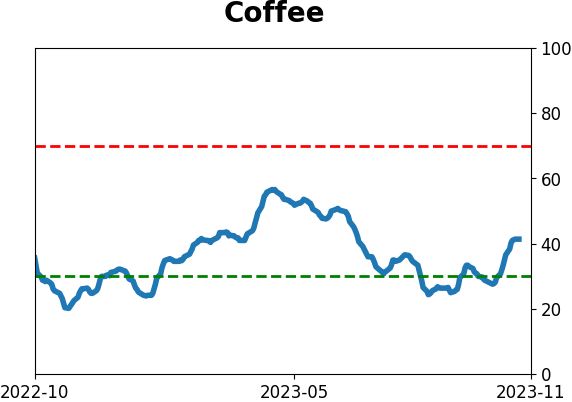
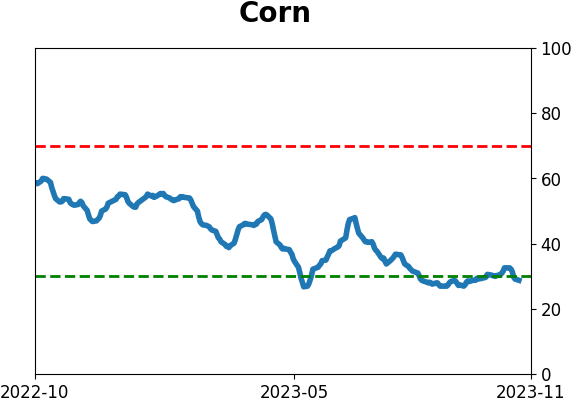
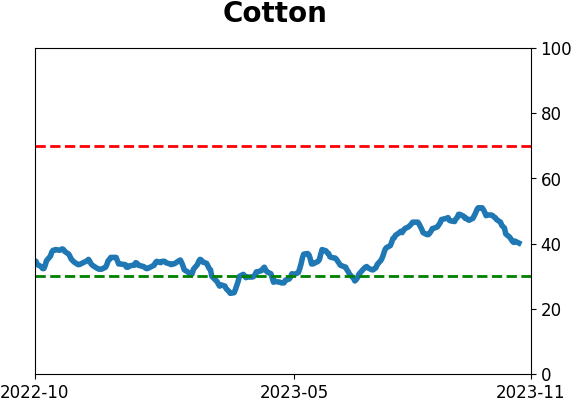
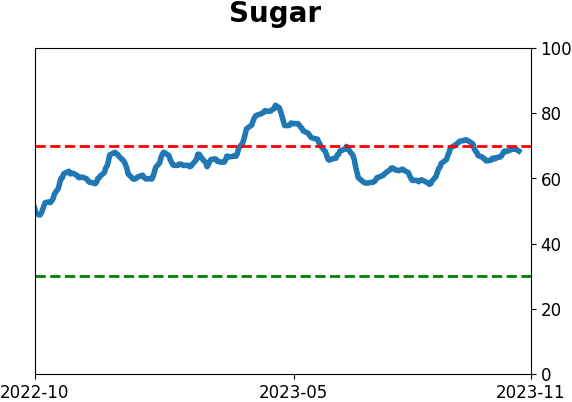
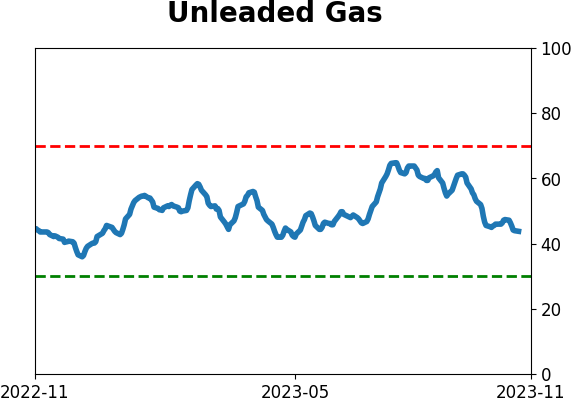
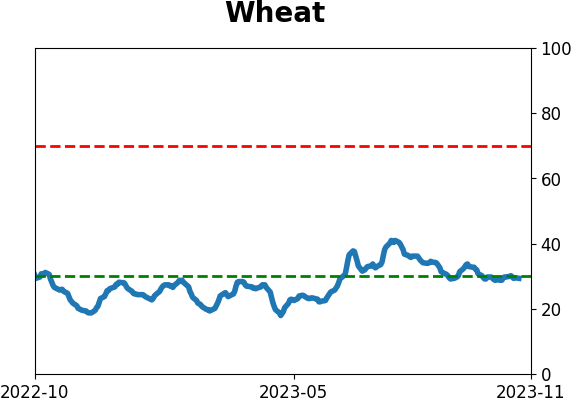
Agriculture
|
|
Research
By Jason Goepfert
BOTTOM LINE
After a big jump in commercial and industrial lending, U.S. banks have pulled back, and C&I loan growth has turned negative. This is often cited as a pre-recessionary indicator, but it has not been effective in that way. It has also not been consistent in leading to declines in the Financial sector or broader S&P 500.
FORECAST / TIMEFRAME
None
|
Key points:
- For one of the rare times in 50 years, U.S. banks are pulling back on business lending
- This is a rising concern for banks and small-cap companies
- Historically, however, negative lending growth preceded solid returns for those sectors and the broader market
Banks are pulling back on business lending
As stocks continue to decline, many hitting new lows for the year, worries are increasing. We've discussed many seemingly existential threats since the October 2022 bottom, and few have a reliable historical track record of consistently preceding further declines.
We can add a lack of bank loan growth to businesses to the potential reasons for angst. Per The Wall Street Journal:
Regional banks are facing the prospect of a slowdown in one of their bread-and-butter offerings, business lending.
There has been much talk of risk centered on credit cards and offices, and not without reason. But these aren't usually the most important kinds of loans to the typical regional bank. Instead, a core kind of lending for many of the large regionals is to enterprises.
This includes commercial-and-industrial loans, such as lines of credit that companies can tap when they need cash.
According to the Federal Reserve, bank lending to businesses has stagnated over the past year after a robust post-pandemic recovery.
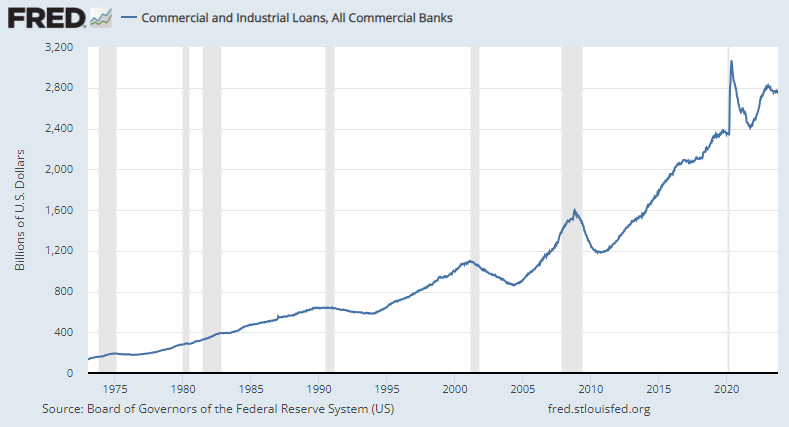
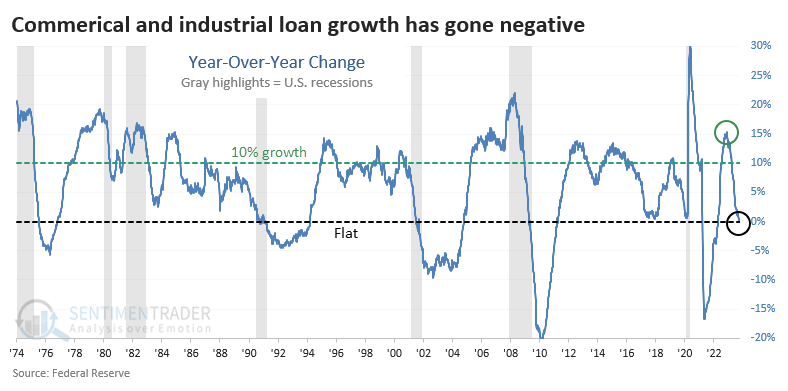
We can clearly see the slowdown via the year-over-year rate of change in Commercial & Industrial (C&I) loans. After spiking above a 15% growth rate, it has since plunged and just turned negative, meaning banks have issued fewer C&I loans than they did a year ago. Sometimes negative (or almost negative) loan growth preceded recessions, and a couple of times, it lagged.
Weak loan growth did not spell doom (except for once)
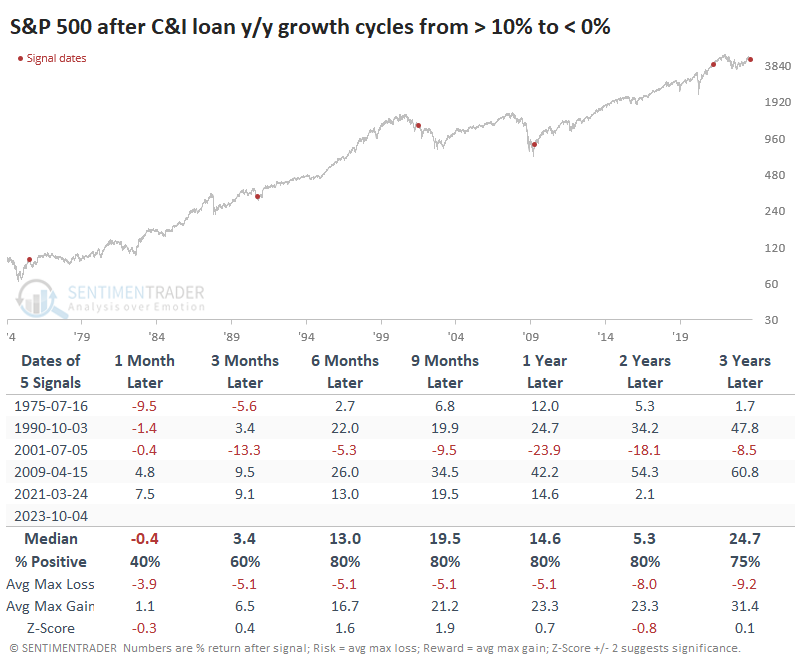
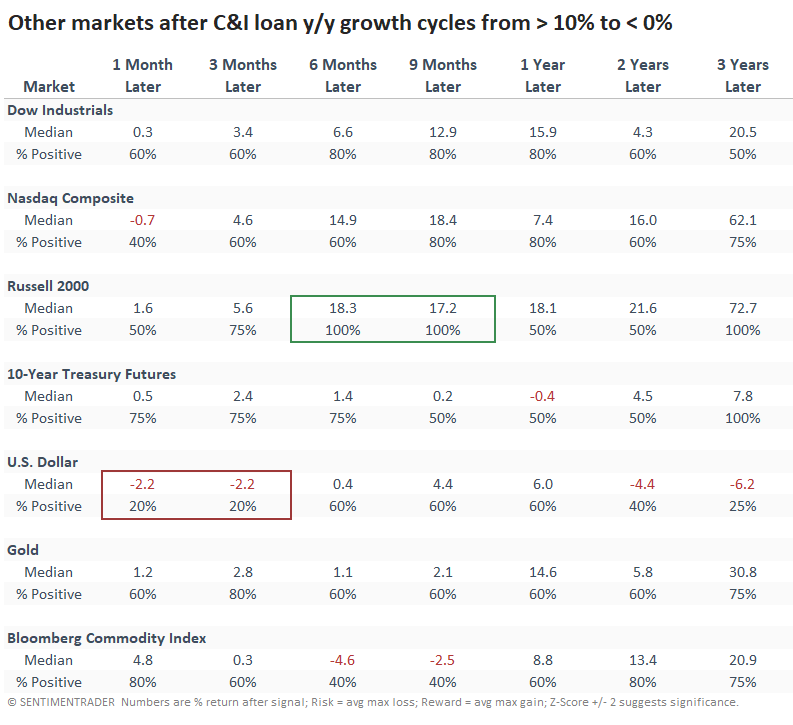
For the S&P 500, when C&I loan growth turned negative after rising more than 10% year-over-year, it was not a sign of impending doom. Four out of five times, it lagged what had already been a substantial decline in stock prices, for future long-term returns were good. The only time it preceded a significant decline was following the internet bubble.
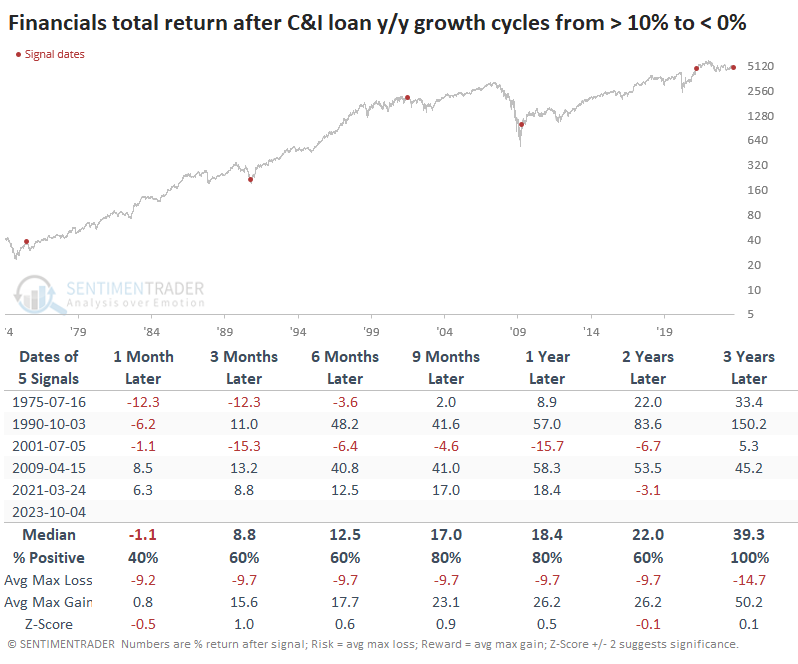
For Financials, the risk was higher, but so was the reward. There was an additional loss scattered among the time frames, but overall returns in the sector from 1-3 years later were more robust than those for the S&P 500.
Interestingly, the best-performing index over the next 6-9 months was the small-cap Russell 2000. It rose after all five signals, averaging a very healthy +18.3% six months later. Typically, when loan growth turns negative, we'd be inundated about how this is a sign of a stagnating business environment, most likely to hit the smallest companies. We're certainly seeing many of those headlines today.
The U.S. dollar struggled up to three months after loan growth turned negative, but other than that, there wasn't much consistent across time frames.
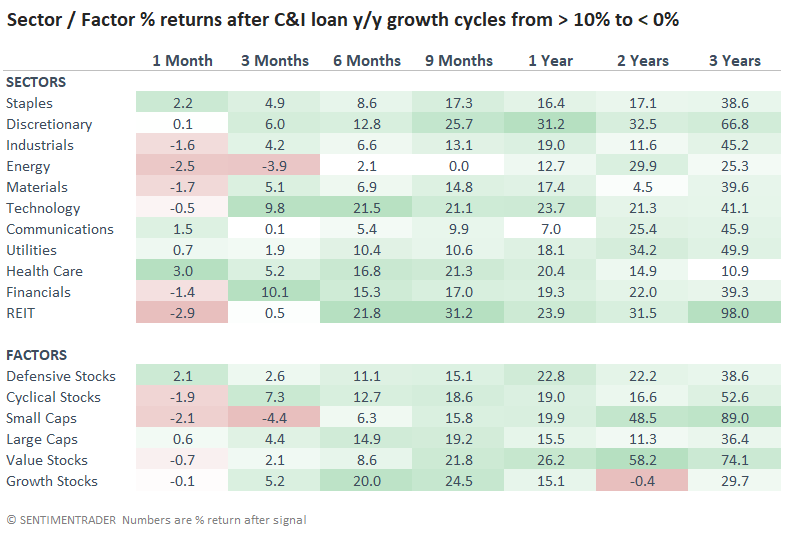
Over the next two to three years, Small Caps were among the best performers, as were Value, REITs, and Discretionary stocks.
What the research tells us...
With many stocks failing to hold their long-term trendlines recently, investors are getting skittish. The worries that had been bandied about for over a year seem to be coming to fruition.
Weak oversold conditions like we have now tend to precede even weaker forward returns, so we're in an anxious no man's land at the moment - oversold enough to be compelling during bull markets but more oversold than we usually get during healthy trends, which is a worry. As reasons for anxiety pile up, it pays to investigate them to see if they add to the bearish argument. As we hear more about weak loan growth, though, it has not been effective as a reason to worry.
Indicators at Extremes
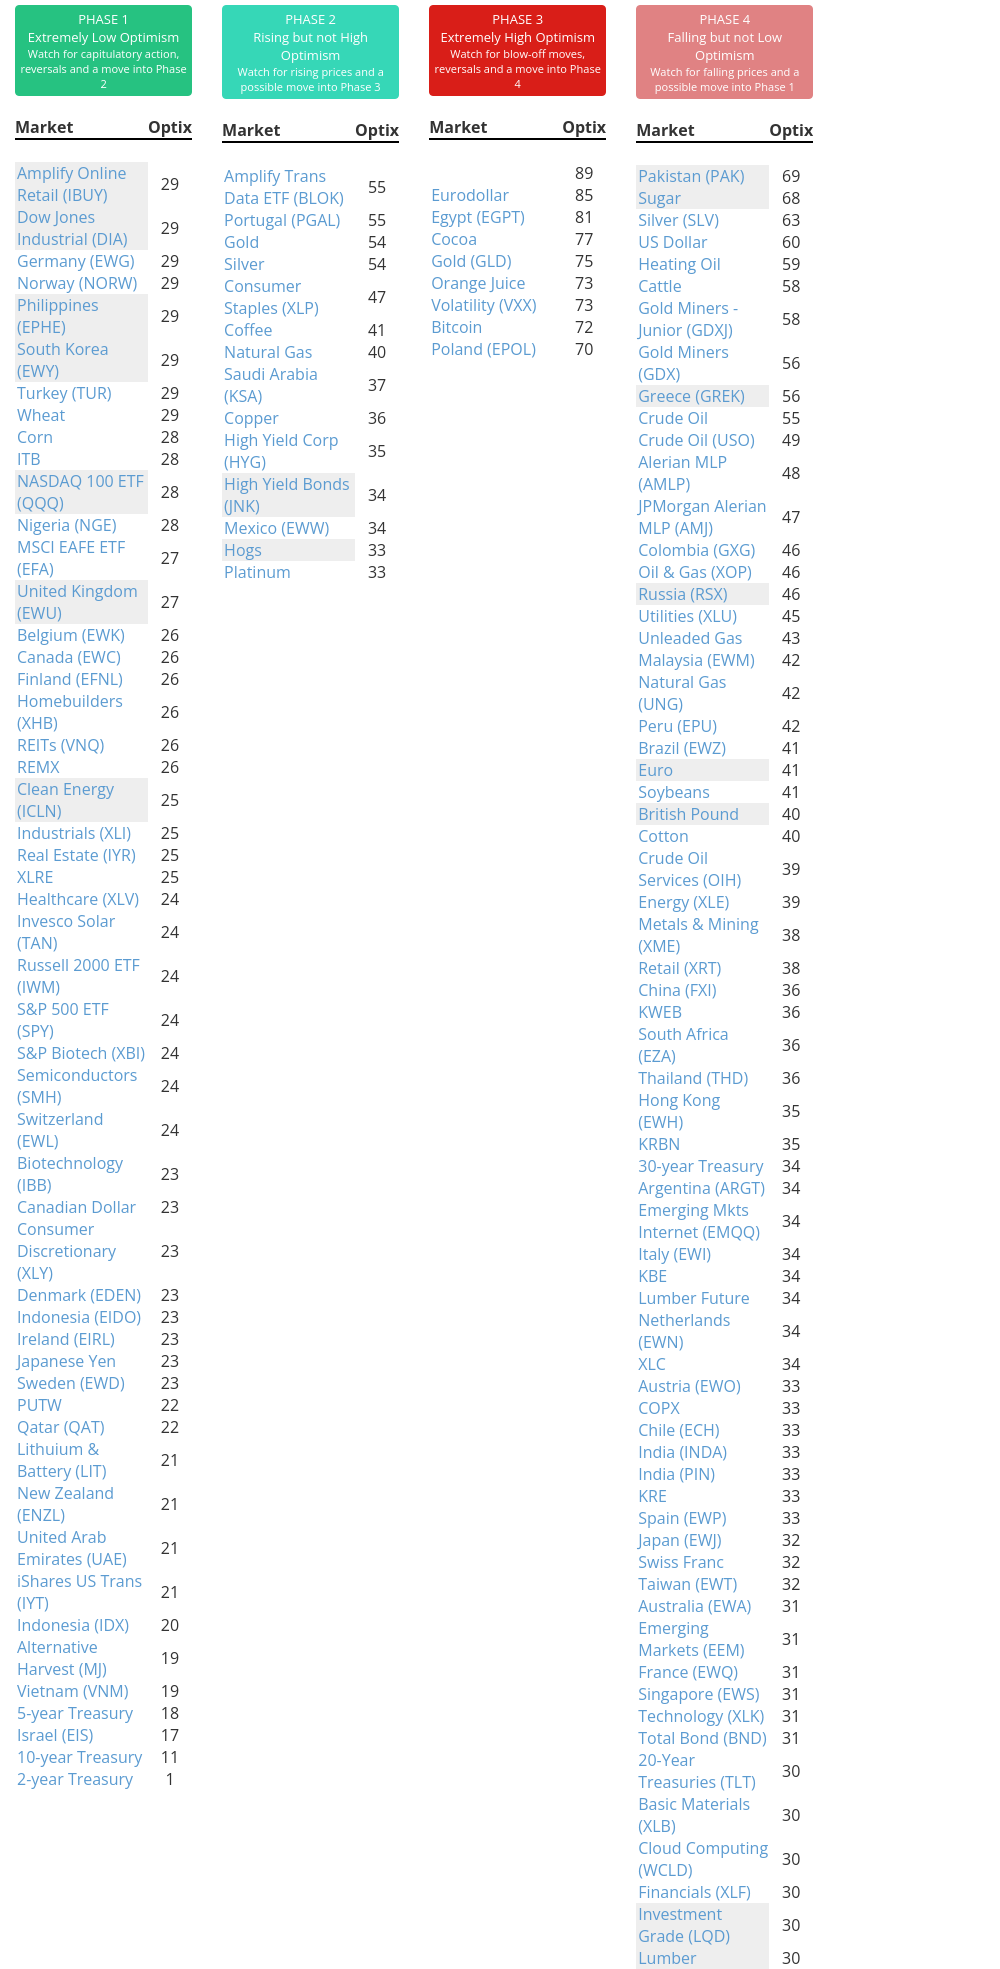
Phase Table
Ranks
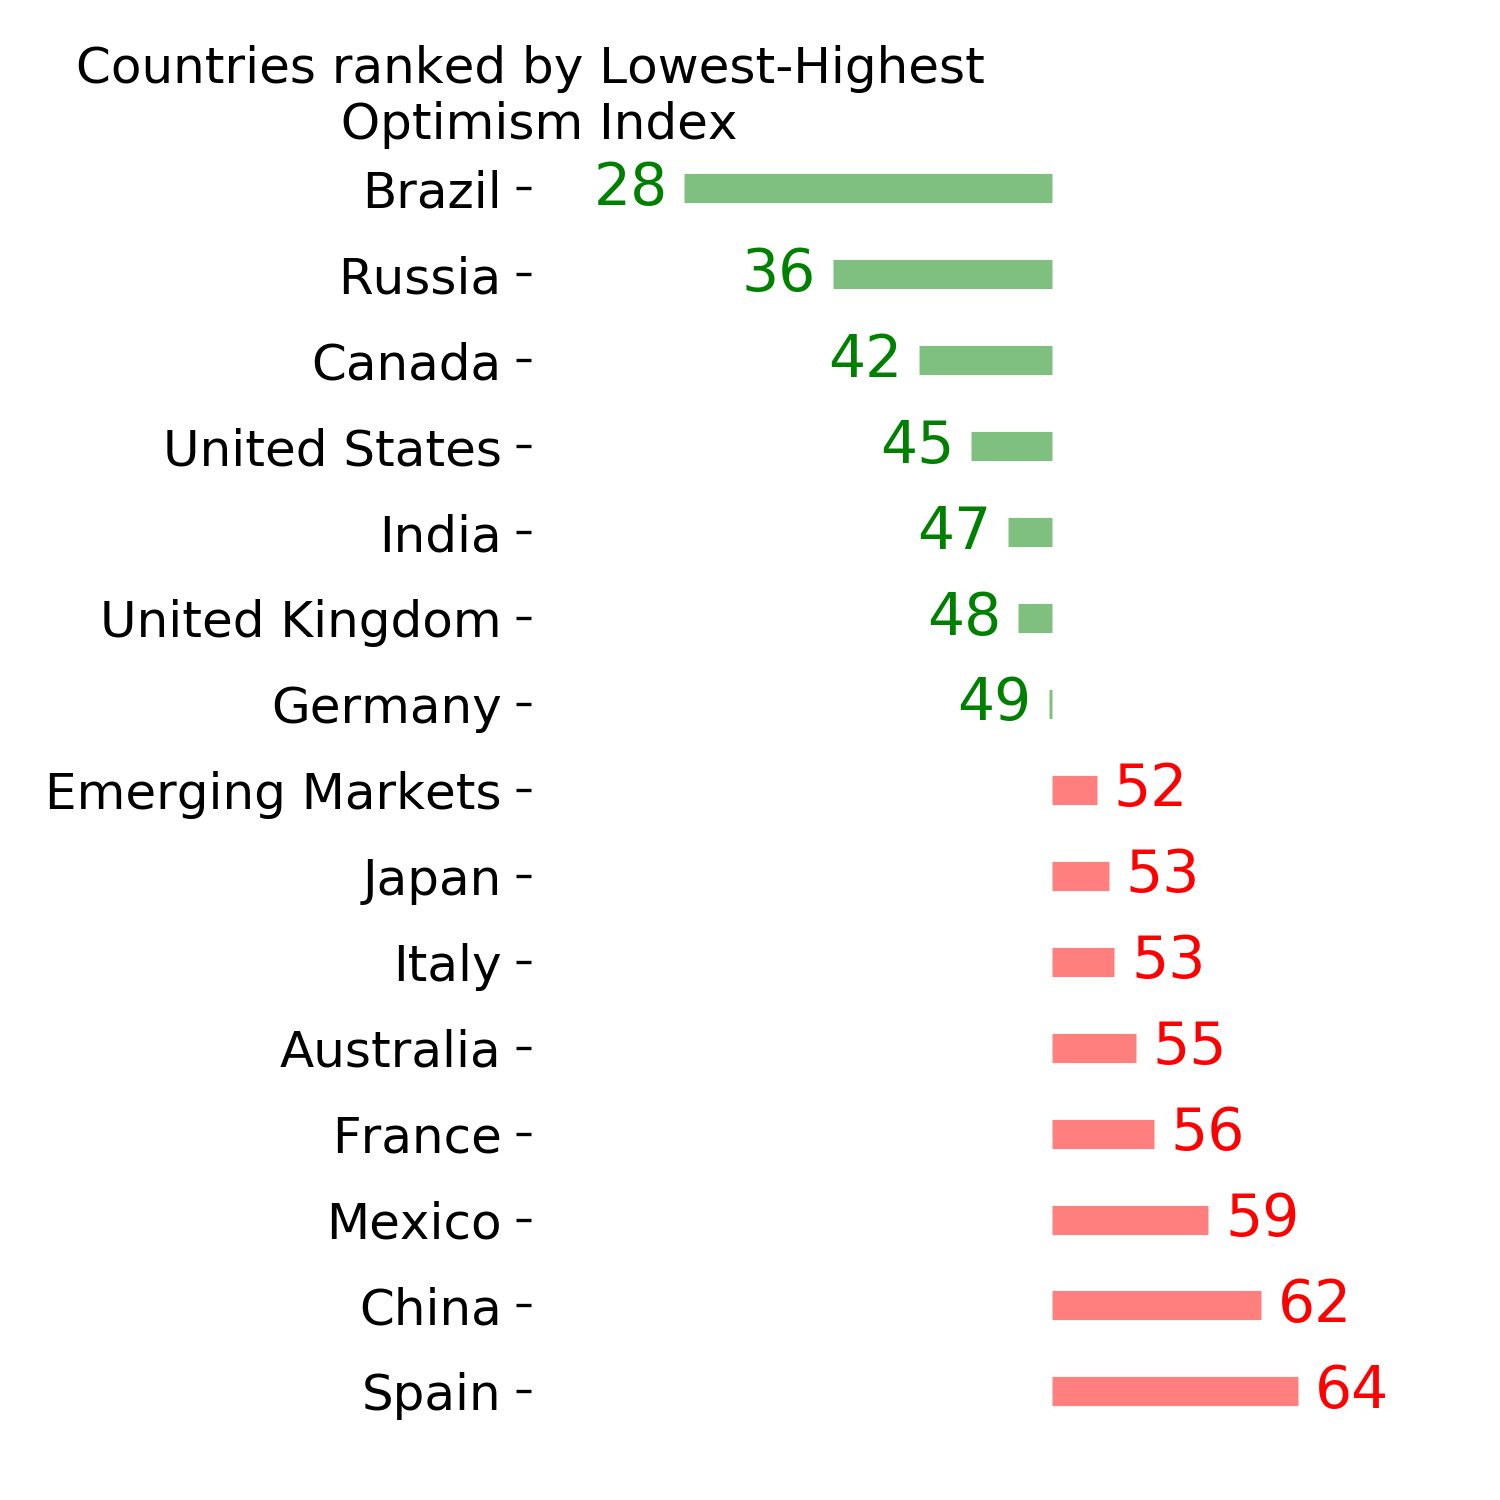
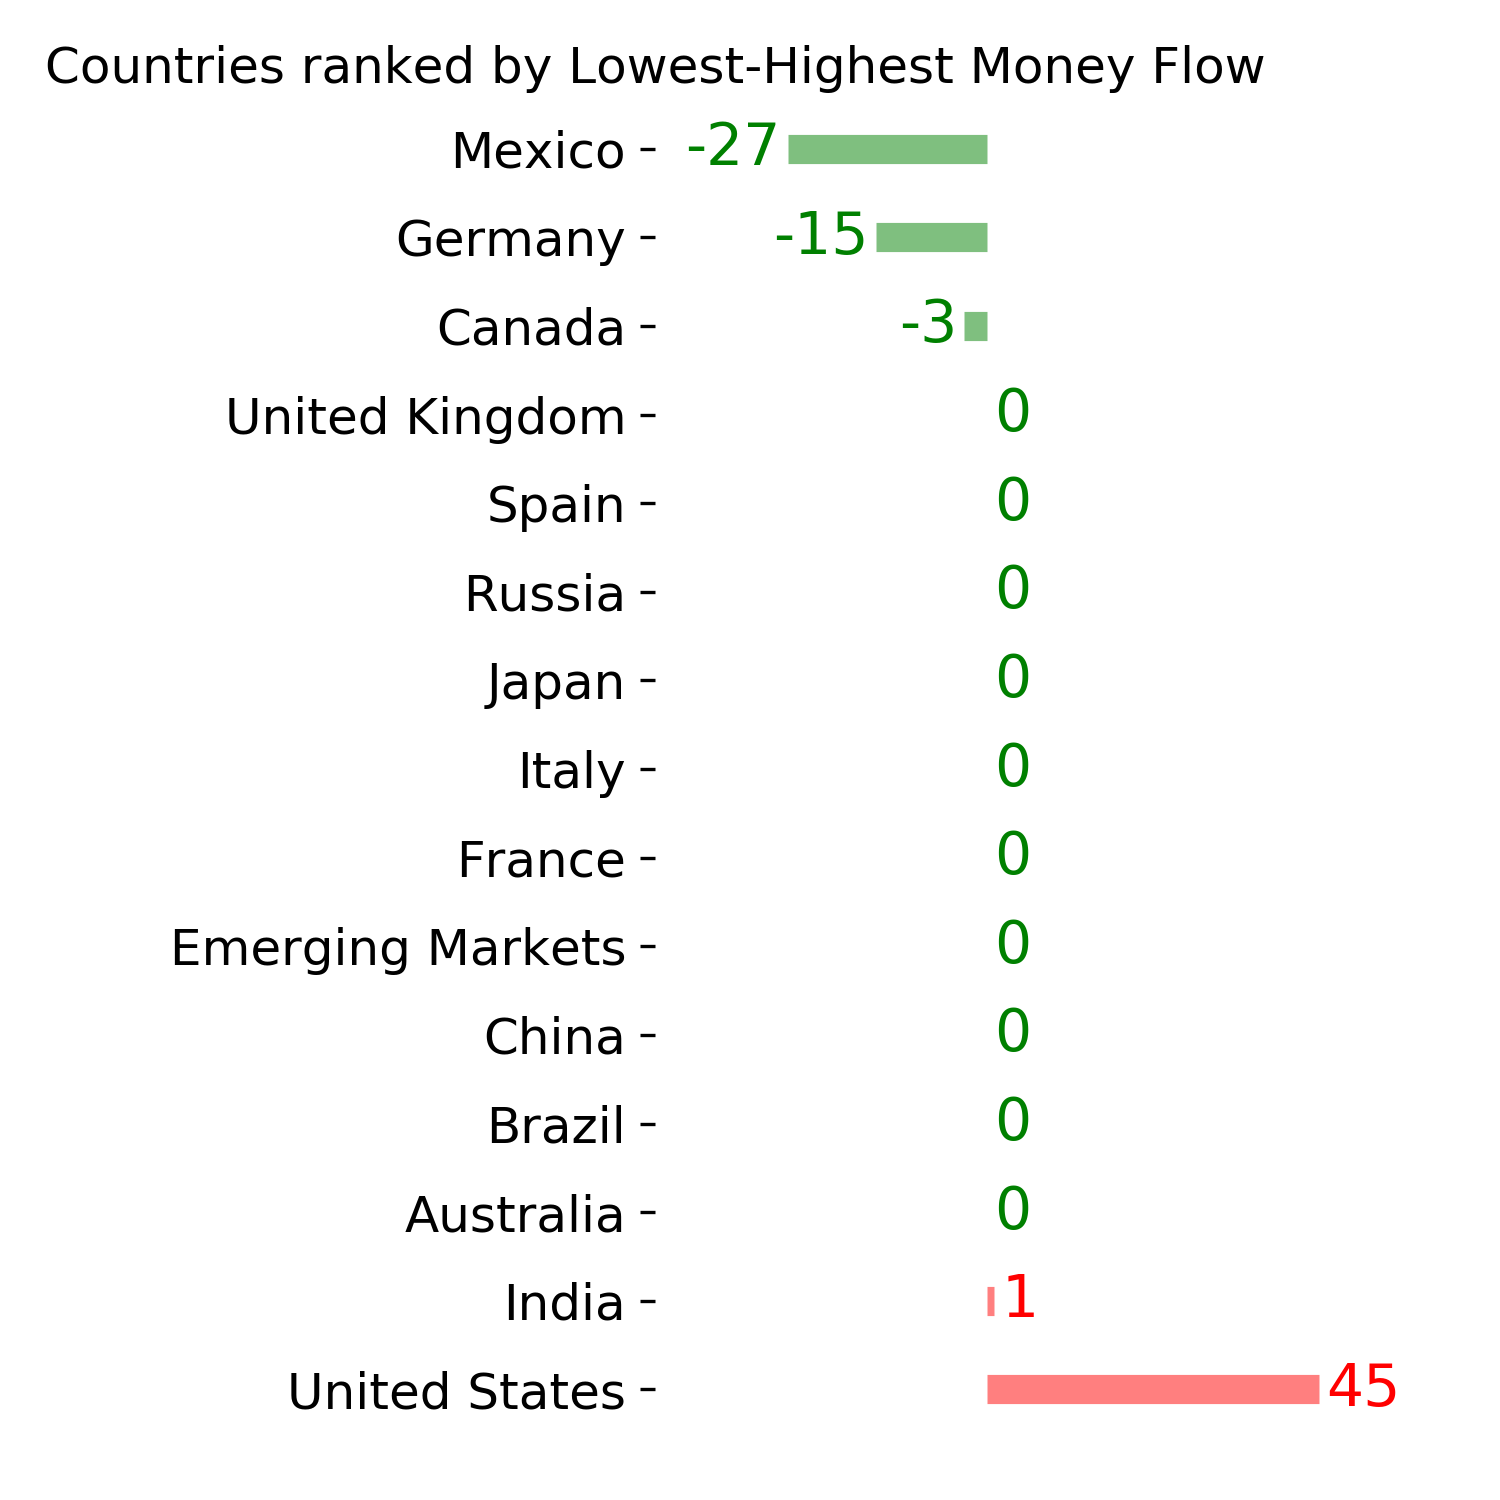
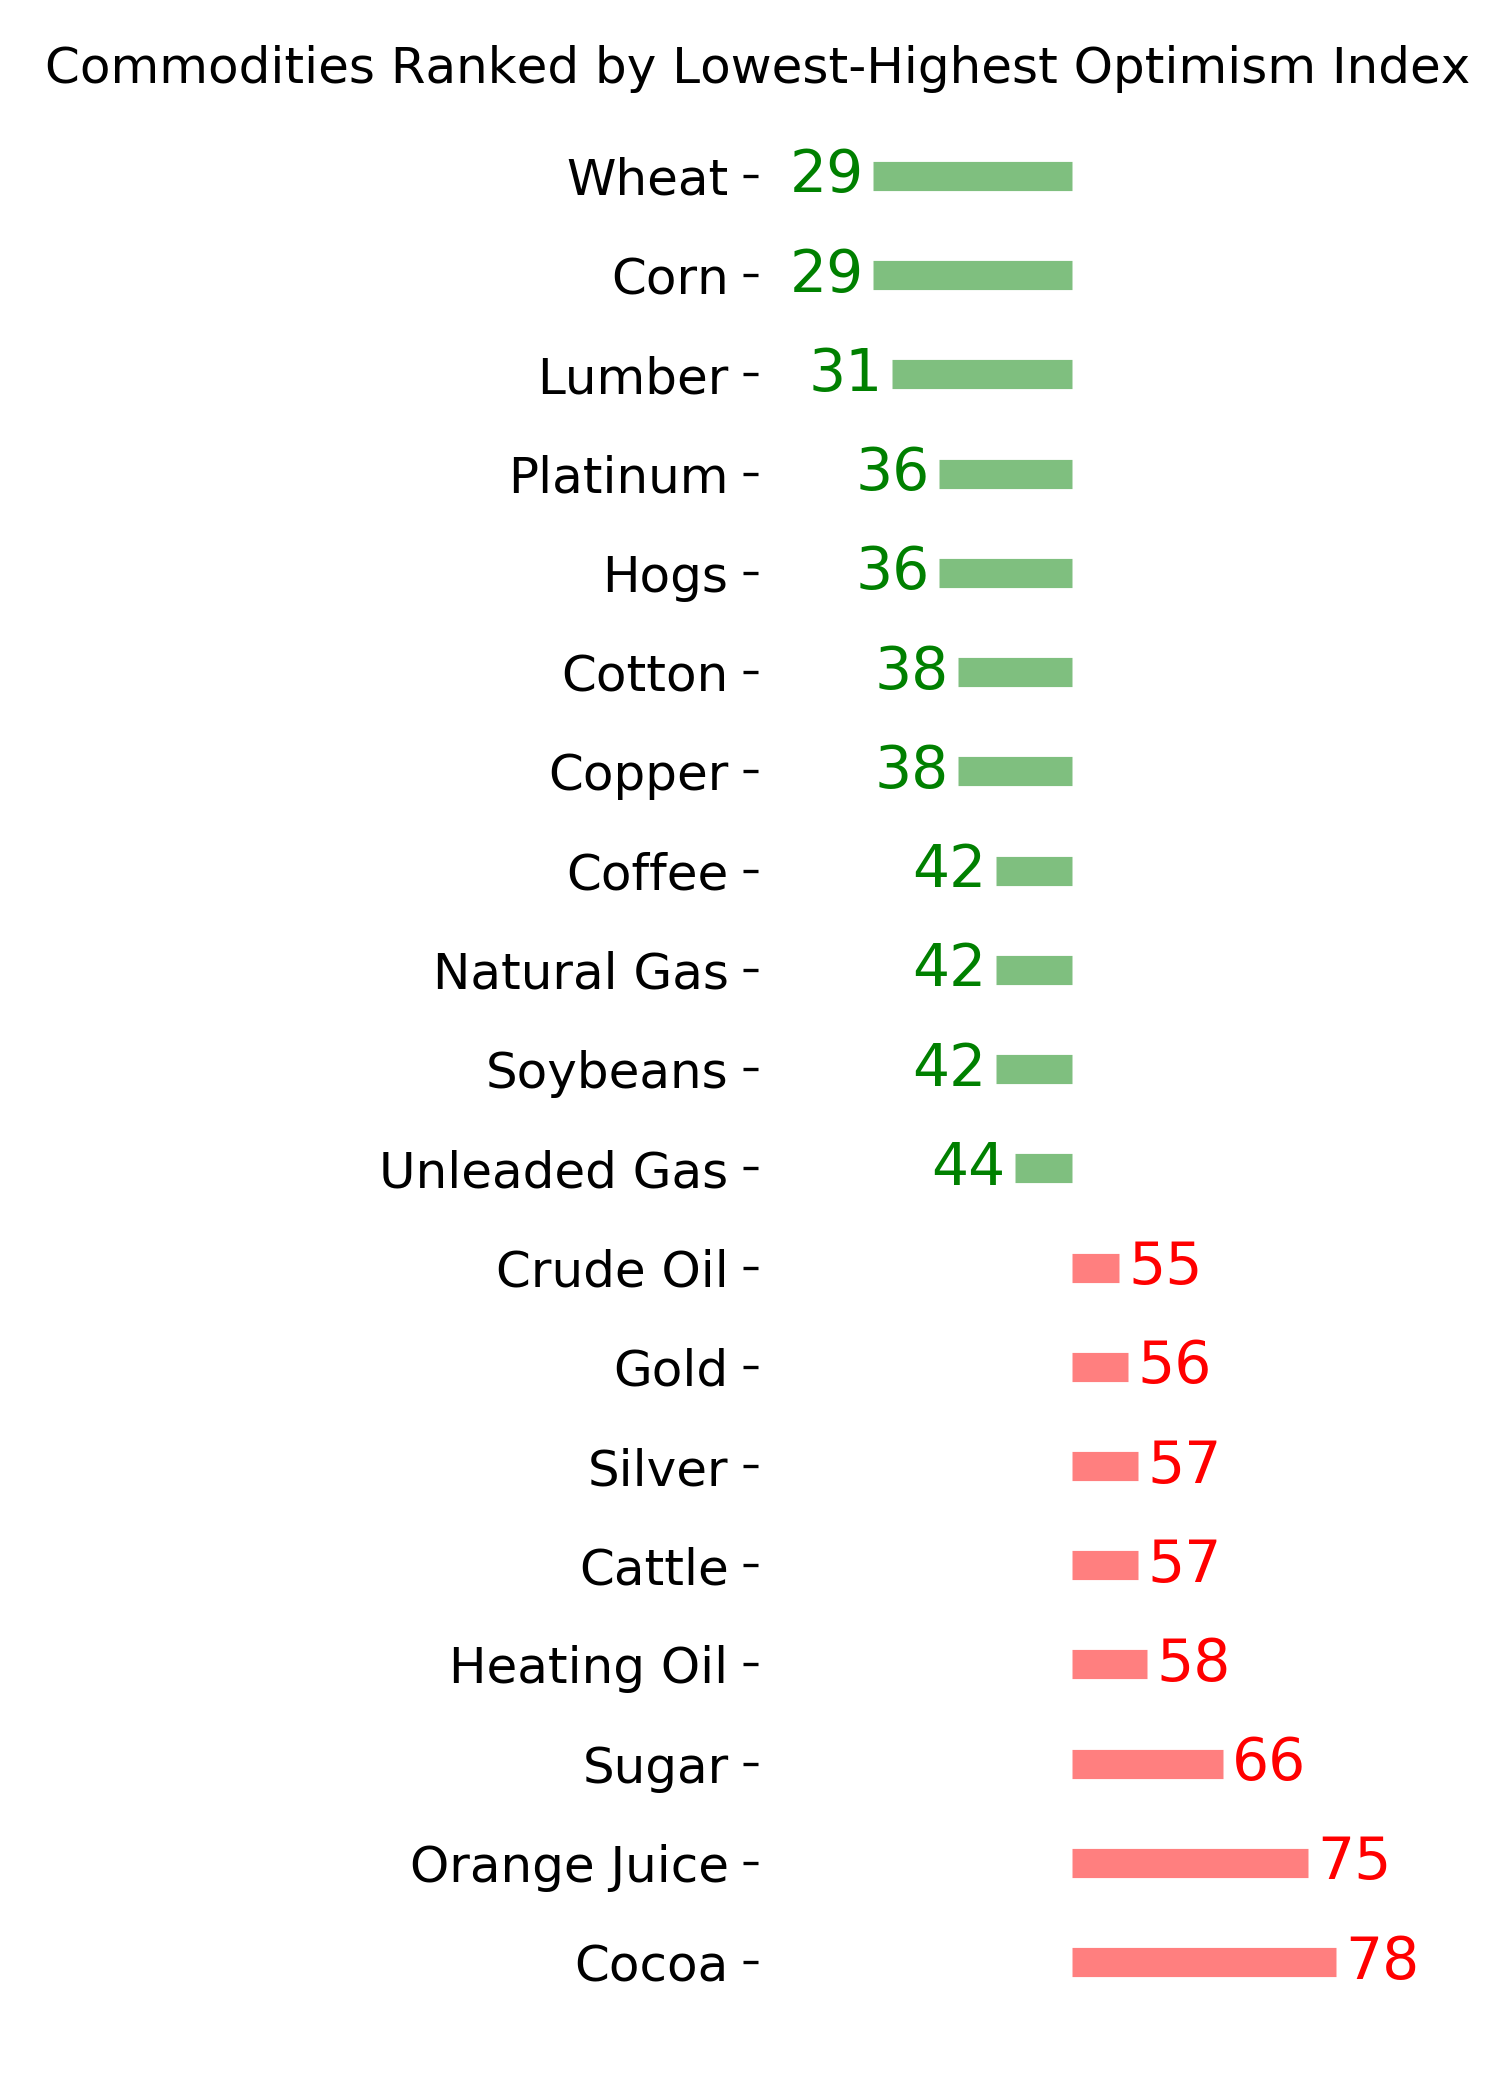
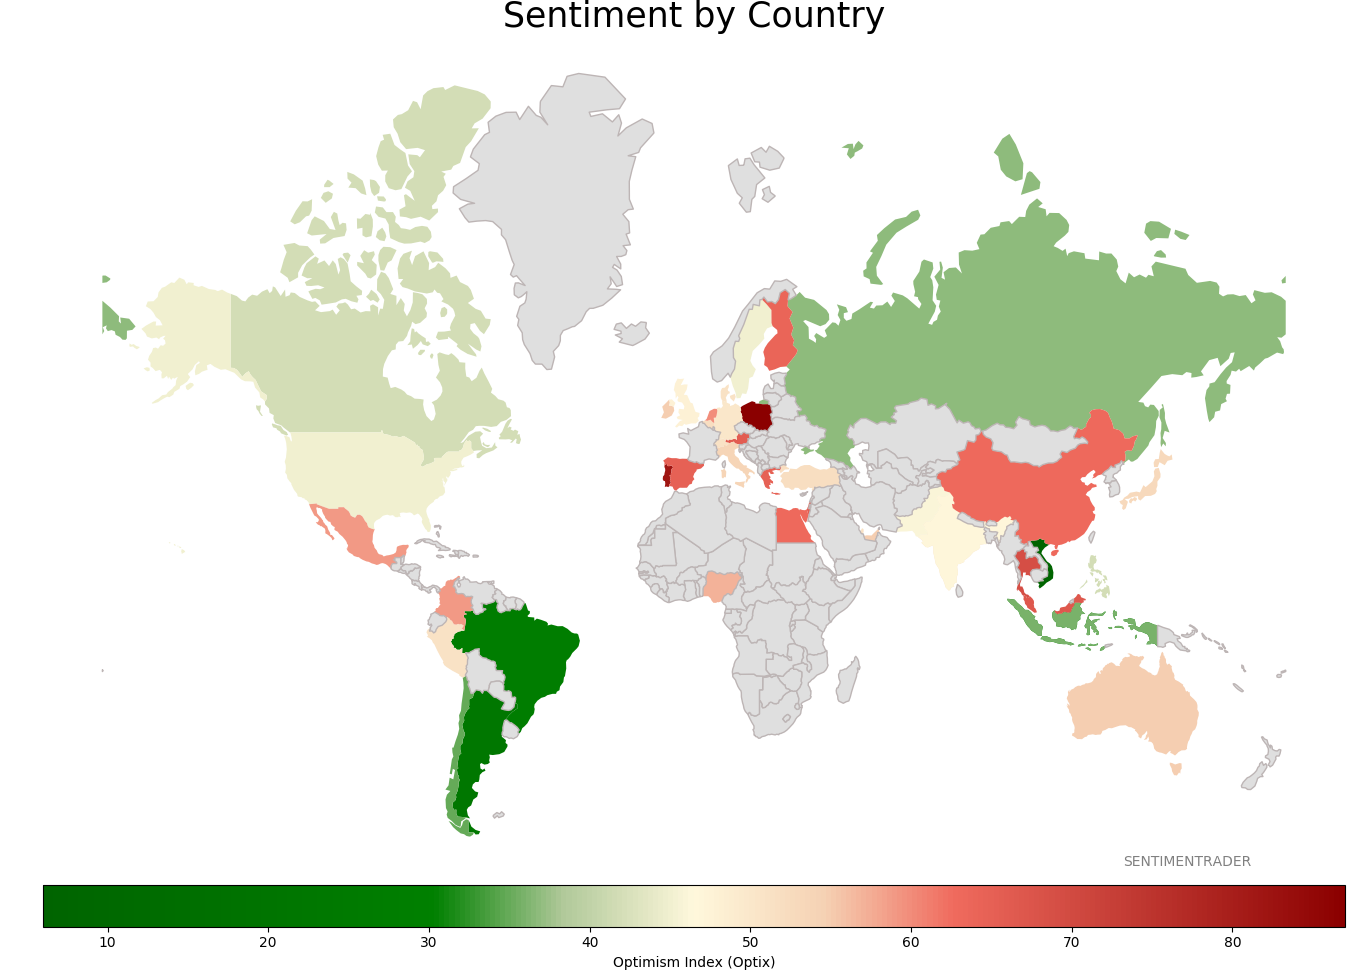
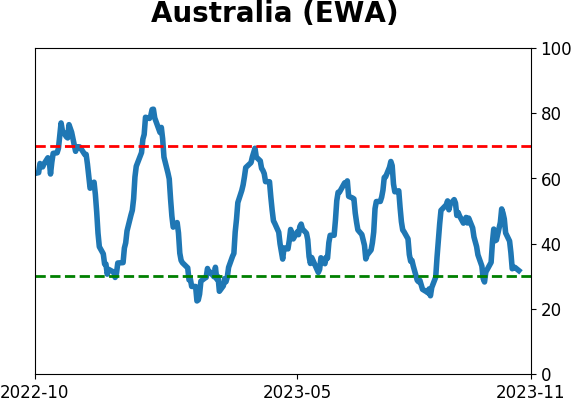
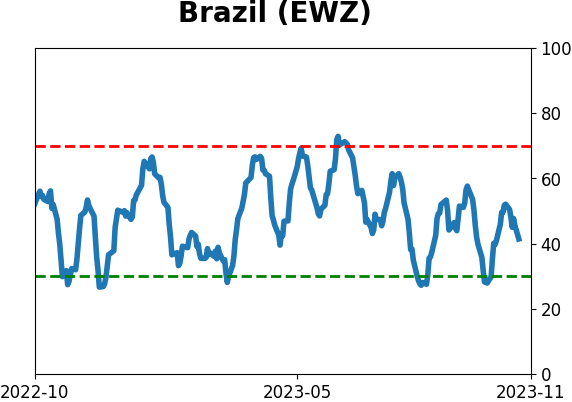
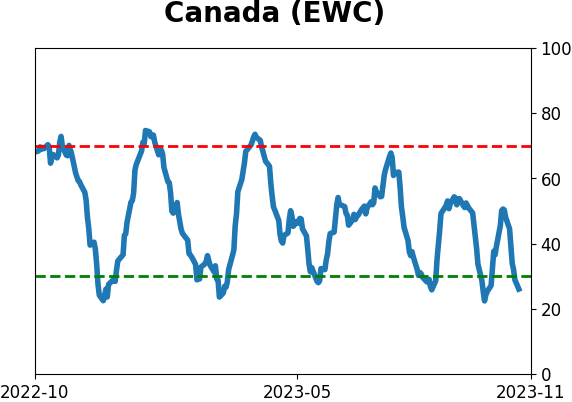
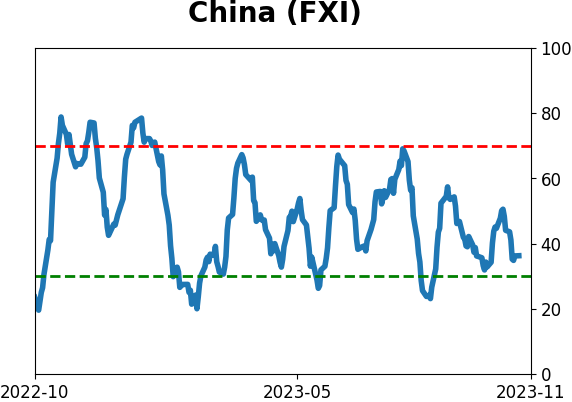
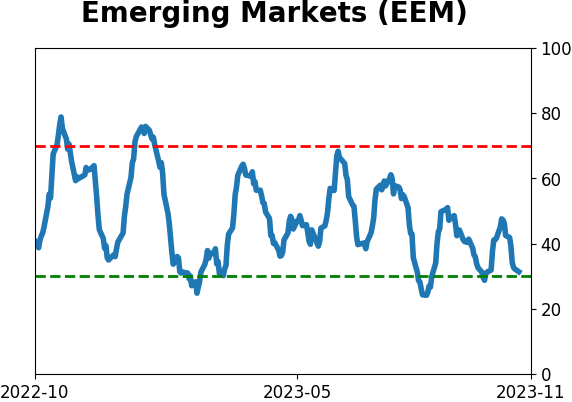
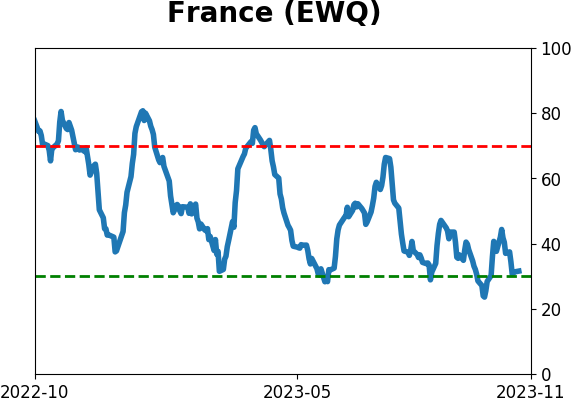
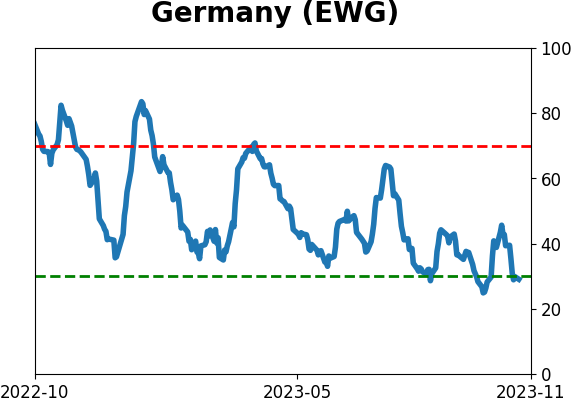
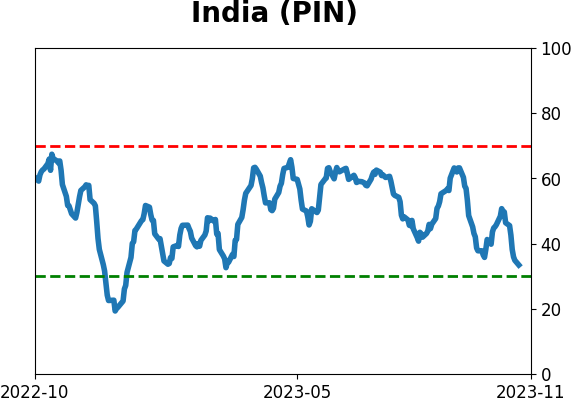
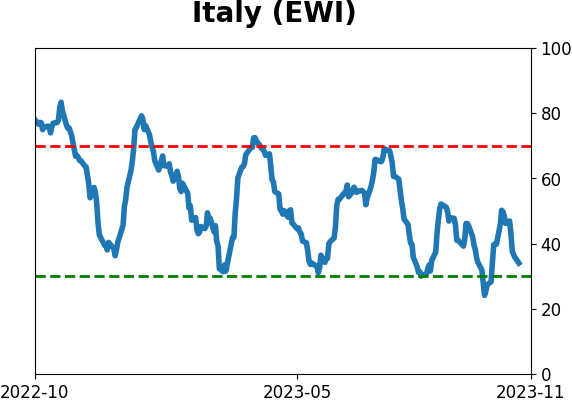
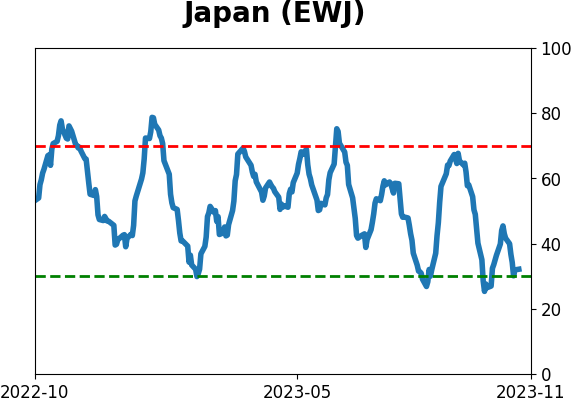
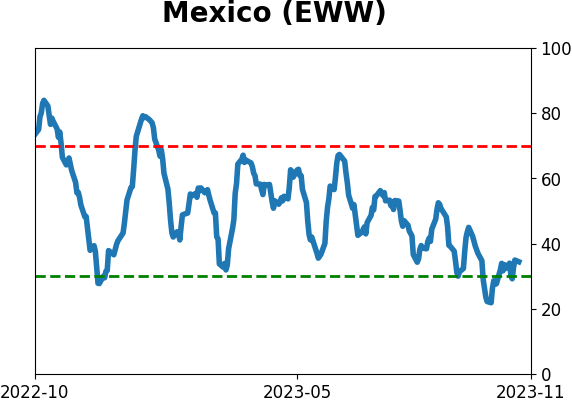
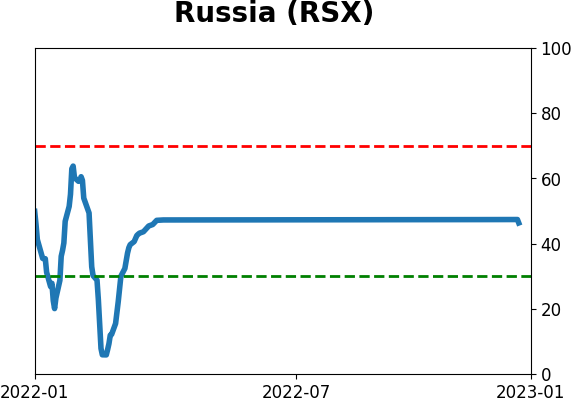
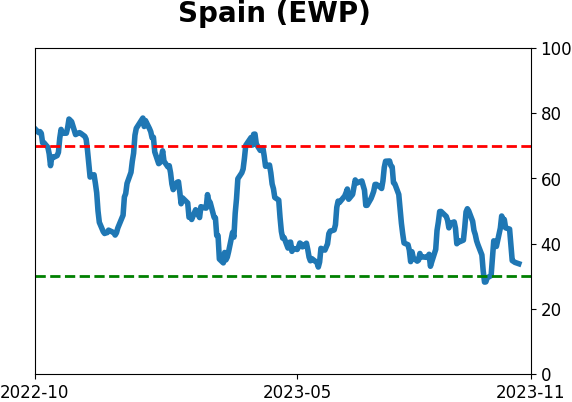
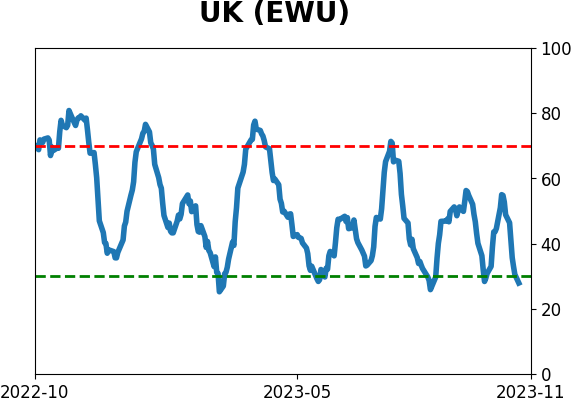
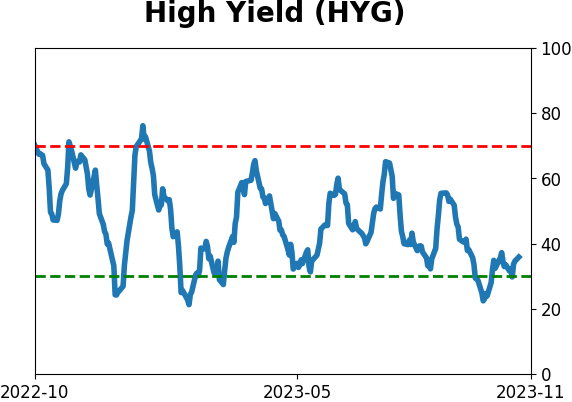
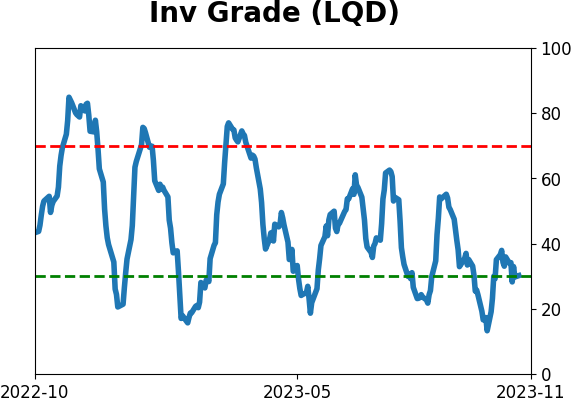
Sentiment Around The World
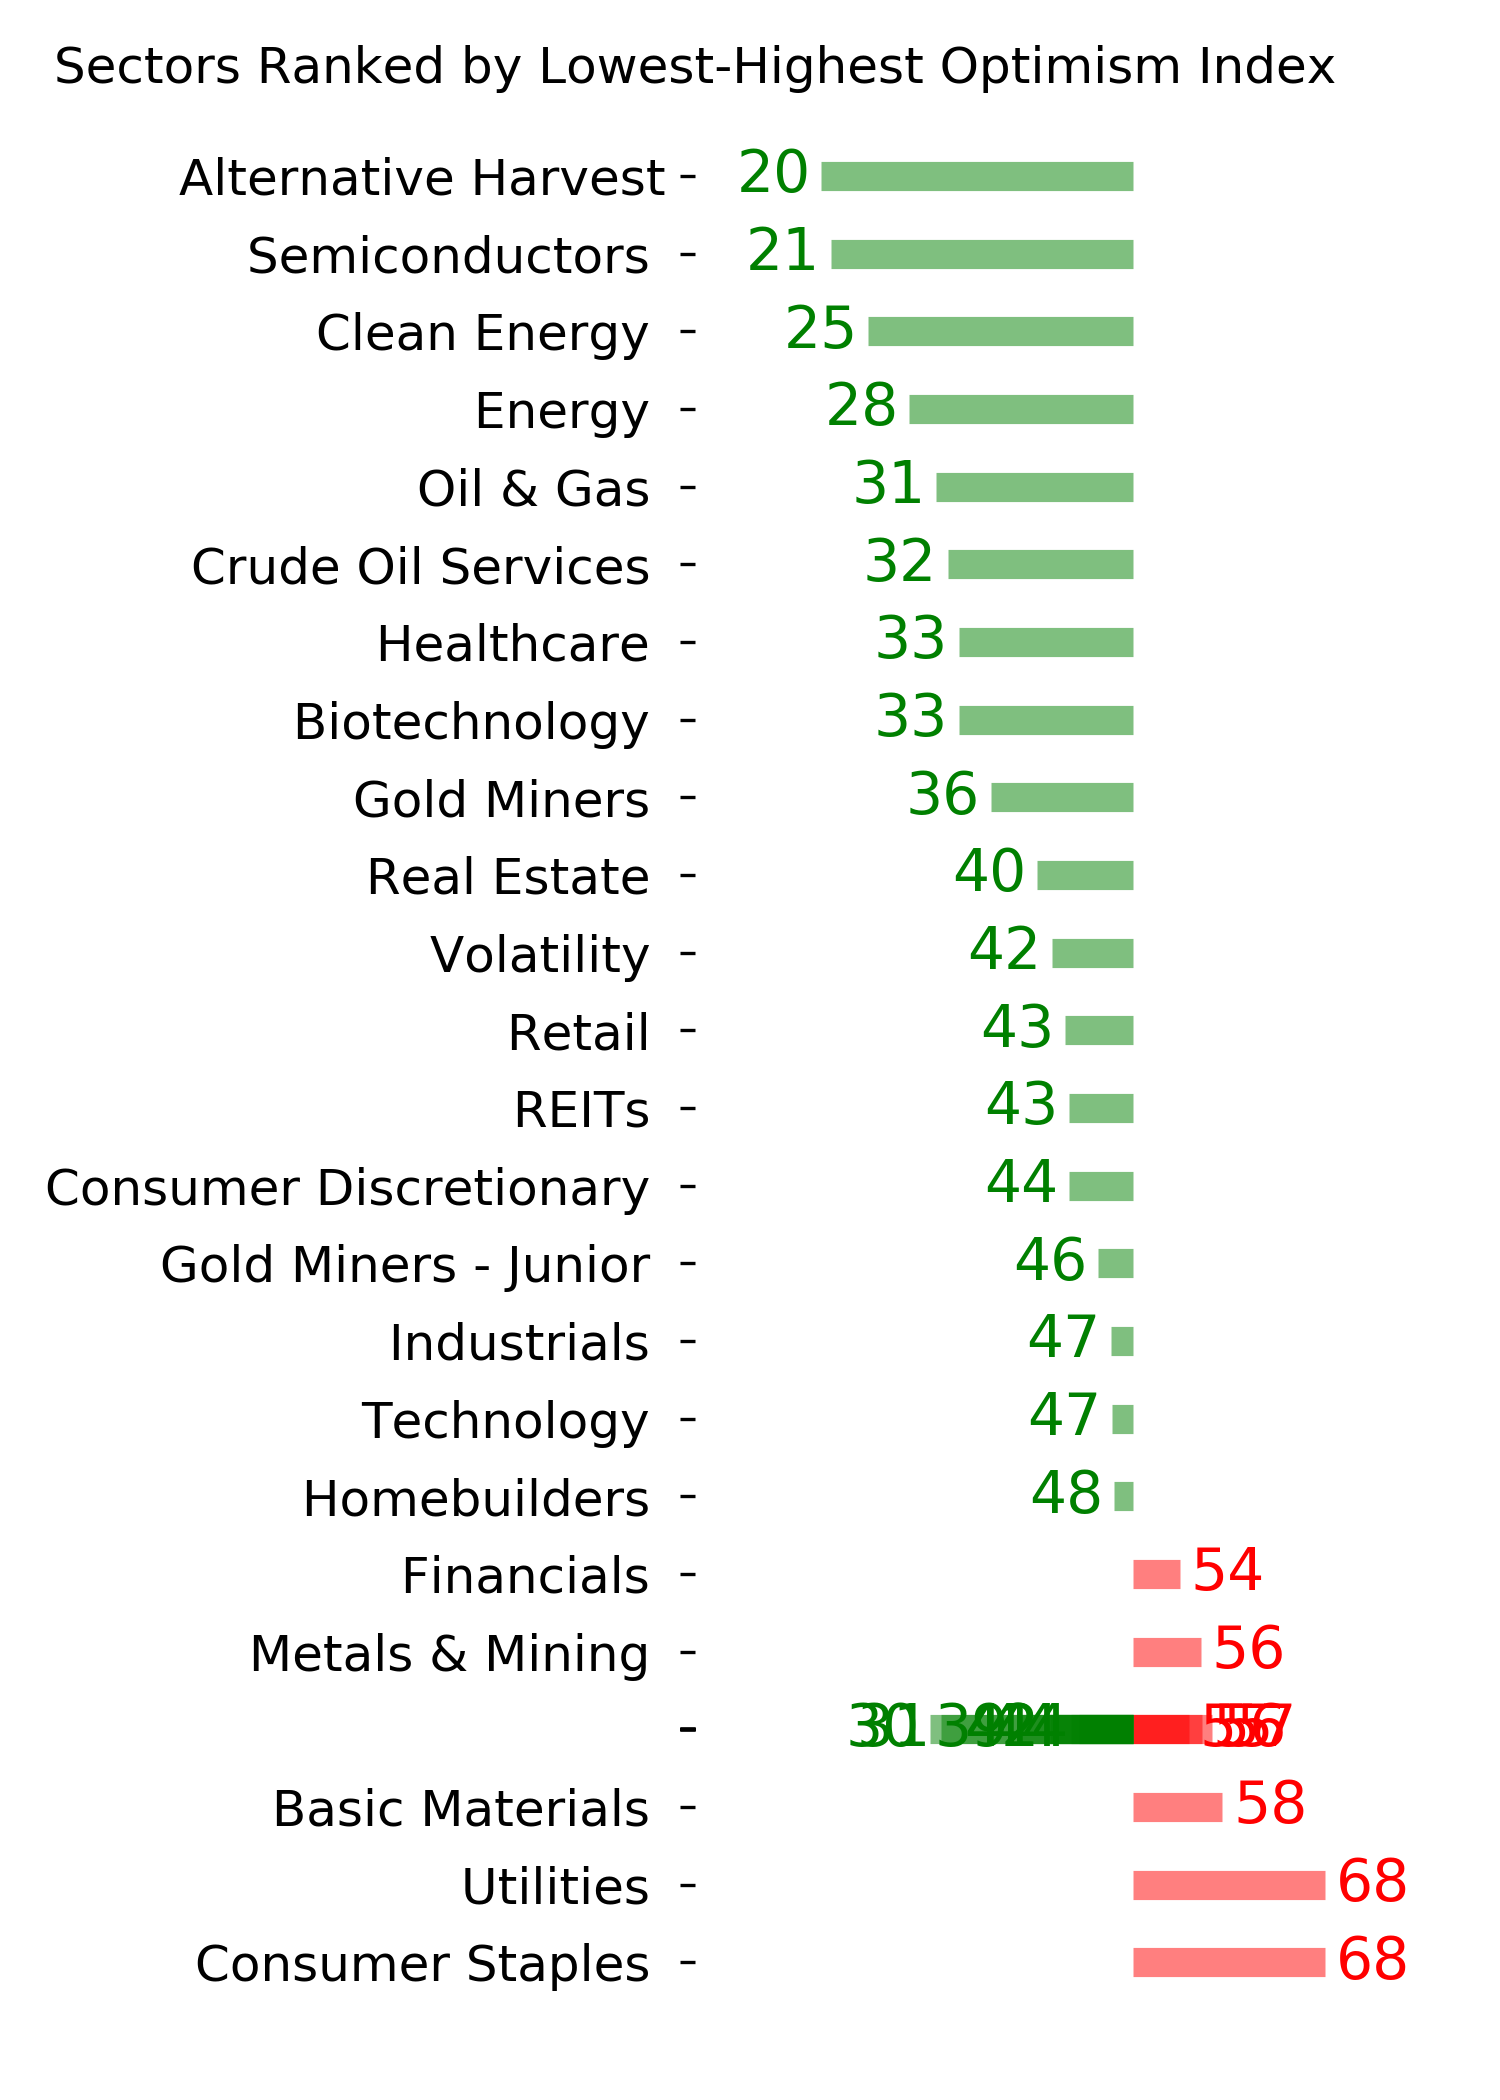
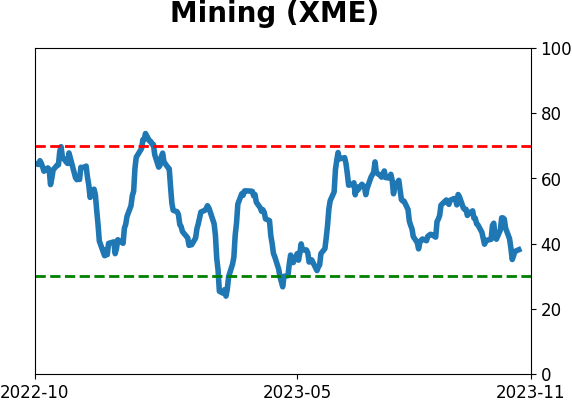
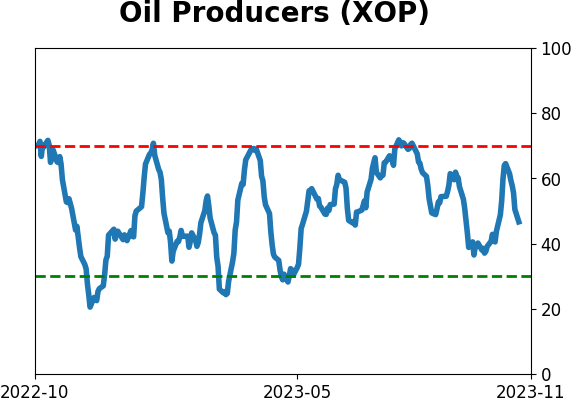
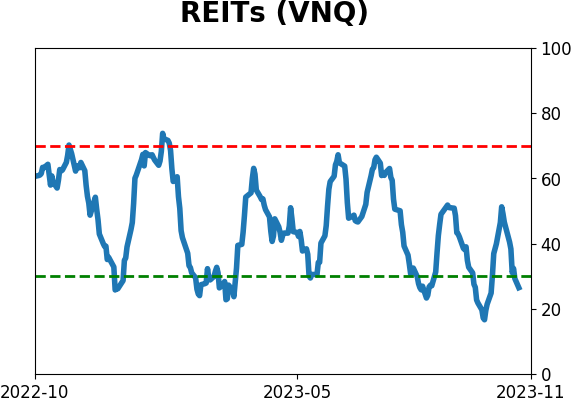
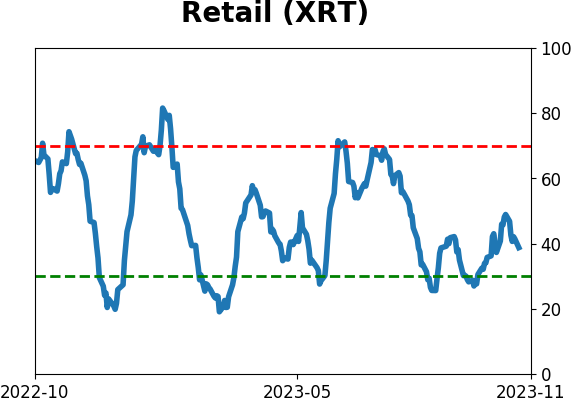
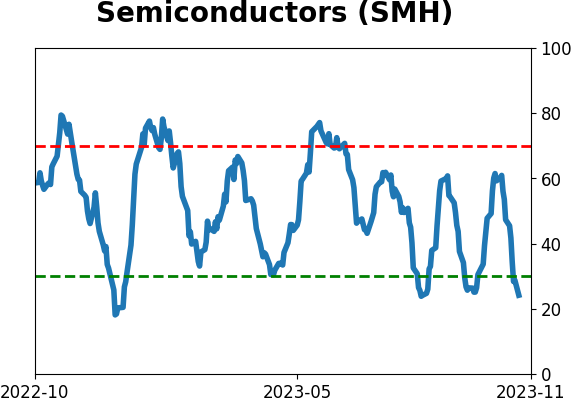
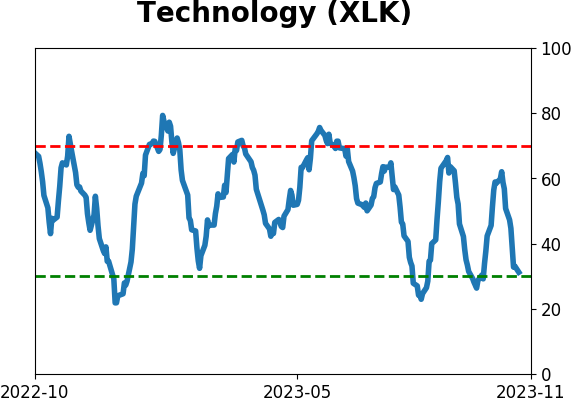
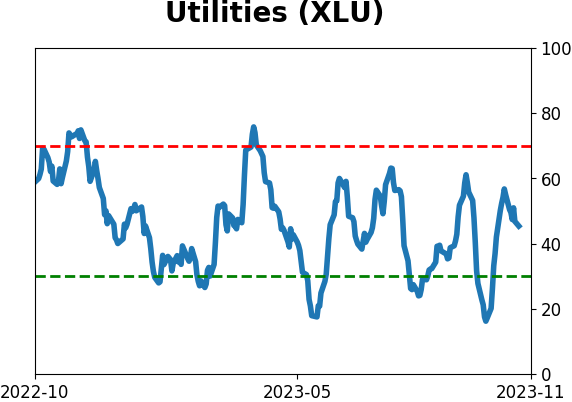
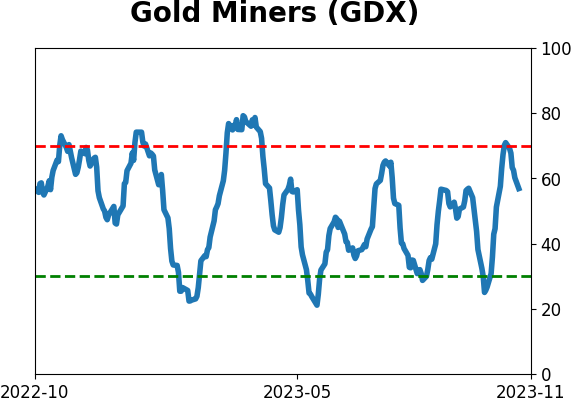
Optimism Index Thumbnails
|
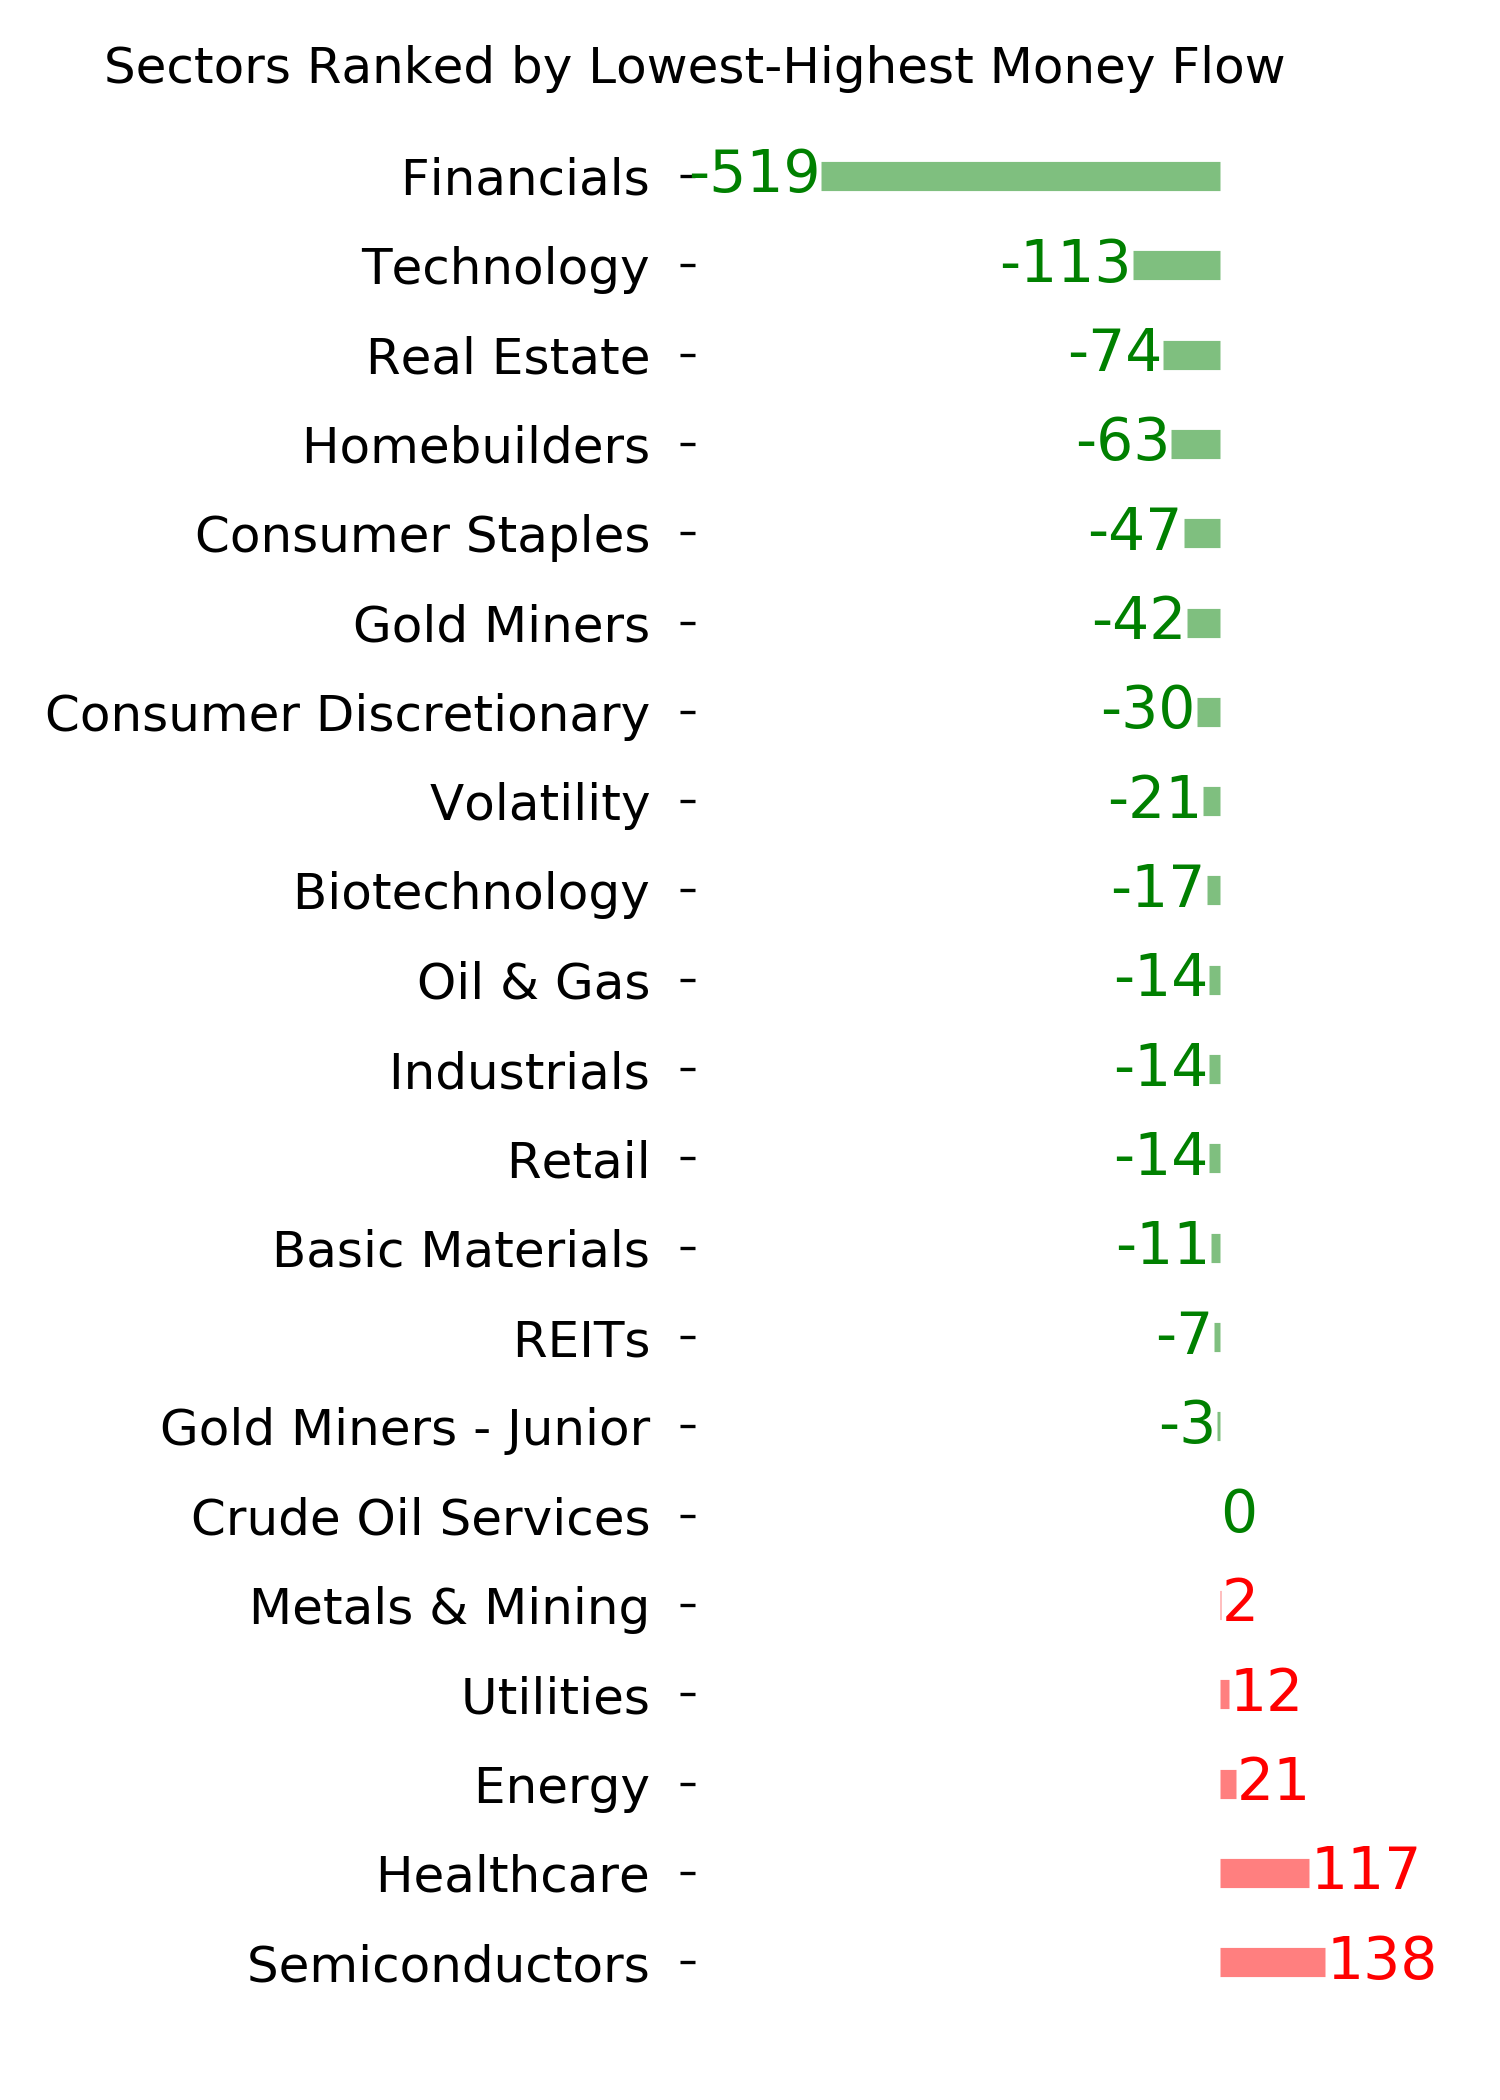
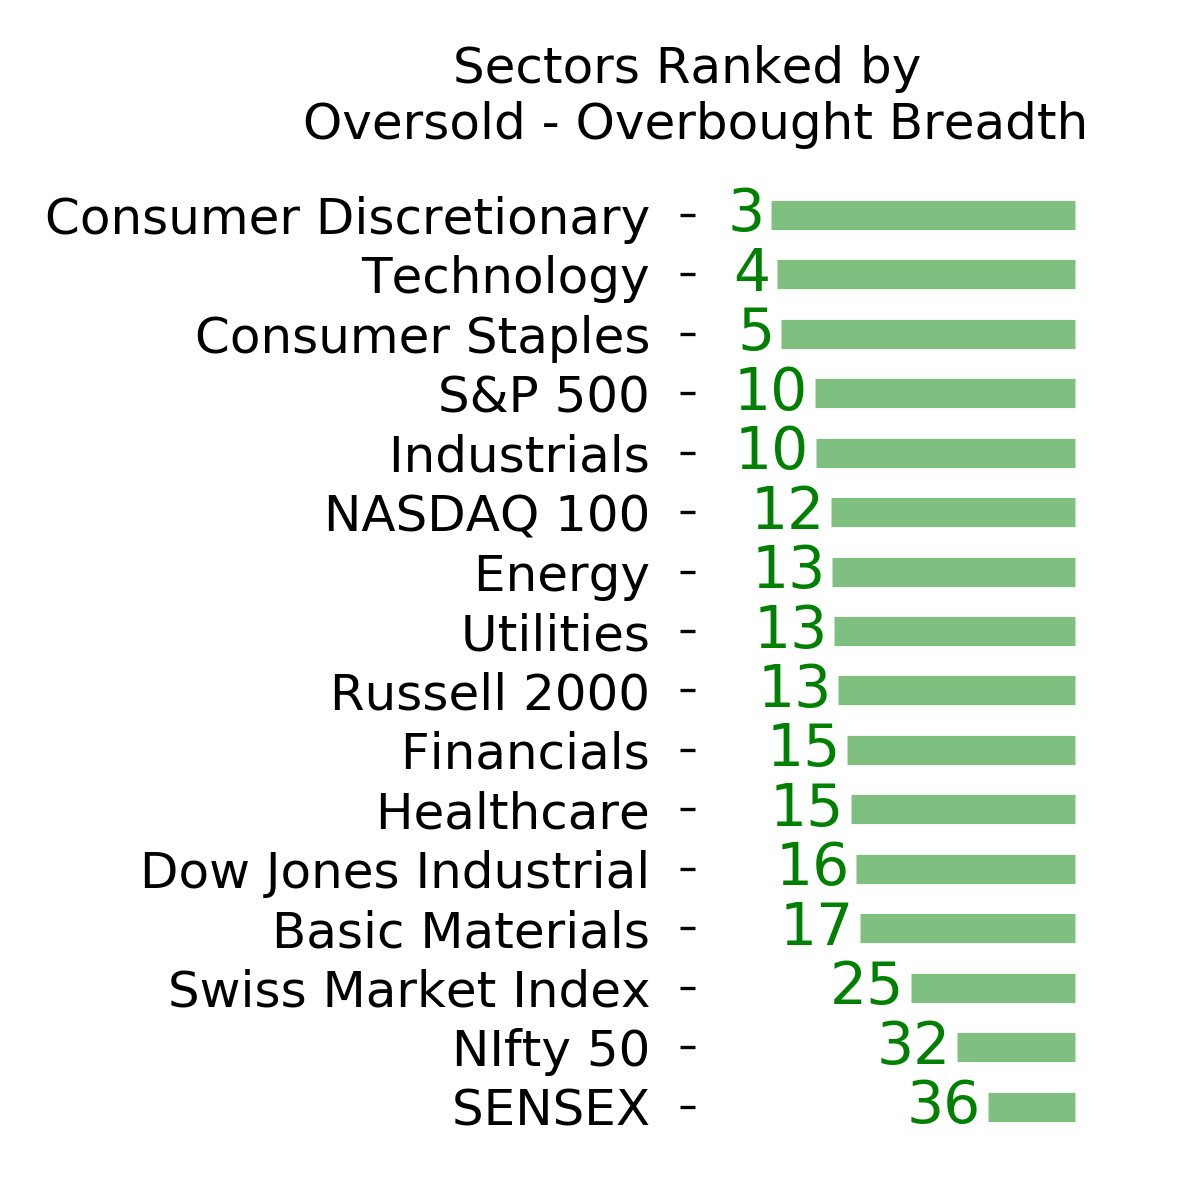
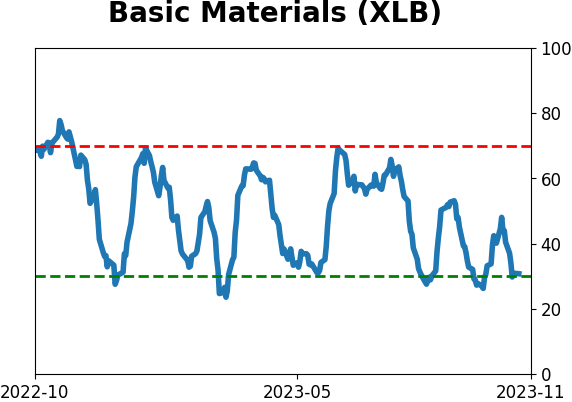
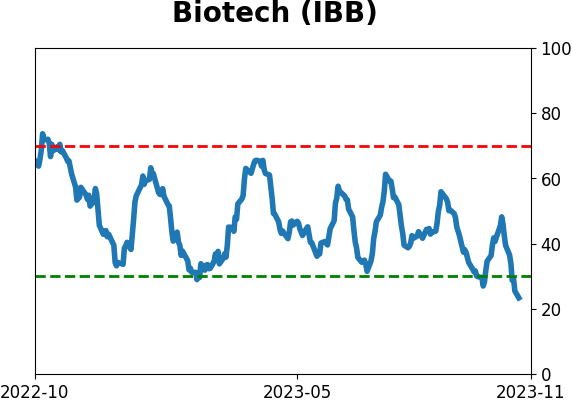
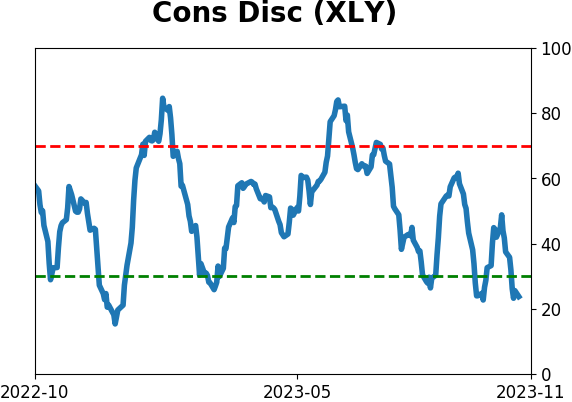
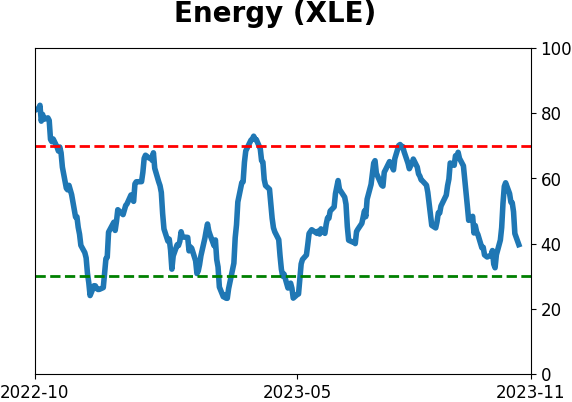
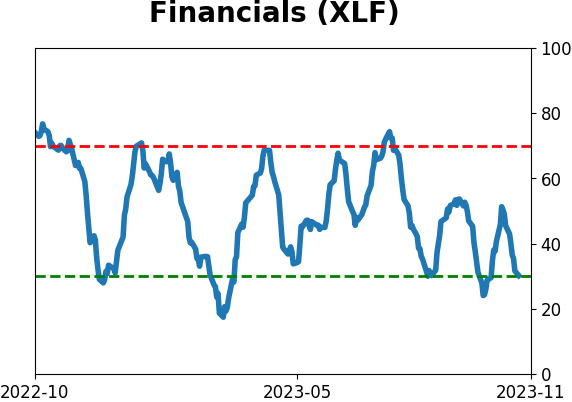
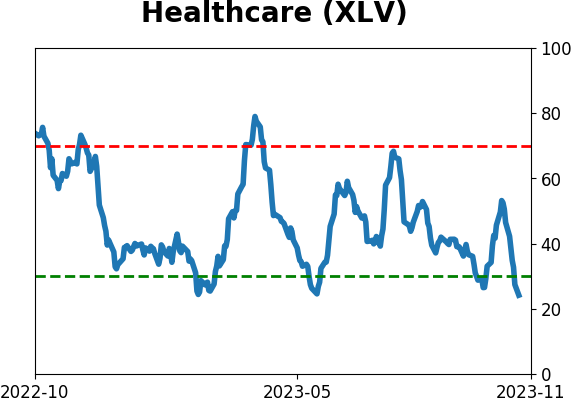
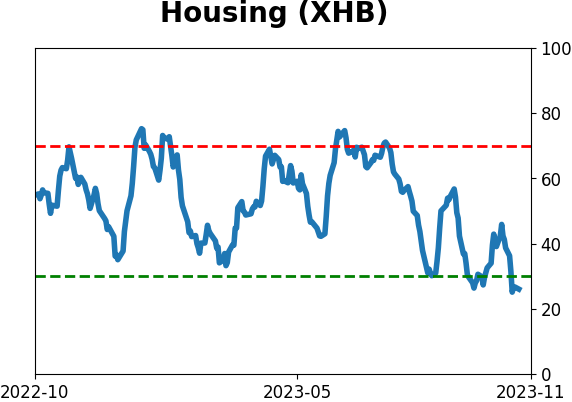
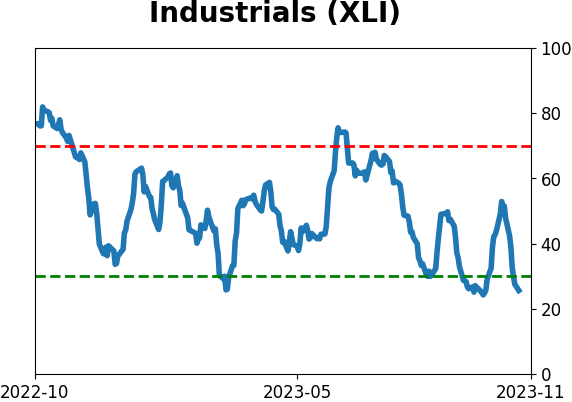
Sector ETF's - 10-Day Moving Average
|
|
|
Country ETF's - 10-Day Moving Average
|
|
|
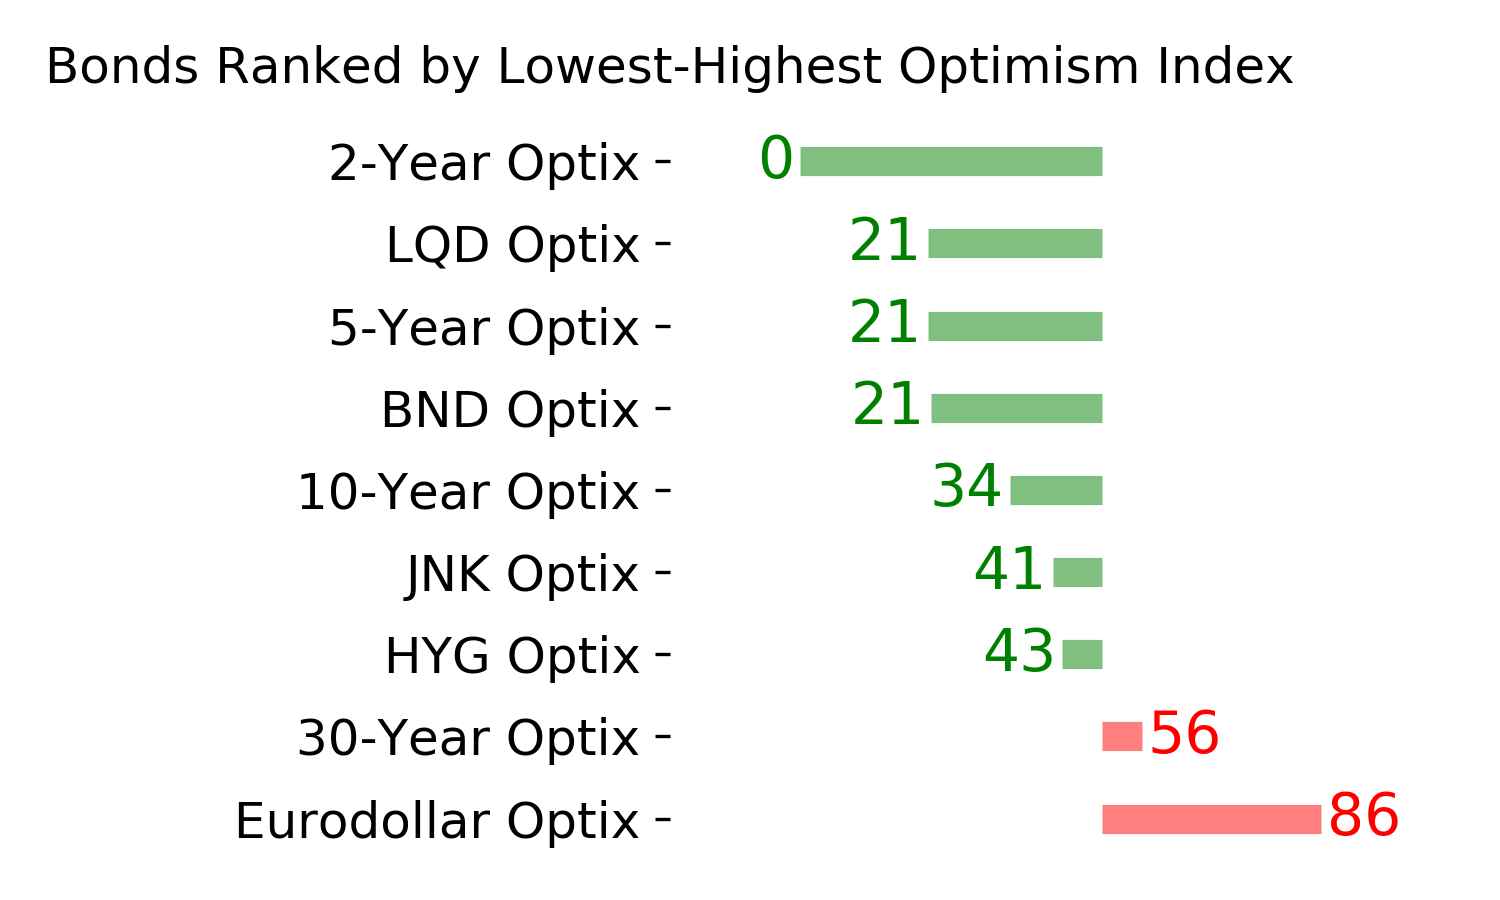
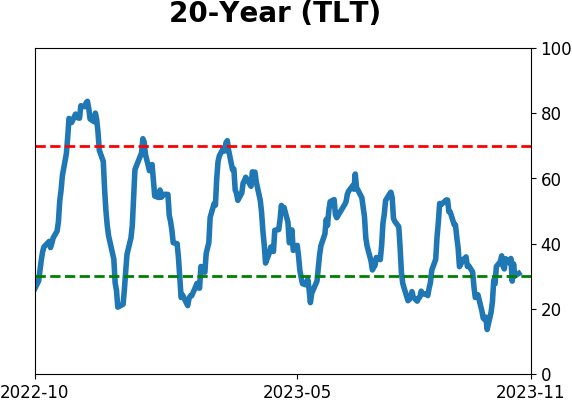
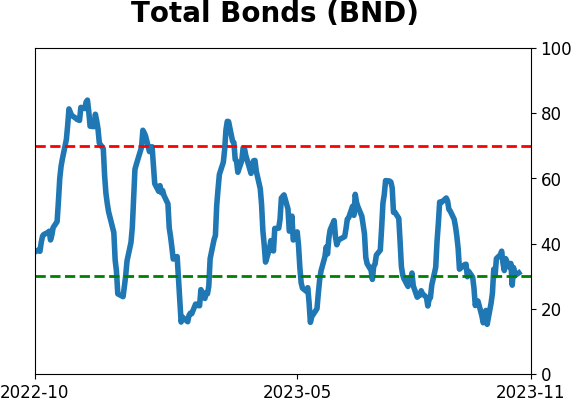
Bond ETF's - 10-Day Moving Average
|
|
|
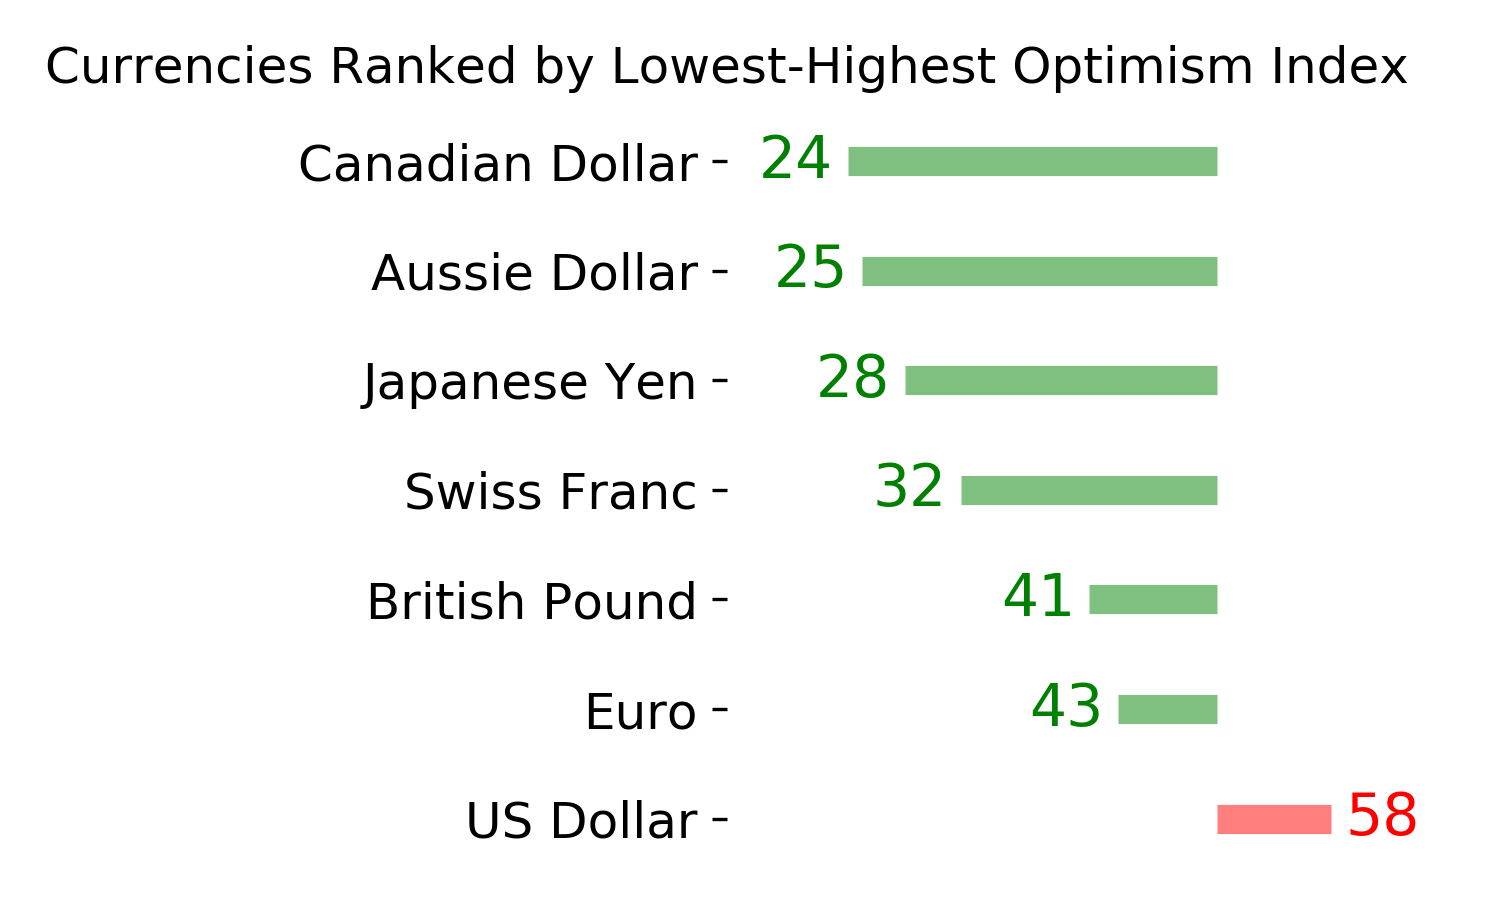
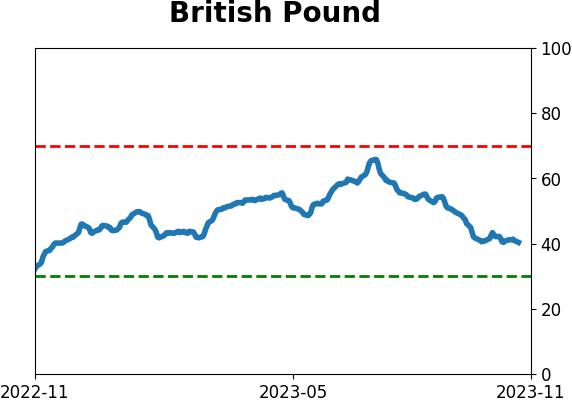
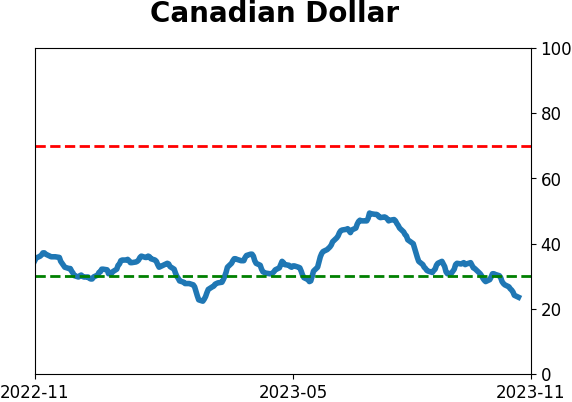
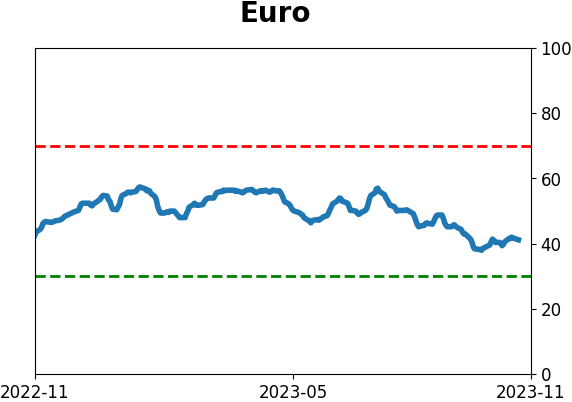
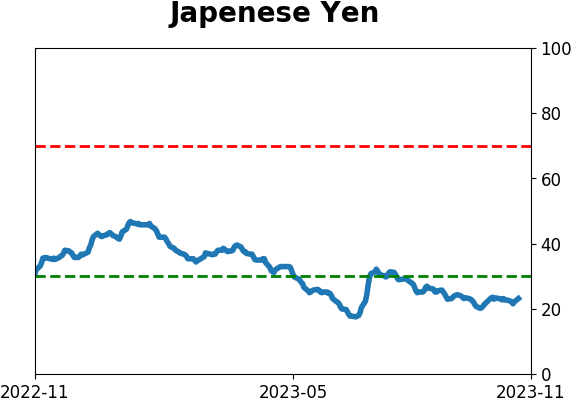
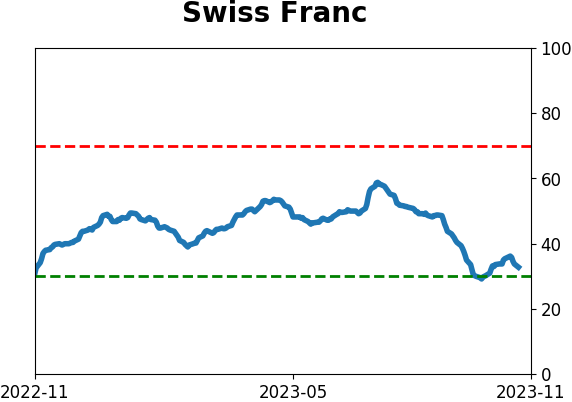
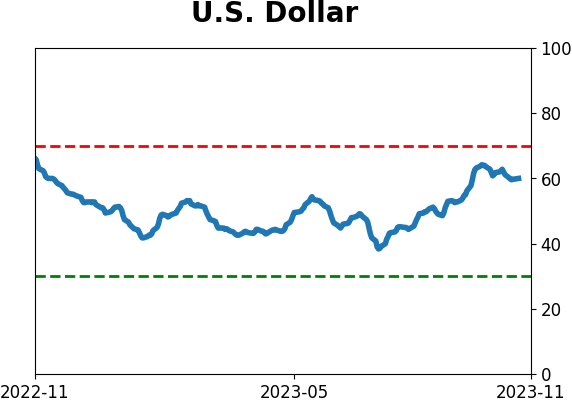
Currency ETF's - 5-Day Moving Average
|
|
|
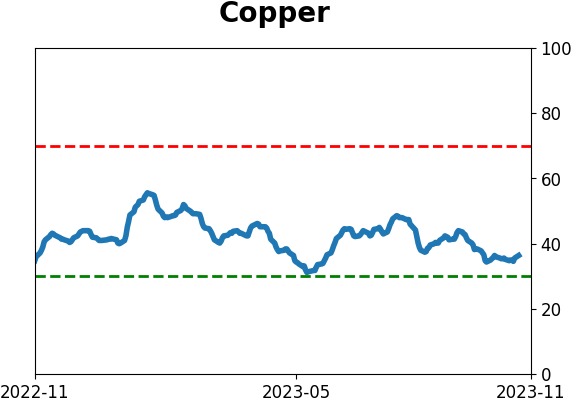
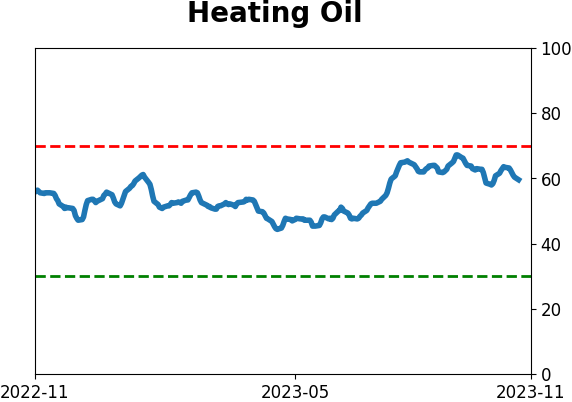
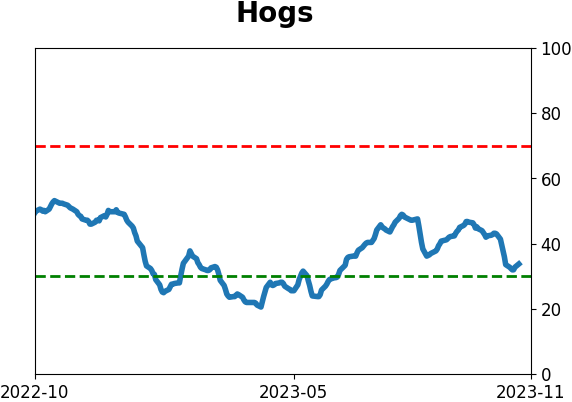
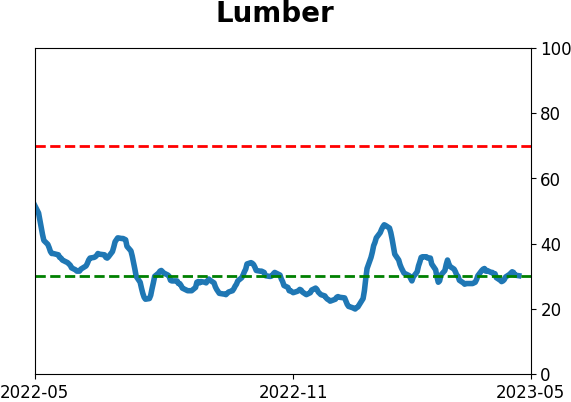
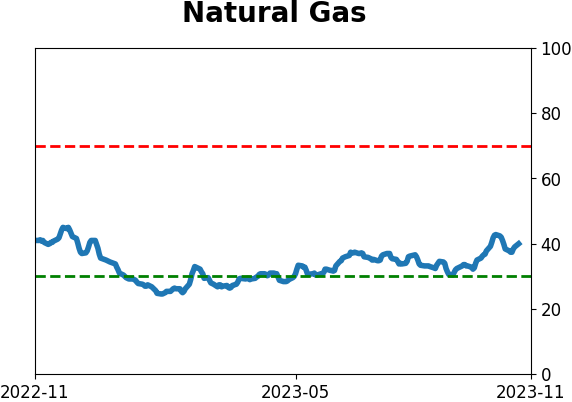
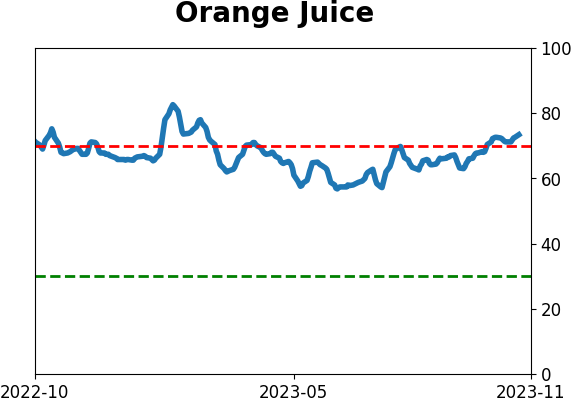
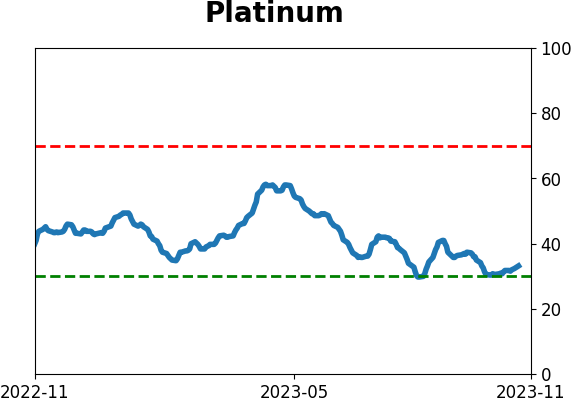
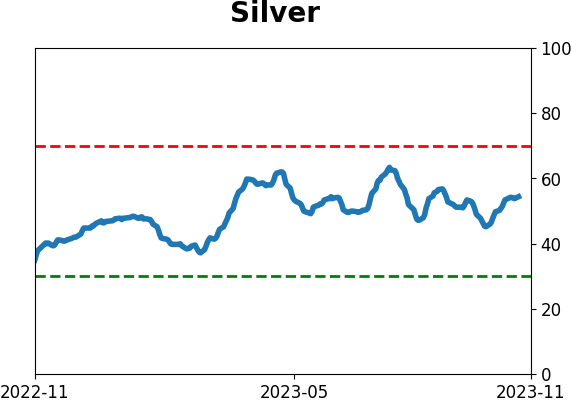
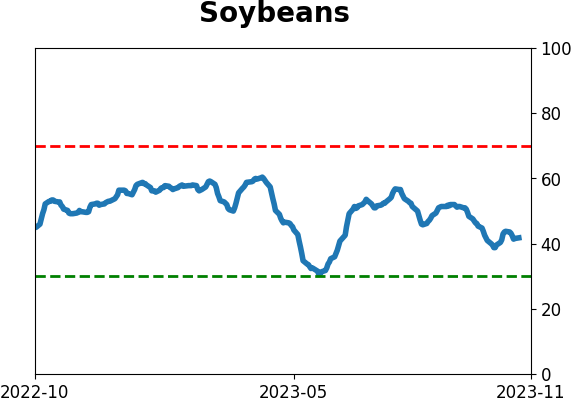
Commodity ETF's - 5-Day Moving Average
|
|