Daily Report : TradingEdge Weekly for Oct 28 - Reversals upon reversals, seasonal tailwinds, declining dollar

| View/Print a PDF version of this Report |
Headlines
|
TradingEdge Weekly for Oct 28 - Reversals upon reversals, seasonal tailwinds, declining dollar: This week, we saw that investors' leverage has plunged along with stocks. There are nascent signs of an impressive reversal in prices, and many individual stocks. Some breadth measures have triggered notable extremes. Short-term positive seasonal tendencies might help. Chinese tech stocks plunged anew, but a wobbling dollar might help. |
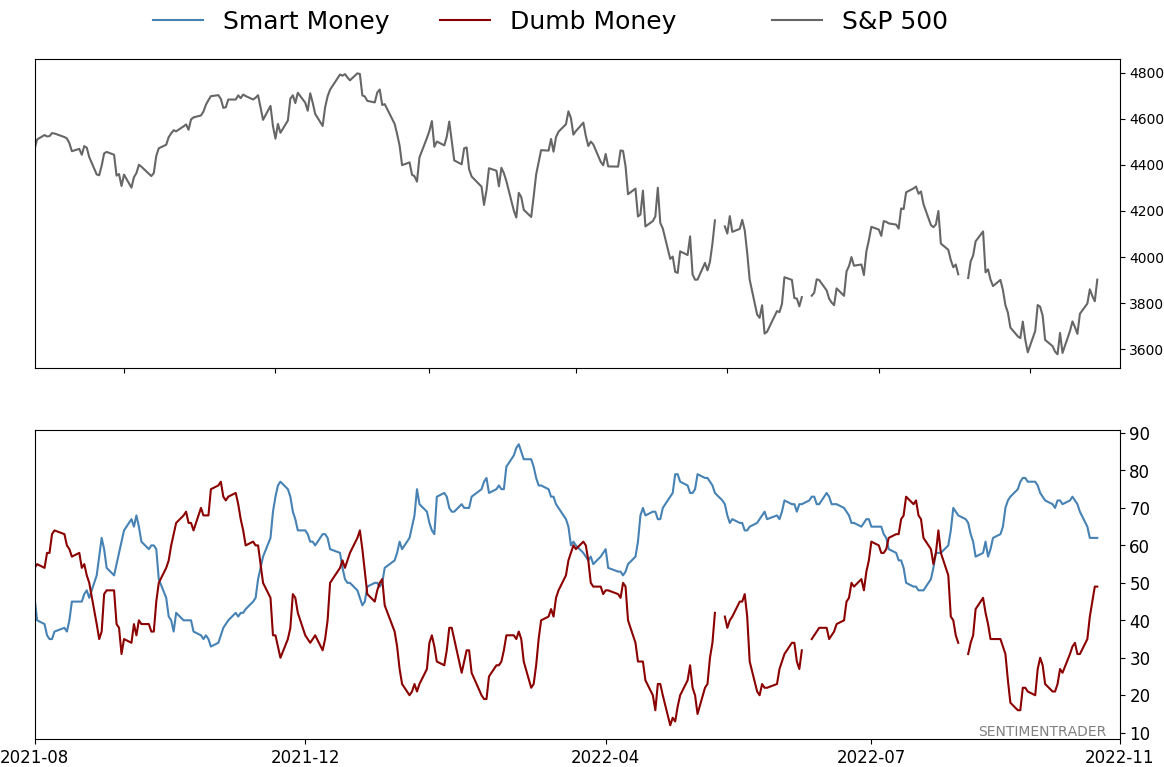
Smart / Dumb Money Confidence
|
|
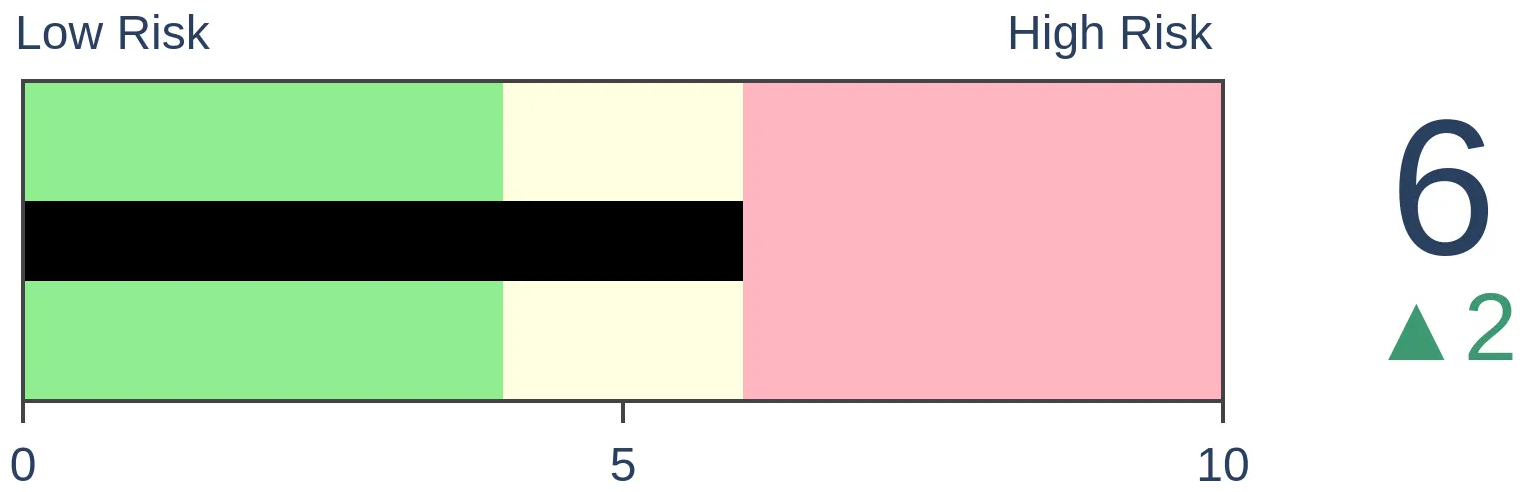
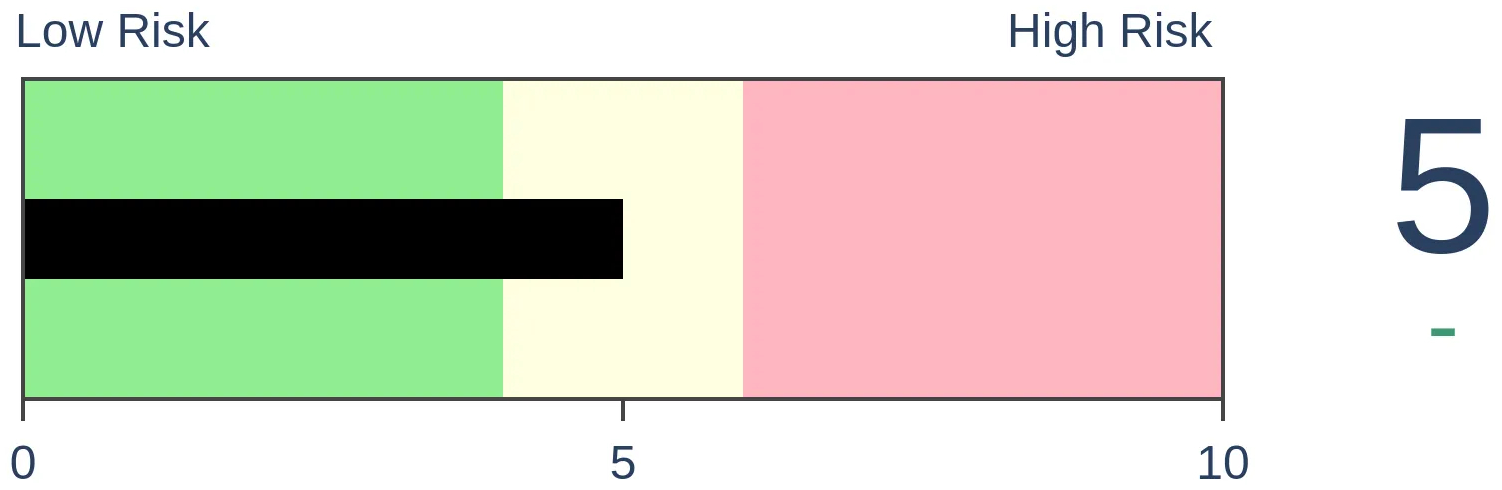
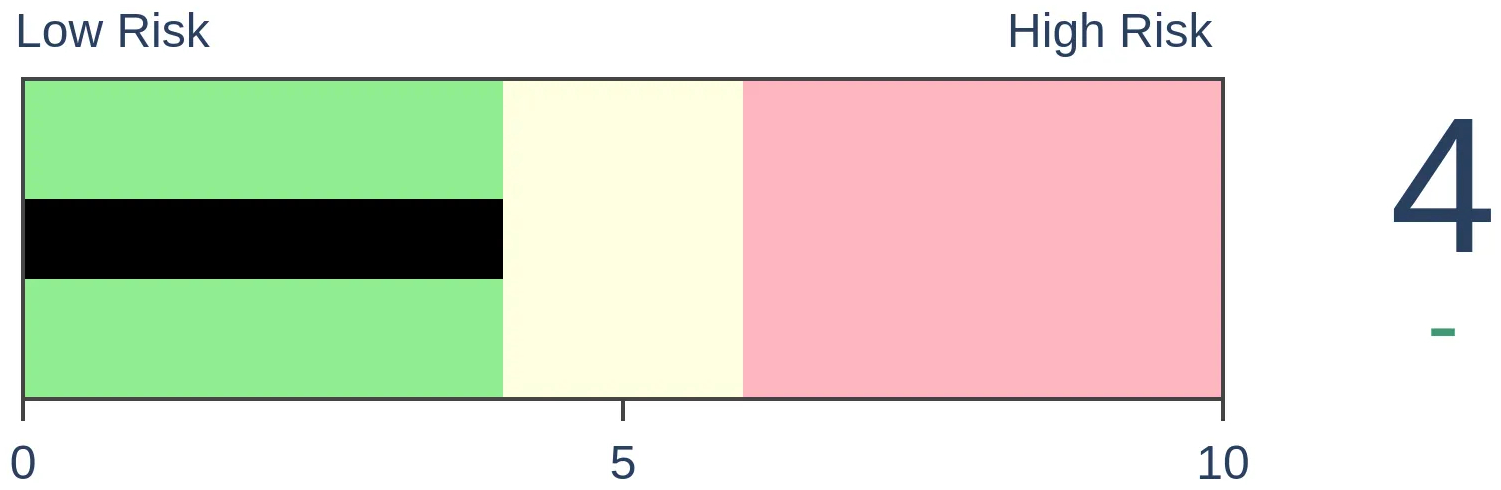
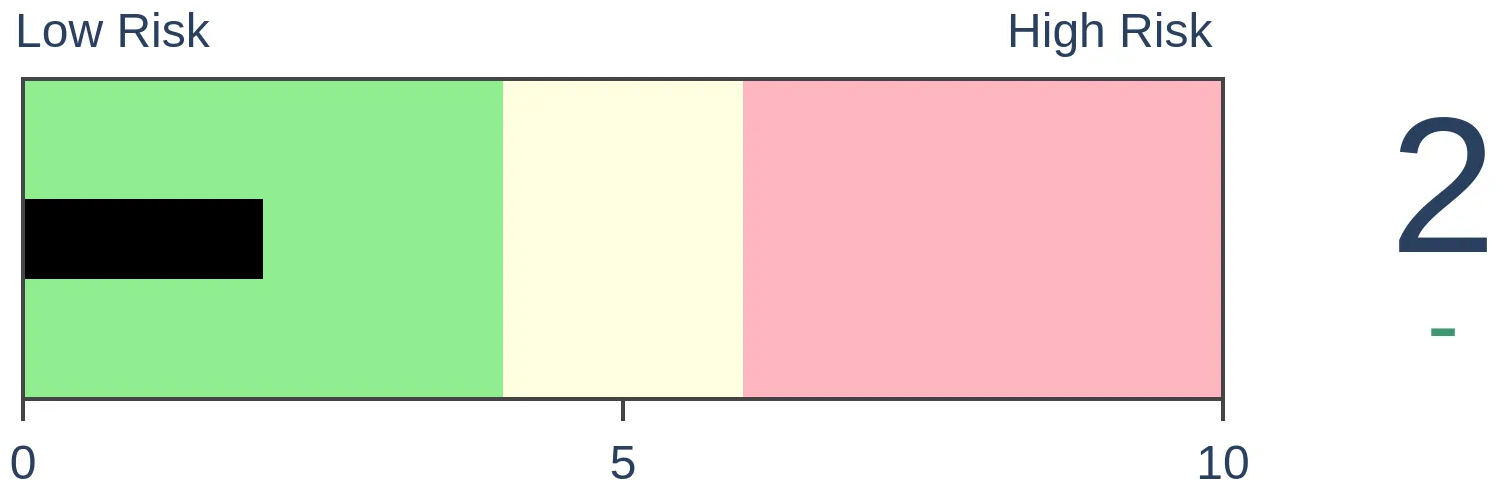
Risk Levels
|
|

|

Research
TradingEdge Weekly for Oct 28 - Reversals upon reversals, seasonal tailwinds, declining dollarBy Jason GoepfertBOTTOM LINEThis week, we saw that investors' leverage has plunged along with stocks. There are nascent signs of an impressive reversal in prices, and many individual stocks. Some breadth measures have triggered notable extremes. Short-term positive seasonal tendencies might help. Chinese tech stocks plunged anew, but a wobbling dollar might help. FORECAST / TIMEFRAME |
Key points:
- Stocks have plunged, and investors' leverage went along with it
- There are nascent signs of price reversals in the S&P 500
- Reversals have spread to industry groups and volatility metrics
- Notable breadth indicators are also showing impressive reversals
- The S&P and the Tech sector are in short-term positive seasonal windows
- Chinese internet stocks plunged, yet again
- The dollar's incessant uptrend is wobbling
- Seasonal tendencies and options positions may give it some support, though
- Natural gas is oversold but now has a seasonal headwind
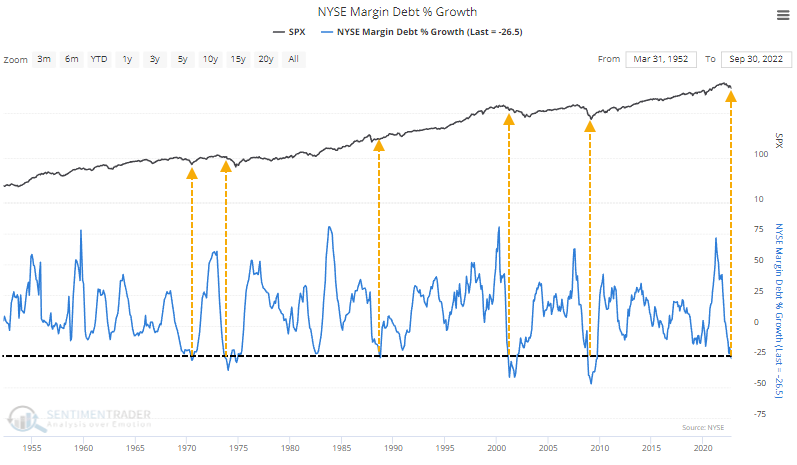
Leverage plunges along with stocks
A little less than a year ago, we saw a breathtaking rise in leverage. The only recent comparisons were the prior two peaks in stocks, though it was getting more and more challenging to have much confidence in the signal.
With the persistent decline in markets, leverage has plunged; margin debt is down more than 25% year-over-year. That kind of de-leveraging was about all it took near the ends of bear markets in 1970, 1987, and 2008, but it was early in the bears in 1974 and 2001.
When we look at times after debt rose at least 25% year-over-year and then dropped at least 25%, returns in the S&P 500 weren't great. As noted above, it preceded excellent long-term results a few times and twice quite the opposite.
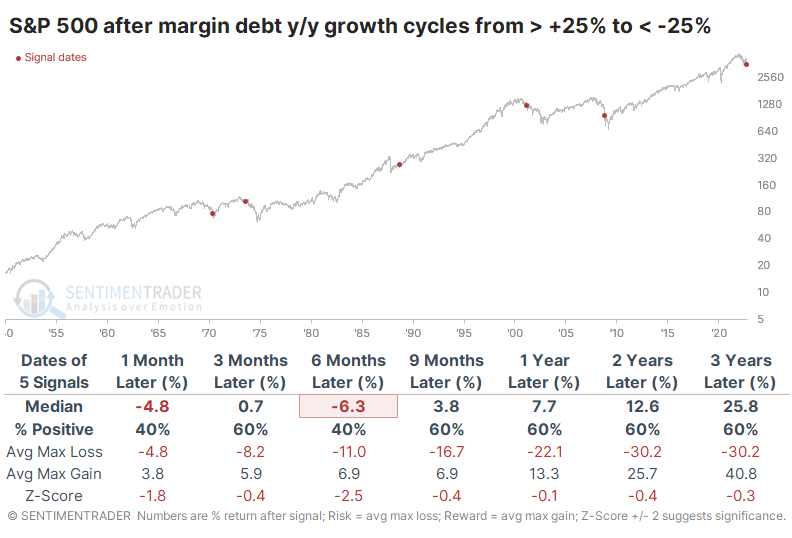
Investors have been pulling back on leverage more than the decline in stocks would excuse. Debt has been falling at about a 10% greater pace than the S&P, which is low but not to prior extremes.
After de-leveraging, some nascent reversal signs
Dean noted that the world's most-watched benchmark reversed from a 21-day low (close) to a 21-day high (close) in fewer than ten sessions, triggering a bullish price-based pattern.
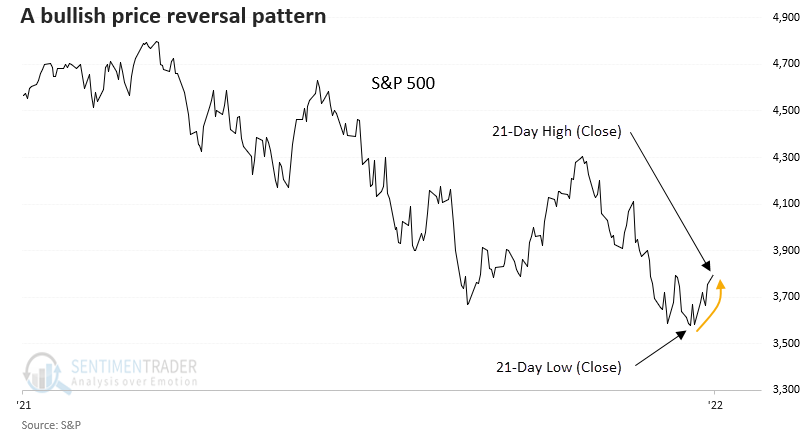
A swift reversal from a 21-day low (close) to a 21-day high (close) typically leads to more upside momentum, especially in the near term. After the initial bounce in the first month, the S&P 500 tends to consolidate the gains before heading higher.
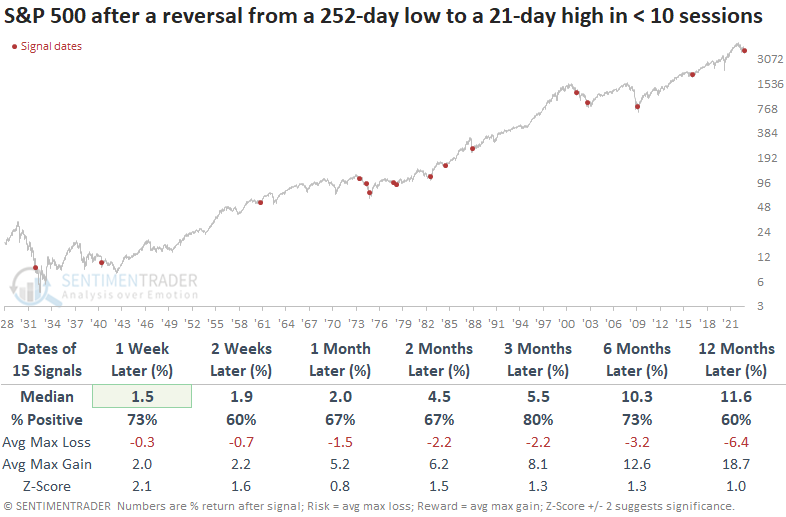
When the reversal initiated from a 252-day low (close) to a 21-day high (close) in fewer than ten sessions, returns and win rates still look impressive. A signal occurred after significant bottoms in 1974, 1982, 2002, and 2009. However, the pattern was also susceptible to a whipsaw alert in some of those same drawdown phases.
Reversals are spreading to industries
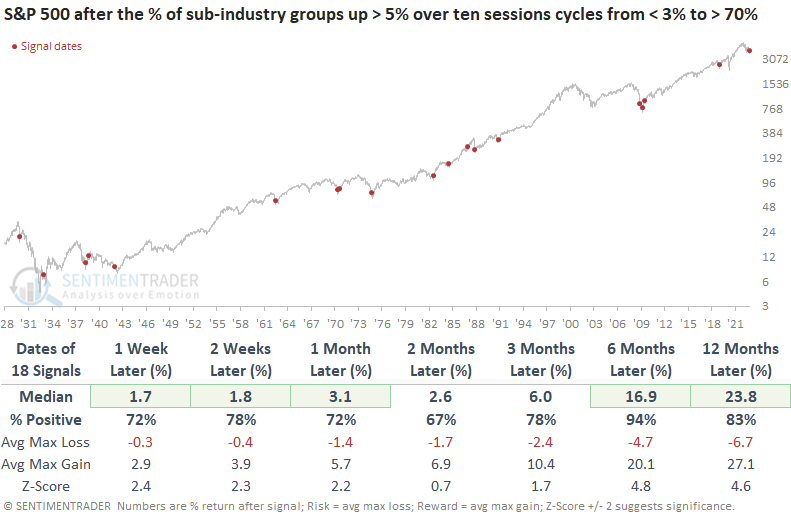
Stocks, excluding some mega-cap technology/communication sector members, have responded to the oversold condition by swiftly reversing higher. Dean showed that on Wednesday, the percentage of Sub-Industry groups up > 5% over 10 sessions cycled from < 3% to > 70%. The reversal occurred in only five sessions.
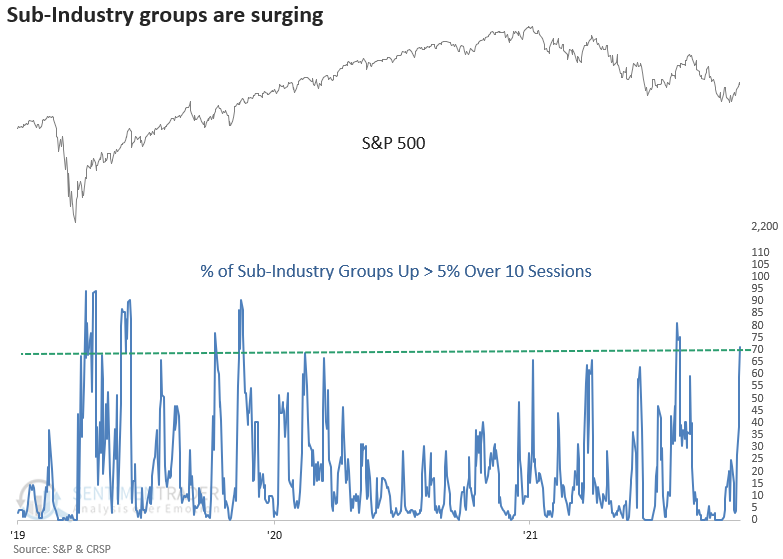
When Sub-Industry groups thrust higher in a brief period, the momentum typically leads to more upside momentum. The signal marked several significant bottoms since 1962, with 2008 being an exception.
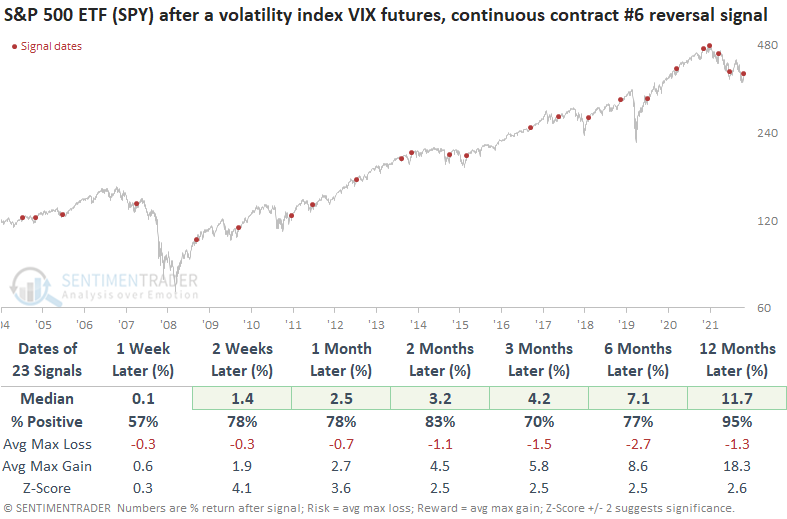
The reversal in stocks from the October low has driven volatility lower, which is typically the case after a drawdown phase. A trading model that uses VIX futures to identify when volatility cycles from high to low relative to its recent range issued a buy signal at the close of trading on Wednesday.
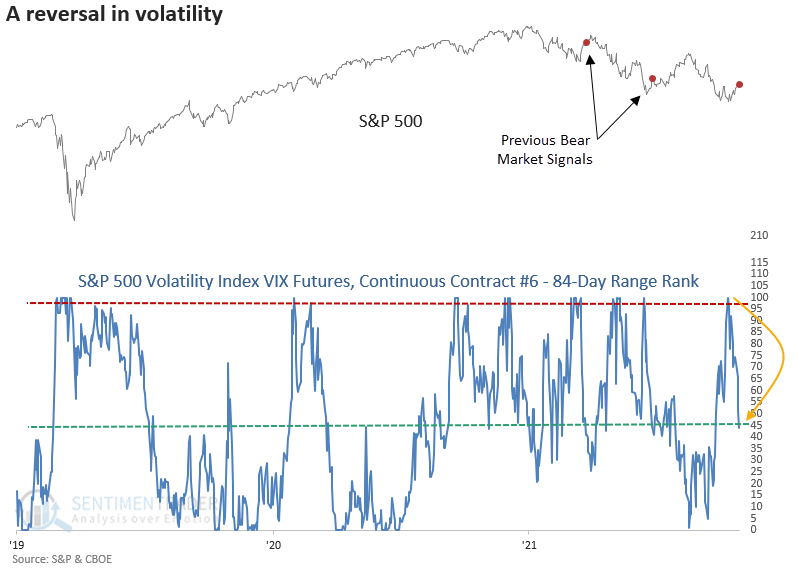
With the VIX futures index data starting in 2005, the range rank signal has benefited chiefly from bull markets. While the sample size is small, the bear market alerts all show a gain at some point in the first two months. In the case of the March 2022 instance, the profit lasted only a short time.
Reversals have been plentiful in individual stocks, too
This week, the S&P 500 enjoyed yet another big gain. It was its 6th daily gain of 1% or more since the bottom on October 12.
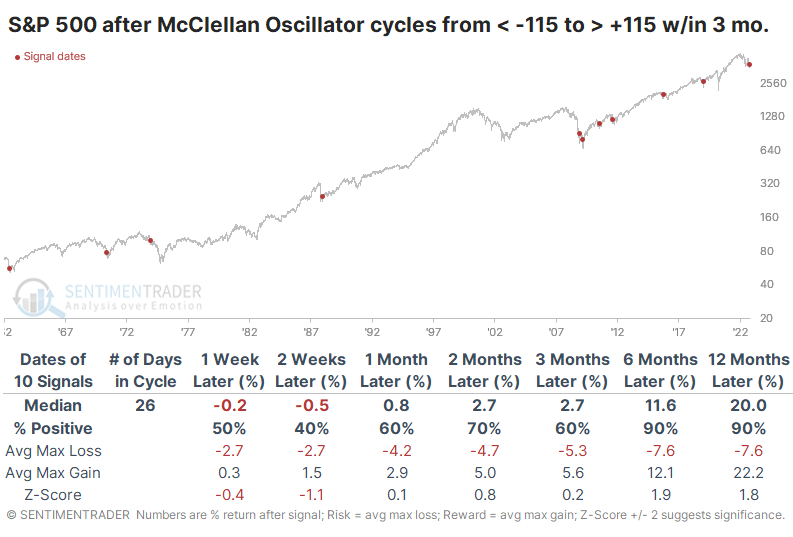
More impressively than the price gains, the spurt from the low has been accompanied by a good amount of advancing stocks relative to declining ones. That surge in momentum pushed the McClellan Oscillator for the S&P to one of its highest levels in decades.
If we look at the past 60 years, this is one of fewer than a dozen times when the Oscillator cycled from below -115 to above +115 in less than three months. Only 1974 proved to be a false signal of long-term gains.
The short-term internal buying interest has been enough to push the S&P's long-term McClellan Summation Index back above -1000 for the first time in a couple of weeks. The nascent recovery comes after the long-term internal momentum indicator cycled from above +1000 to below -1000. In recent years, this only happened in 2011 and 2020.
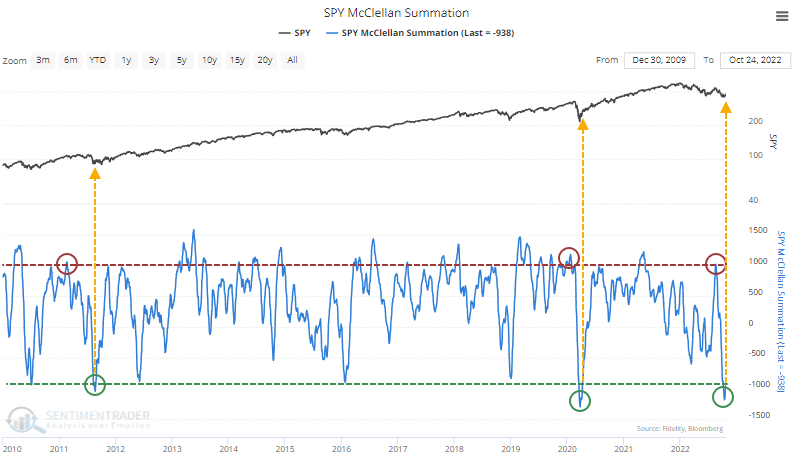
Historically, a push above +1000 has indicated significant buying interest, and when it subsequently drops below -1000, the market is oversold. Watching it move back above -1000 has generally meant the worst of the selling was over. Since 1962, there was essentially only one failure over a medium- to long-term time frame, in 1973.
Another potential short-term boost - seasonality
A month ago, we looked at the upcoming positive seasonality for stocks. Now, let's get a little more granular, as a short-term positive window is also opening.
Jay examined the 5-trading day period that extends from the close of the 3rd to the last trading day of October through the close on the 3rd trading day of November.
The chart below displays the cumulative percentage growth for the S&P 500 Index (price only) every year during the five days described above, starting in 1949.
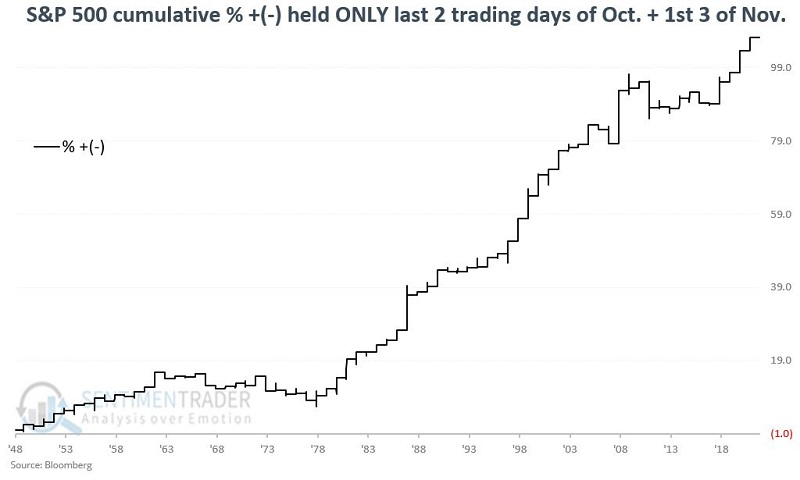
The index showed a gain 55 times versus 18 losses. Its average, median, and maximum gains during the good years far outweighed its losses during the bad ones.
This period has witnessed an S&P 500 Index gain during 3 out of every four years. The median winning period was +1.80% versus a median losing period of minus -0.78% resulting in a median win/median loss ratio of 2.30-to-1. Also, note that this five-day trading period showed a gain of over +4% on eight occasions versus only one losing period above -4%.
Jay also showed that tech stocks are entering a short-term supercharged seasonal window within a longer-term positive seasonal bias.
The chart below displays the annual seasonal trend for the Technology Select Sector SPDR Fund (XLK), an ETF that tracks the S&P 500 Technology Select Sector Index.
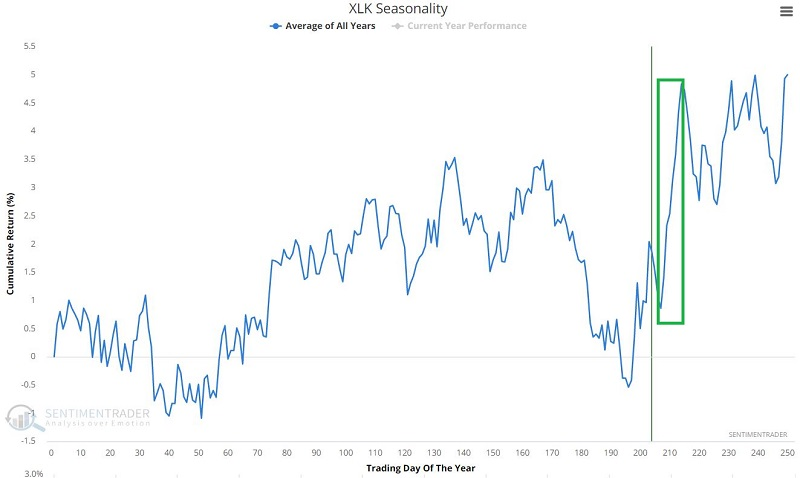
For 2022, this period will extend from the close today, October 27, through November 7.
During these short windows, tech stocks rallied during 47 out of 69 years. But the most impressive thing is the size of the gains during positive years relative to losses during negative years. There was a very positive skew to the returns.
The purest trade for this tendency is the Technology Select Sector SPDR Fund (XLK). Since its inception, the fund rallied 19 out of 23 times and sported much larger gains during positive years than losses during the few negative ones.
Another country's tech stocks have suffered horrid losses
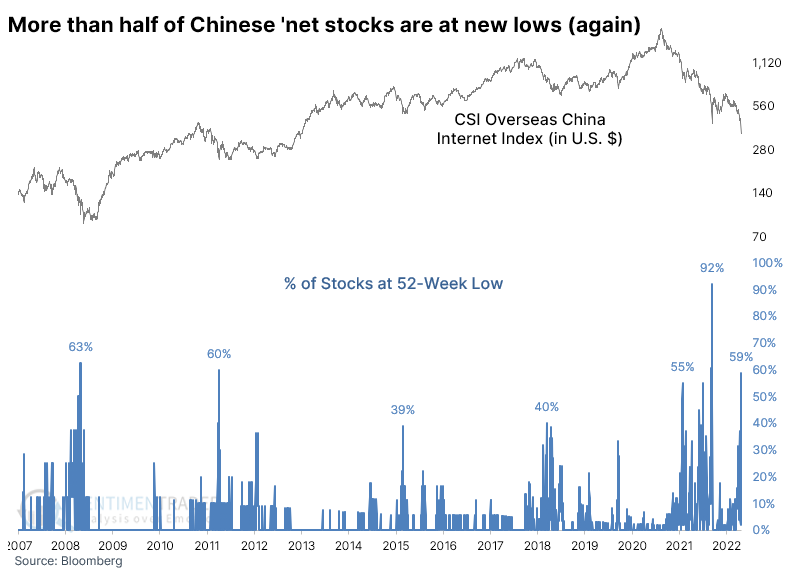
Chinese internet stocks have been ground zero for pessimism in 2022. After weekend developments, that pessimism morphed into hatred so intense that, once again, there were declarations of the sector being uninvestable.
The last time we heard that kind of talk was mid-March. In response, the stocks rallied more than 60% over the next few months. All the rebound gains have evaporated, and most of the stocks are trading at new lows. On Monday, nearly 60% of Chinese internet stocks hit a 52-week low, the 4th-highest reading in 15 years.
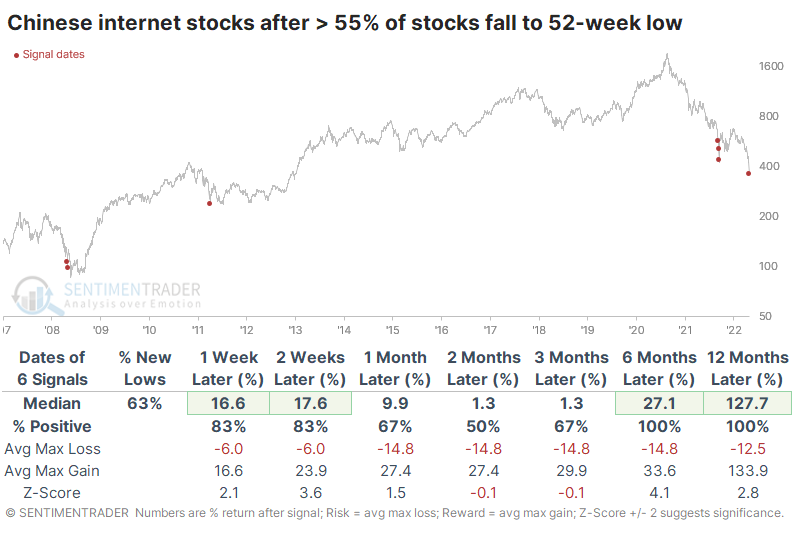
There have been six other days when more than 55% of the stocks fell to a new low on the same day. There were some hefty losses at some point after several of them, but all showed gains over the next six months.
One of the better representations of long-term underlying momentum in an index is the McClellan Summation Index. After the Summation Index dropped below -2375, the sector rebounded over the next month each time. It ended up being a terrible long-term signal in 2008 and the beginning of this year, while the three other signals rallied at least 20% within the next six months.
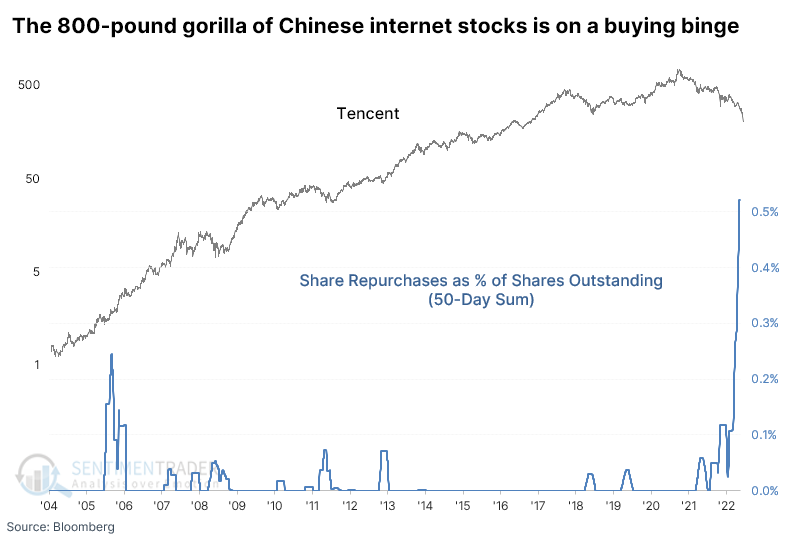
We've looked at Tencent before and its unblemished record of share repurchases. Their buyback programs for over a decade were almost impeccably timed, usually showing massive gains over the next 6-12 months. Over a 50-day span, the company bought back a record percentage of its outstanding shares, at least relative to its history as a public company.
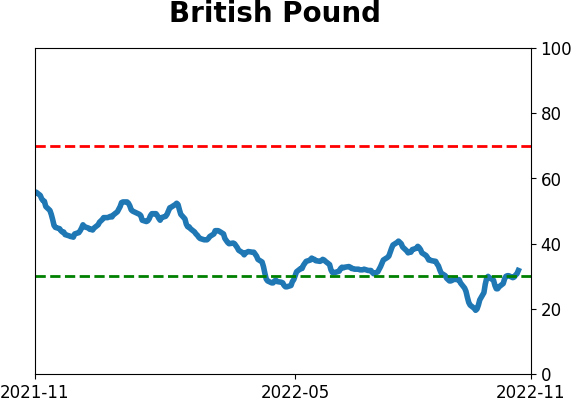
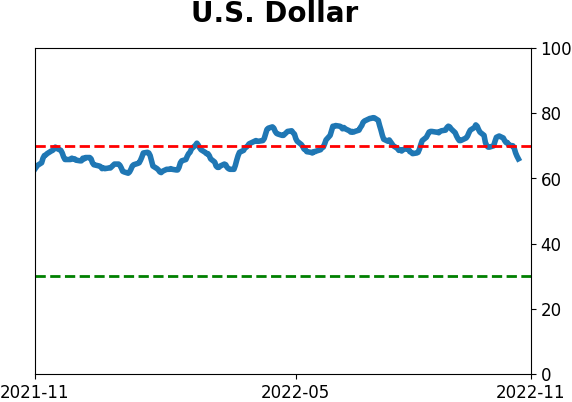
The dollar is starting to wobble
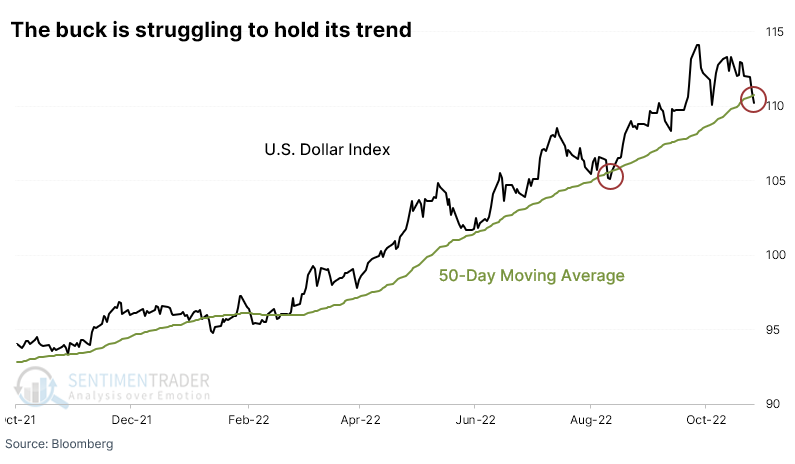
The U.S. dollar has been an increasing focus of investors who don't usually pay attention to it. A surge of media articles and earnings call excuses will always help zero in investors' attention.
After an incessant rise into October, the buck has started to oscillate and, for the first time in months, closed below its 50-day moving average. This is one of the first warning signs of a potential trend change for trend followers.
When the dollar had set a multi-year high within the past 30 days and then closed below its 50-day average for the first time in at least 50 days, it tended to keep moving lower.
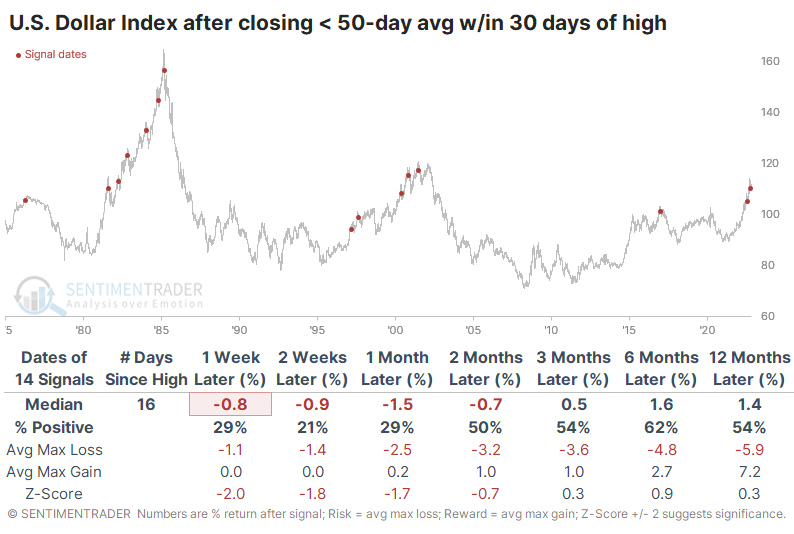
There were four times - including the last one in August - when the dollar managed to shrug off this tendency and trigger a second signal relatively soon, within about six months. Every time, the dollar lost ground up to two months later.
There is certainly room for more of an unwind. Large speculators in dollar futures hold nearly 60% of open interest net long, among the highest exposure they've ever had. And the Dollar Optimism Index 100-day average is now above 70% for only the 3rd time since we have data. The other times, early 1997 and late 2014, preceded a long slog for the buck.
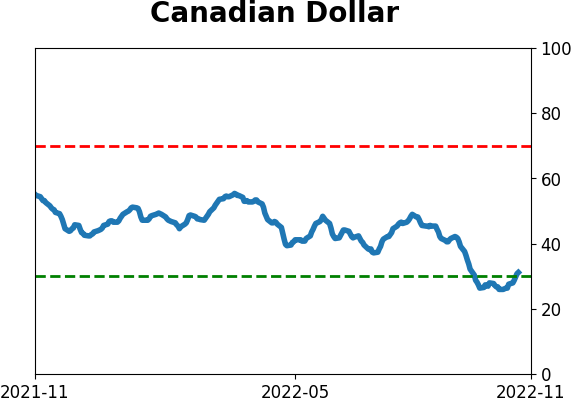
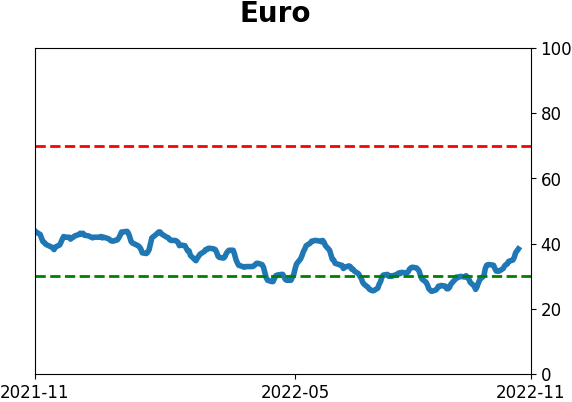
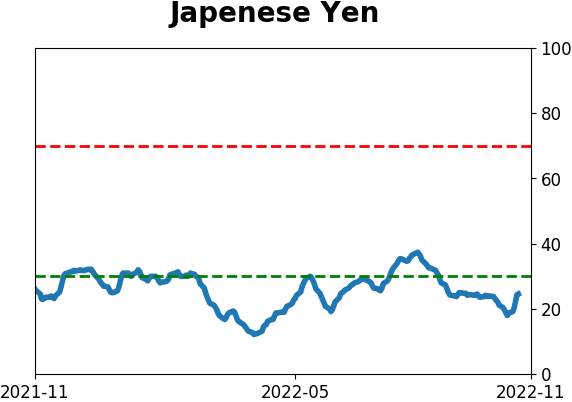
But...seasonality and options positions in some currencies are arguing against a dollar decline
Almost every currency has plunged against the U.S. dollar. Jay showed that seasonal tendencies and options bets suggest it could continue. It's especially acute in the euro and Canadian dollar.
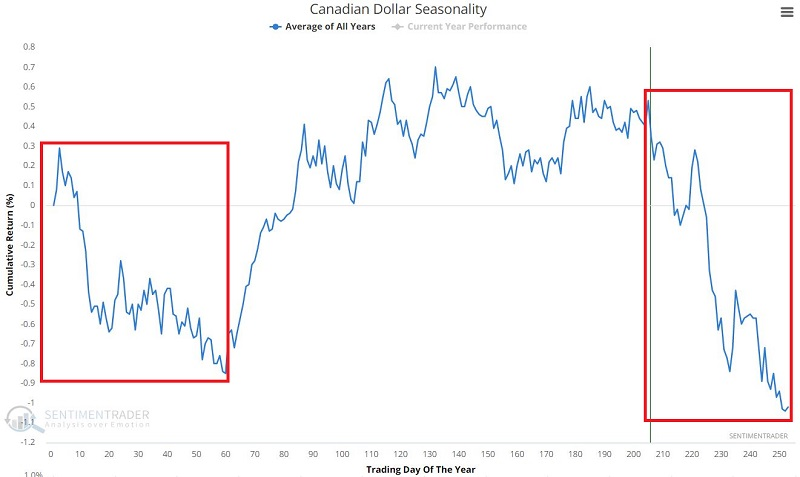
The chart below displays the annual seasonal trend for the Canadian Dollar. Note that this market has just entered an extended seasonal period of typically adverse results. This period extends from the close on Trading Day of the Year (TDY) #205 through TDY #60 of the following year.
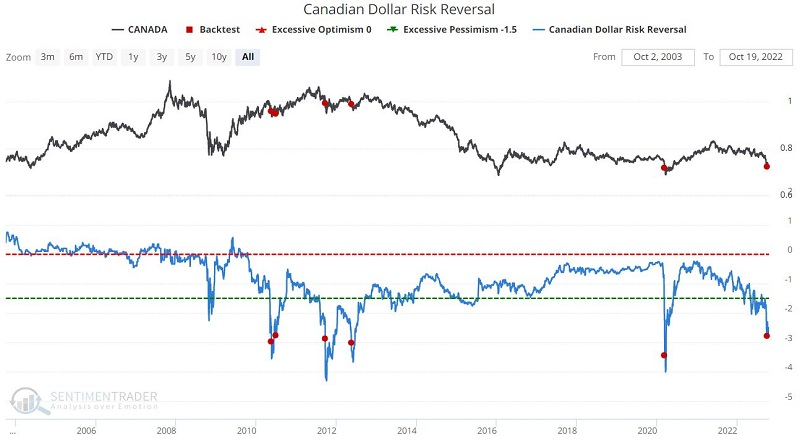
The Canadian Dollar risk reversal indicator shows how much more expensive Canadian Dollar put options are relative to call options. Extreme readings can be noteworthy for both the currency and Canadian stocks (more in a moment).
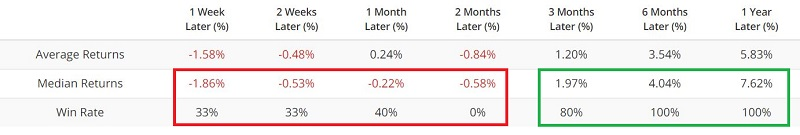
The chart below displays rare occasions when the Canadian Dollar risk reversal crossed below -2.75. The latest signal occurred on September 30.
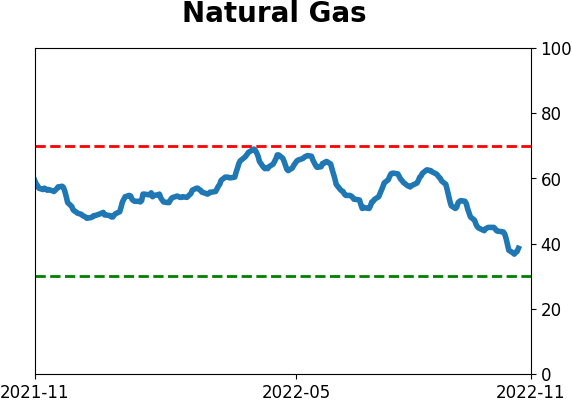
Natural gas is oversold, but still has a seasonal headwind
Conventional wisdom suggests a reflex rally of some sort is due in natural gas. Still, Jay noted that the next significant bearish seasonal period began at the close of October 24 and will extend into late February 2023.
The chart below displays the cumulative $ +(-) for holding a long position in natural gas futures only from TDY #210 through TDY #41 the following year.
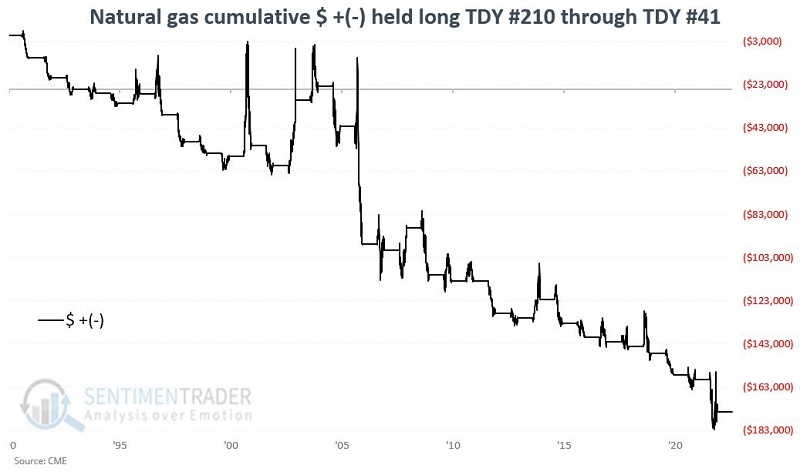
During these seasonal windows, natural gas declined during a whopping 26 out of 32 years.
The ProShares UltraShort Bloomberg Natural Gas ETF (KOLD) is designed to track two times the inverse daily performance for natural gas futures. Make no mistake about the highly volatile and risky nature of investing in this ETF!
About TradingEdge Weekly...
The goal of TradingEdge Weekly is to summarize some of the research published to SentimenTrader over the past week. Sometimes there is a lot to digest and this summary is meant to highlight the highest conviction or most compelling ideas we discussed. This is NOT the full research that's published, rather it pulls out some of the most relevant parts. It includes links to the published research for convenience; if you don't subscribe to those products it will present the options for access.
Indicators at Extremes
|
|
|
Phase Table
|
|
|
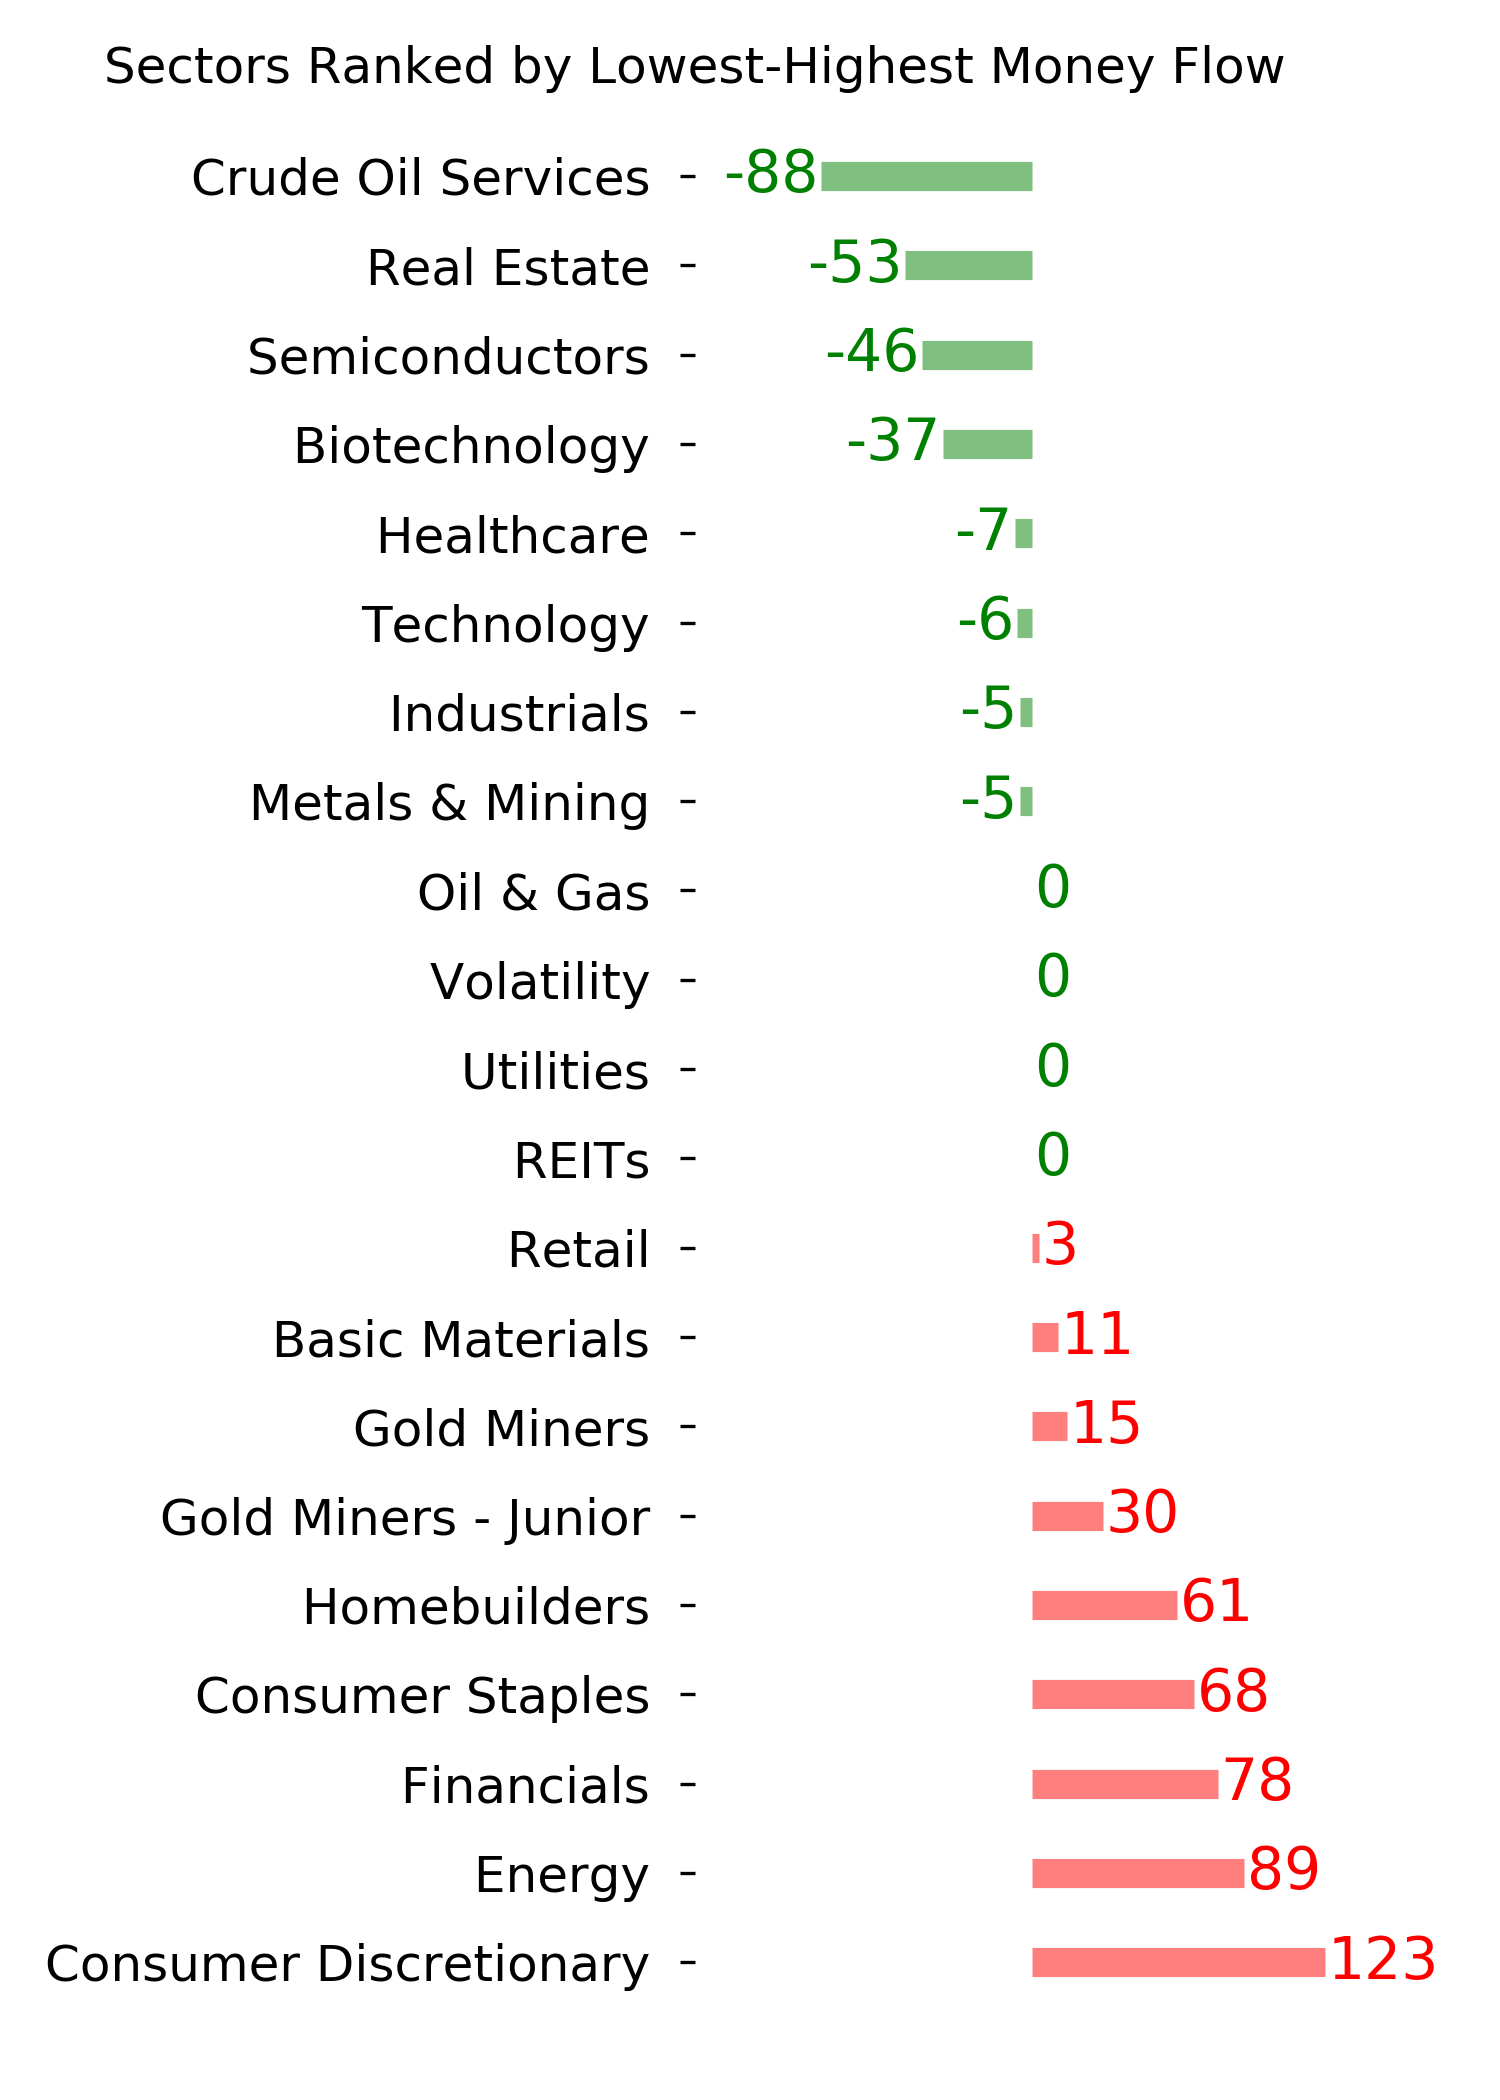
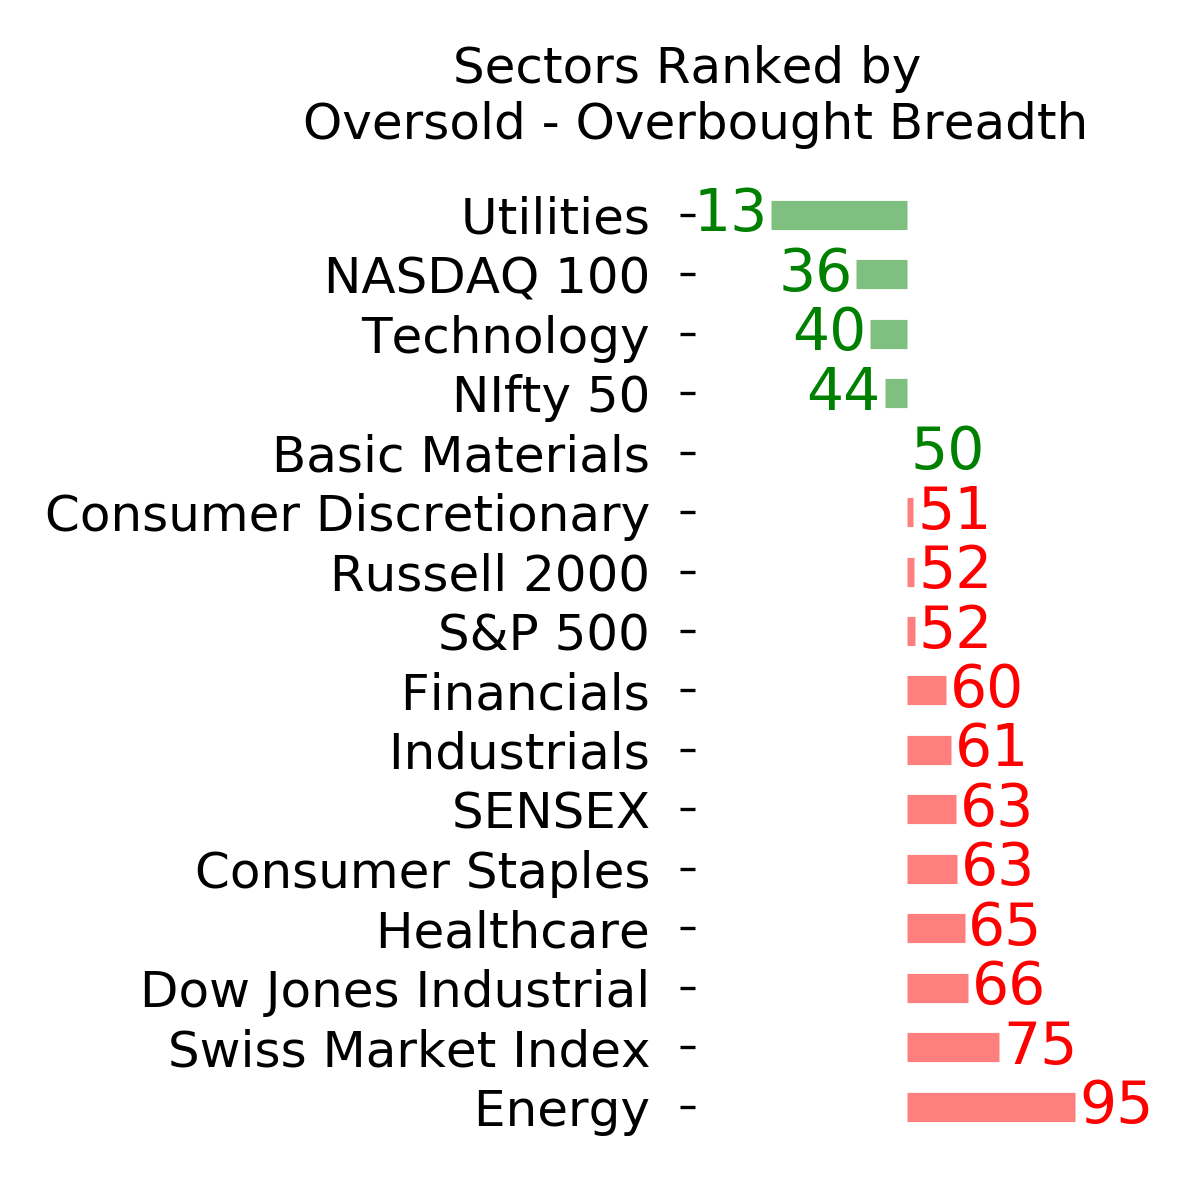
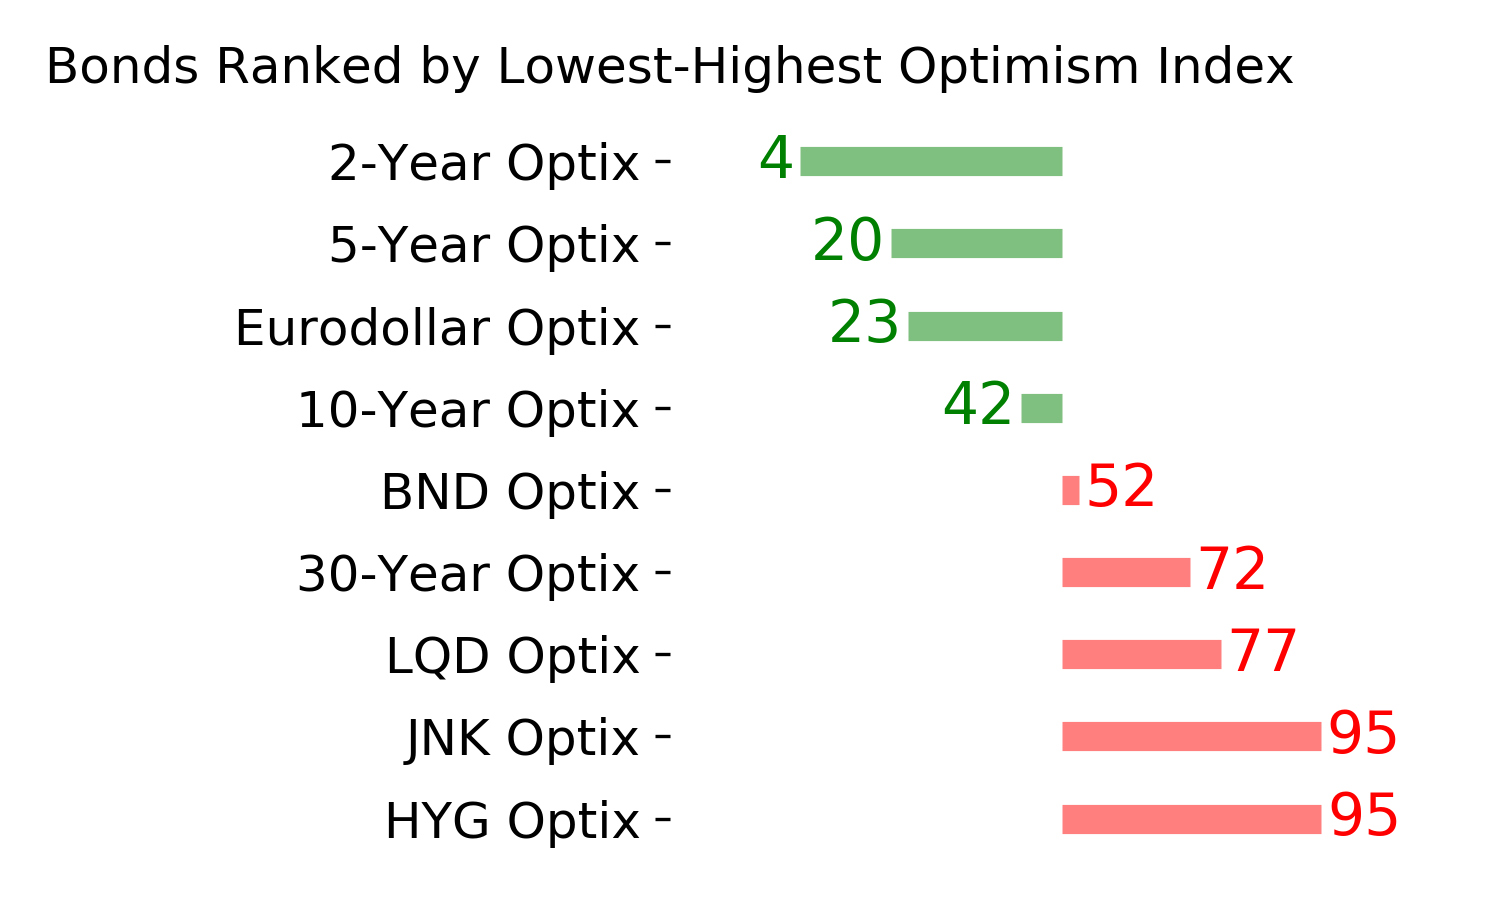
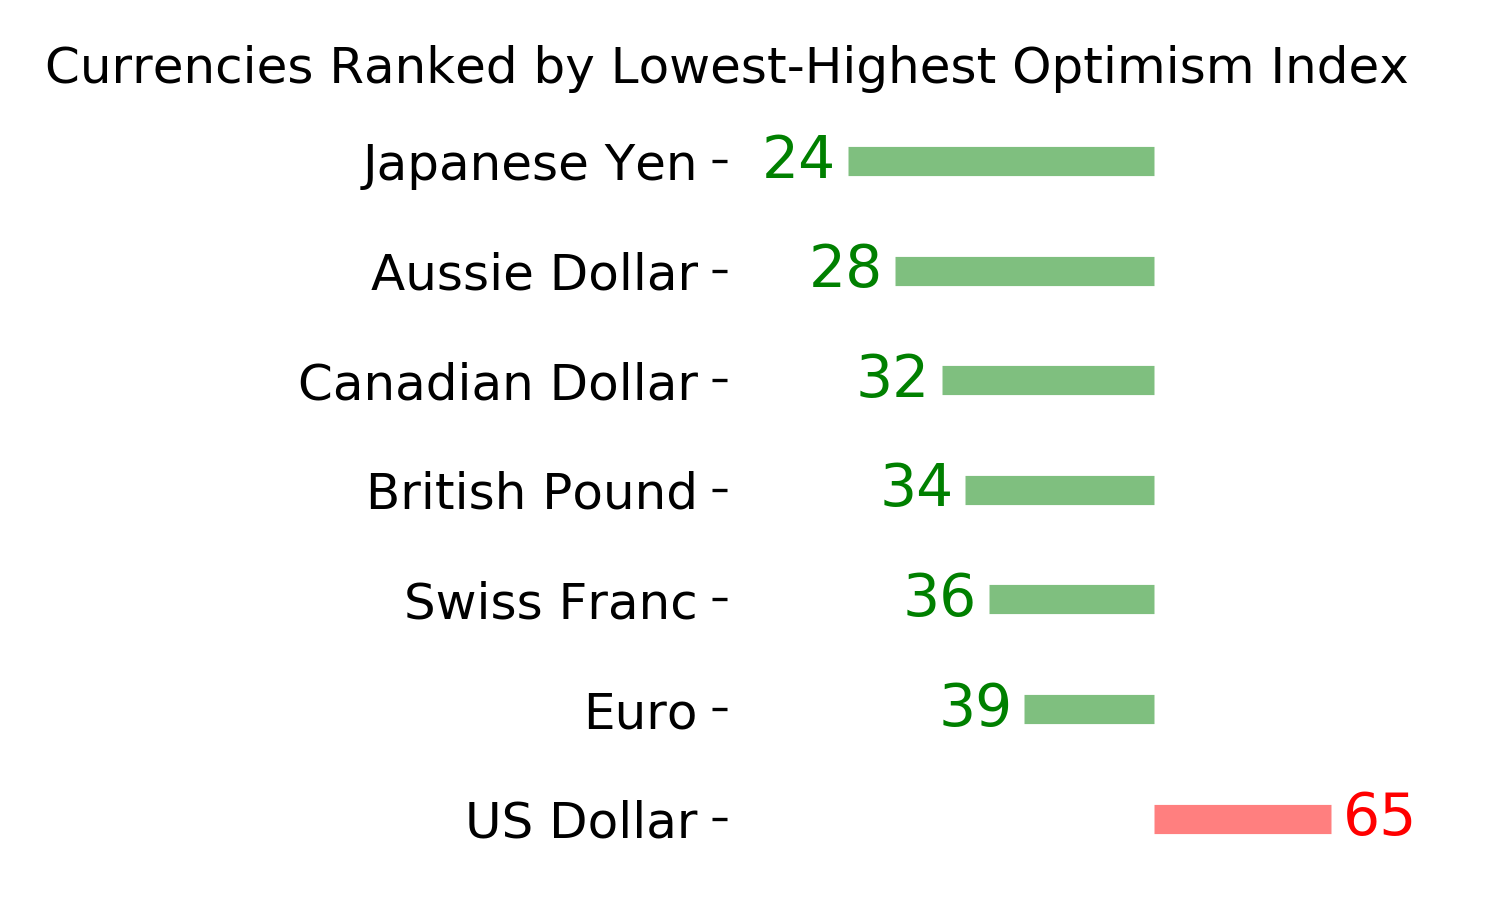
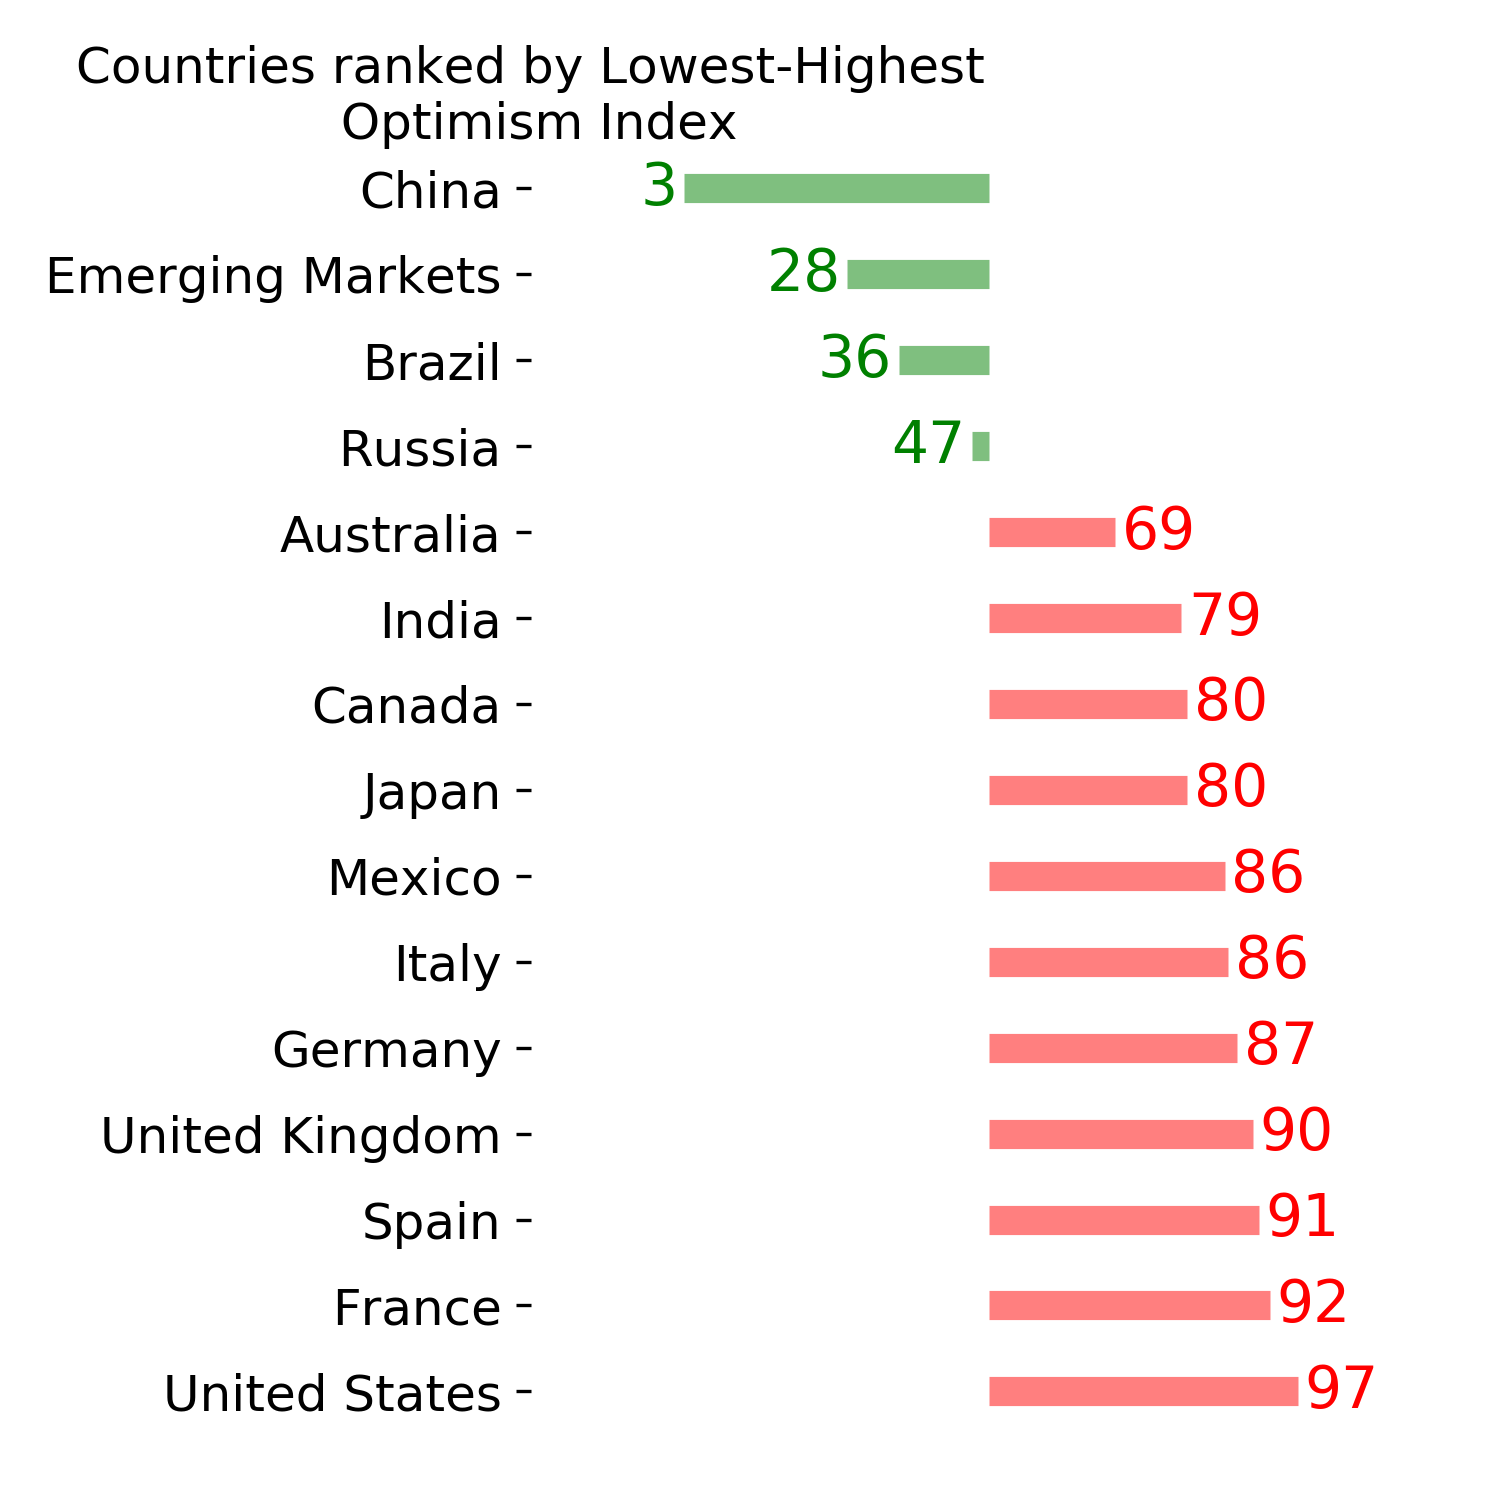
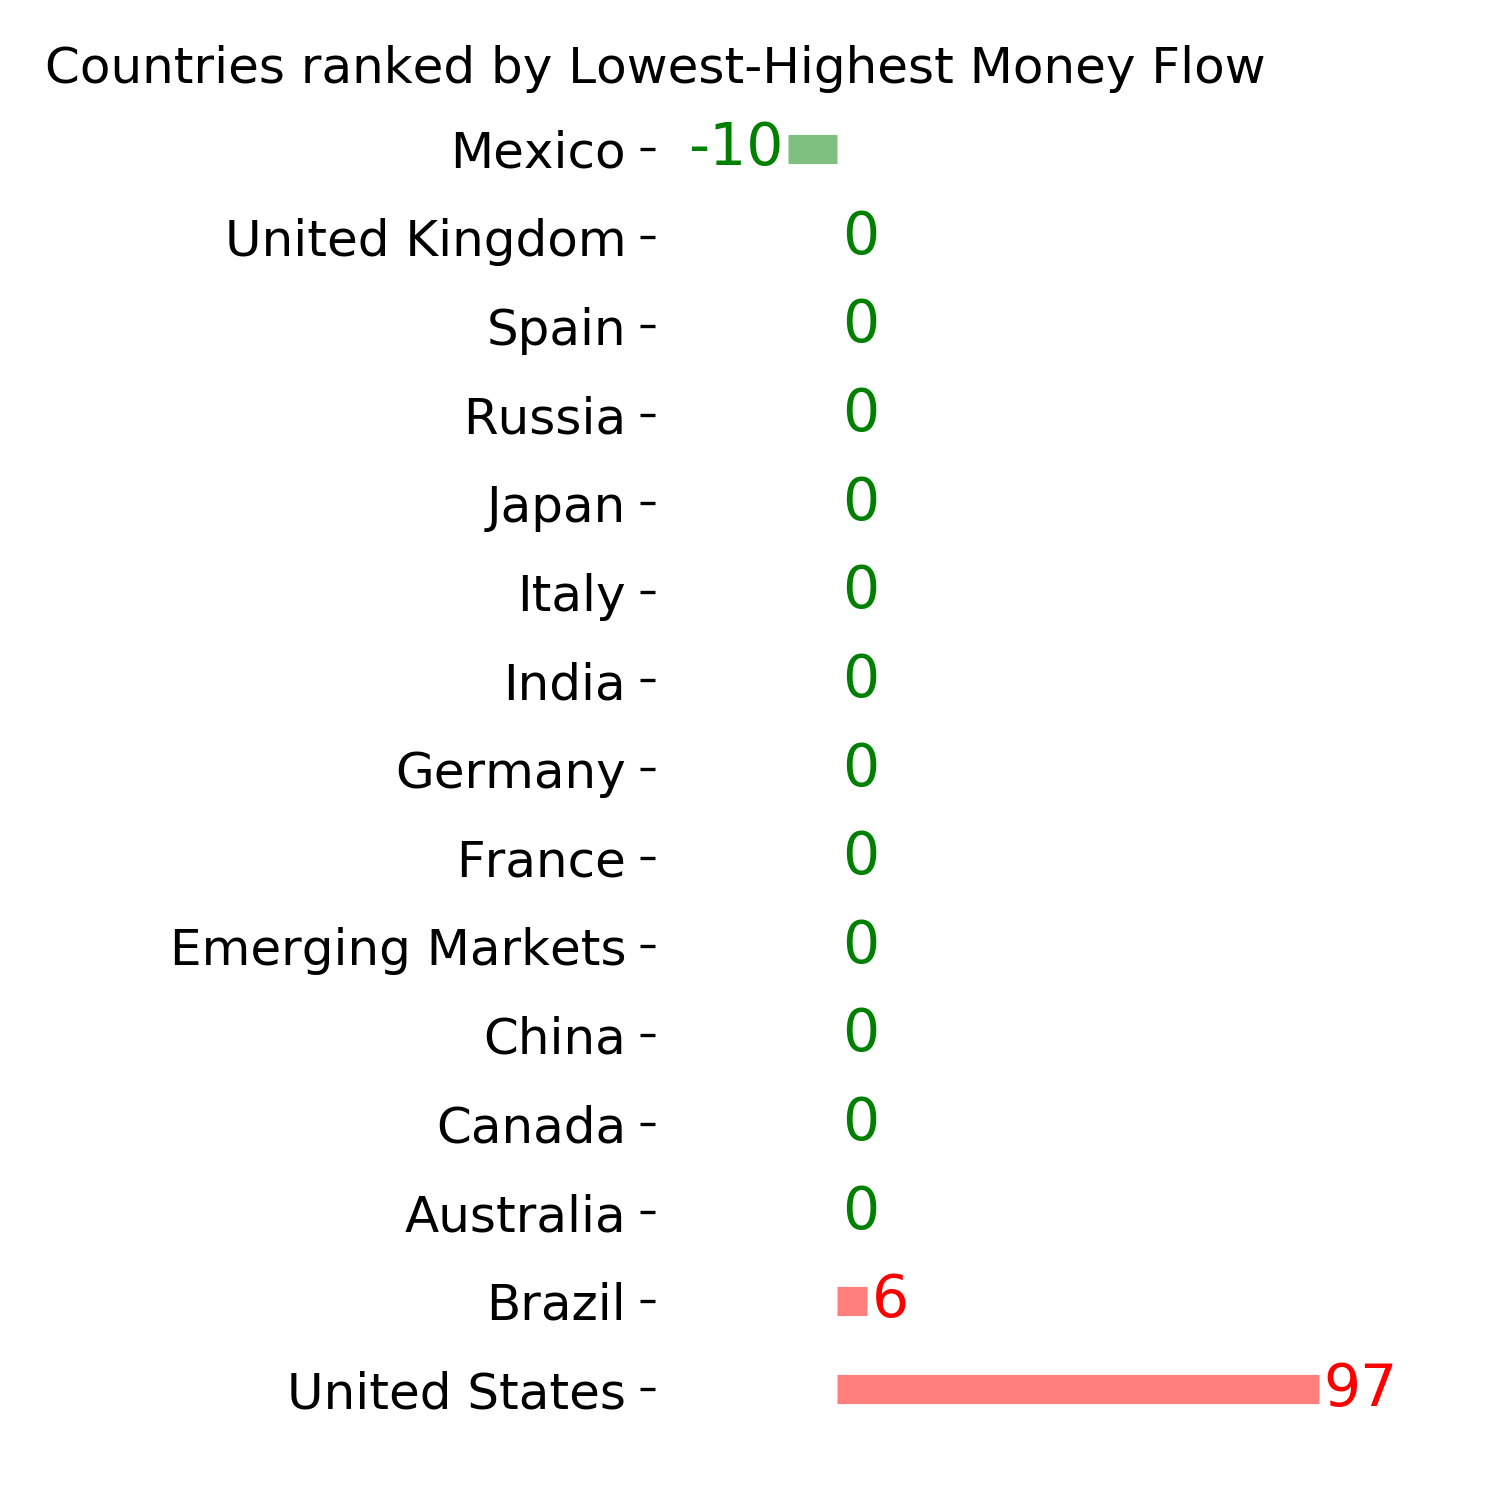
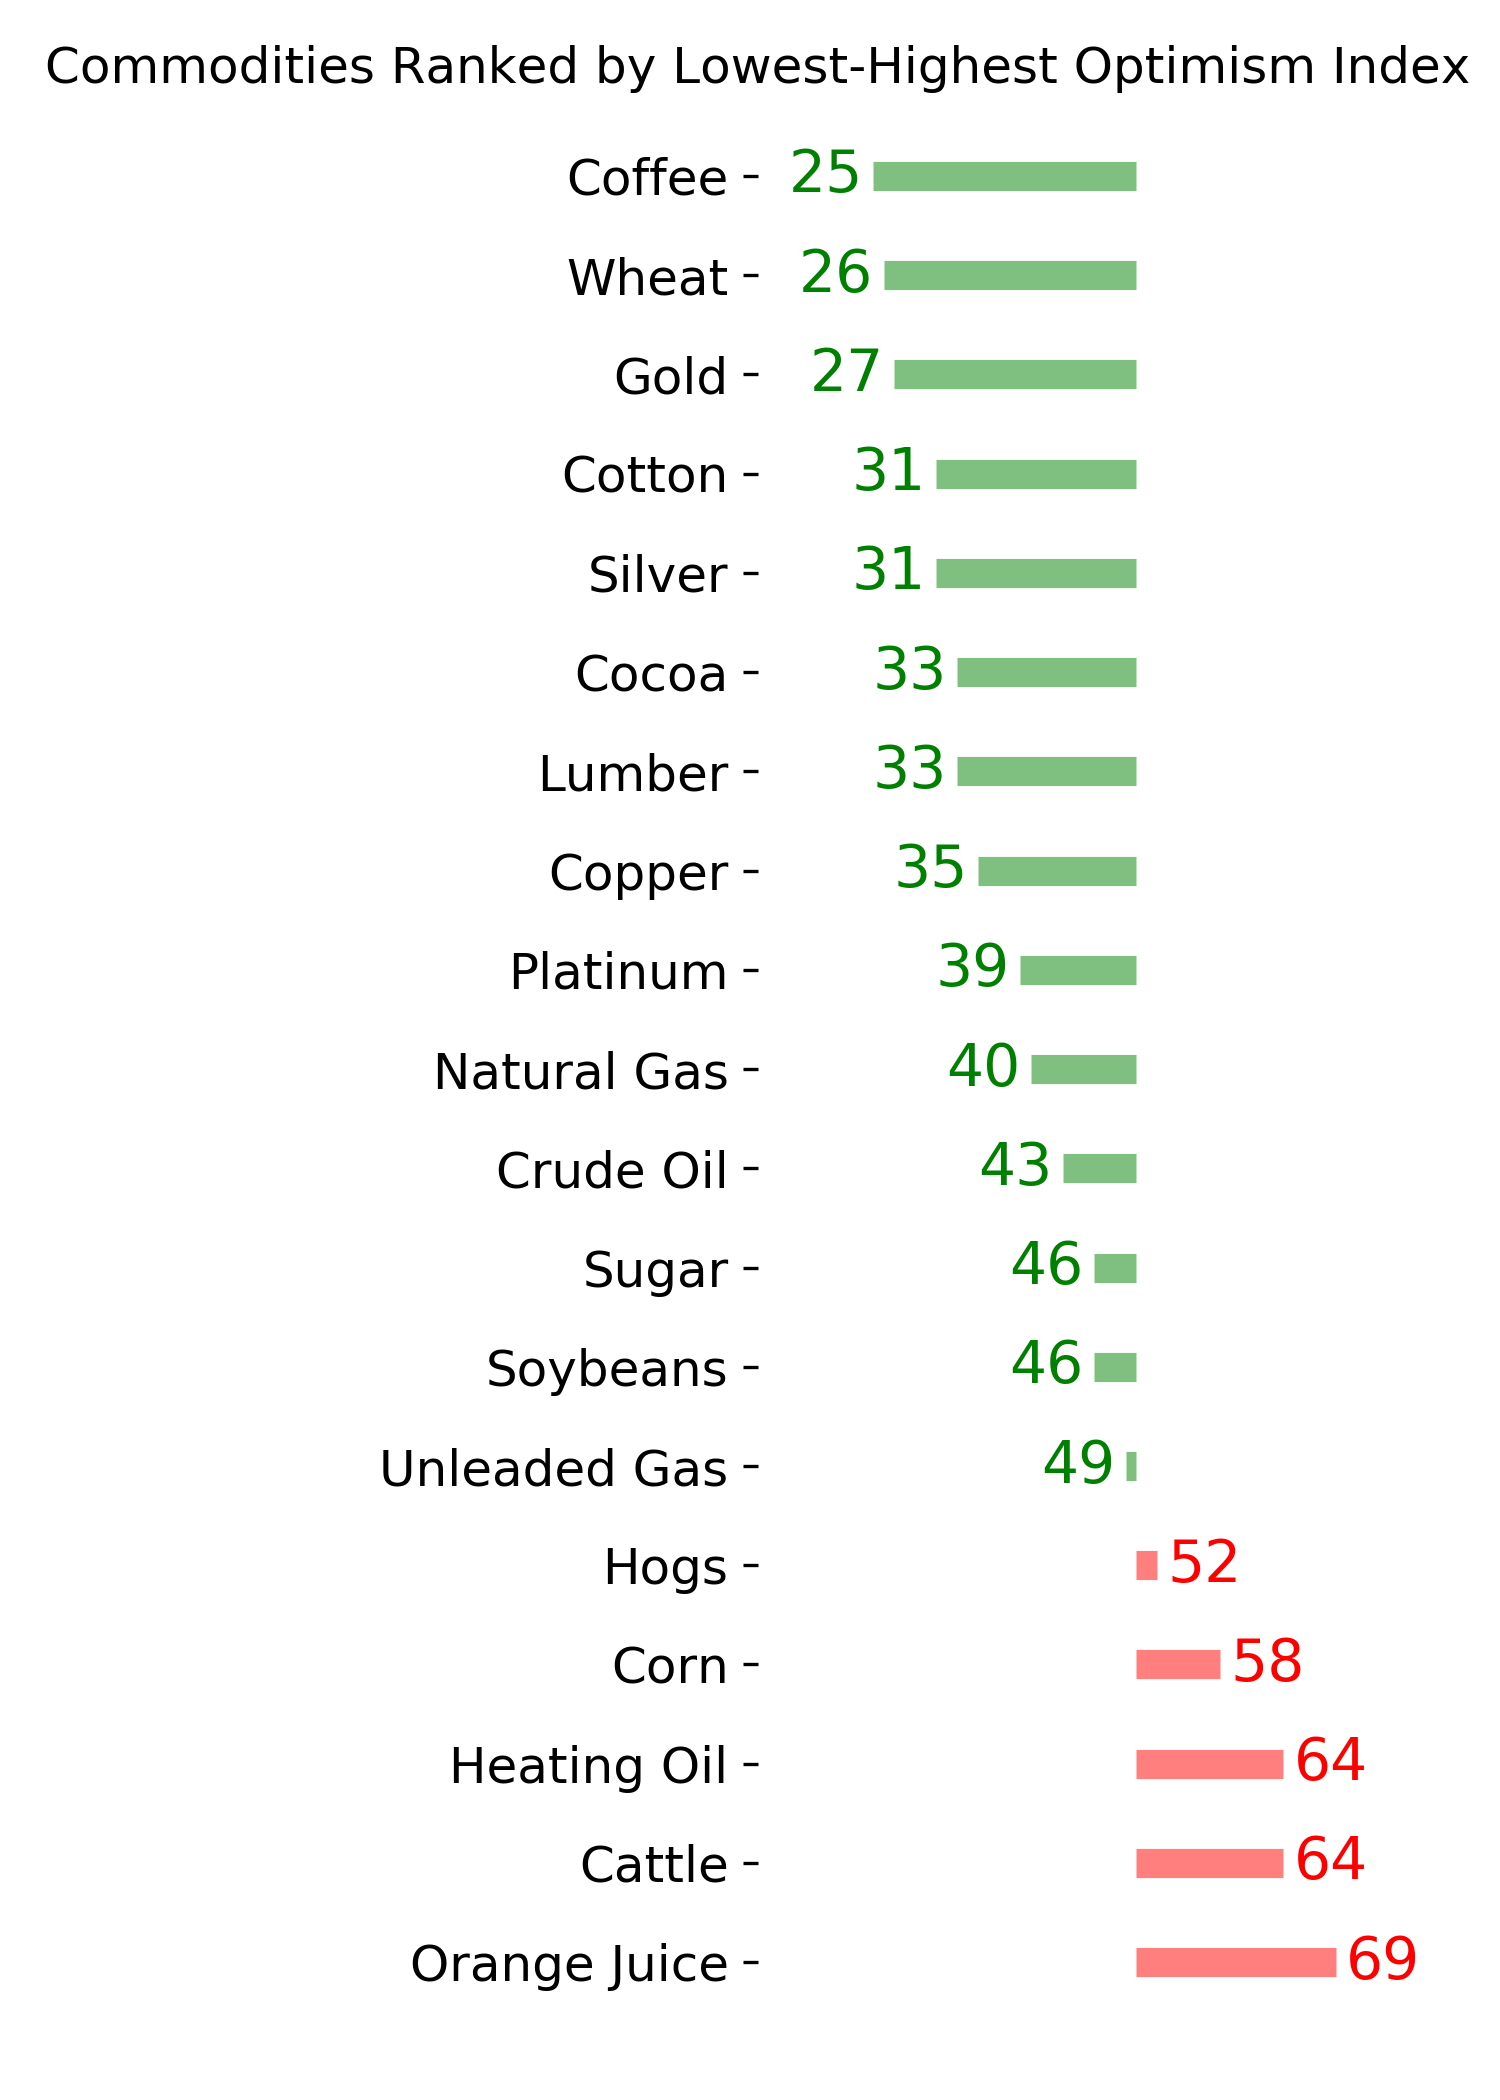
Ranks
|
|
|
|
|
|
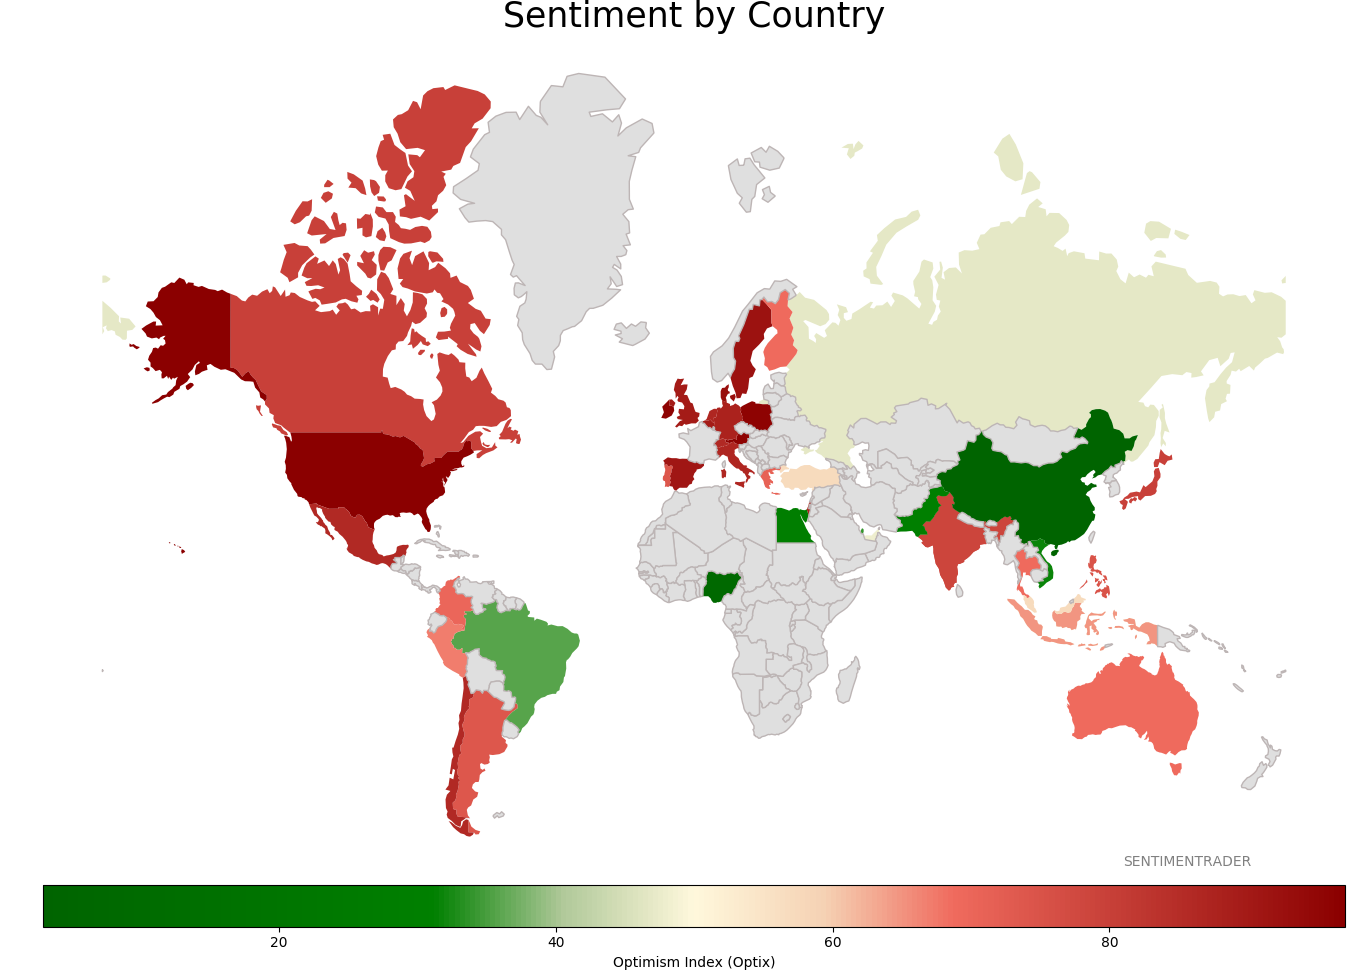
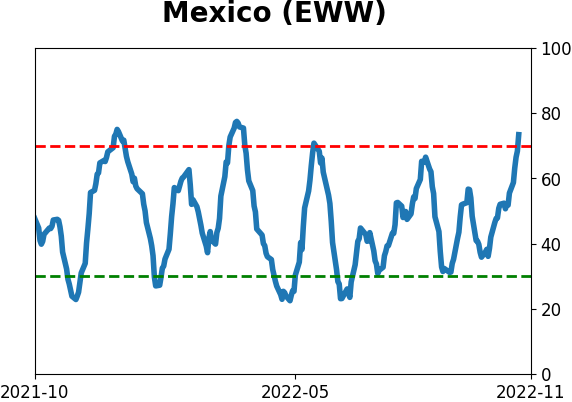
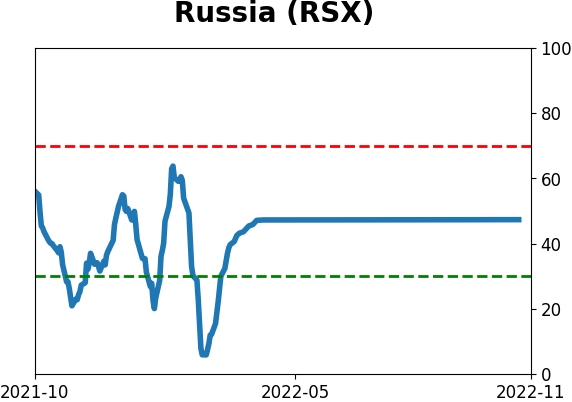
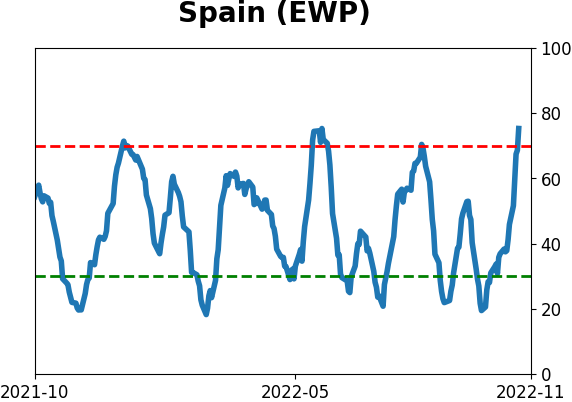
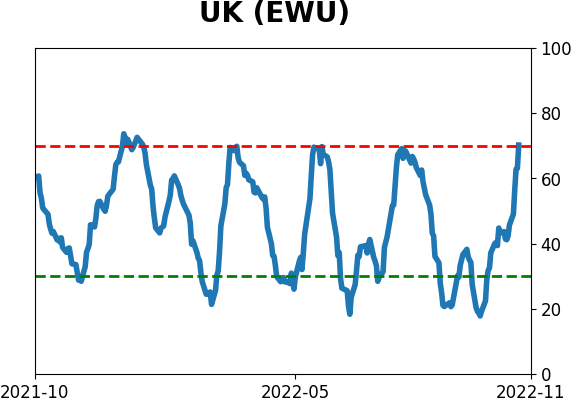
Sentiment Around The World
|
|
|
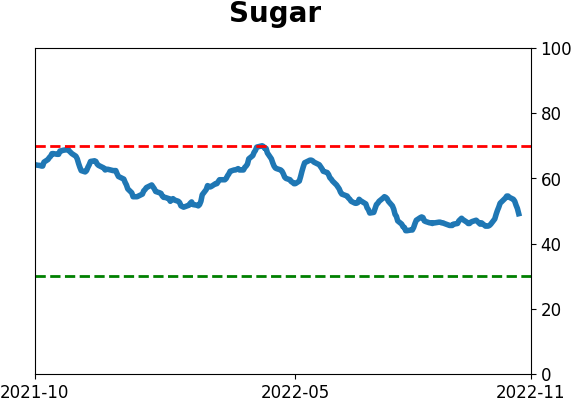
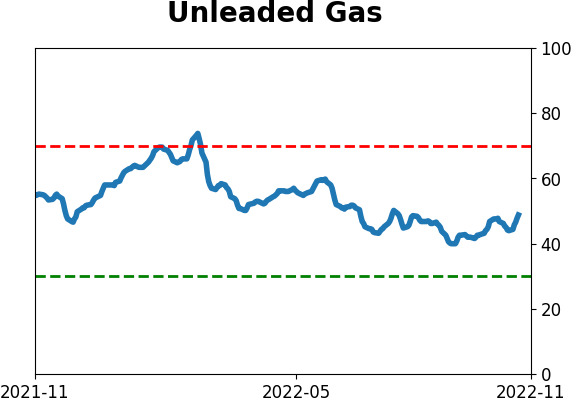
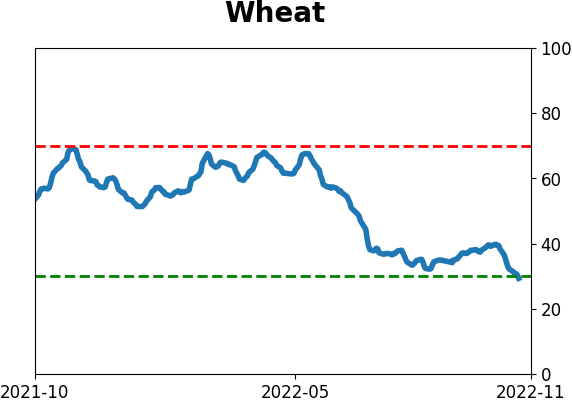
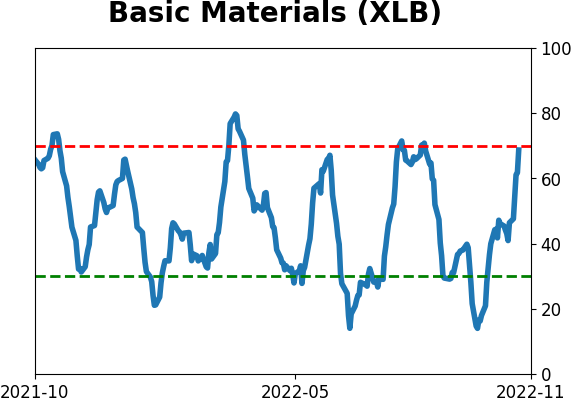
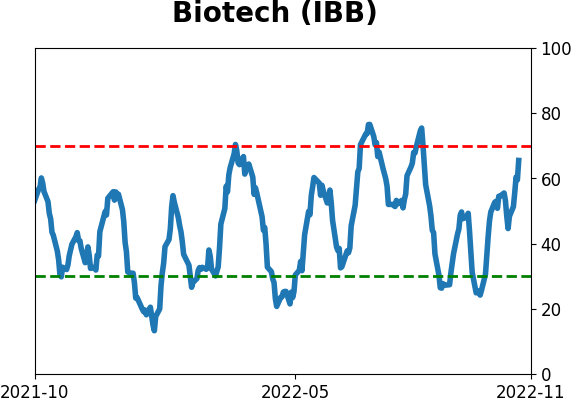
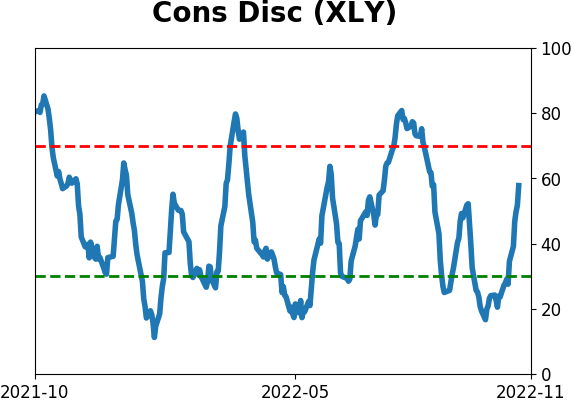
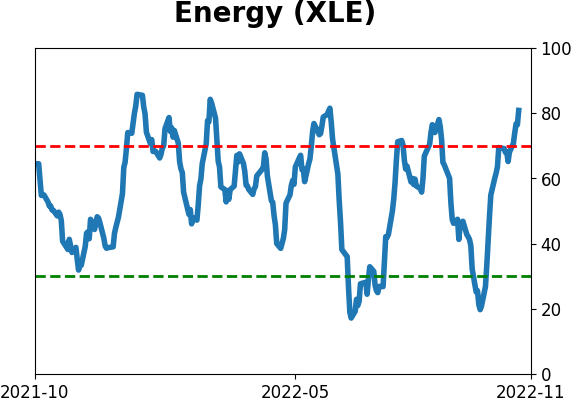
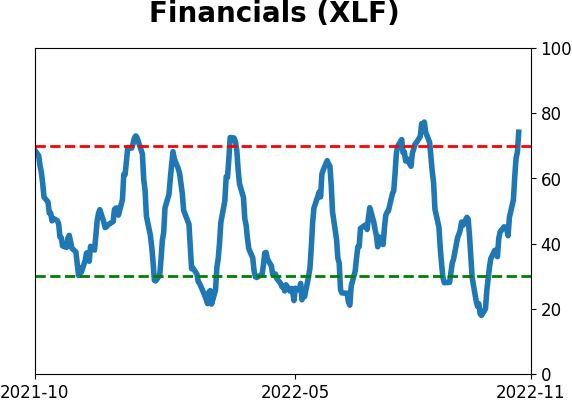
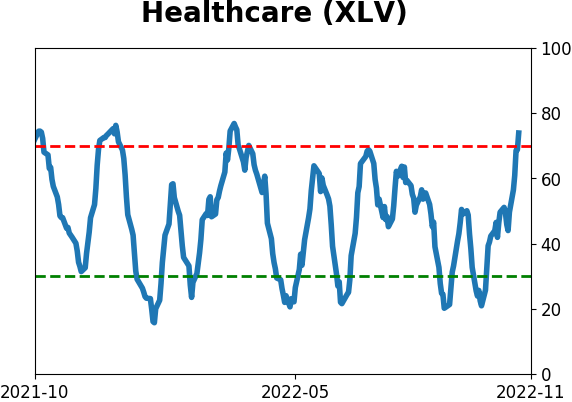
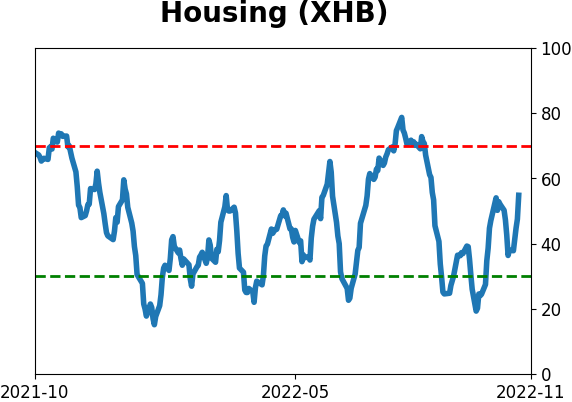
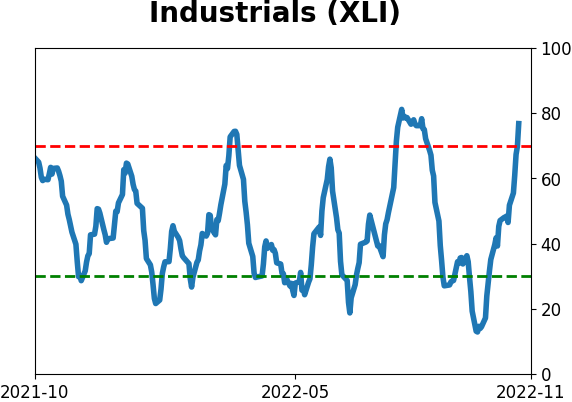
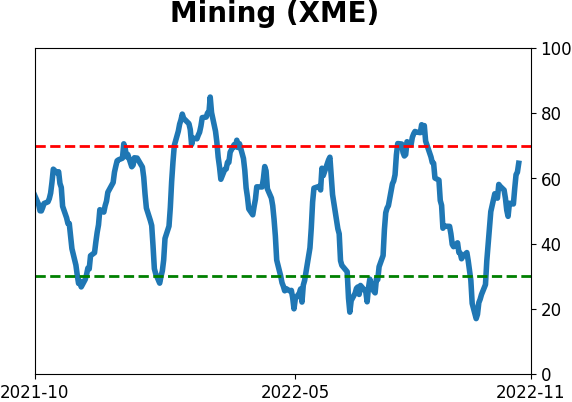
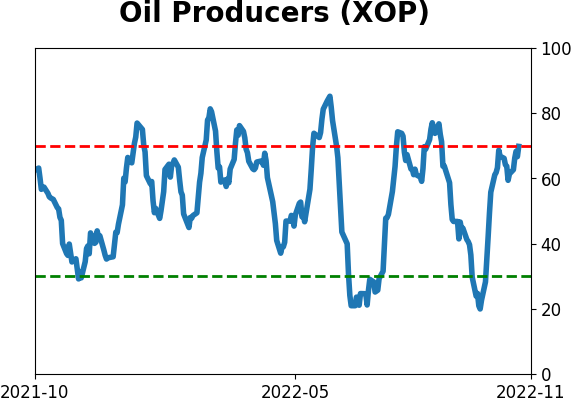
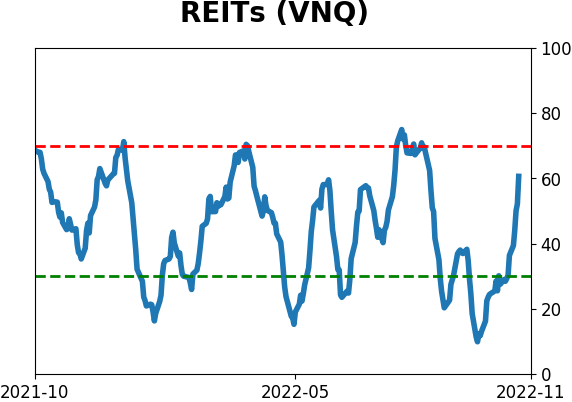
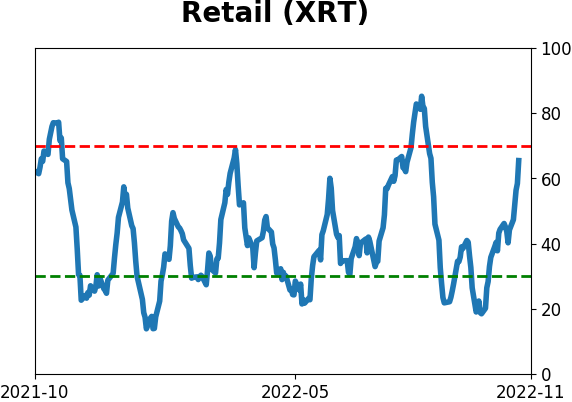
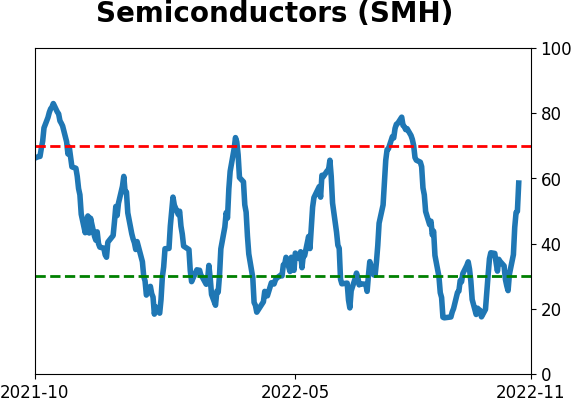
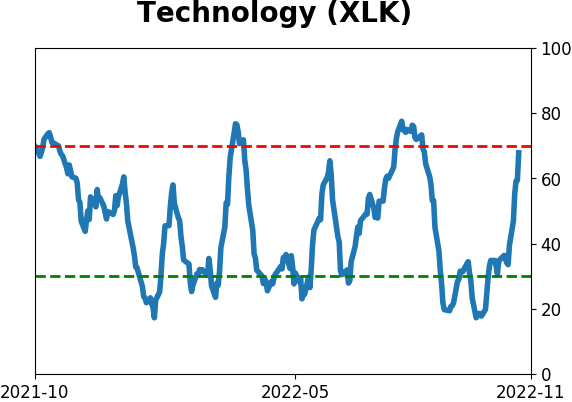
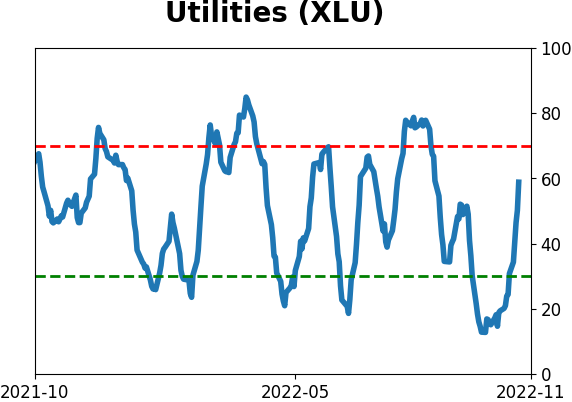
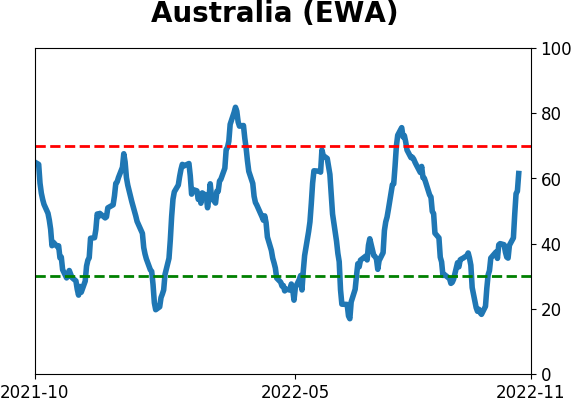
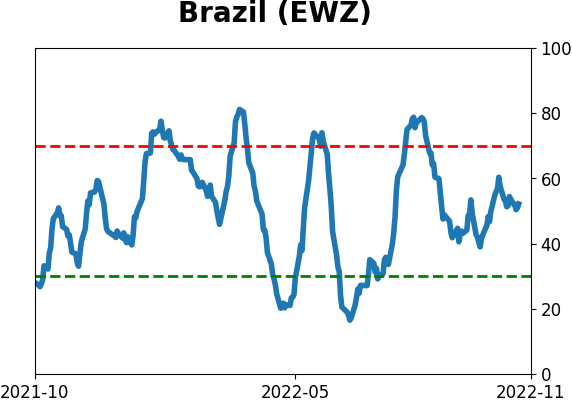
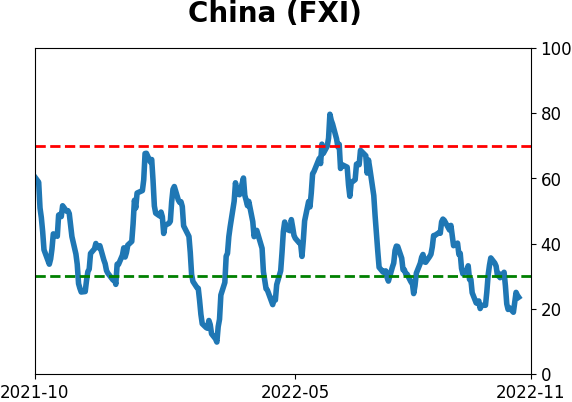
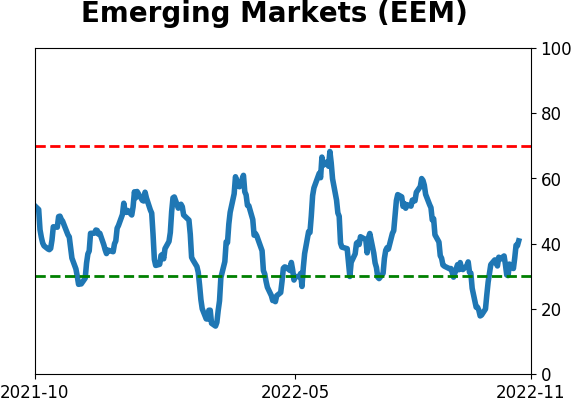
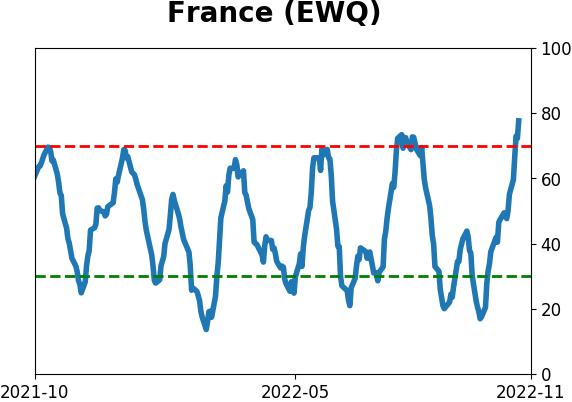
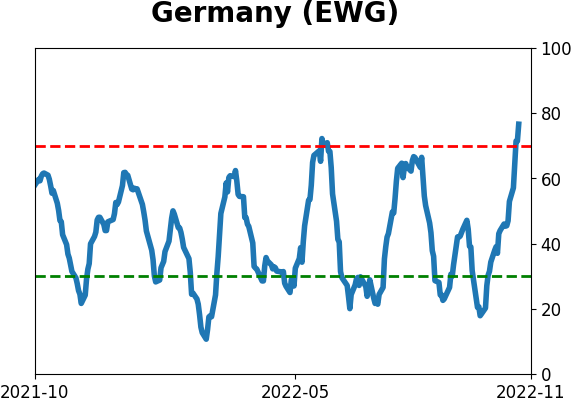
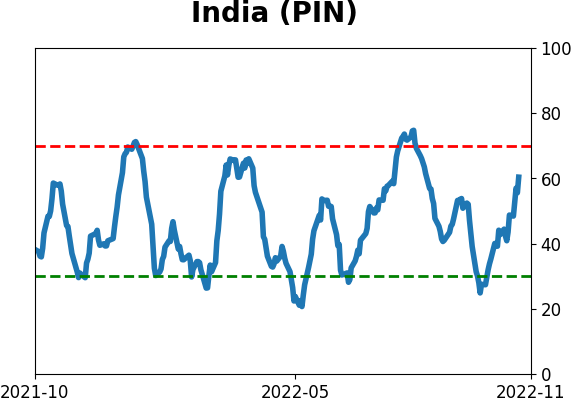
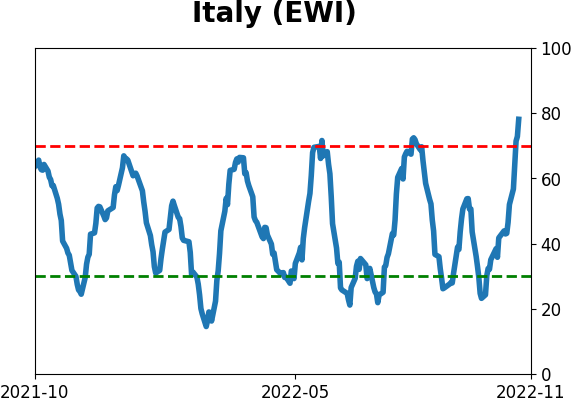
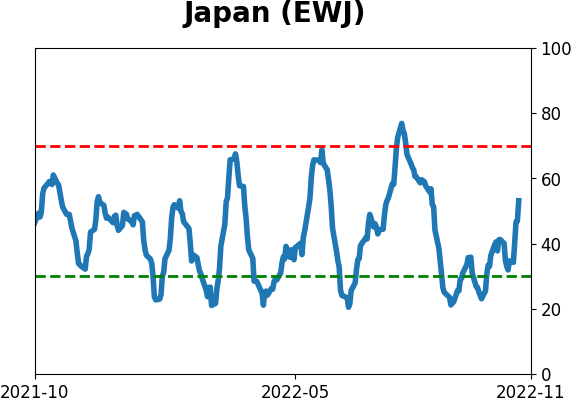
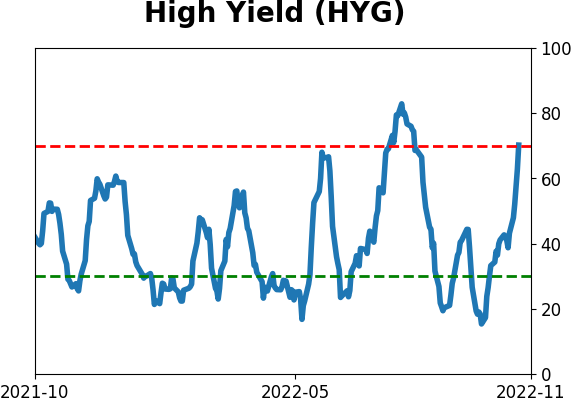
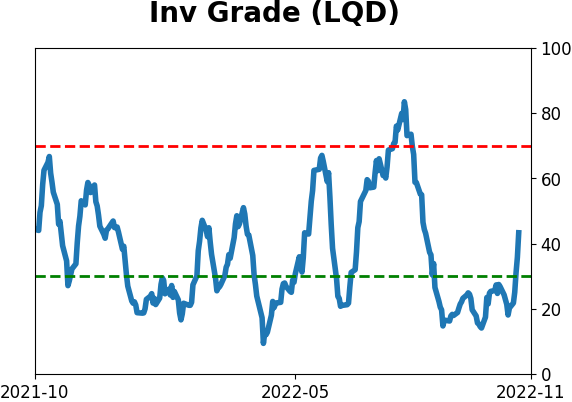
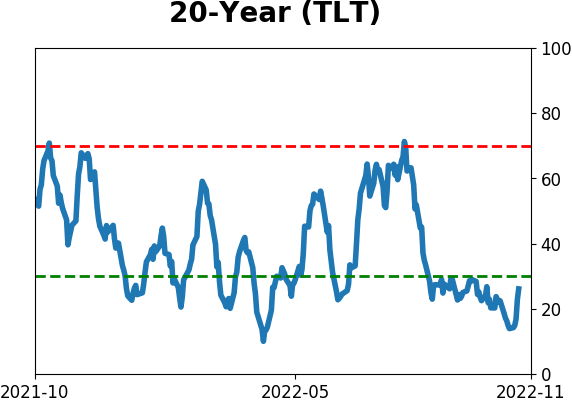
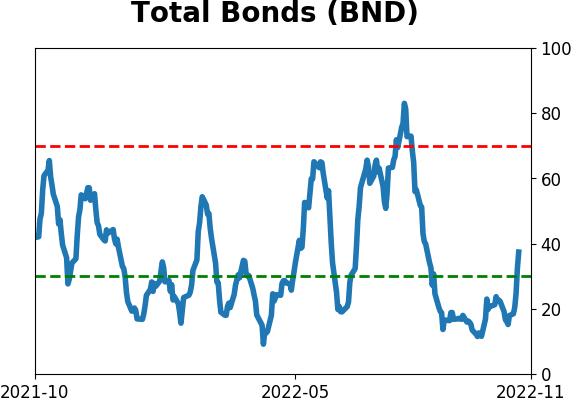
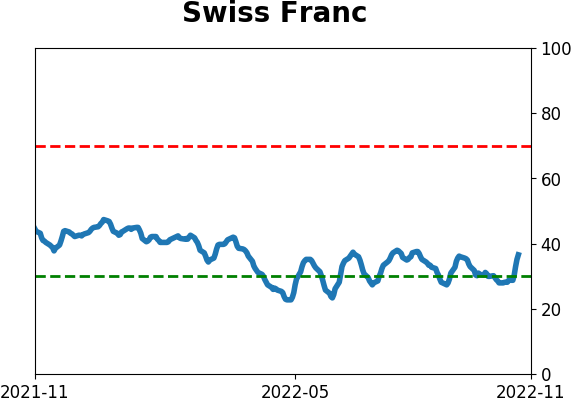
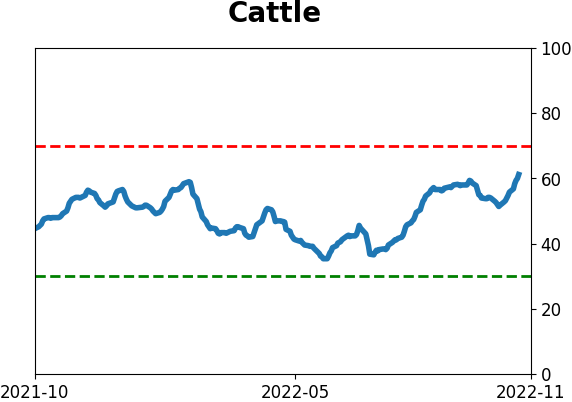
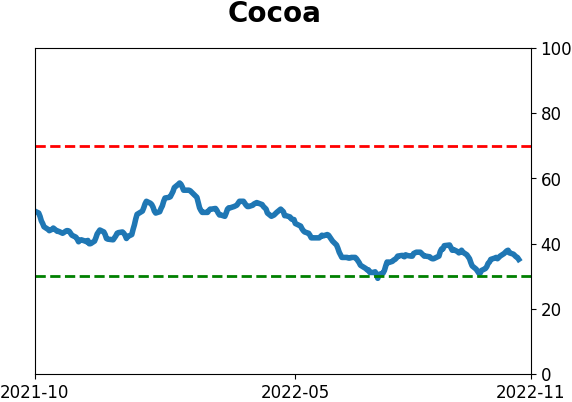
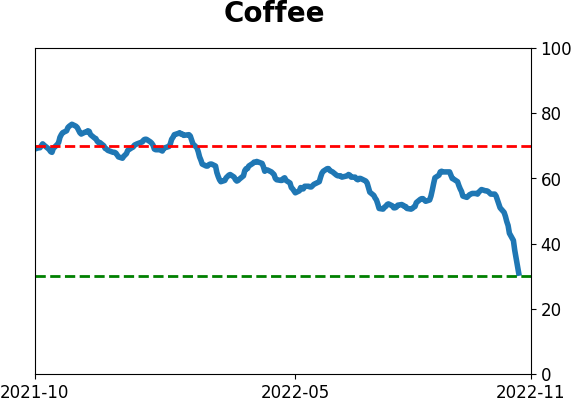
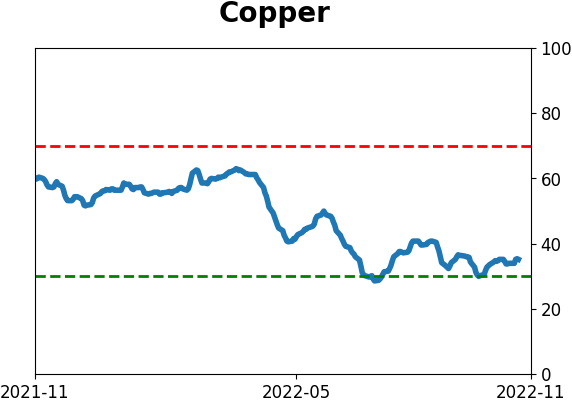
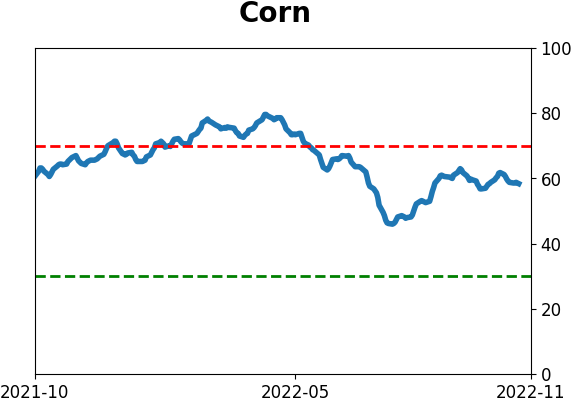
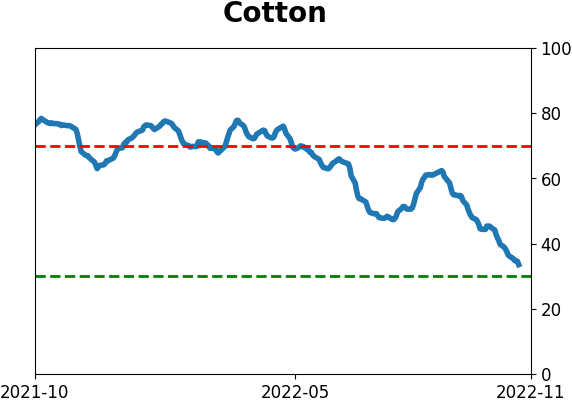
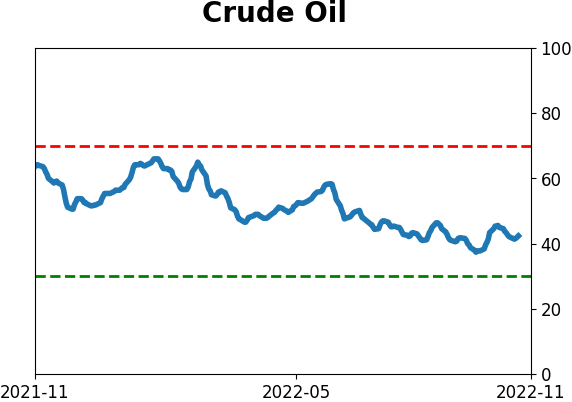
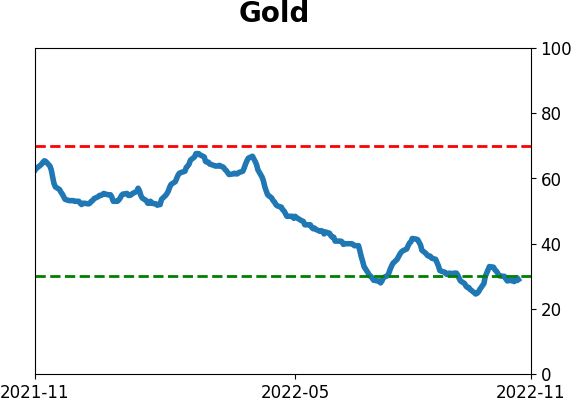
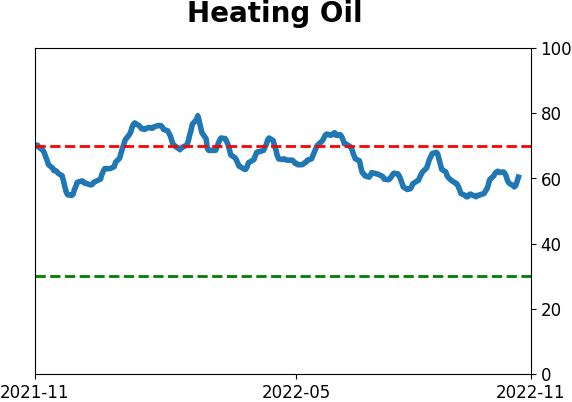
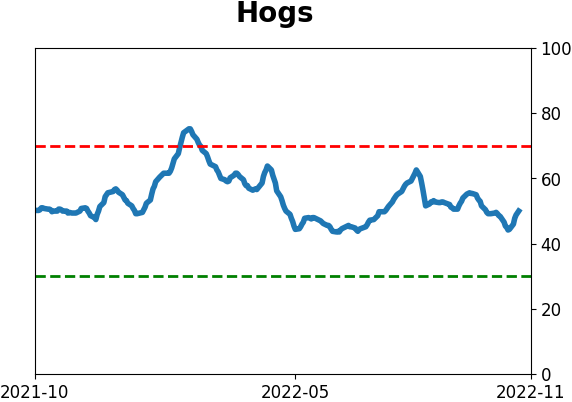
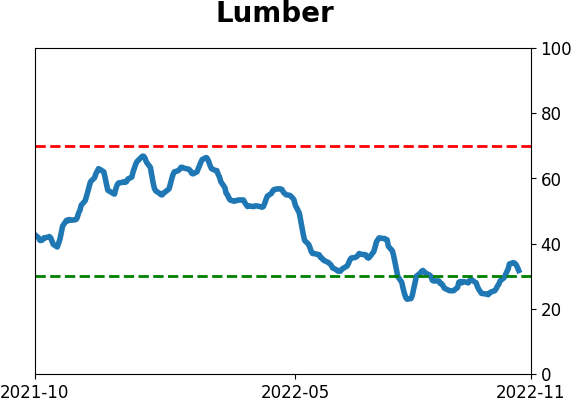
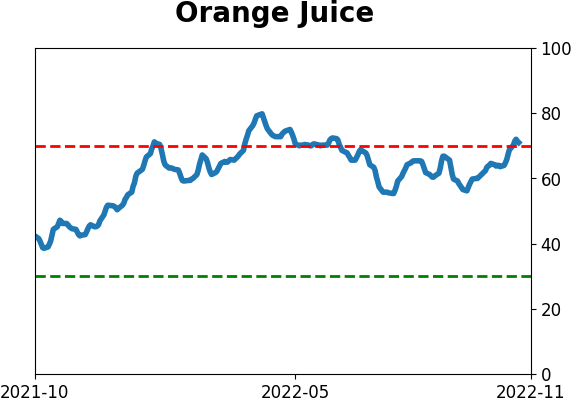
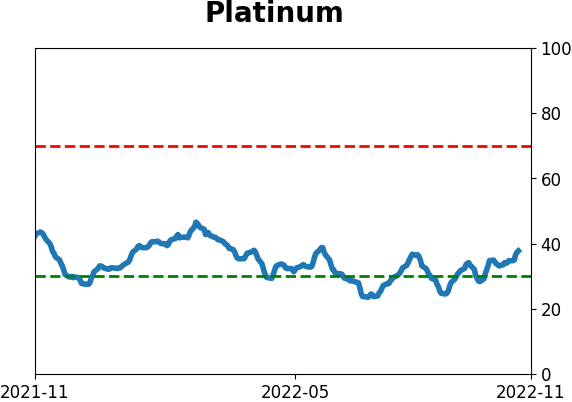
Optimism Index Thumbnails
|
|
|
|
|
|
|

|
|
|
|
|
|
|
|
|
|
|
|
|
|