Headlines
|
|
The dollar is starting to stumble:
The U.S. dollar closed below its 50-day average for the first time in months. When this happens soon after a multi-year high, the dollar tends to keep dropping. Especially so if it recently shrugged off a similar sell signal. Positioning in dollar futures and broader sentiment measures suggest that many investors could be interested in taking gains.
|
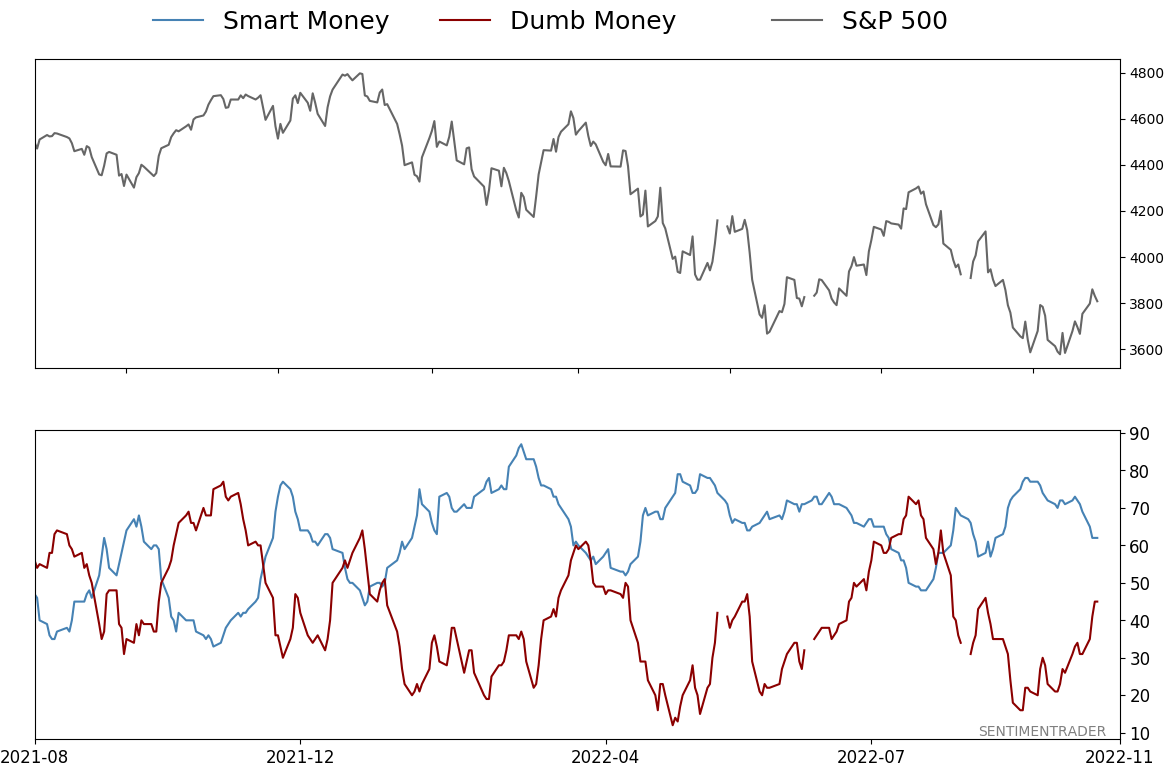
Smart / Dumb Money Confidence
|
Smart Money Confidence: 62%
Dumb Money Confidence: 45%
|
|
Risk Levels
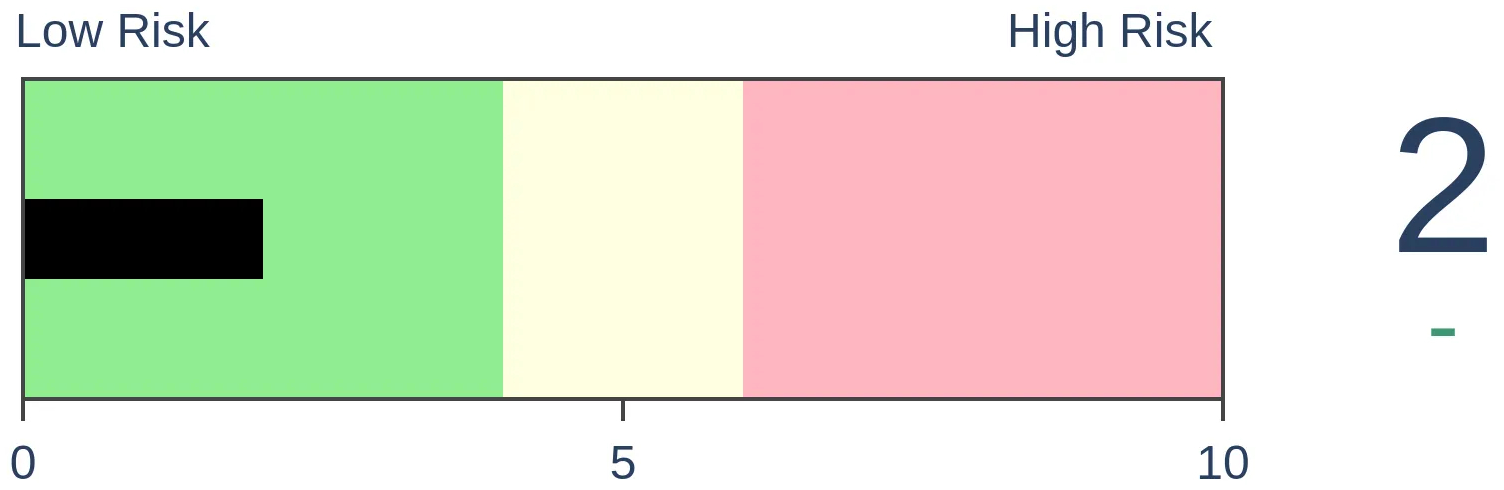
Stocks Short-Term
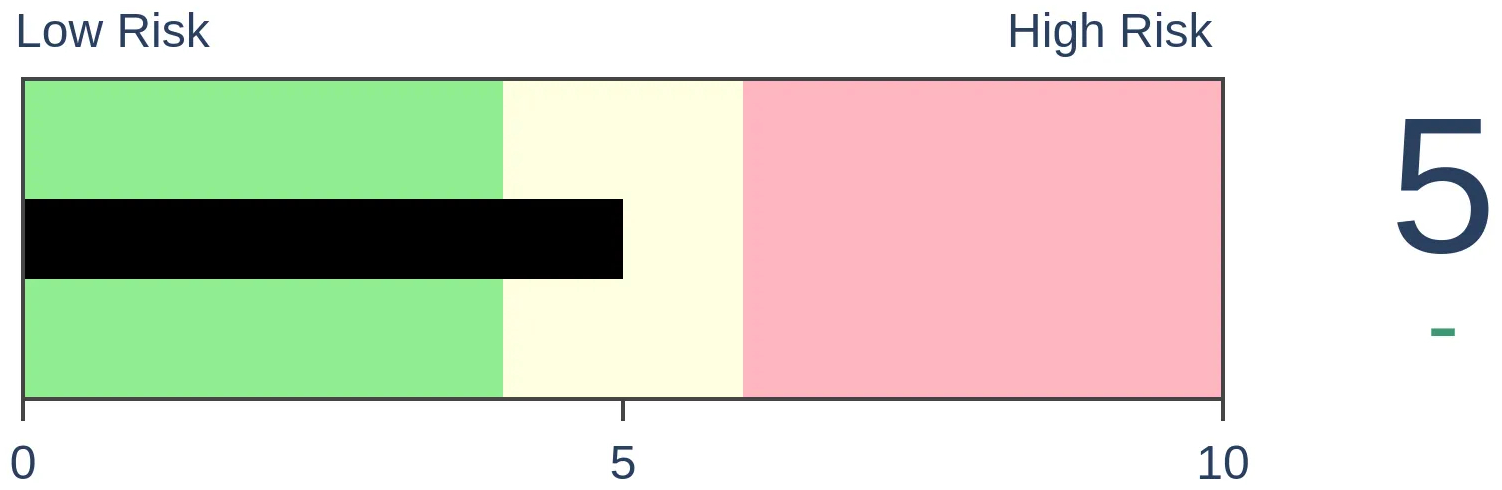
|
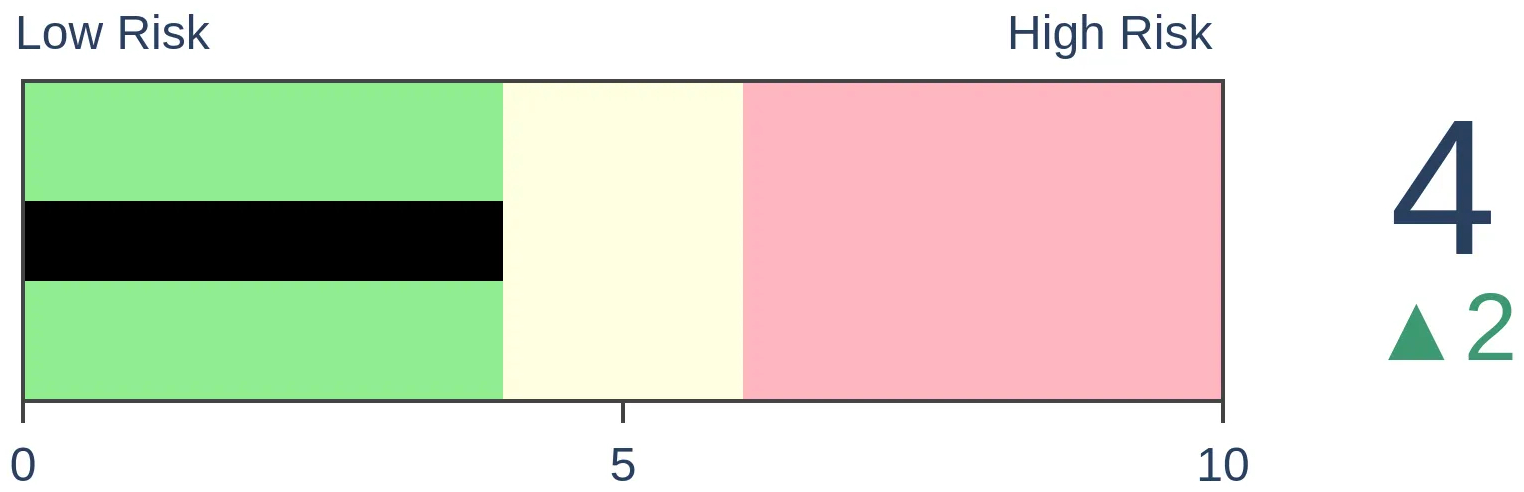
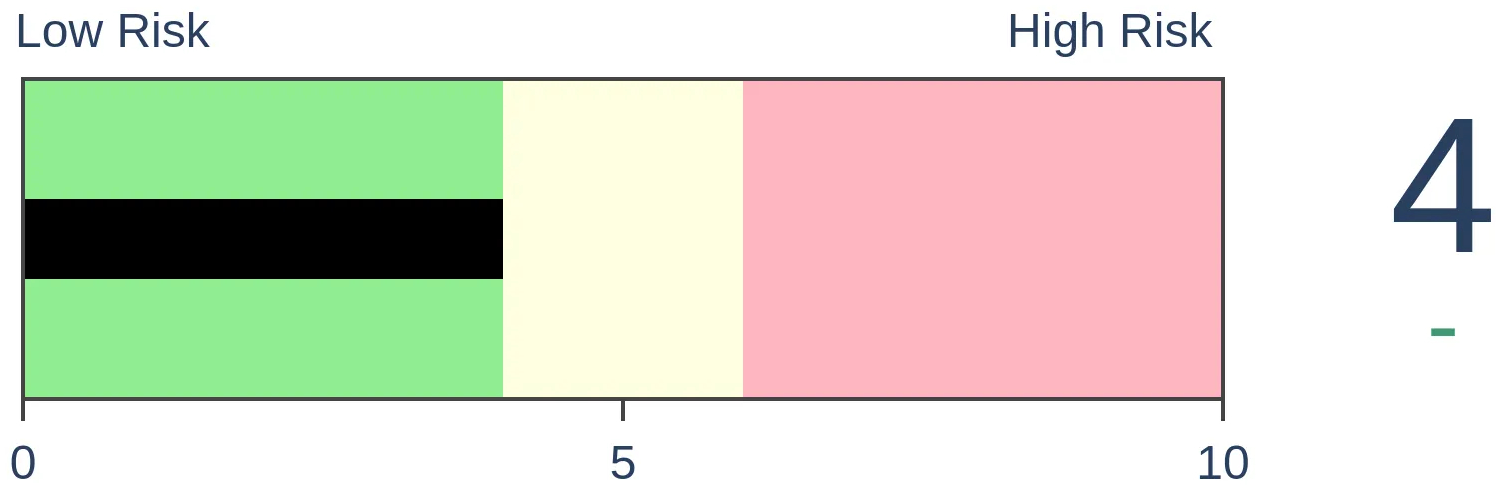
Stocks Medium-Term

|
|
Bonds
|
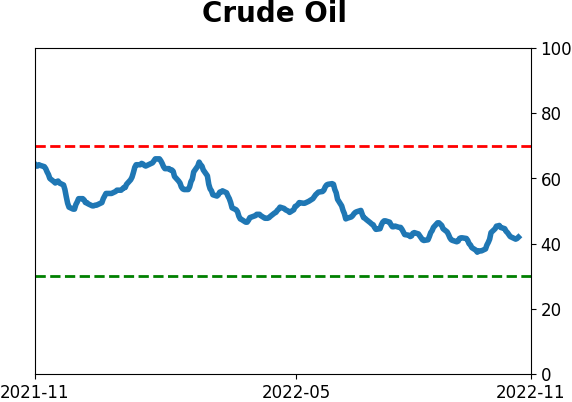
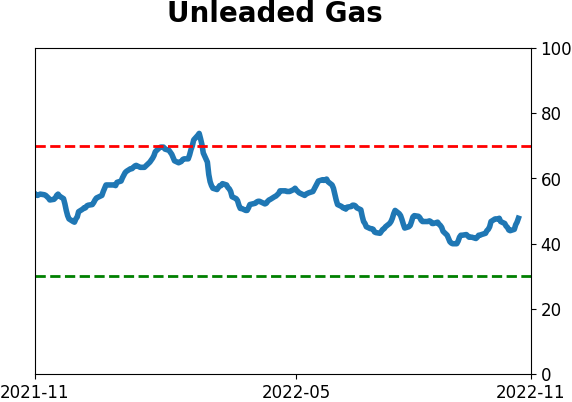
Crude Oil

|
|
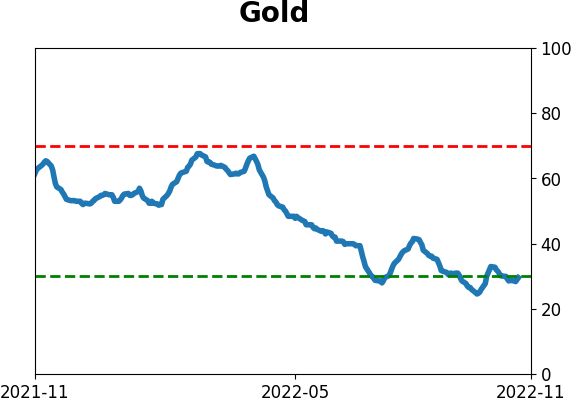
Gold
|
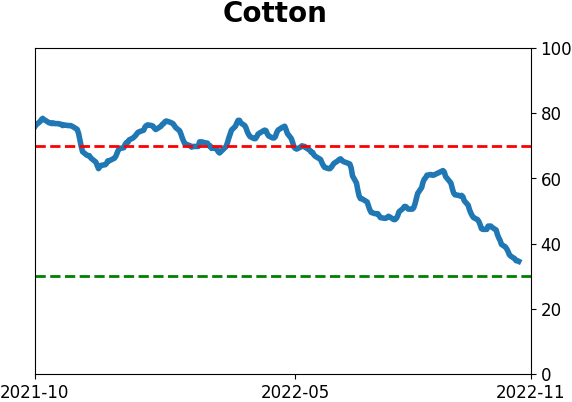
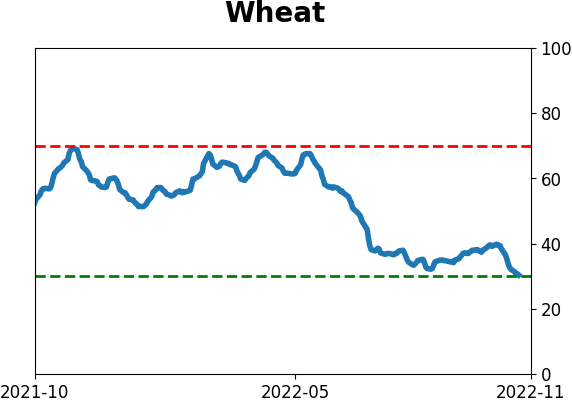
Agriculture
|
|
Research
By Jason Goepfert
BOTTOM LINE
The U.S. dollar closed below its 50-day average for the first time in months. When this happens soon after a multi-year high, the dollar tends to keep dropping. Especially so if it recently shrugged off a similar sell signal. Positioning in dollar futures and broader sentiment measures suggest that many investors could be interested in taking gains.
FORECAST / TIMEFRAME
None
|
Key points:
- The U.S. dollar closed below its 50-day average for the first time in months
- Coming after a multi-year high and another recent signal, the dollar has tended to keep dropping
- Positioning and sentiment also argue that the long-dollar trade is overdue for a correction
For the first time in months, the dollar is stumbling
The U.S. dollar has been an increasing focus of investors who don't usually pay attention to it. A surge of media articles and earnings call excuses will always help zero in investors' attention.
After an incessant rise into October, the buck has started to oscillate and, for the first time in months, closed below its 50-day moving average. This is one of the first warning signs of a potential trend change for trend followers.
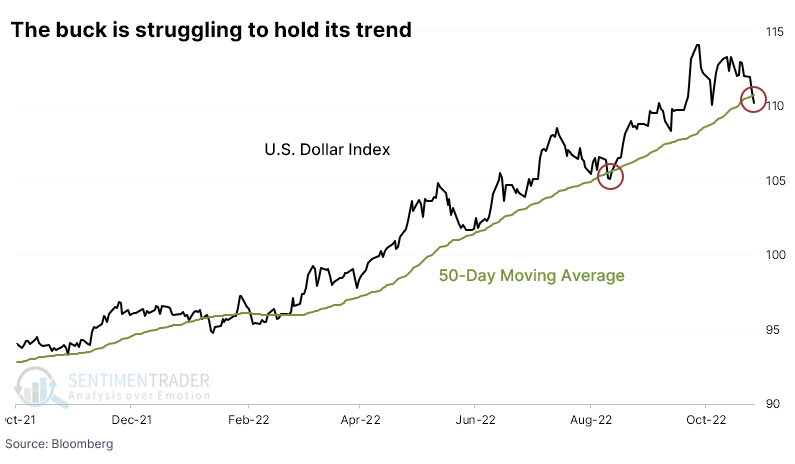
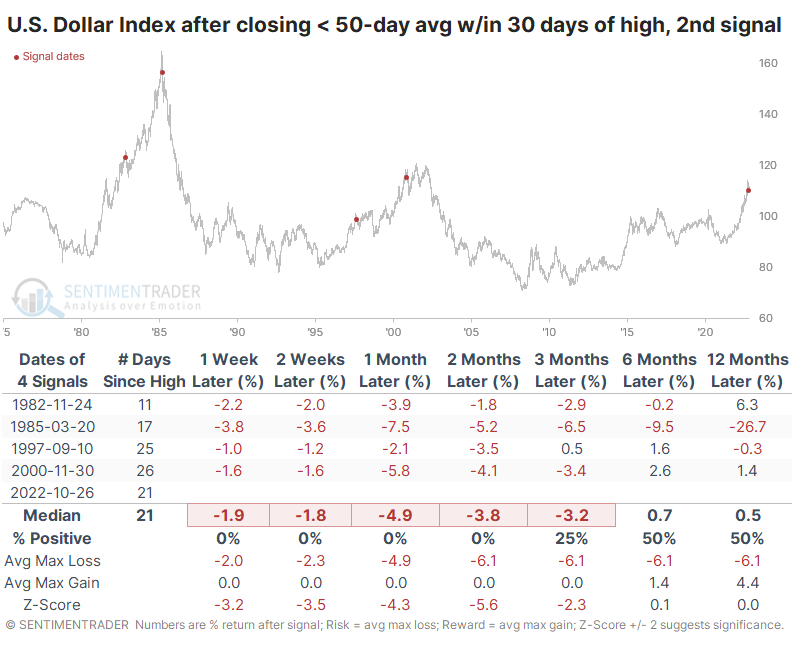
When the dollar had set a multi-year high within the past 30 days and then closed below its 50-day average for the first time in at least 50 days, it tended to keep moving lower. Over the next 1-4 weeks, the dollar's returns were terrible, with a strong tendency toward losses.
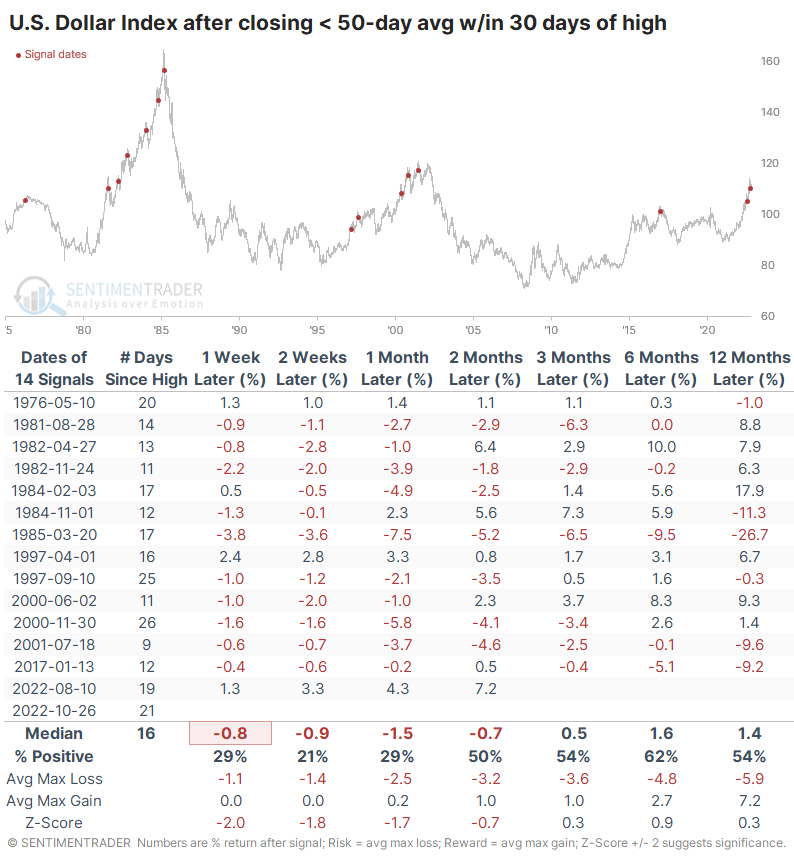
There were four times - including the last one in August - when the dollar managed to shrug off this tendency by rising and then and trigger a second signal within about six months. The table below shows its returns after these second-chance sell signals.
Every time, the dollar lost ground up to two months later. Within the next couple of months, the dollar declined at least 3.5% at some point every time, averaging more than a 6% loss.
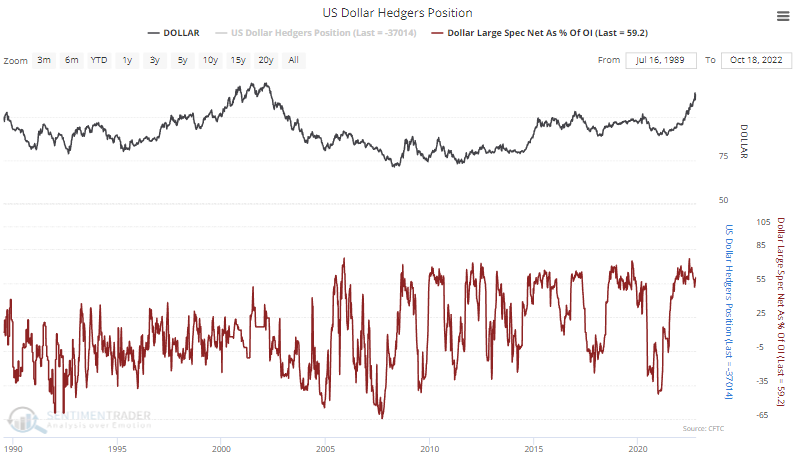
There is certainly room for more of an unwind. Large speculators in dollar futures hold nearly 60% of open interest net long, among the highest exposure they've ever had.
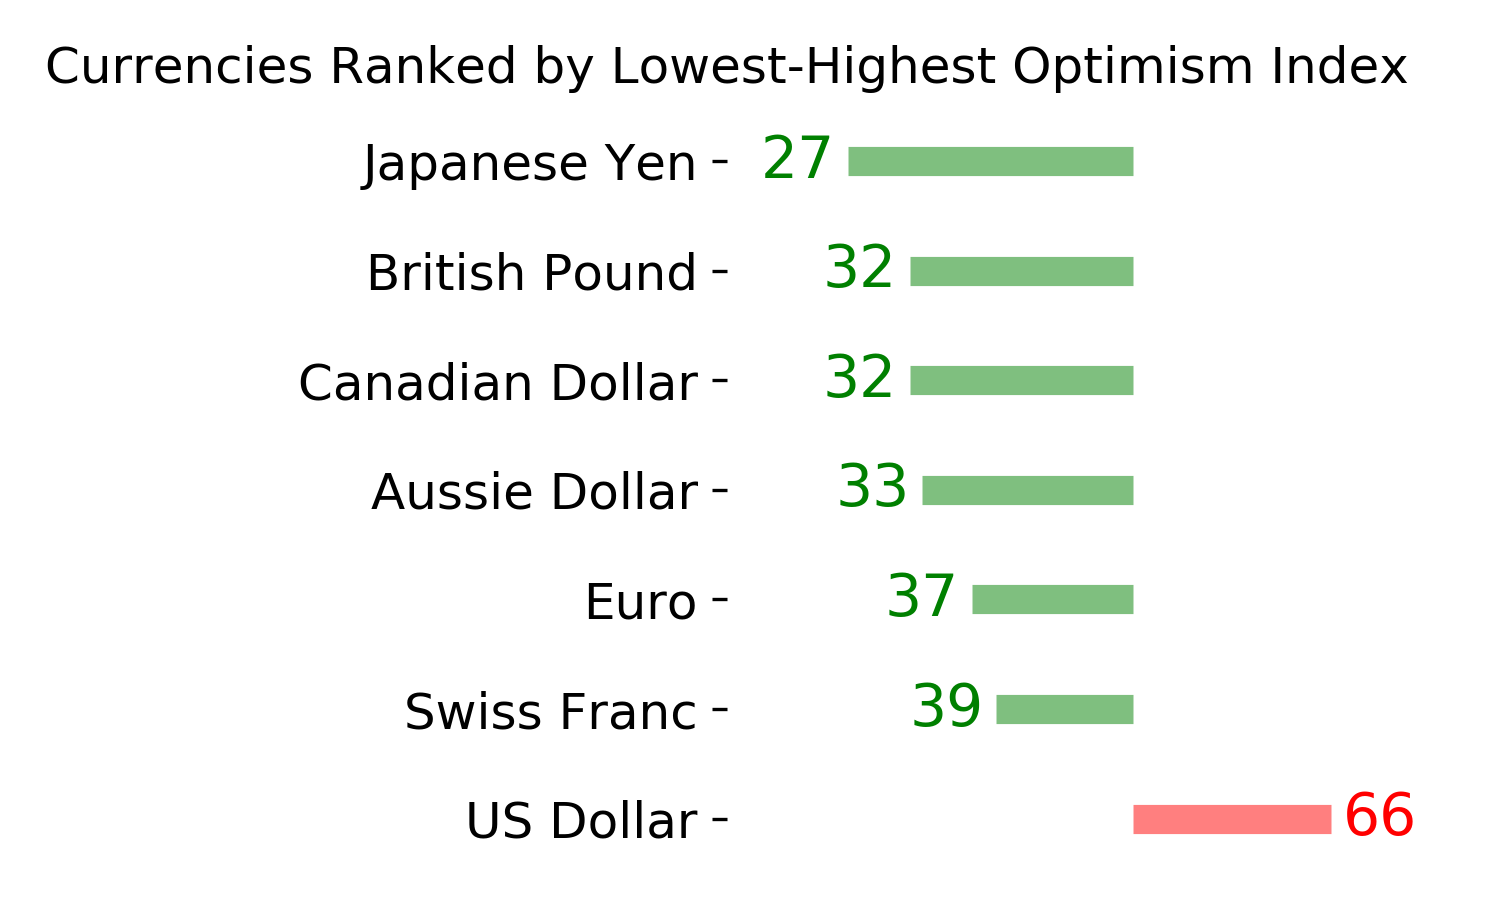
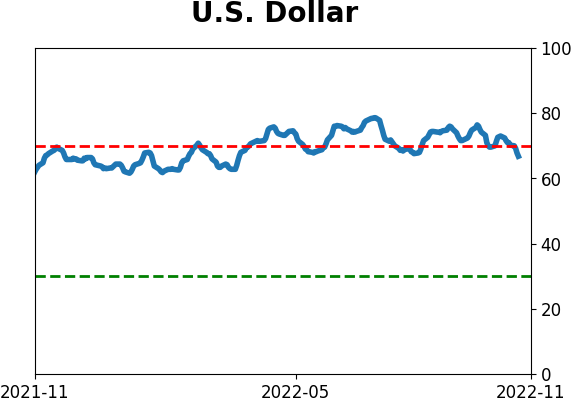
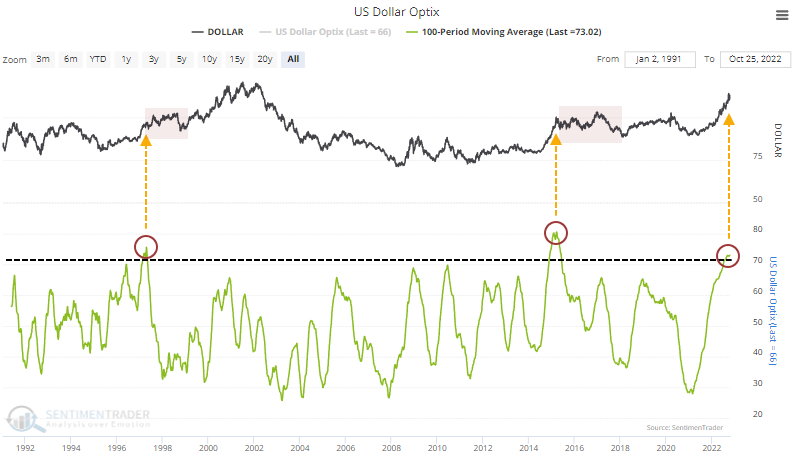
Positioning in futures contracts is one input to the Dollar Optimism Index (Optix), which has been persistently high. The 100-day average is now above 70% for only the 3rd time since we have data. The other times, early 1997 and late 2014, preceded a long slog for the buck.
What the research tells us...
Anyone trying to use contrary analysis on the dollar has been nursing a bruised ego and brokerage account. Currencies are one of the rare markets that tend to be ruled more by forces other than sentiment. Even so, the uptrend has gone on so long that it's being taken as a given, which is always dangerous. Now that there are nascent signs of a stumble, the risk of a long dollar position has increased substantially.
Indicators at Extremes
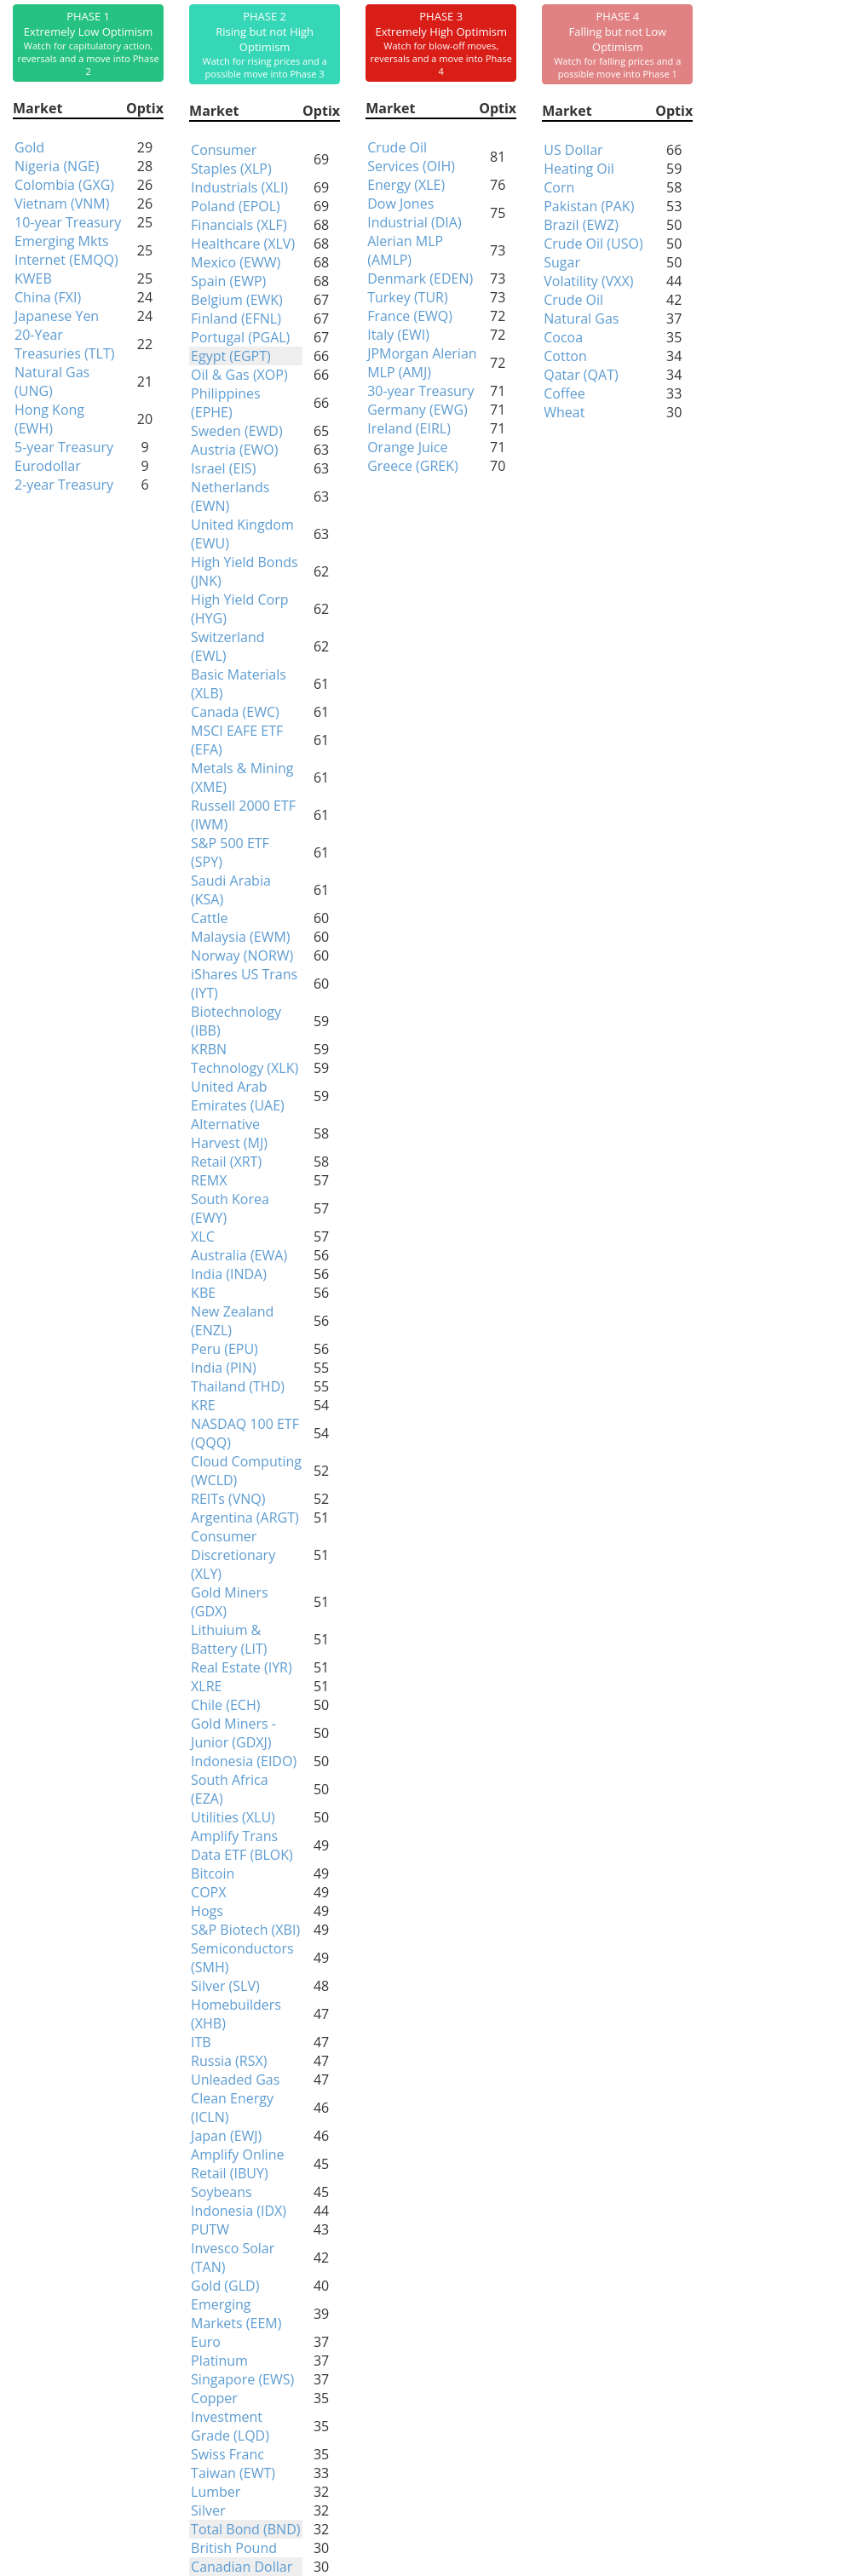
Phase Table
Ranks
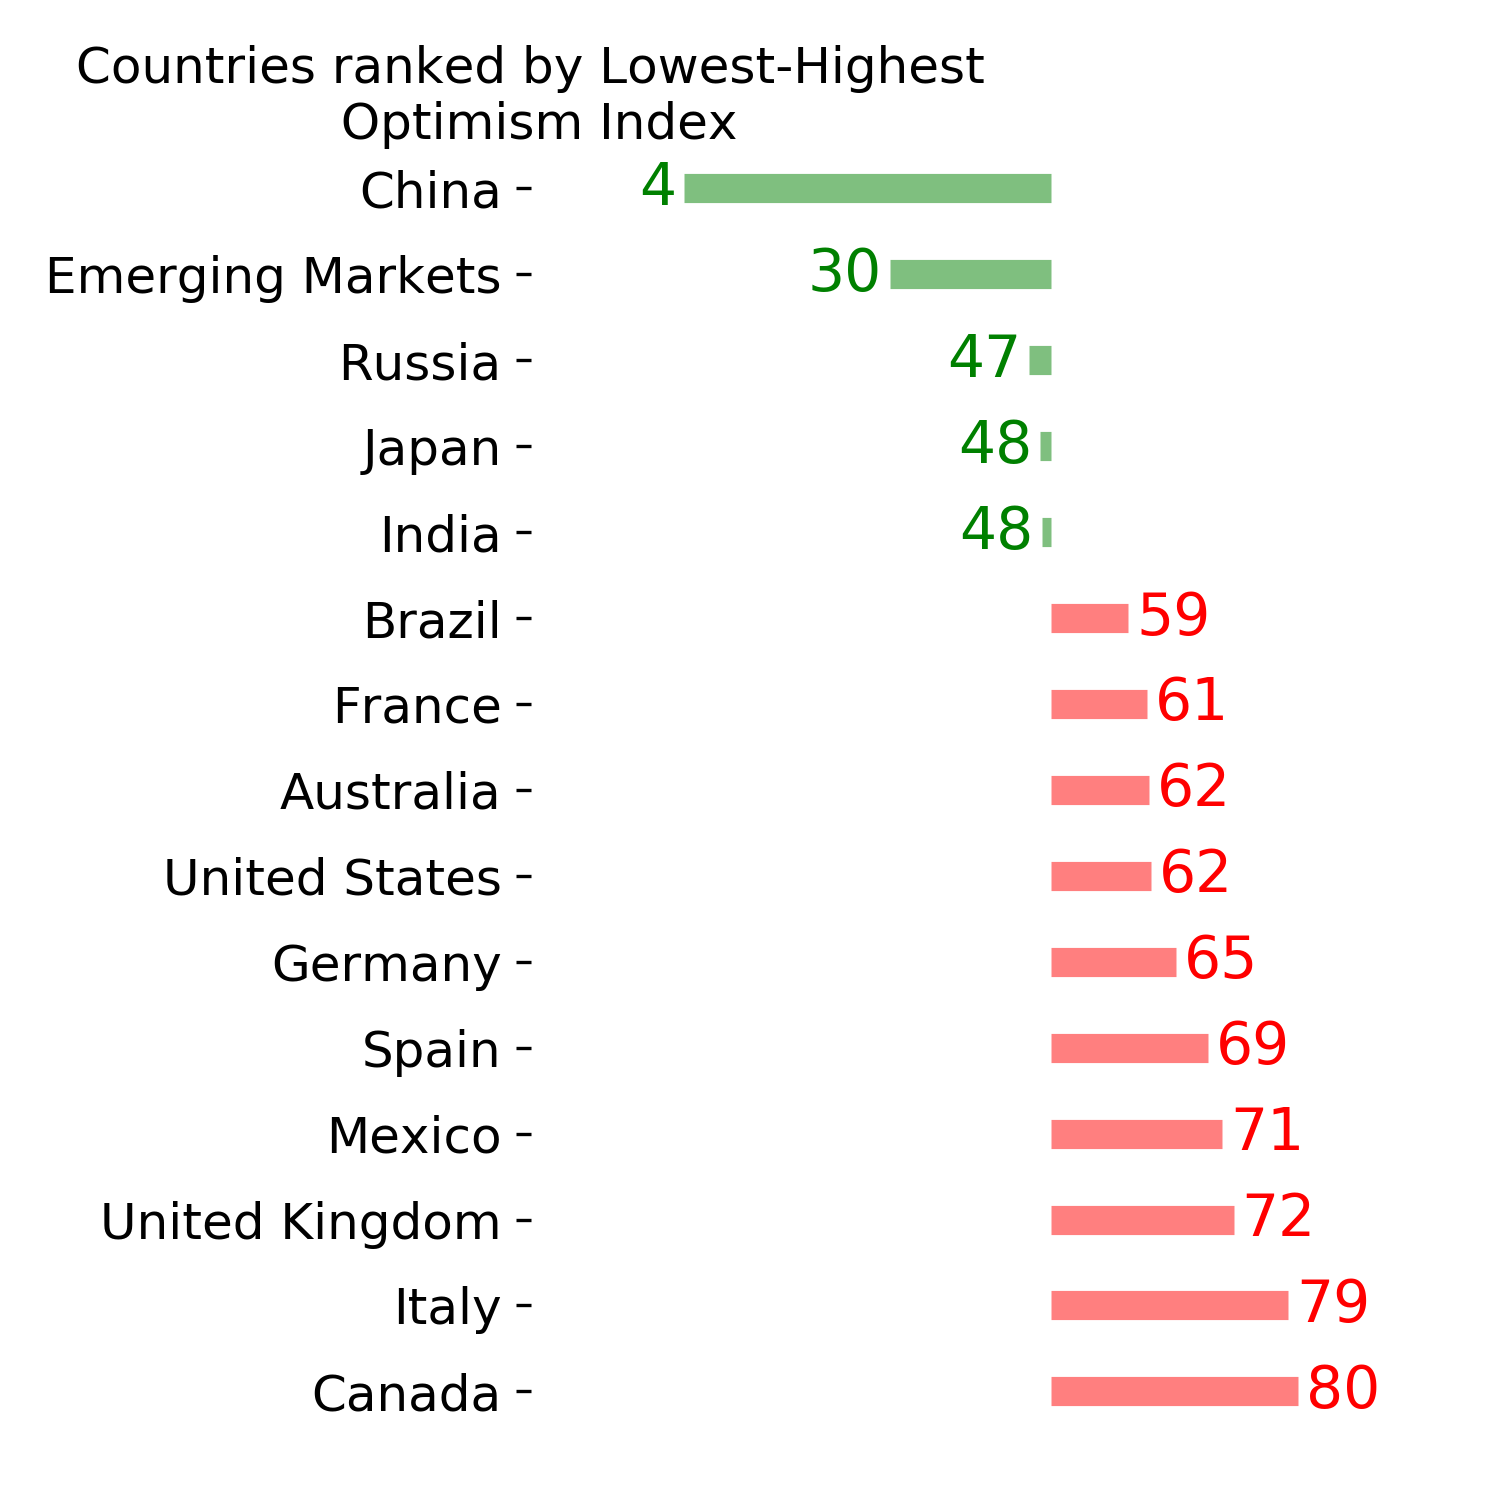
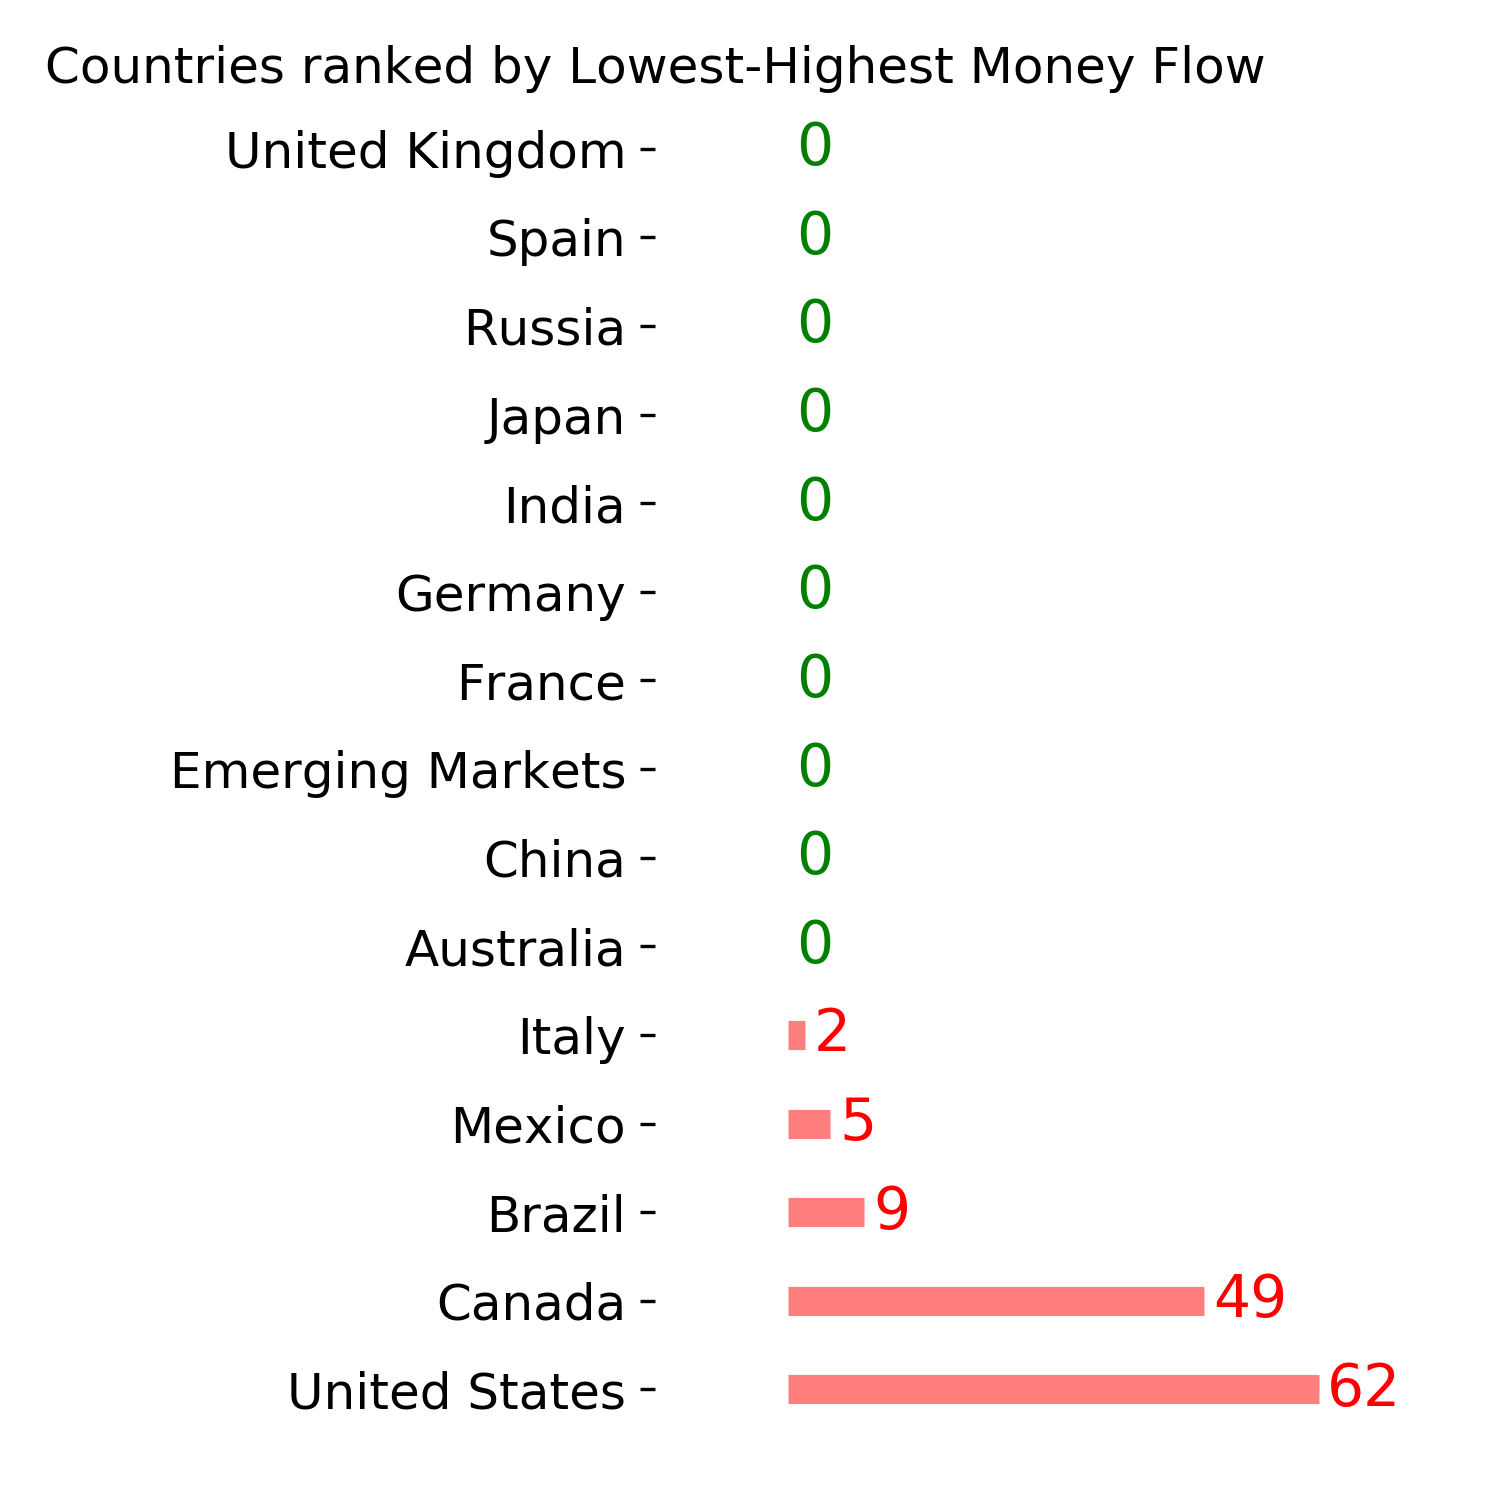
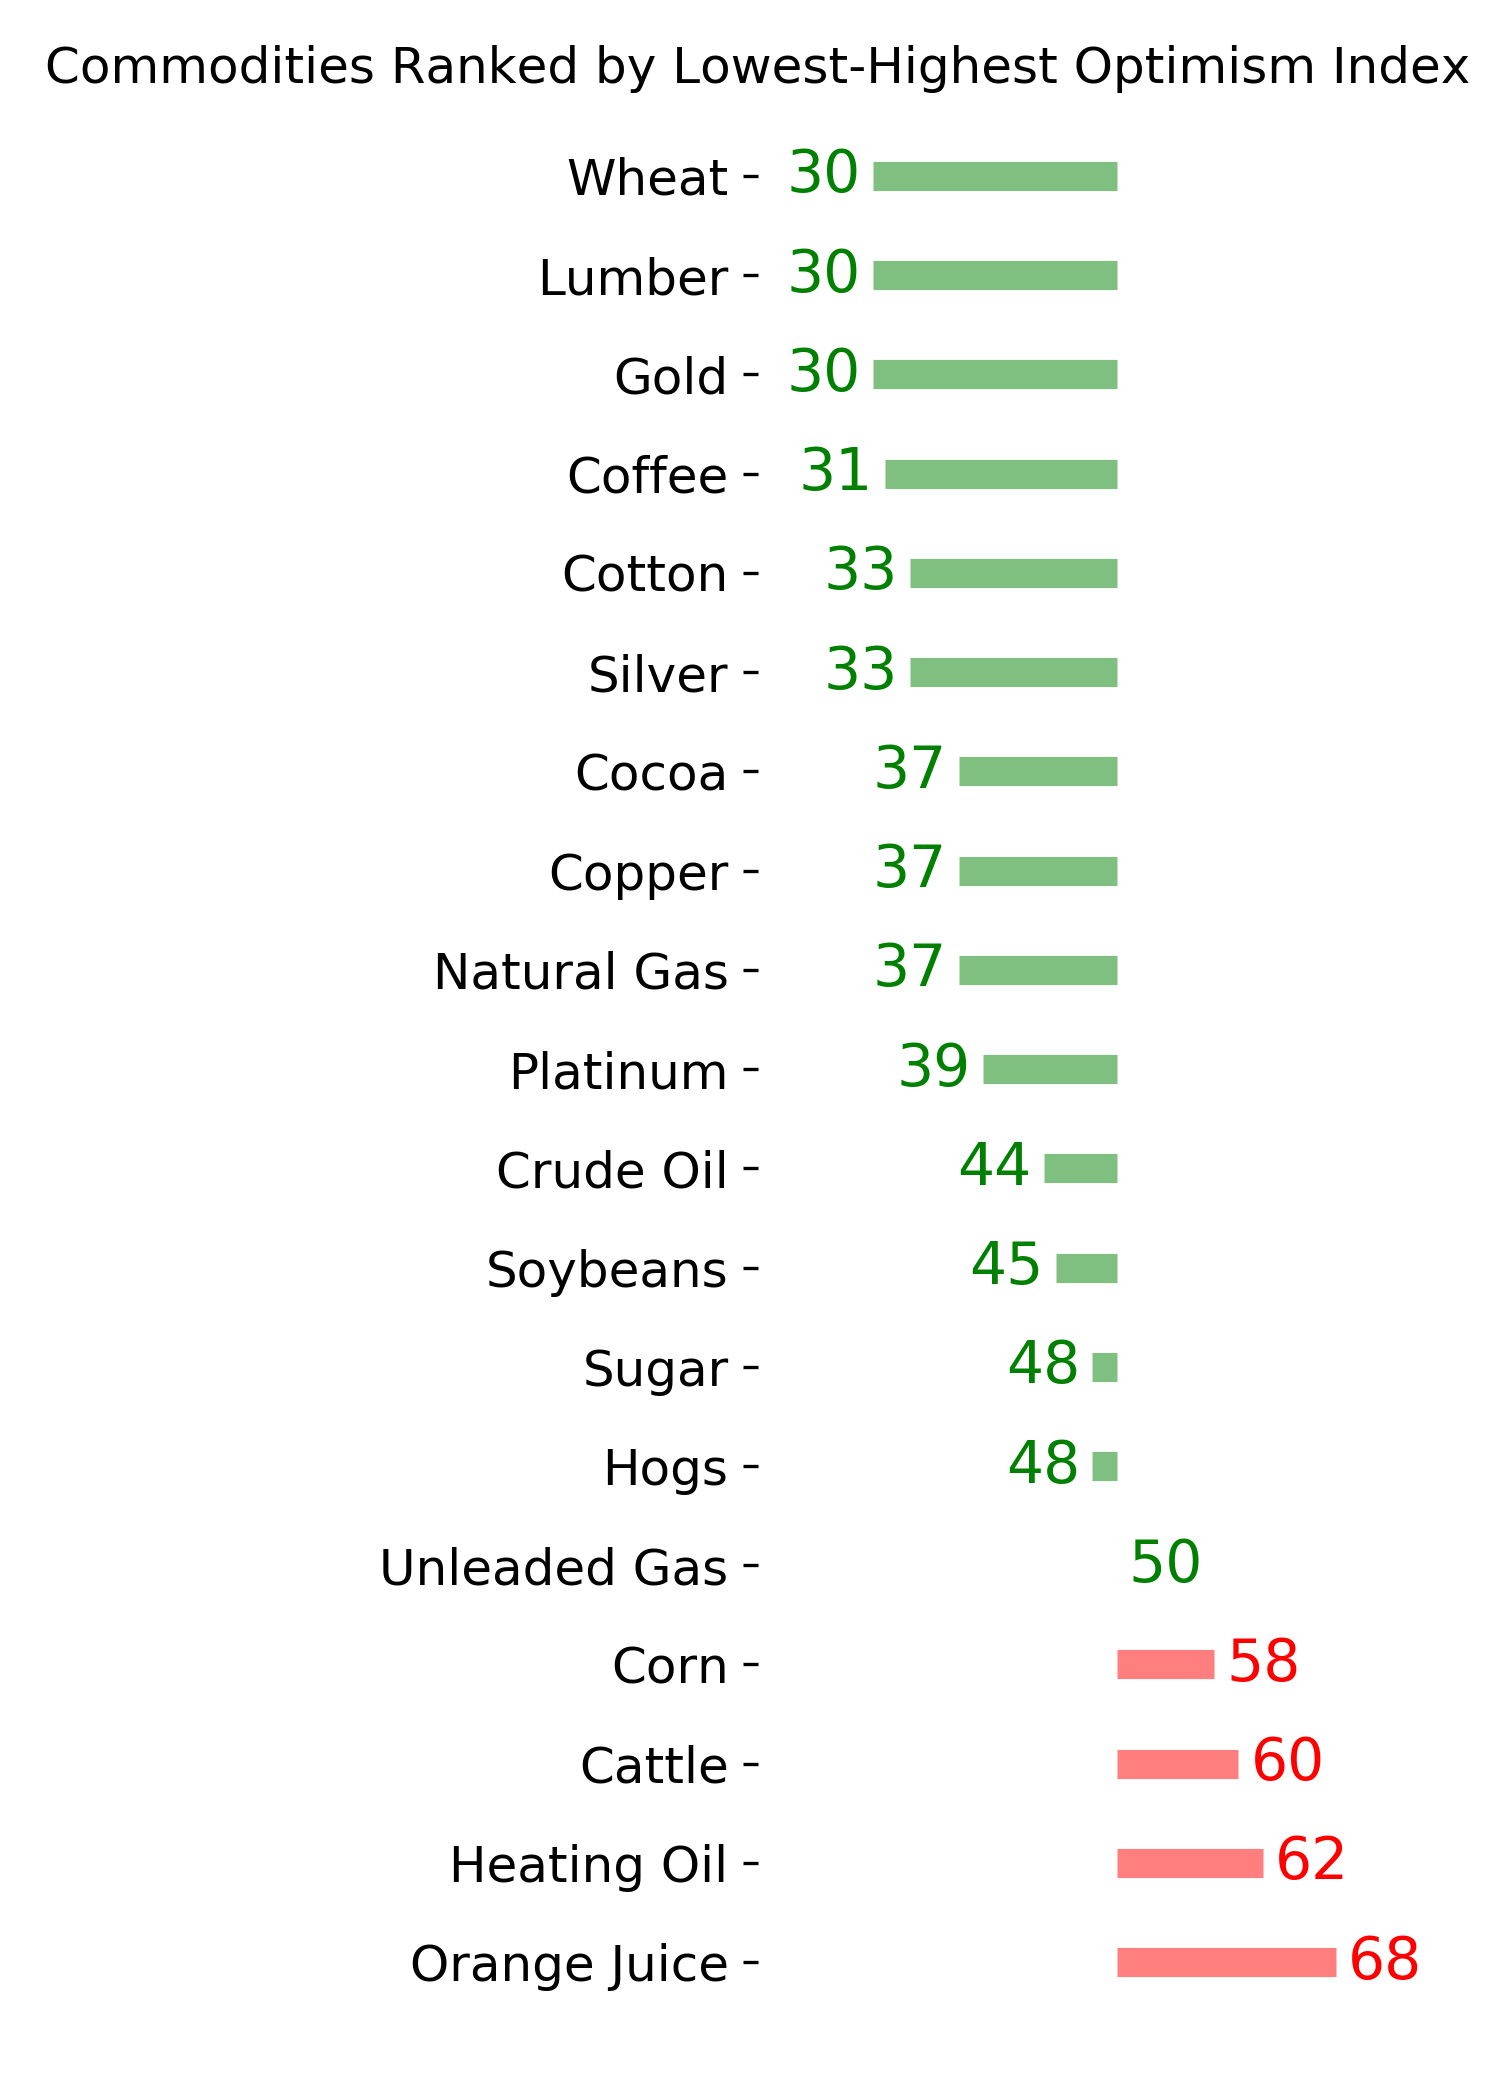
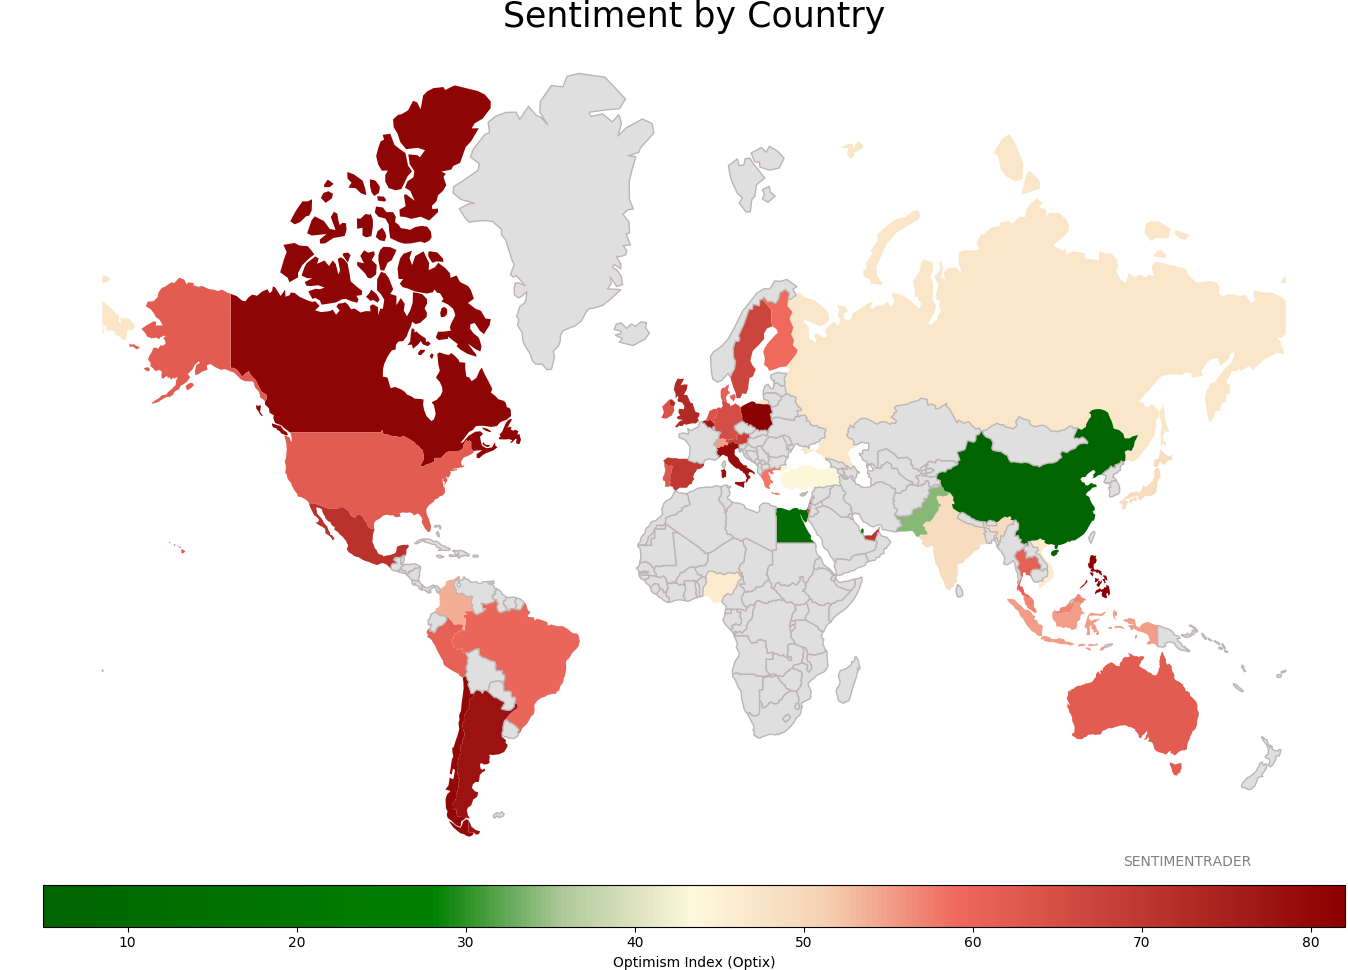
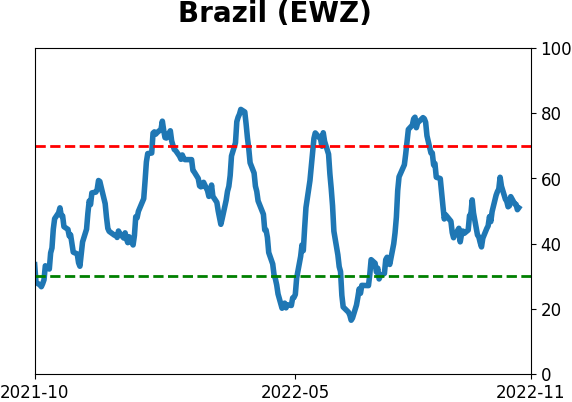
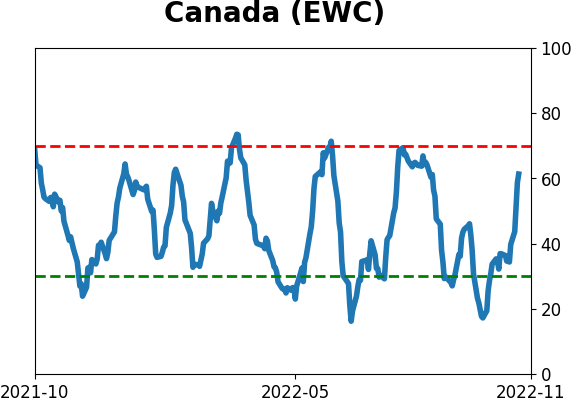
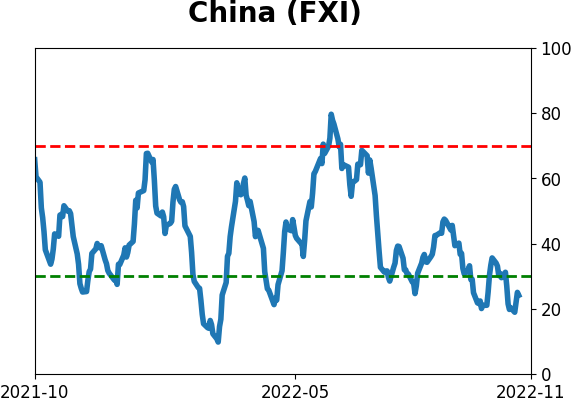
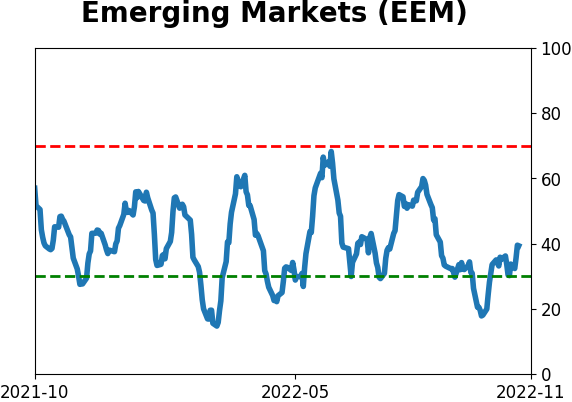
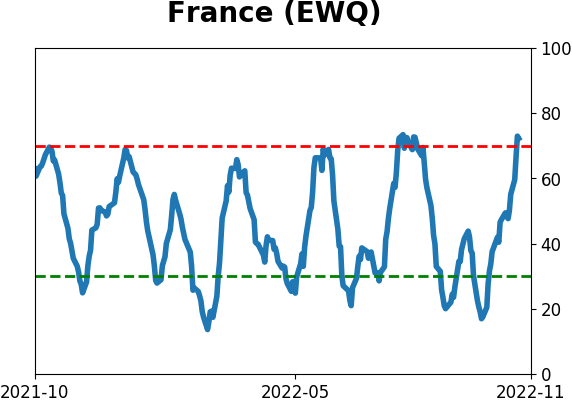
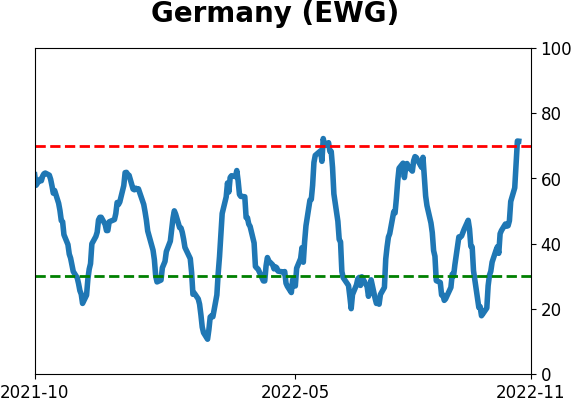
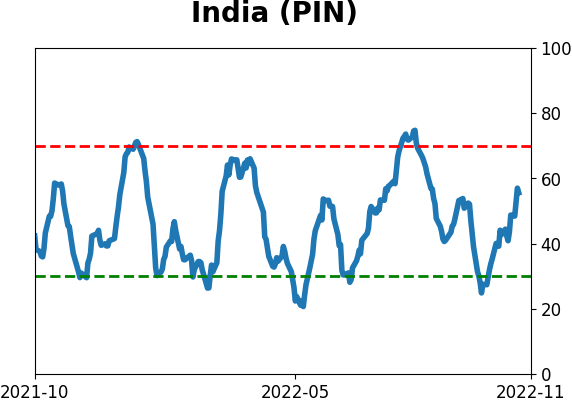
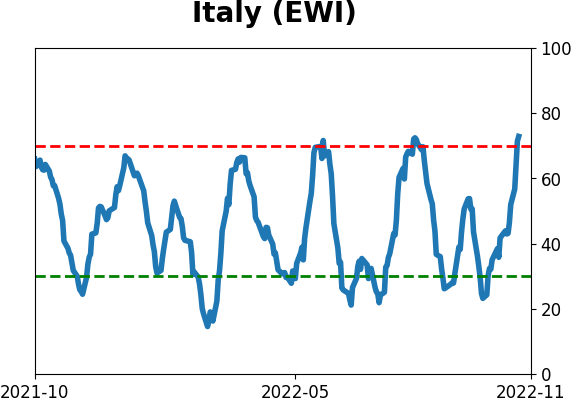
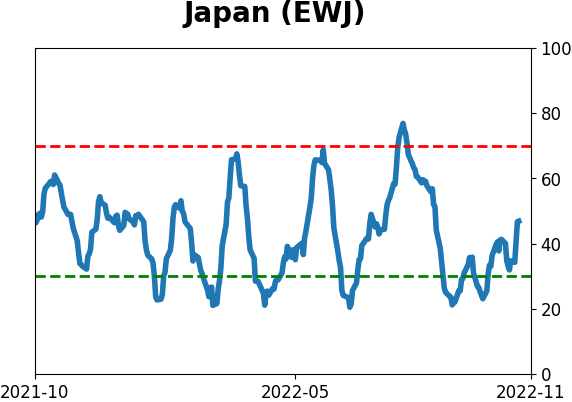
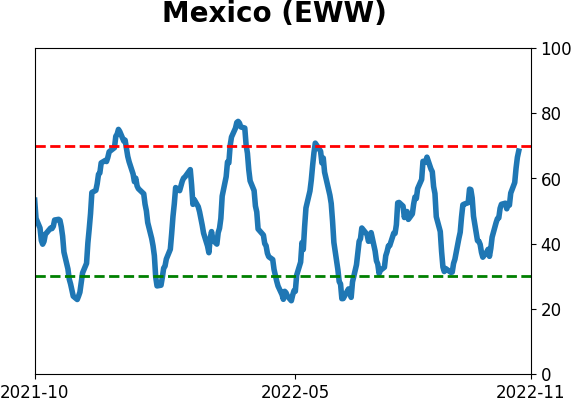
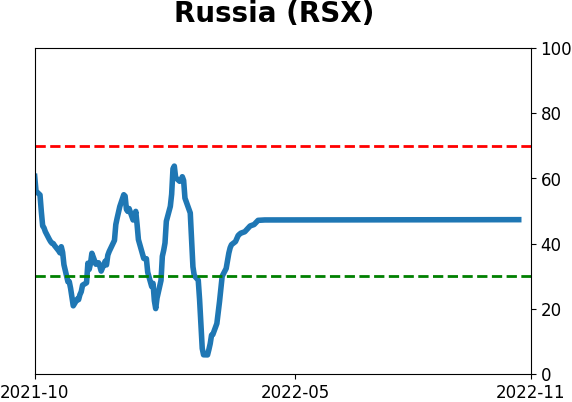
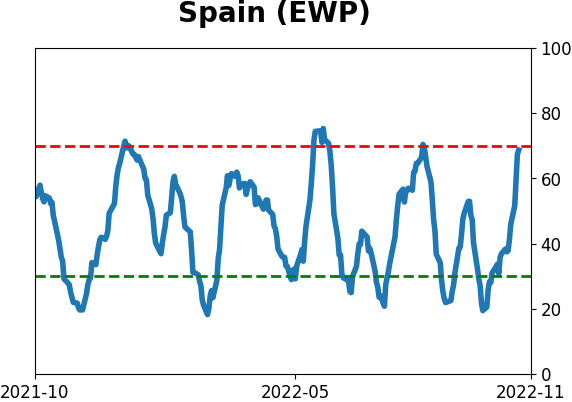
Sentiment Around The World
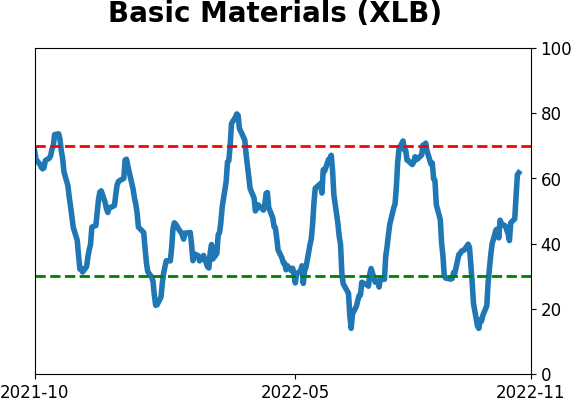
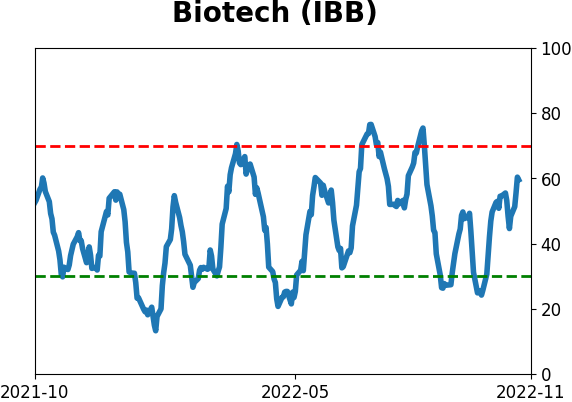
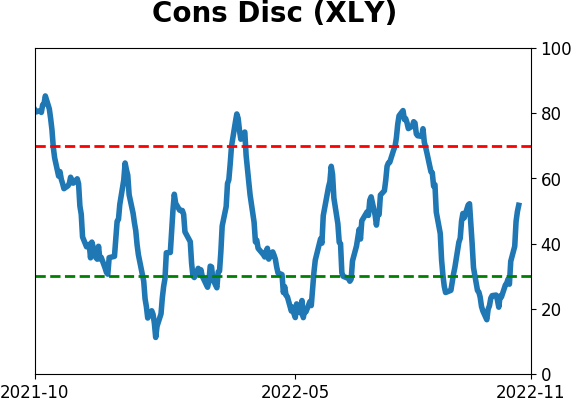
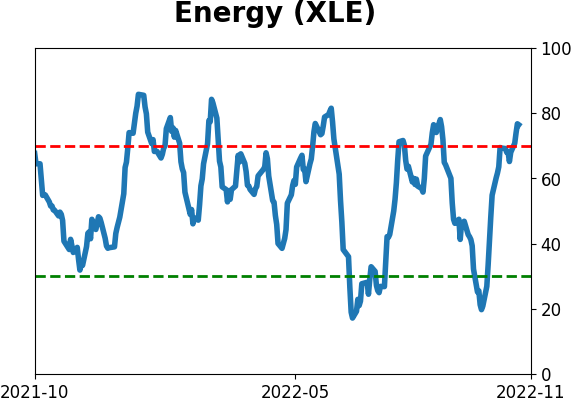
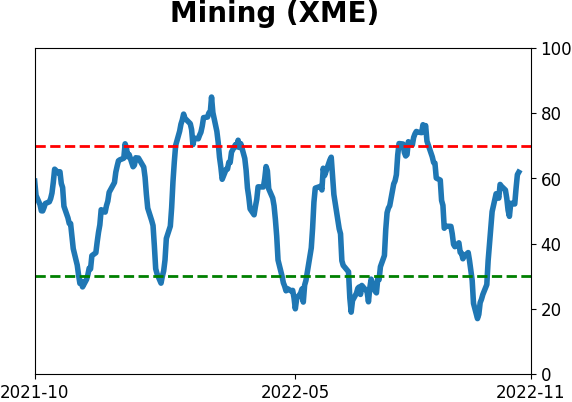
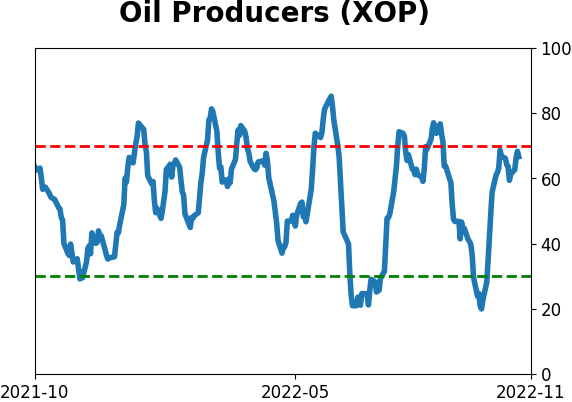
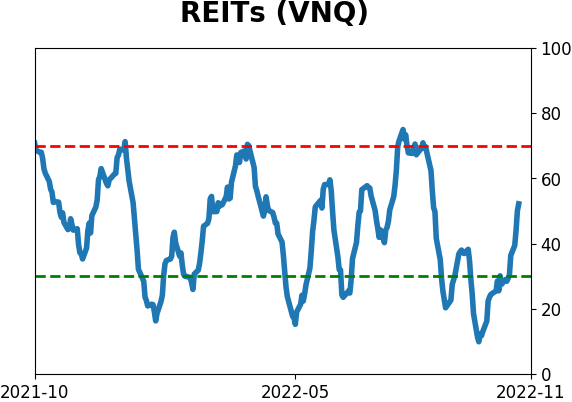
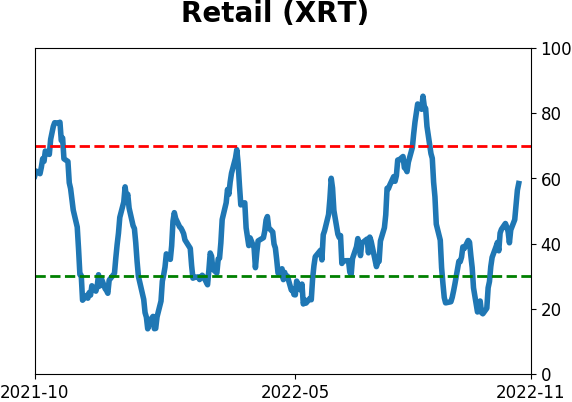
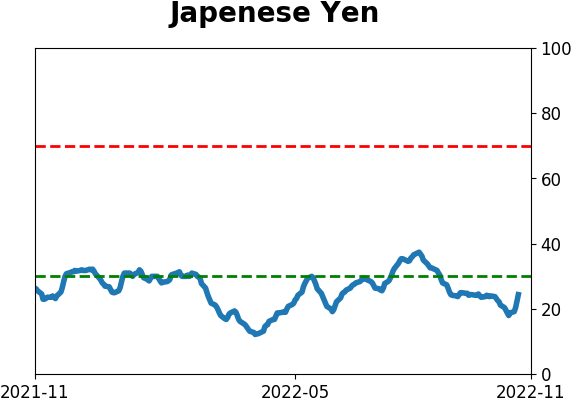
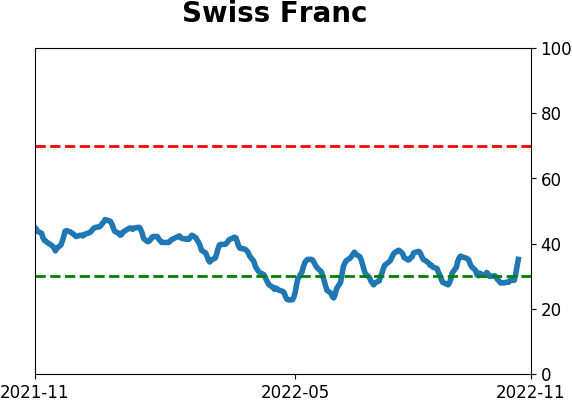
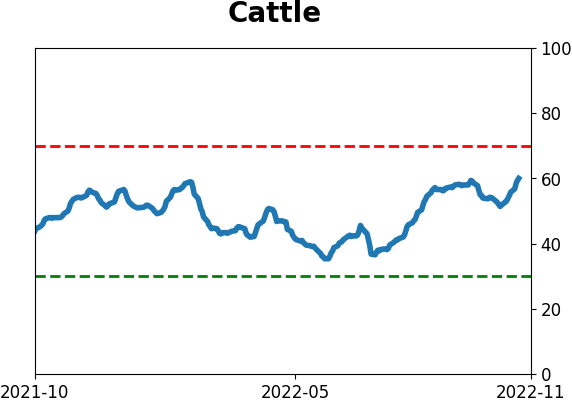
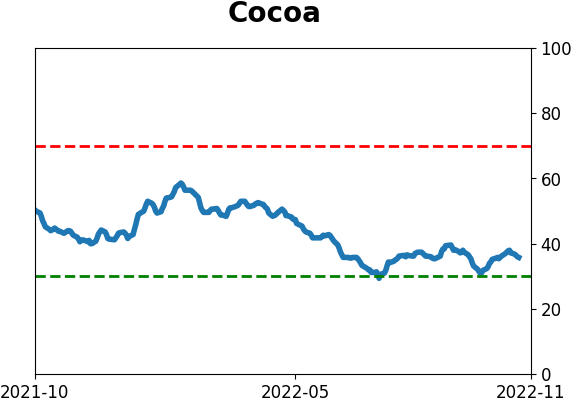
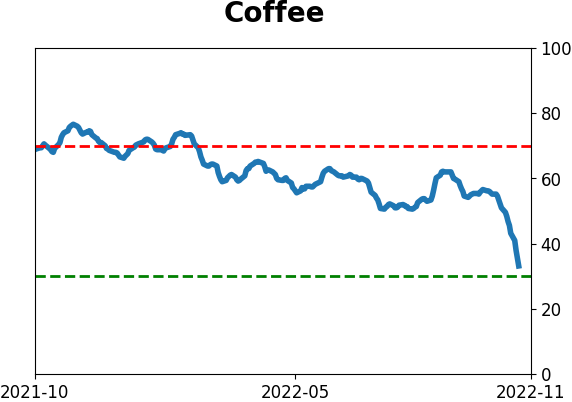
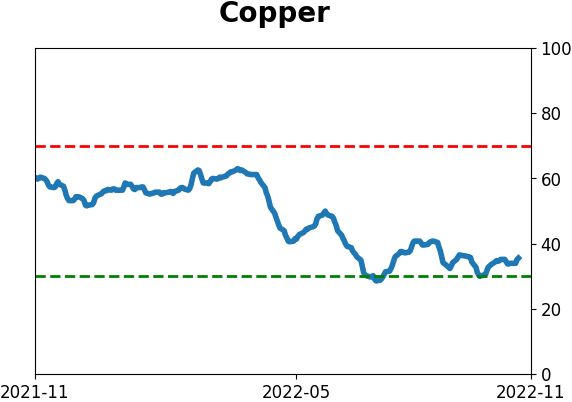
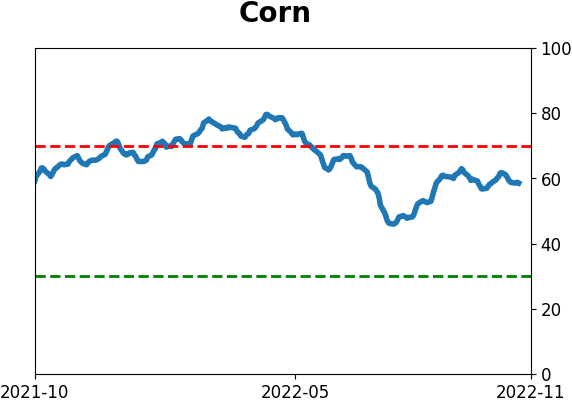
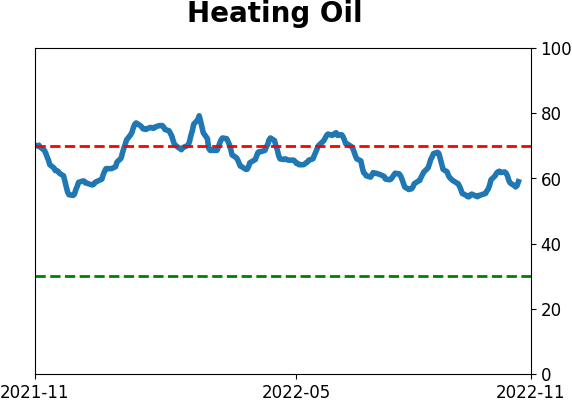
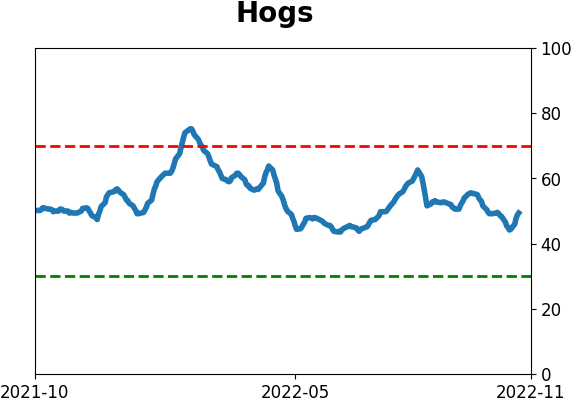
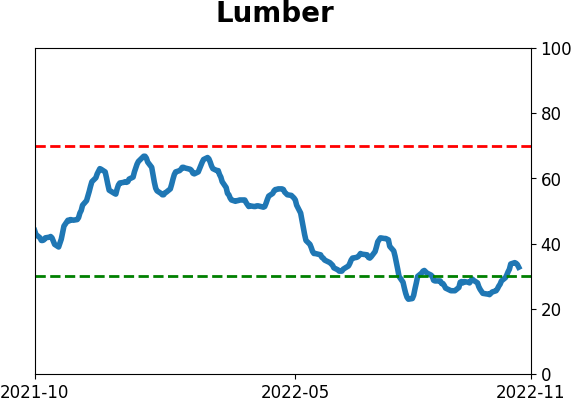
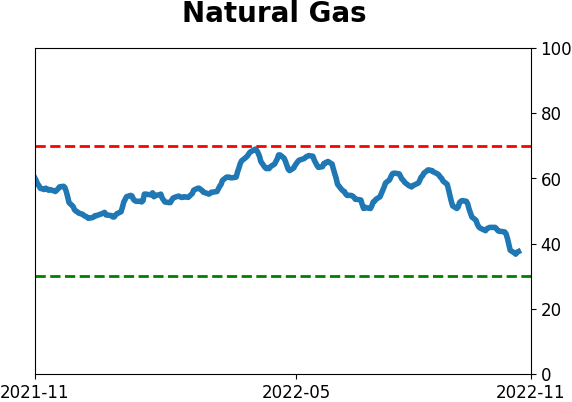
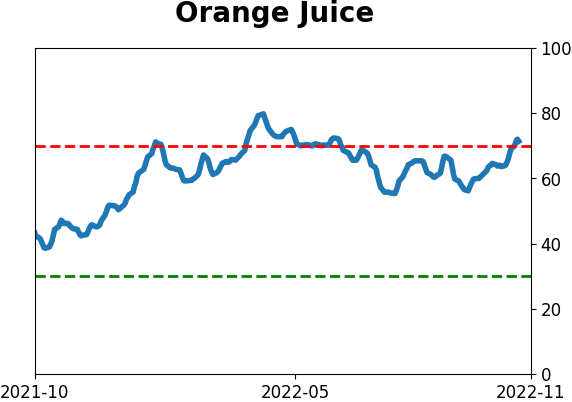
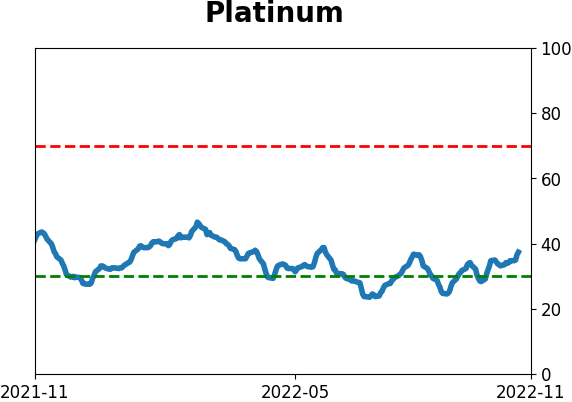
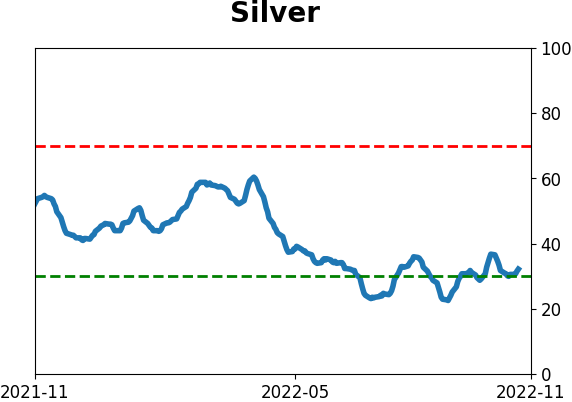
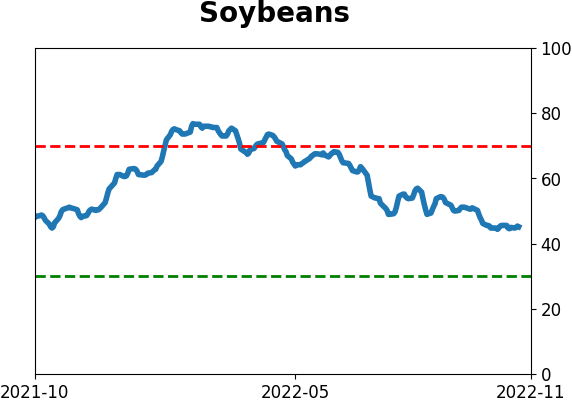
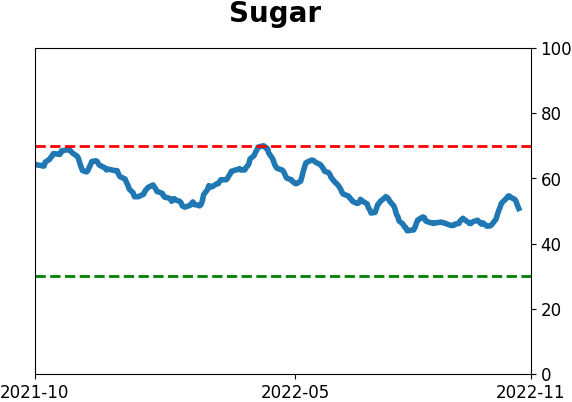
Optimism Index Thumbnails
|
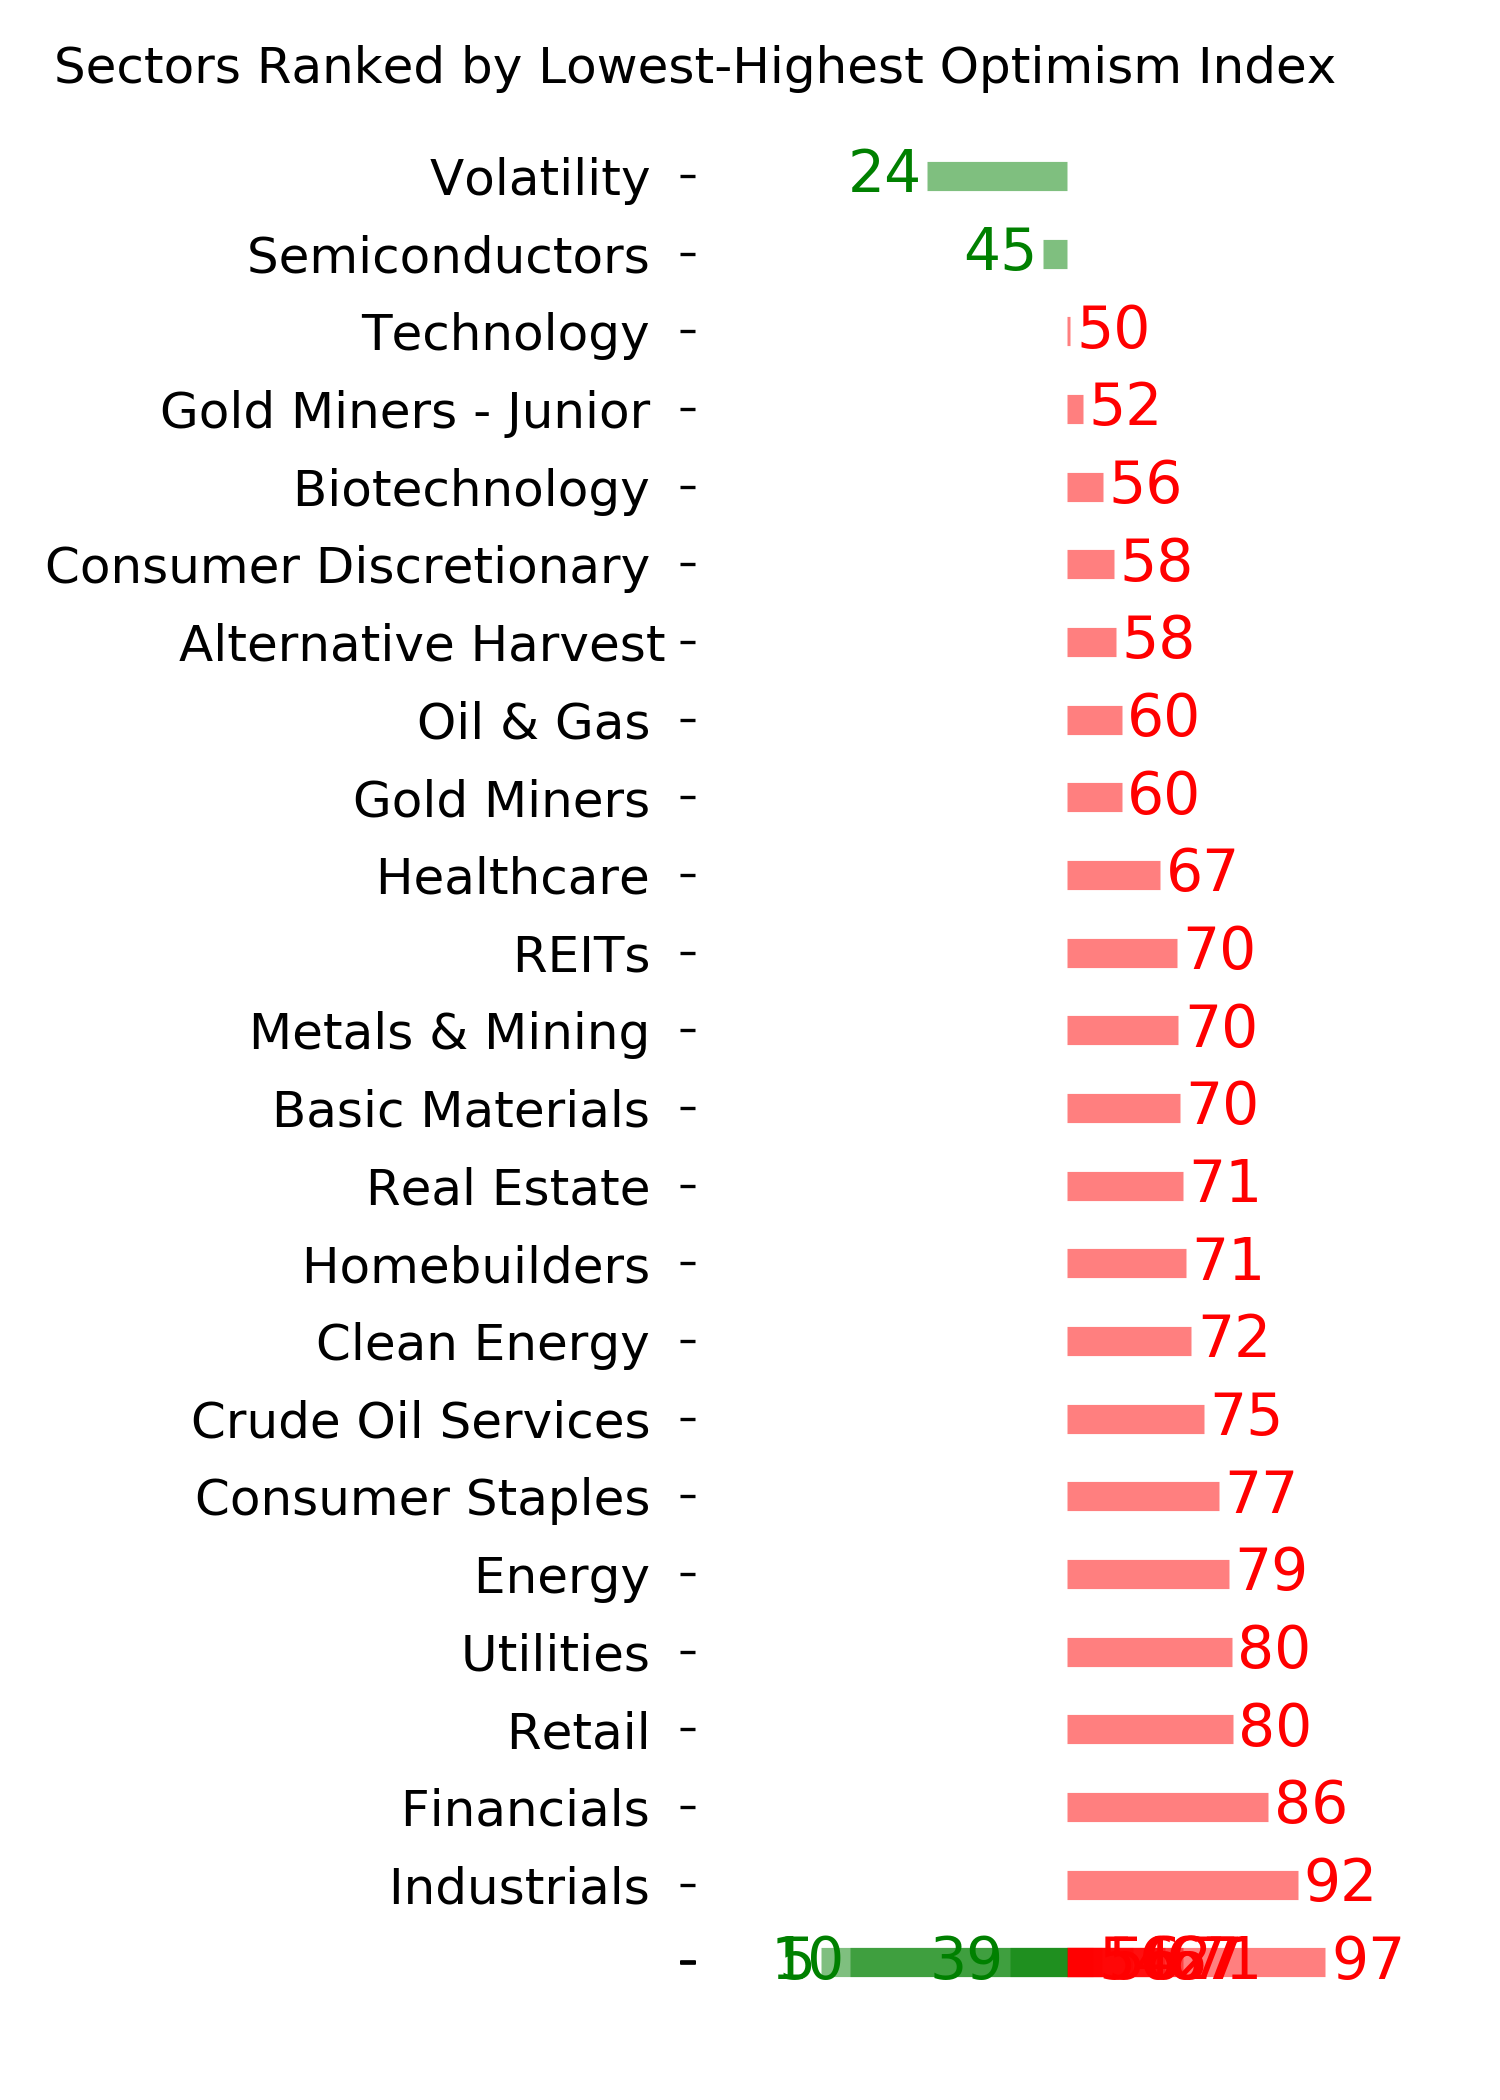
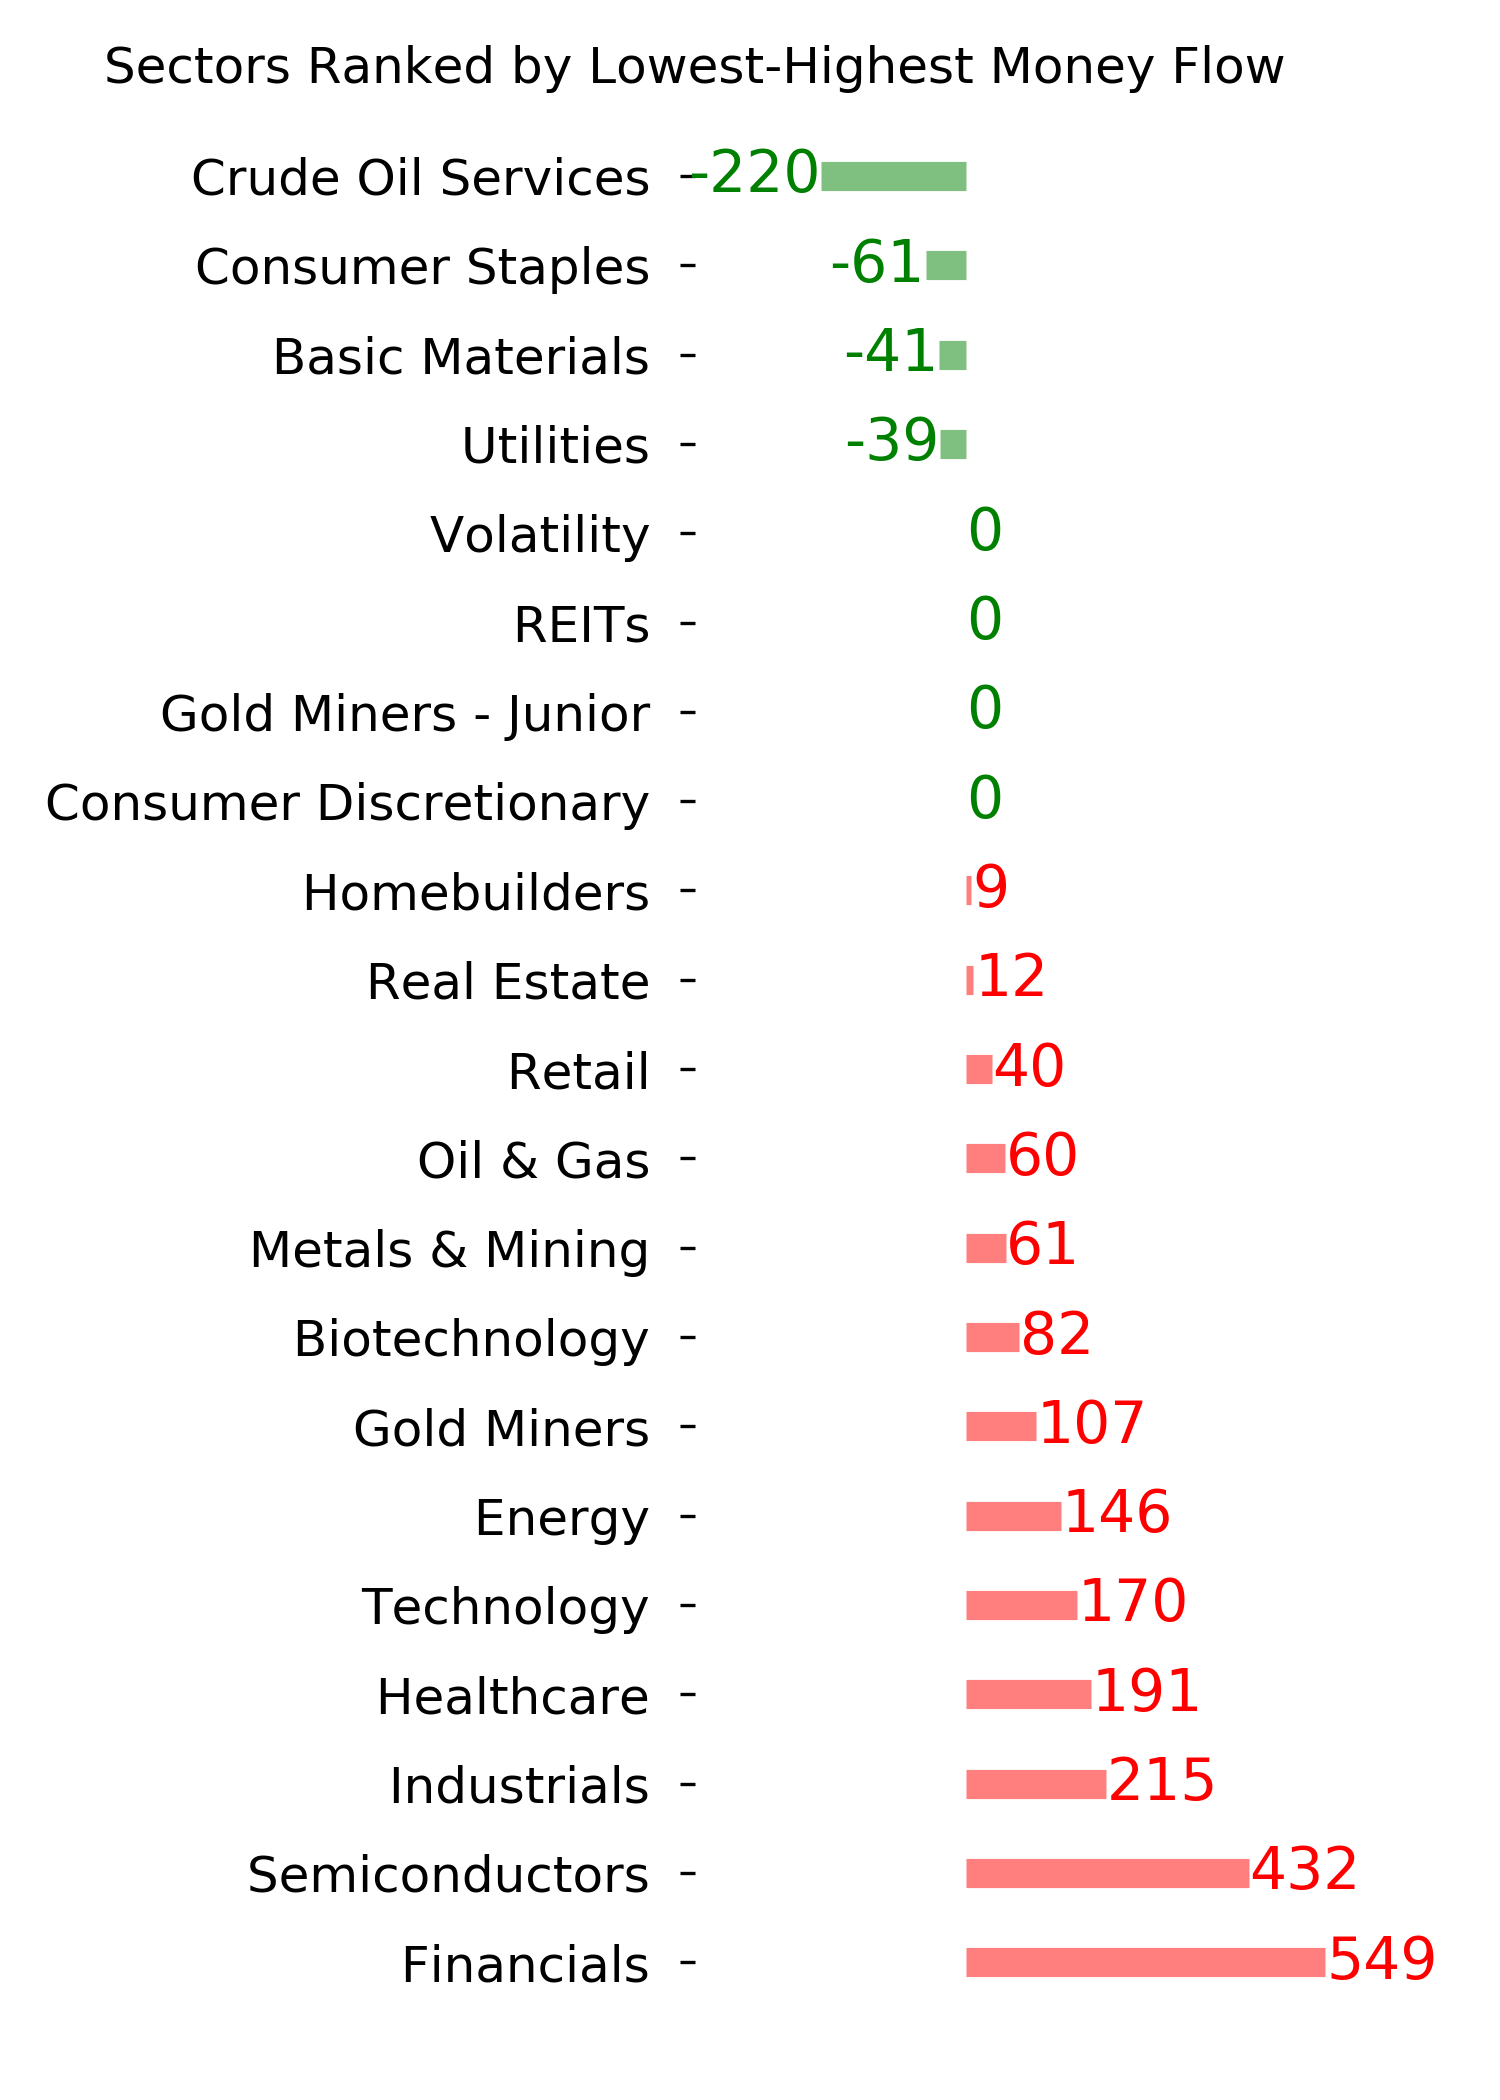
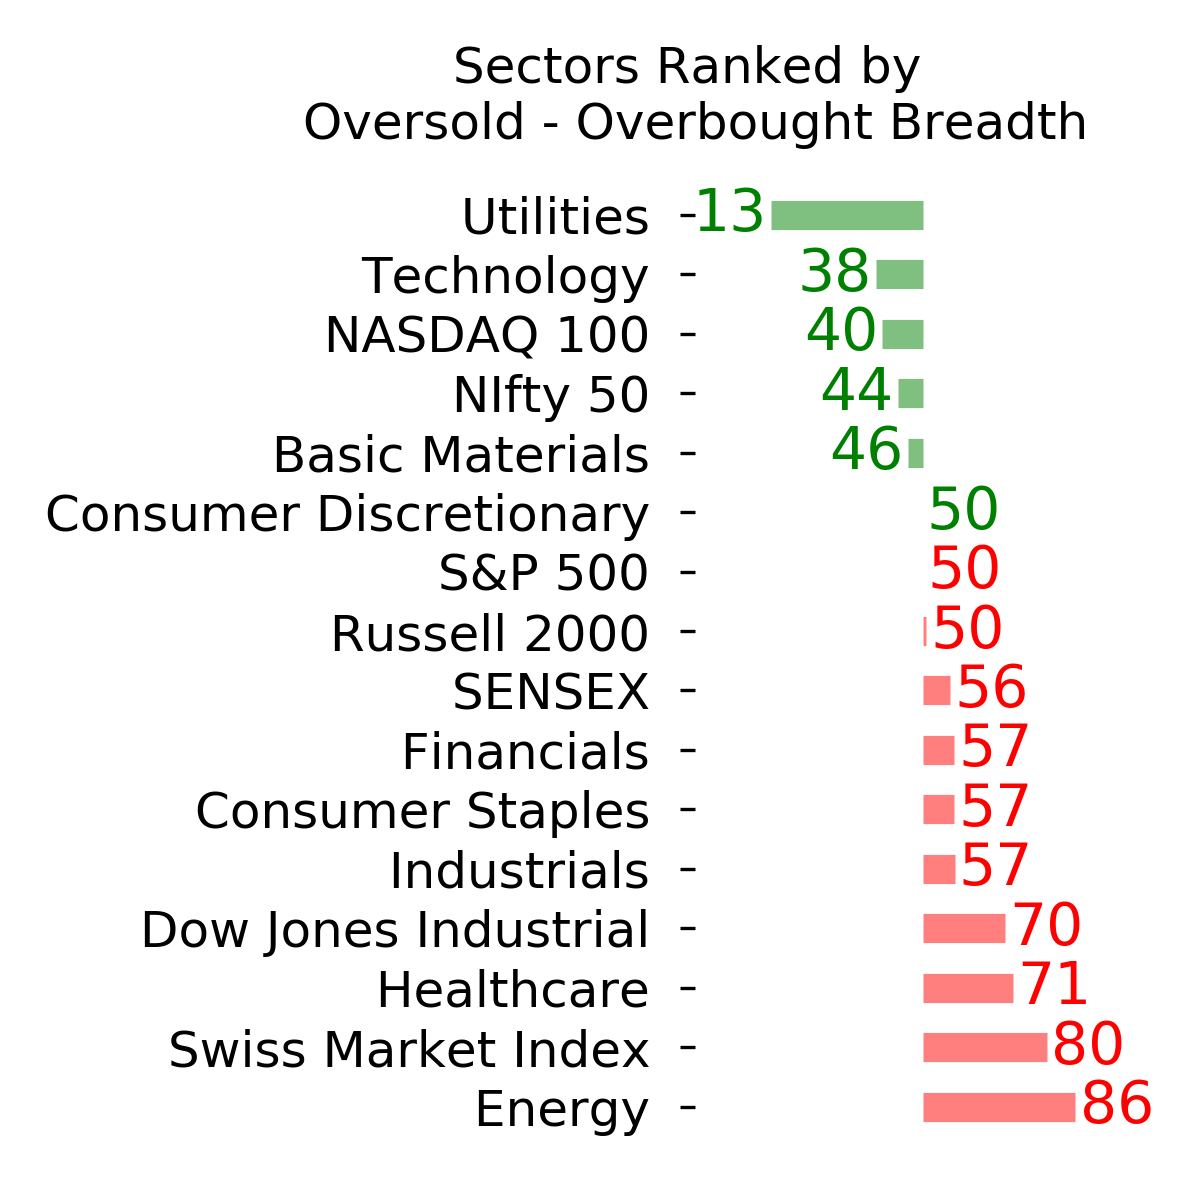
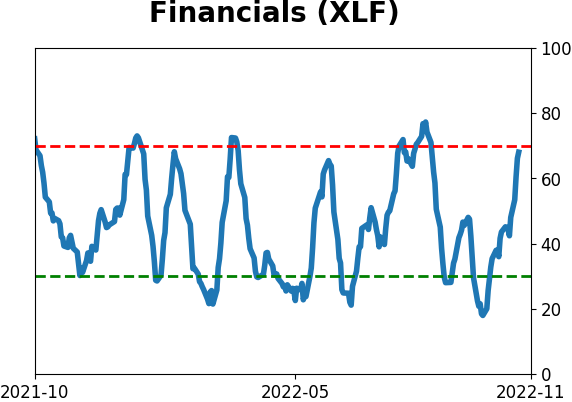
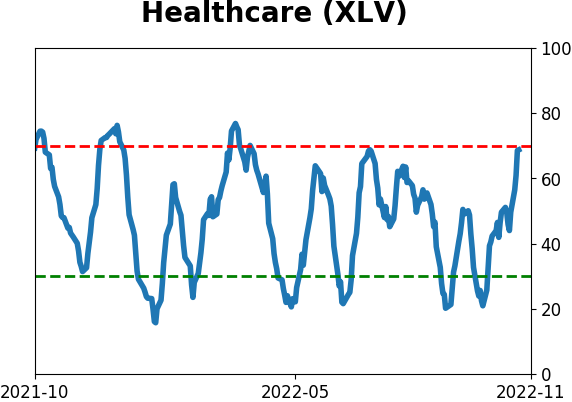
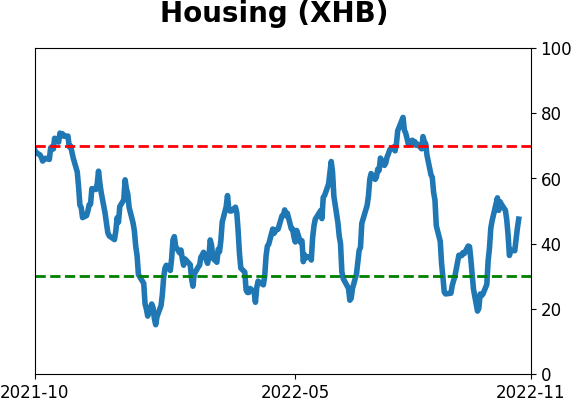
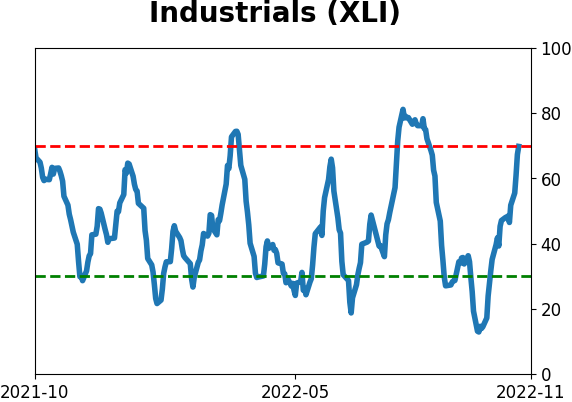
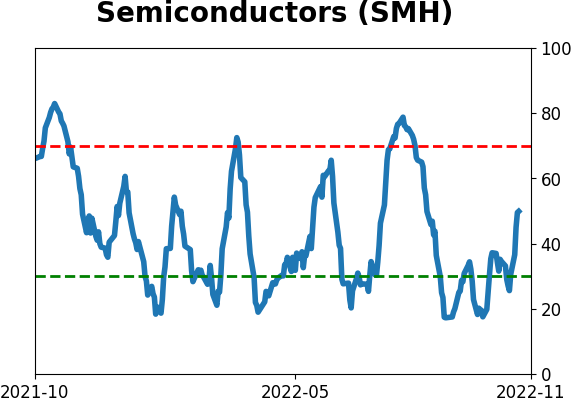
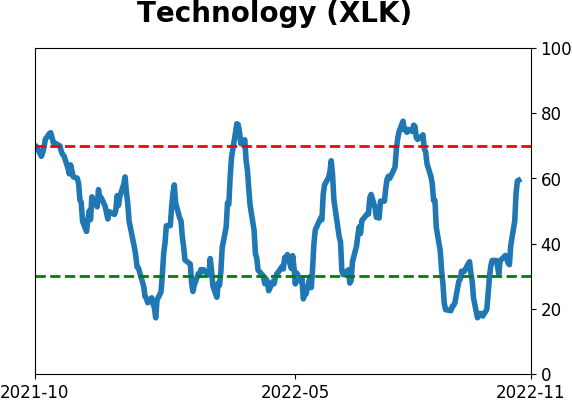
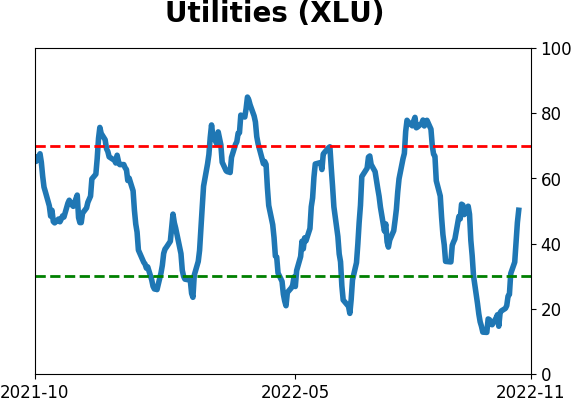
Sector ETF's - 10-Day Moving Average
|
|
|
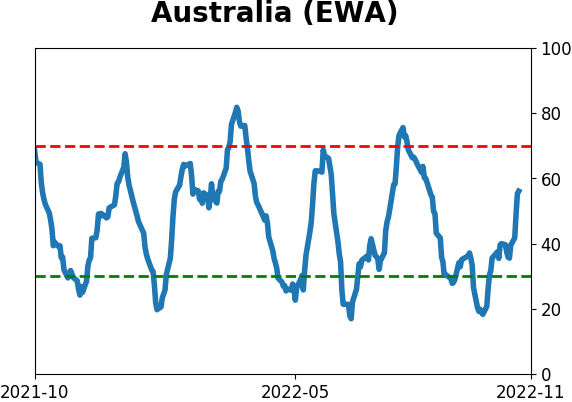
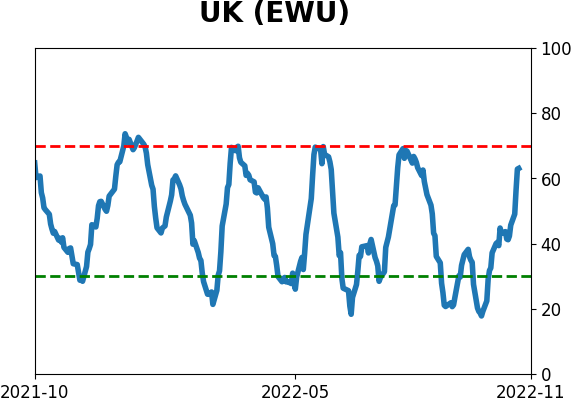
Country ETF's - 10-Day Moving Average
|
|
|
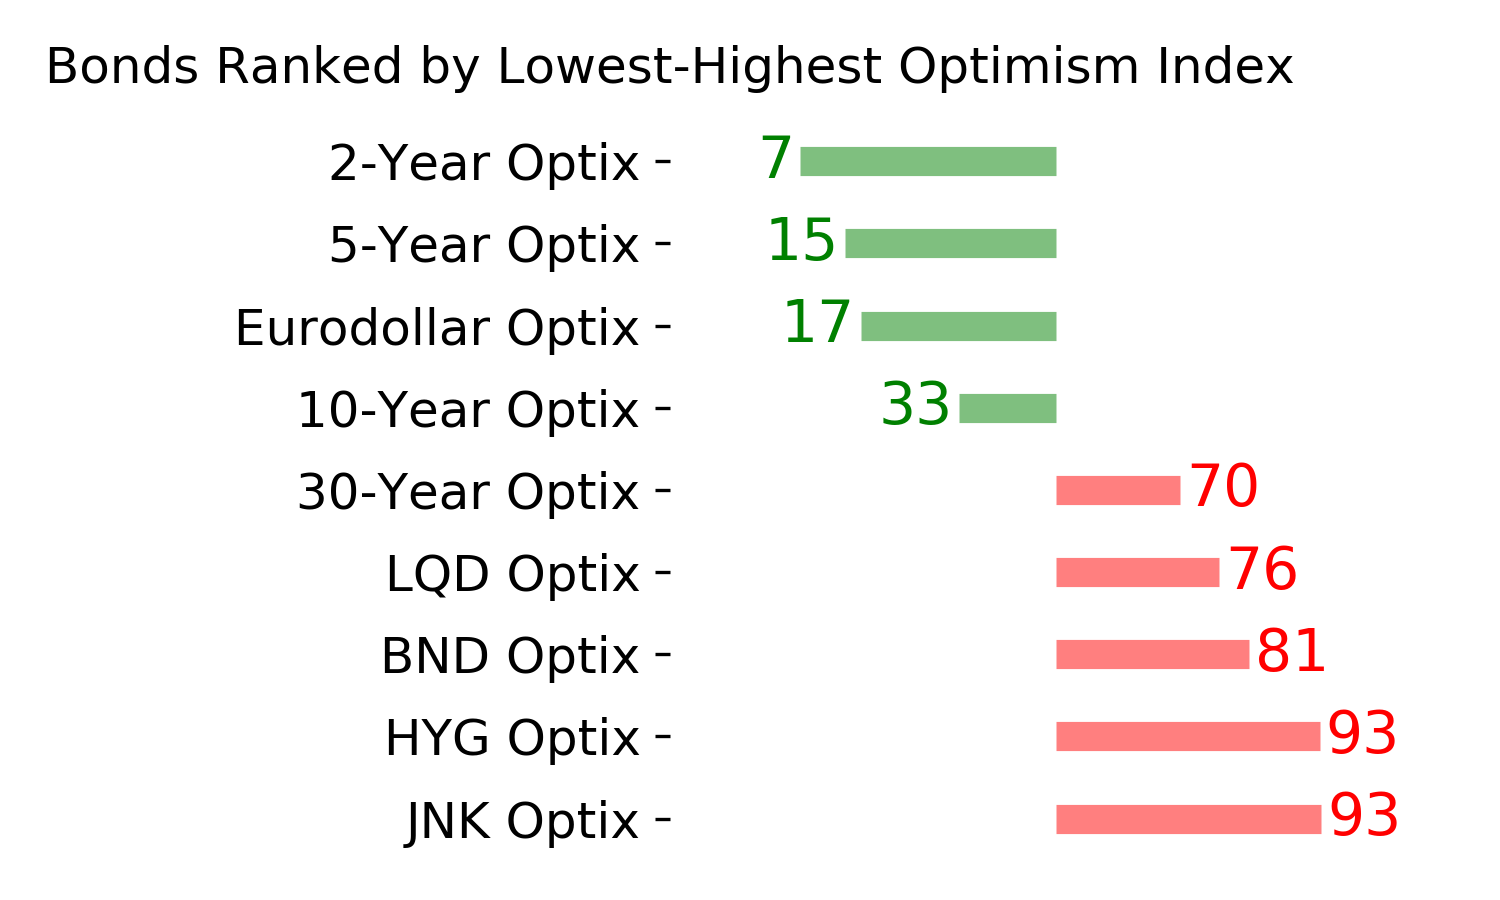
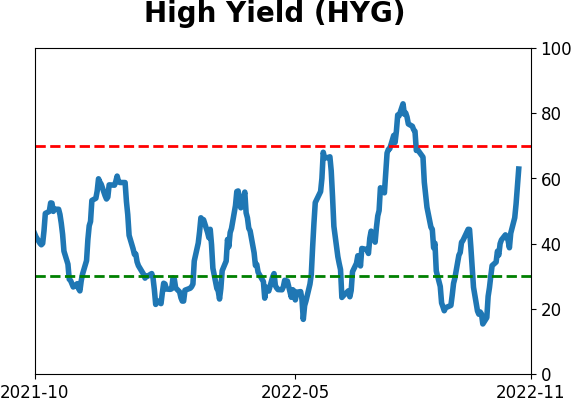
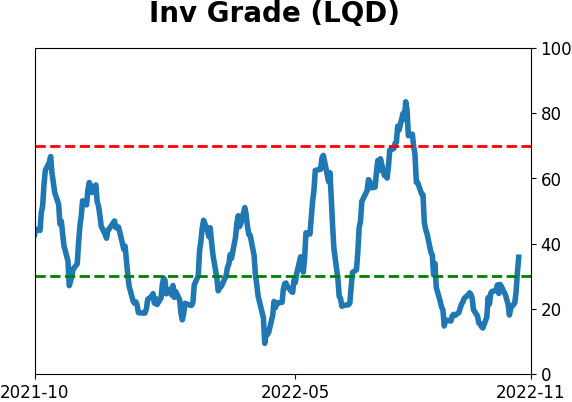
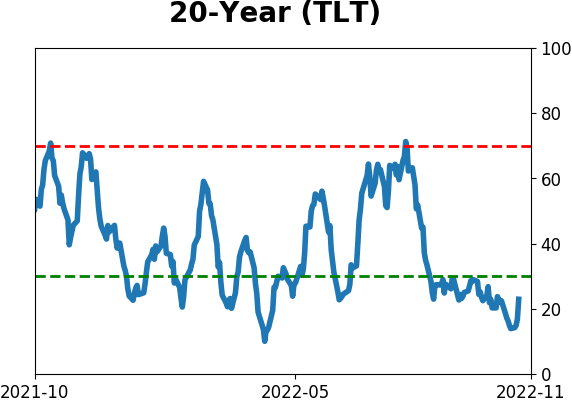
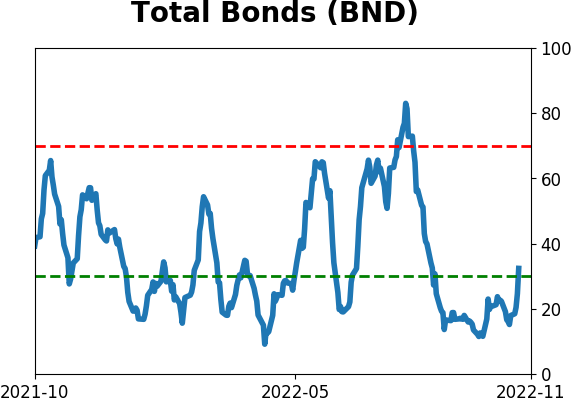
Bond ETF's - 10-Day Moving Average
|
|
|
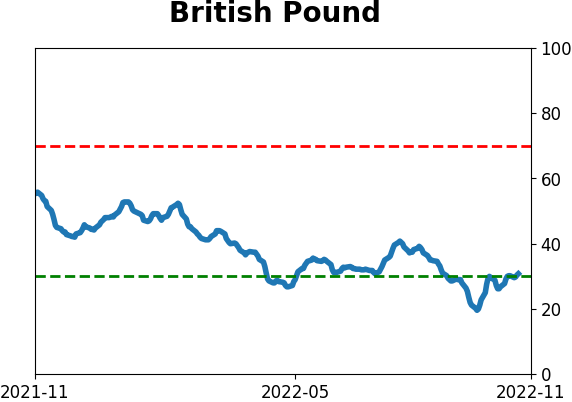
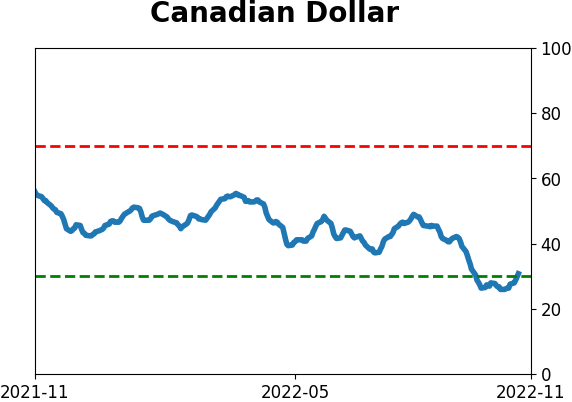
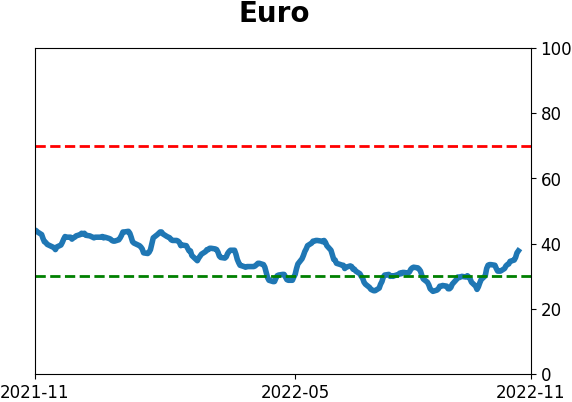
Currency ETF's - 5-Day Moving Average
|
|
|
Commodity ETF's - 5-Day Moving Average
|
|