Headlines
|
|
Every Basic Material stock is in a downtrend:
With a bout of heavy selling pressure in recent days, every stock in the Basic Materials sector has fallen below its 10-day and 50-day moving average. This is a near-washout level of pressure that tended to see long-term rebounds in the sector and the broader S&P 500 index.
|
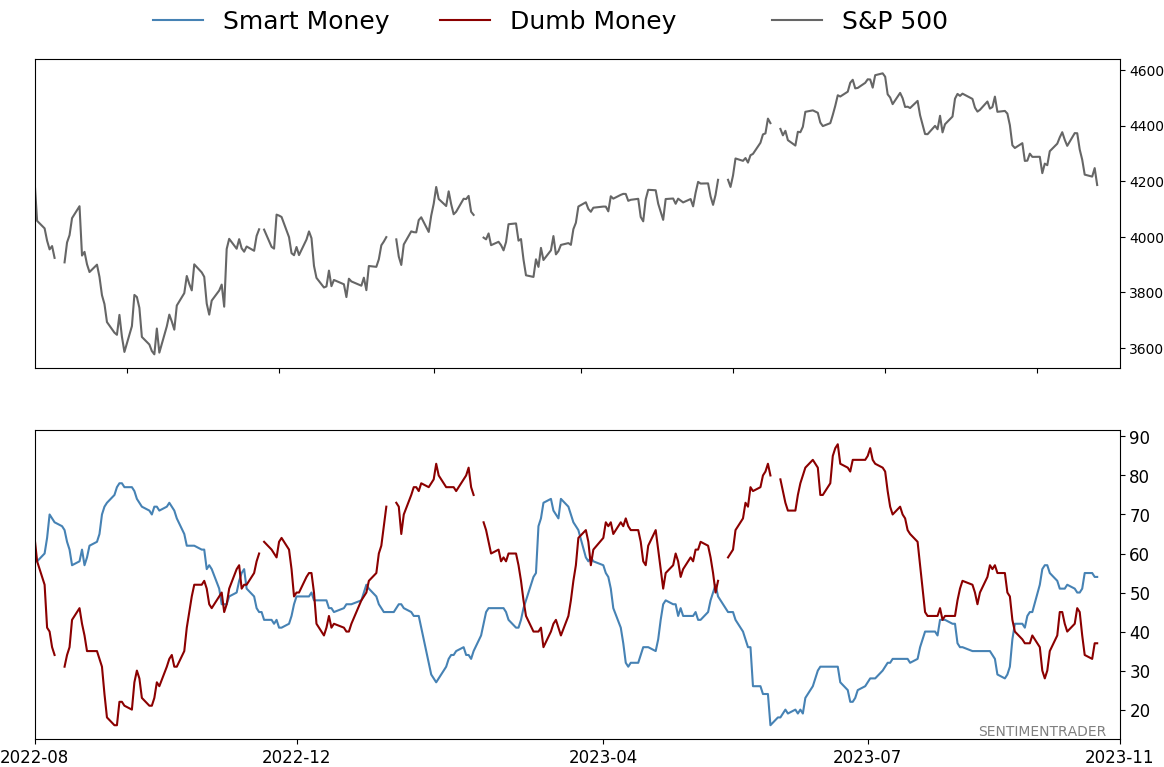
Smart / Dumb Money Confidence
|
Smart Money Confidence: 54%
Dumb Money Confidence: 37%
|
|
Risk Levels
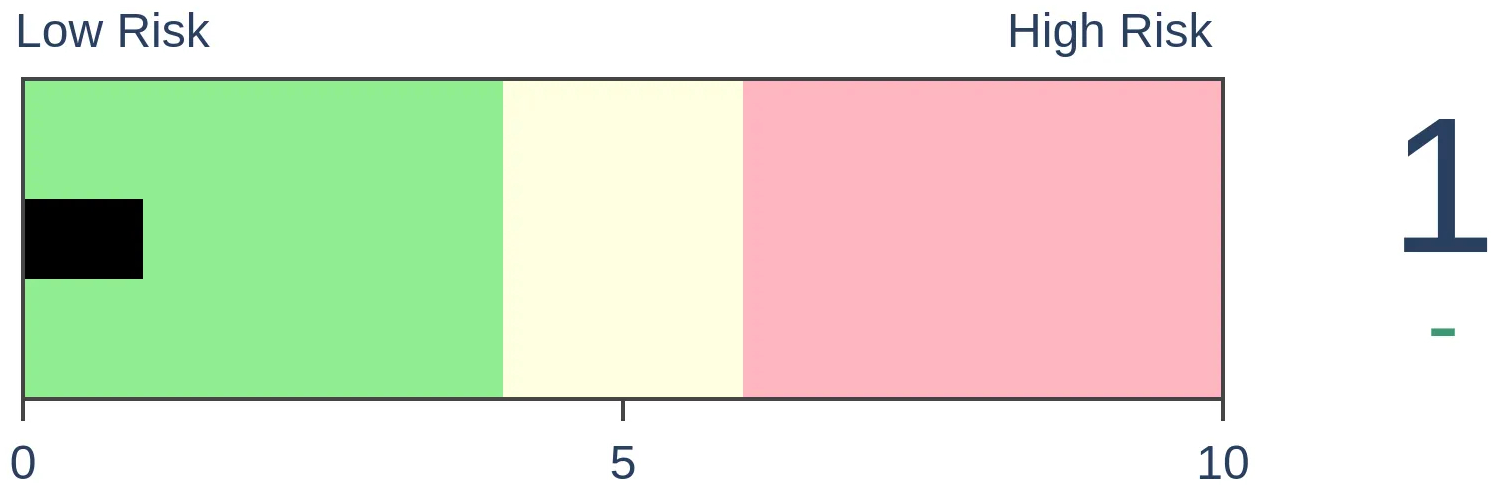
Stocks Short-Term
|
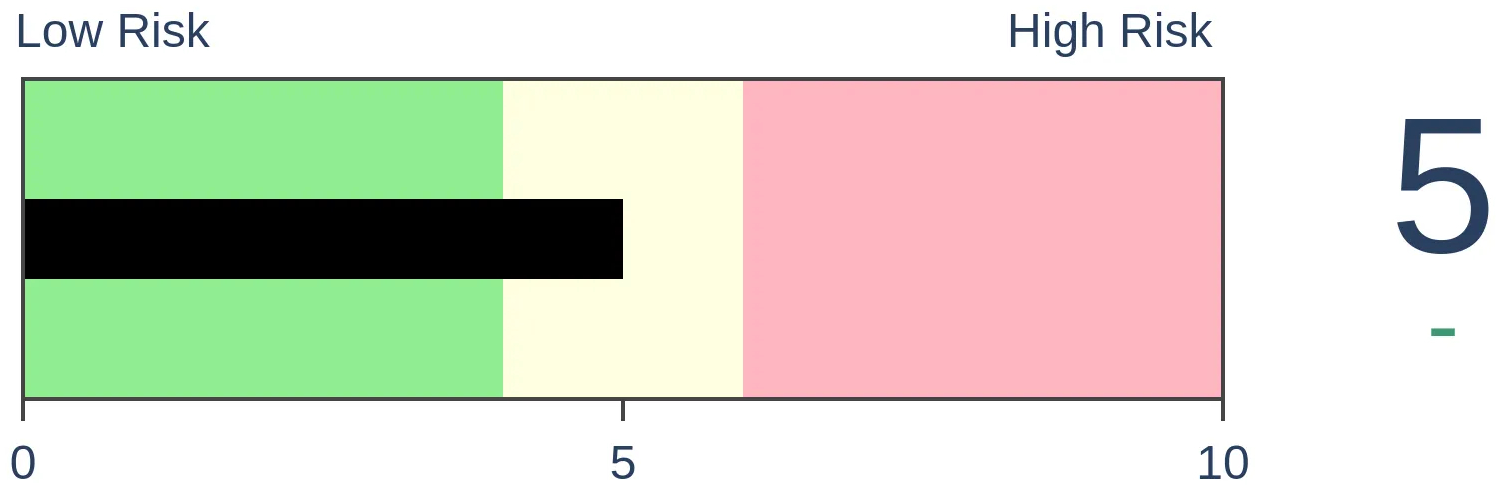
Stocks Medium-Term

|
|
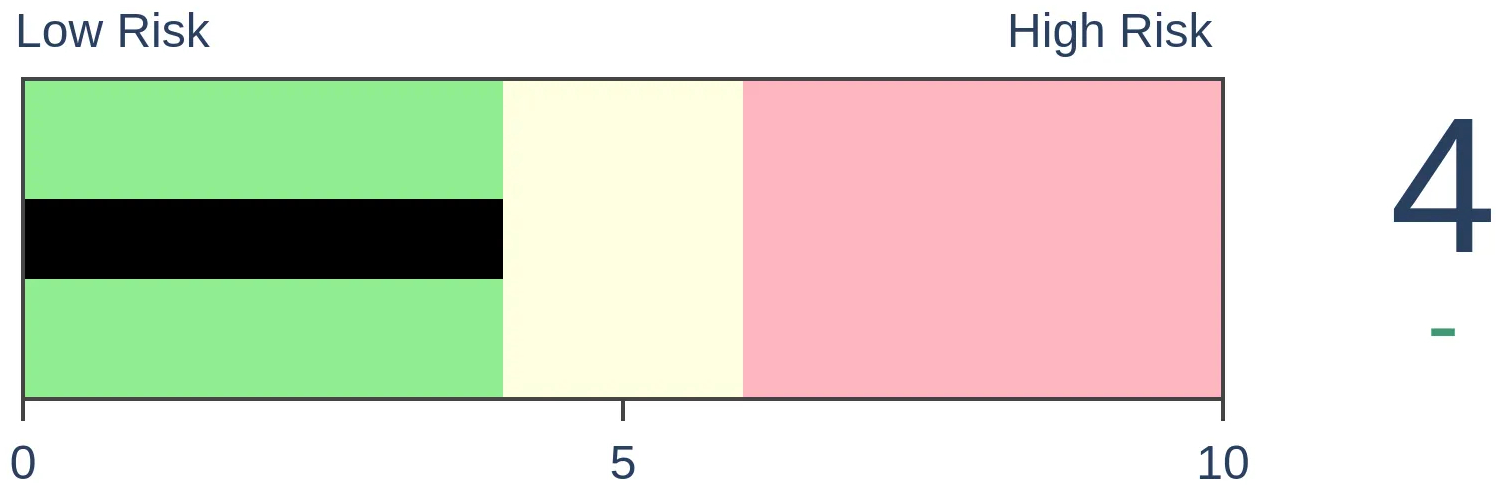
Bonds
|
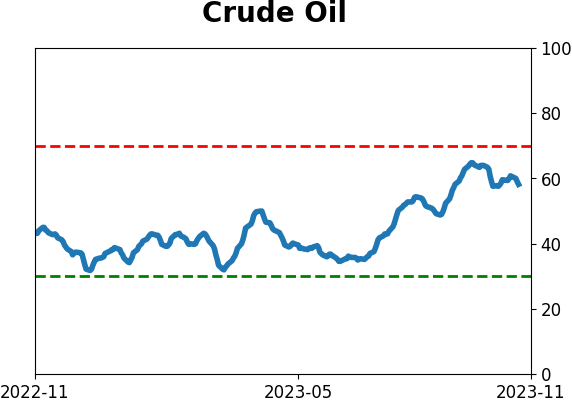
Crude Oil
|
|
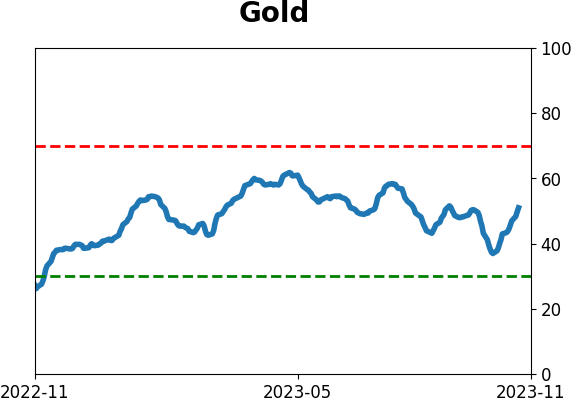
Gold
|
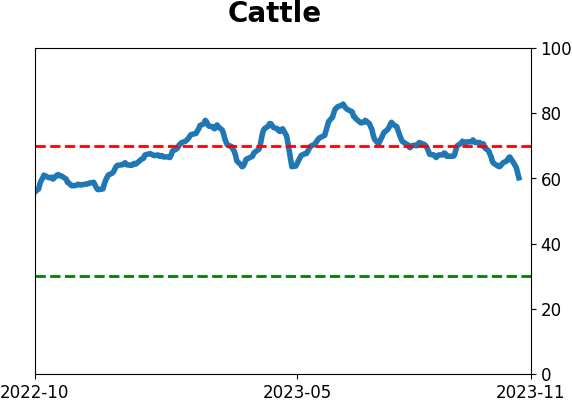
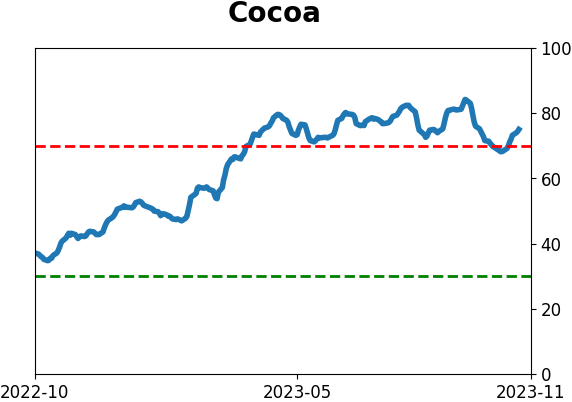
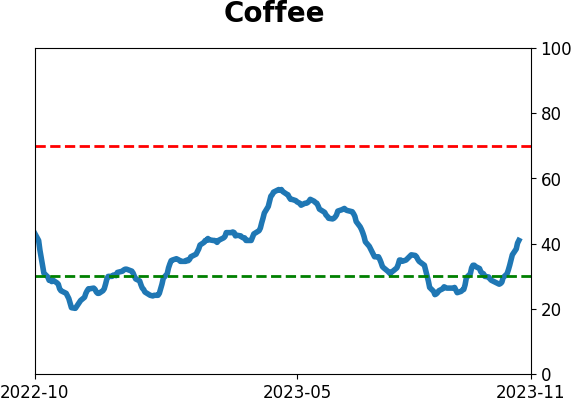
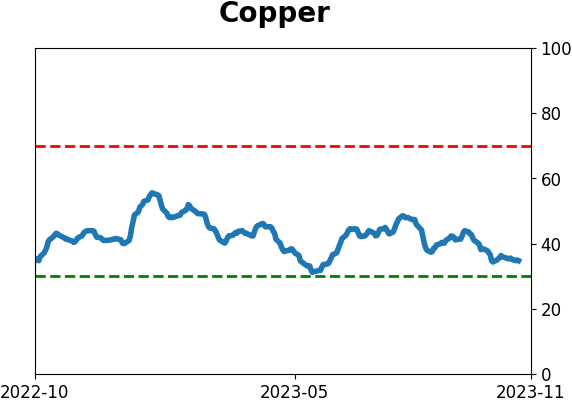
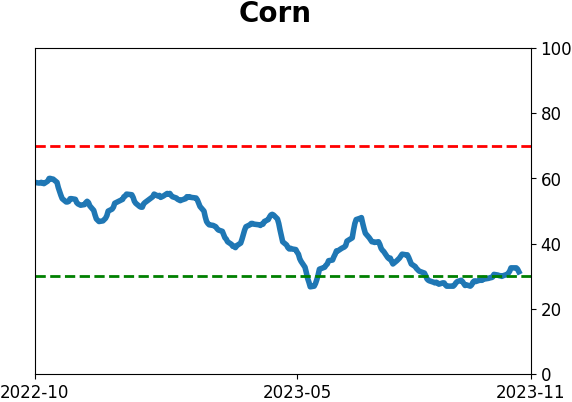
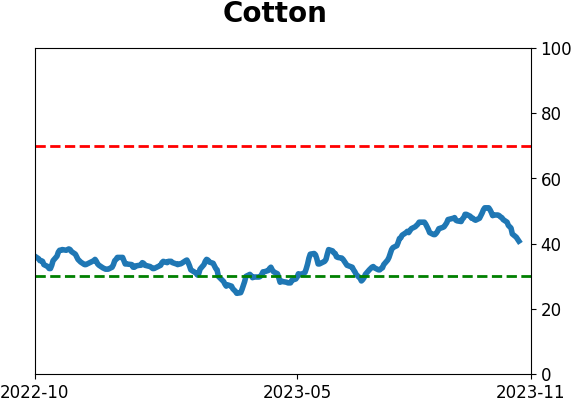
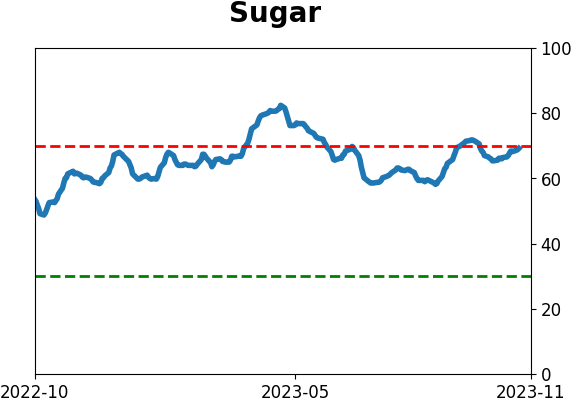
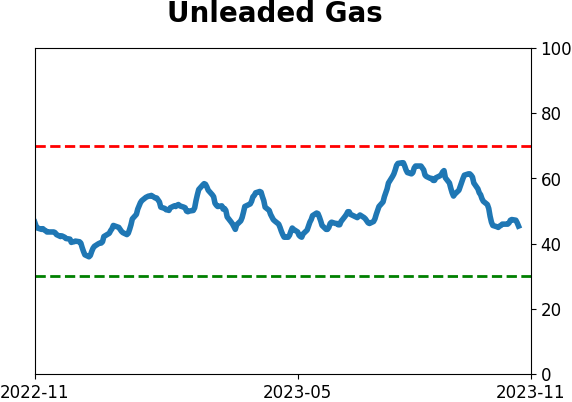
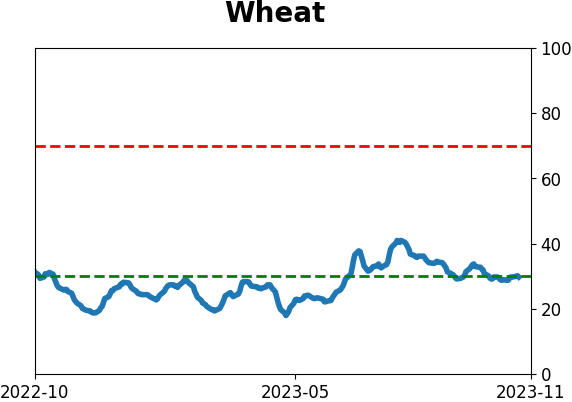
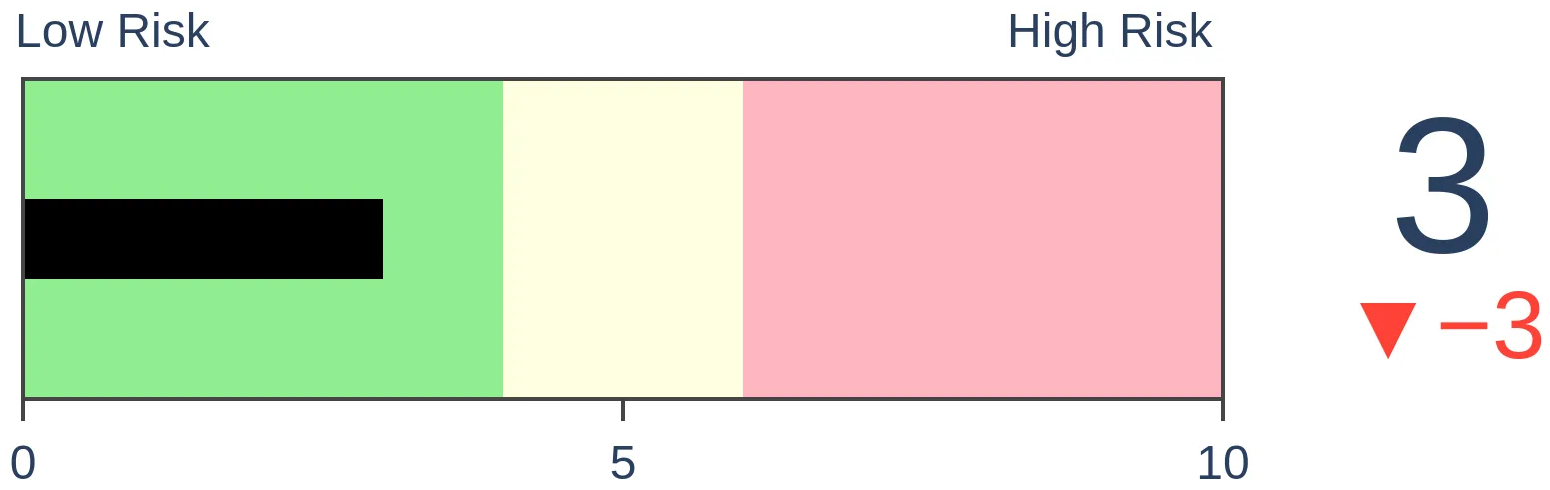
Agriculture

|
|
Research
By Jason Goepfert
BOTTOM LINE
With a bout of heavy selling pressure in recent days, every stock in the Basic Materials sector has fallen below its 10-day and 50-day moving average. This is a near-washout level of pressure that tended to see long-term rebounds in the sector and the broader S&P 500 index.
FORECAST / TIMEFRAME
None
|
Key points:
- Every stock in the Basic Materials sector is below its 10- and 50-day moving averages
- This is a near-washout level of selling pressure that has triggered only a handful of times in 70 years
- Similar behavior tended to precede strong long-term returns in the sector and broader S&P 500
No Materials stocks are in uptrends
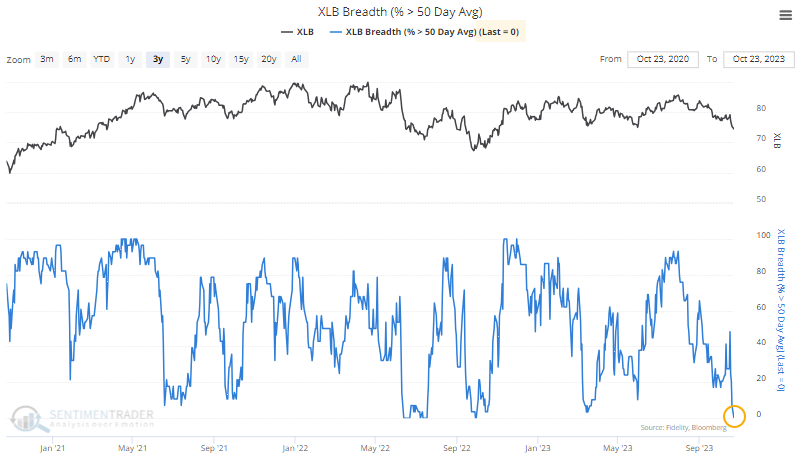
Thanks to some significant declines in the stocks of companies that focus on the underbelly of the economy, the Basic Materials index has given back all of its year-to-date gains. Big drops in stocks like International Flavors & Fragrances, Albermarle, Newmont, and Freeport-McMoRan have pushed the S&P sector into negative territory.
Declines in recent sessions have been especially severe, and it has caused every stock in the index to fail. Every stock in the Basic Materials sector has failed its short-term trend, below its 10-day moving average.
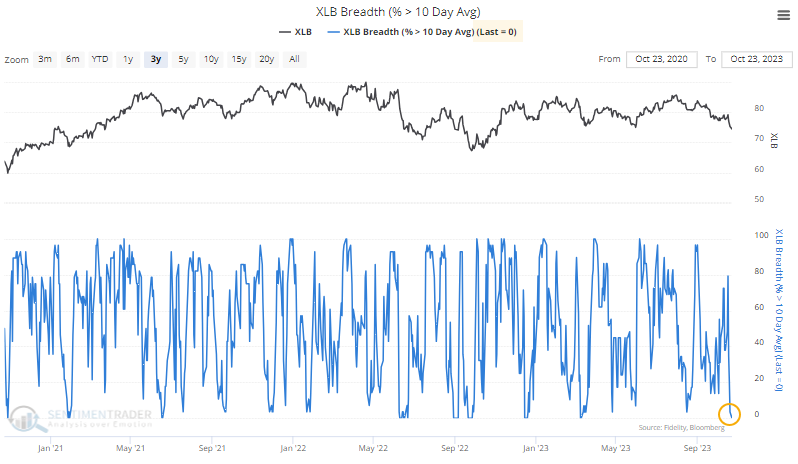
It's the same with medium-term trends - every stock is below its 50-day moving average.
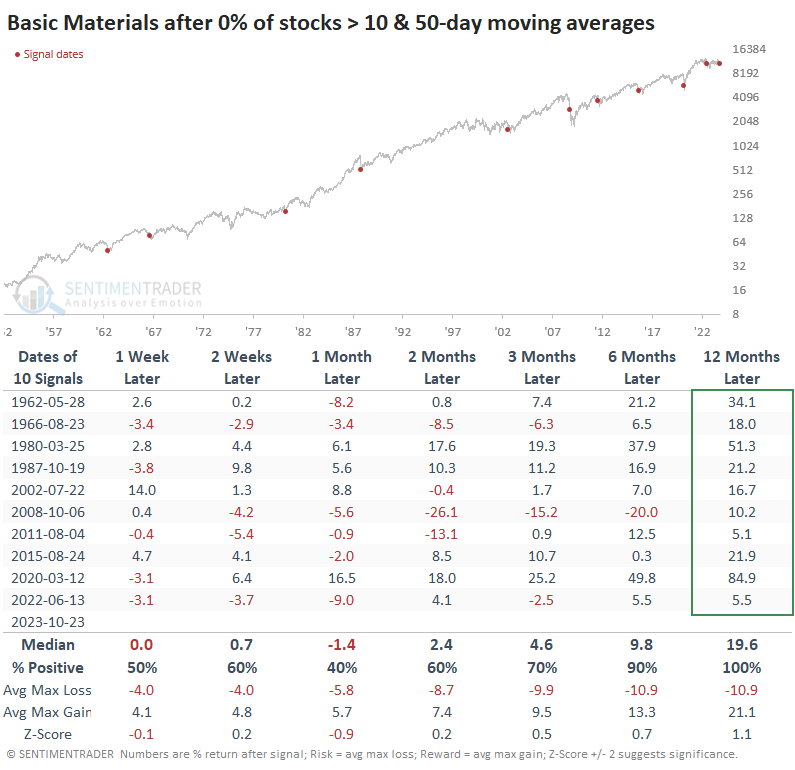
This is rare - we don't often see every stock in short- and medium-term downtrends. Over the past 70 years, it has happened only a handful of other times.
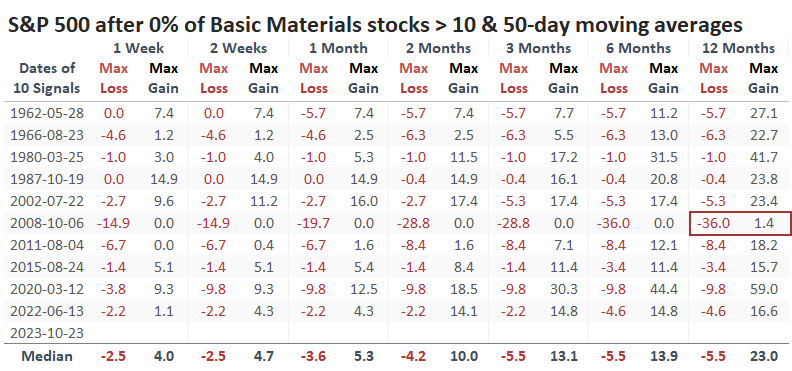
Lack of uptrends has typically signaled near-washout conditions
The table below shows every time since 1952 when this happened. While the last signal was not a great buying opportunity, with more than a 9% drawdown within a month, they all showed positive medium- to long-term returns.
Again, this was not without risk. The average drawdown of nearly -11% within the next year is relatively stiff, especially since the average maximum gain is only about twice that. We prefer to see a 3-to-1 reward-to-risk ratio to suggest a comfortable edge.
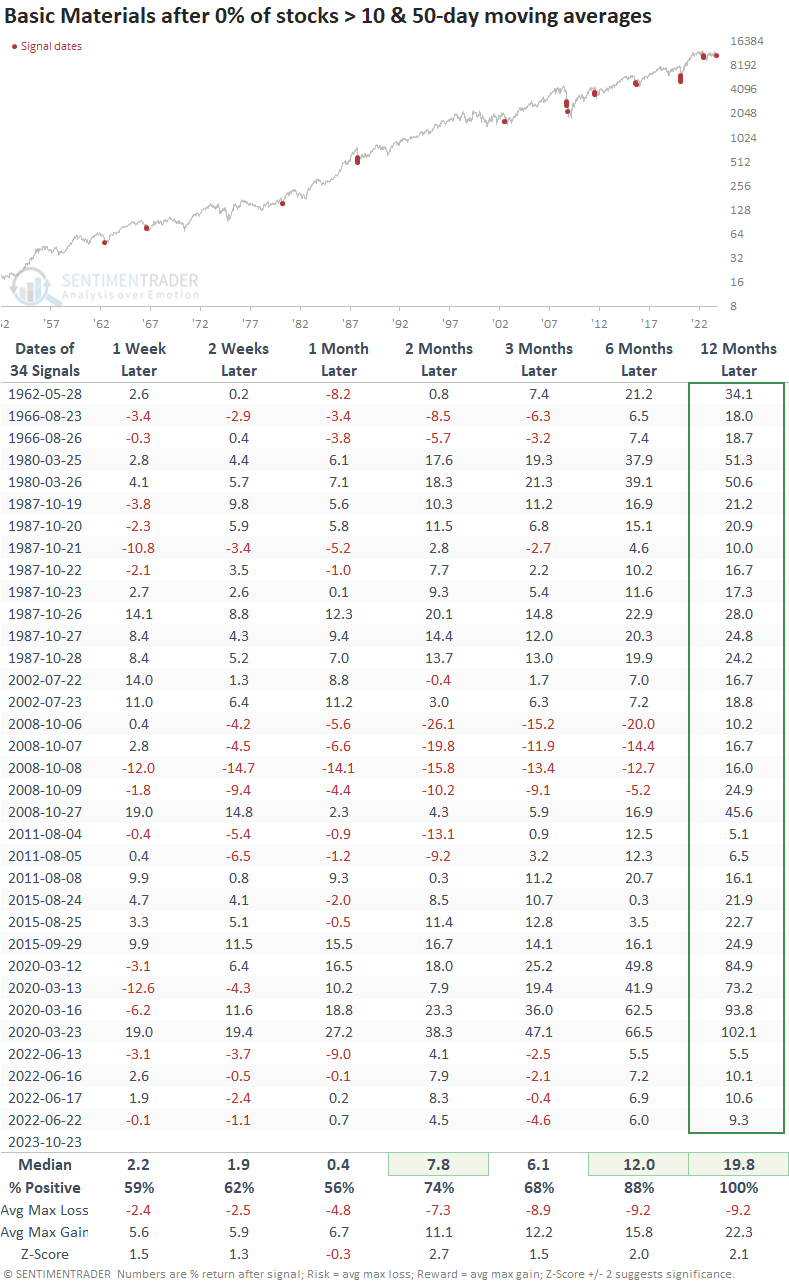
If we ignore distinct instances and just look at every single session when this was the case - when every stock was in a short- and medium-term downtrend - then we can see below that all 35 days sported a positive one-year return. Most of them were within weeks of an investable bottom, with the 2008 financial crisis being the primary exception.
Potential trouble in these raw material stocks didn't spill over into the broad market, though again, this is except the 2008 meltdown. Outside of that notable outlier, the S&P 500 index sported a positive return every time from 3-12 months later.
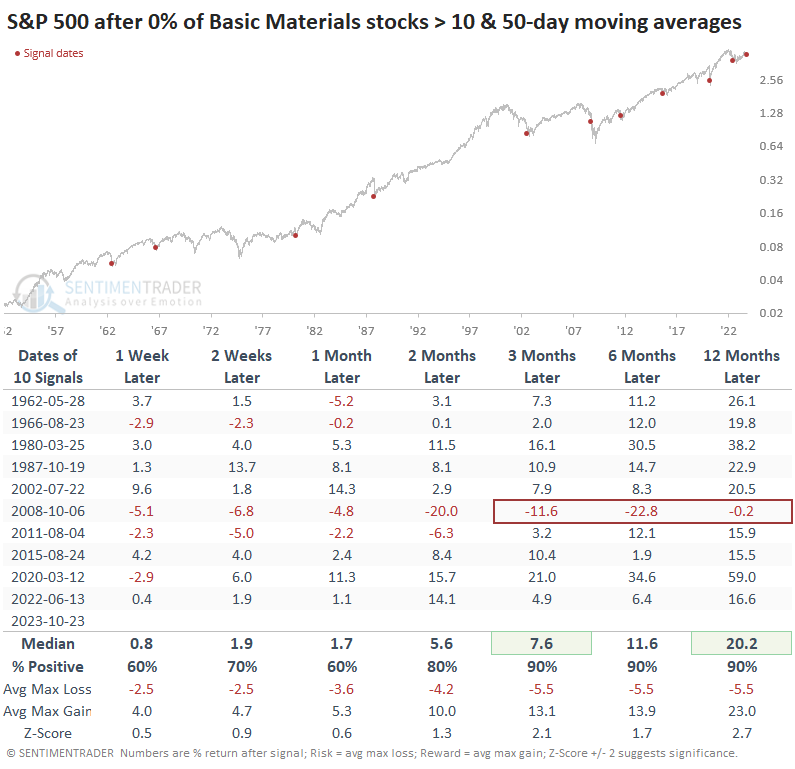
More impressively, the 2008 signal was the only one that saw the S&P decline more than -10% at any point within the following year.
What the research tells us...
The 2022 bear market was so devastating for financial assets that it seems like it broke the mindset of many investors. Without a place to hide, most investors witnessed portfolio-wide losses. That kind of thing tends to foster fear of a repeat. We've gone over many, many examples of fear-mongering over the past year, with some signal or another supposedly a sign that we're on the cusp of another crash. Almost all of those had little or no empirical support.
The decline in raw material stocks is another one of these supposed doomsday signs. Still, unless we're on the cusp of a 2008 repeat, there is again little empirical support that their complete lack of short- and medium-term uptrends is an ominous sign.
Indicators at Extremes
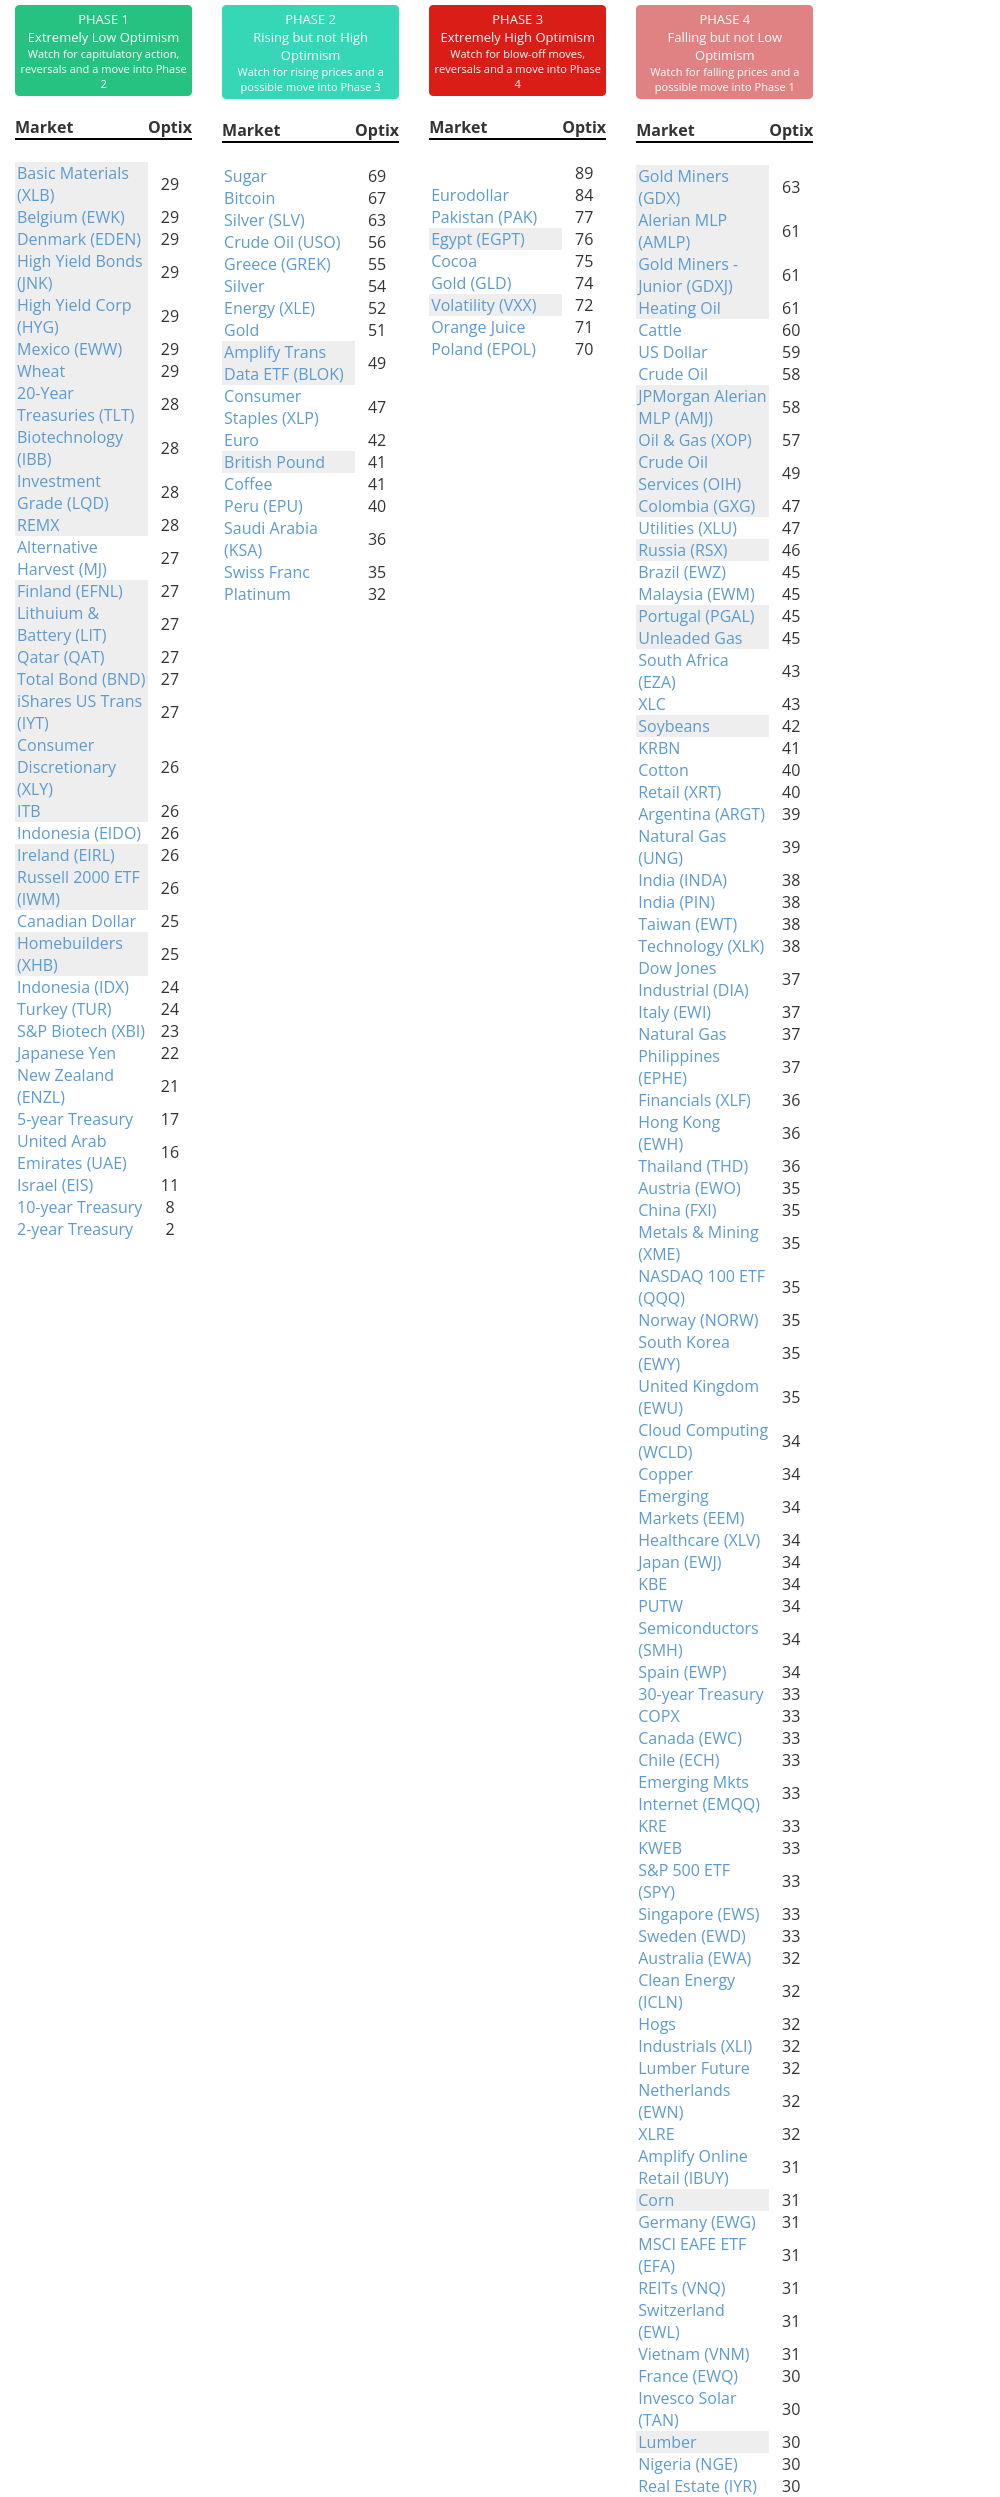
Phase Table
Ranks
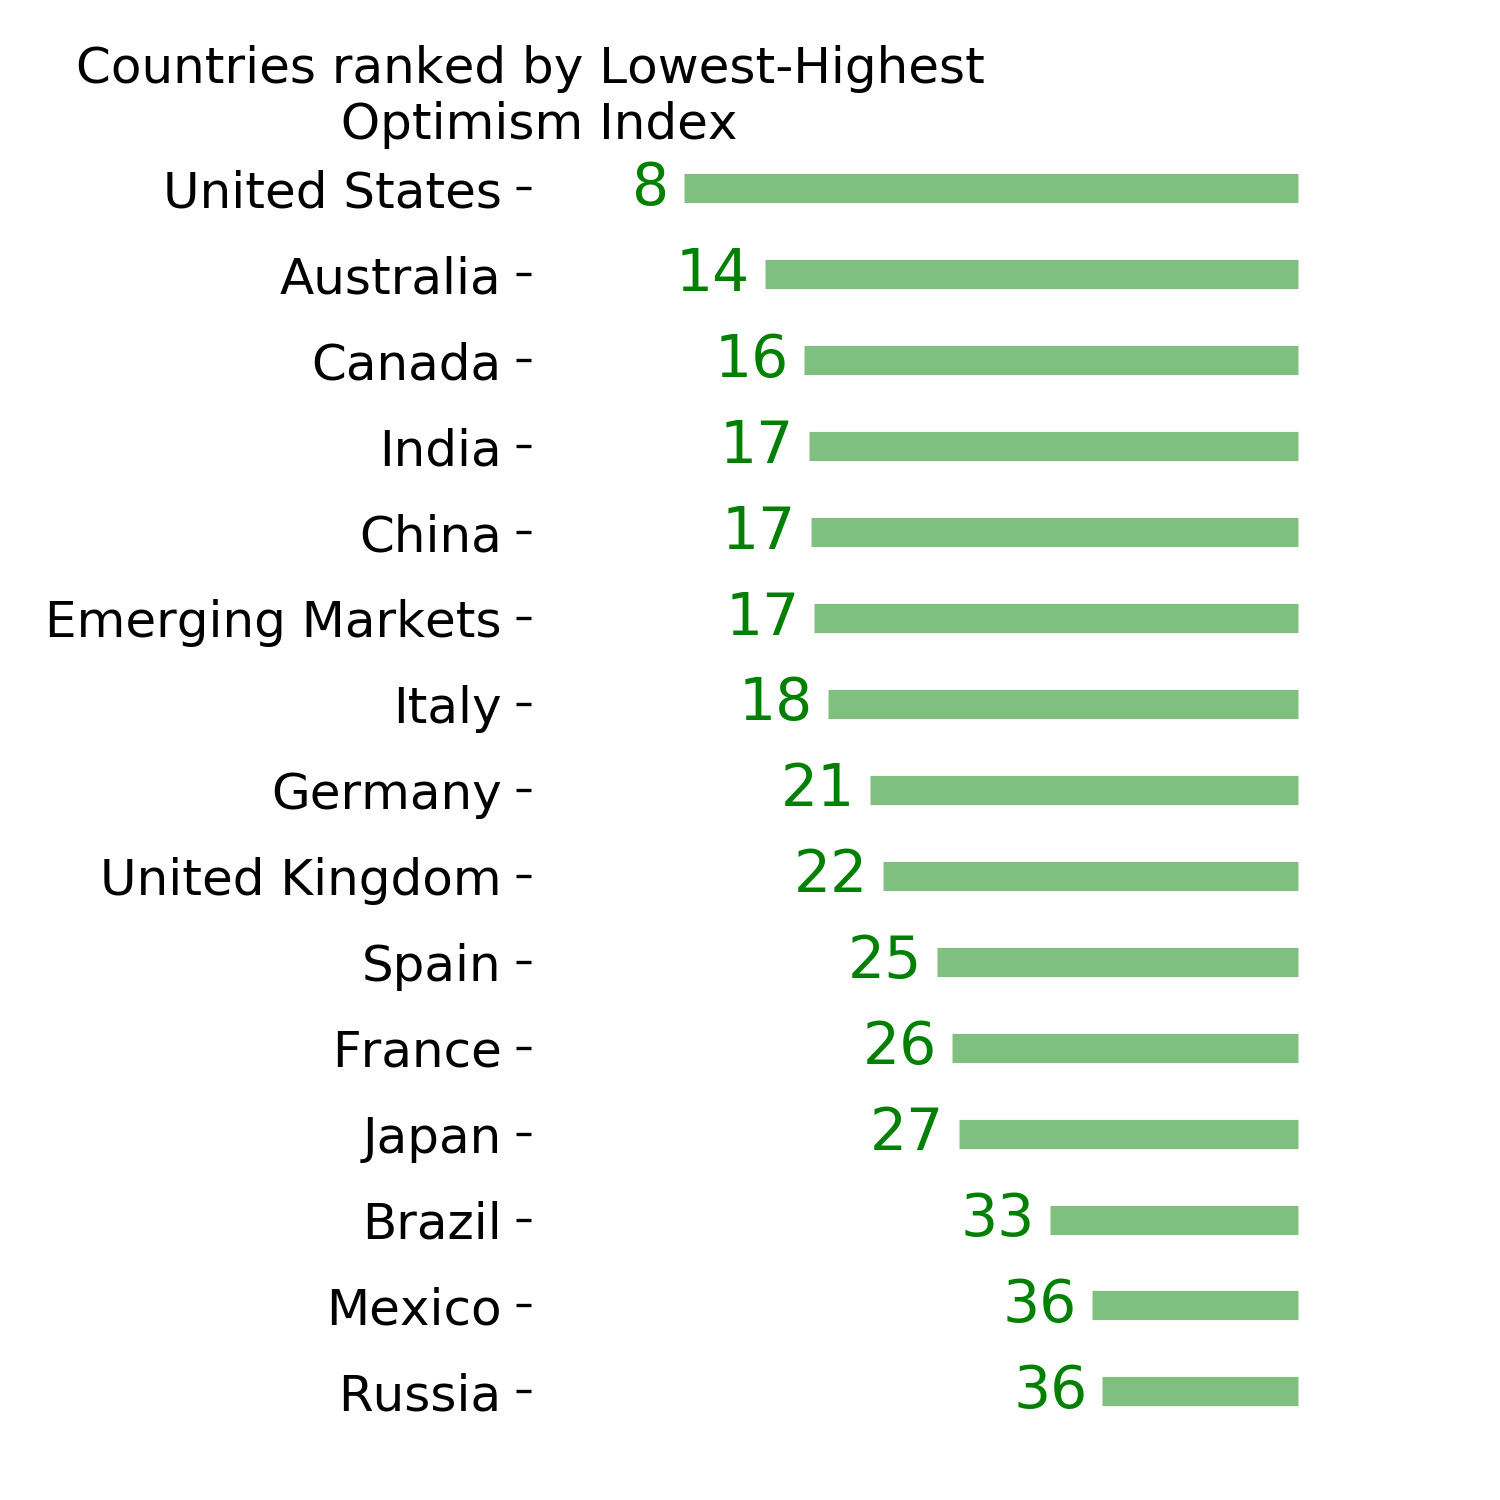
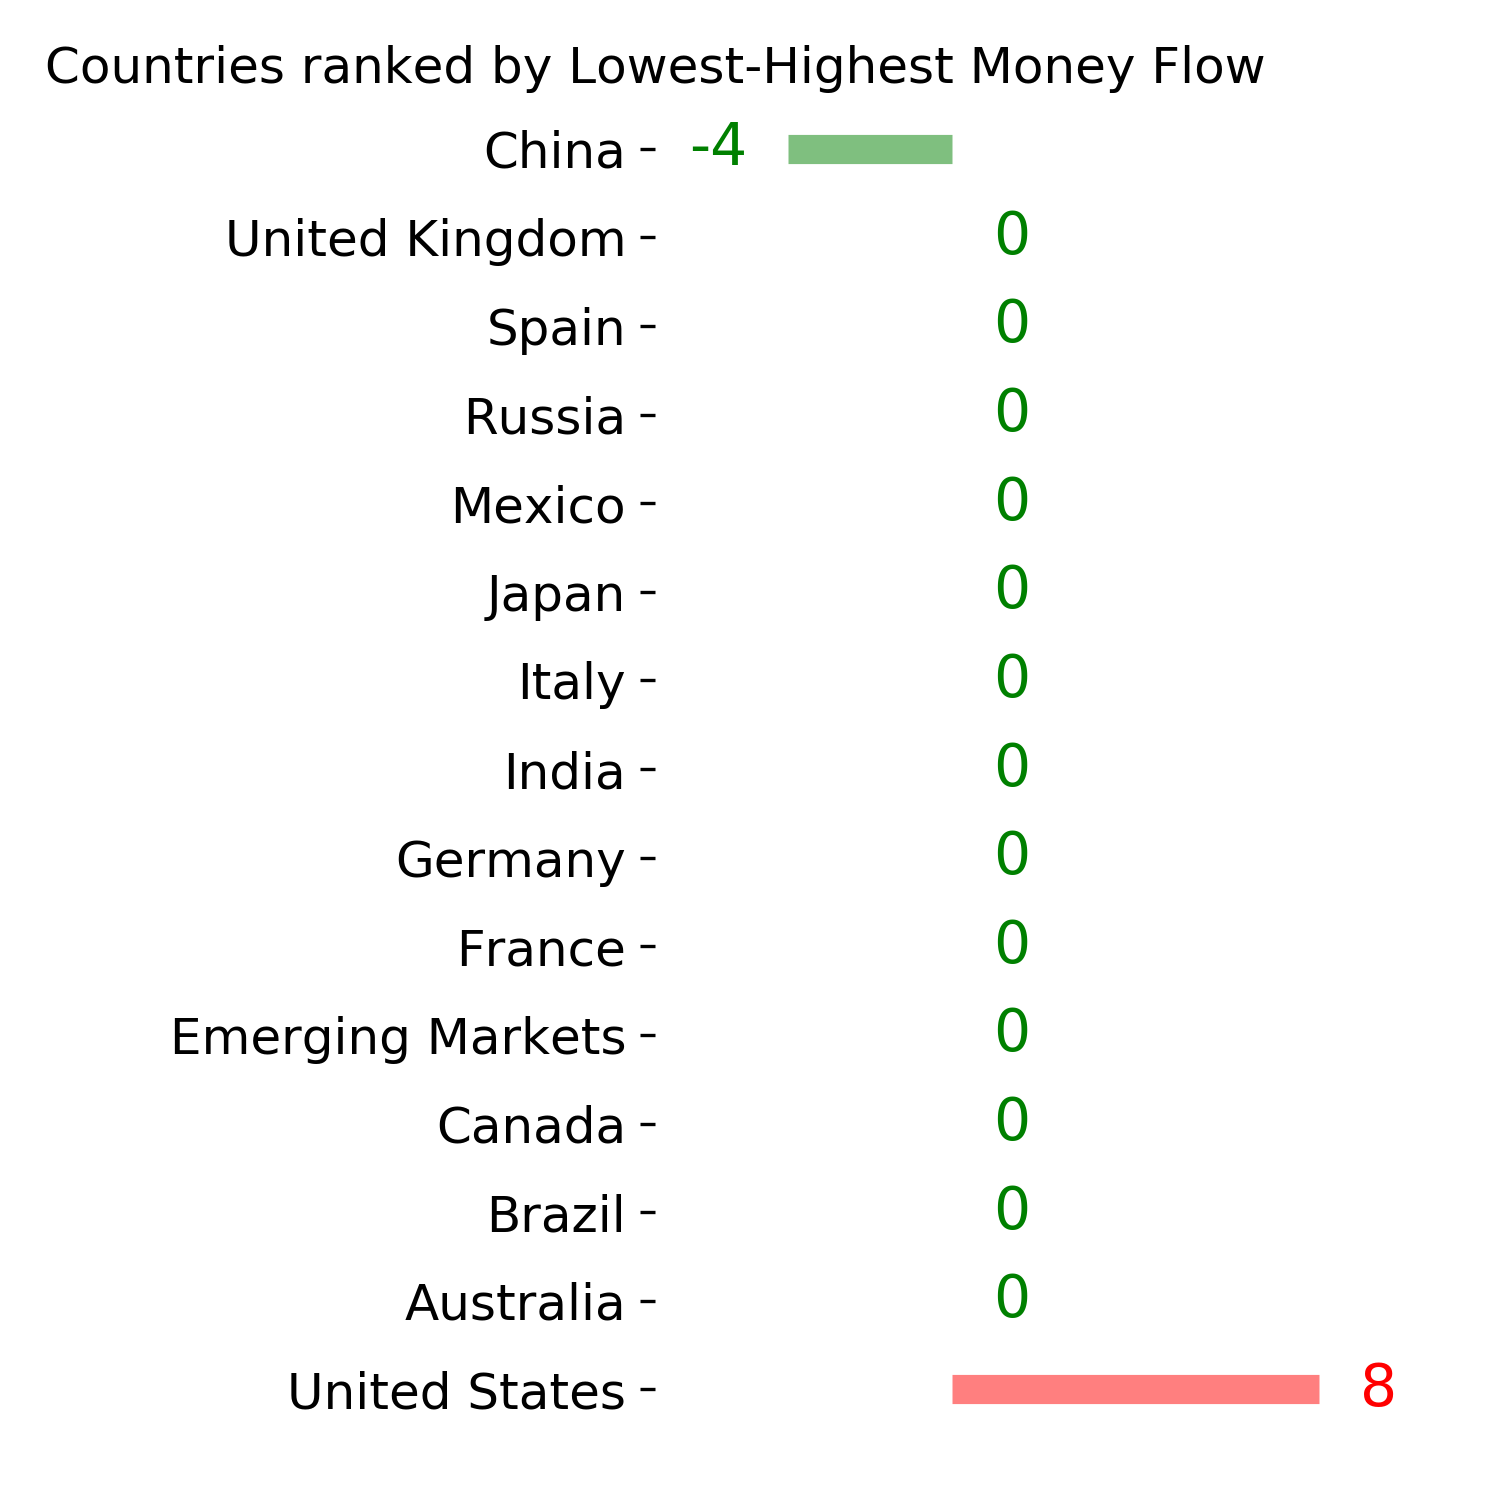
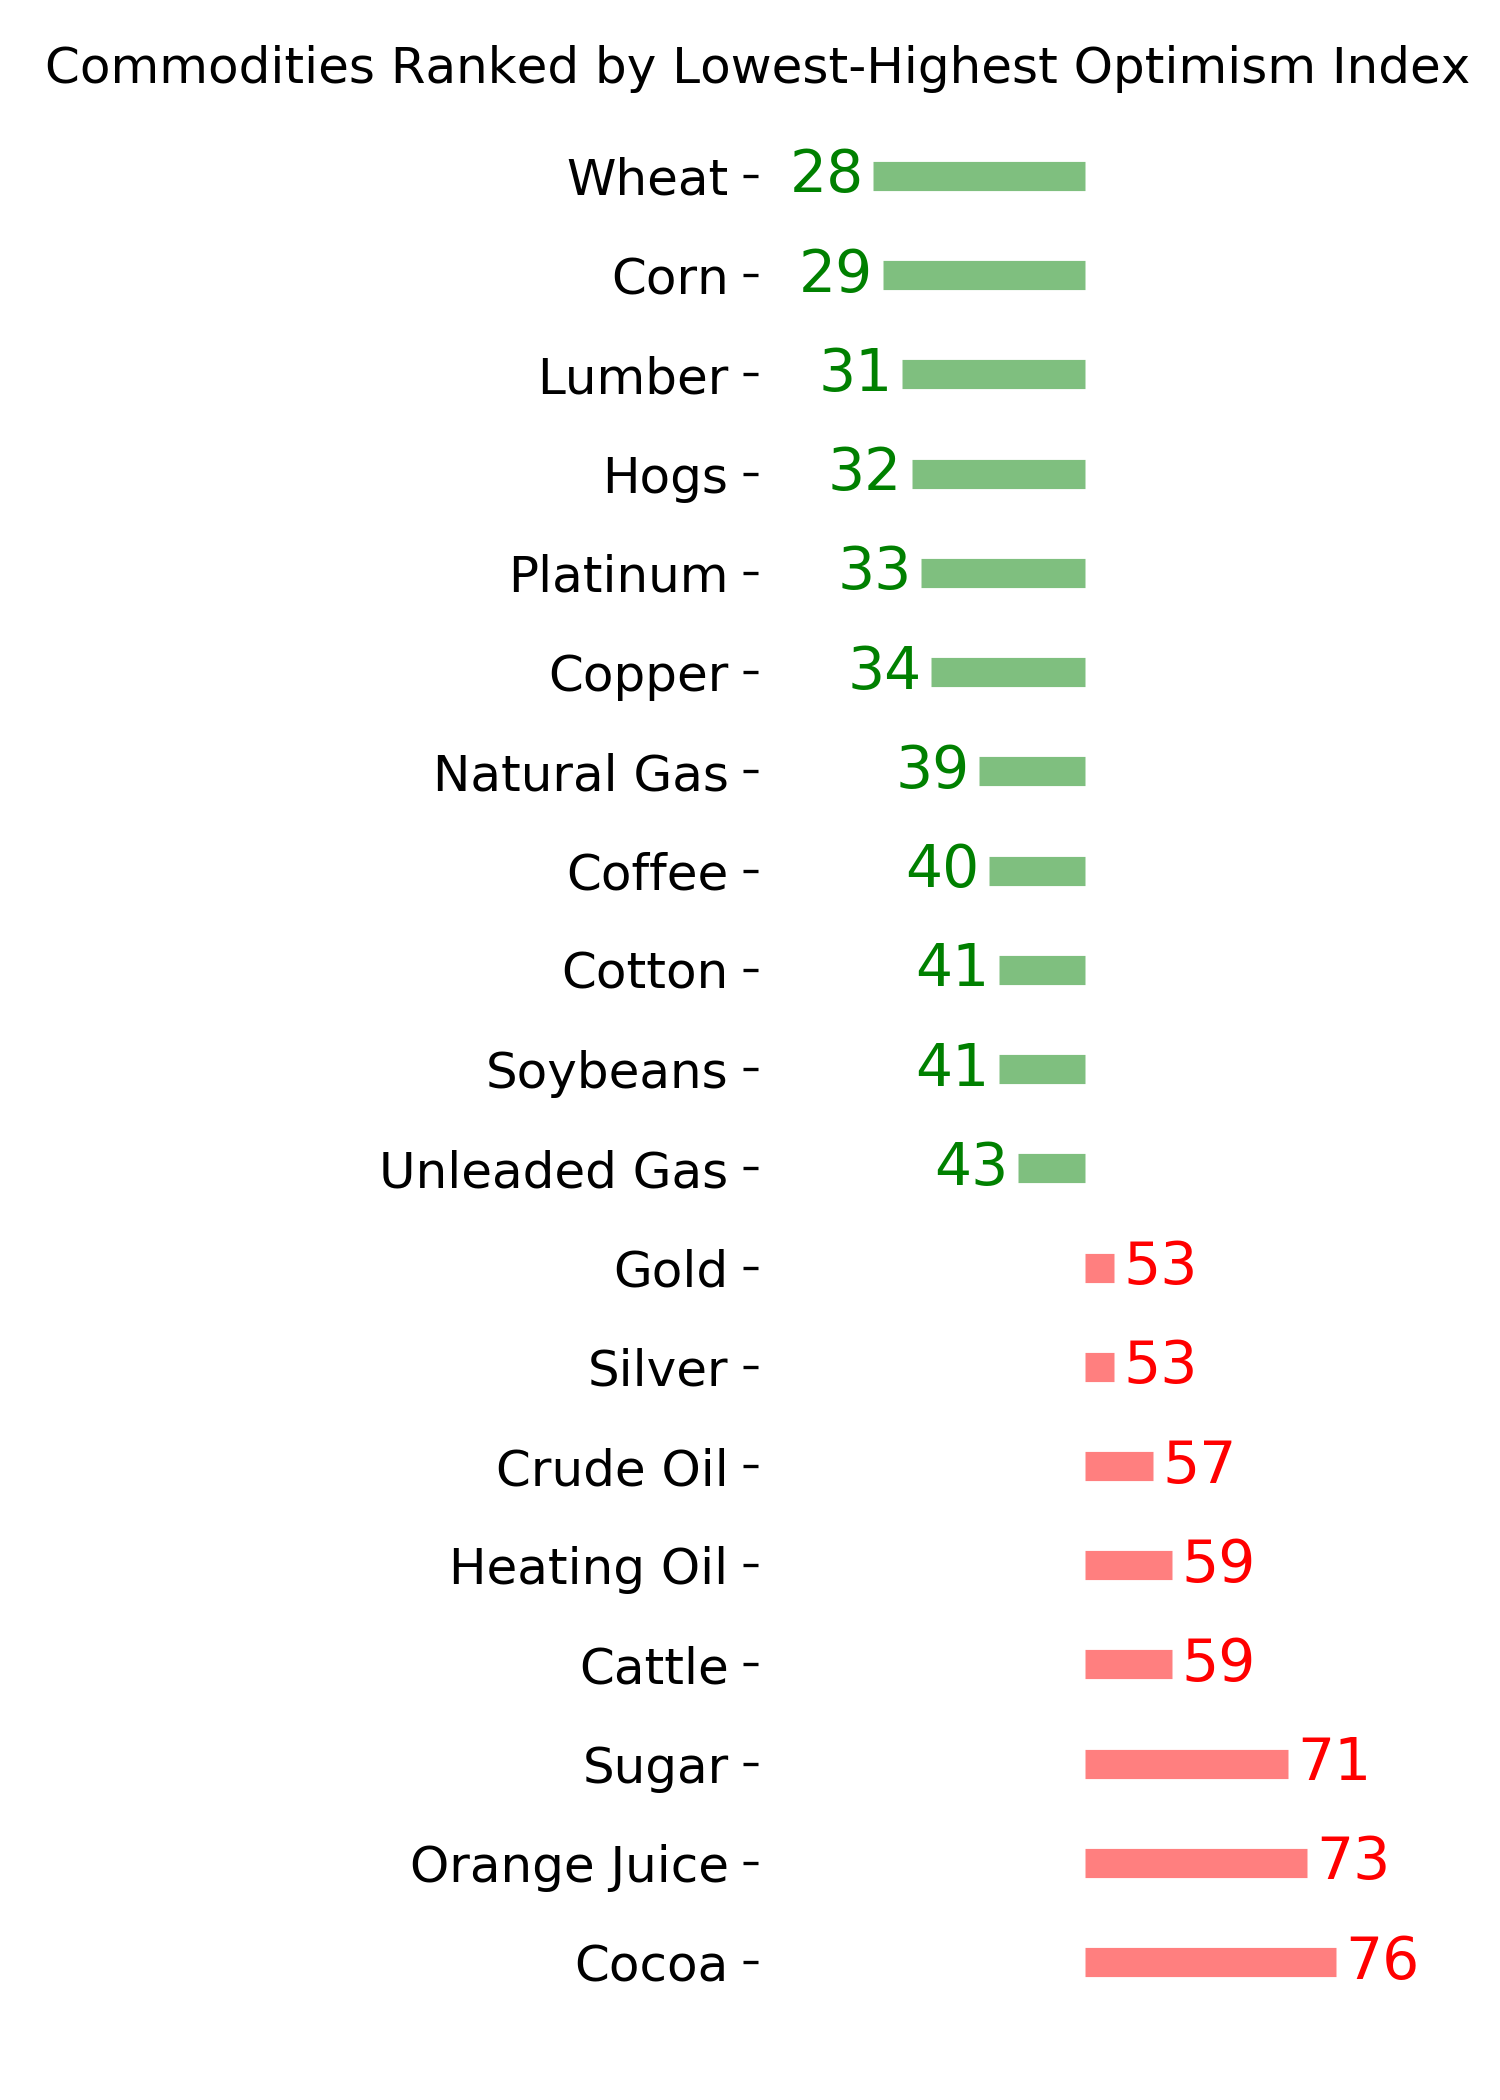
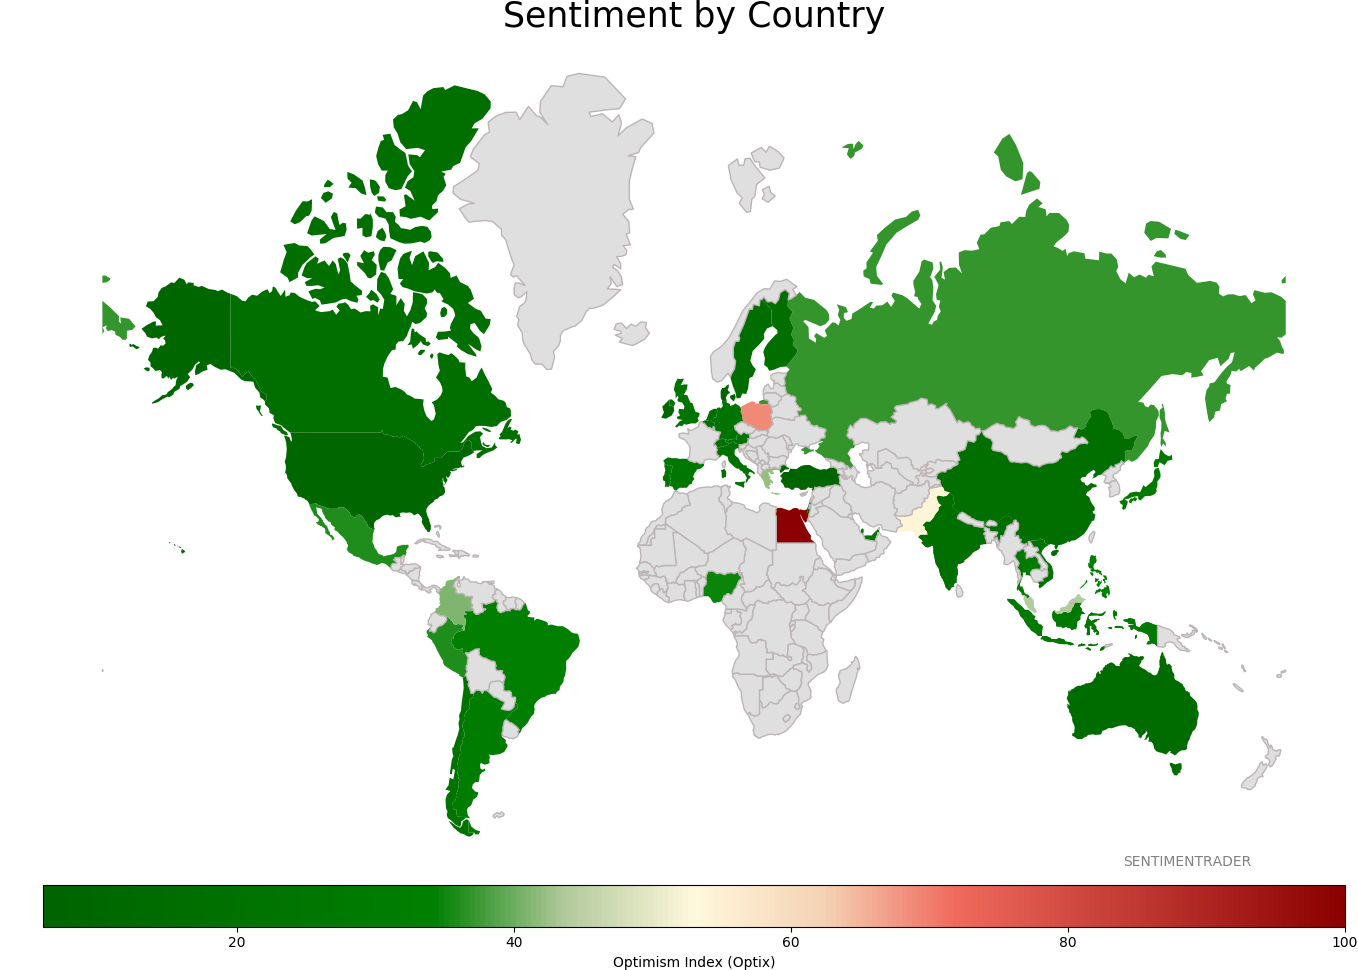
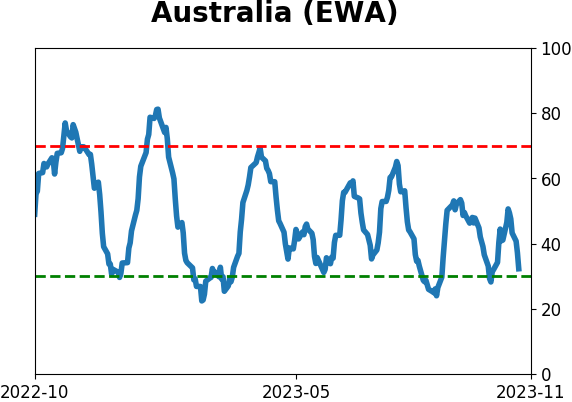
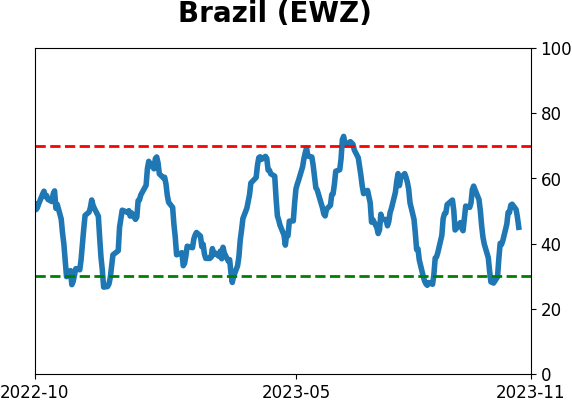
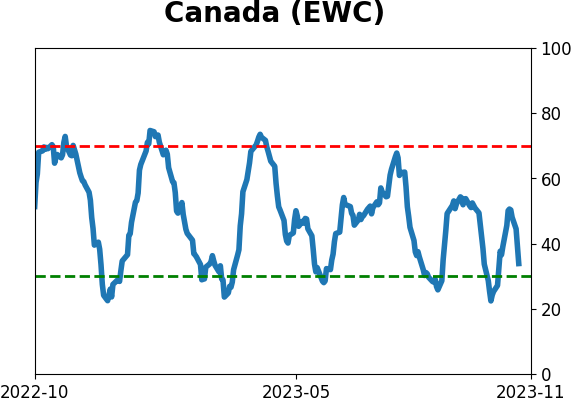
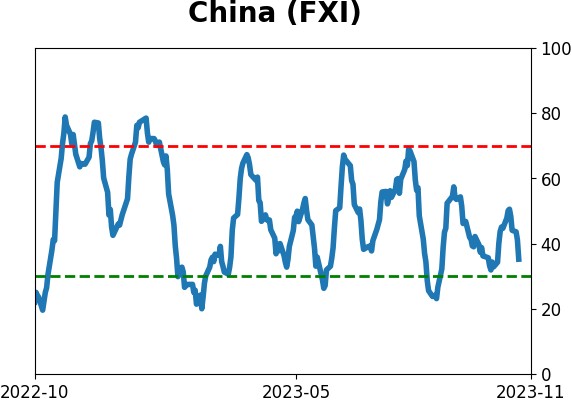
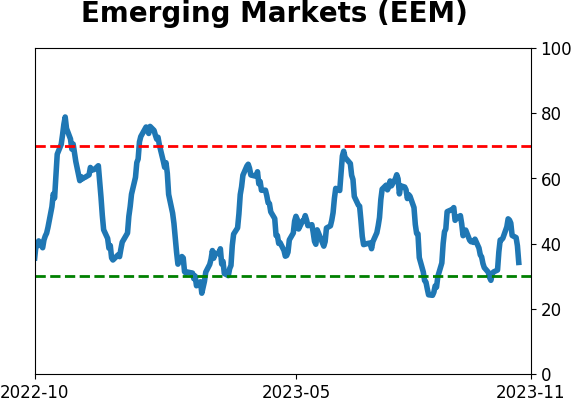
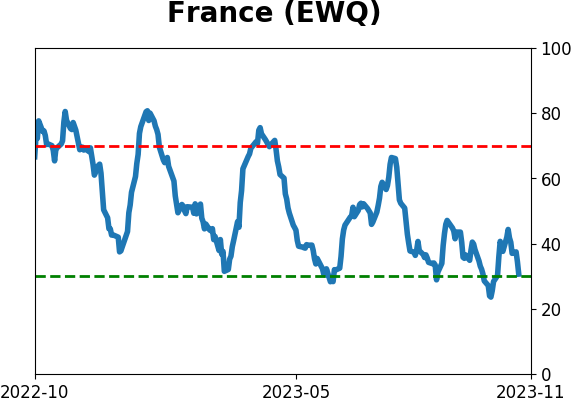
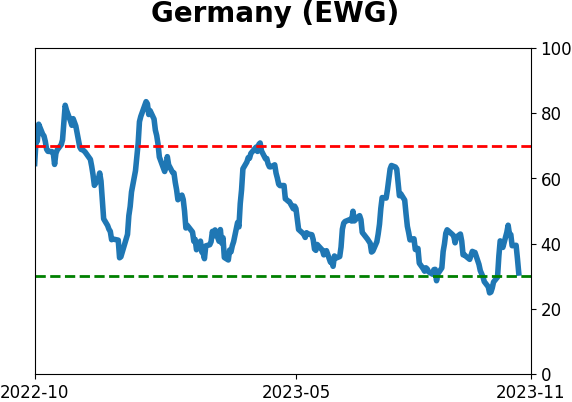
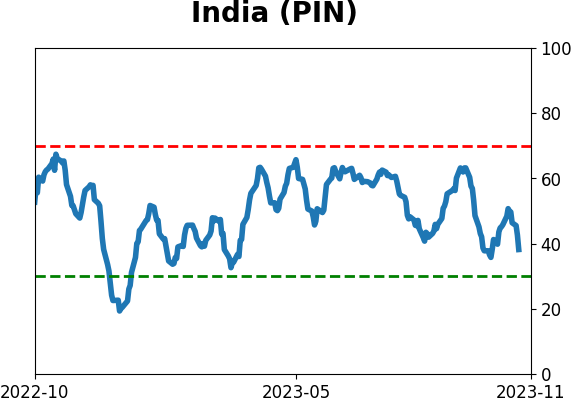
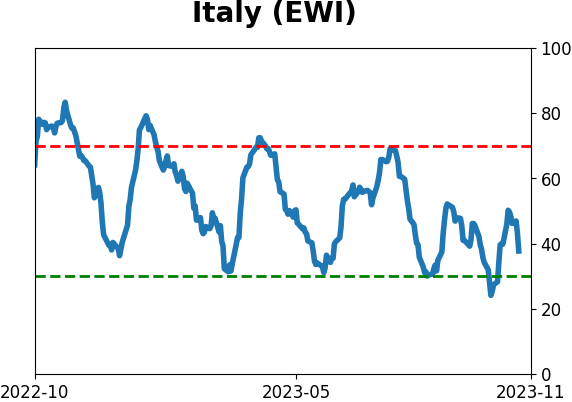
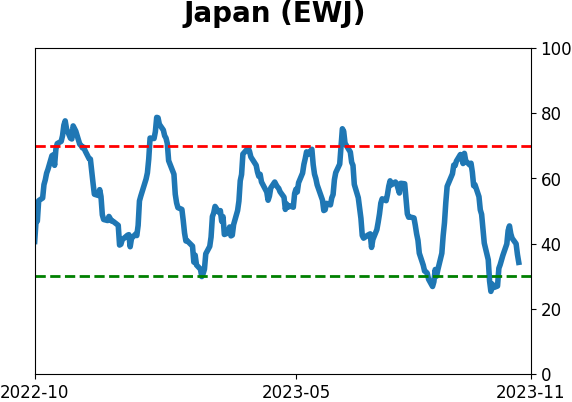
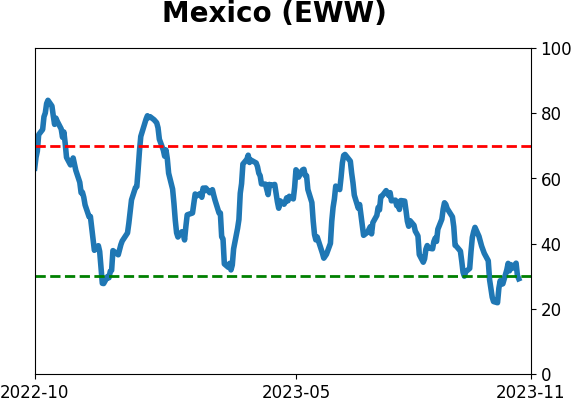
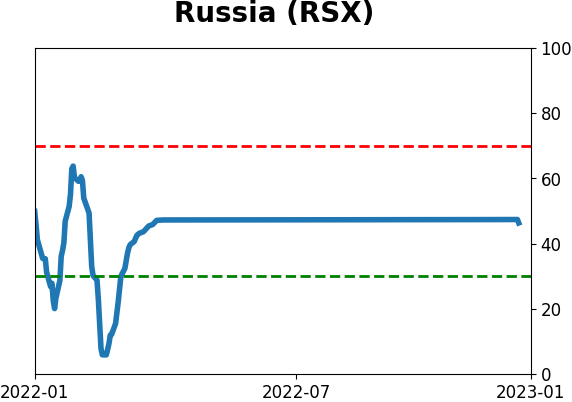
Sentiment Around The World
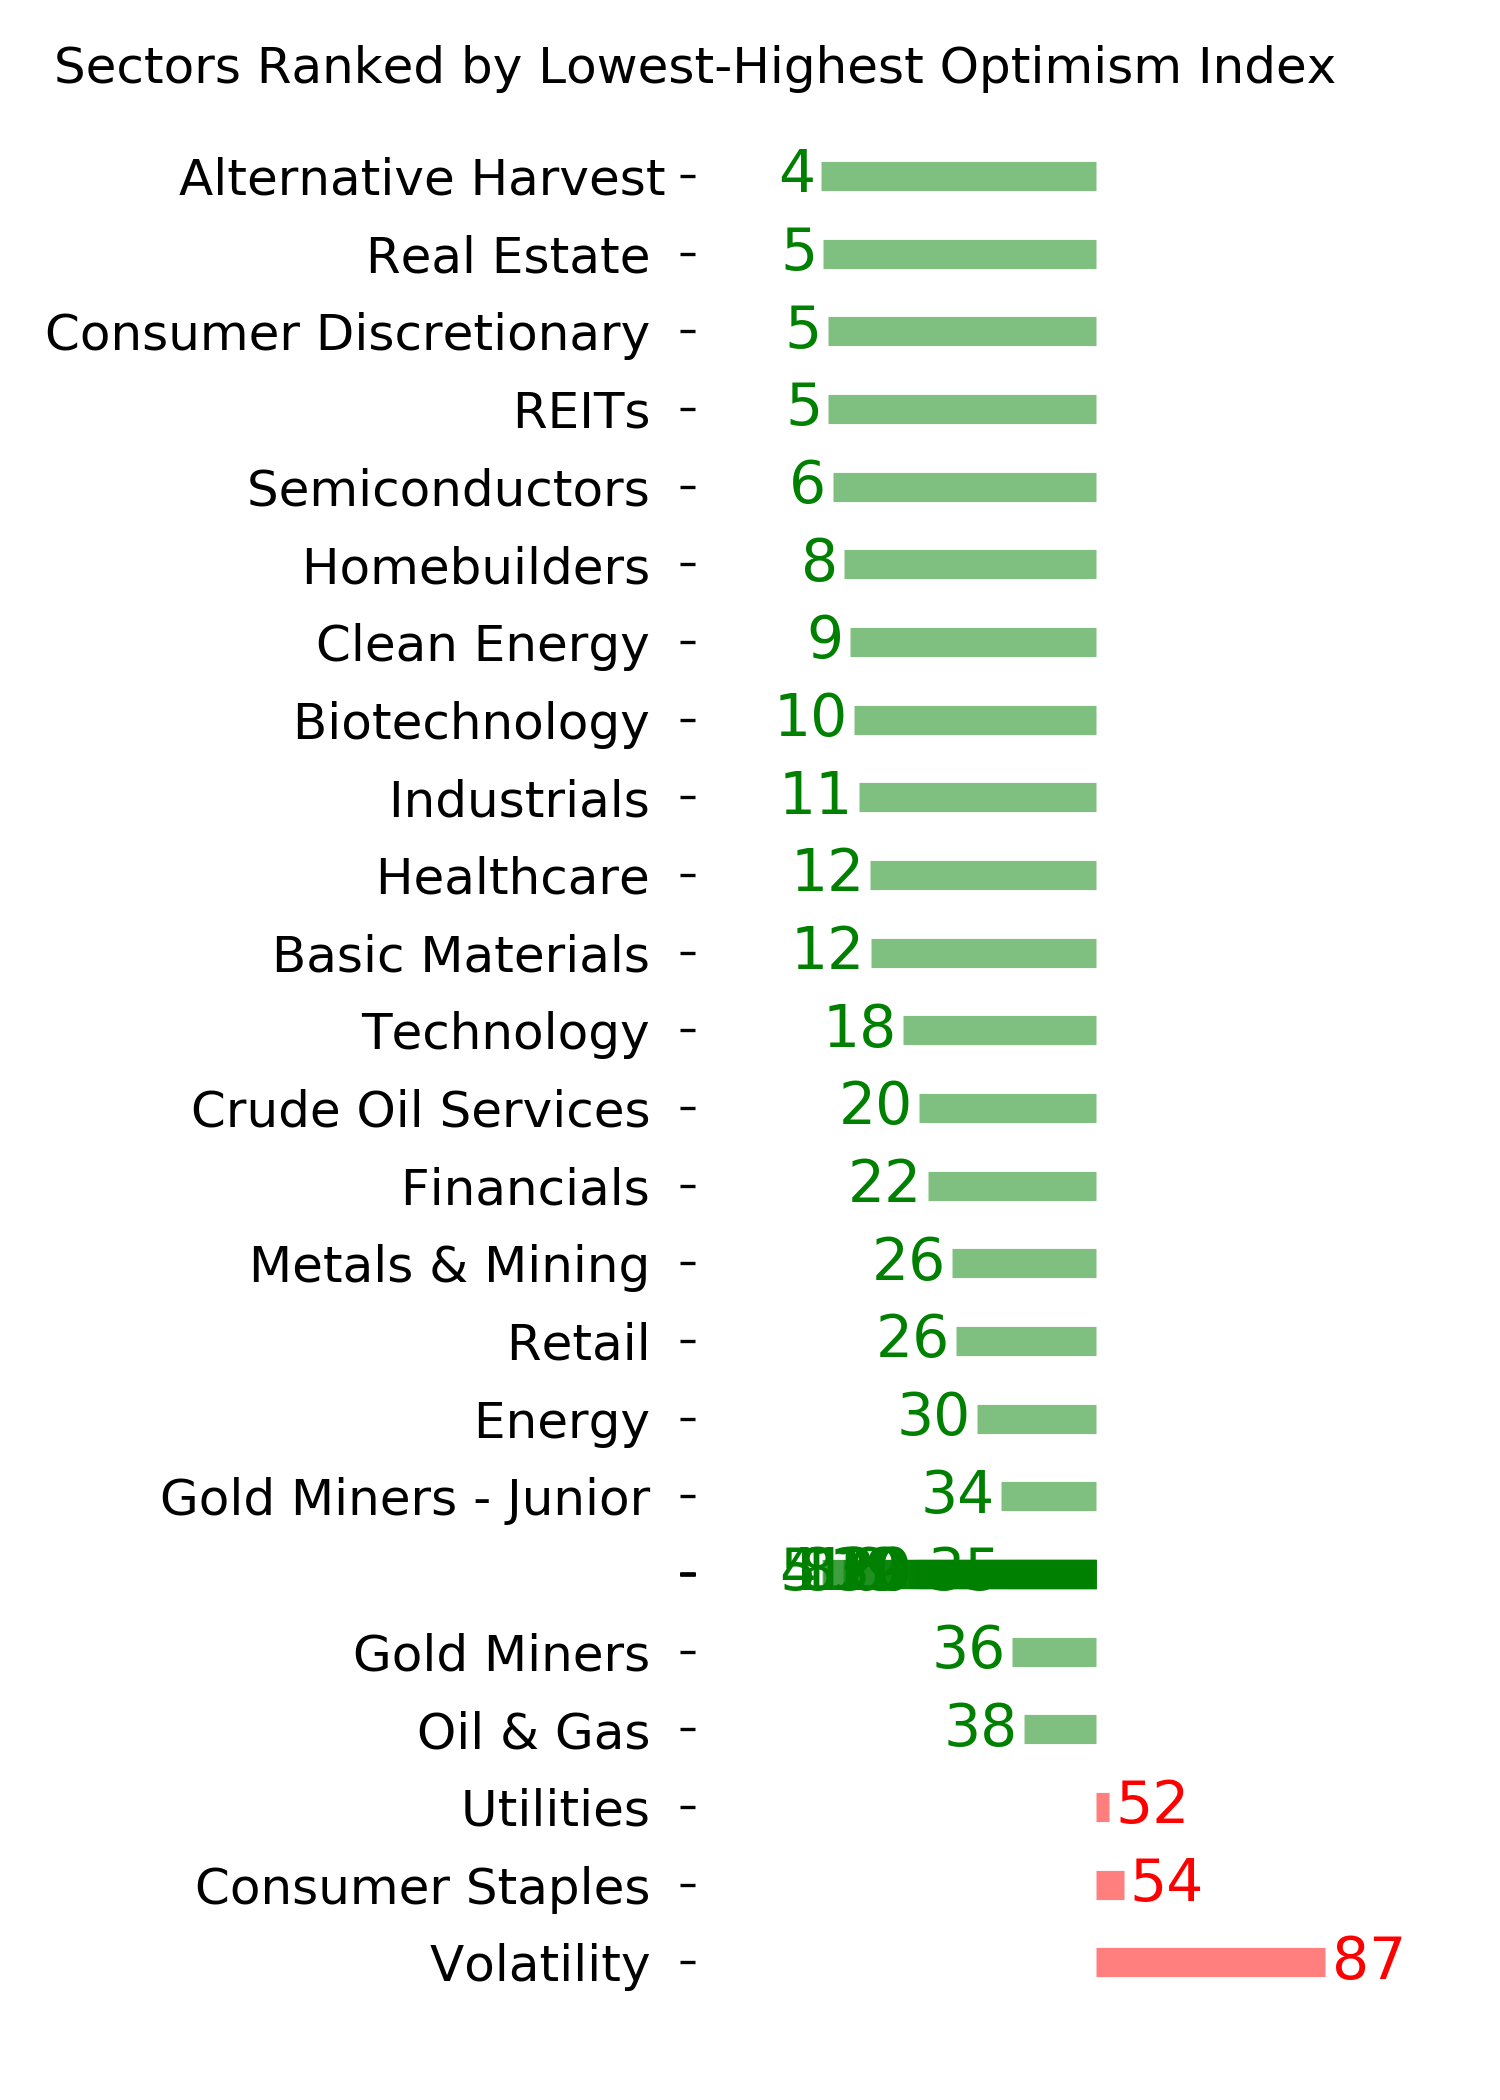
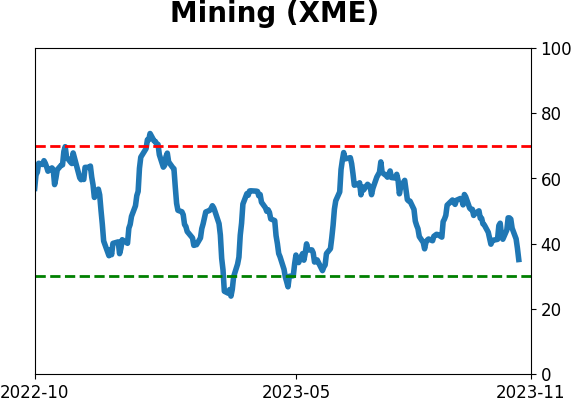
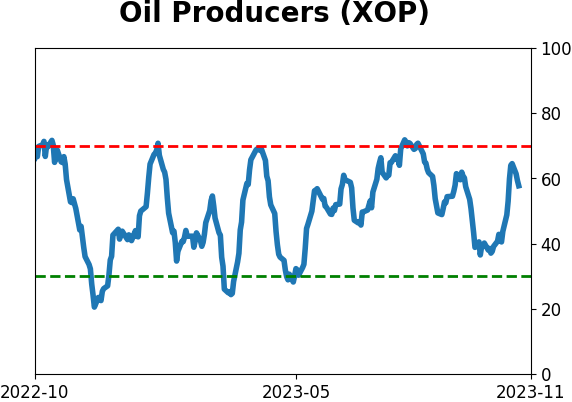
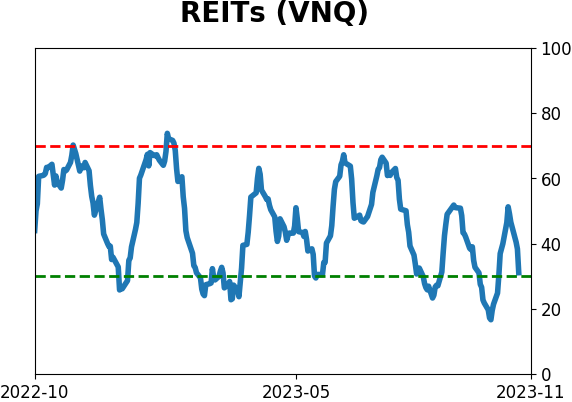
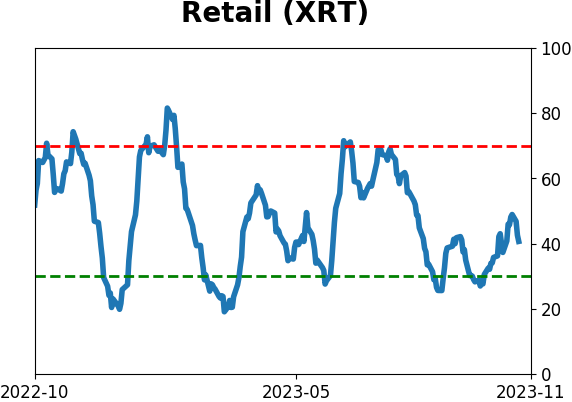
Optimism Index Thumbnails
|
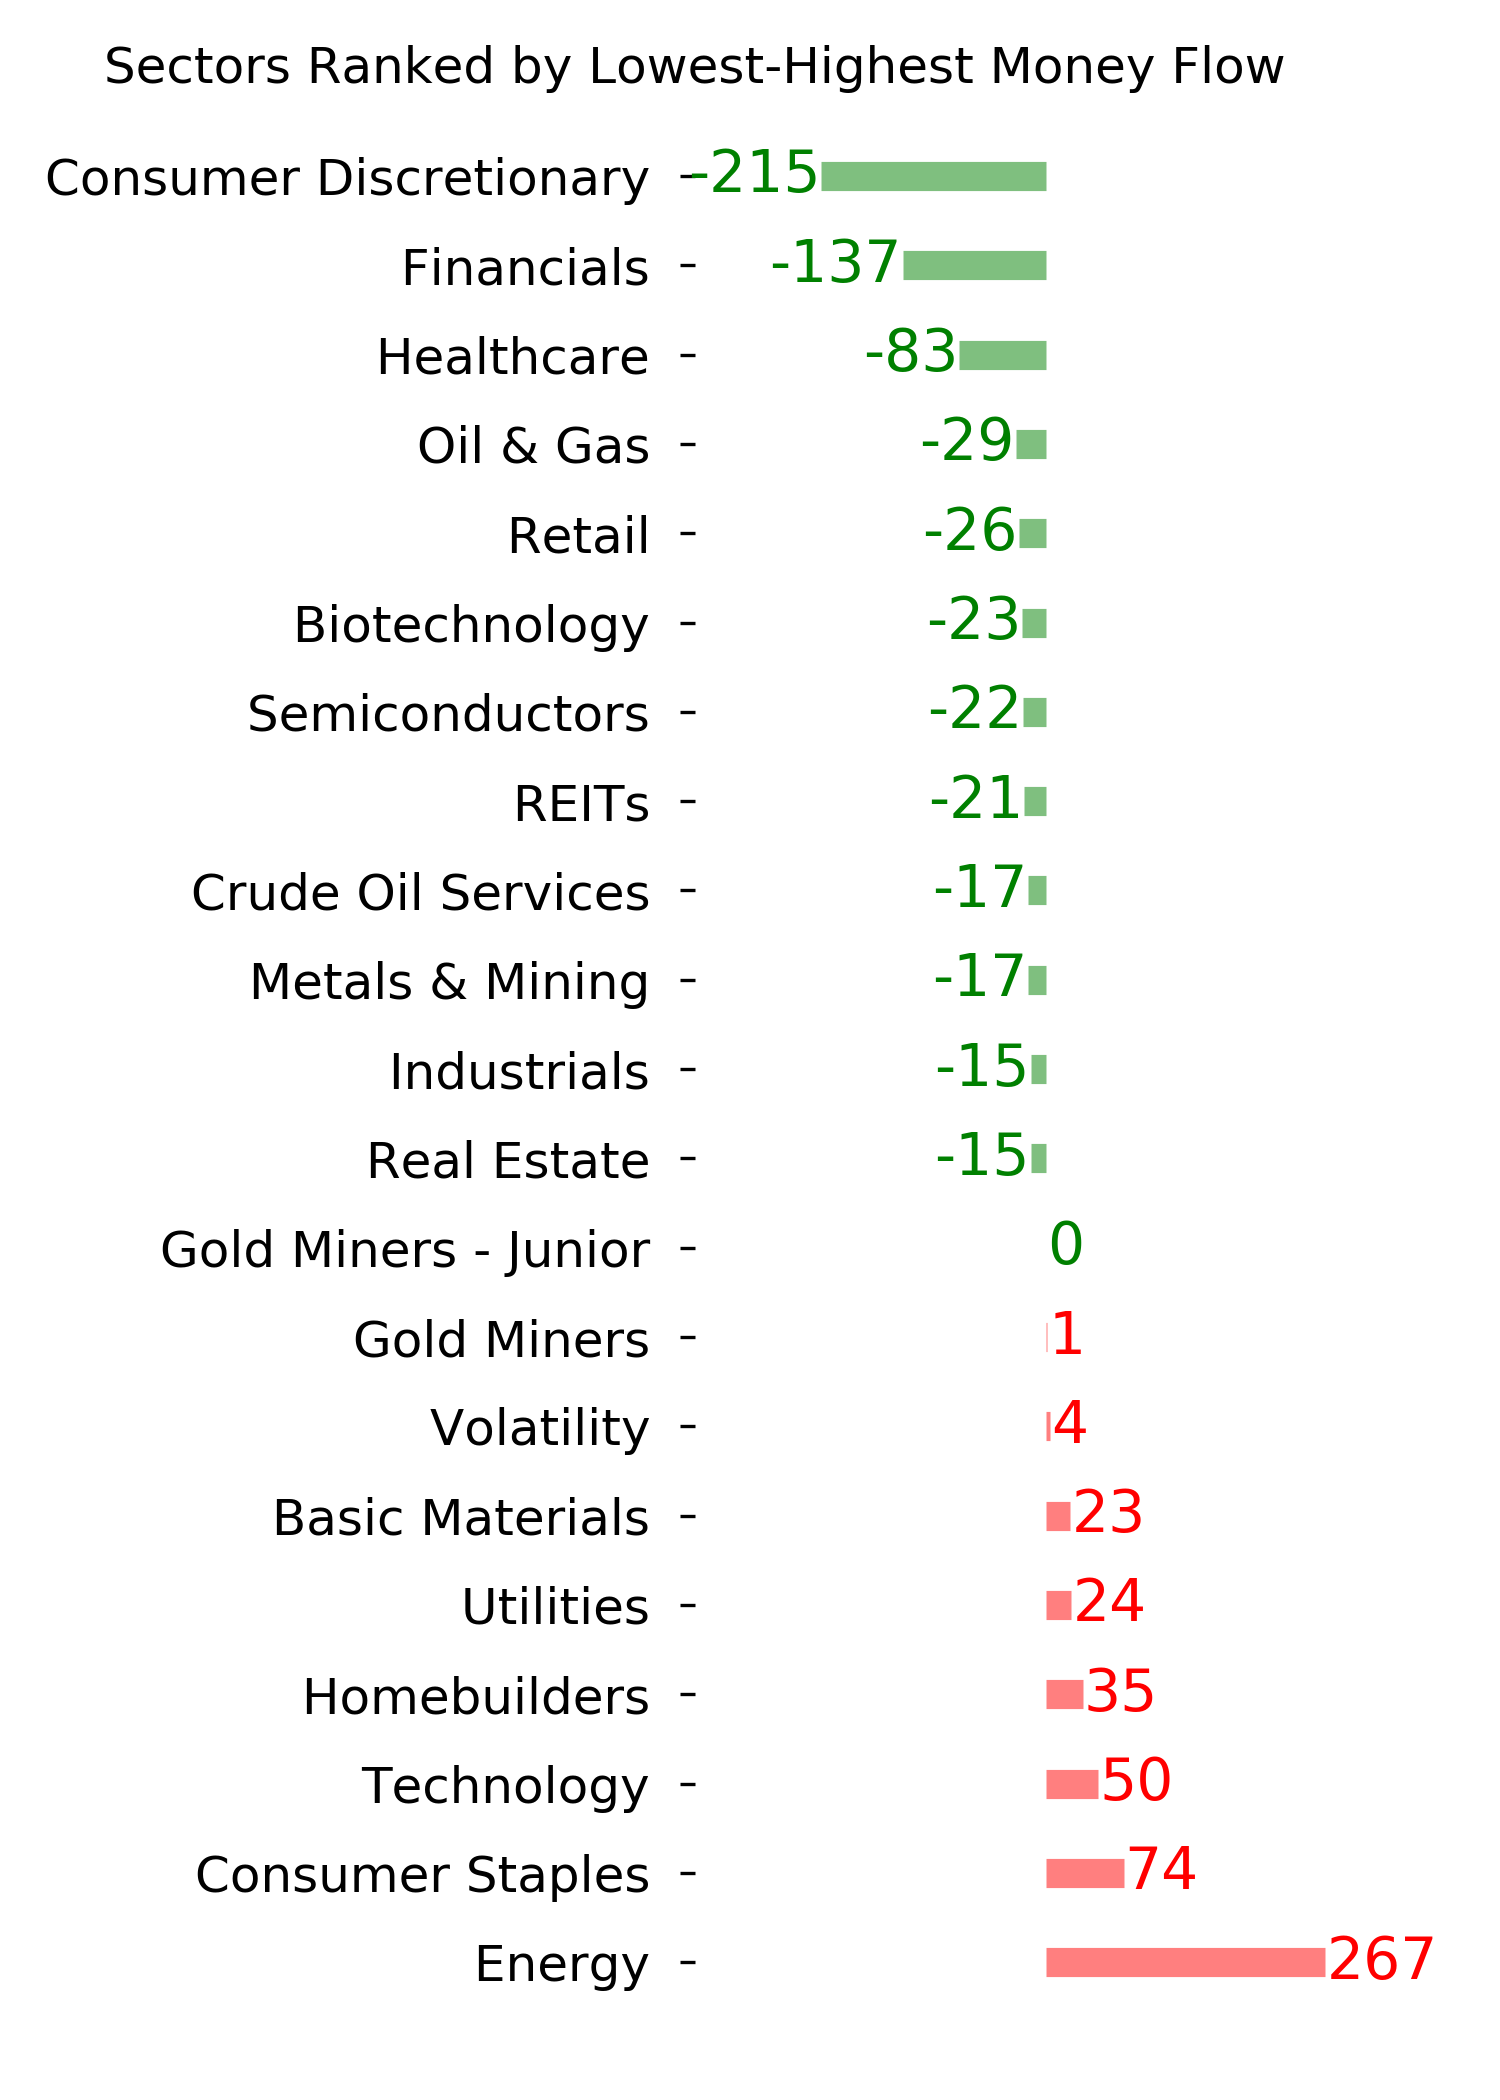
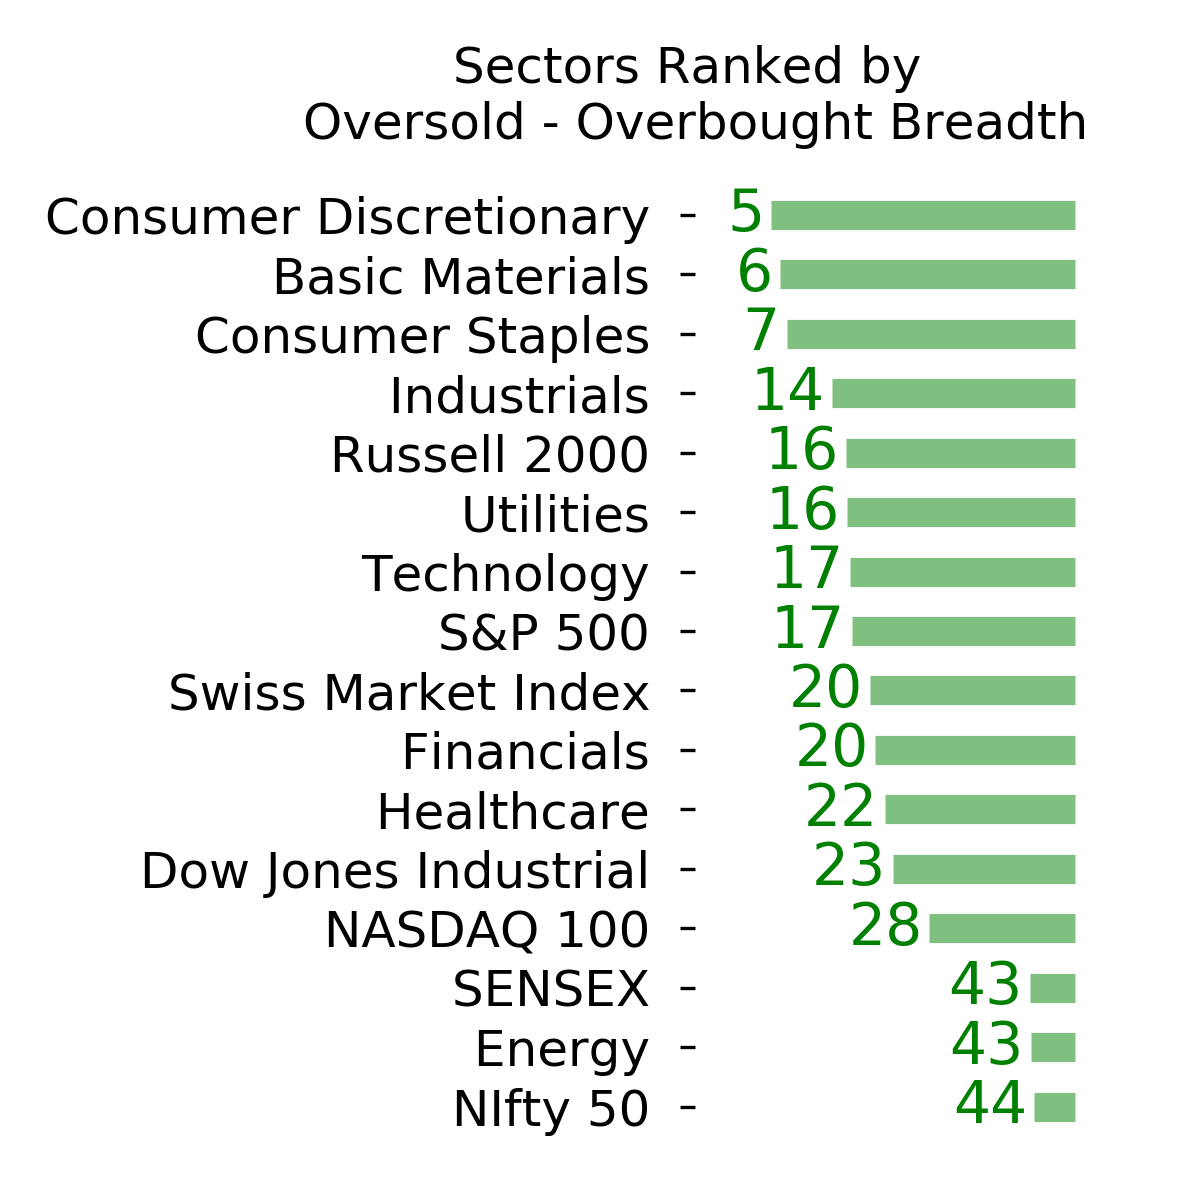
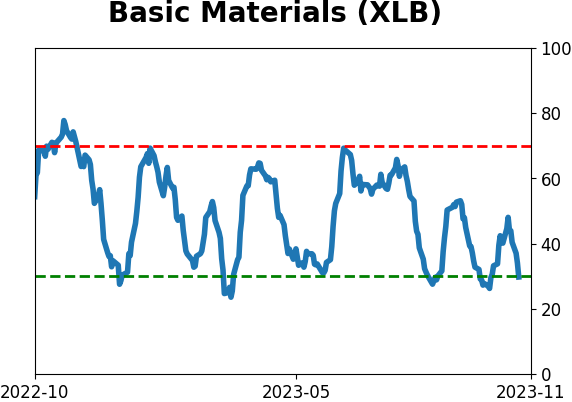
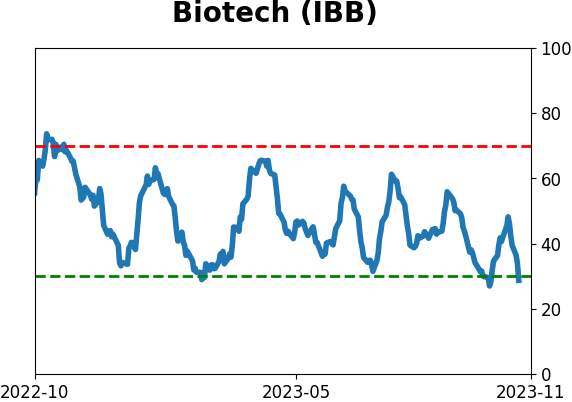
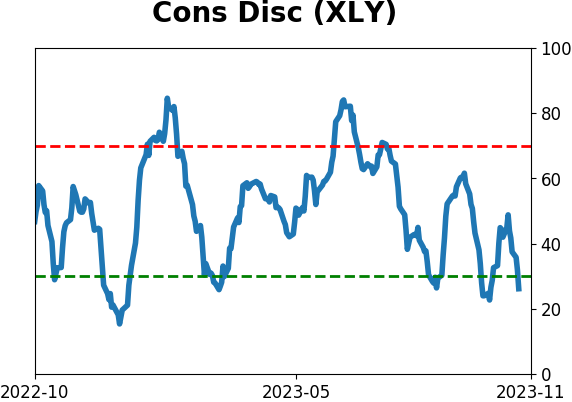
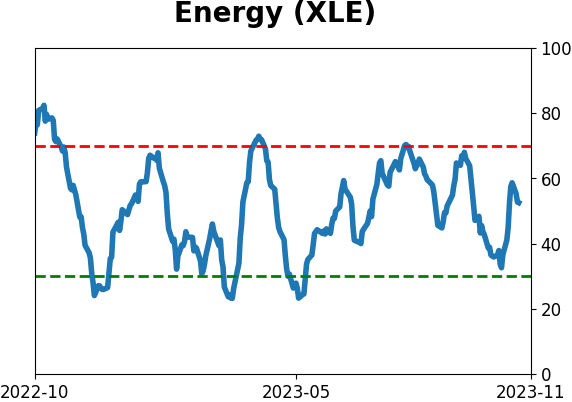
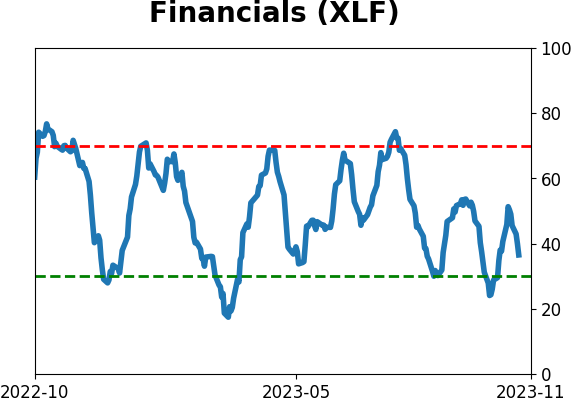
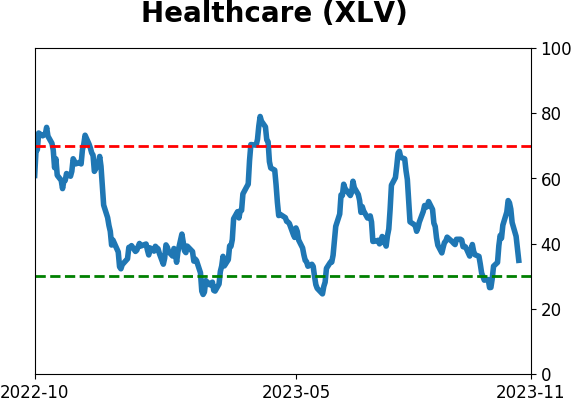
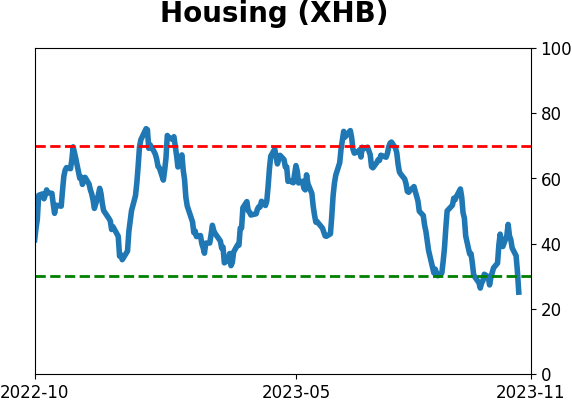
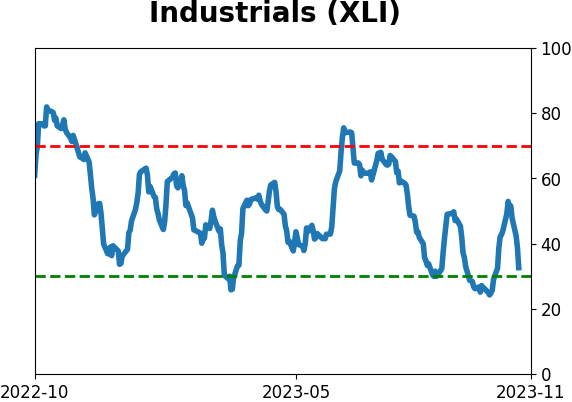
Sector ETF's - 10-Day Moving Average
|
|
|
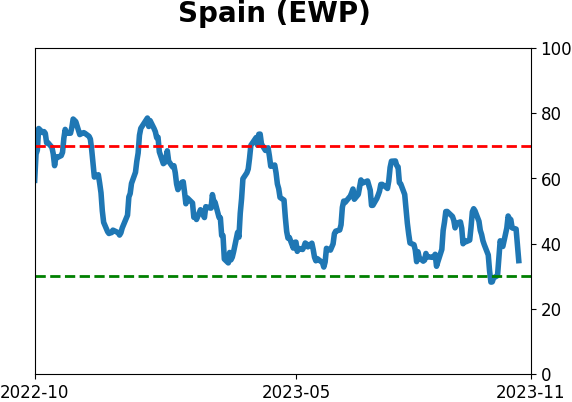
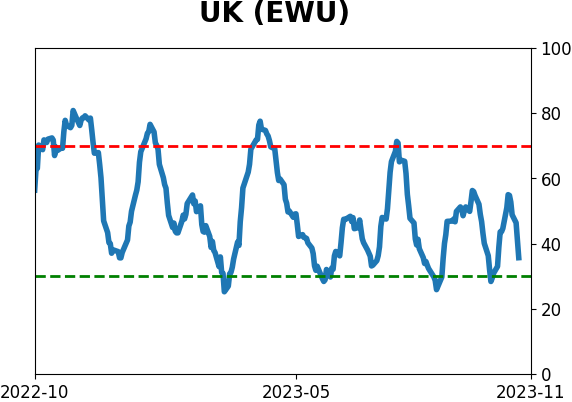
Country ETF's - 10-Day Moving Average
|
|
|
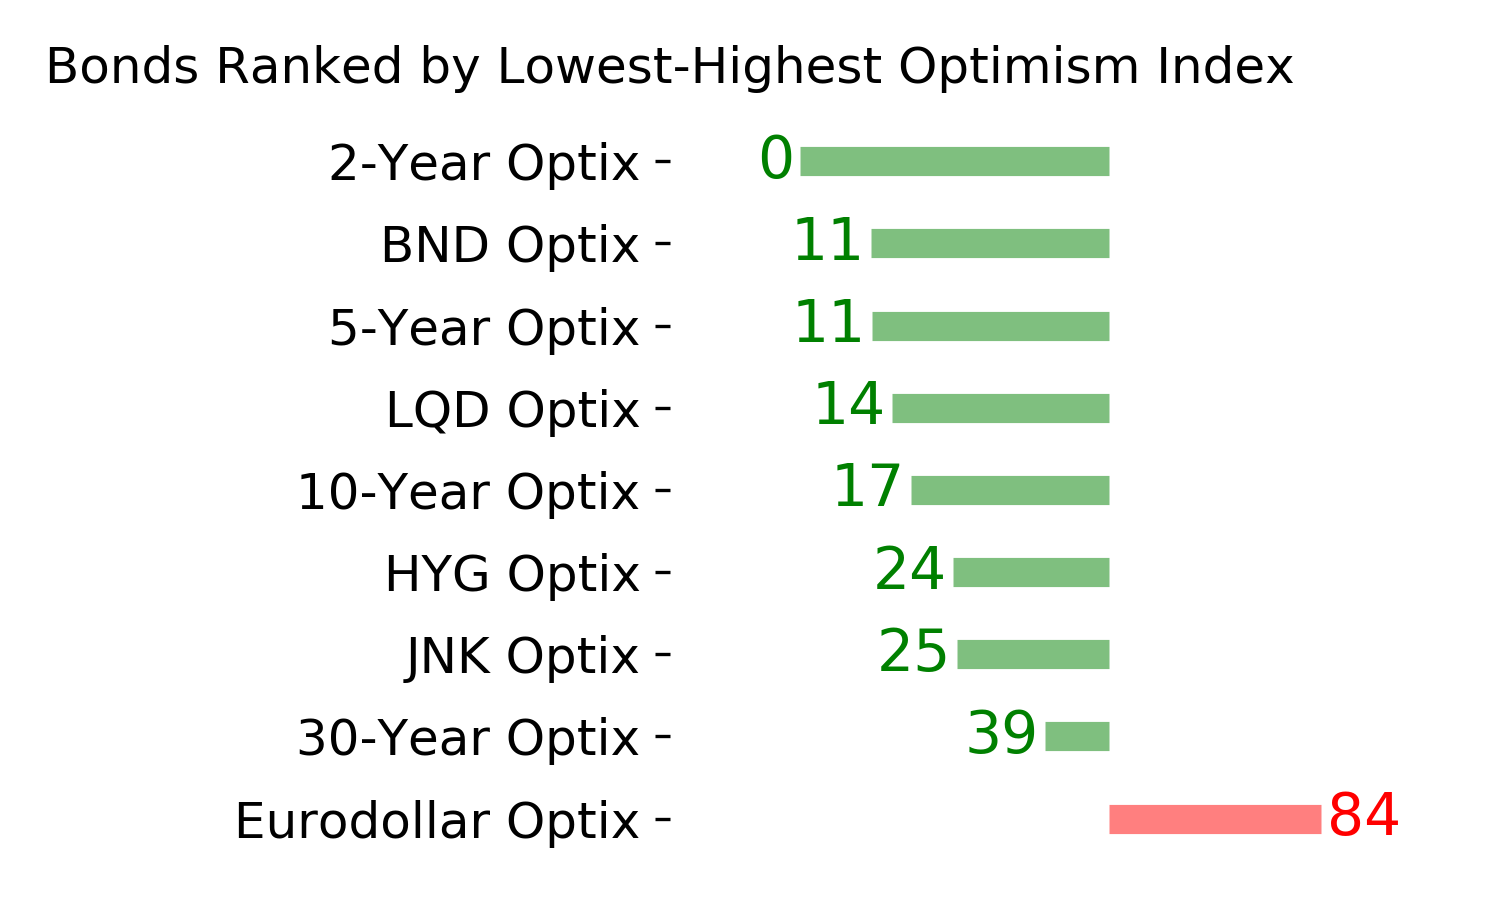
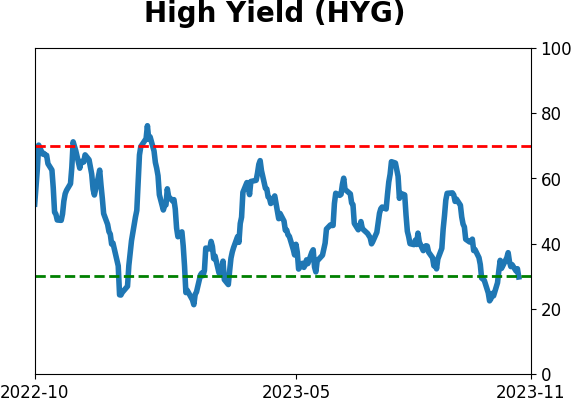
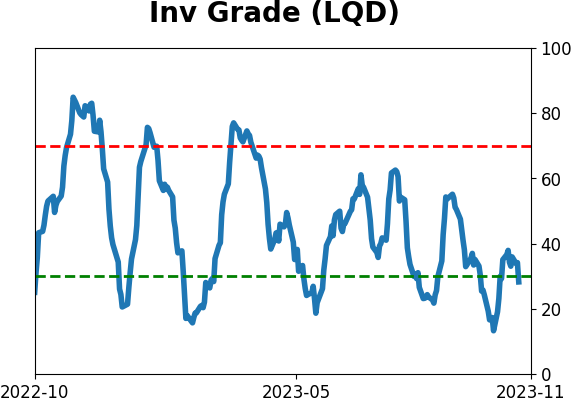
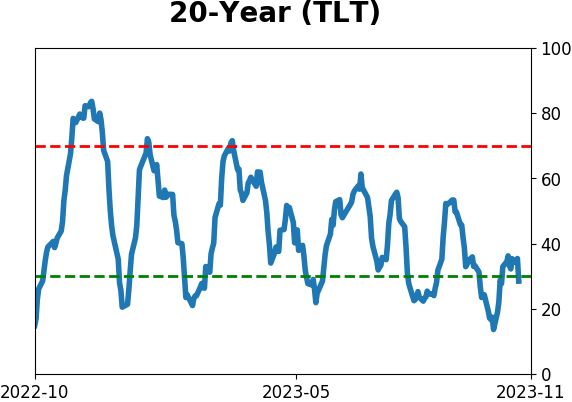
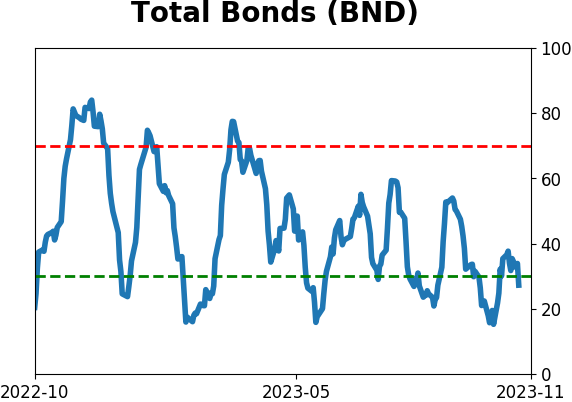
Bond ETF's - 10-Day Moving Average
|
|
|
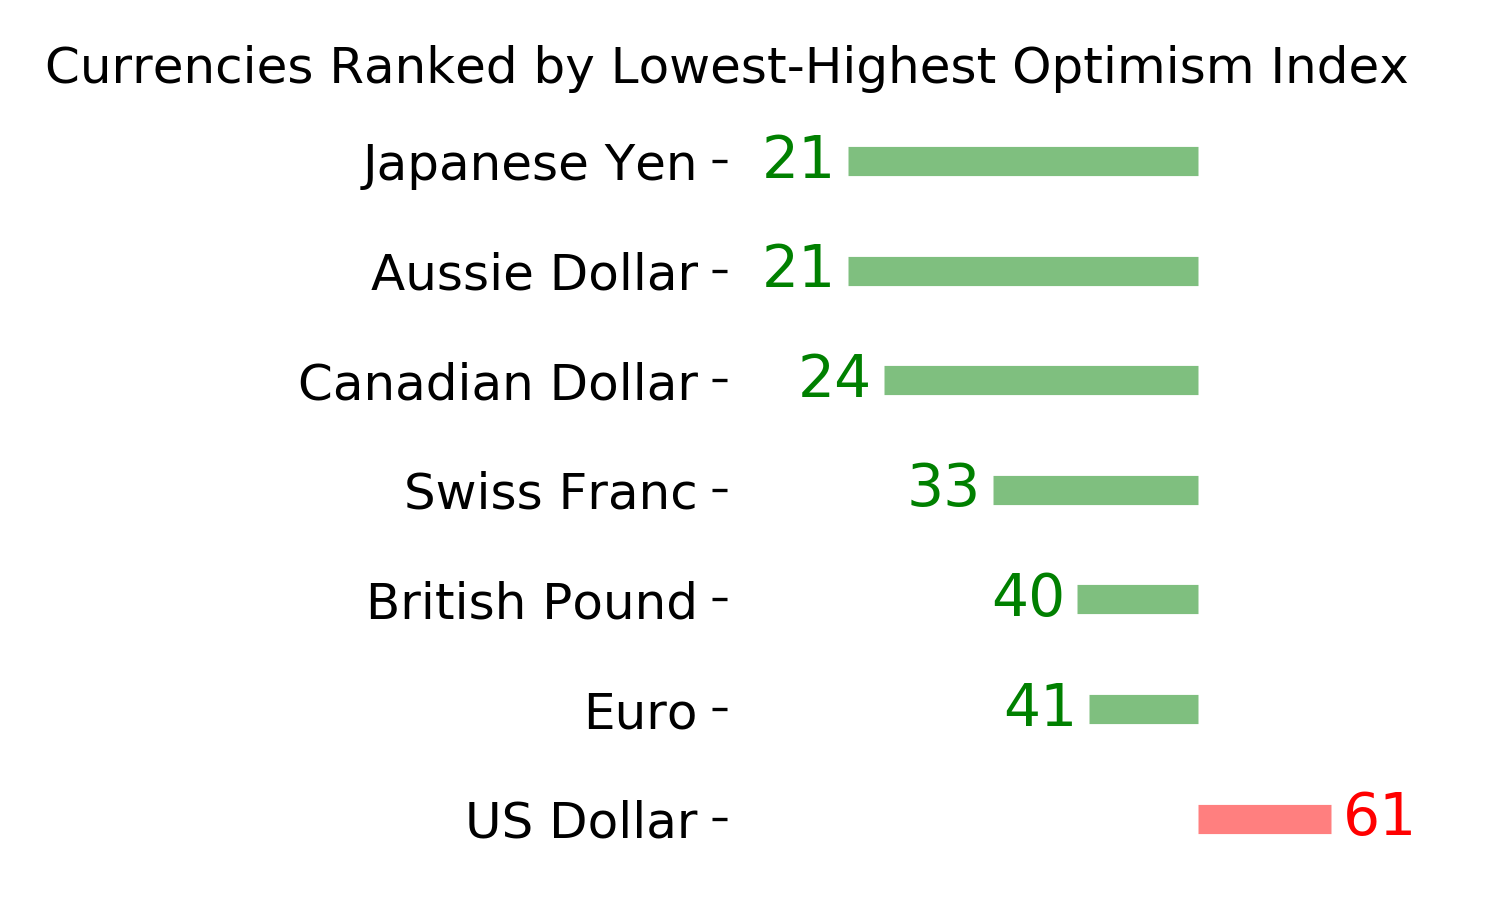
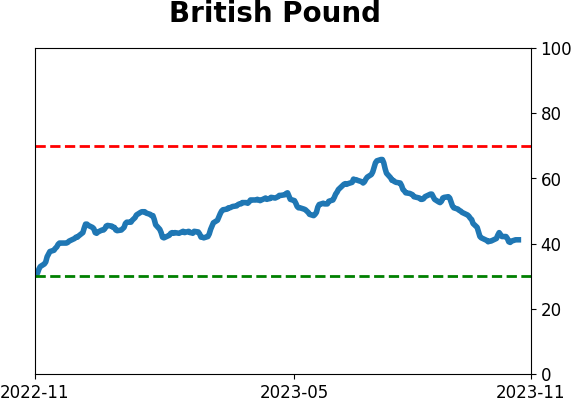
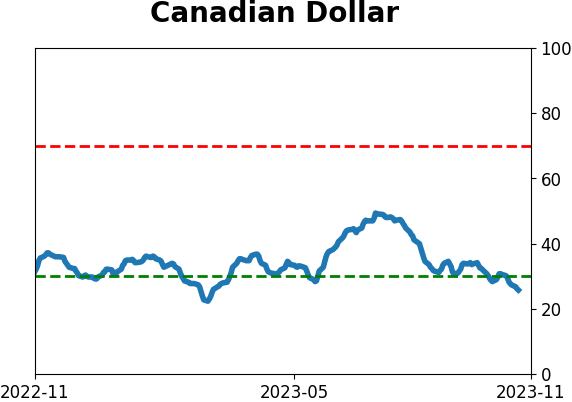
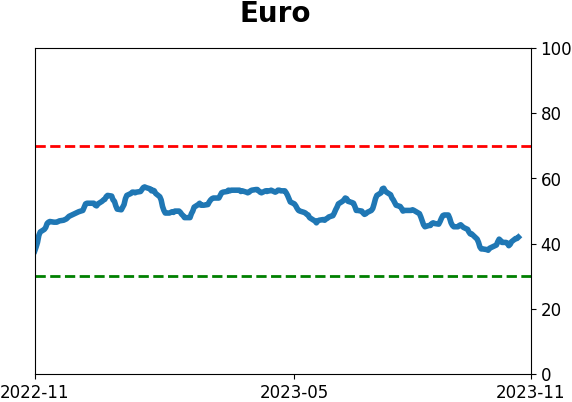
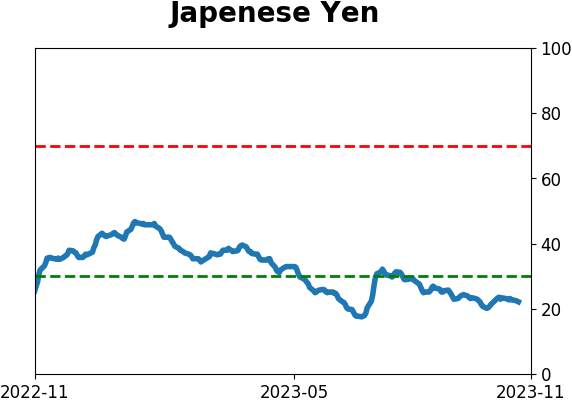
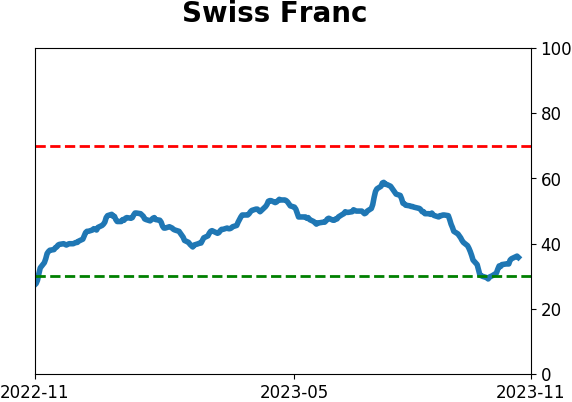
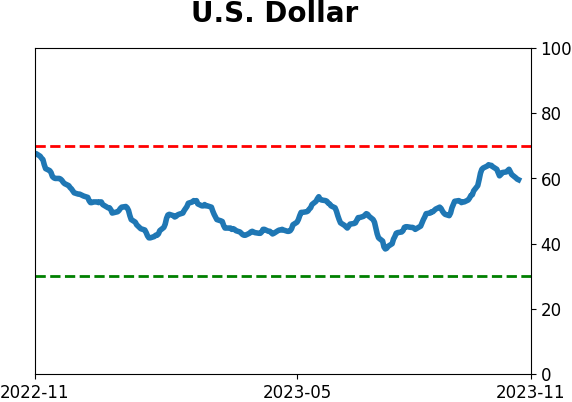
Currency ETF's - 5-Day Moving Average
|
|
|
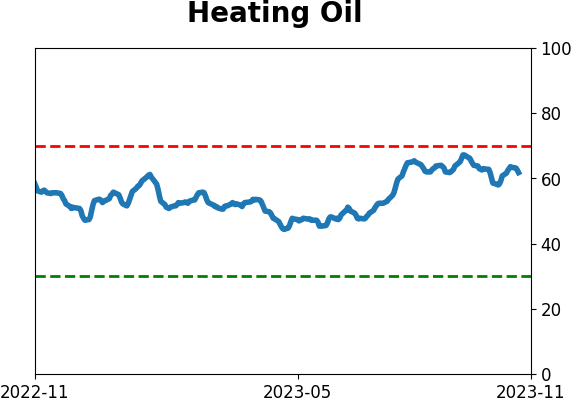
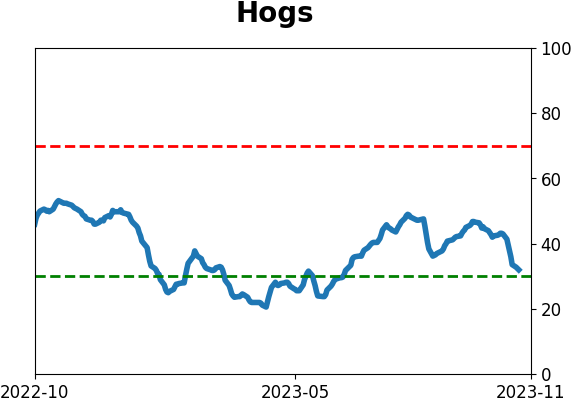
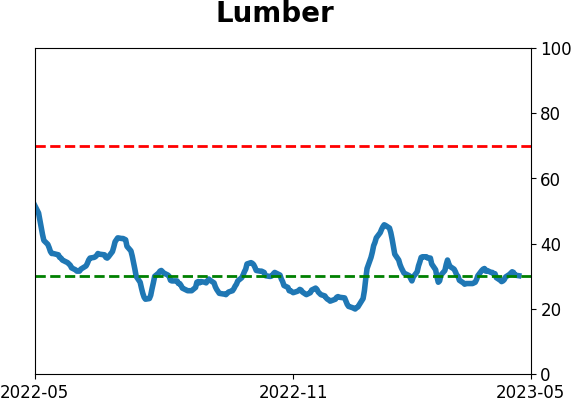
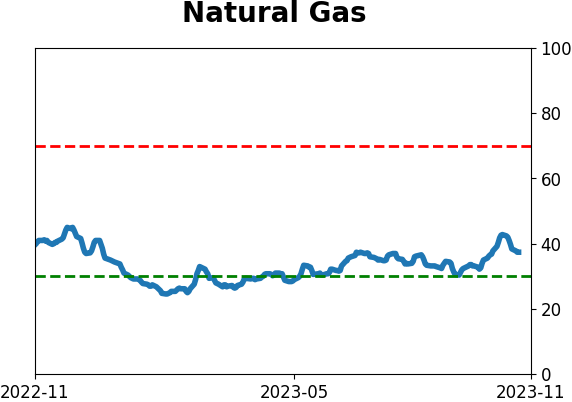
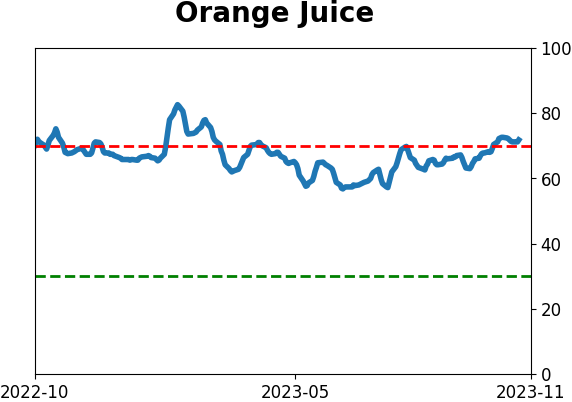
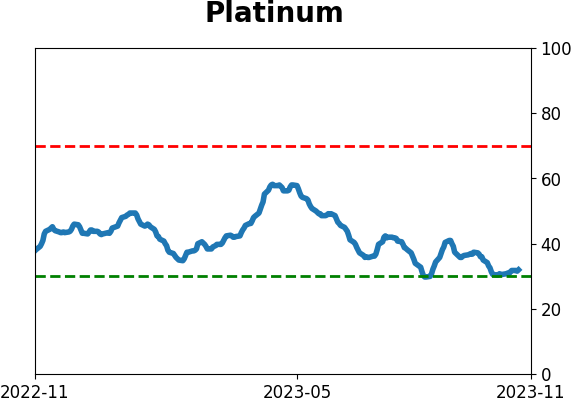
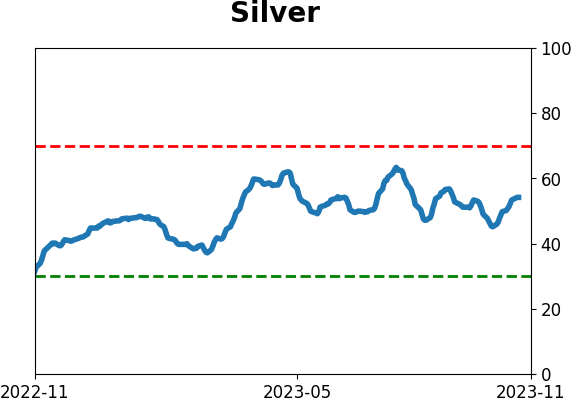
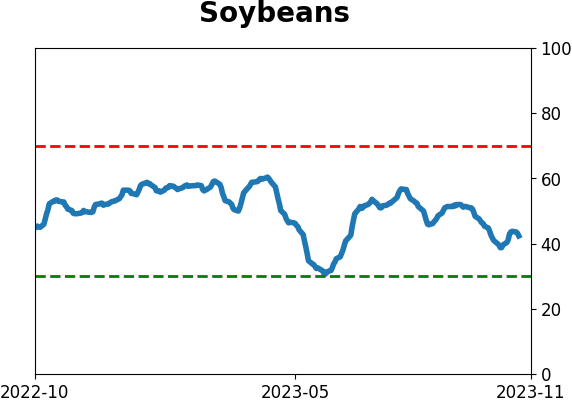
Commodity ETF's - 5-Day Moving Average
|
|