Headlines
|
|
The first year of this bull market has been unlike any other:
In the first year of the rally off the October 2022 bottom, Small Cap stocks underperformed the S&P 500 to a near-record degree. There has also been abnormal investor preference among sectors and factors. While unusual behavior can sometimes precede poor returns, rallies most similar to the past year didn't do so consistently.
|
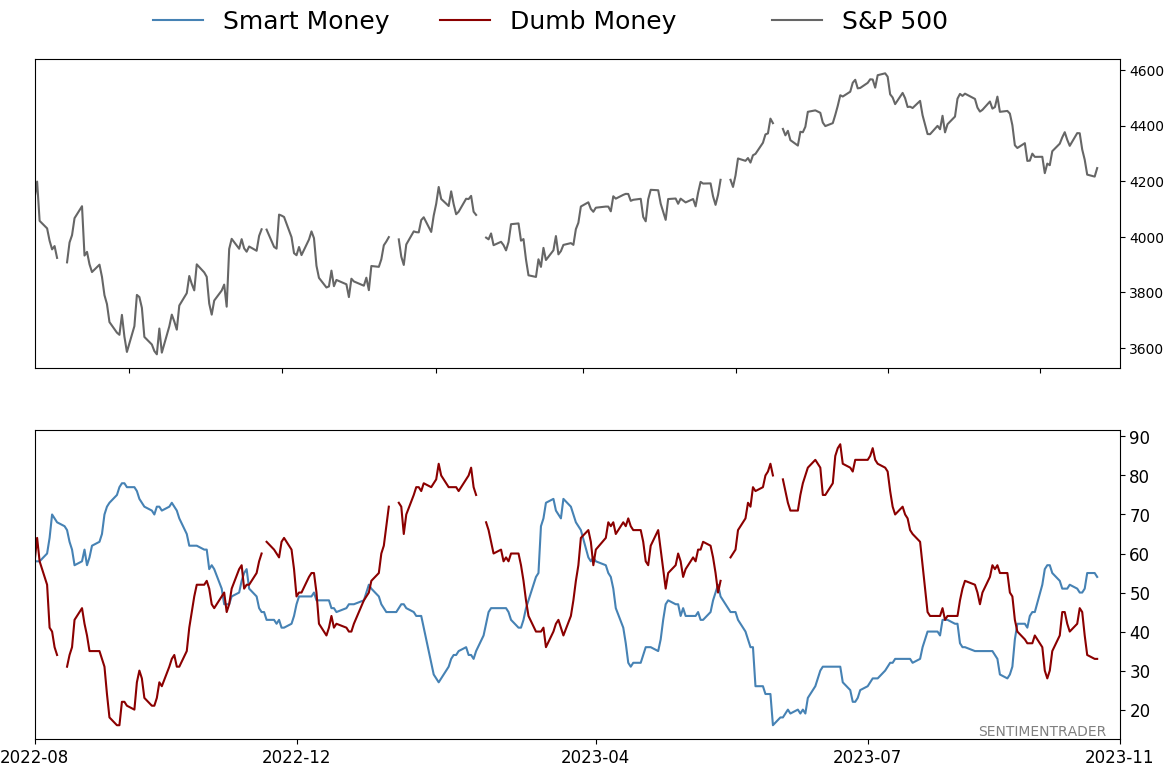
Smart / Dumb Money Confidence
|
Smart Money Confidence: 54%
Dumb Money Confidence: 33%
|
|
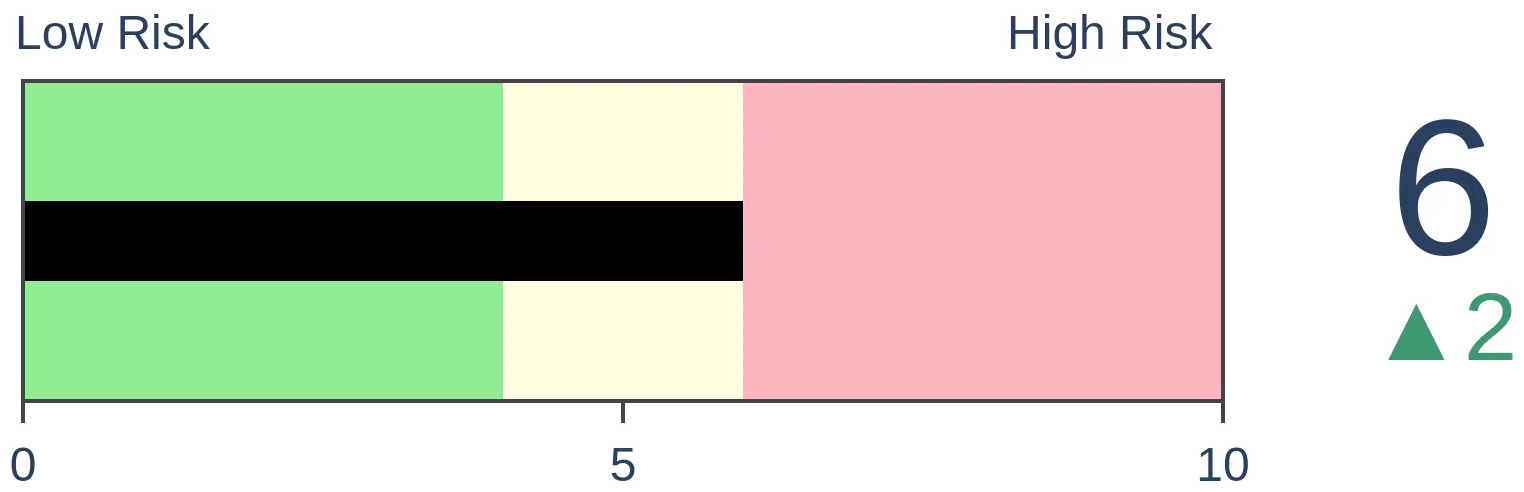
Risk Levels
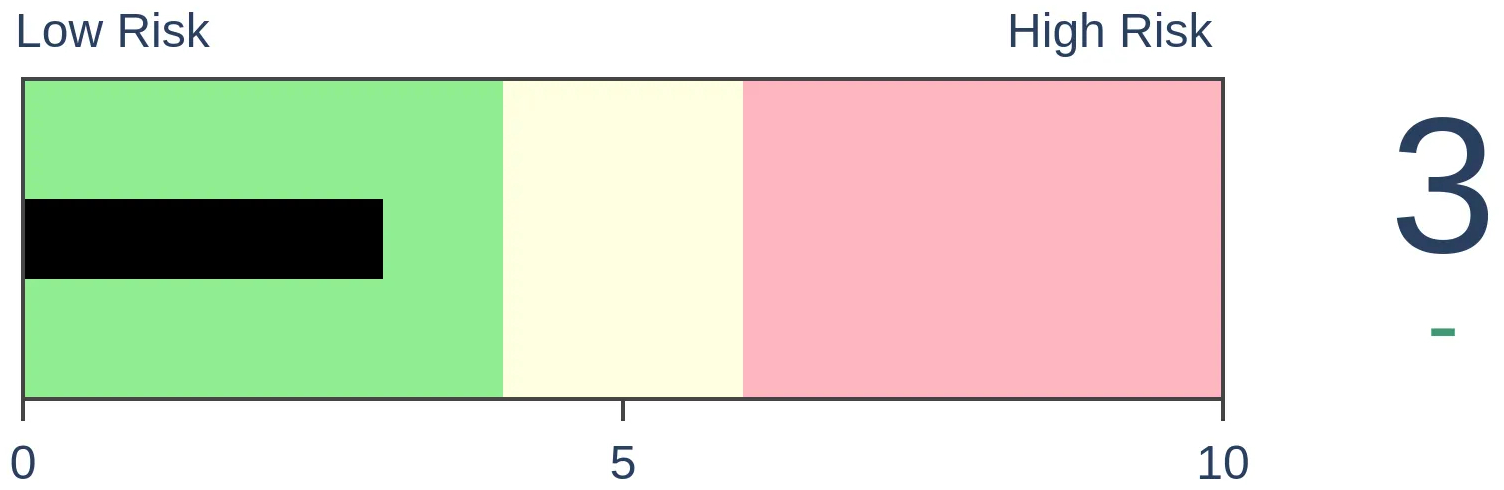
Stocks Short-Term
|
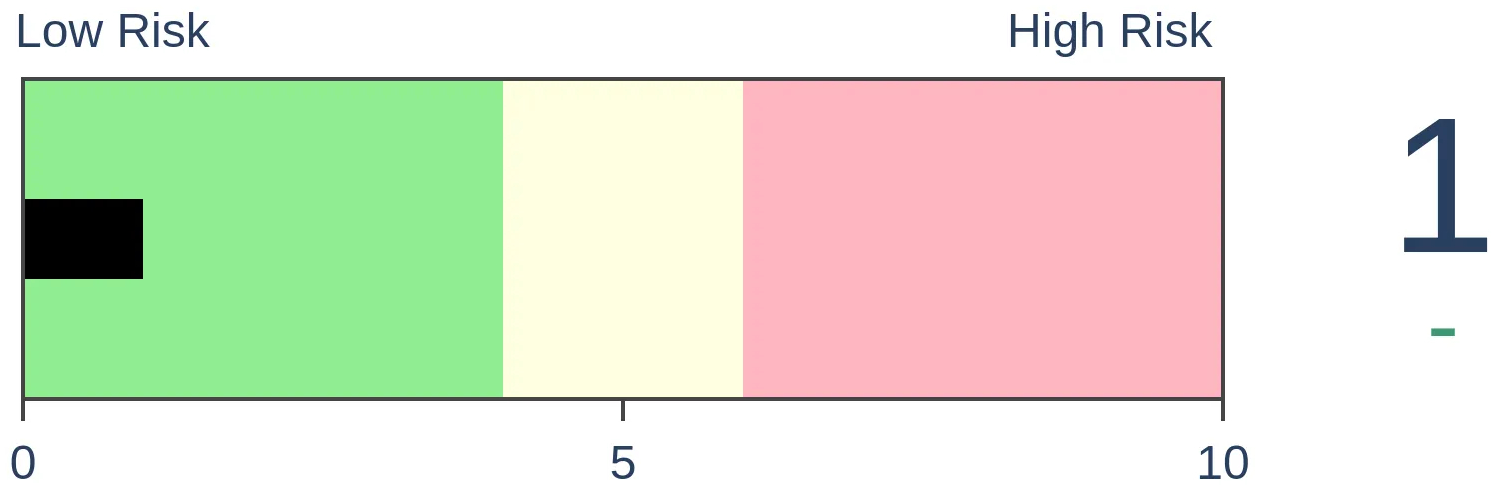
Stocks Medium-Term
|
|
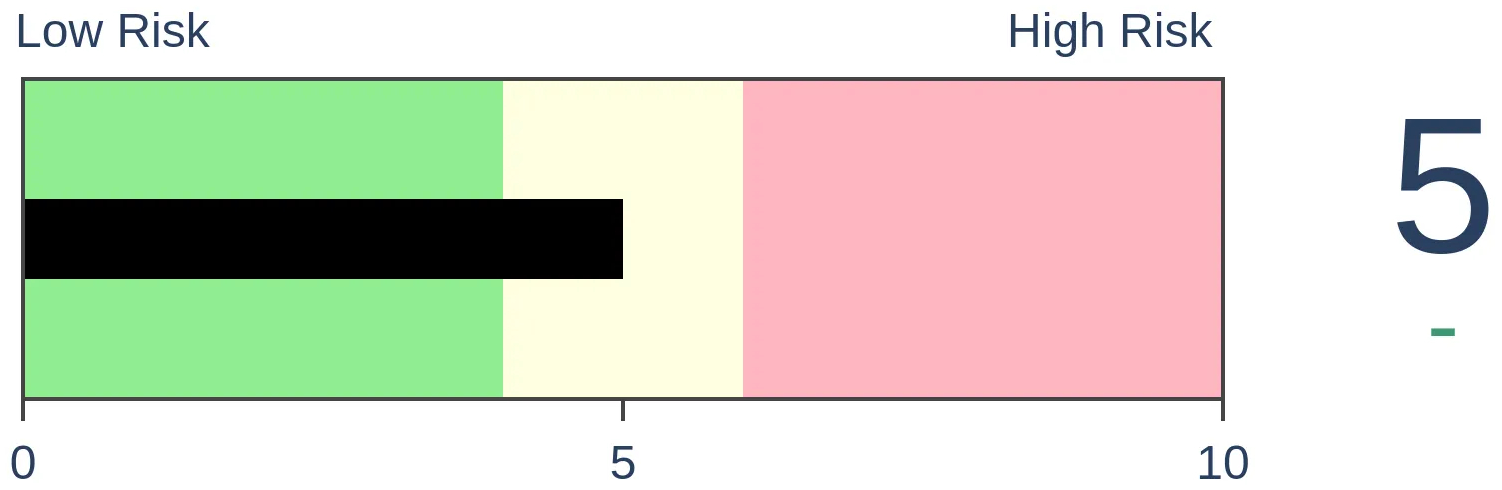
Bonds
|
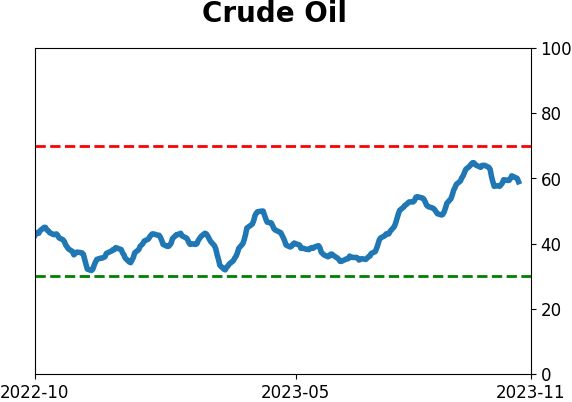
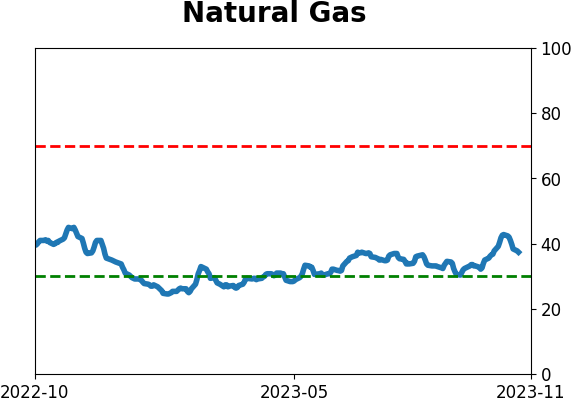
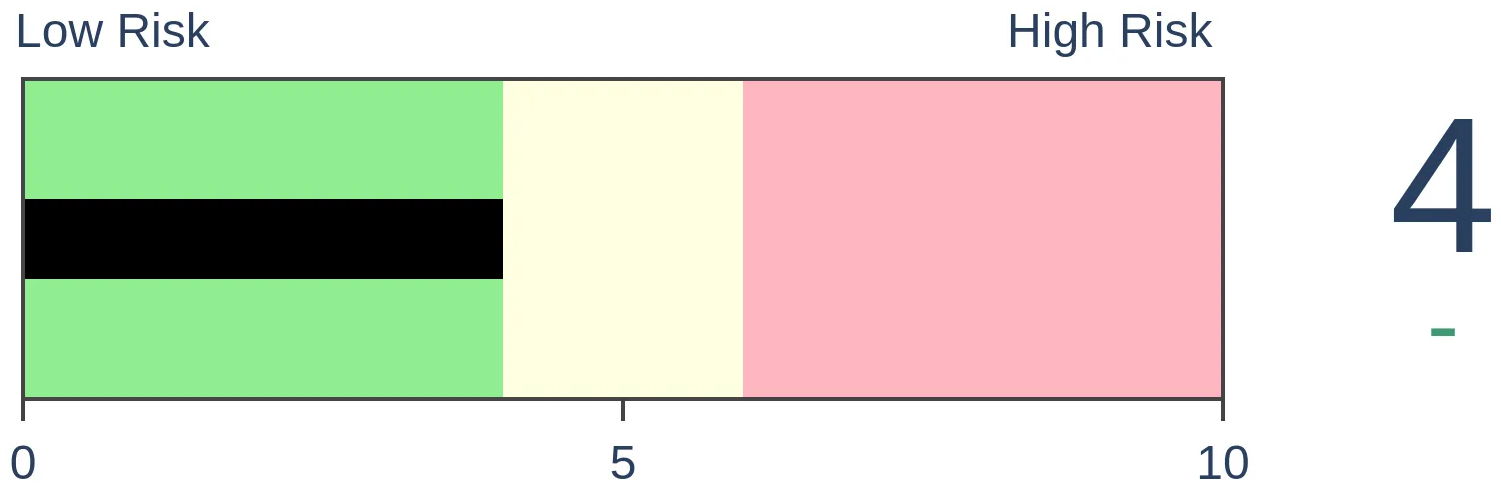
Crude Oil
|
|
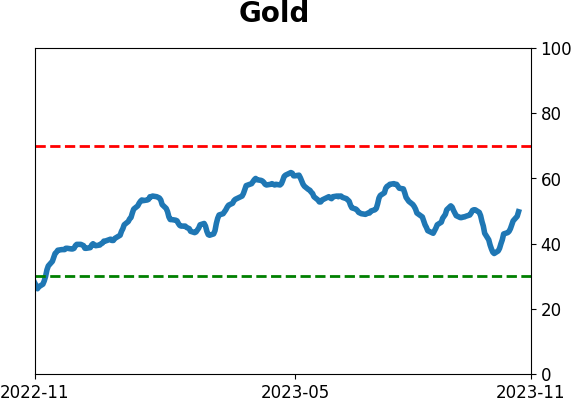
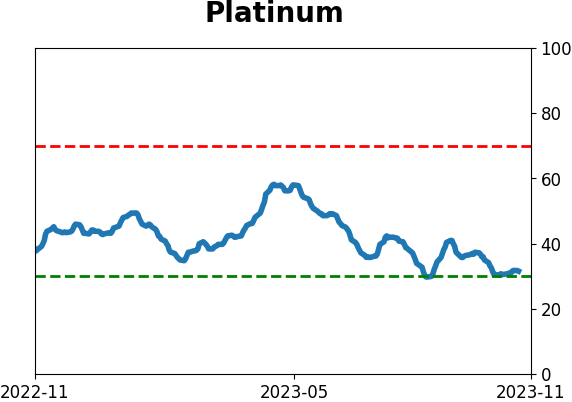
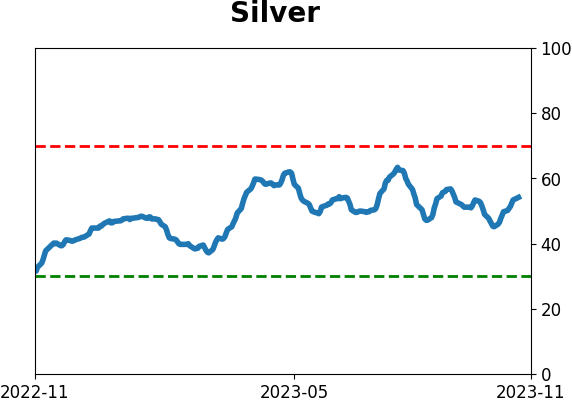
Gold
|
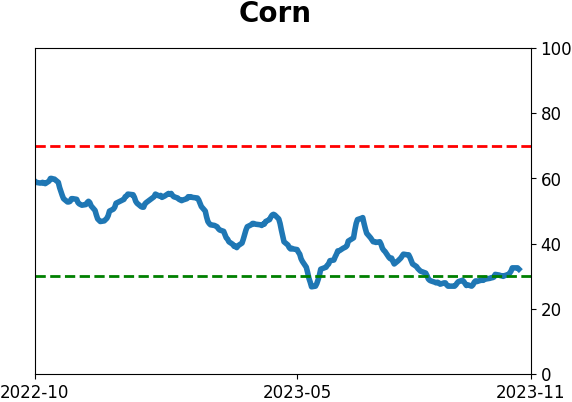
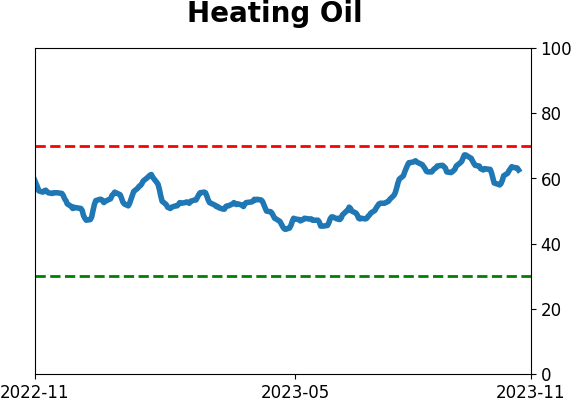
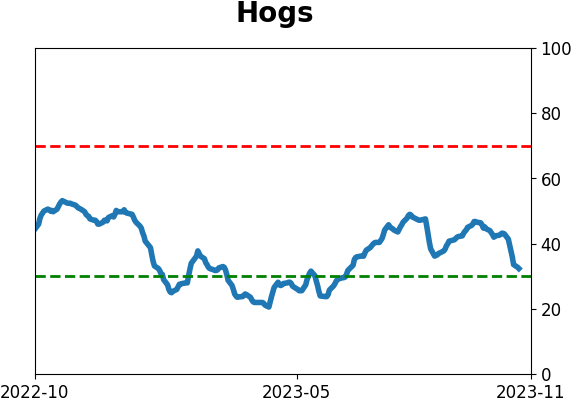
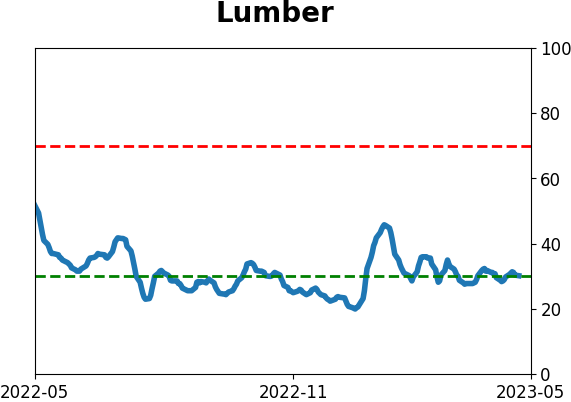
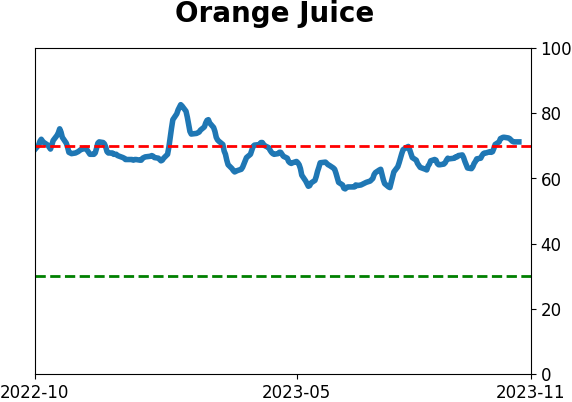
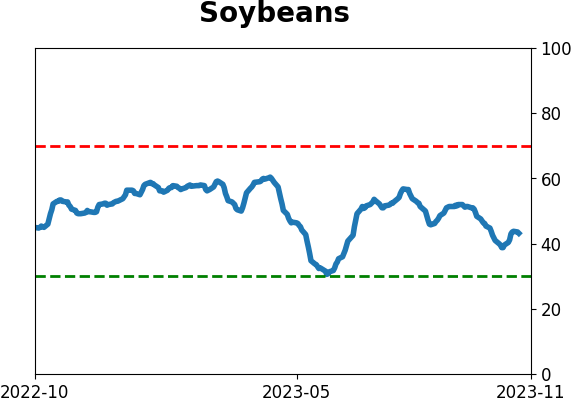
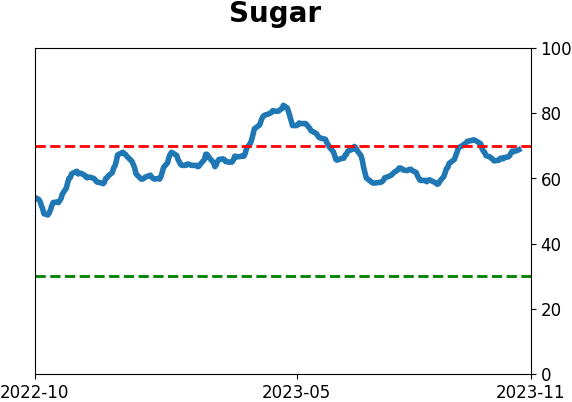
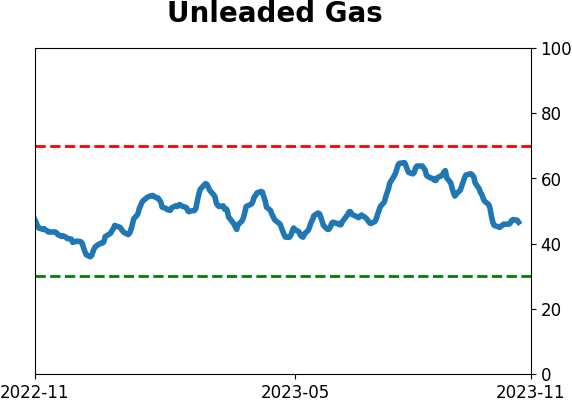
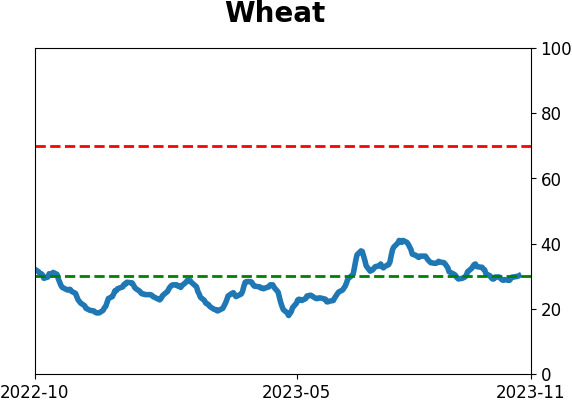
Agriculture

|
|
Research
By Jason Goepfert
BOTTOM LINE
In the first year of the rally off the October 2022 bottom, Small Cap stocks underperformed the S&P 500 to a near-record degree. There has also been abnormal investor preference among sectors and factors. While unusual behavior can sometimes precede poor returns, rallies most similar to the past year didn't do so consistently.
FORECAST / TIMEFRAME
None
|
Key points:
- In the first year following the October 2022 bottom, Small Caps have underperformed by a near-record degree
- There has also been an unusual pattern in how other sectors and factors have performed
- First-year rallies most similar to the current one have still mostly preceded higher prices, though
The first year of the rally has been unlike any other
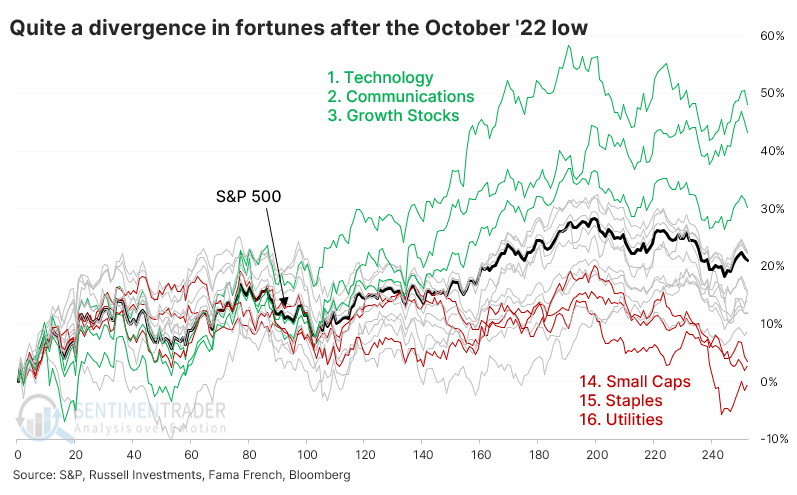
We've passed the one-year market of the October 2022 bottom, and things are looking...interesting. There has been a drastic split between winning and losing sectors and factors, unlike pretty much any other bottom since 1928.
Technology, Communications, and Growth stocks are leading the returns since last year while pulling up the rear are Utilities, Consumer Staples, and Small Caps. The first group kind of makes sense; the latter group less so.
According to The Wall Street Journal, this isn't normal:
Here's the basic outline of what happens in the first year of a bull market, using the lows of October 1990, October 2002, March 2009 and March 2020 as a template:
Everything goes up.
That's pretty much it. At the start of the past four bull markets, the rebound was led by banks and smaller companies. And in three out of the four bull markets, earnings forecasts rose, too. But investors took a simplistic approach to bullishness and bought almost everything. It was hard to lose money on stocks.
This time, large numbers of stocks went down, even as the S&P 500 went up. Banks did badly, and smaller companies worse, while earnings expectations have dropped. This isn't normal.
That's not wrong, in that this rally has not been typical. There hasn't been a one-year rally from a one-year low that looked quite like the mix we've seen this time around. We'll get back to that later.
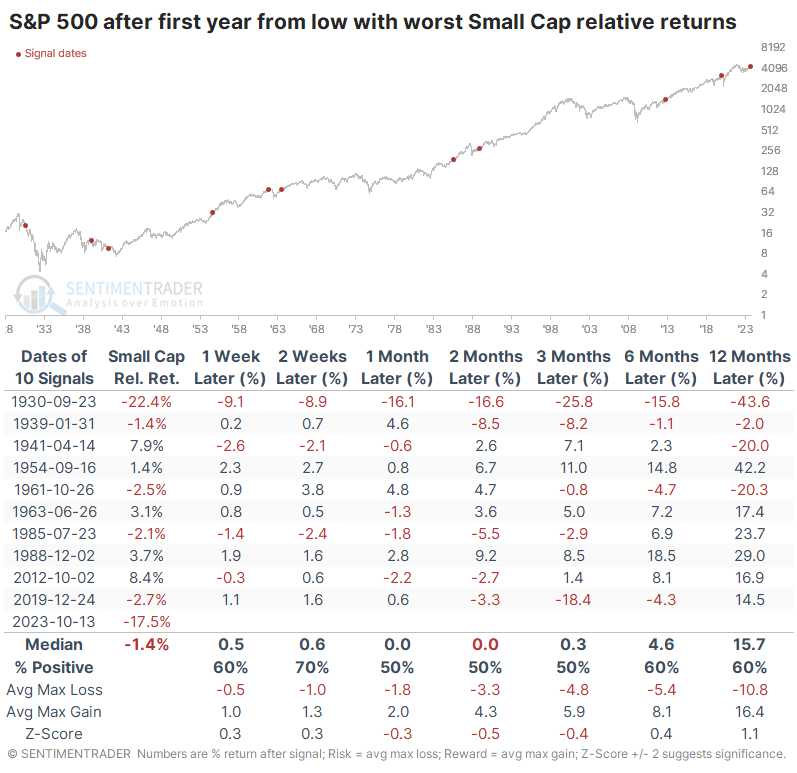
First, let's focus on Small Caps because that's been an increasing focus since they slid to lower lows last week. We use 252 trading days for the length of an average year in stocks. In that year since the 2022 bottom, Small Caps underperformed the S&P 500 by more than -17%, the 2nd-worst ever next to 1930. No other year even comes close.
That 1930 signal was a woeful sign for forward returns, and bulls would shudder to think of a repeat. And, generally, when Small Caps showed the worst relative returns compared to the S&P in the first year following a bottom, future returns in the S&P weren't all that great. They weren't terrible, either, though.
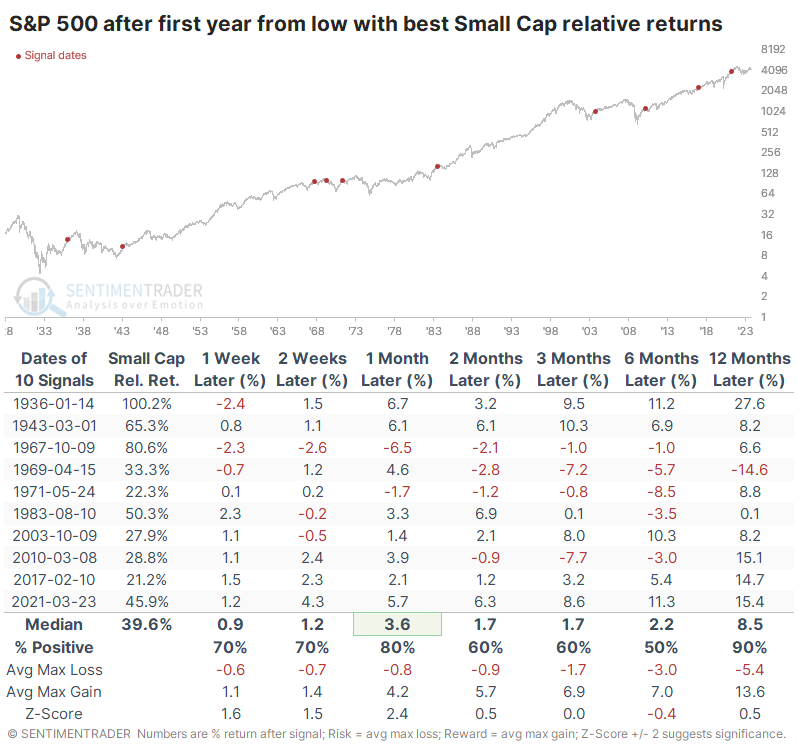
The table below shows the opposite condition, meaning those bottoms when Small Caps roared ahead the most relative to the S&P. On average, they outgained the S&P by nearly +40%. That didn't necessarily translate to future good returns for the S&P, especially after the first few months. In fact, the S&P's median return over the following 6-12 months was worse than it was when Small Caps had underperformed the most.
A most abnormal year for sectors and factors
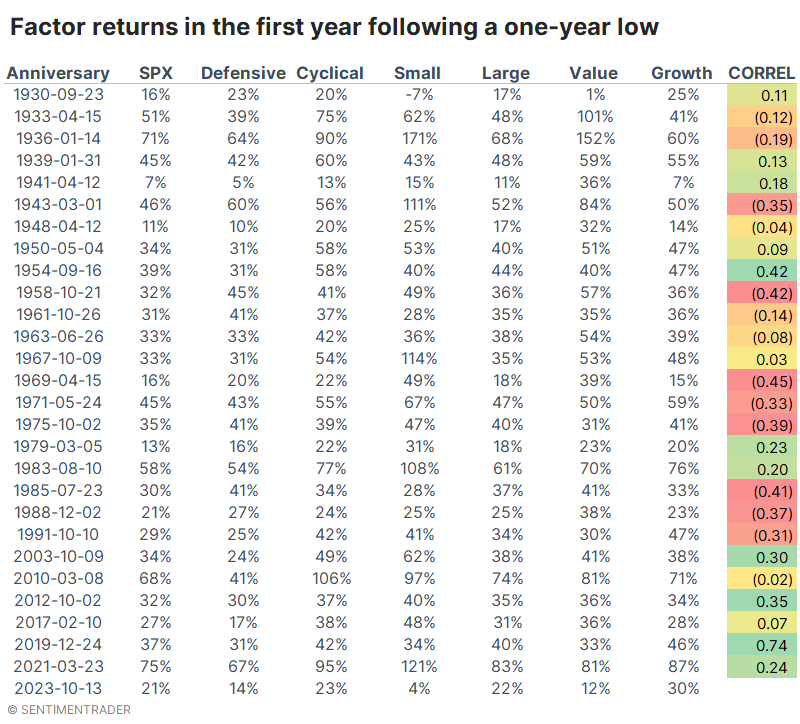
The table below has a whole bunch of numbers, and most can be tuned out. It shows each sector's return in the first year following a bottom, with the final column, CORRL, showing the correlation of those sector returns to the returns we saw across sectors over the past year.
So, for example, the 1985 bottom was the most unlike the current one. Staples and Utilities roared higher in the first year of that rally. At the same time, Technology and Industrials were relative underperformers, pretty much the opposite of what we saw over the past year. The 2019 bottom was most similar to the current one, with a +0.73 correlation (out of a scale of -1.0 to +1.0).
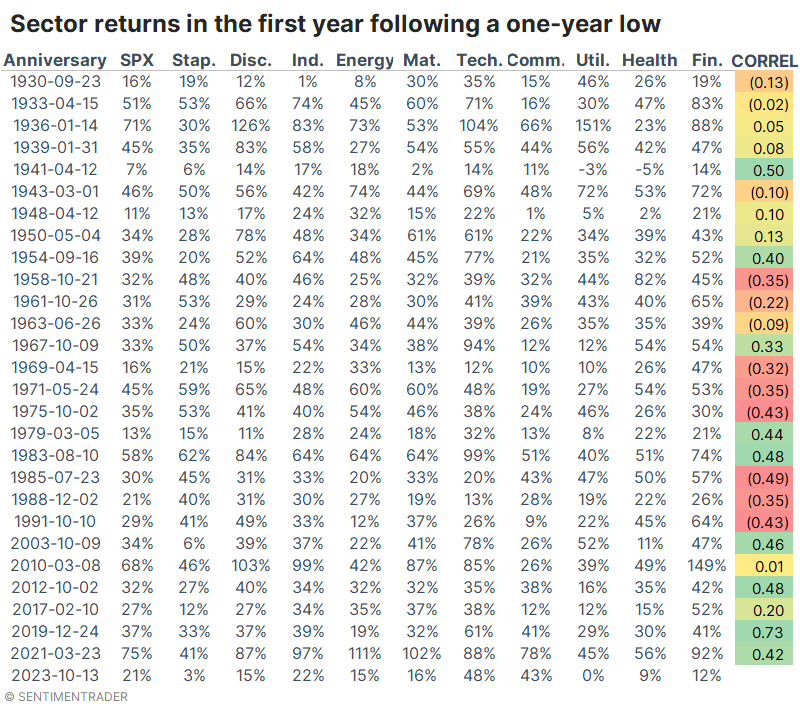
The following table uses the same methodology but looks at broader factors. During the 1968-69 rally, investors favored factors most unlike the past year, while again, 2019 showed the highest positive correlation.
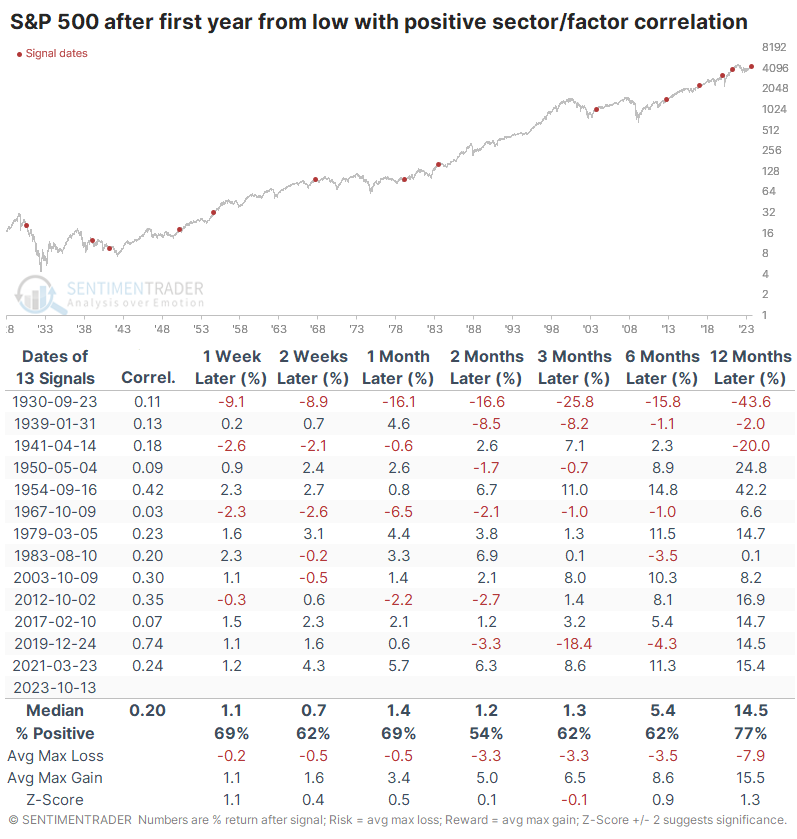
We care most about what that might mean, so the table below shows the S&P 500's returns following the first anniversary of rallies that showed the highest correlations to the past year. Most of them were pretty weak, though the troublesome 1930 comparison reappears. Other than that signal, most of the others led to generally higher prices without much in terms of drawdown. The 2019 precedent, which had the highest correlation, did get interrupted by the pandemic, which is a big asterisk.
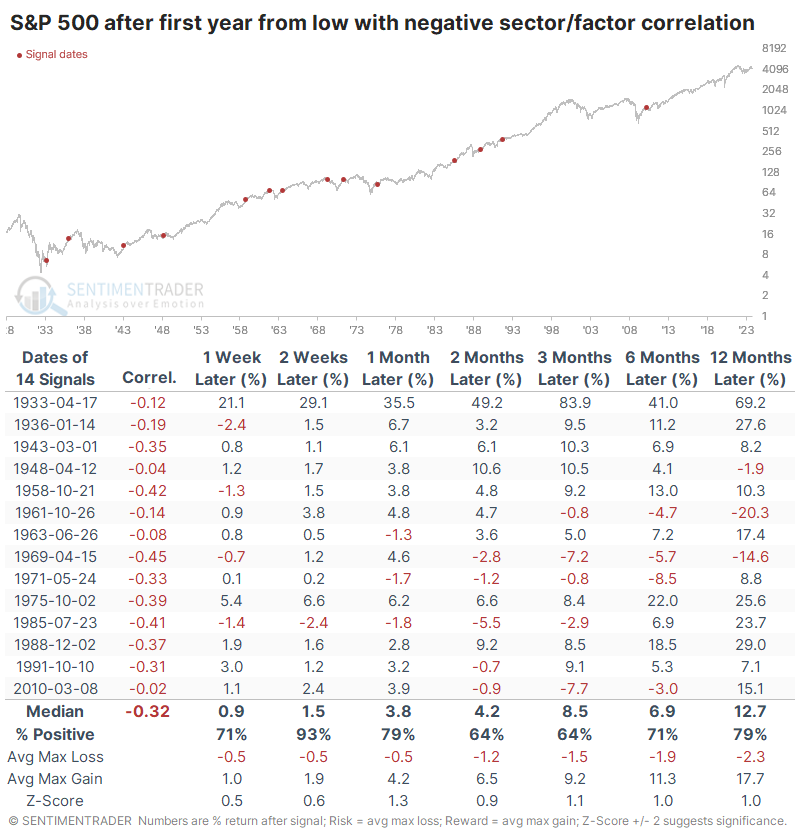
We like to look at counter-examples to see if it helps or hurts any conclusion. If the least-correlated rallies showed mostly negative forward returns, that would bolster a bullish argument.
That's not really the case, though. After the one-year rallies with sector and factor returns least correlated to the past year, the S&P 500's forward returns were pretty good - better in the short- and medium-term than in the table above, though more recent decades showed worse returns.
What the research tells us...
There is a lot of concern about lagging Small Cap stocks and what that means for the broader market and even broader economy. Often, too much is read into these signals, and from what we can see above, their lag over the past year has been an inconsistent predictor.
When Small Caps badly lag the S&P 500 in the first year of a rally, future medium- to long-term returns weren't impacted too much. The same goes for the types of sectors and factors investors favored during this rally's first year. We might have a bit of a stronger bullish argument if Small Caps hadn't underperformed by so much and if there was more "normal" behavior among sectors and factors. But it's not a strong argument, which suggests we shouldn't be all that worried about how abnormal the past year has been.
Indicators at Extremes
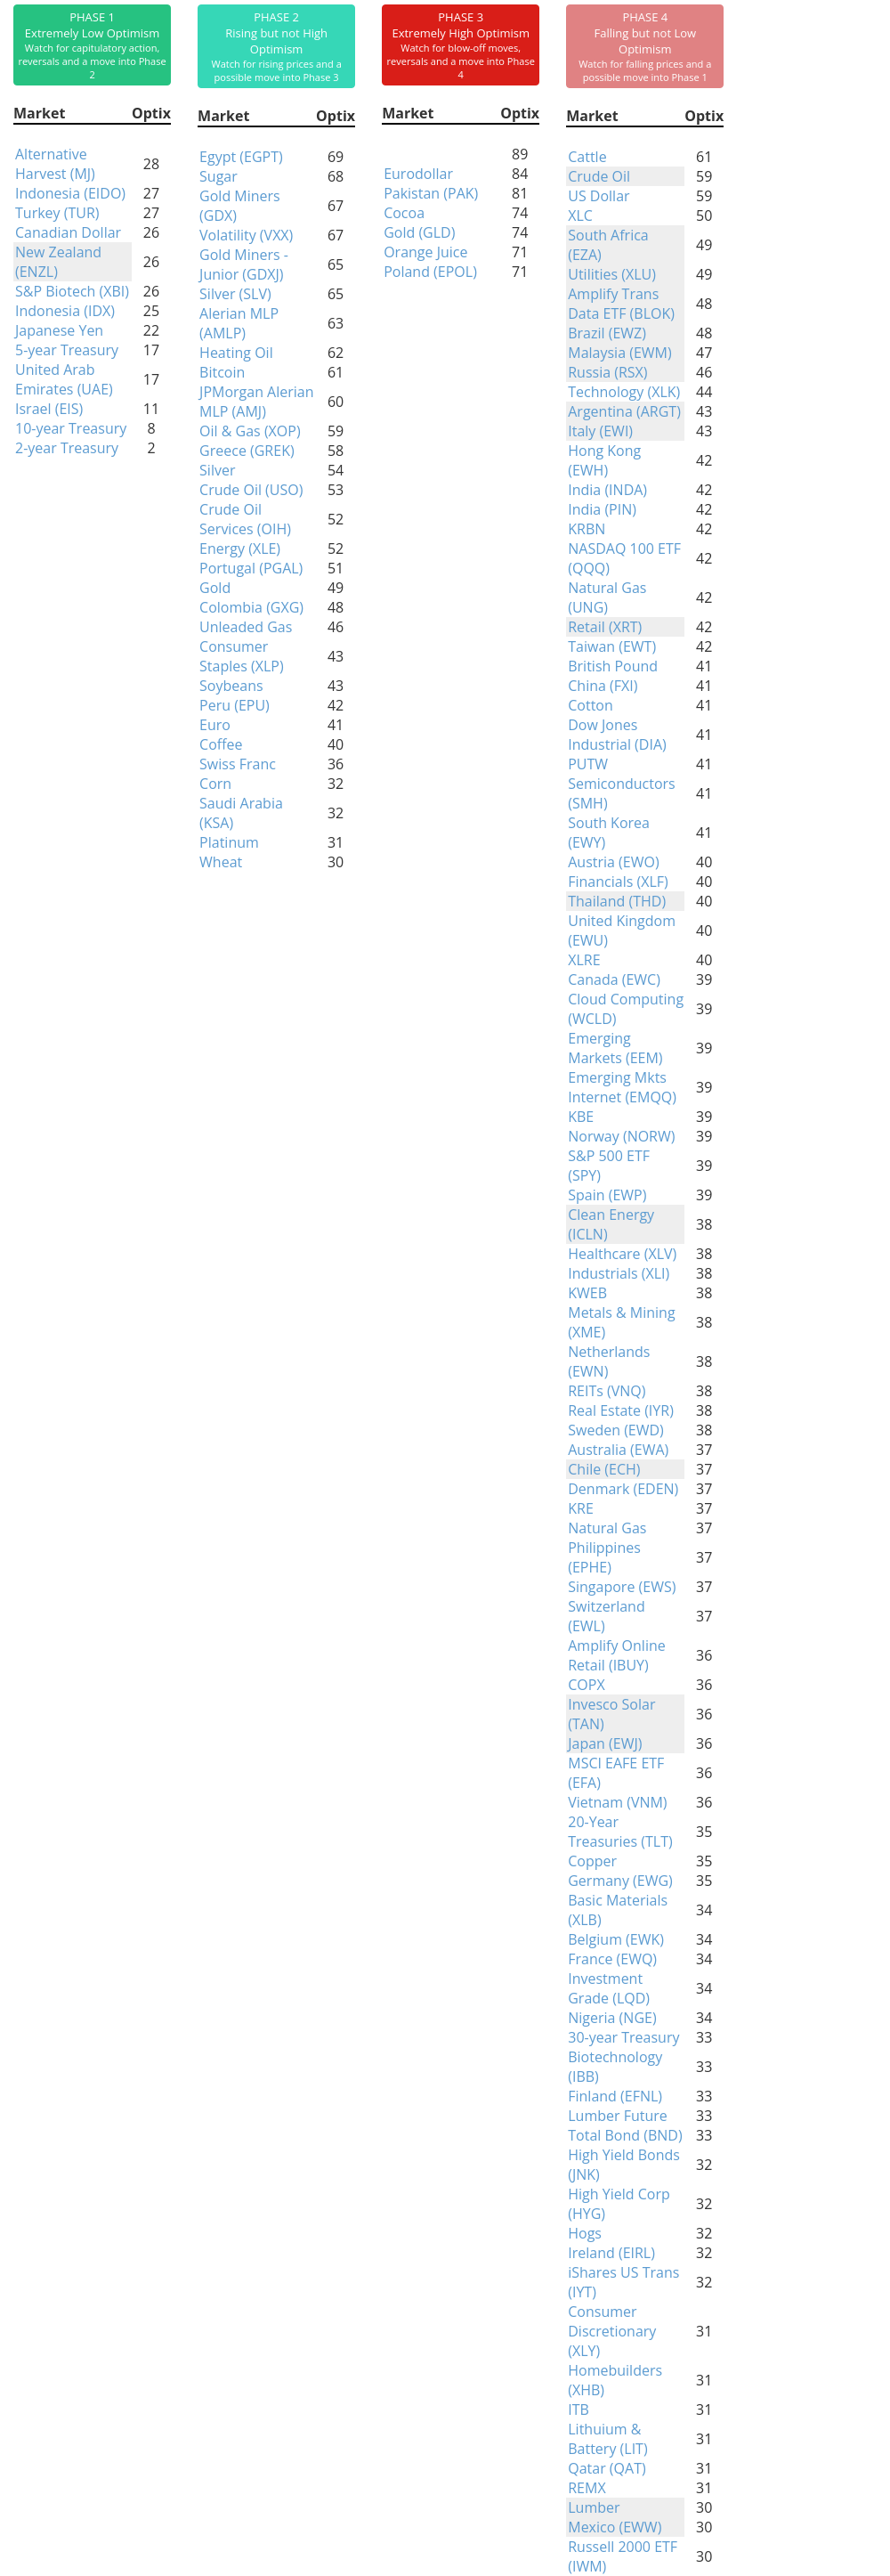
Phase Table
Ranks
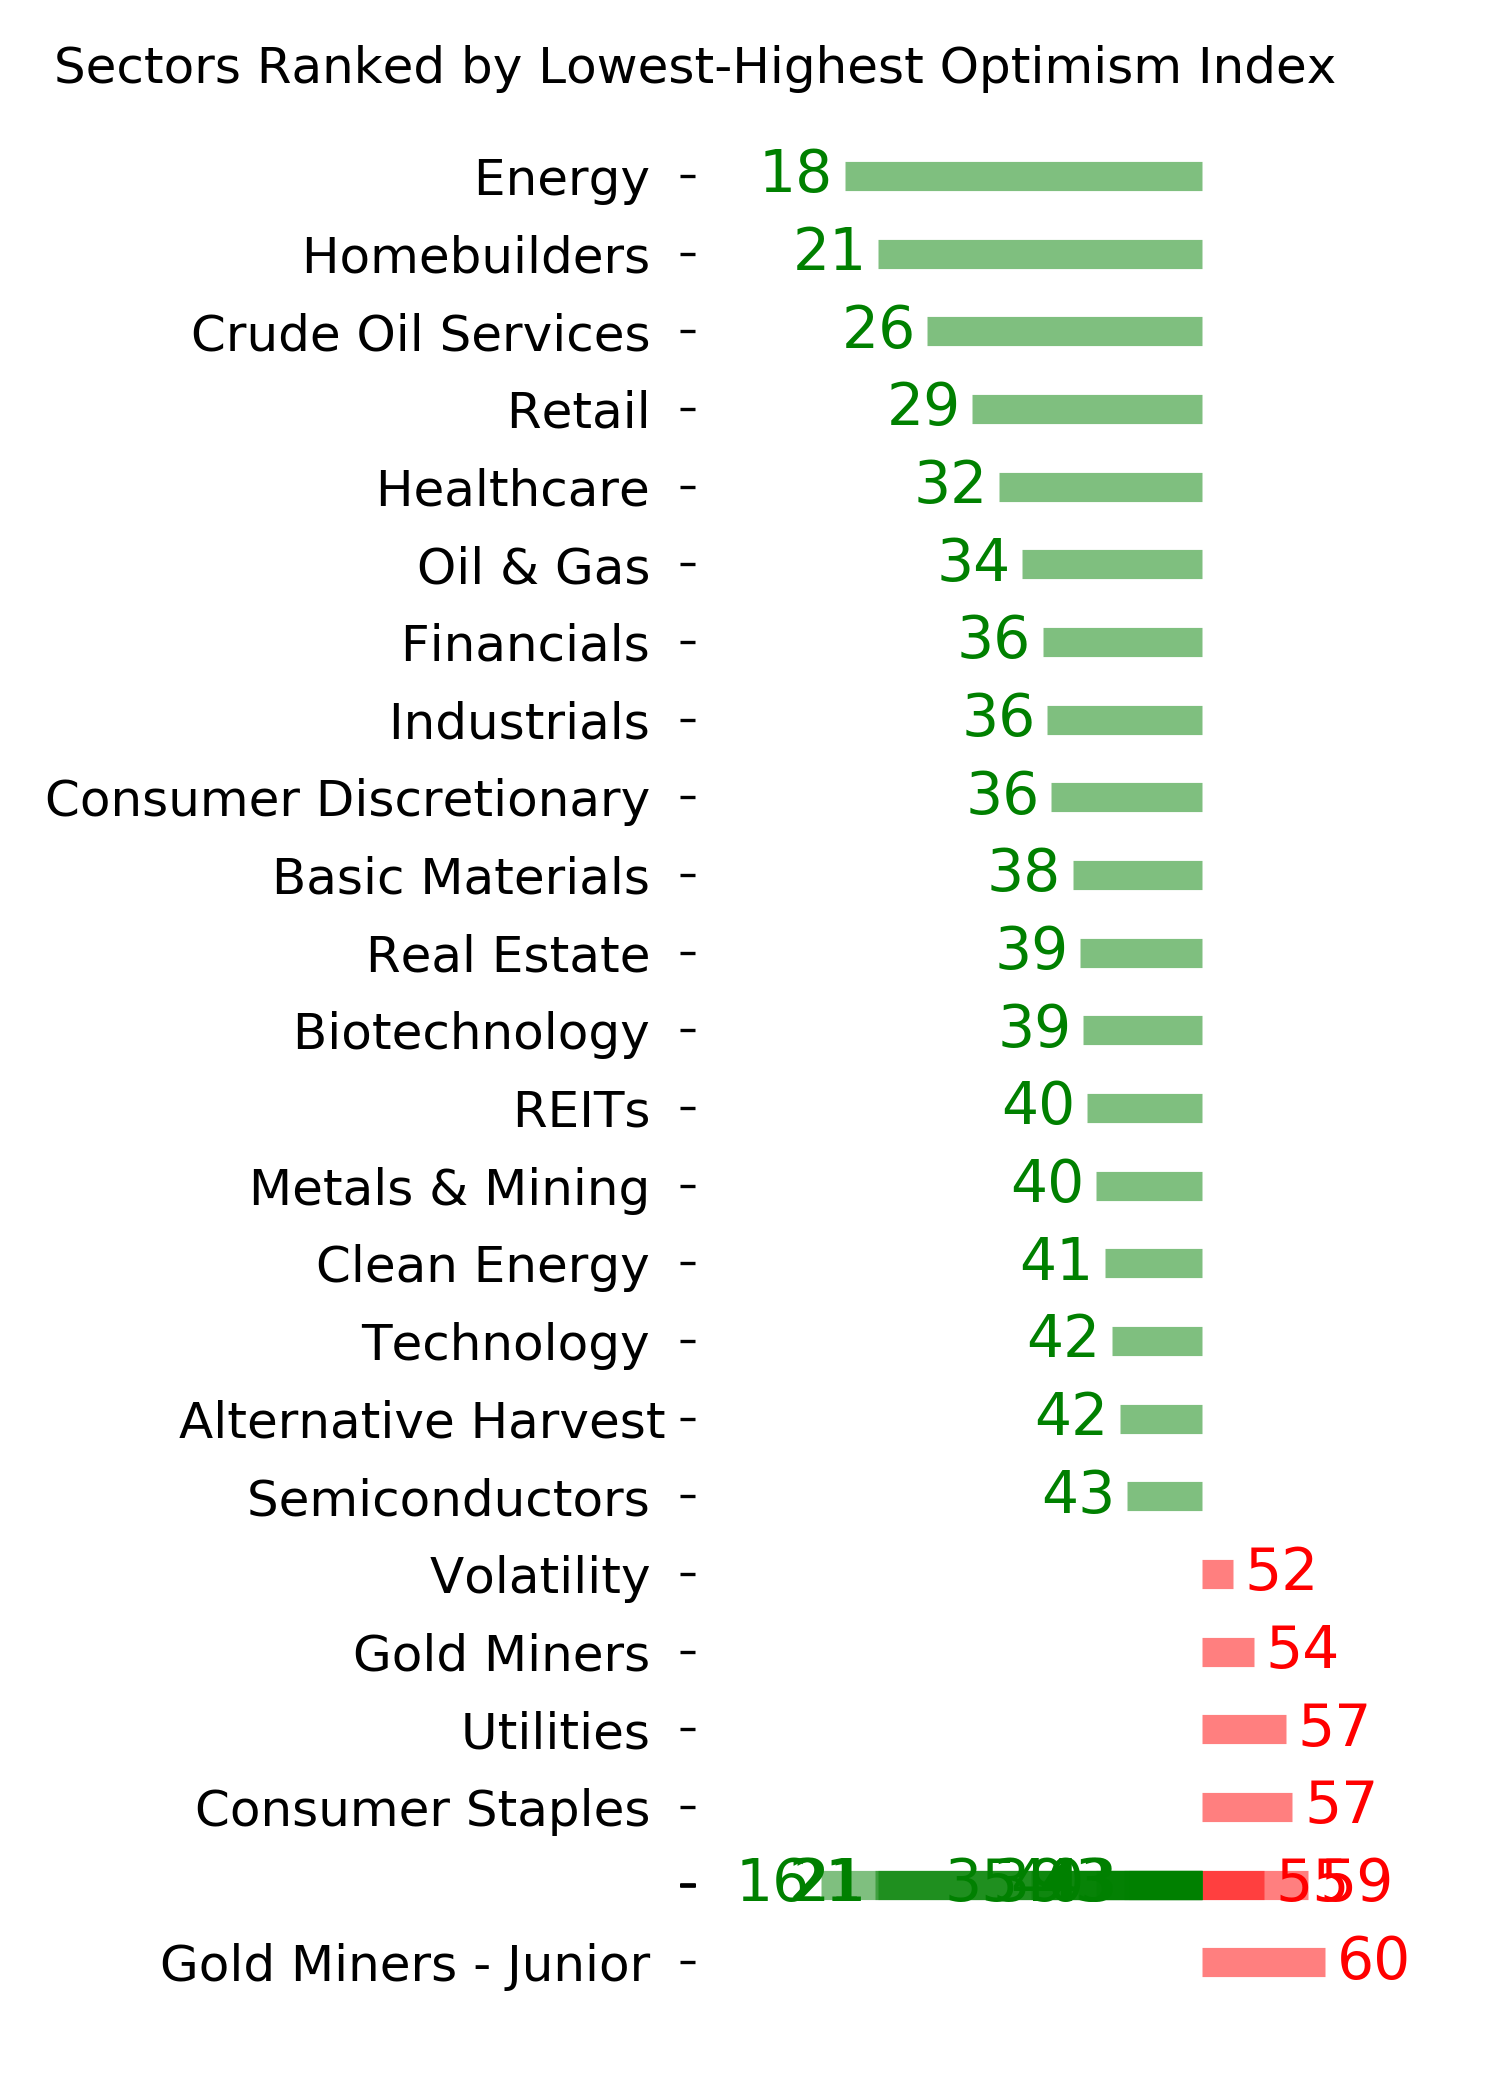
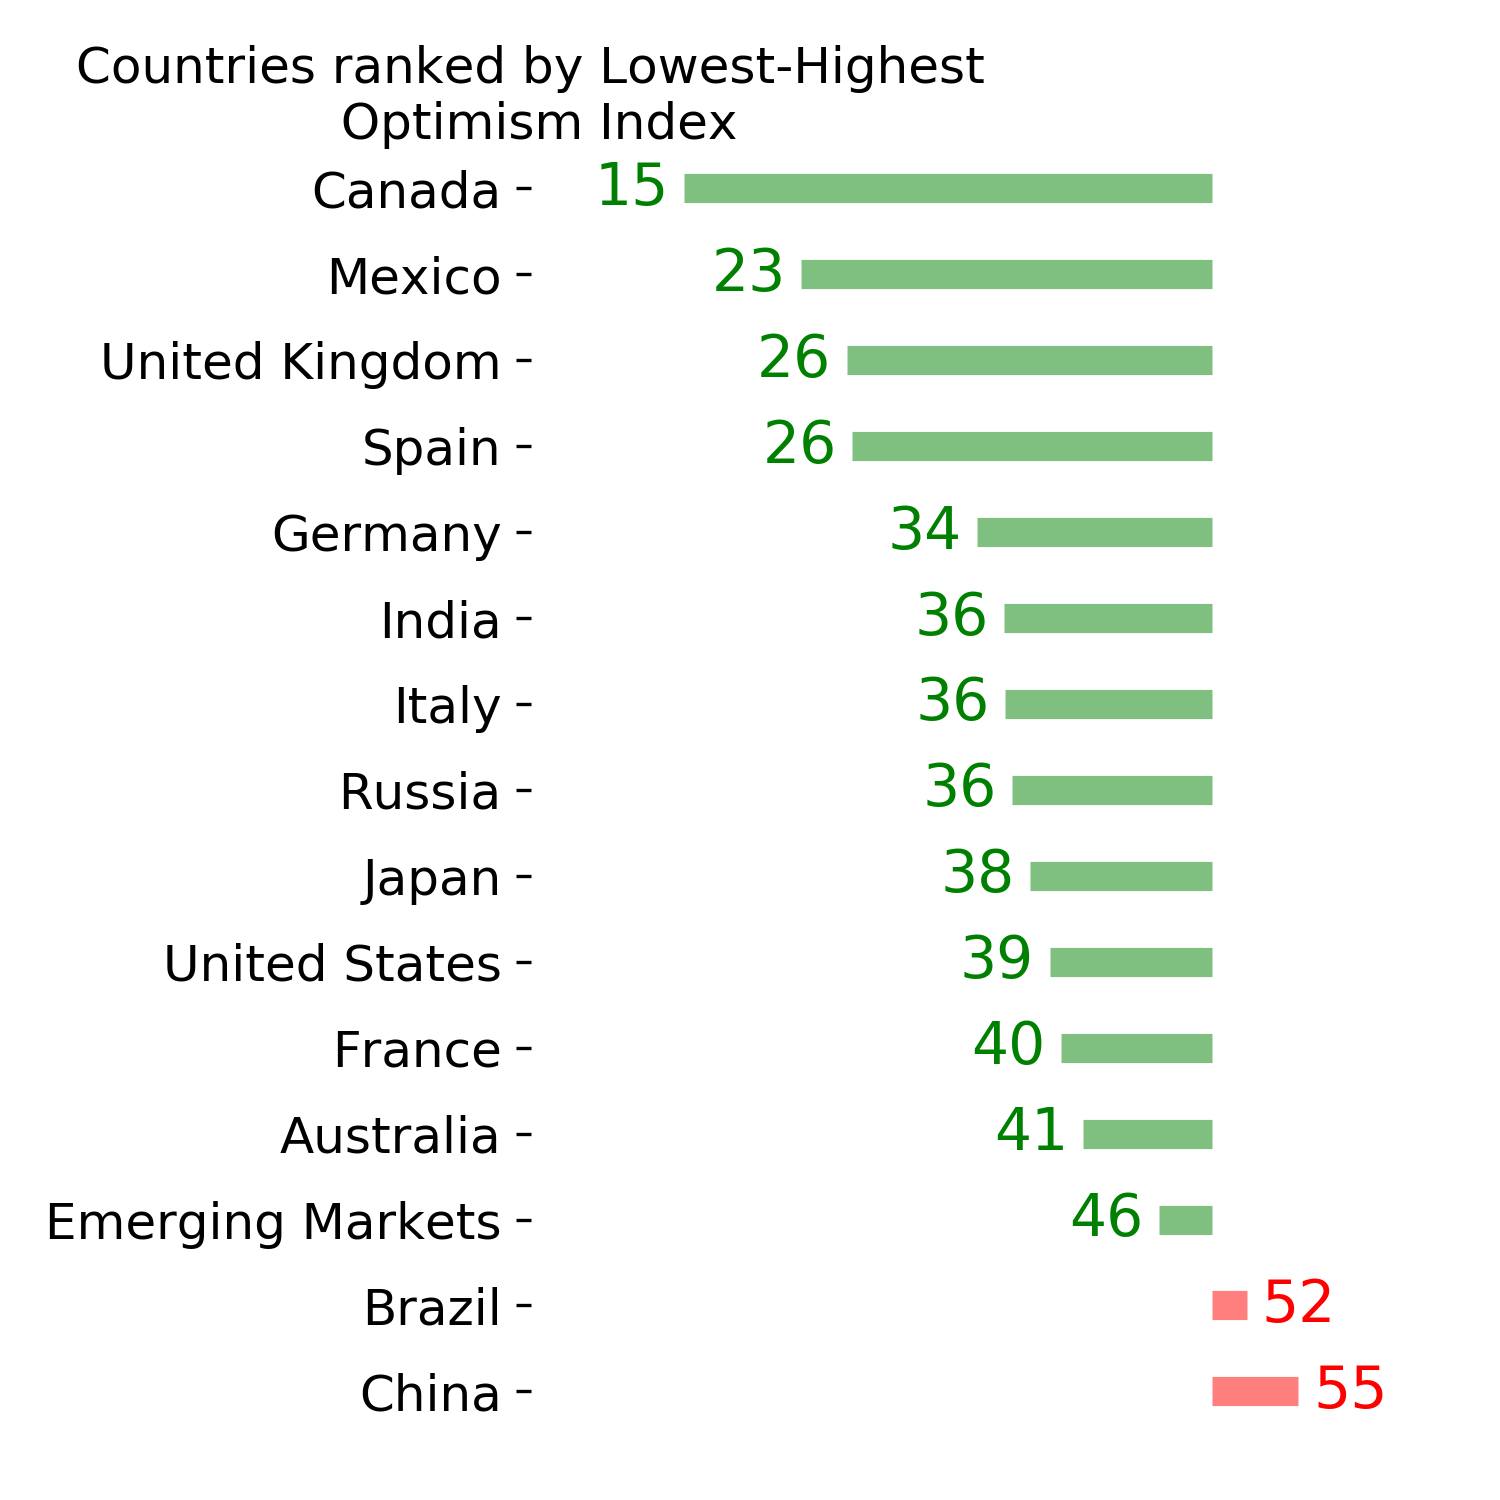
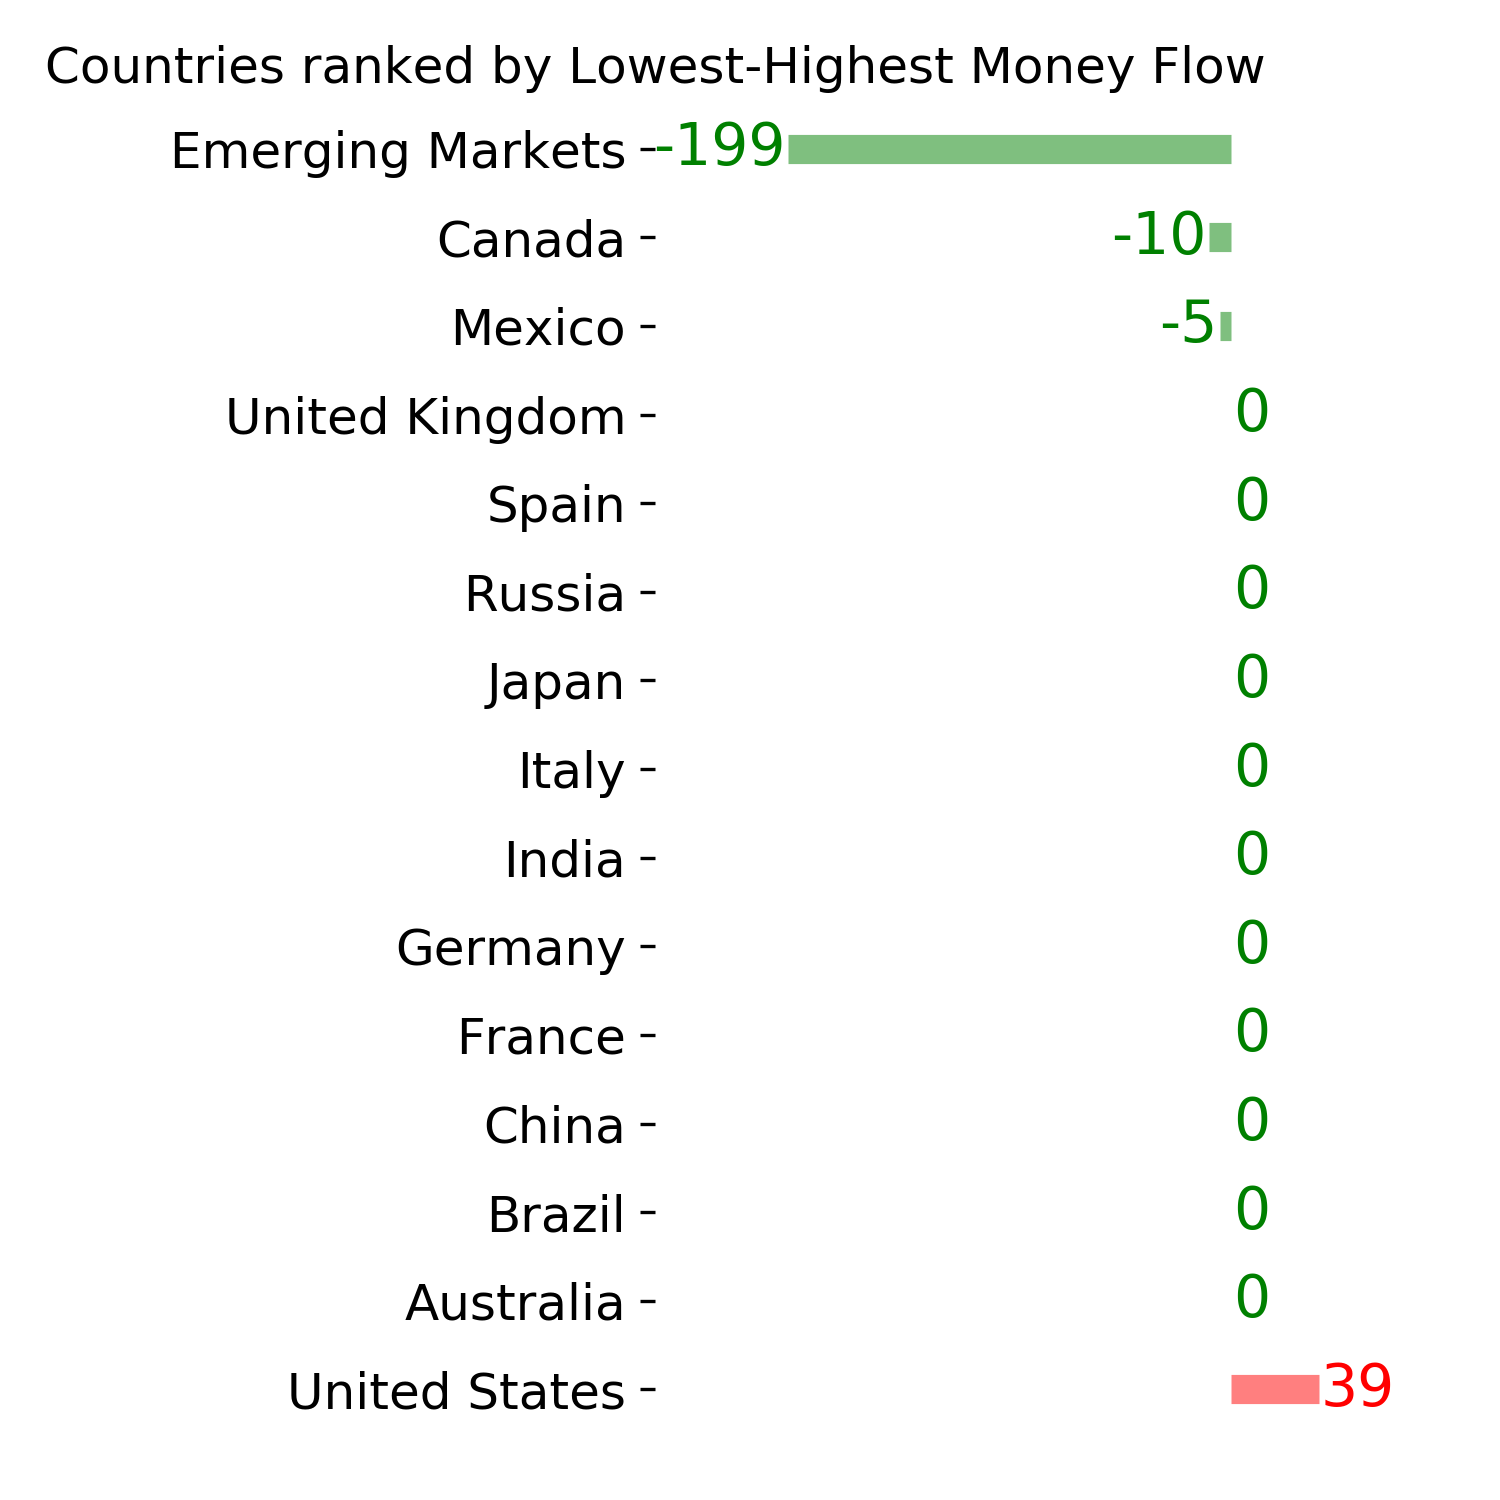
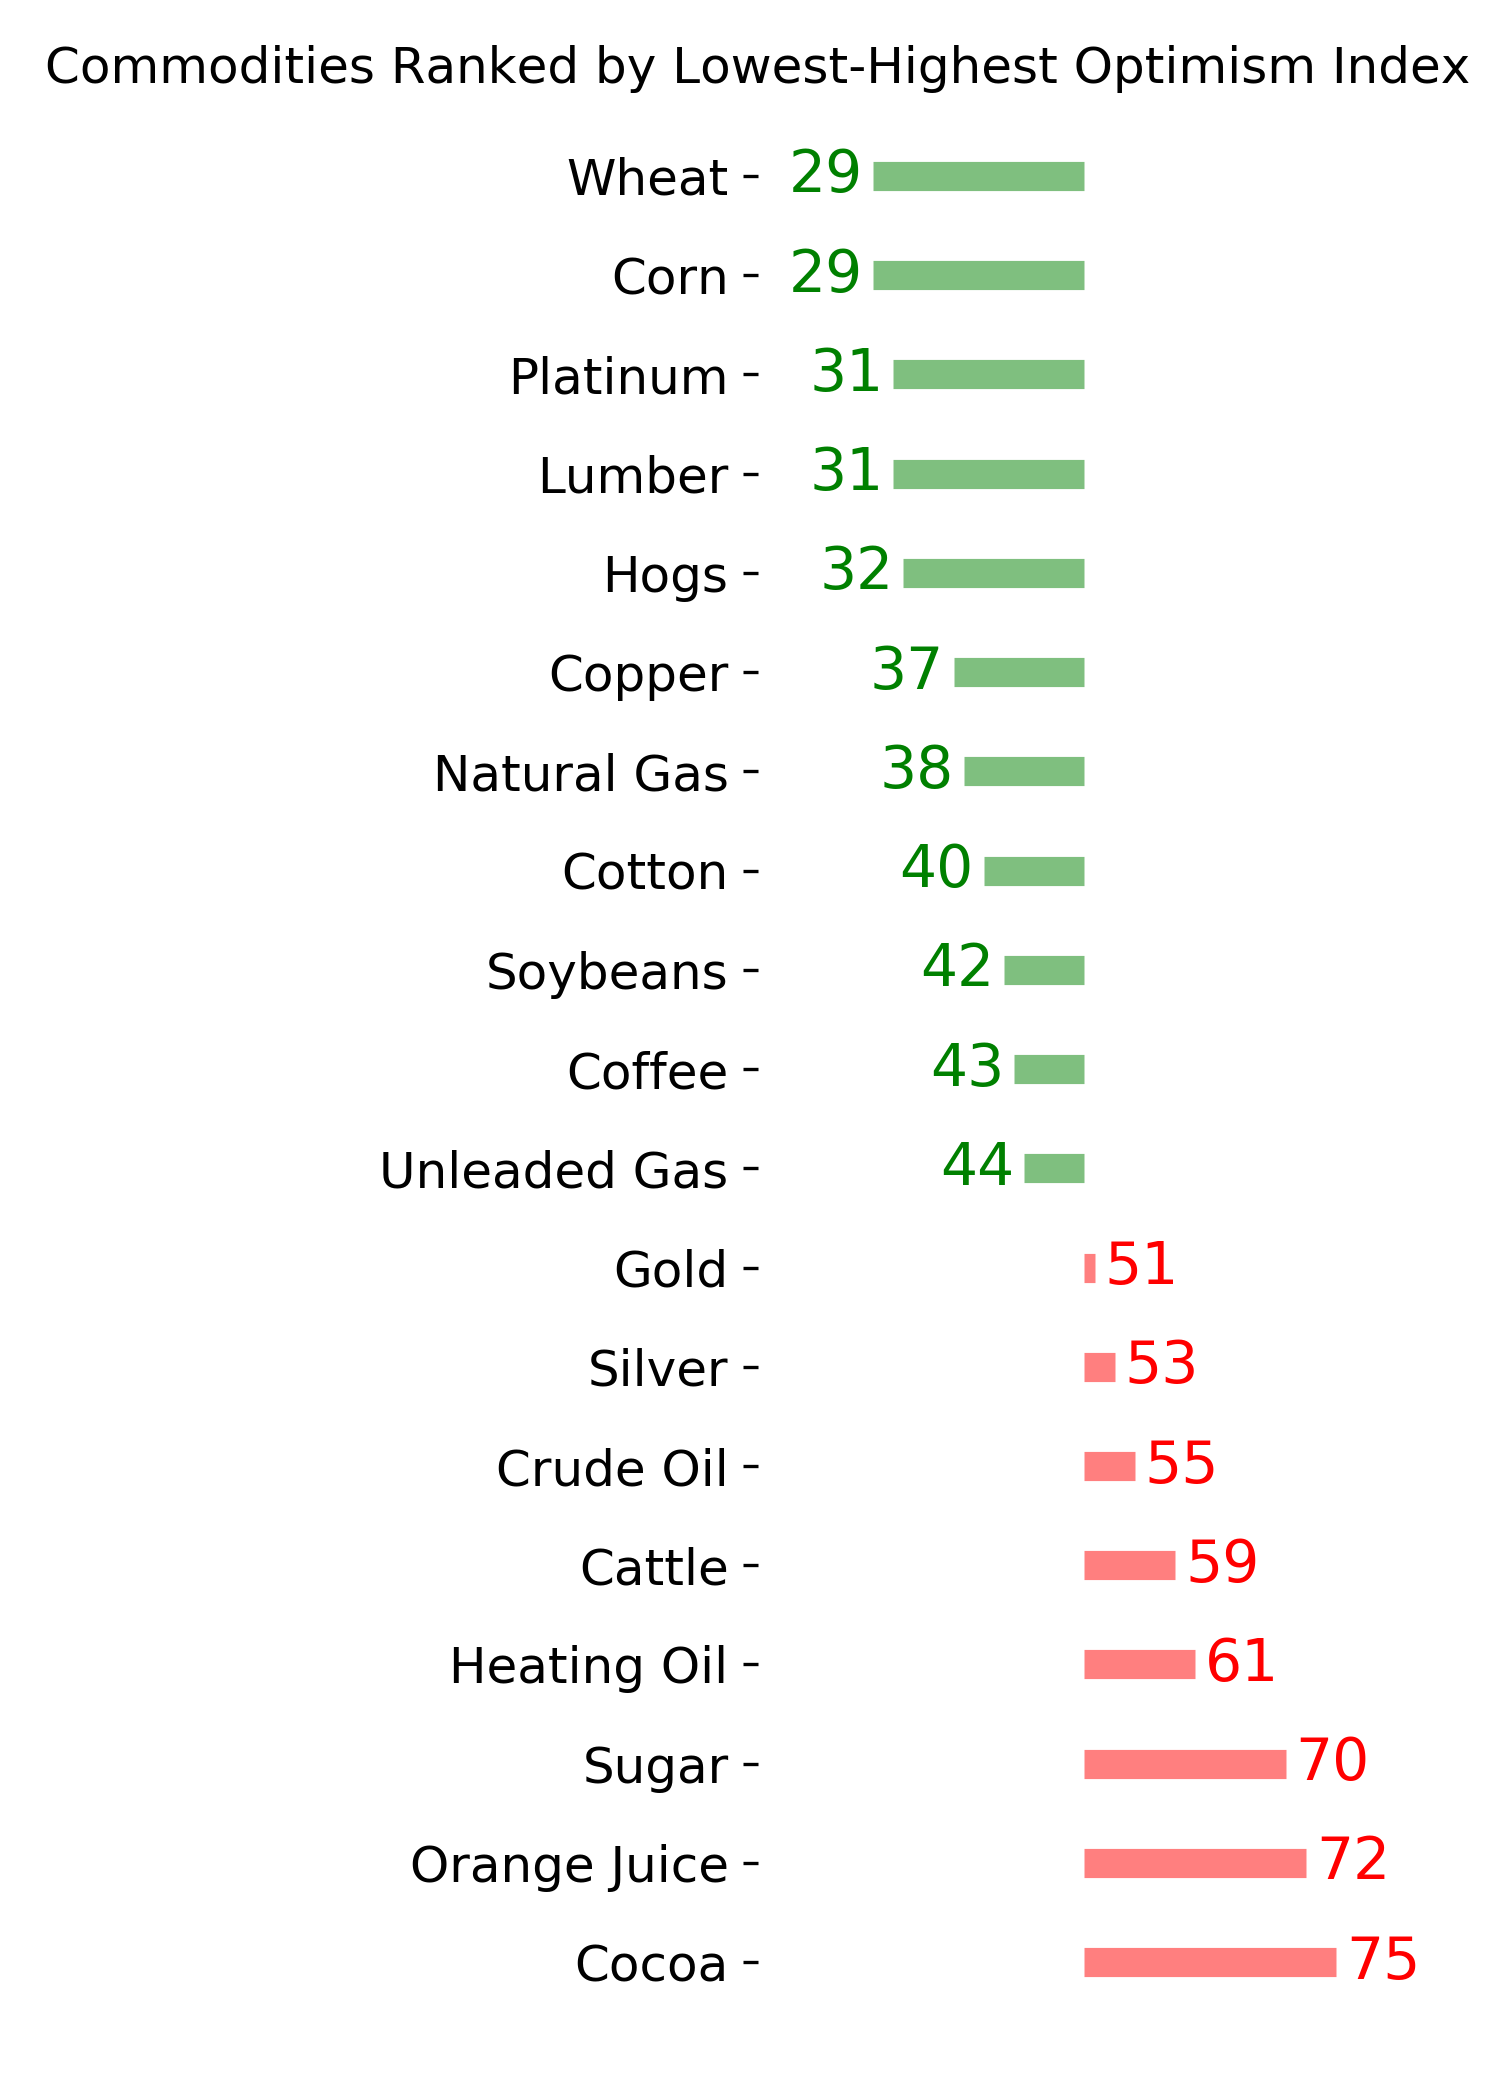
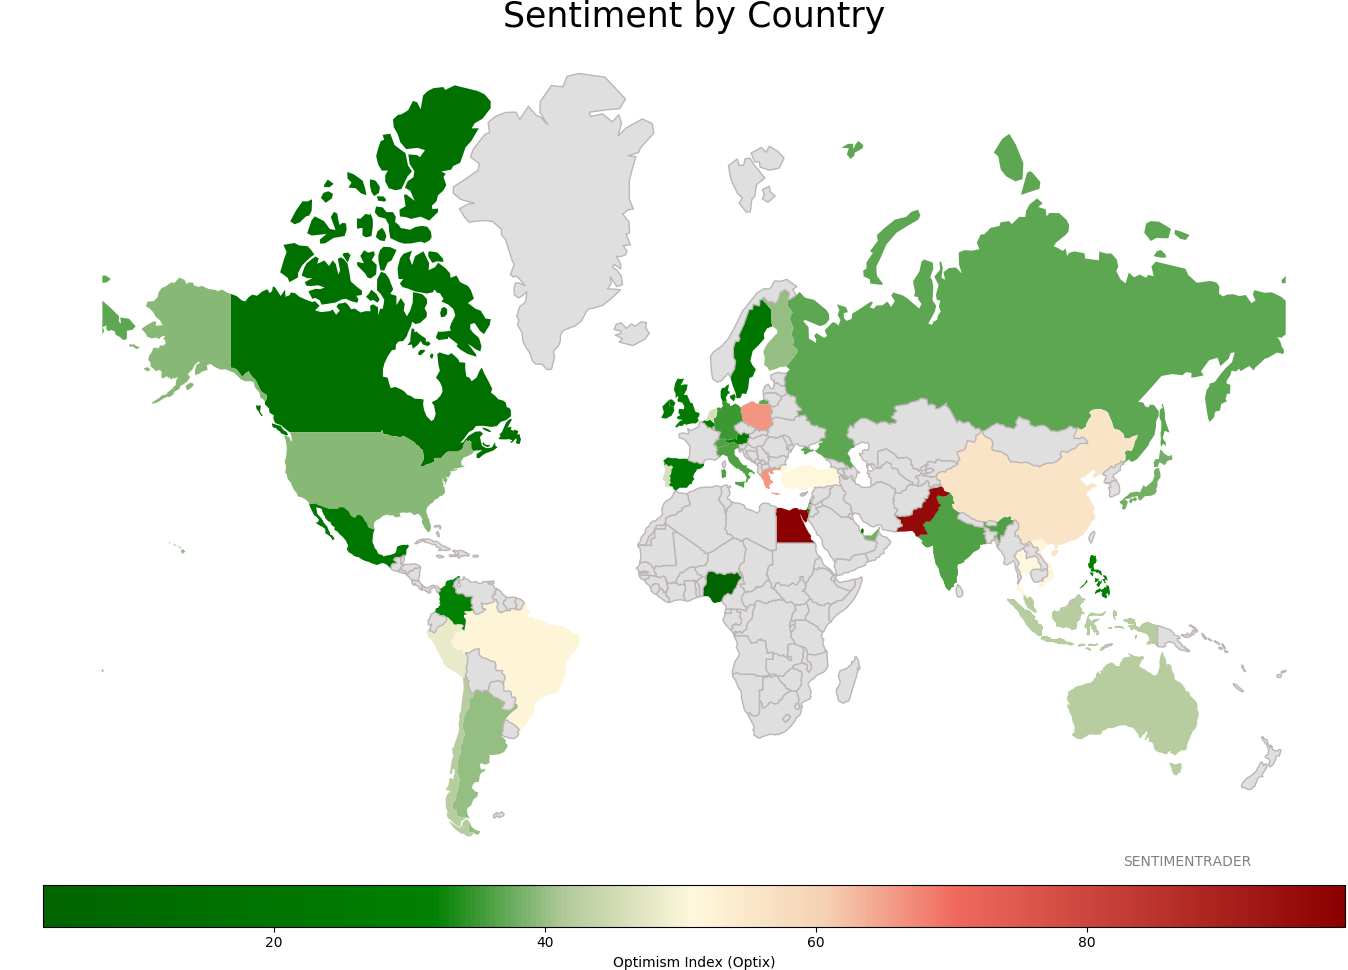
Sentiment Around The World
Optimism Index Thumbnails
|
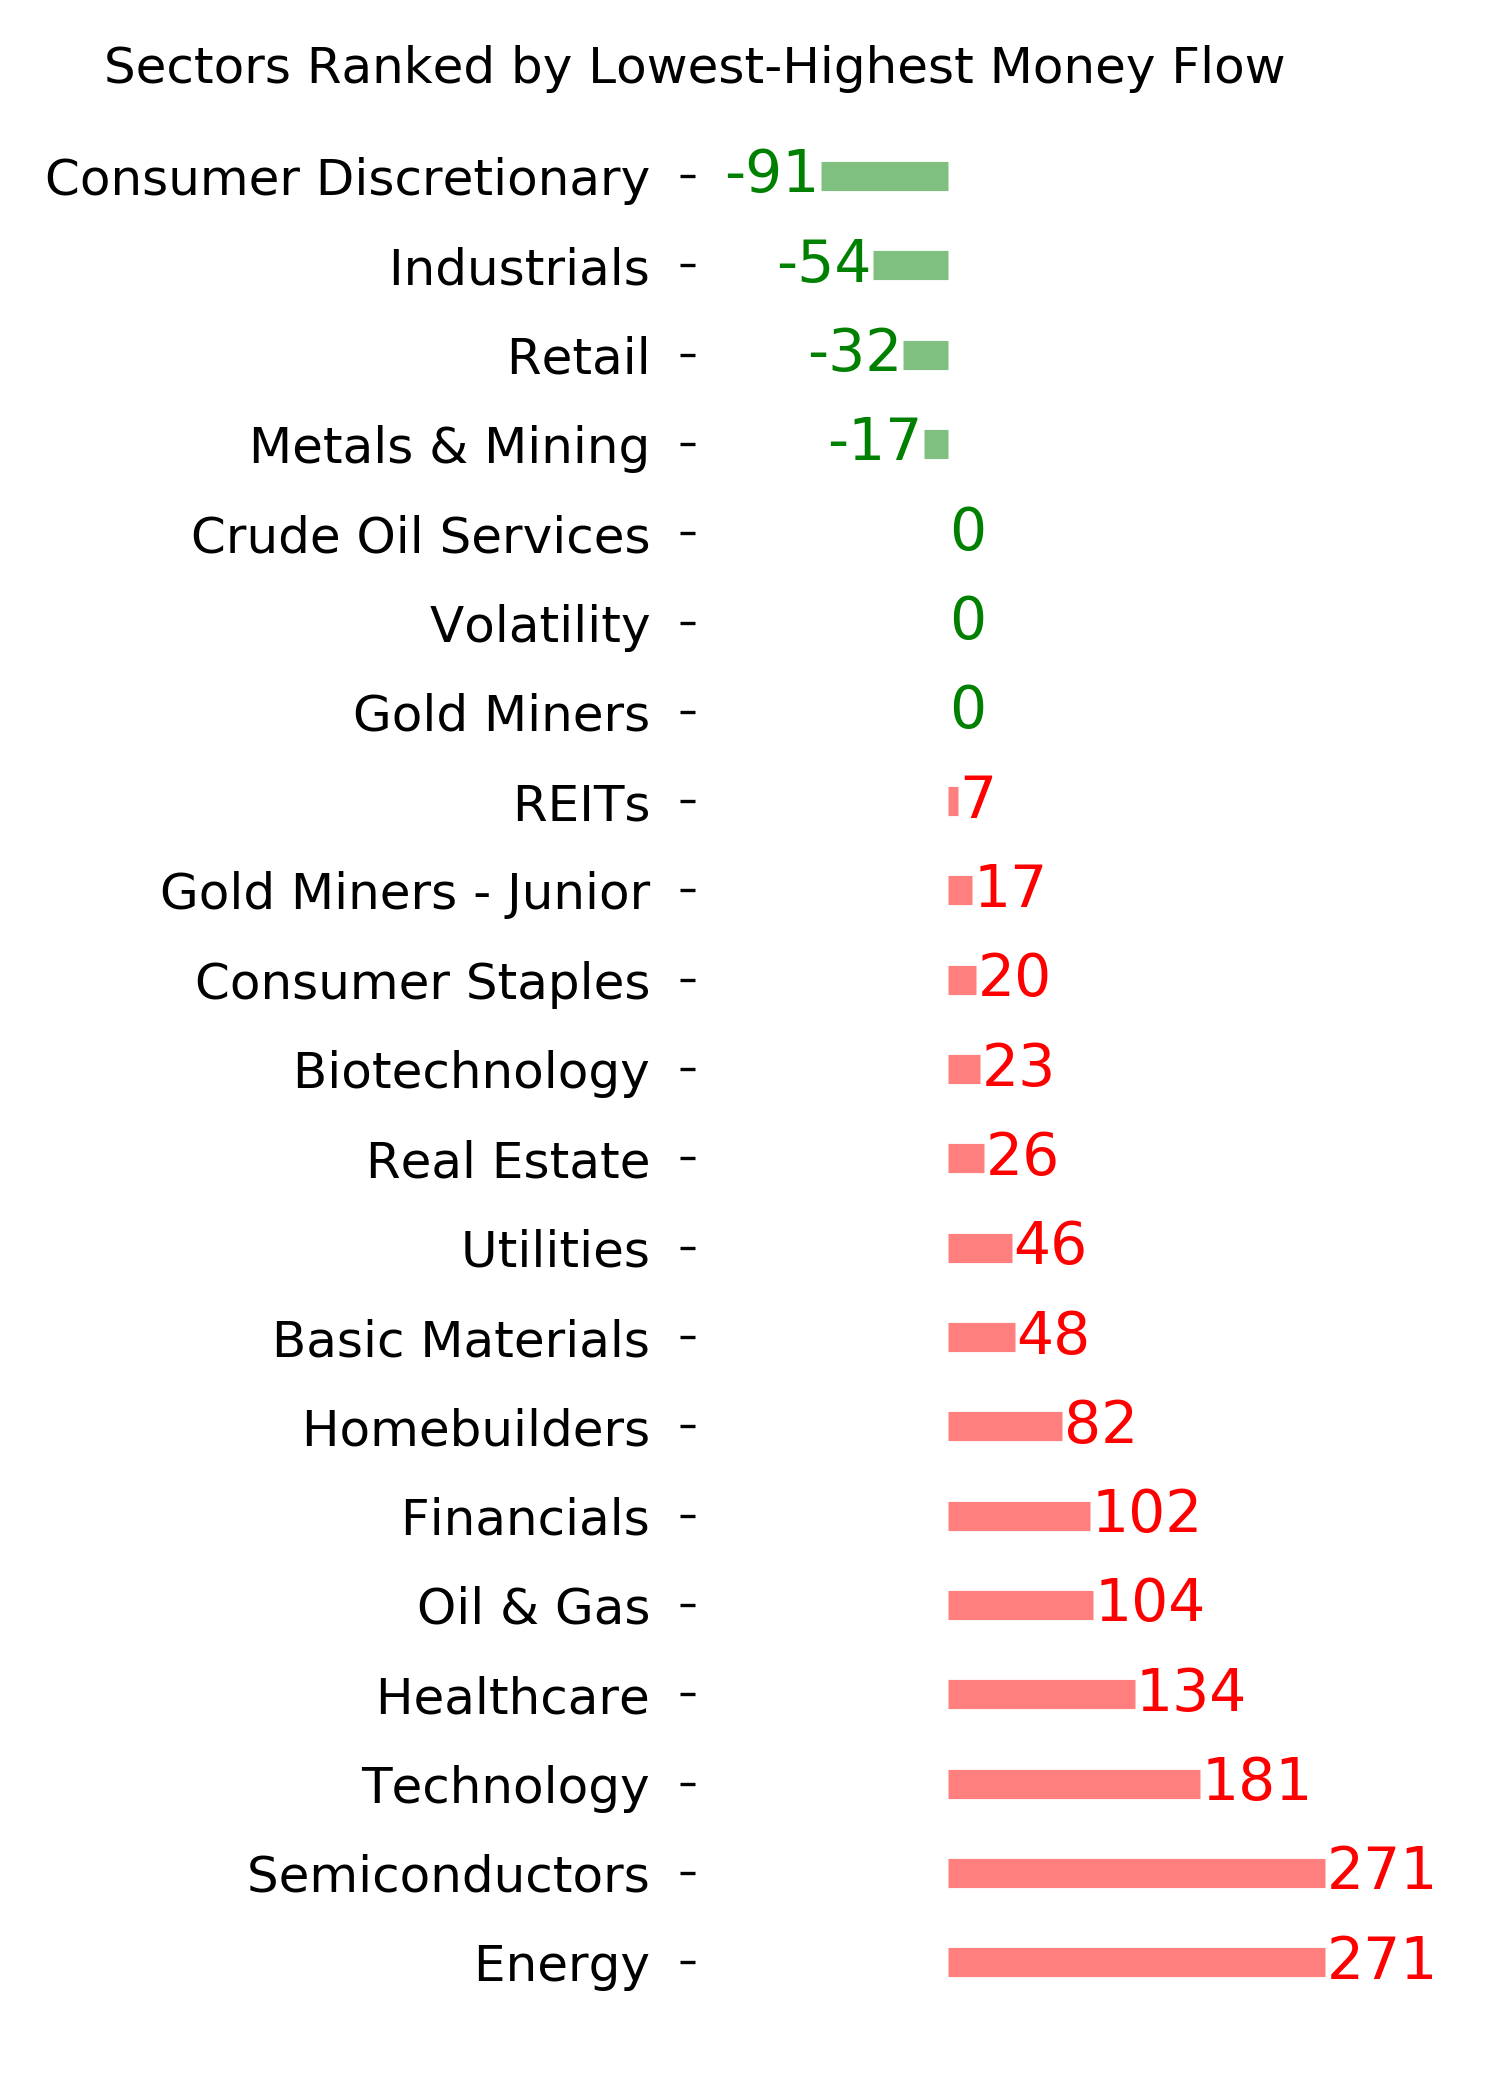
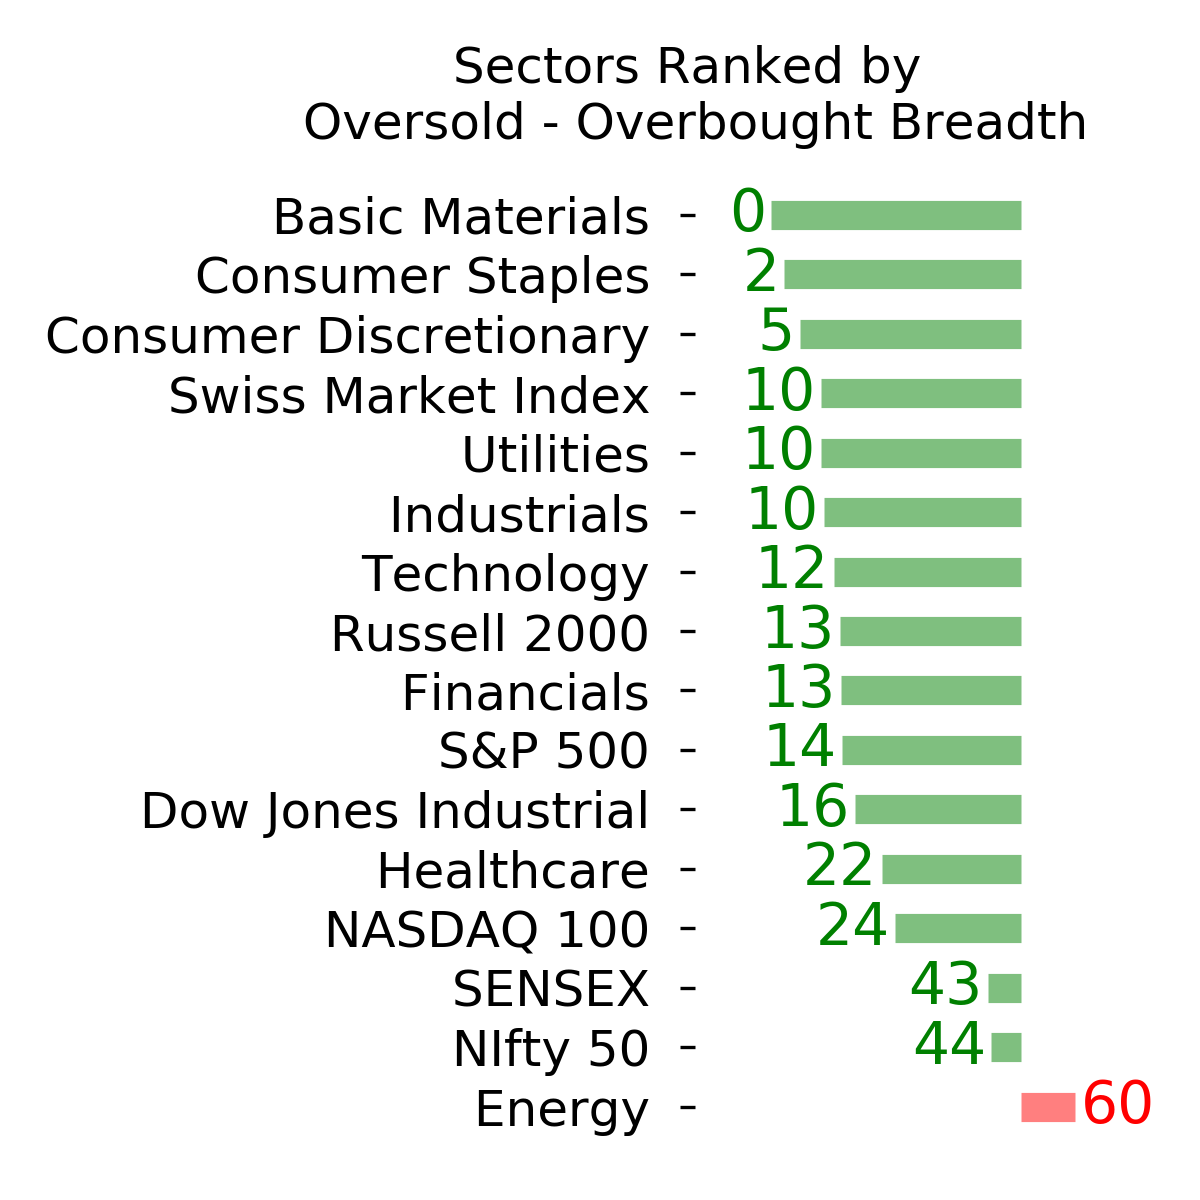
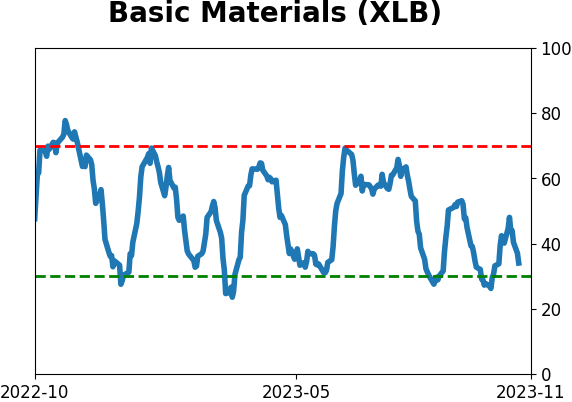
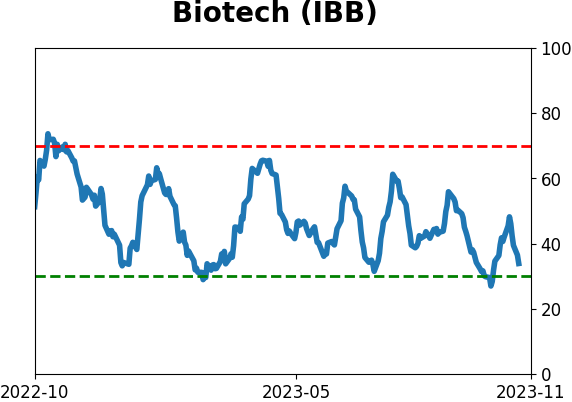
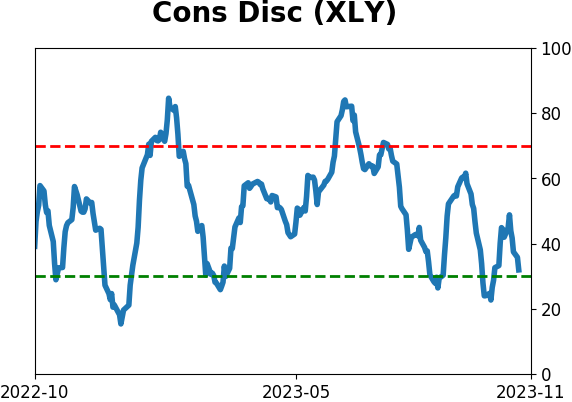
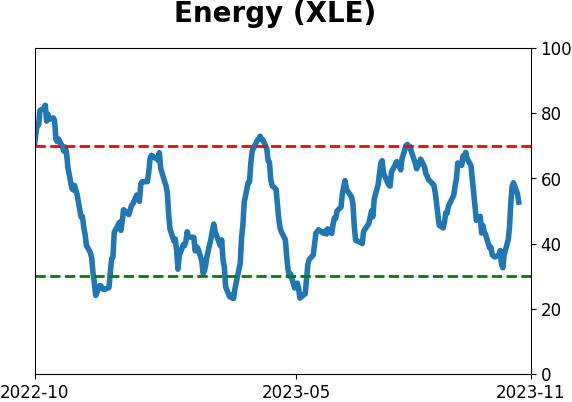
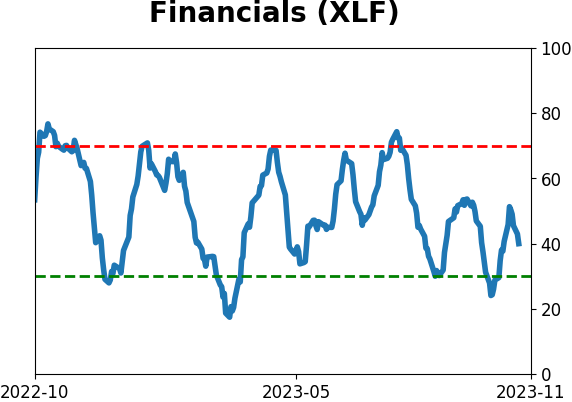
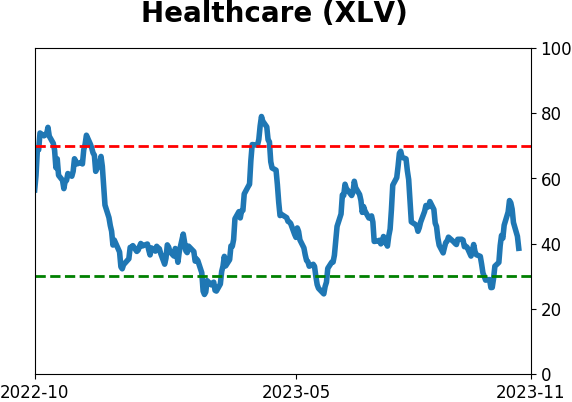
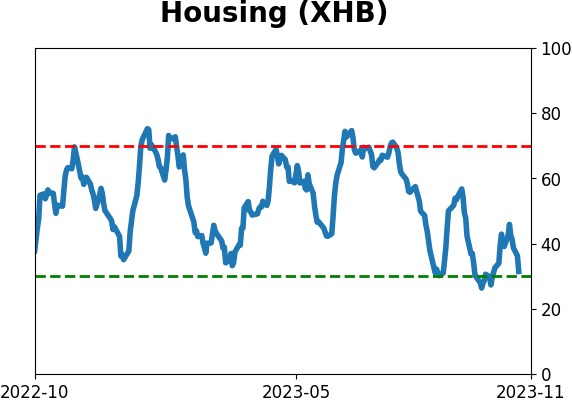
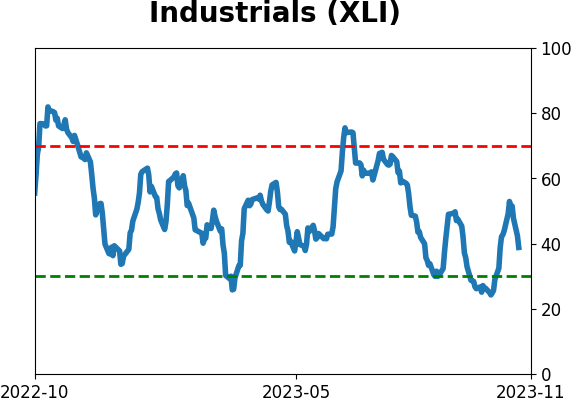
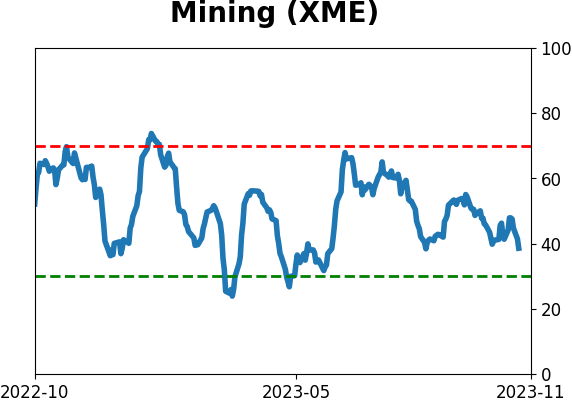
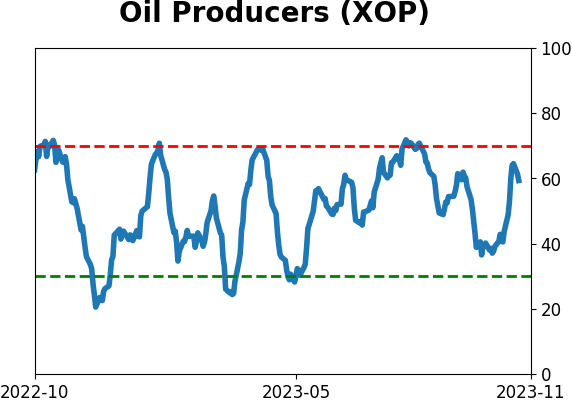
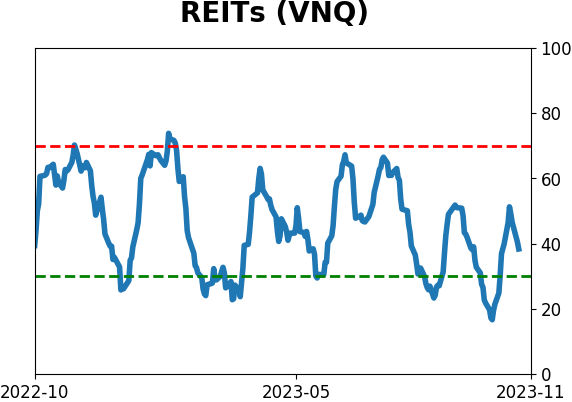
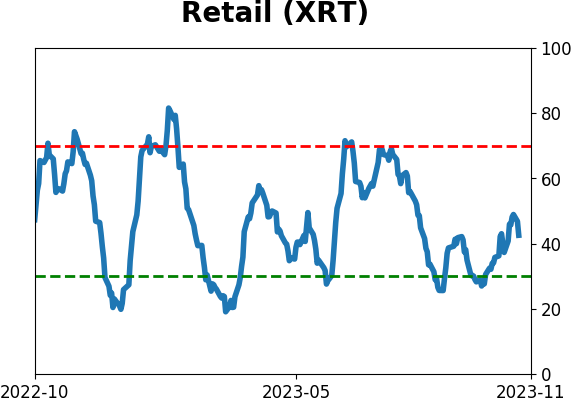
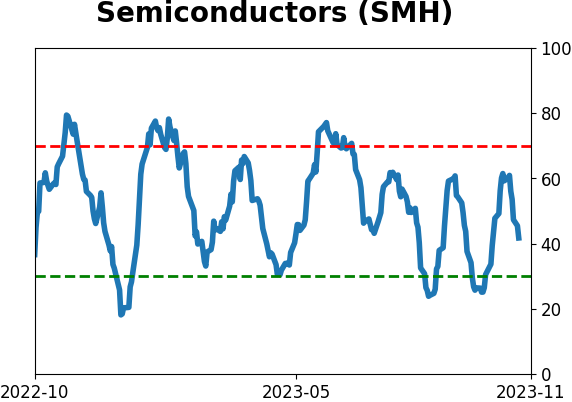
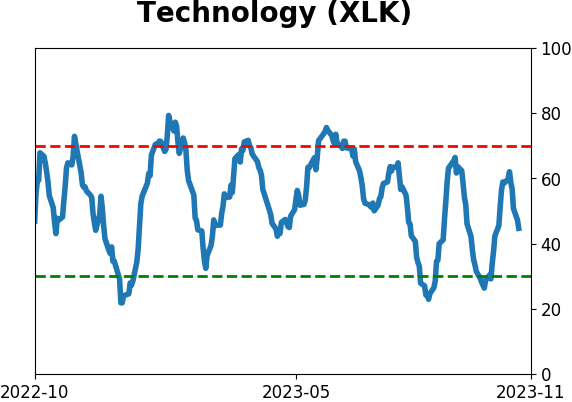
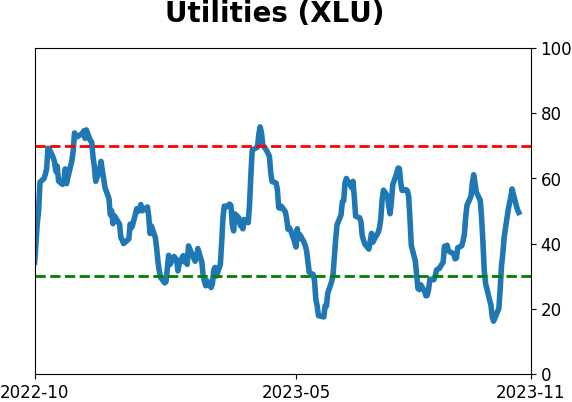
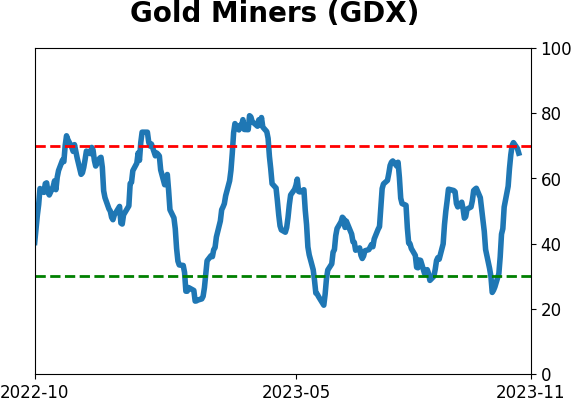
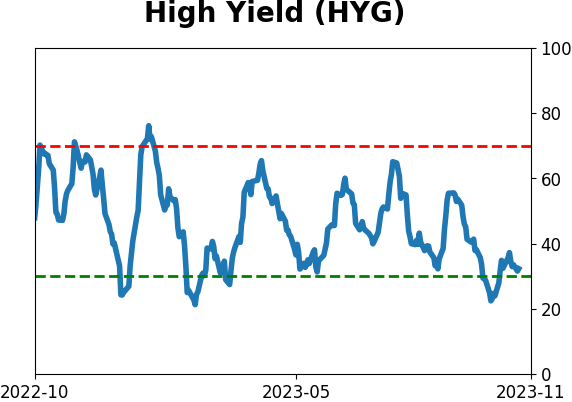
Sector ETF's - 10-Day Moving Average
|
|
|
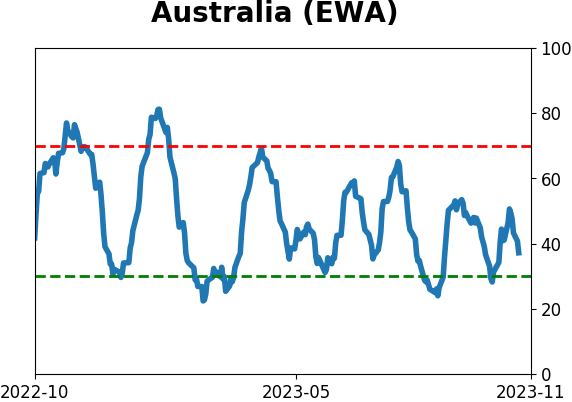
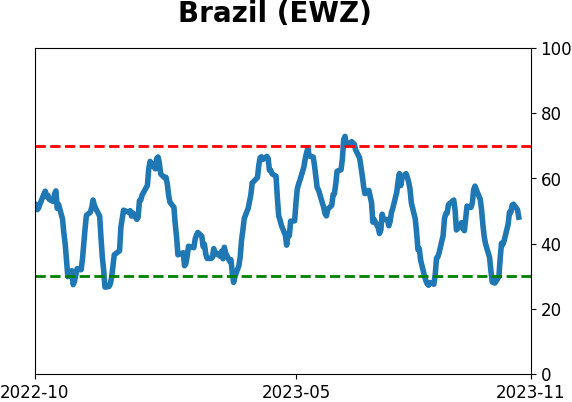
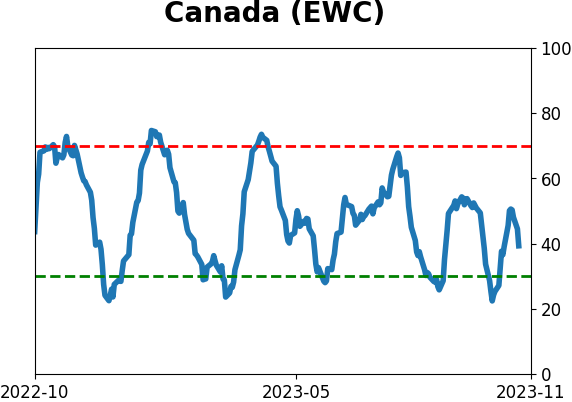
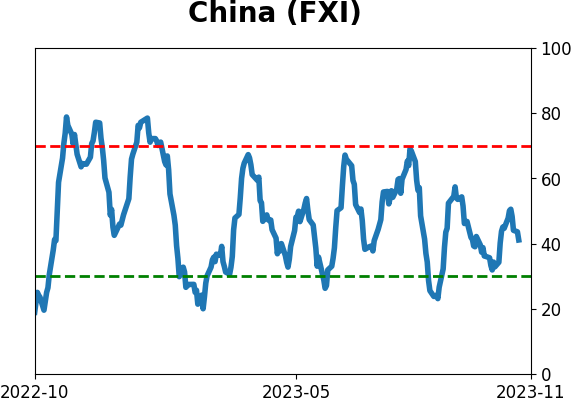
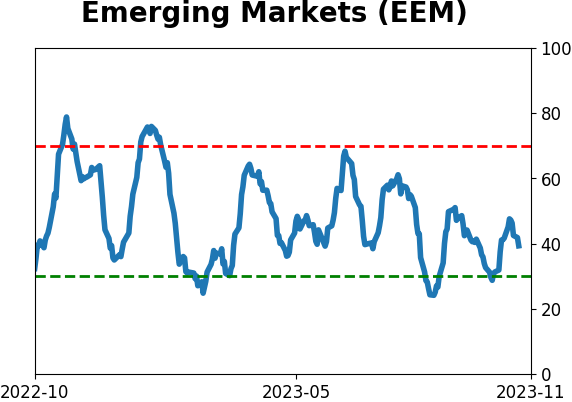
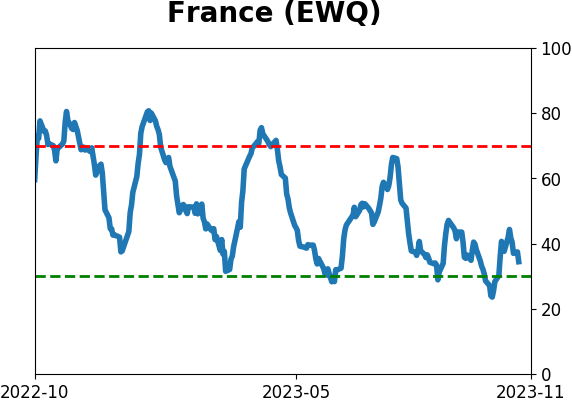
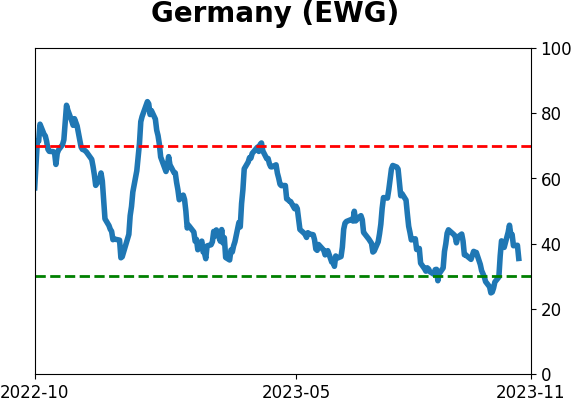
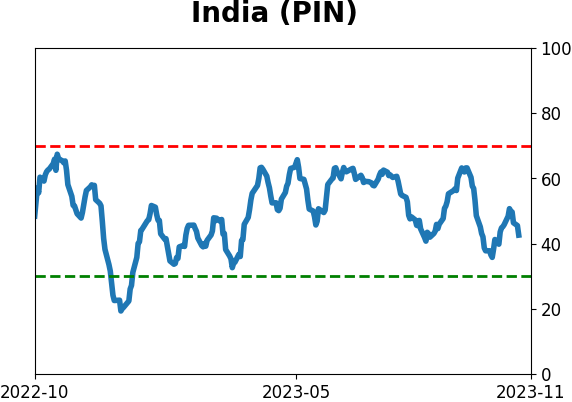
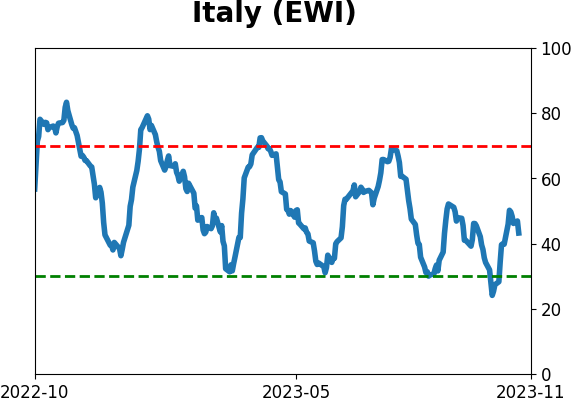
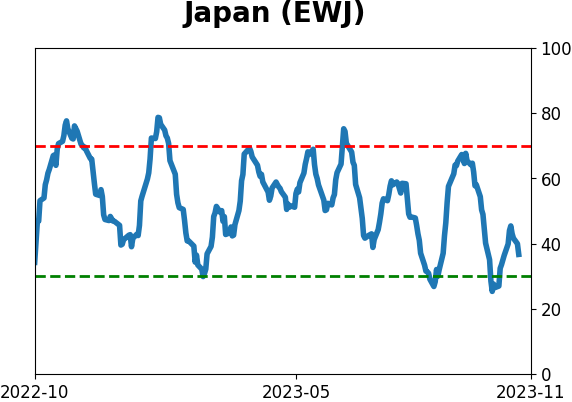
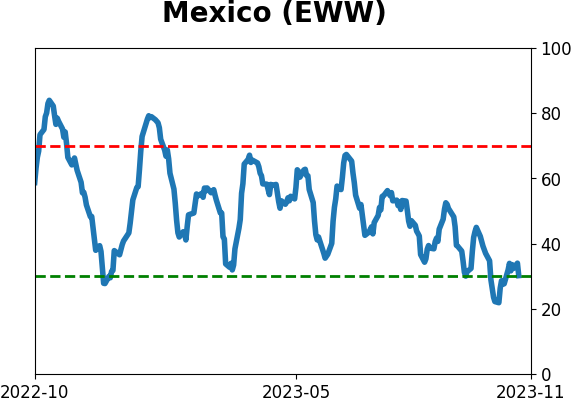
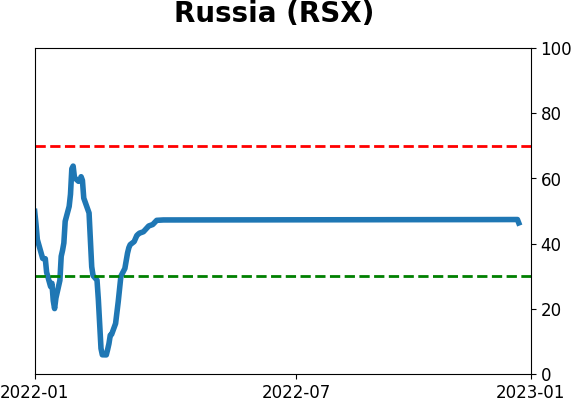
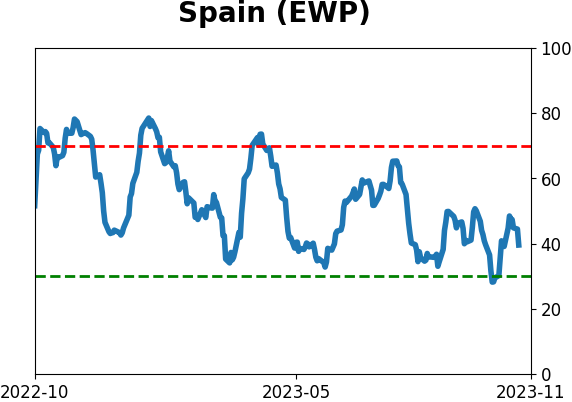
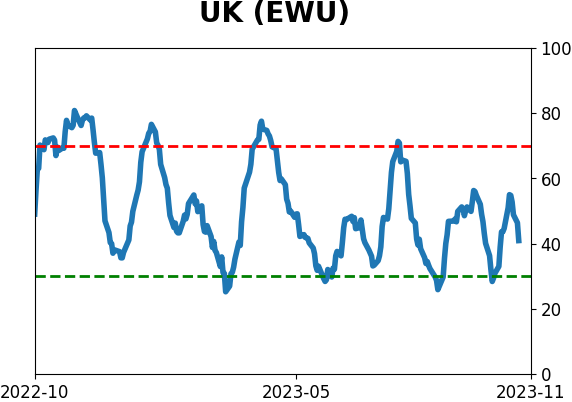
Country ETF's - 10-Day Moving Average
|
|
|
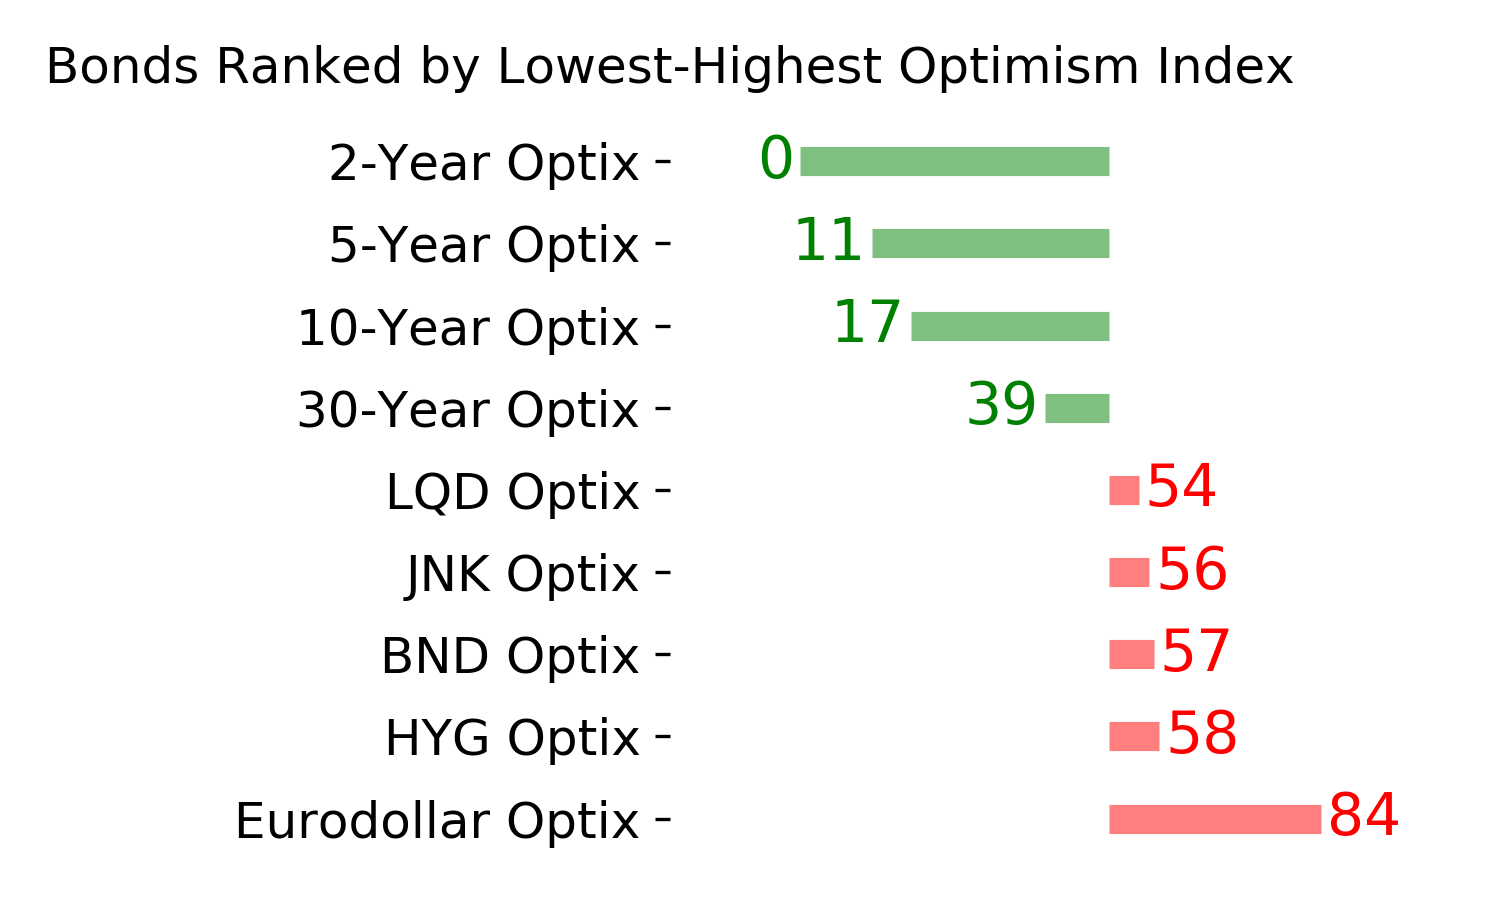
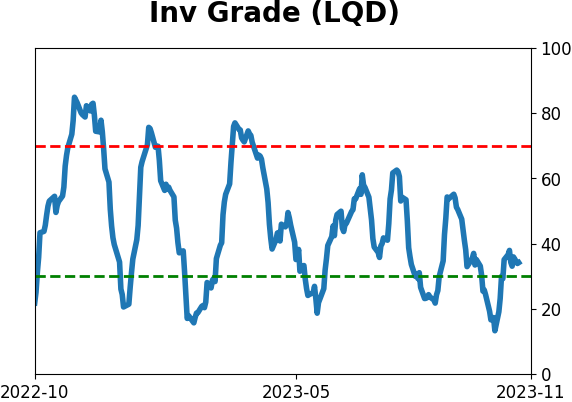
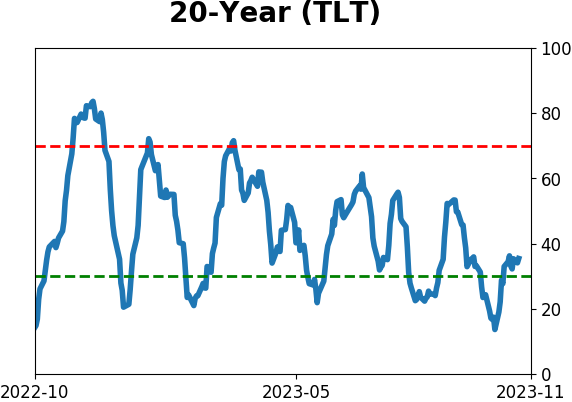
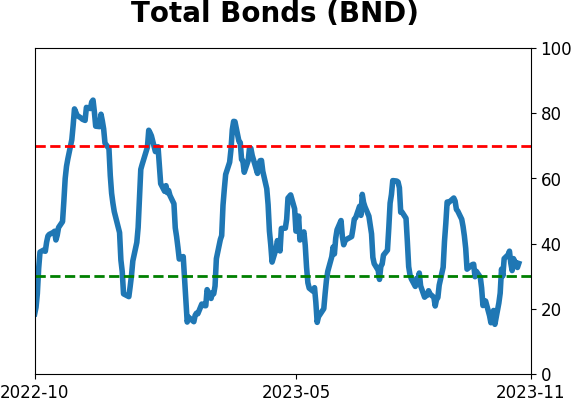
Bond ETF's - 10-Day Moving Average
|
|
|
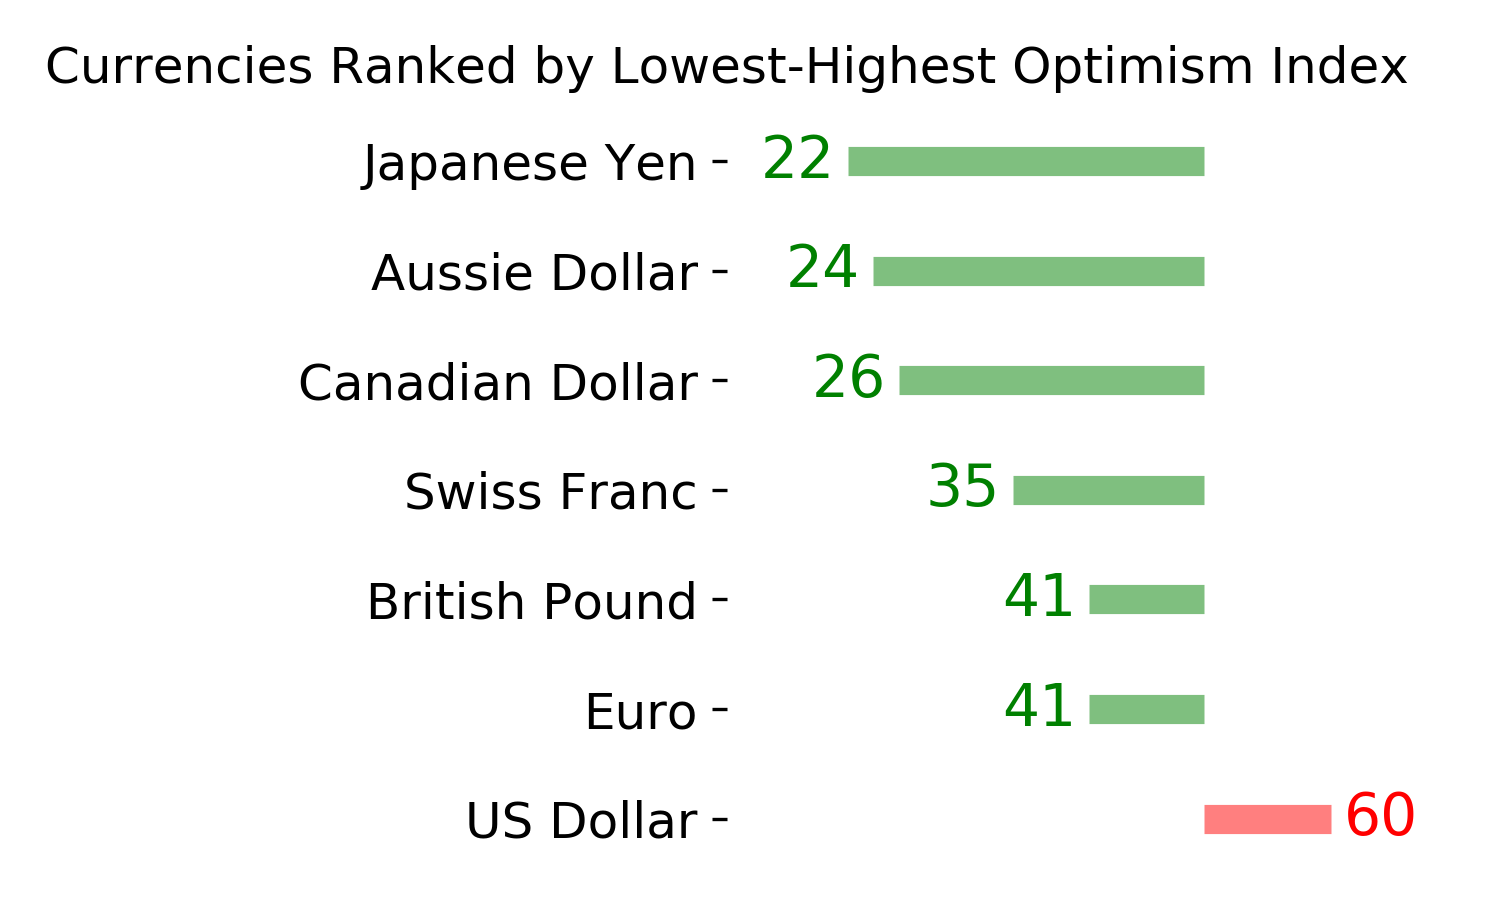
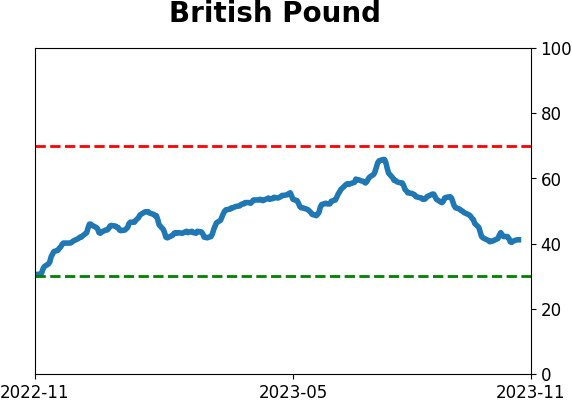
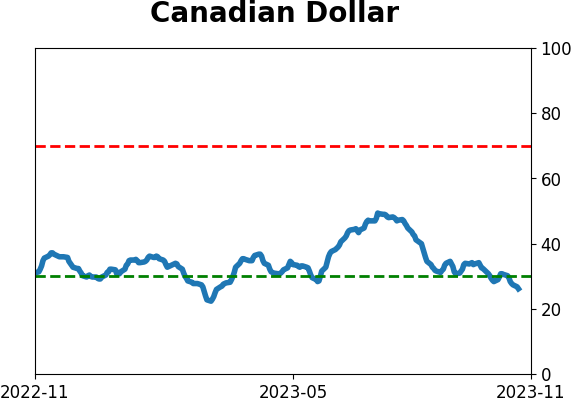
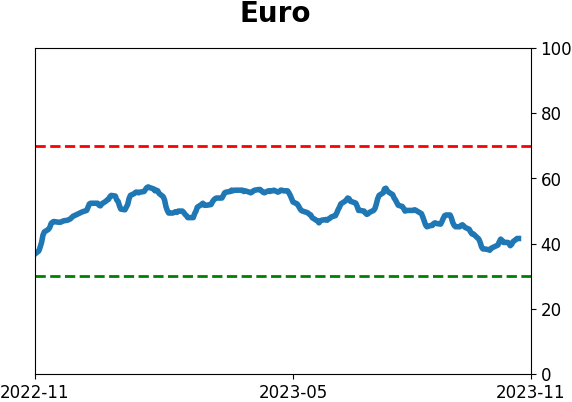
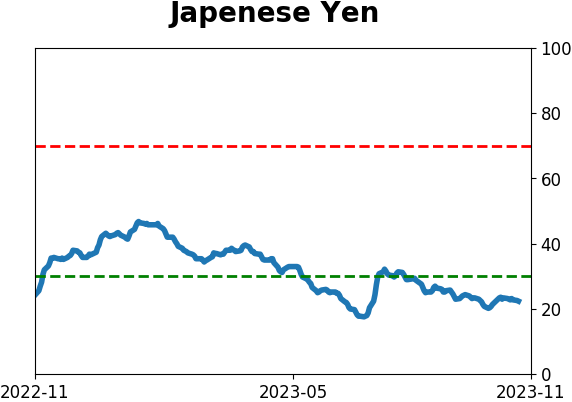
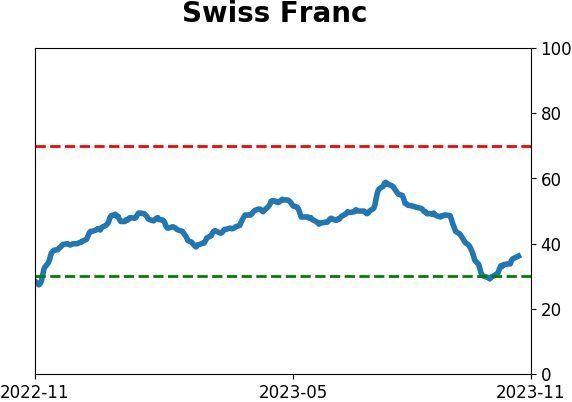
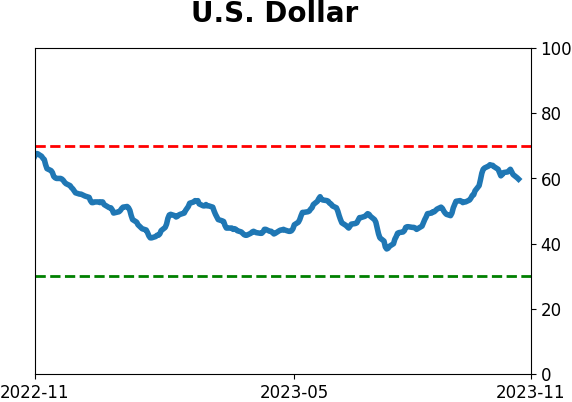
Currency ETF's - 5-Day Moving Average
|
|
|
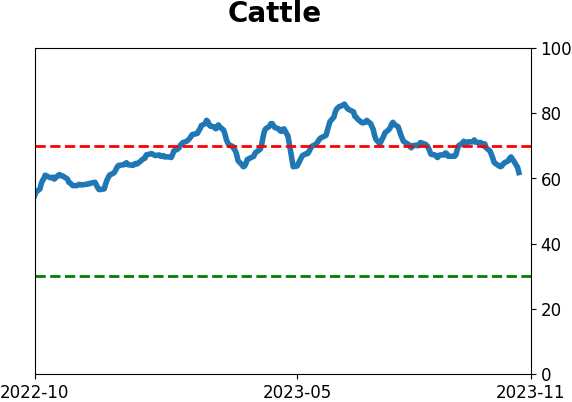
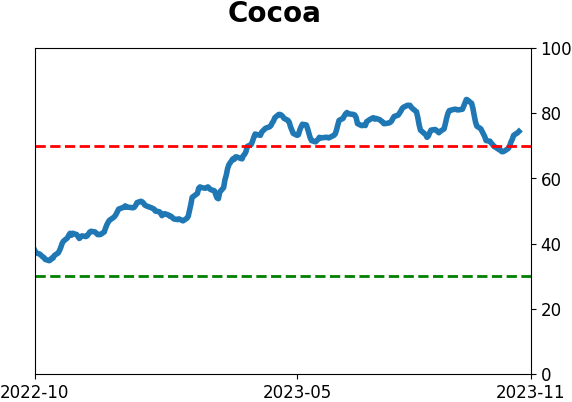
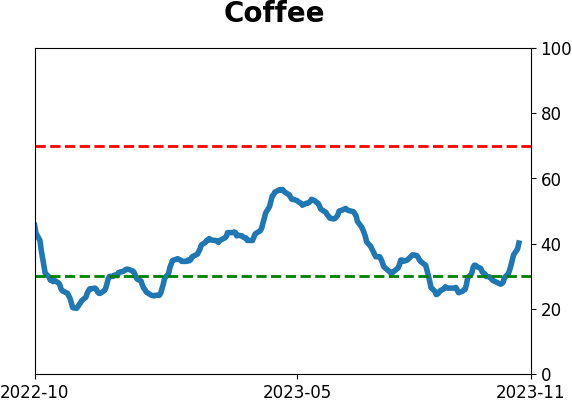
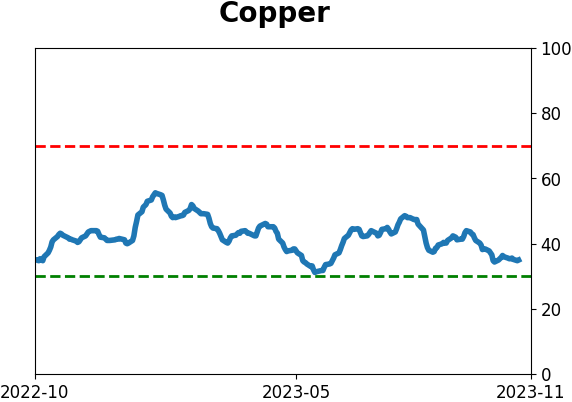
Commodity ETF's - 5-Day Moving Average
|
|