Headlines
|
|
Investors pull back as leverage plunges:
Margin debt has dropped by more than 25% over the past year, one of the largest year-over-year declines on record. It has an inconsistent history of signalling that sentiment has swung too far from the euphoria of 2021.
|
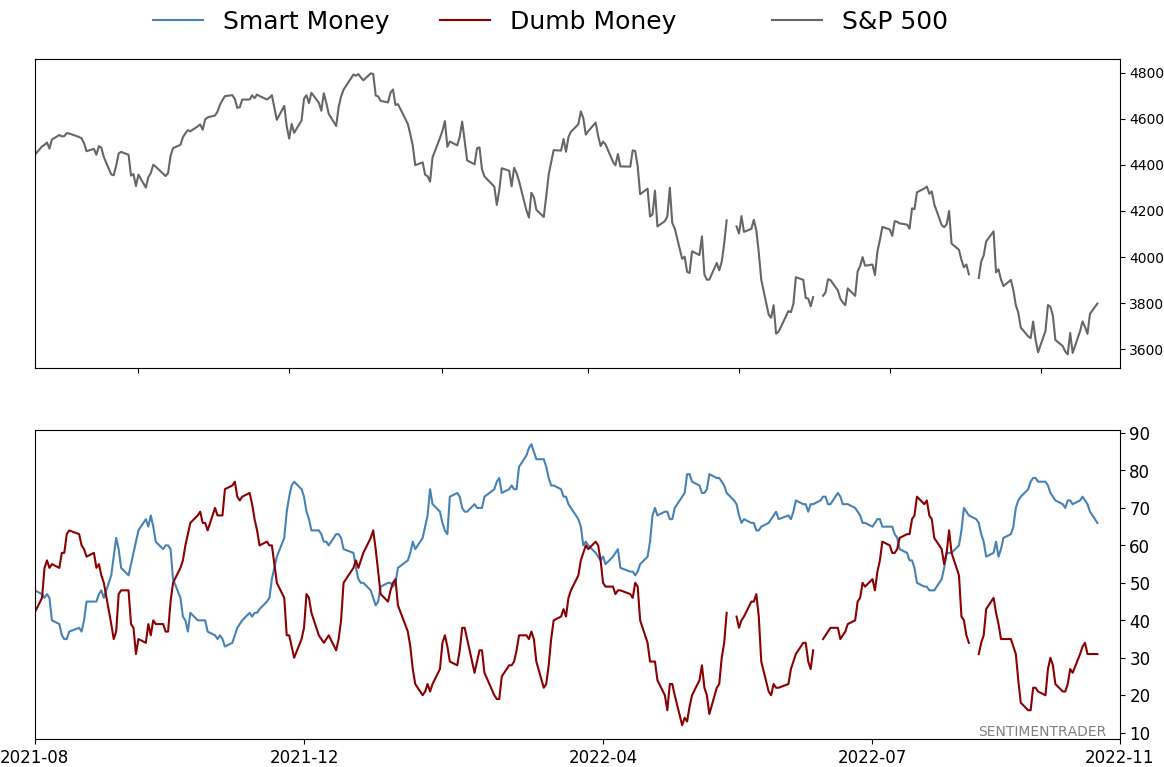
Smart / Dumb Money Confidence
|
Smart Money Confidence: 66%
Dumb Money Confidence: 31%
|
|
Risk Levels
Stocks Short-Term
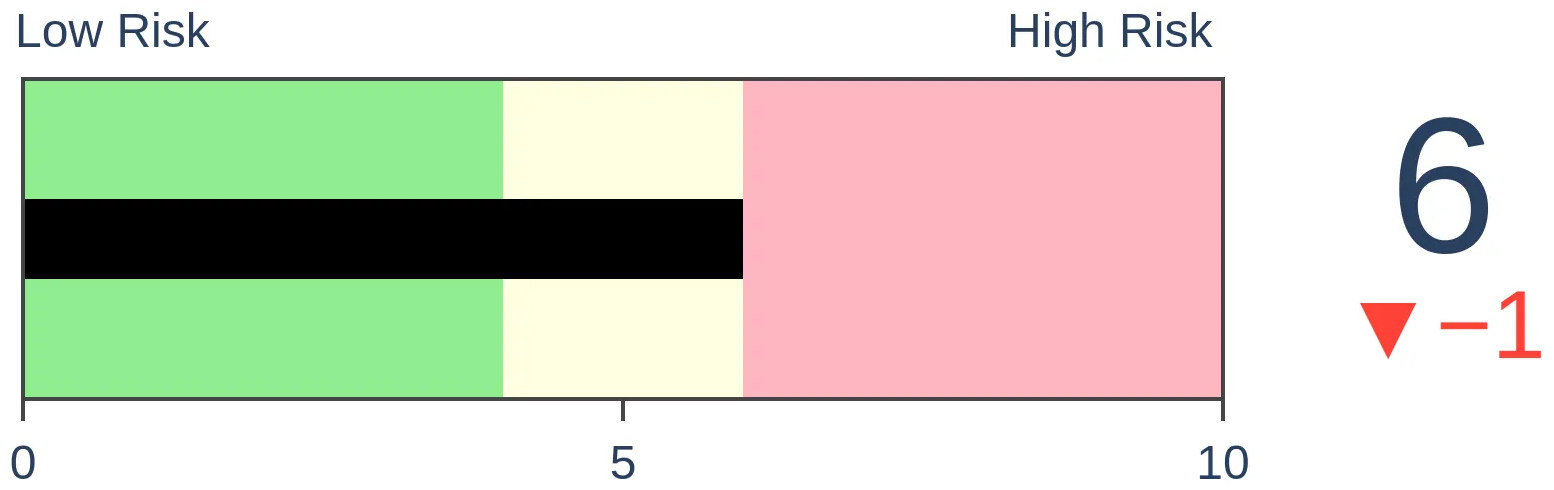
|
Stocks Medium-Term
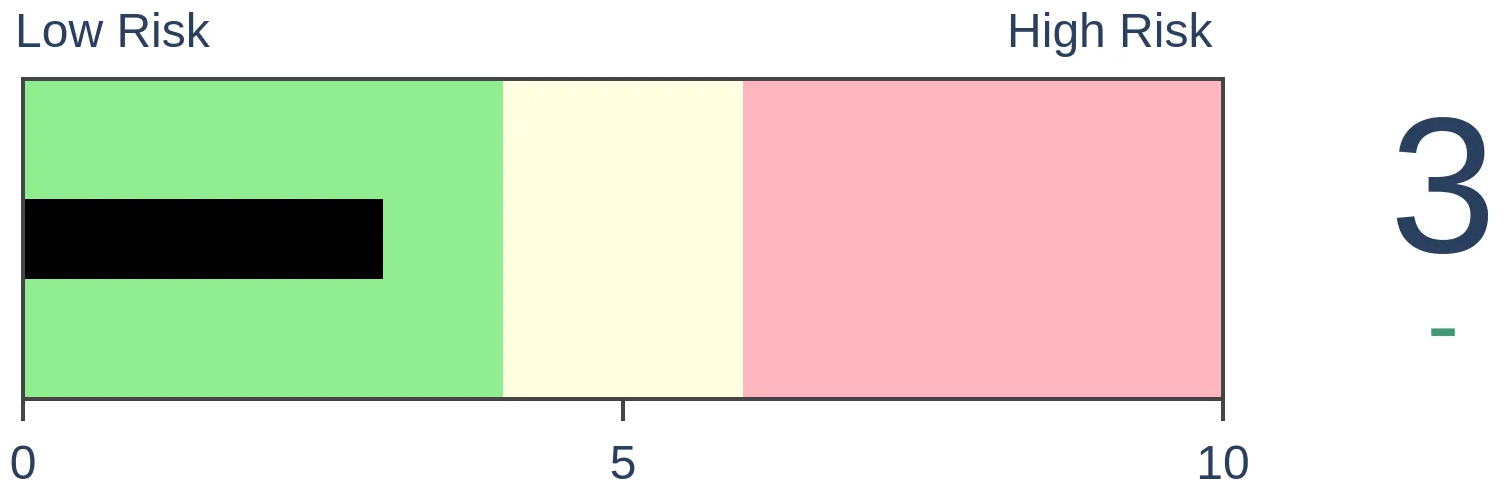
|
|
Bonds
|
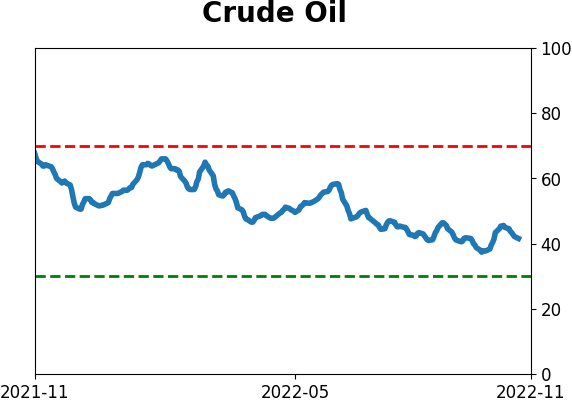
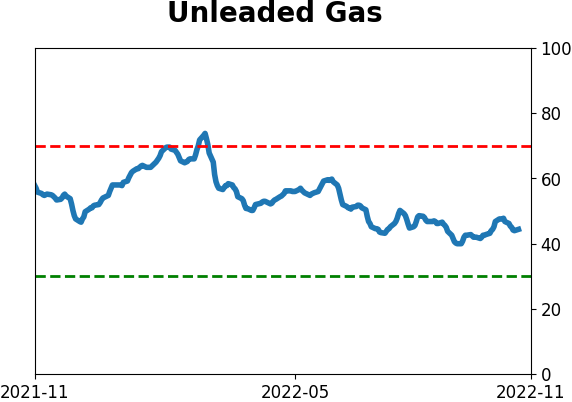
Crude Oil

|
|
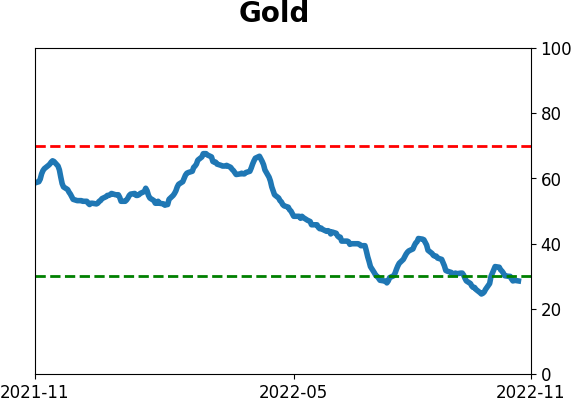
Gold
|
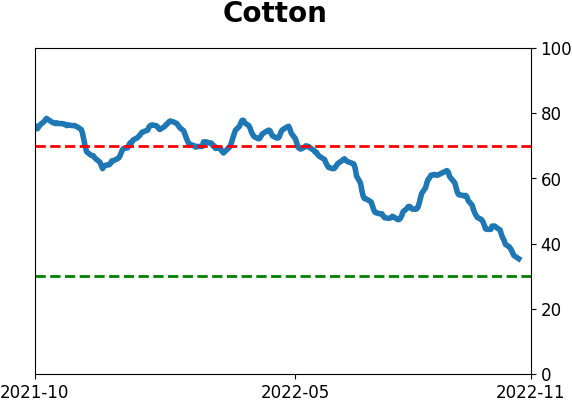
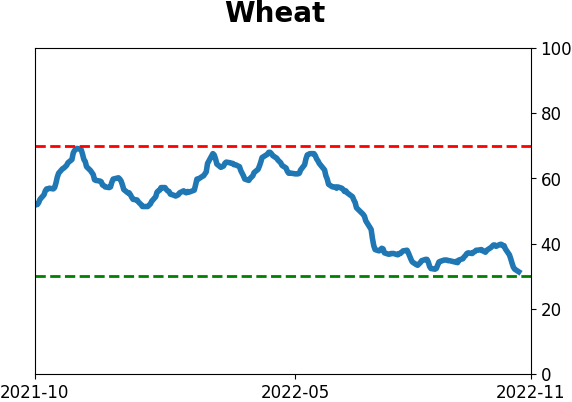
Agriculture
|
|
Research
By Jason Goepfert
BOTTOM LINE
Margin debt has dropped by more than 25% over the past year, one of the largest year-over-year declines on record. It has an inconsistent history of signalling that sentiment has swung too far from the euphoria of 2021.
FORECAST / TIMEFRAME
None
|
Key points:
- Investors have pared back the debt load on stock holdings by more than a quarter
- Similar drops in debt over a year have ended a few bear markets but were early in two others
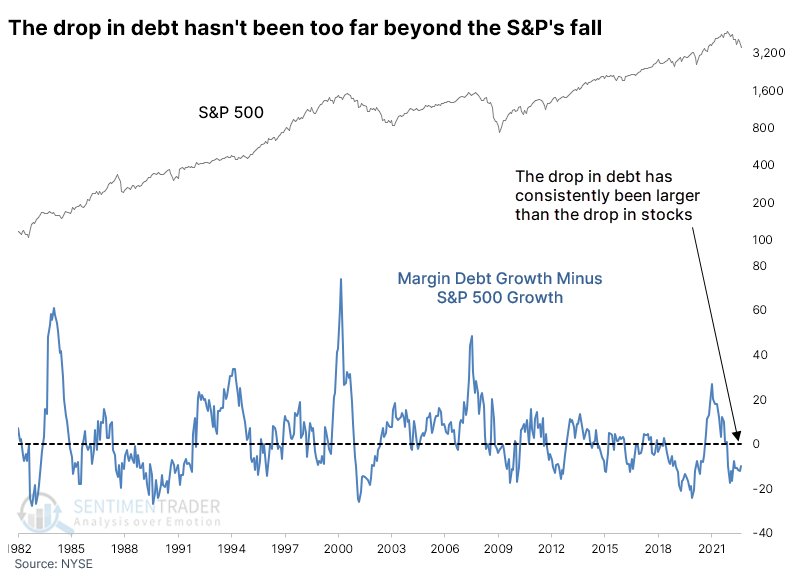
- The drop in debt isn't too far removed from what should be expected, given the drop in stock values
Investors' debt load drops by a quarter
A little less than a year ago, we saw a breathtaking rise in leverage. The only recent comparisons were the prior two peaks in stocks, though it was getting more and more challenging to have much confidence in the signal.
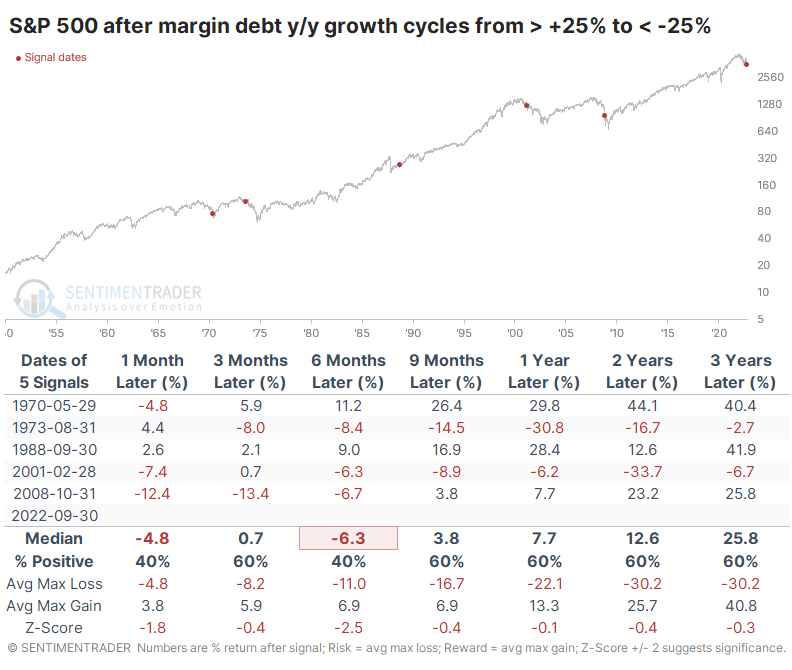
With the persistent decline in markets, leverage has plunged; margin debt is down more than 25% year-over-year. That kind of de-leveraging was about all it took near the ends of bear markets in 1970, 1987, and 2008, but it was early in the bears in 1974 and 2001.
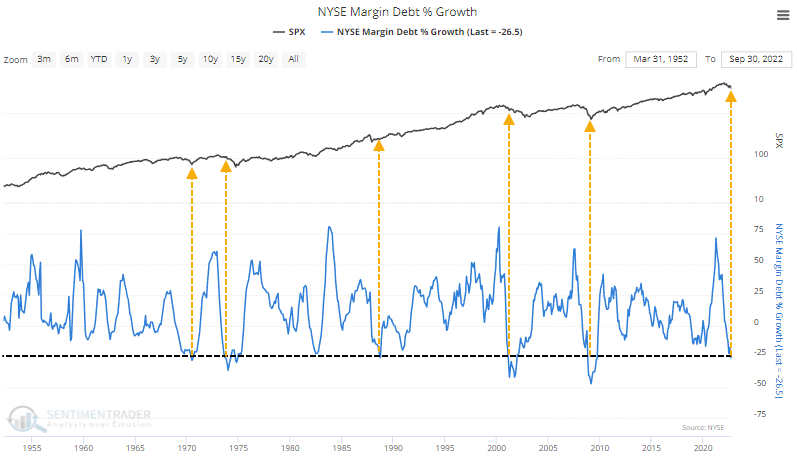
When we look at times after debt rose at least 25% year-over-year and then dropped at least 25%, returns in the S&P 500 weren't great. As noted above, it preceded excellent long-term results a few times and twice quite the opposite.
Investors have been pulling back on leverage more than the decline in stocks would excuse. Debt has been falling at about a 10% greater pace than the S&P, which is low but not to prior extremes.
What the research tells us...
We've never placed a lot of weight on margin debt figures, as they typically follow the trend in stock prices closely. When growth hits an extreme either way, especially in relation to the growth in stocks, the signals can be more effective. The current drop is notable but, historically, not a consistent enough signal of washed-out sentiment, particularly given the small sample size. And it hasn't dropped much more than the decline in stocks would excuse, further suggesting that sentiment isn't too out of whack from where it should be.
Indicators at Extremes
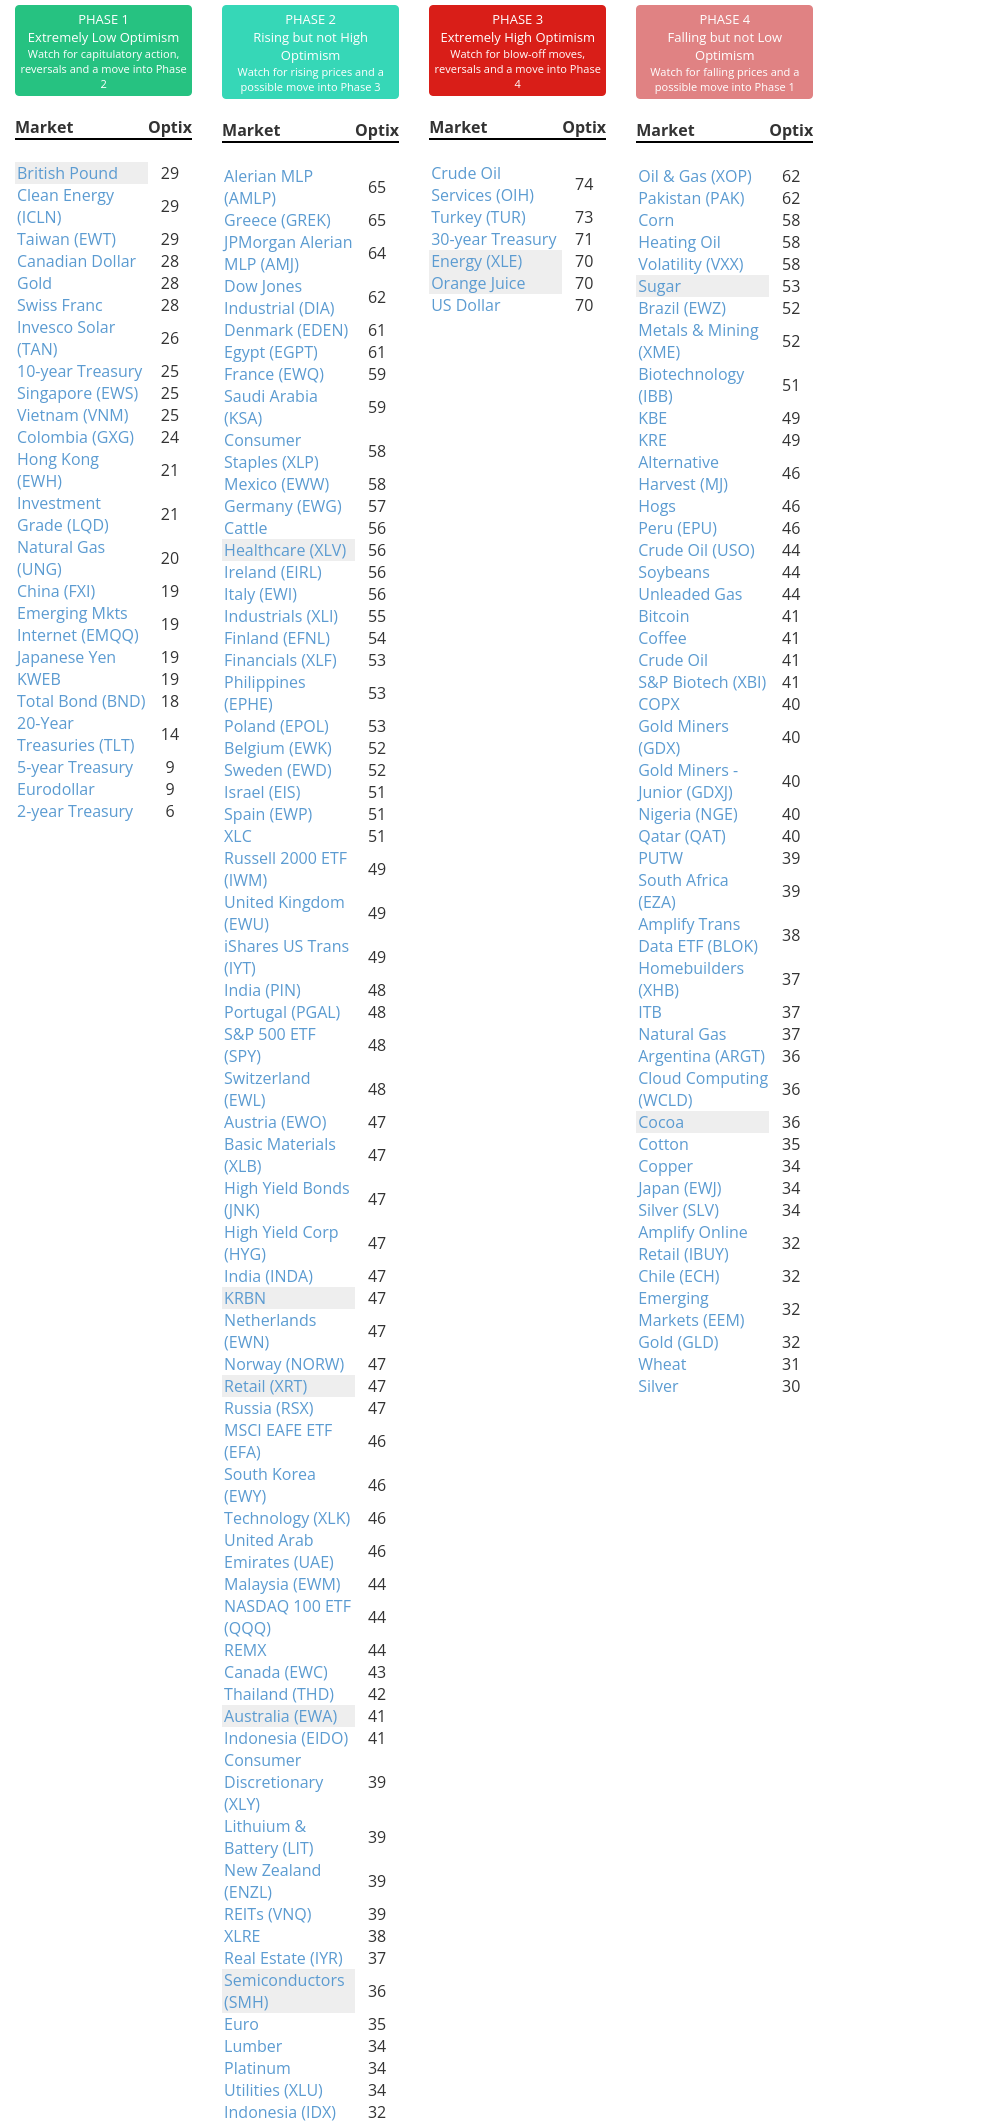
Phase Table
Ranks
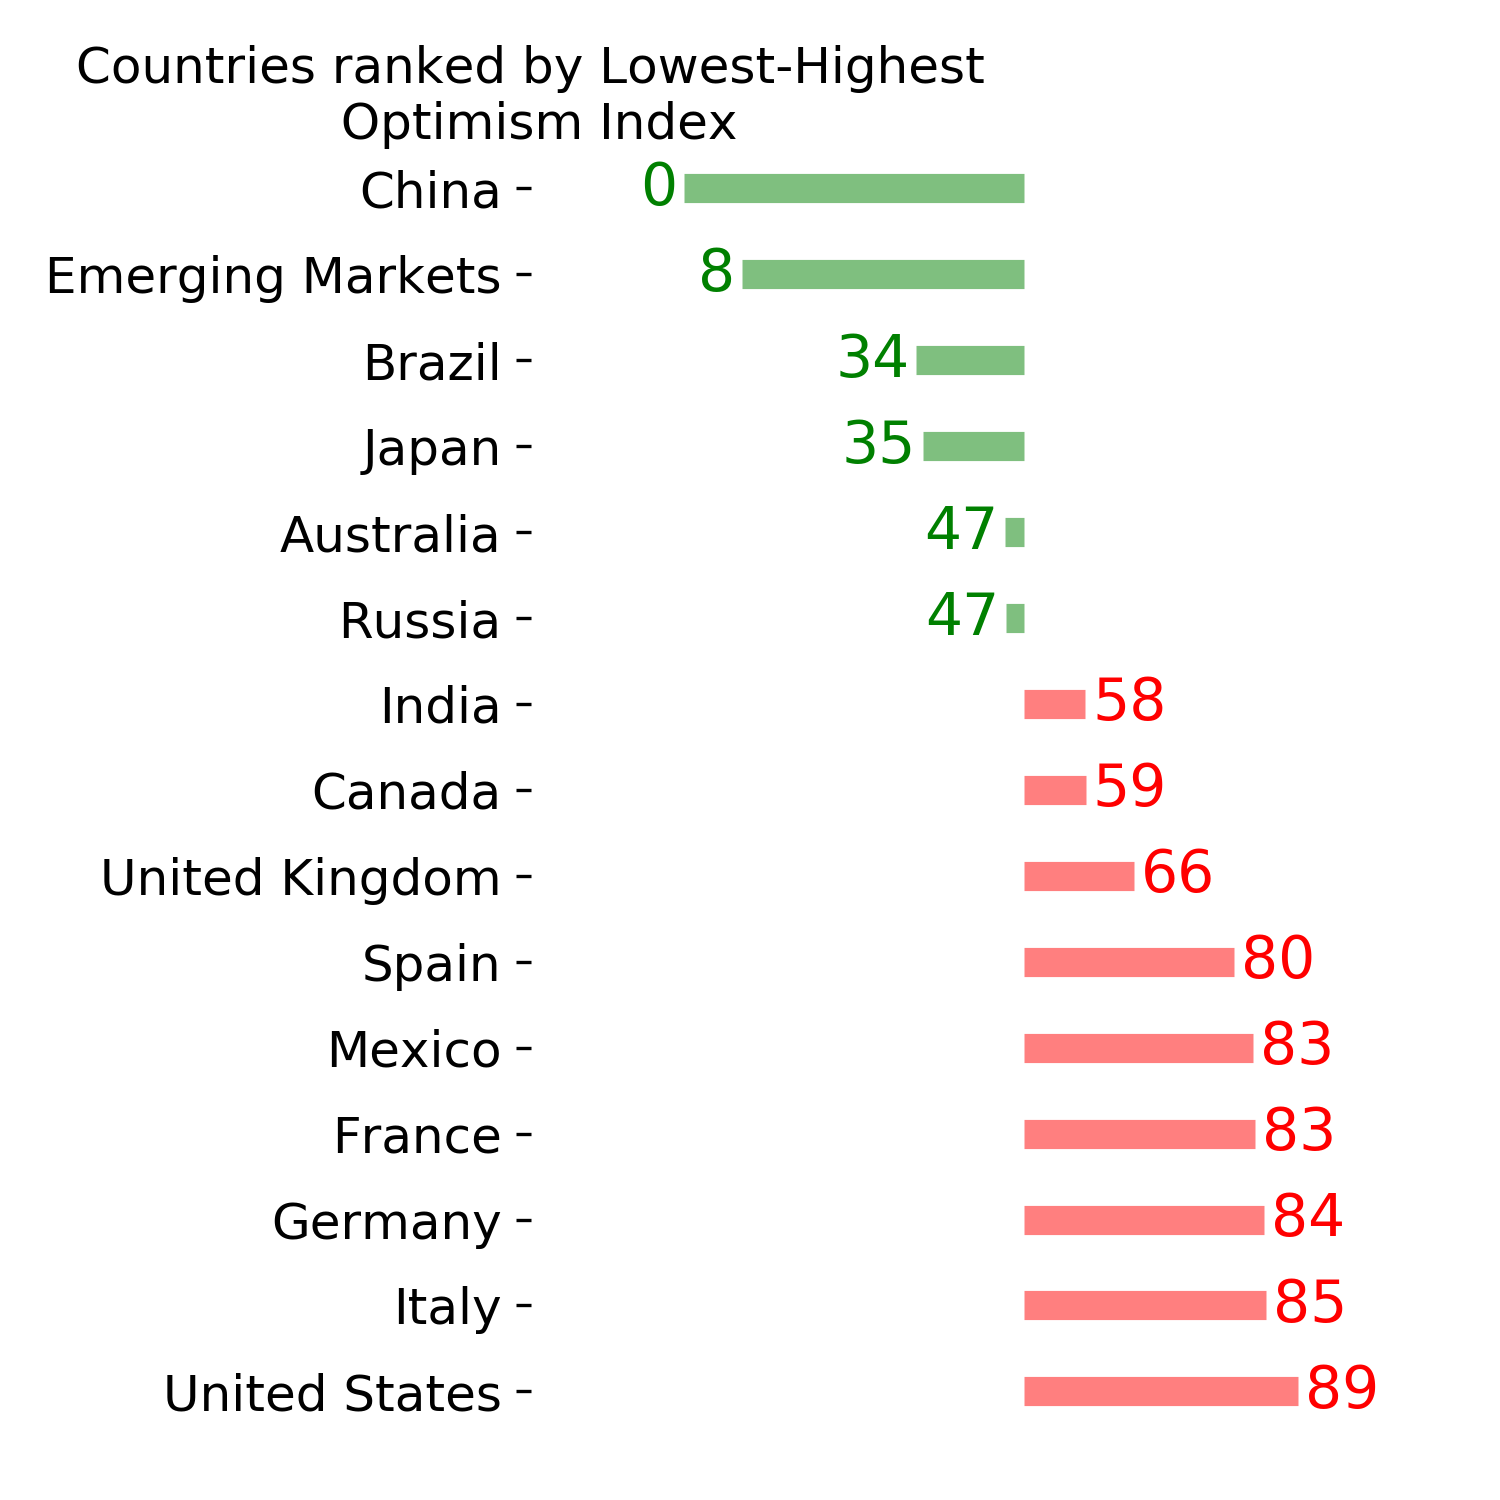
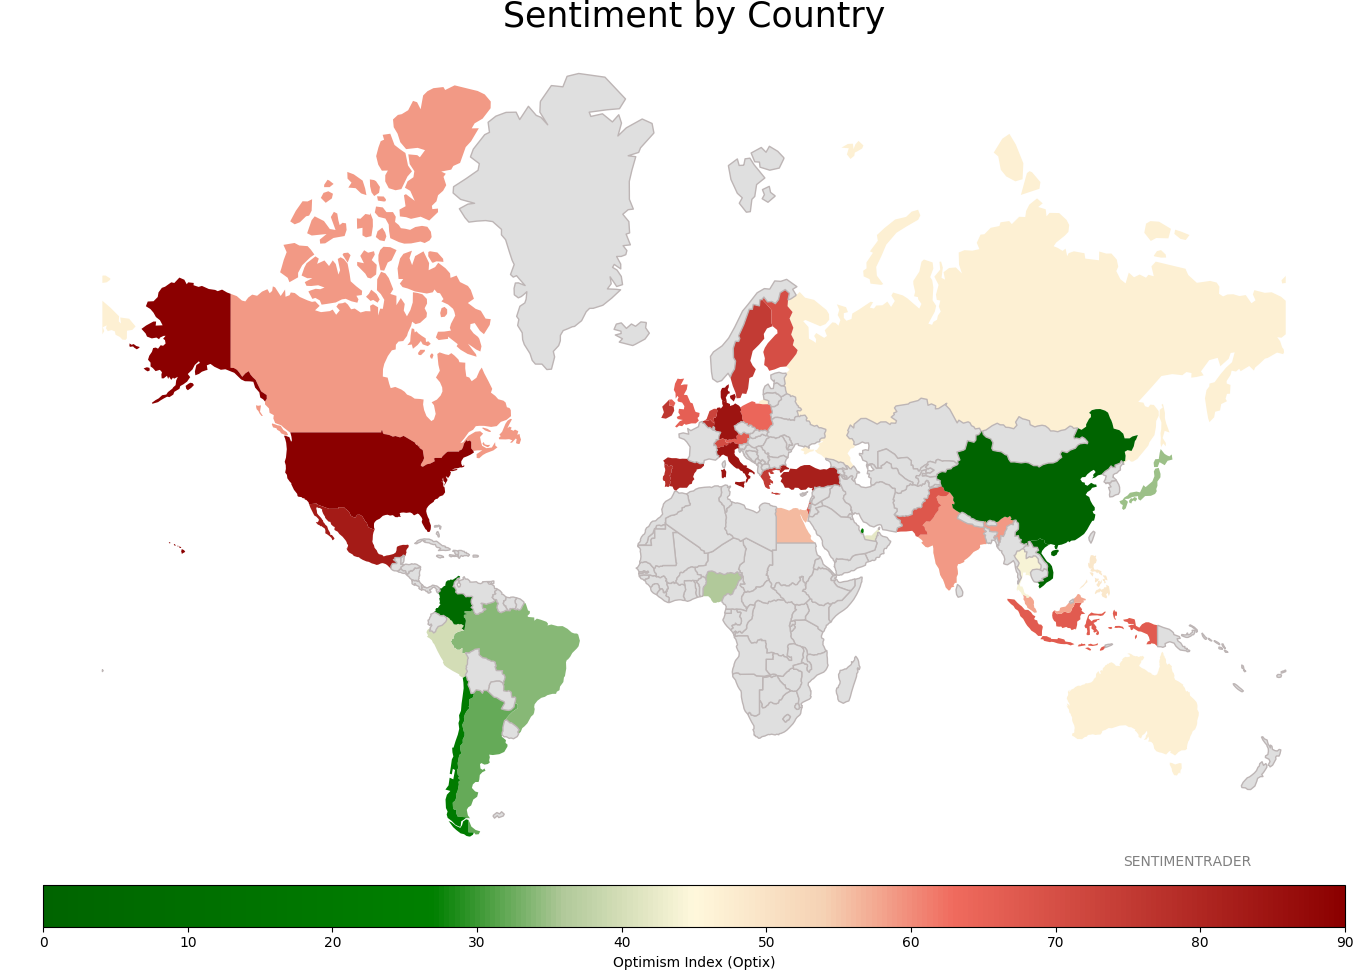
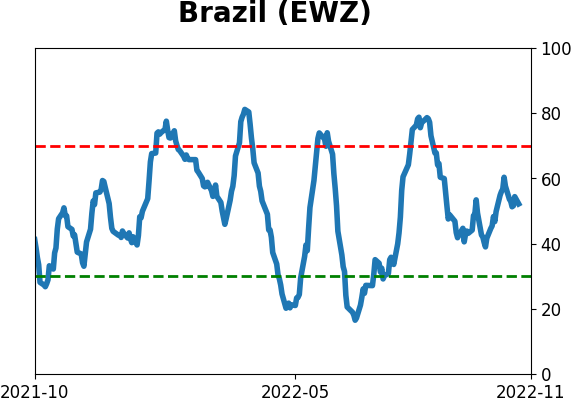
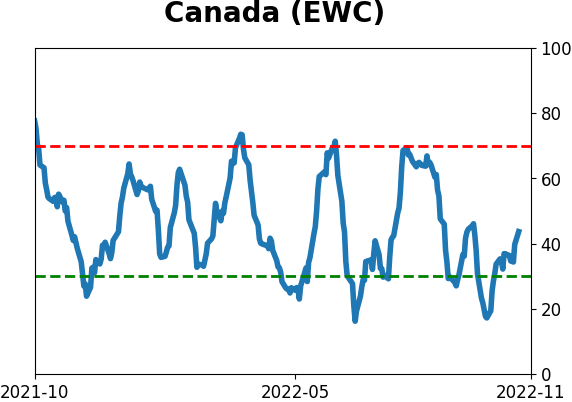
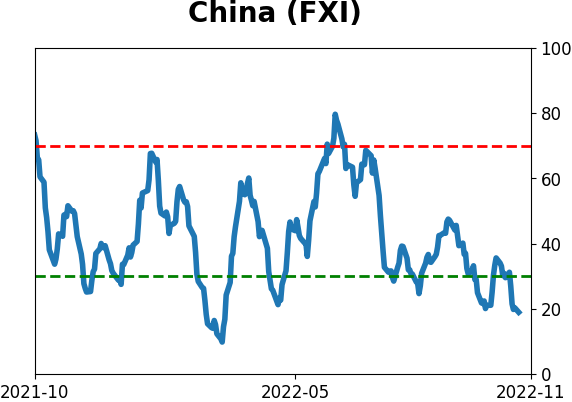
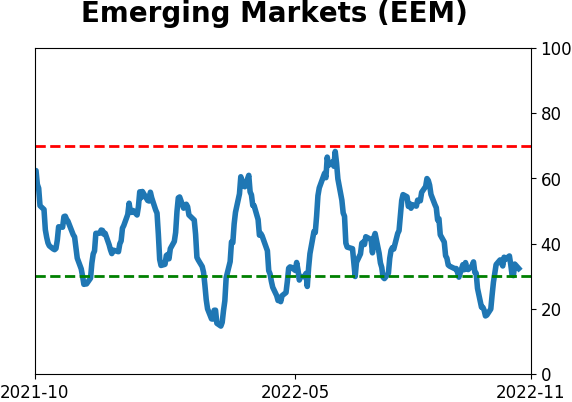
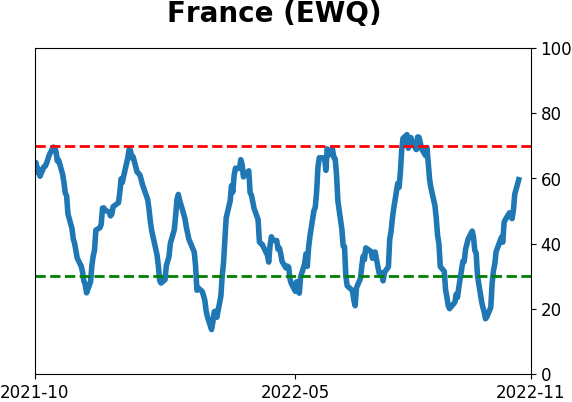
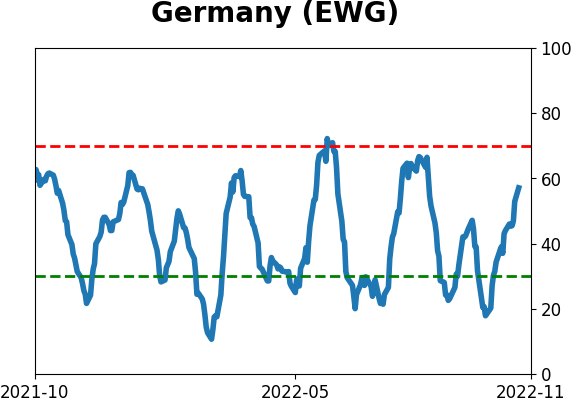
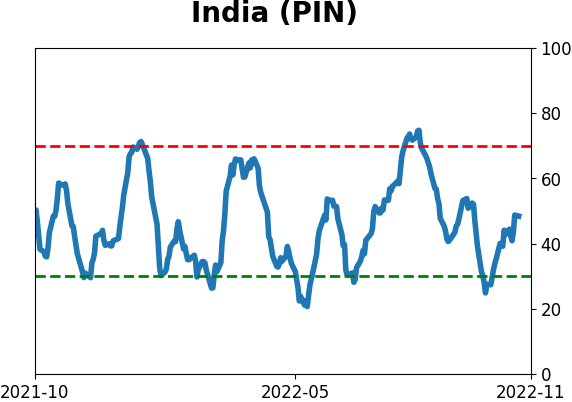
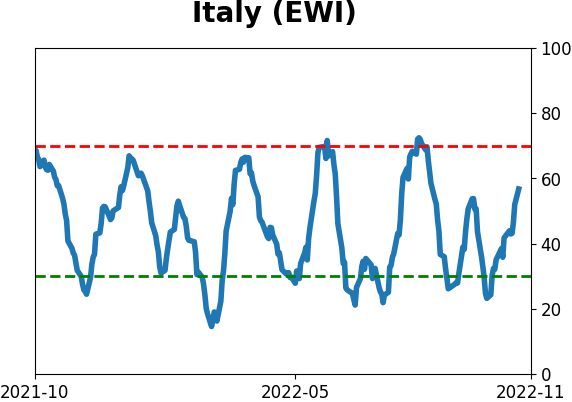
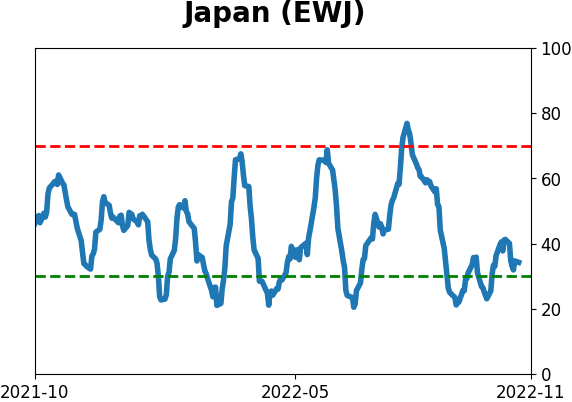
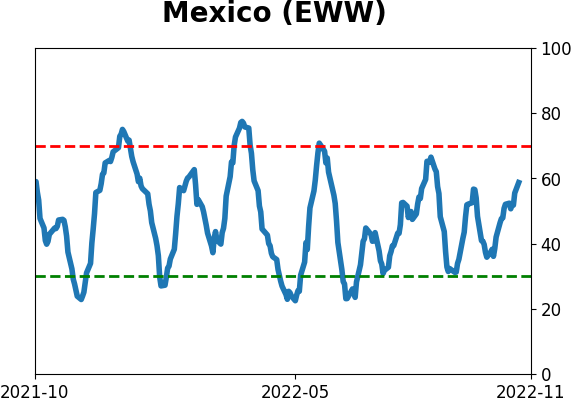
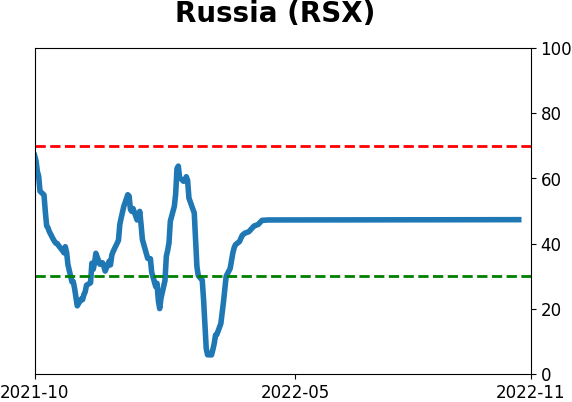
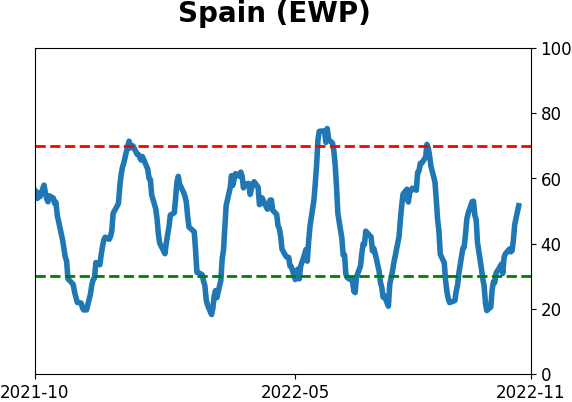
Sentiment Around The World
Optimism Index Thumbnails
|
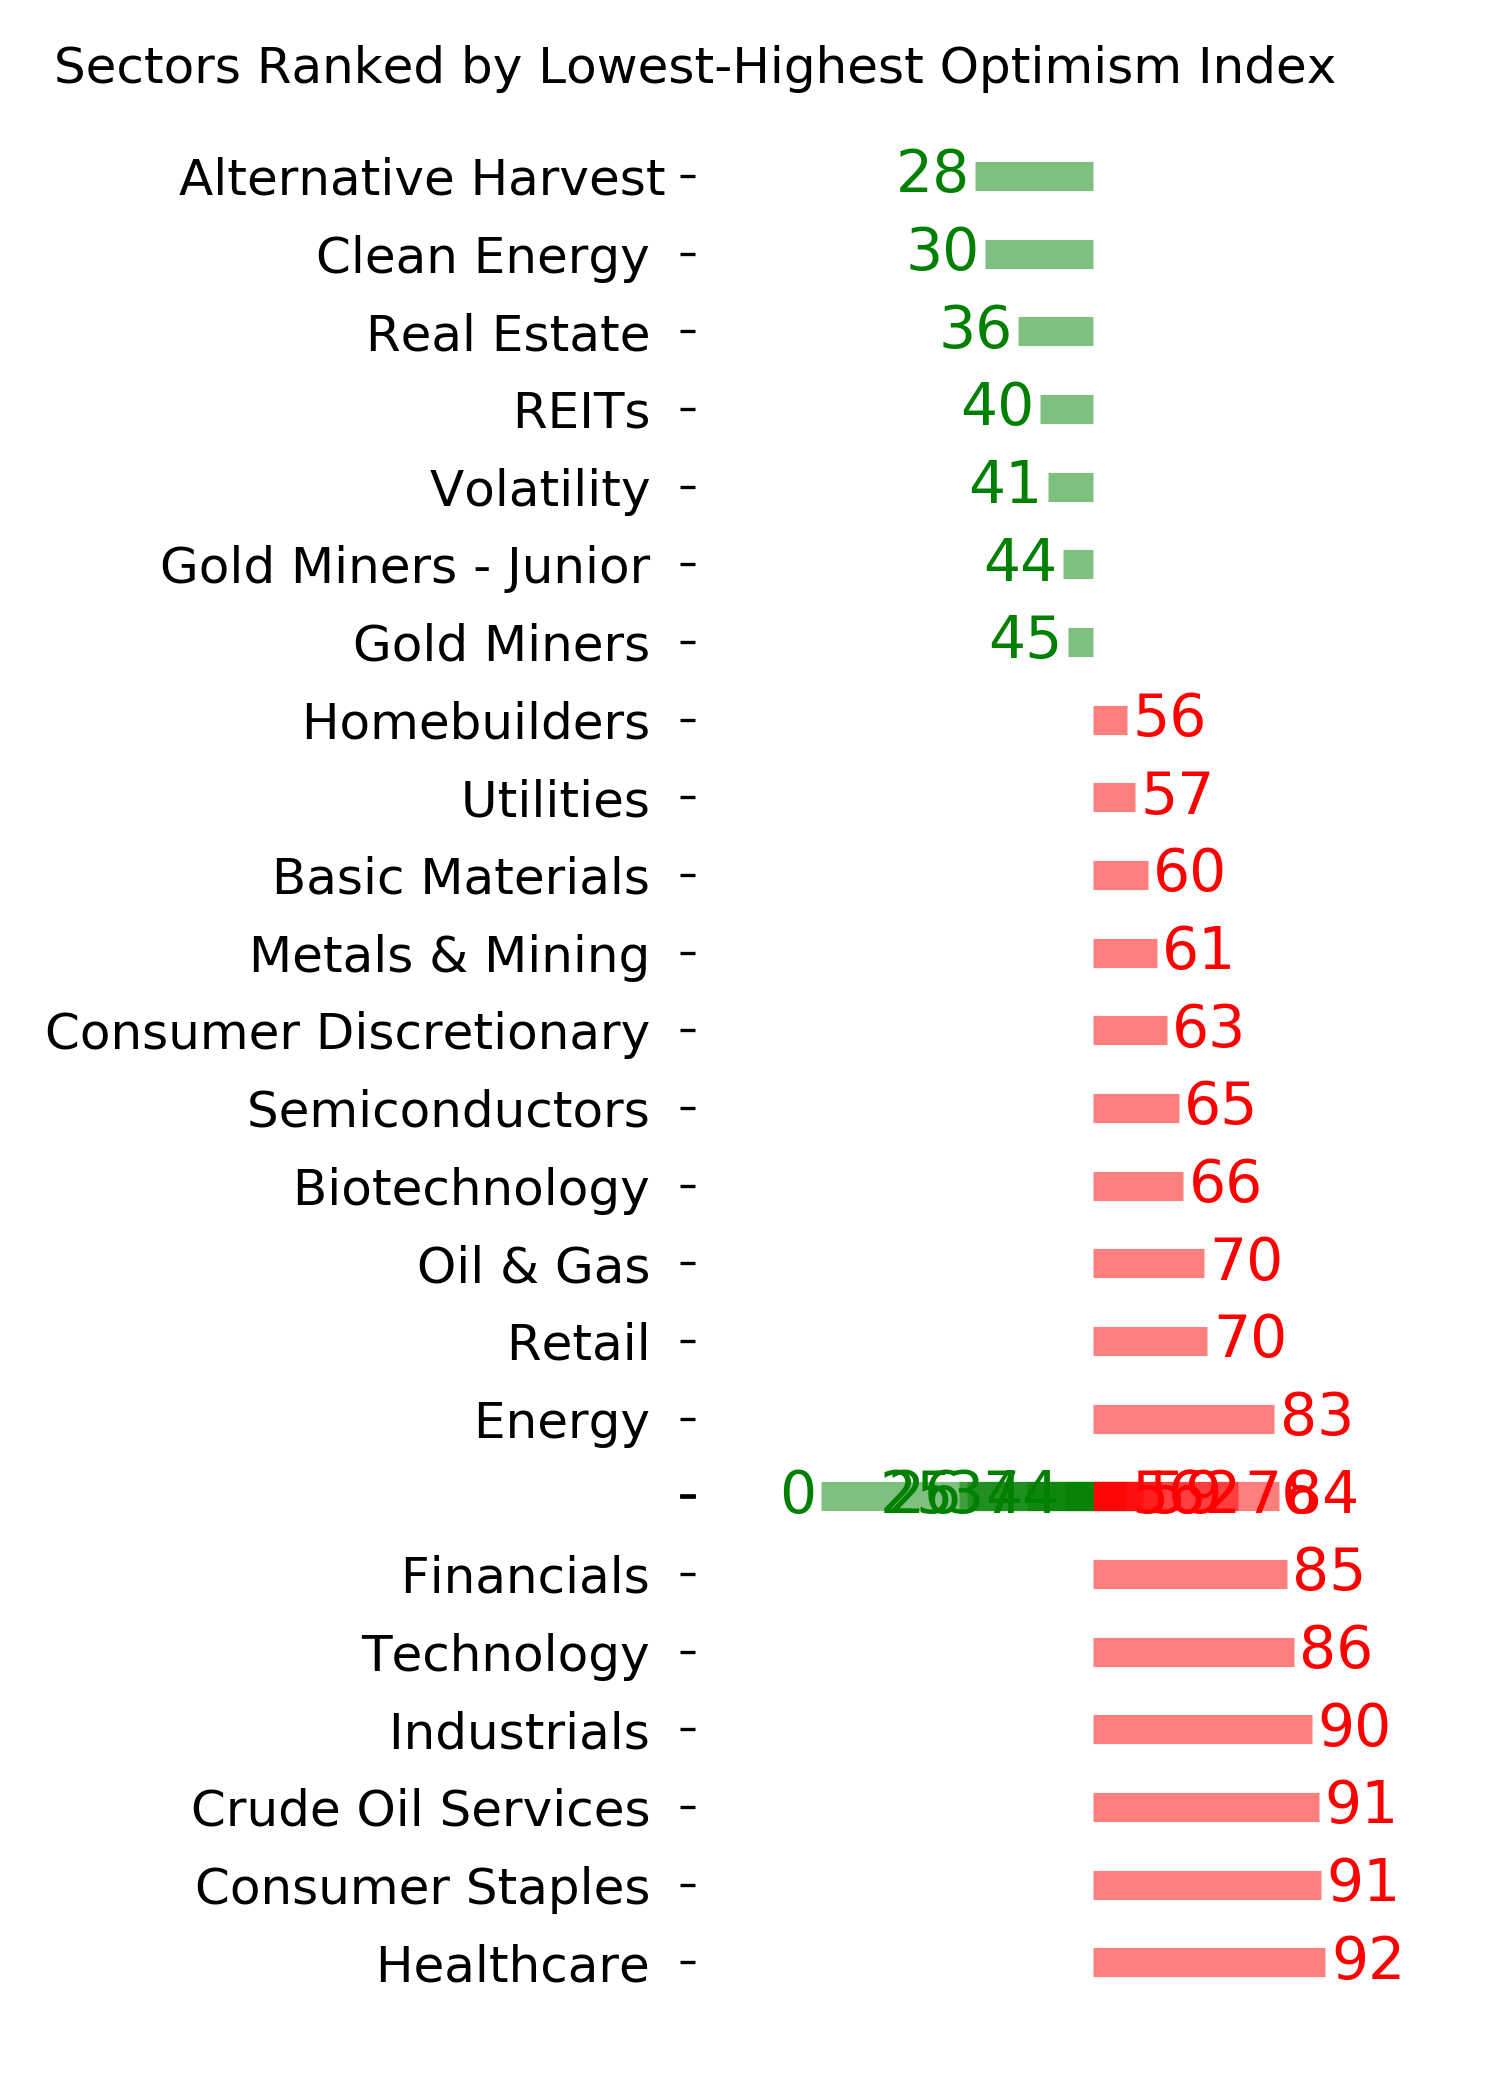
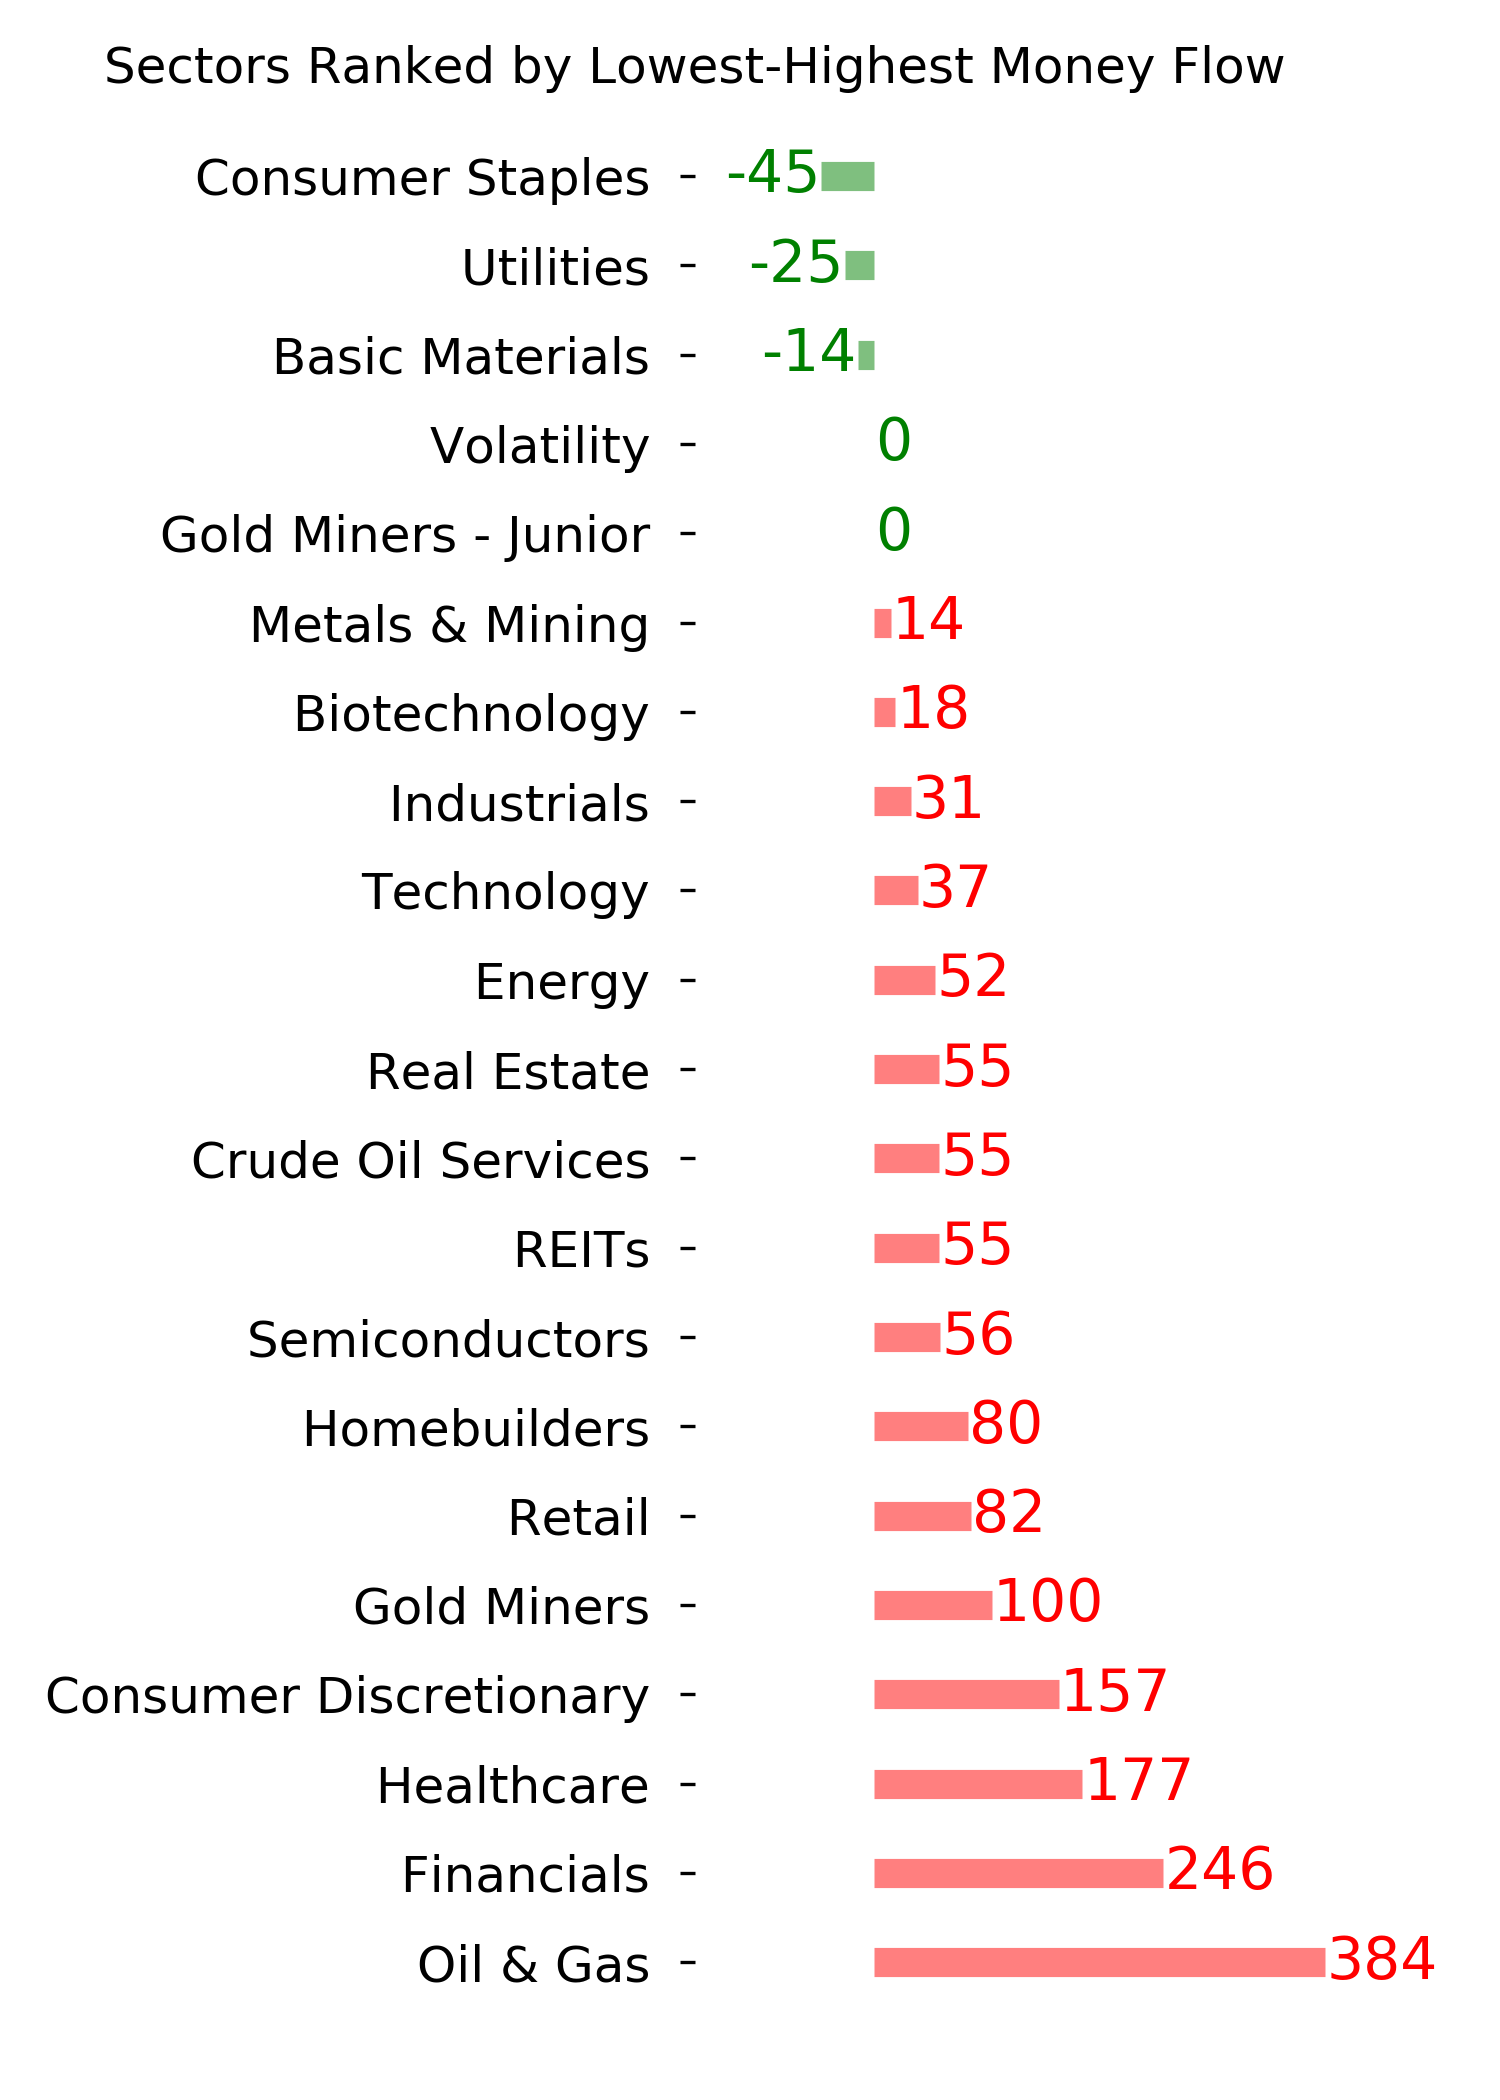
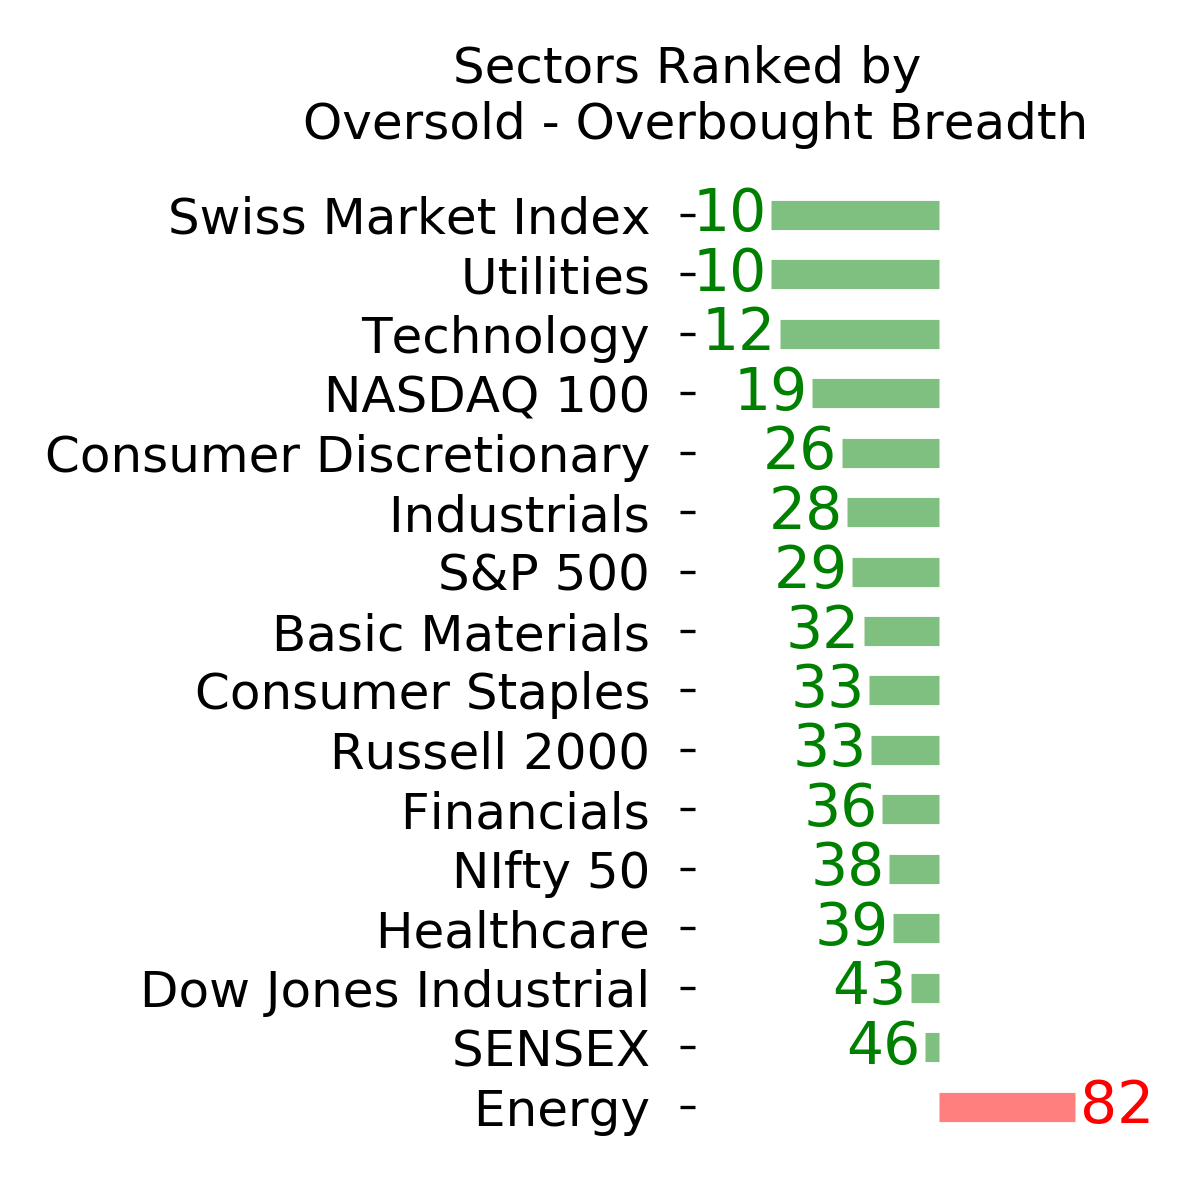
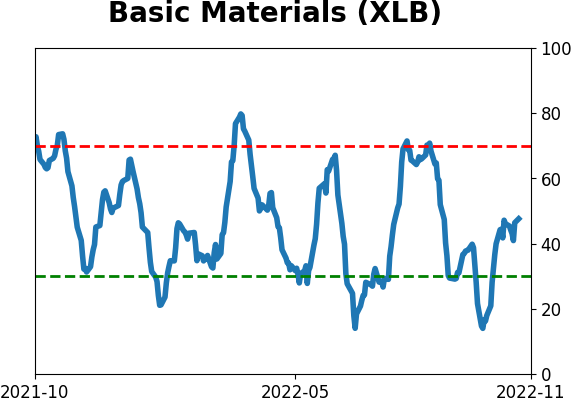
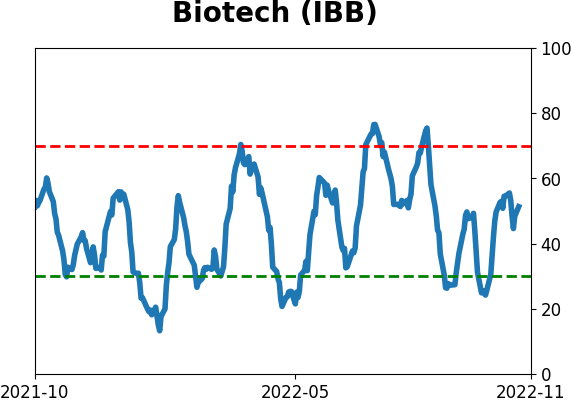
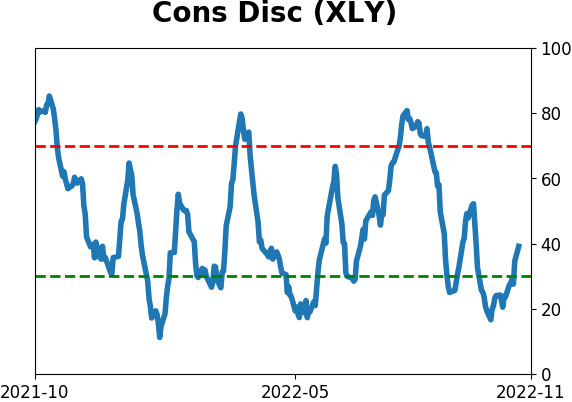
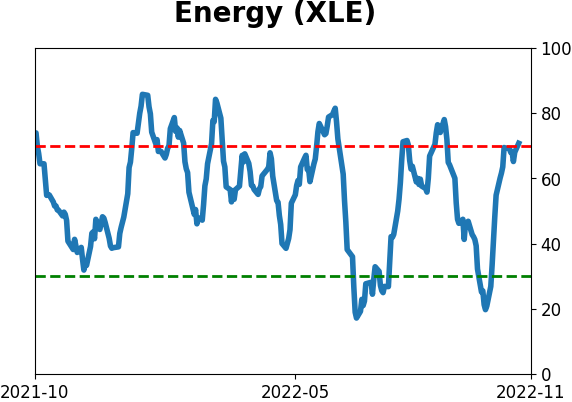
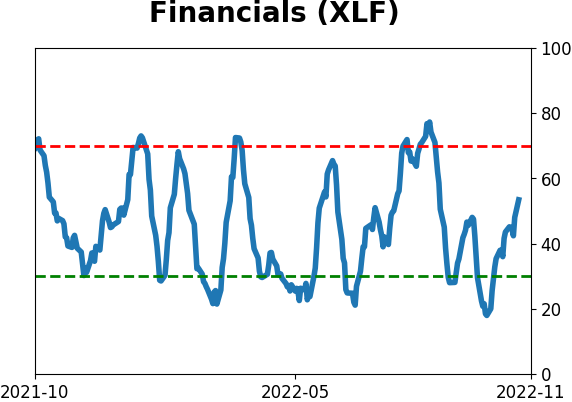
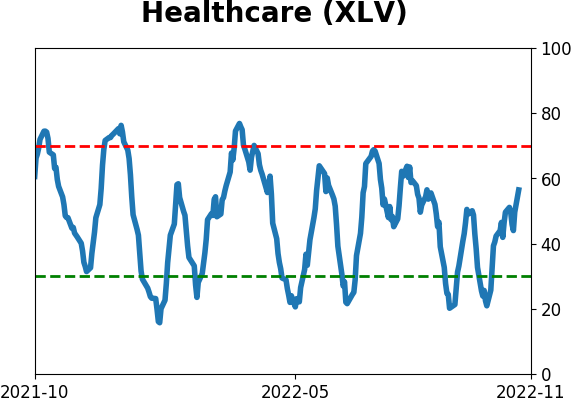
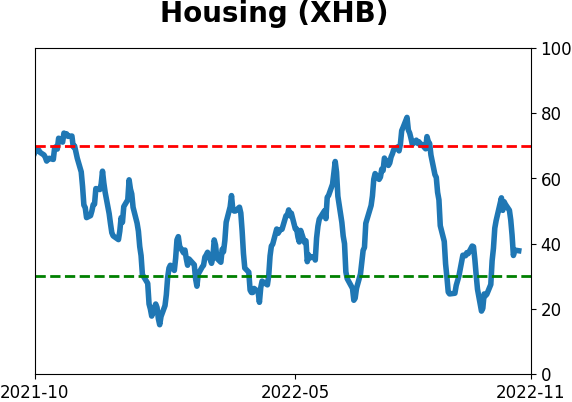
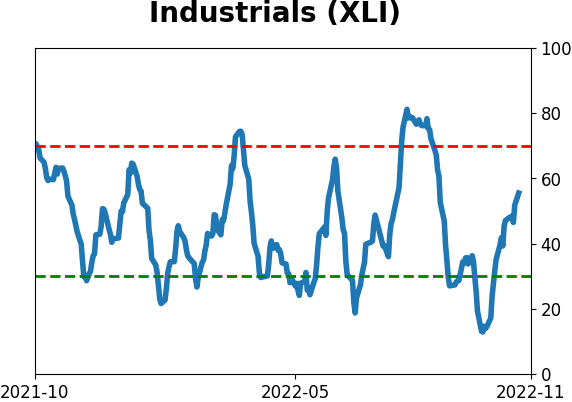
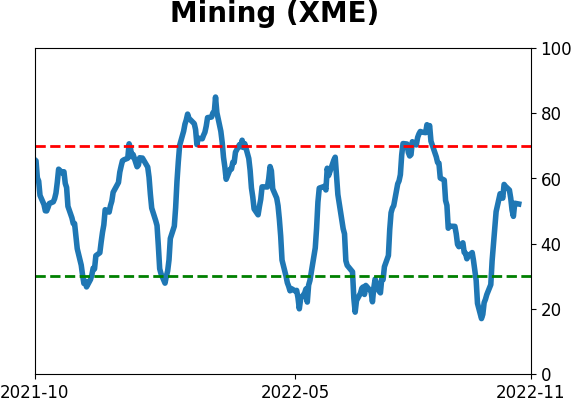
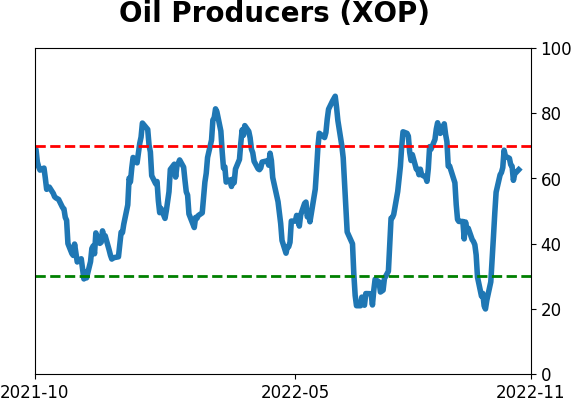
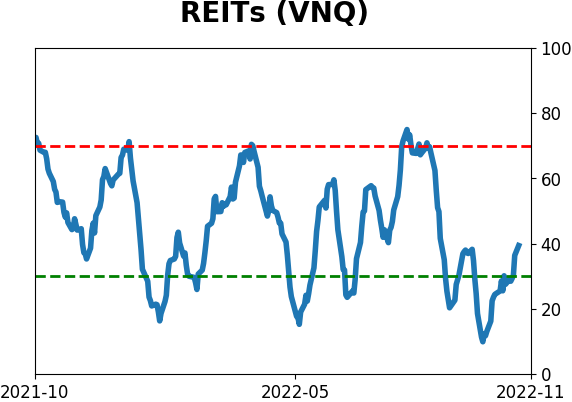
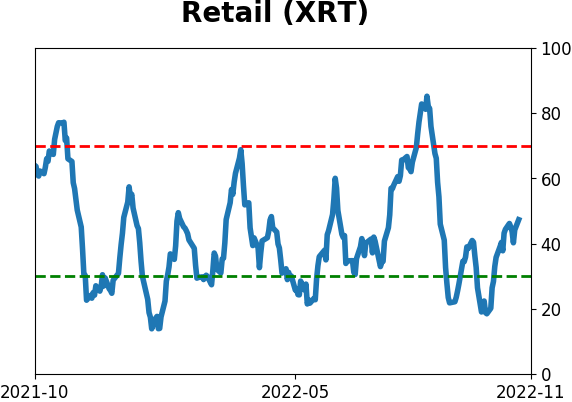
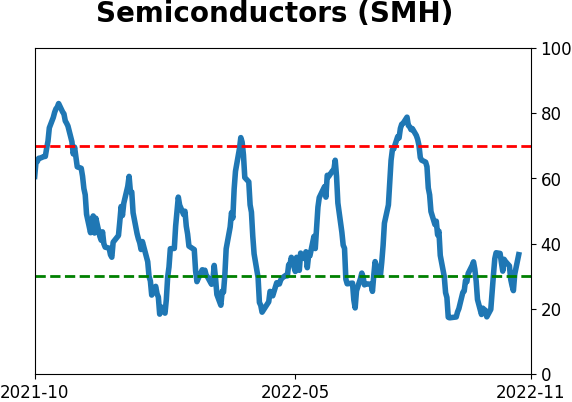
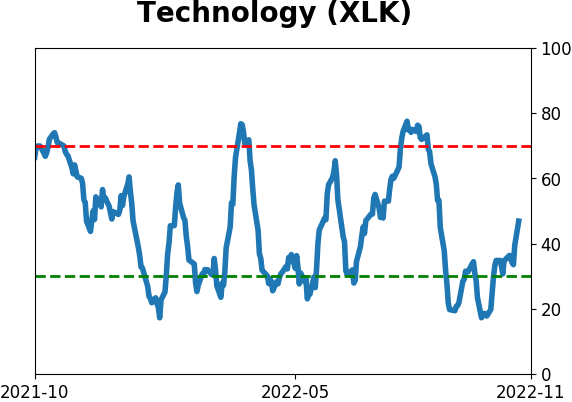
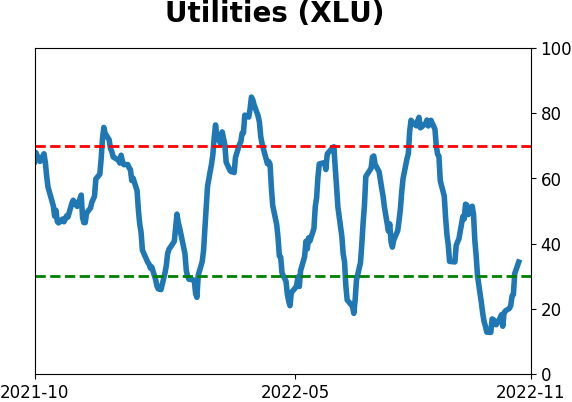
Sector ETF's - 10-Day Moving Average
|
|
|
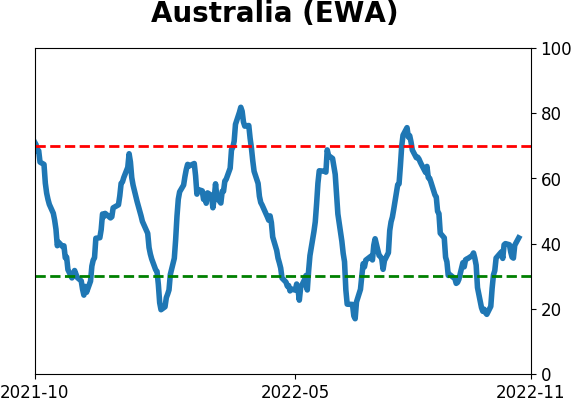
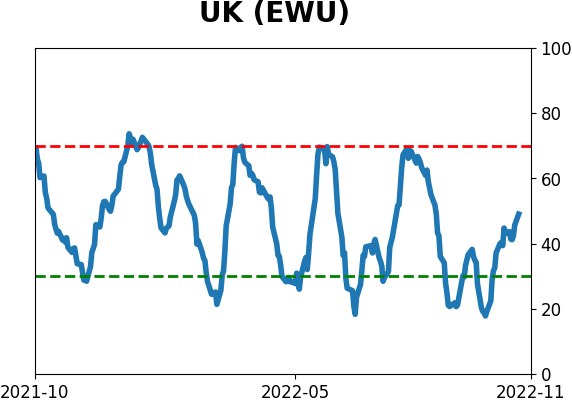
Country ETF's - 10-Day Moving Average
|
|
|
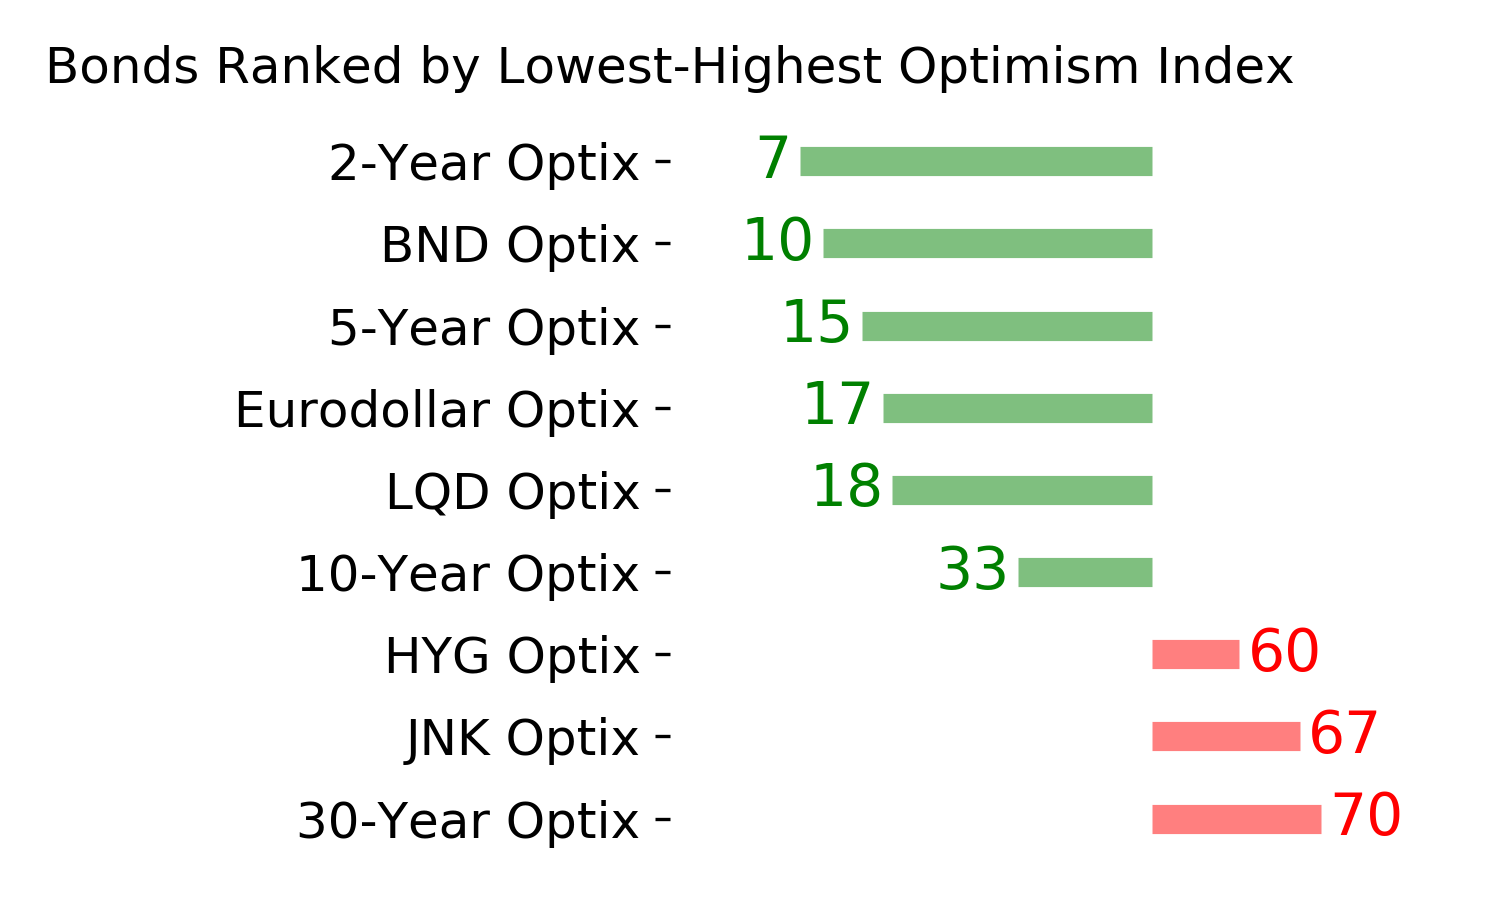
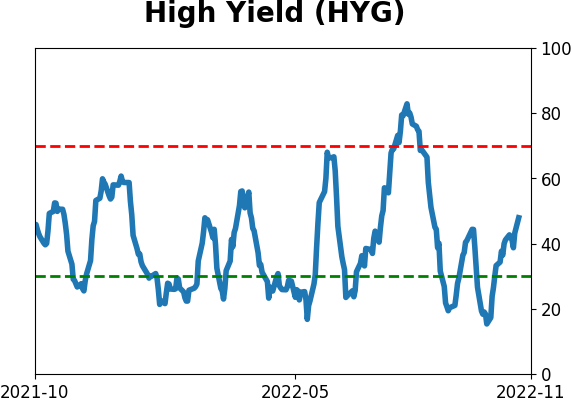
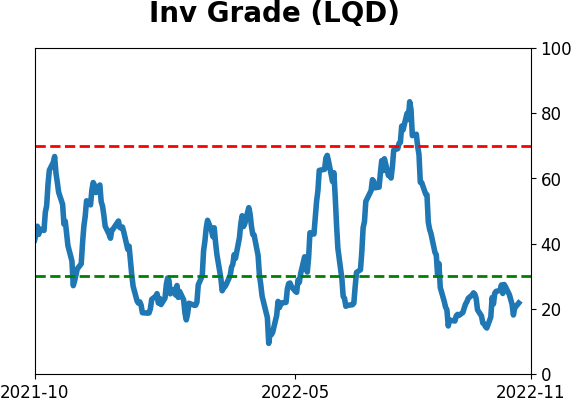
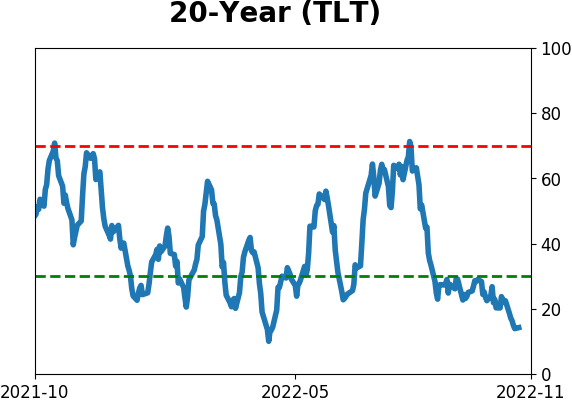
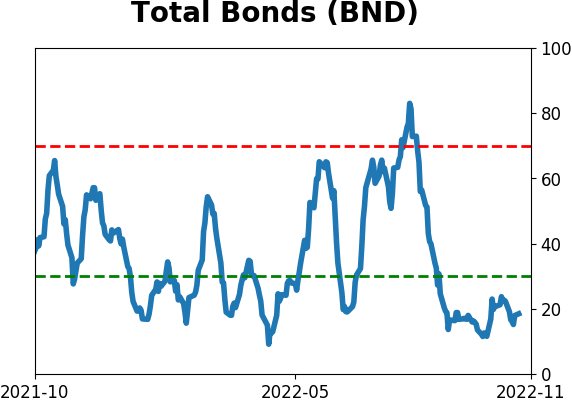
Bond ETF's - 10-Day Moving Average
|
|
|
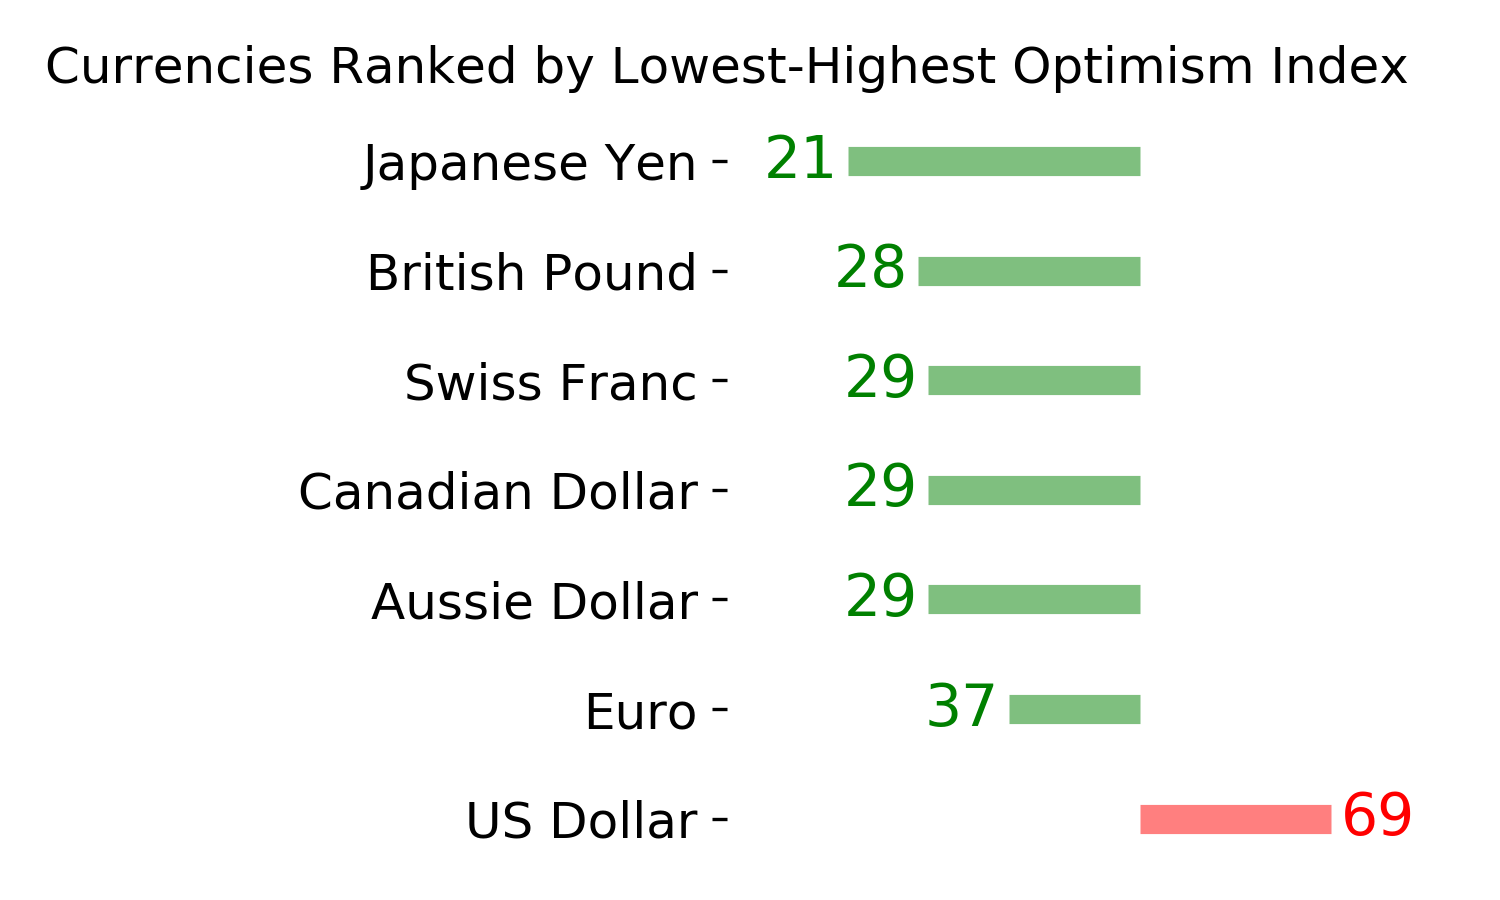
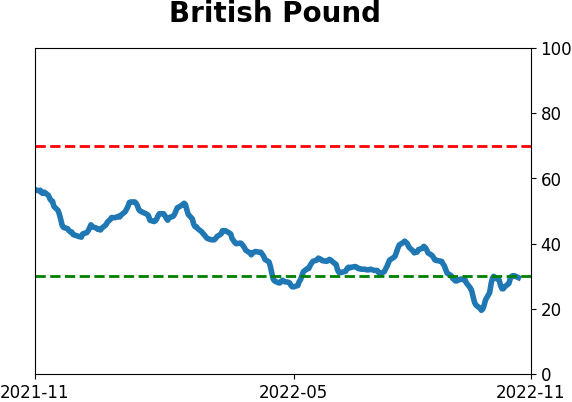
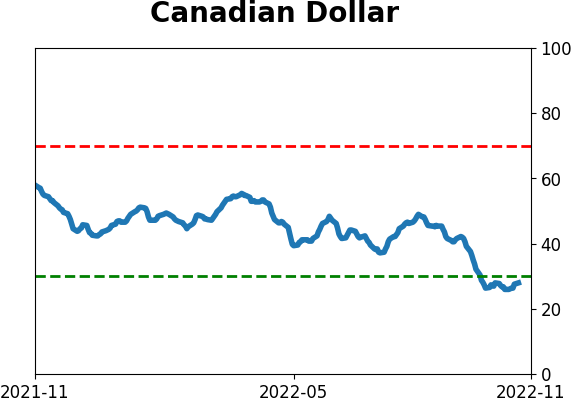
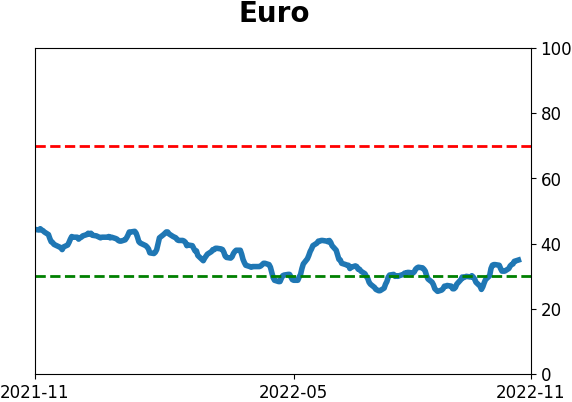
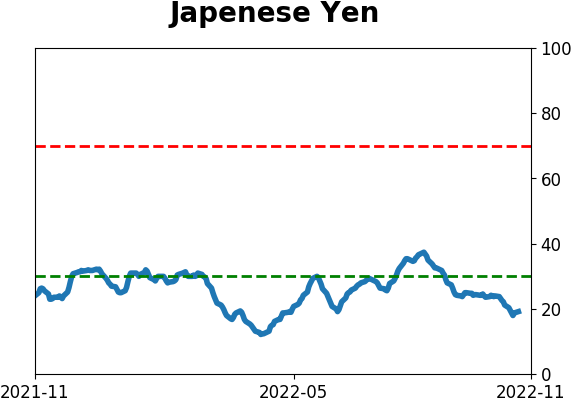
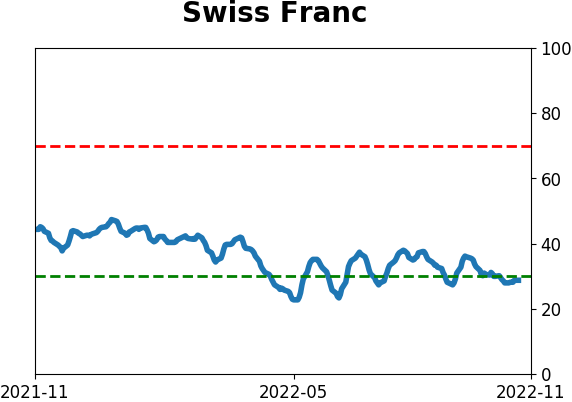
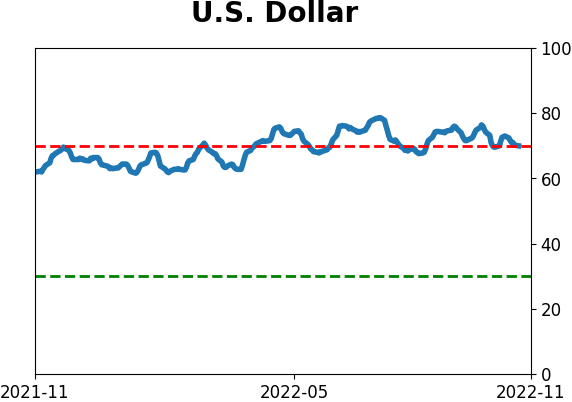
Currency ETF's - 5-Day Moving Average
|
|
|
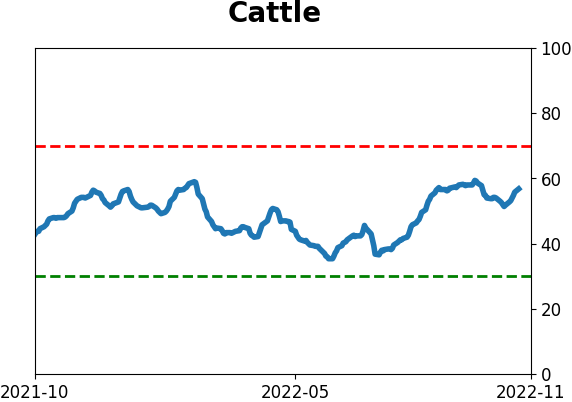
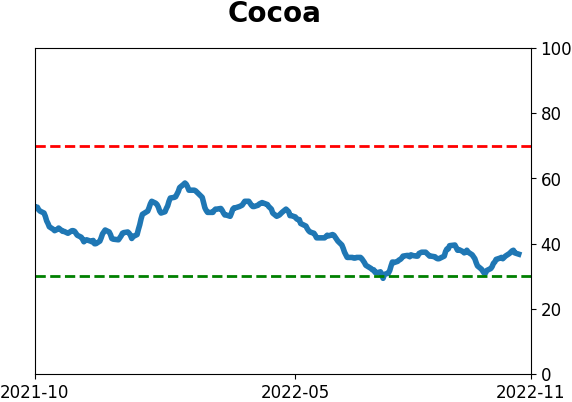
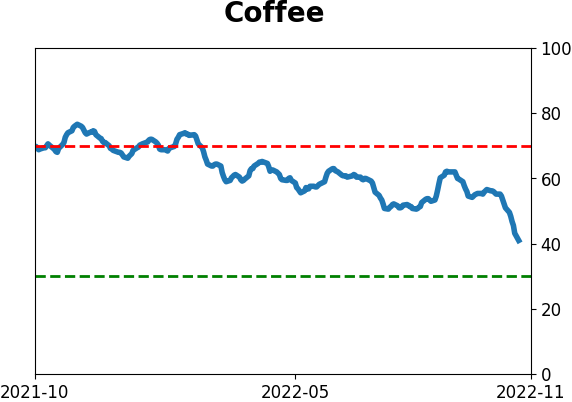
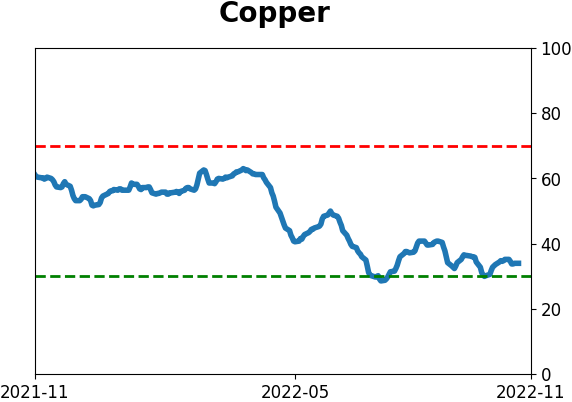
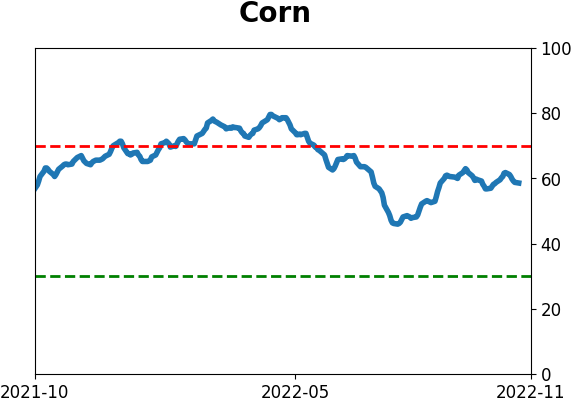
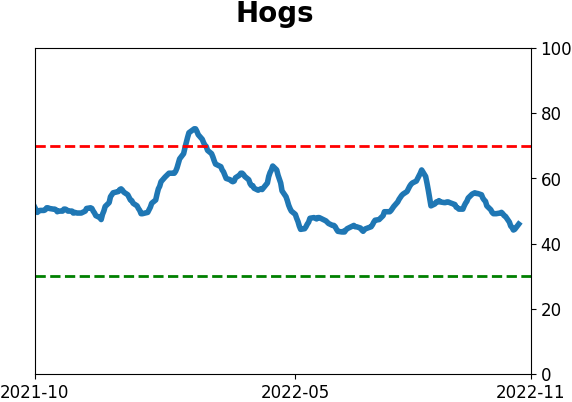
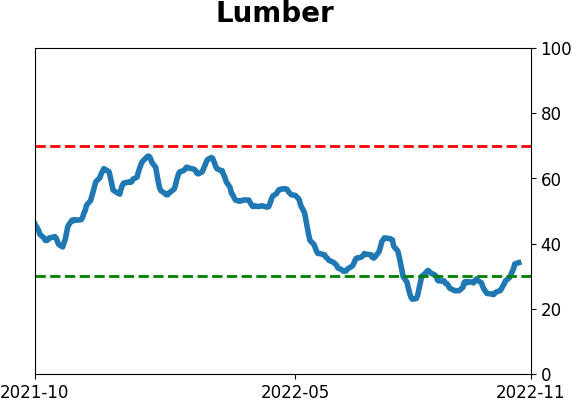
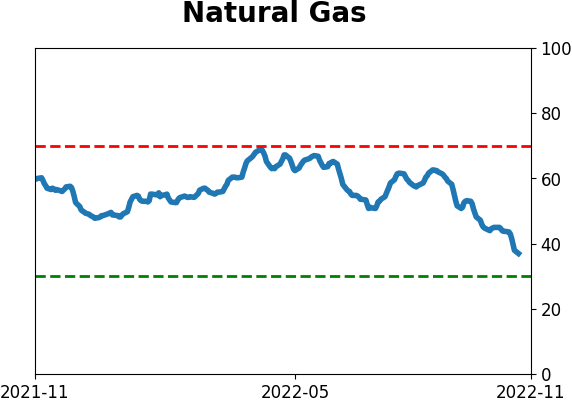
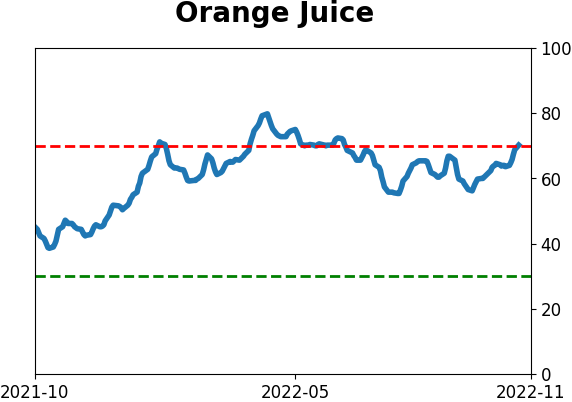
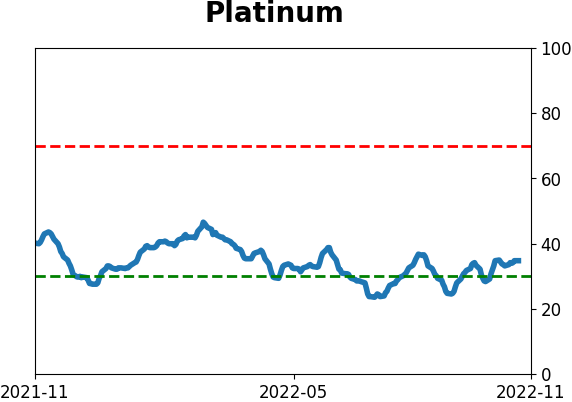
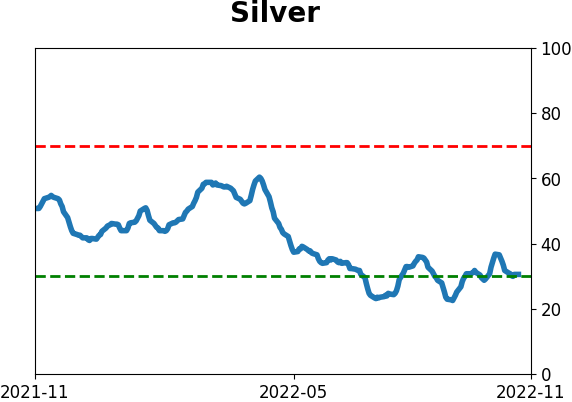
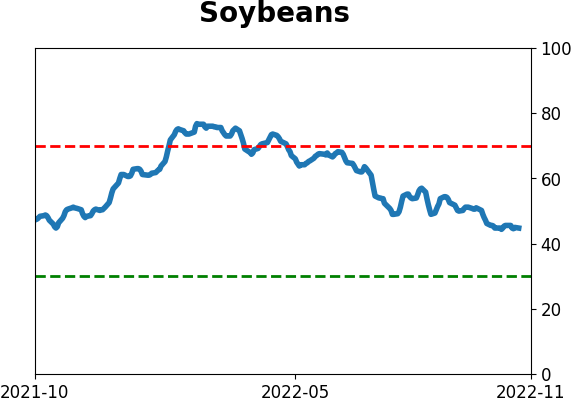
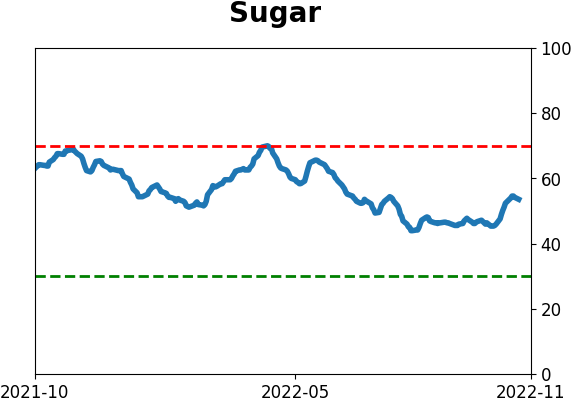
Commodity ETF's - 5-Day Moving Average
|
|