Headlines
|
|
The S&P 500 is failing its most important test:
After more than six months above its 200-day moving average, the S&P 500 has fallen below. That also ended a stretch of more than a month stuck between its 50- and 200-day moving averages. Index returns when it is below average are poor, but improve when that violation occurs after a prolonged stretch above.
|
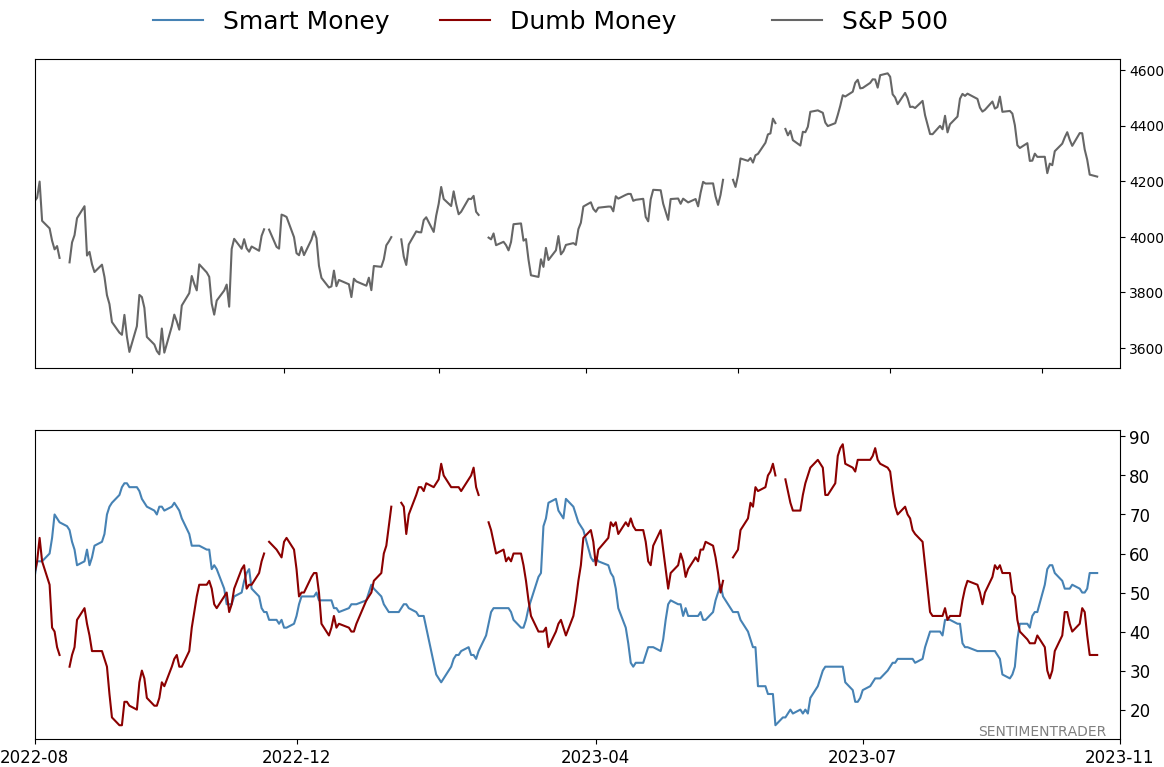
Smart / Dumb Money Confidence
|
Smart Money Confidence: 55%
Dumb Money Confidence: 34%
|
|
Risk Levels
Stocks Short-Term
|
Stocks Medium-Term
|
|
Bonds

|
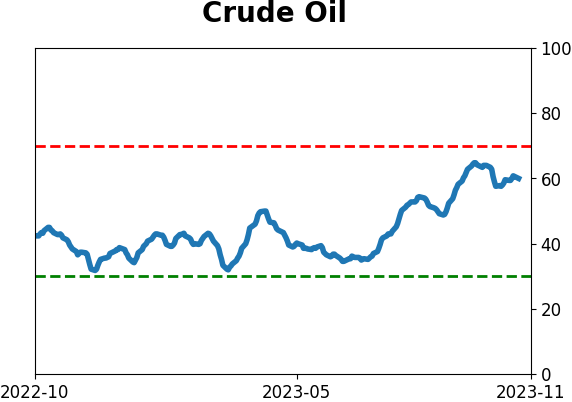
Crude Oil

|
|
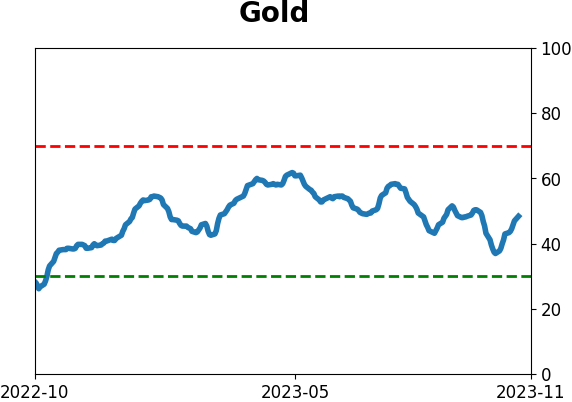
Gold
|
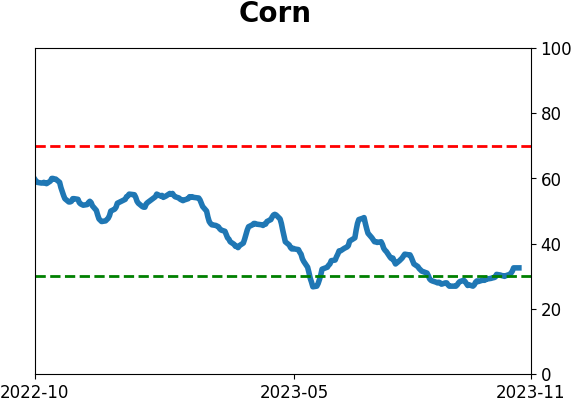
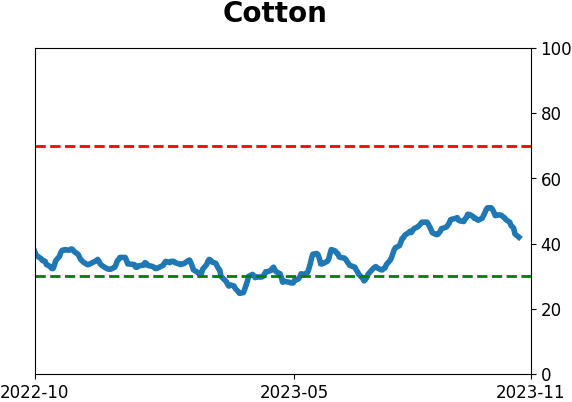
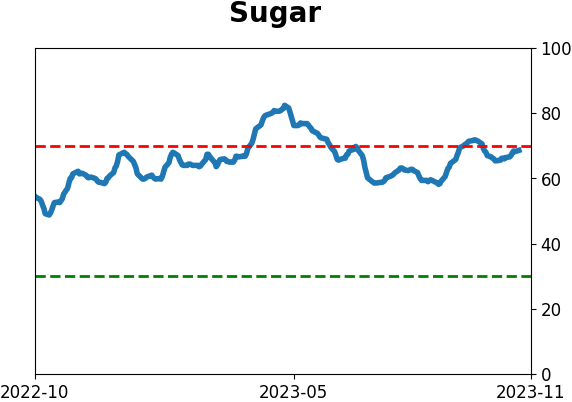
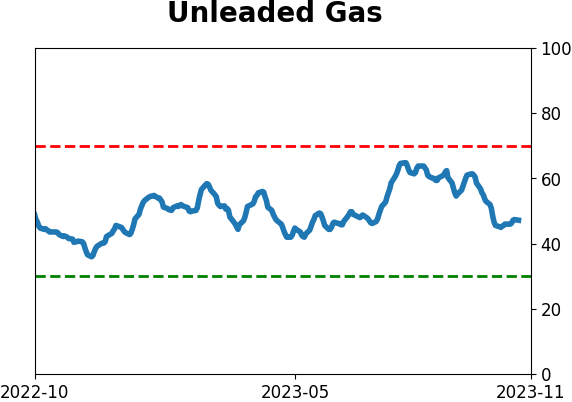
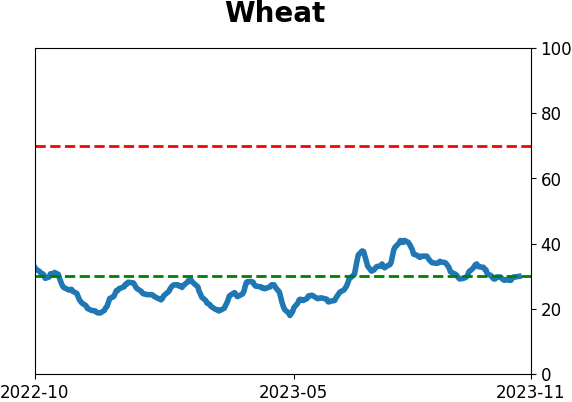
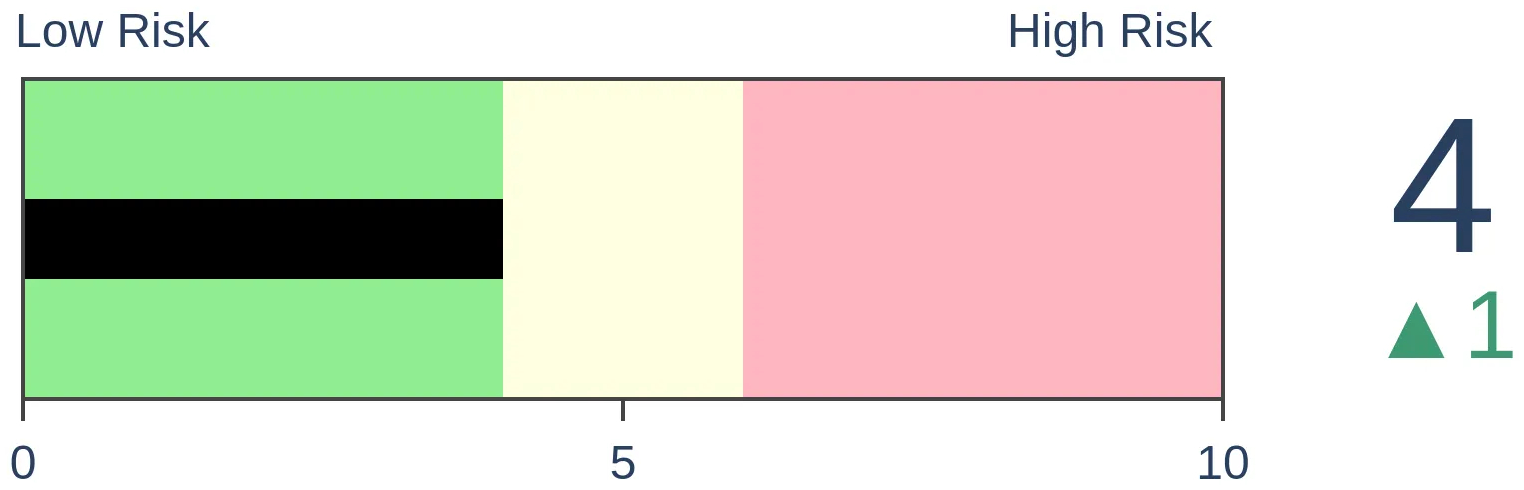
Agriculture
|
|
Research
By Jason Goepfert
BOTTOM LINE
After more than six months above its 200-day moving average, the S&P 500 has fallen below. That also ended a stretch of more than a month stuck between its 50- and 200-day moving averages. Index returns when it is below average are poor, but improve when that violation occurs after a prolonged stretch above.
FORECAST / TIMEFRAME
None
|
Key points:
- The S&P 500 had been stuck between its 50- and 200-day moving averages for over a month
- It has since violated its long-term average, ending a long streak above
- Returns when it is below average tend to be poor, but not so much after a prolonged stretch above
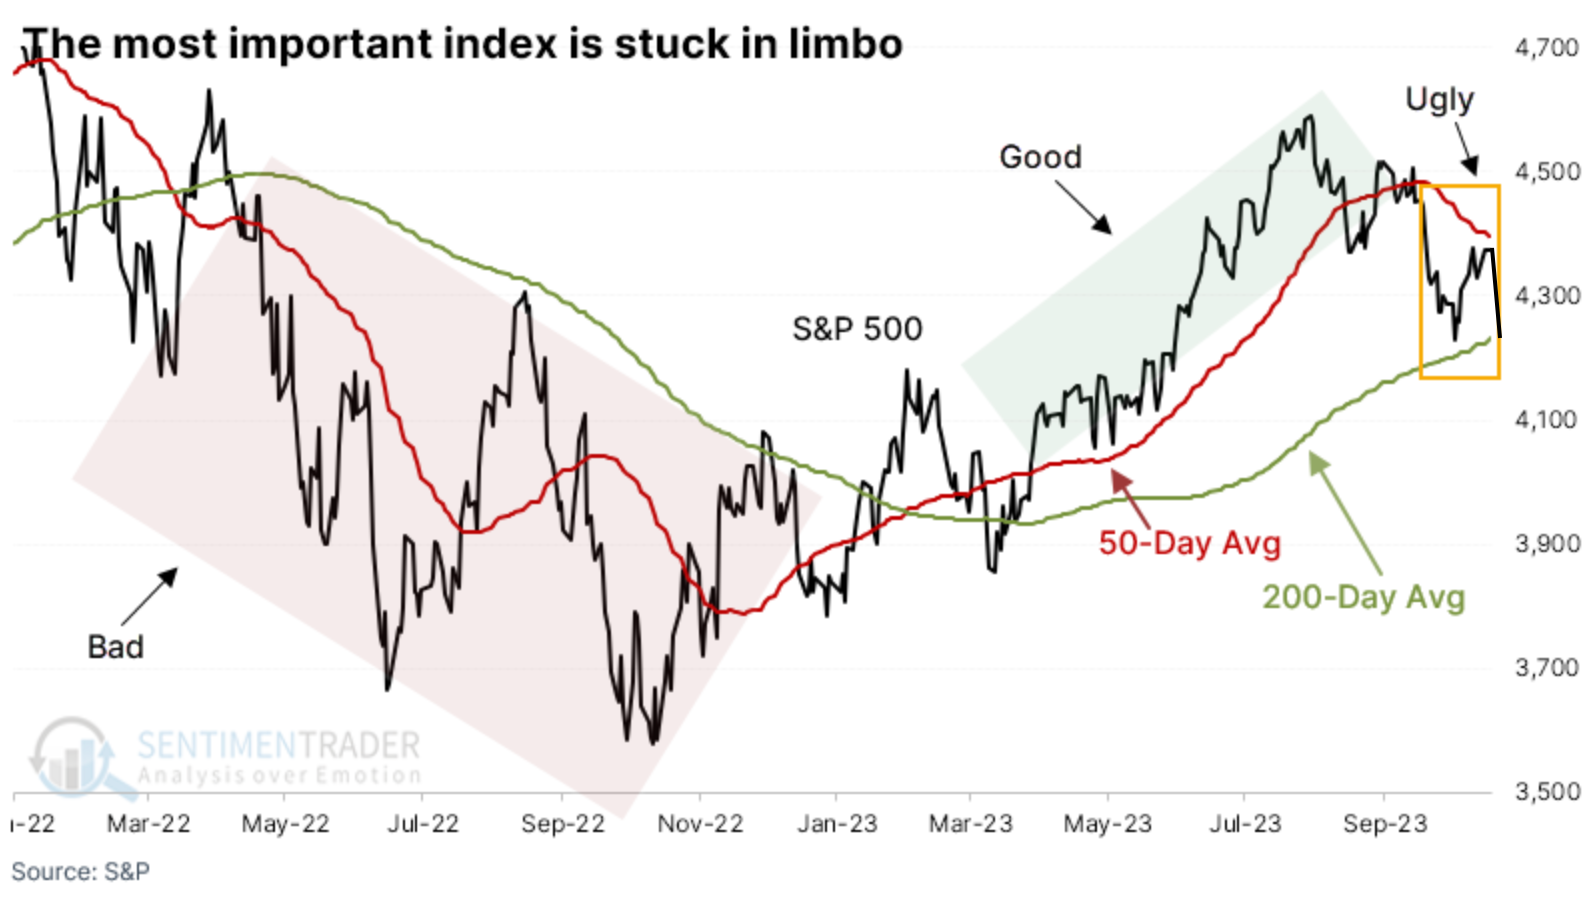
The most important index is failing its most crucial test
The most important equity index in the world just came unstuck. After spending over a month gyrating between its two most-watched trend-following gauges, the S&P 500 on Friday finally fell below its 200-day moving average.
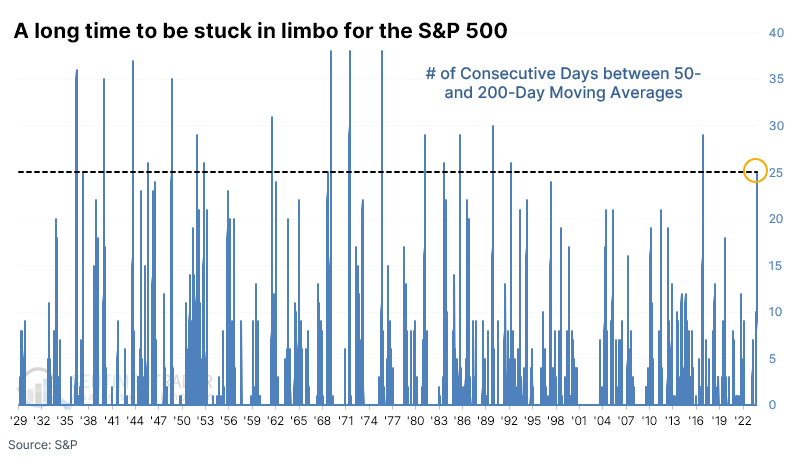
Before that late loss, the index had been trading between a falling 50-day moving average and a rising 200-day moving average for 25 trading sessions. Over the past year, when the index traded below its 200-day (and even more ominously, both averages), it suffered its largest losses. When it traded above both, it signaled a much more healthy environment.
The stretch of 25 sessions between its 50- and 200-day averages is long. Since 1928, there haven't been many times when investors were so undecided between the medium- and long-term trends. It was the 2nd-longest such streak in 30 years.
Moving average violations don't have to indicate the end times
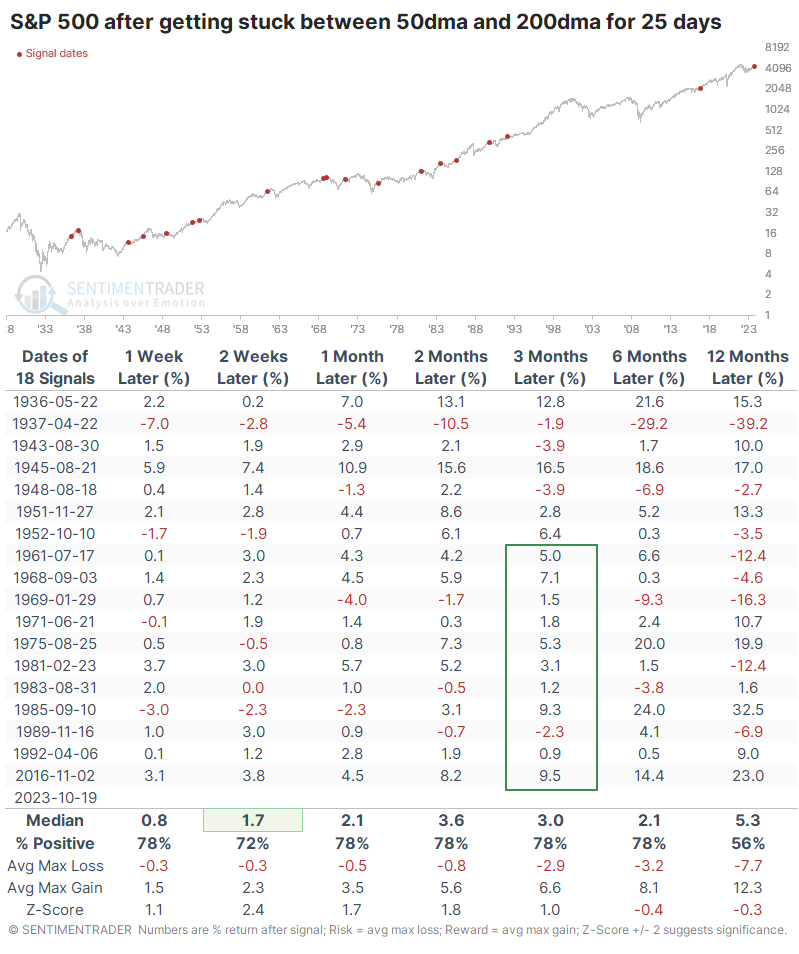
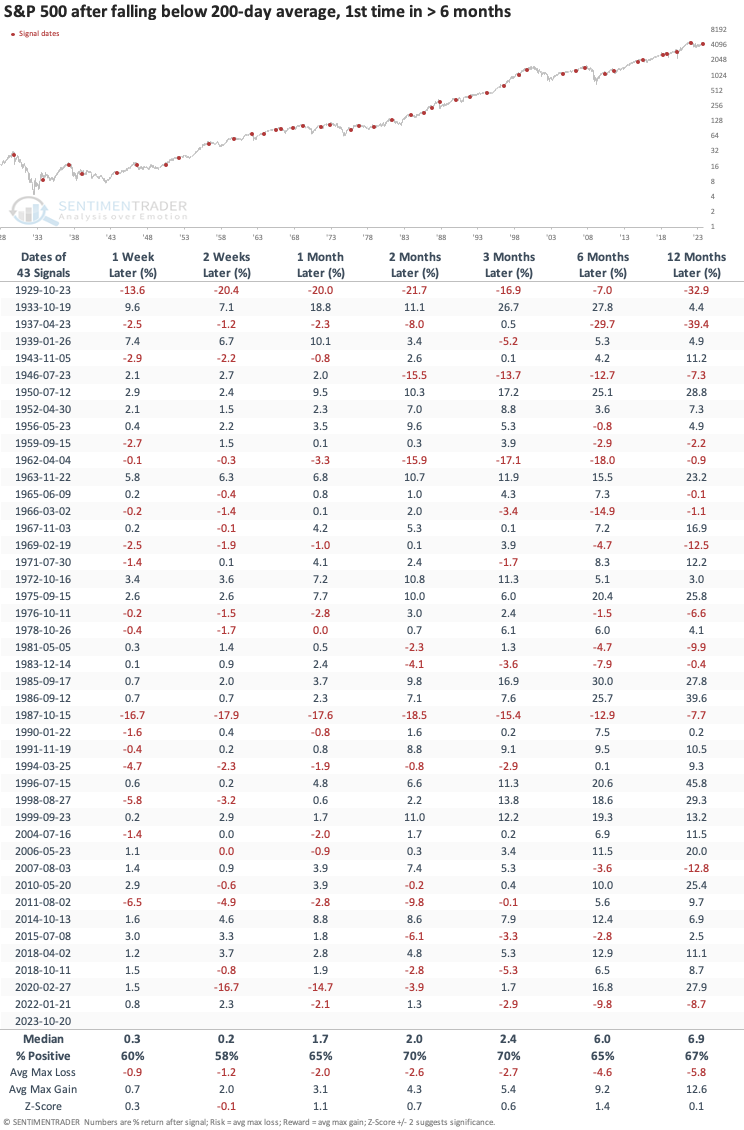
The table below shows every time the S&P spent 25 sessions stuck between its moving averages since 1928. It mostly resolved higher over the short- to medium-term, but not always. And when it didn't, it wasn't necessarily a death knell for the uptrend. When it knifed below its 200-day average in 1937, it was a sign of bad things to come for investors, but other poor initial reactions in 1952, 1971, and 1985 all preceded rebounds over the next 2-3 months.
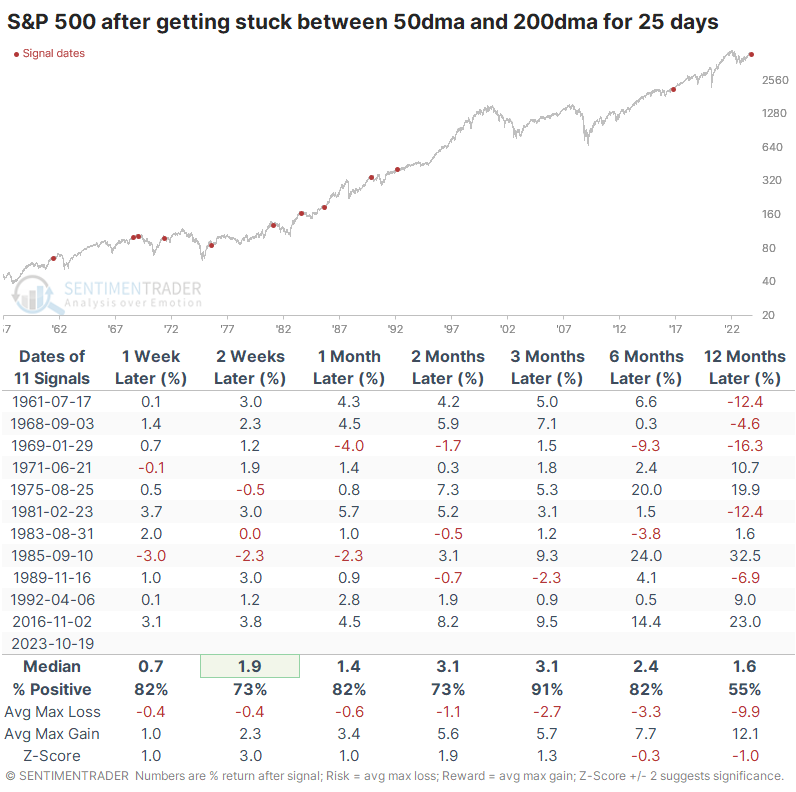
Since it became a 500-stock index in 1957, there was only one loss over the next three months, which was minor and quickly erased. However, several medium-term rallies failed, leading to negative one-year returns. The median return and max loss over the next year were troubling, but again, this was after medium-term rallies.
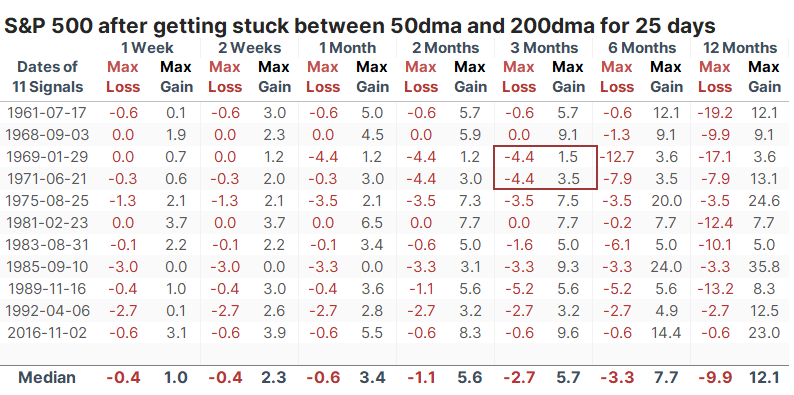
The table of maximum gains and losses across time frames shows that only two signals over the next three months exhibited a larger maximum decline than maximum rally, suggesting that the risk was limited relative to reward for a while anyway.
When the S&P fell below its 200-day average for the first time in six months, it also wasn't a consistent signal that the end was nigh. Over the next two to three months, the index rose 70% of the time, with about twice the average max gain than the average max loss. A caveat here is that since 2010, it has been much more of a crap shoot.
What the research tells us...
Now that the S&P has violated what is likely the most widely-watched trend-following metric, there are increasing calls that we're about to witness a crash. It's no surprise that once again, "Black Monday" is trending on X/Twitter and according to Bloomberg data, news articles with that term are the highest since March 13. There is little doubt that pure trend-followers will now become defensive, and there is also little doubt that S&P 500 returns are poor when it trades below its long-term average.
It is less clear that when it trades below its average after a prolonged stretch above, especially when it has been stuck between its 50- and 200-day averages, its returns have been decent or above average, with few instances of major trouble ahead. Of course, we're simply relying on investor behavior repeating as it usually does, which we've found to be among the most reliable patterns in markets.
Indicators at Extremes
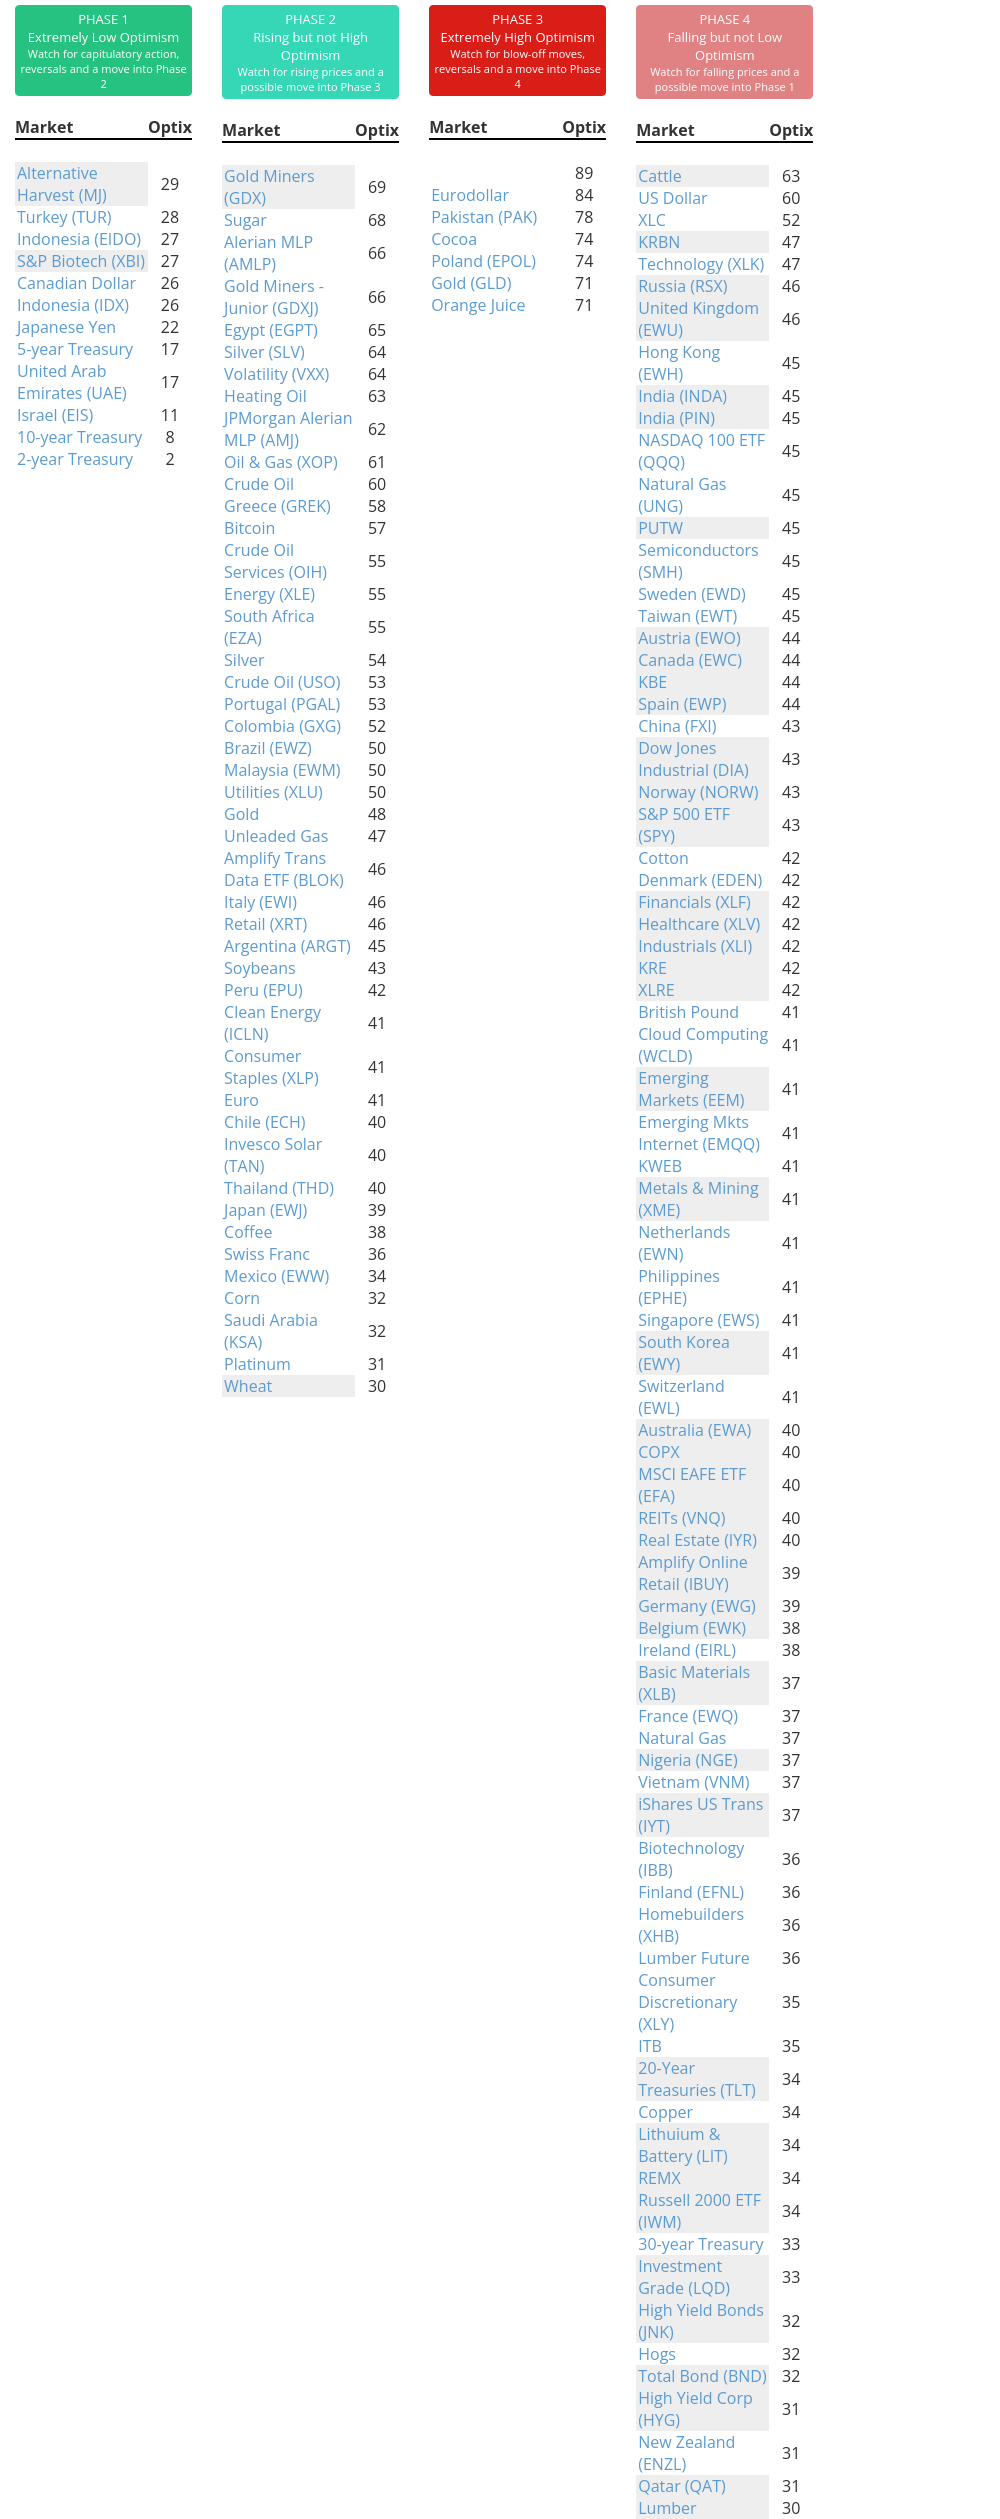
Phase Table
Ranks
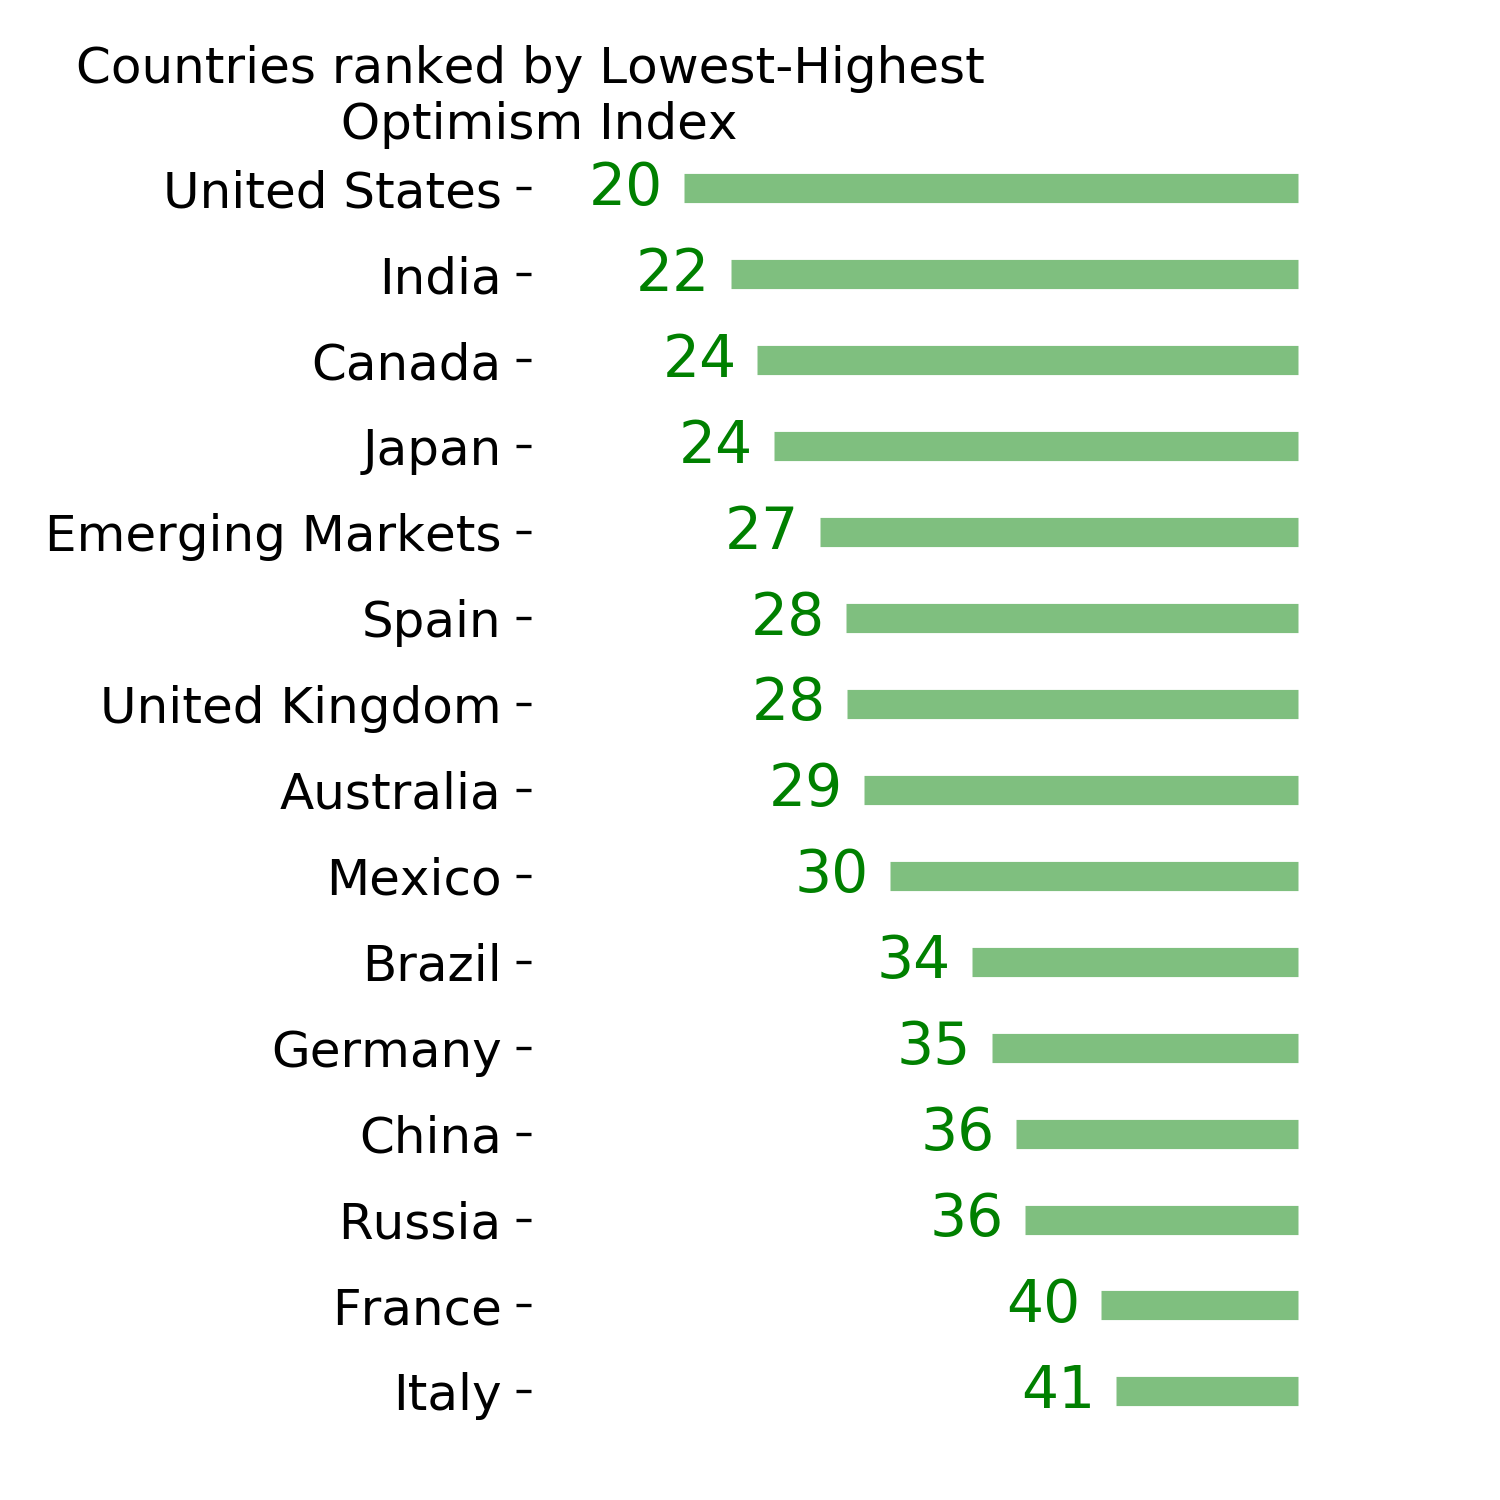
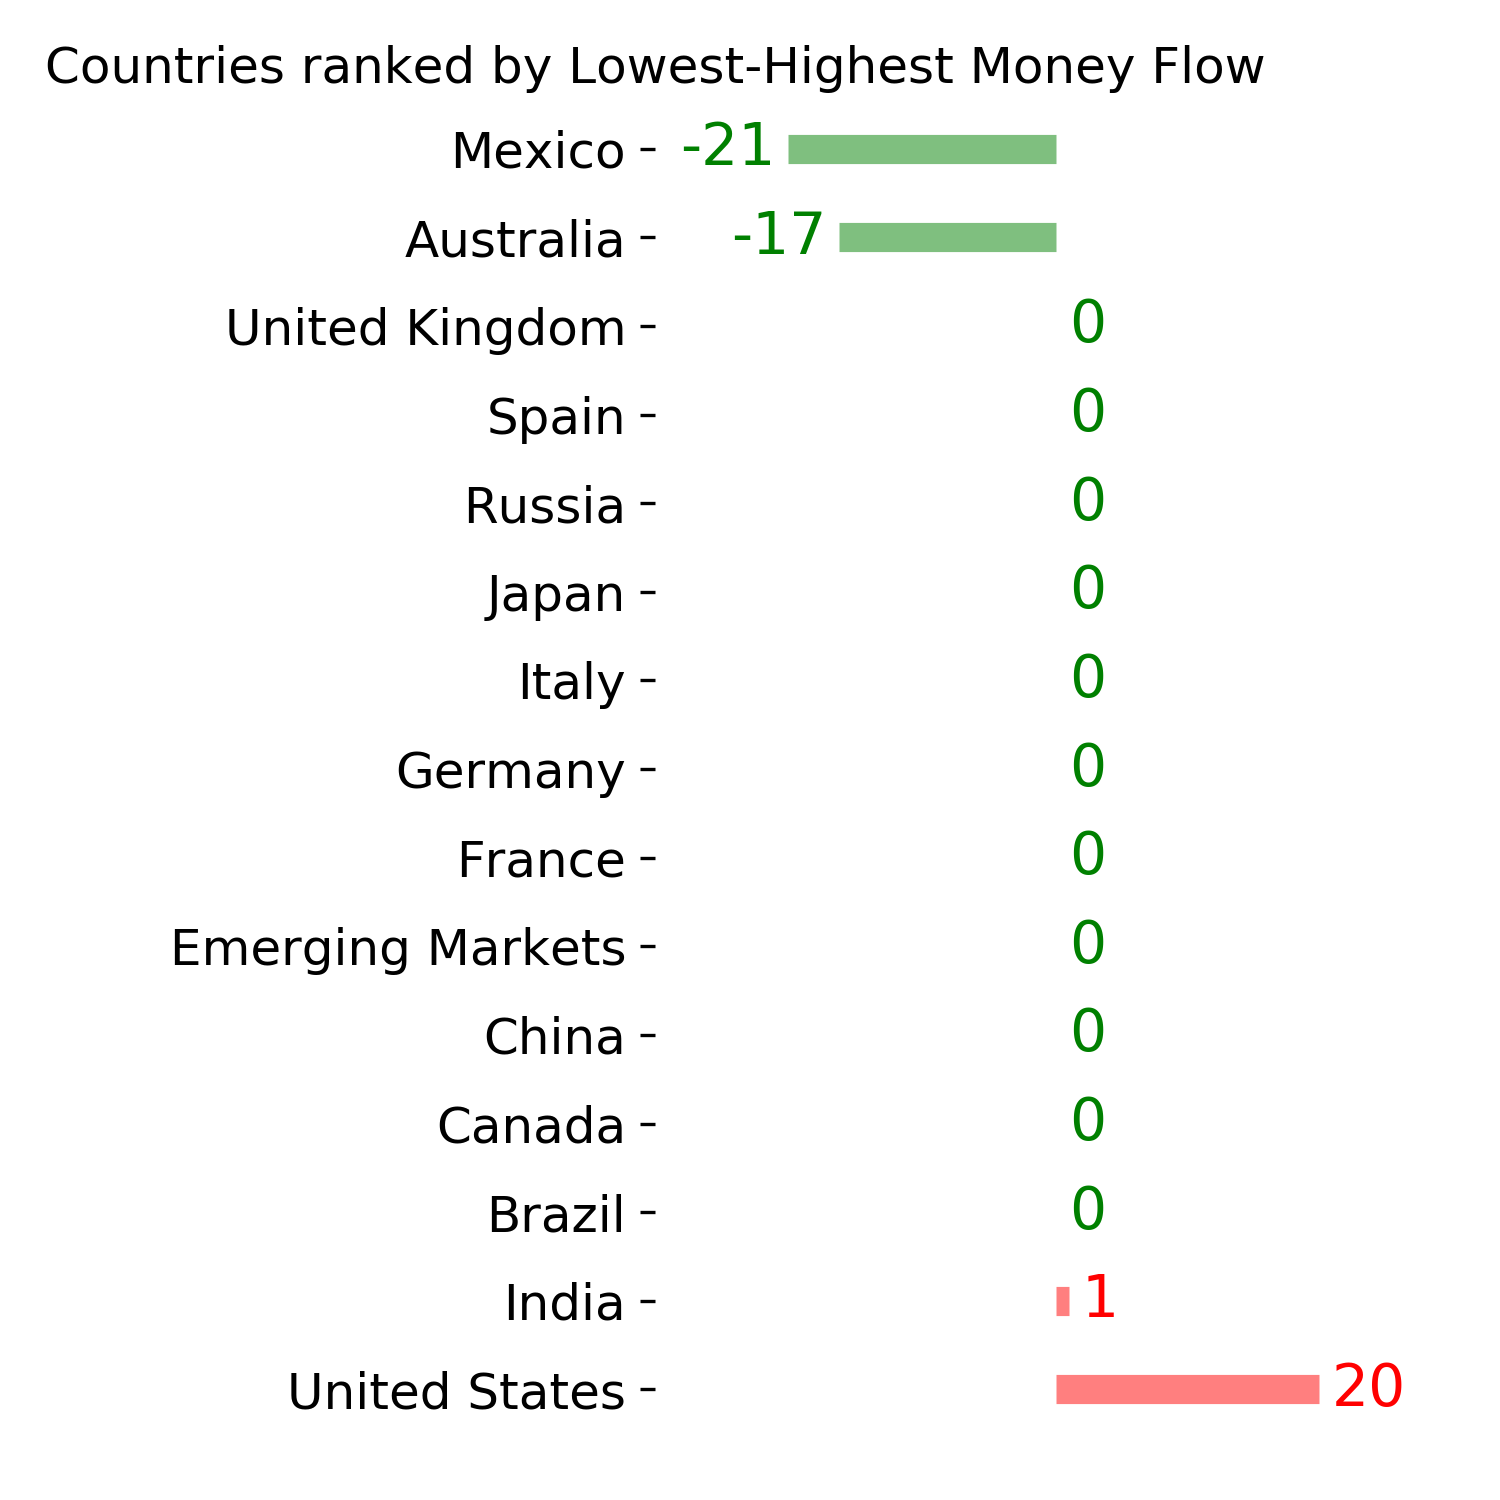
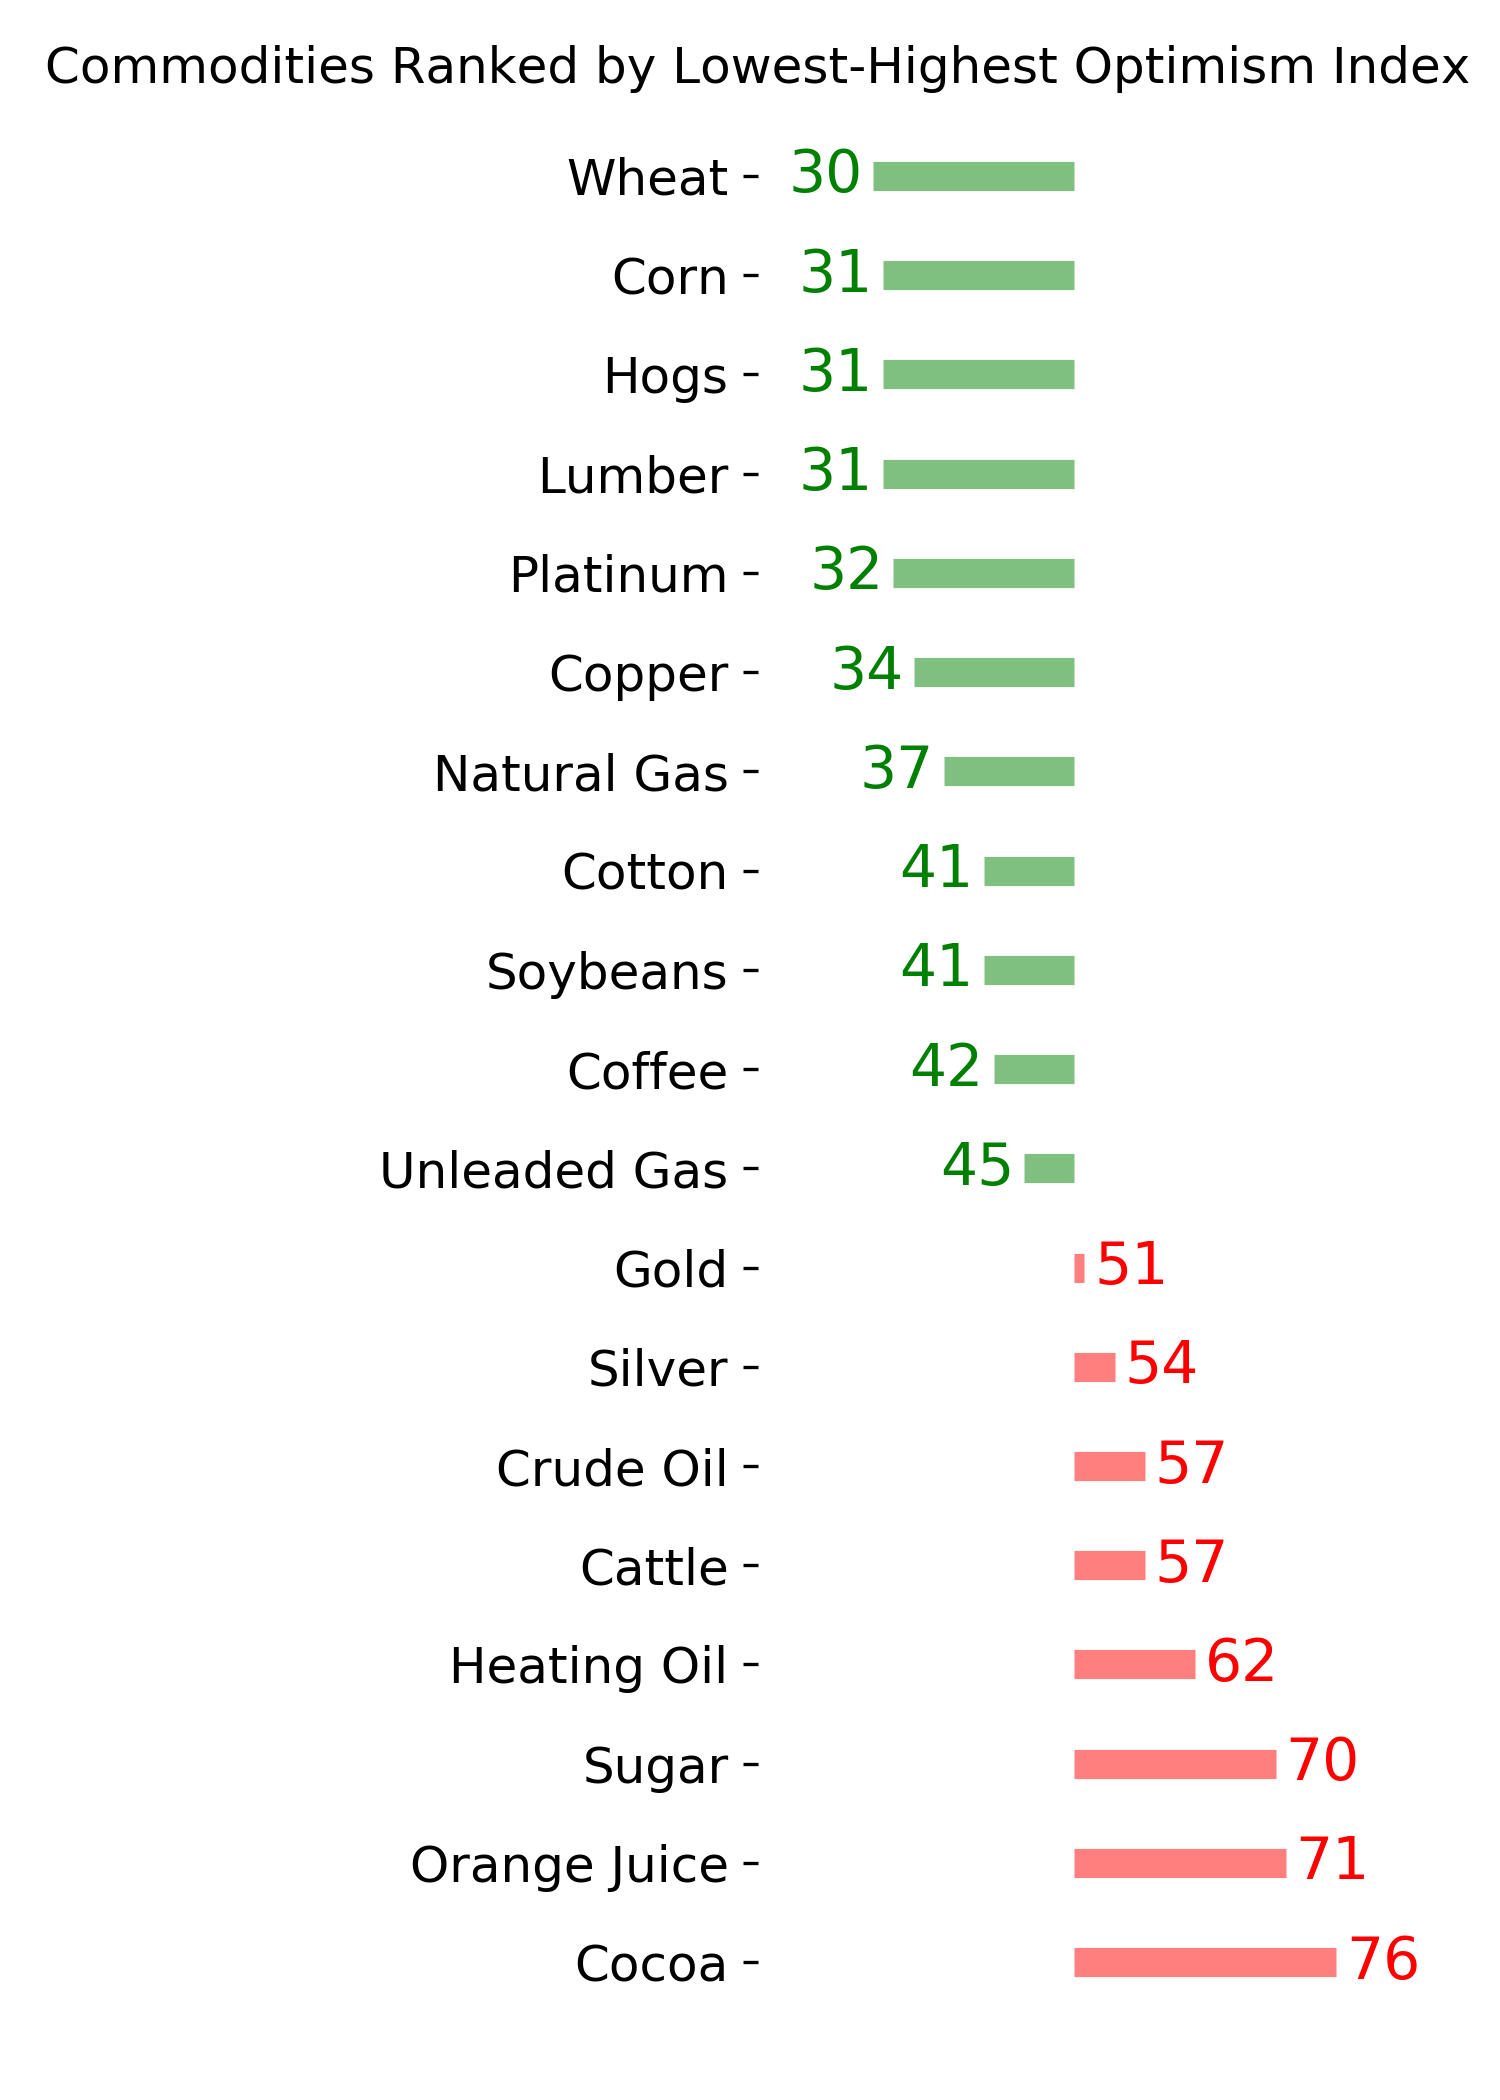
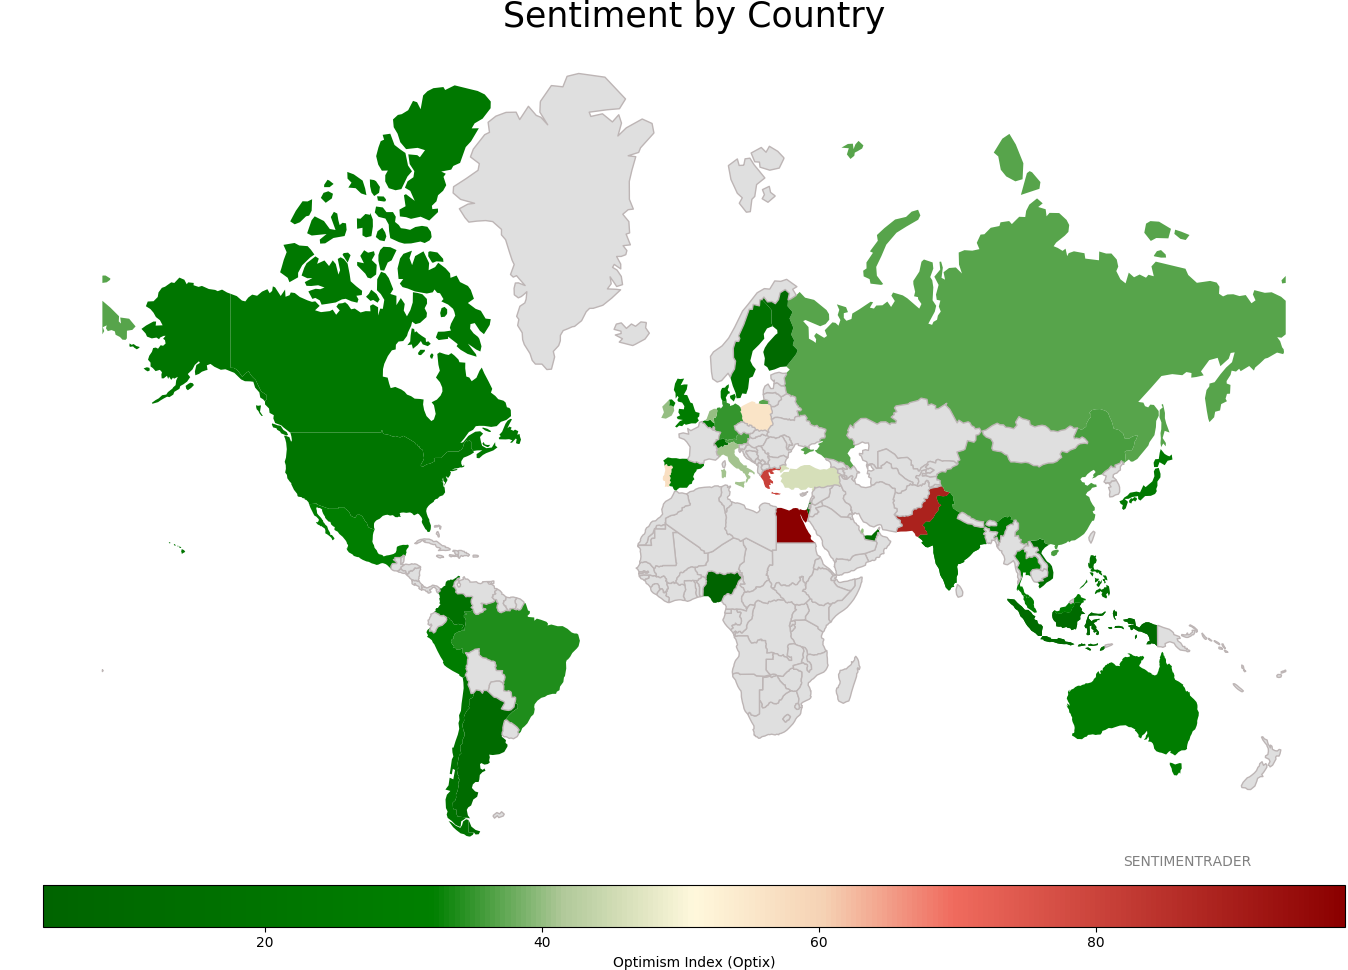
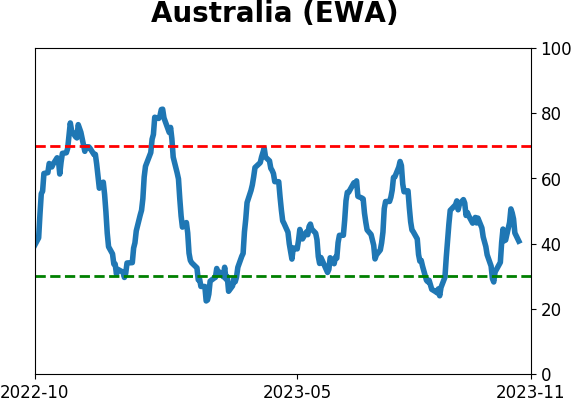
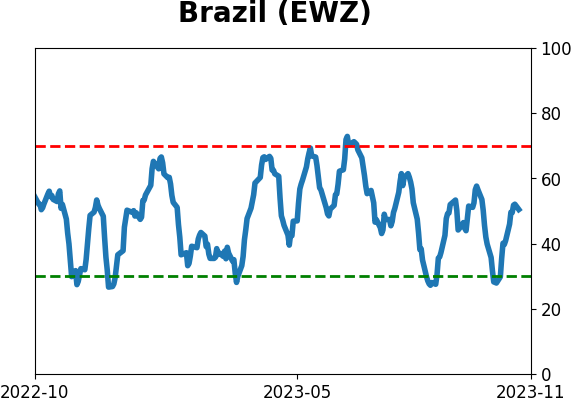
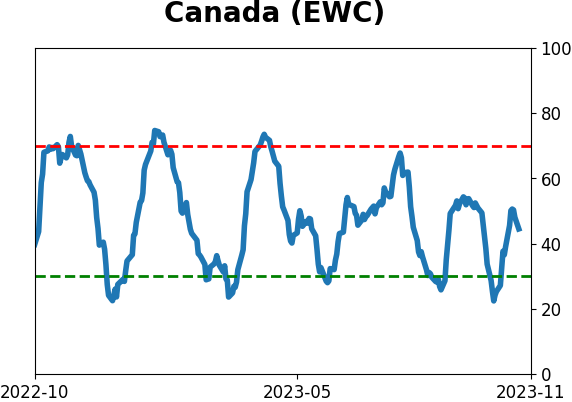
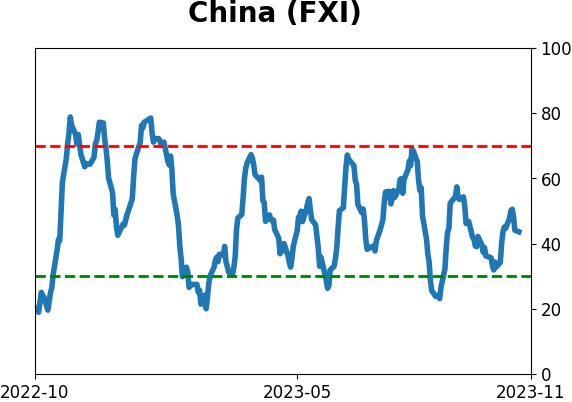
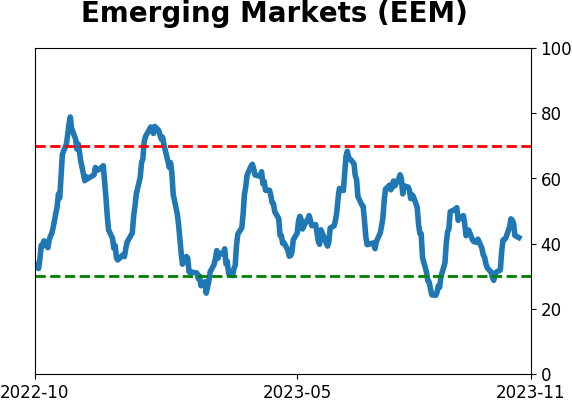
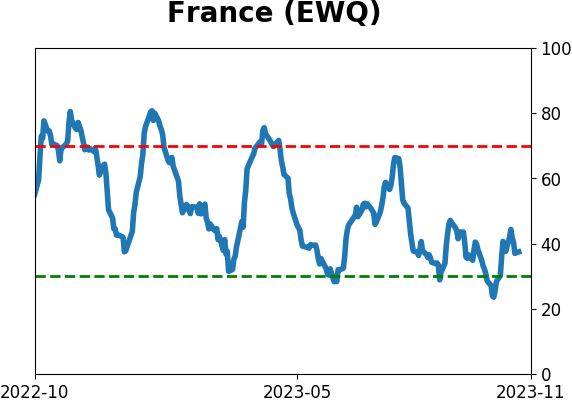
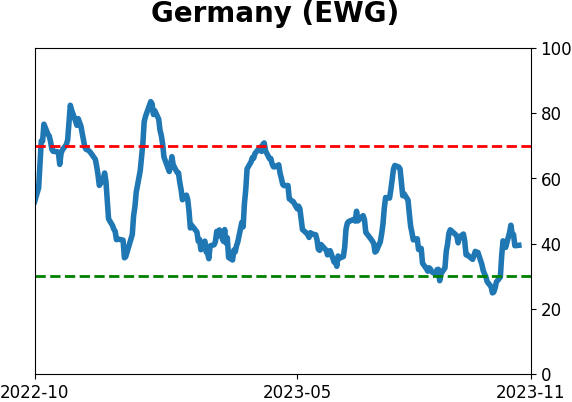
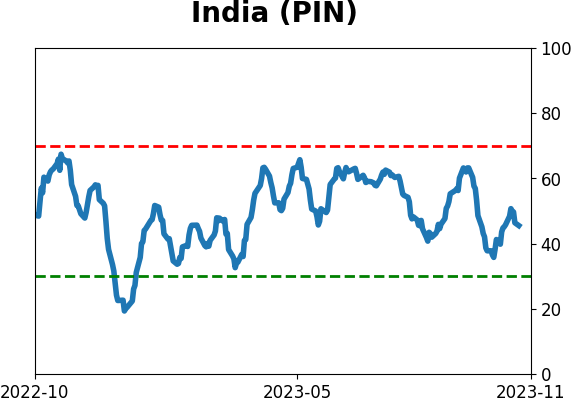
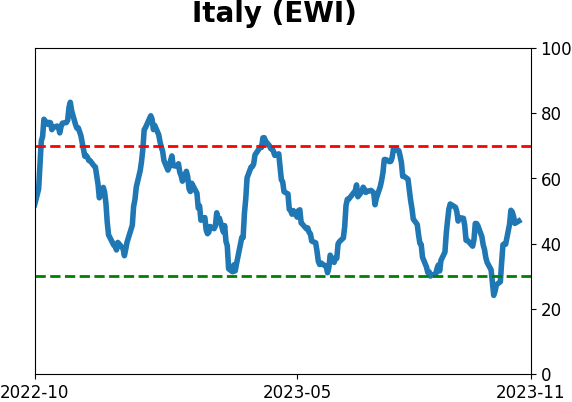
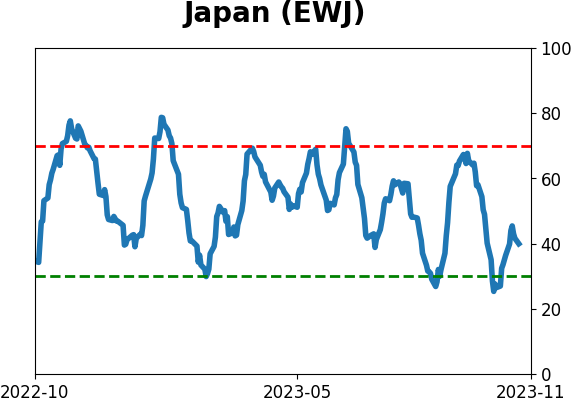
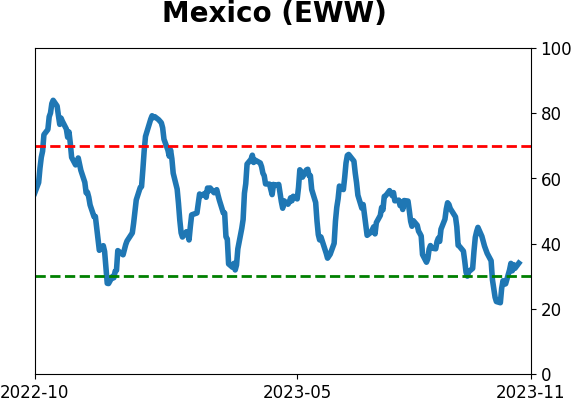
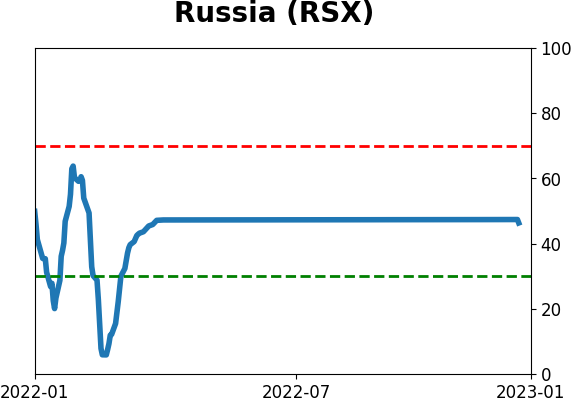
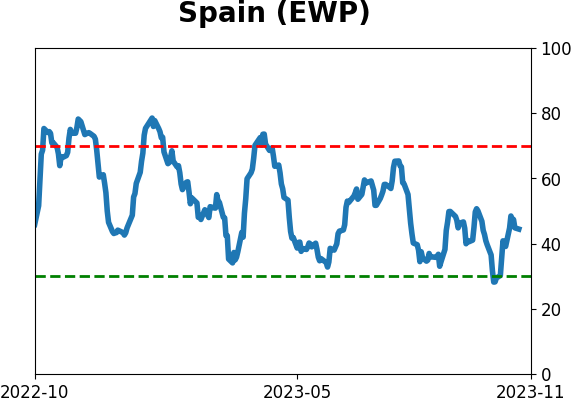
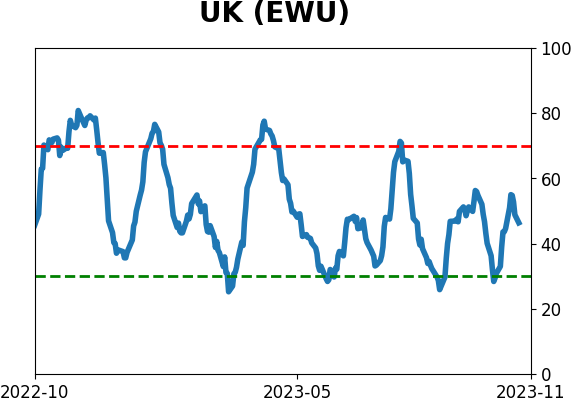
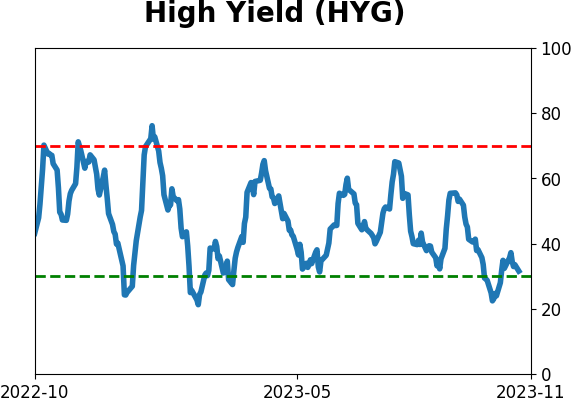
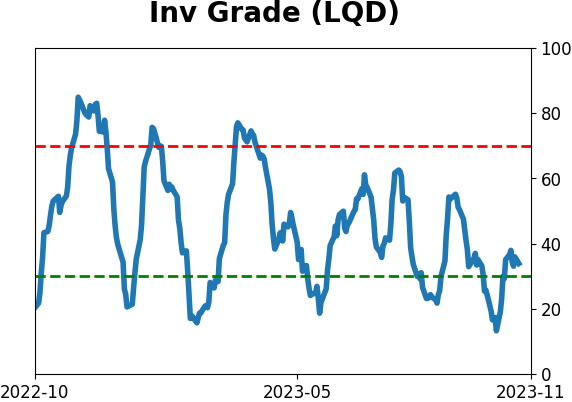
Sentiment Around The World
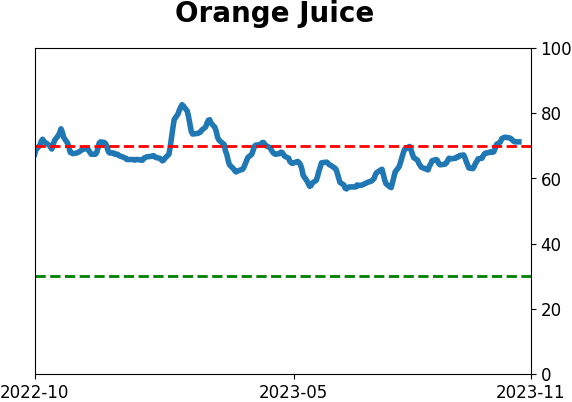
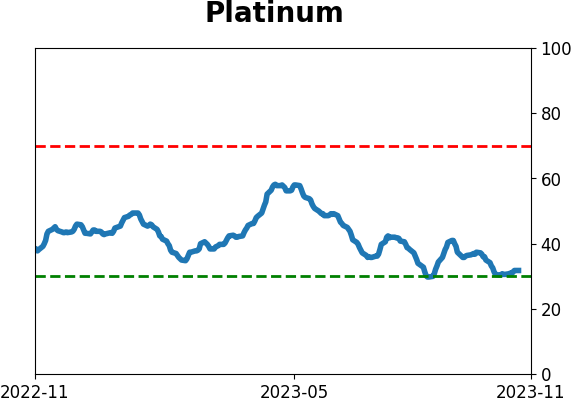
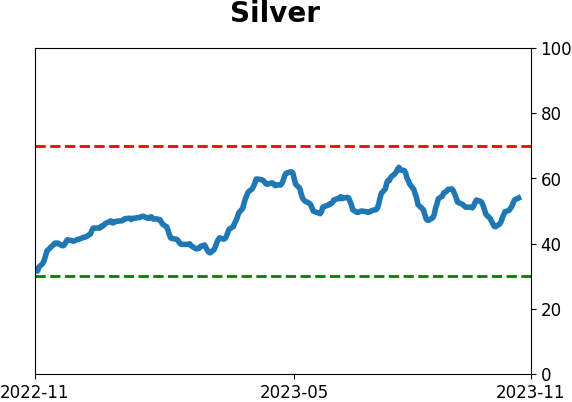
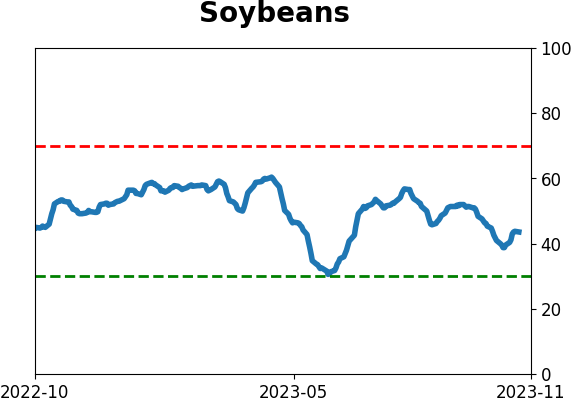
Optimism Index Thumbnails
|
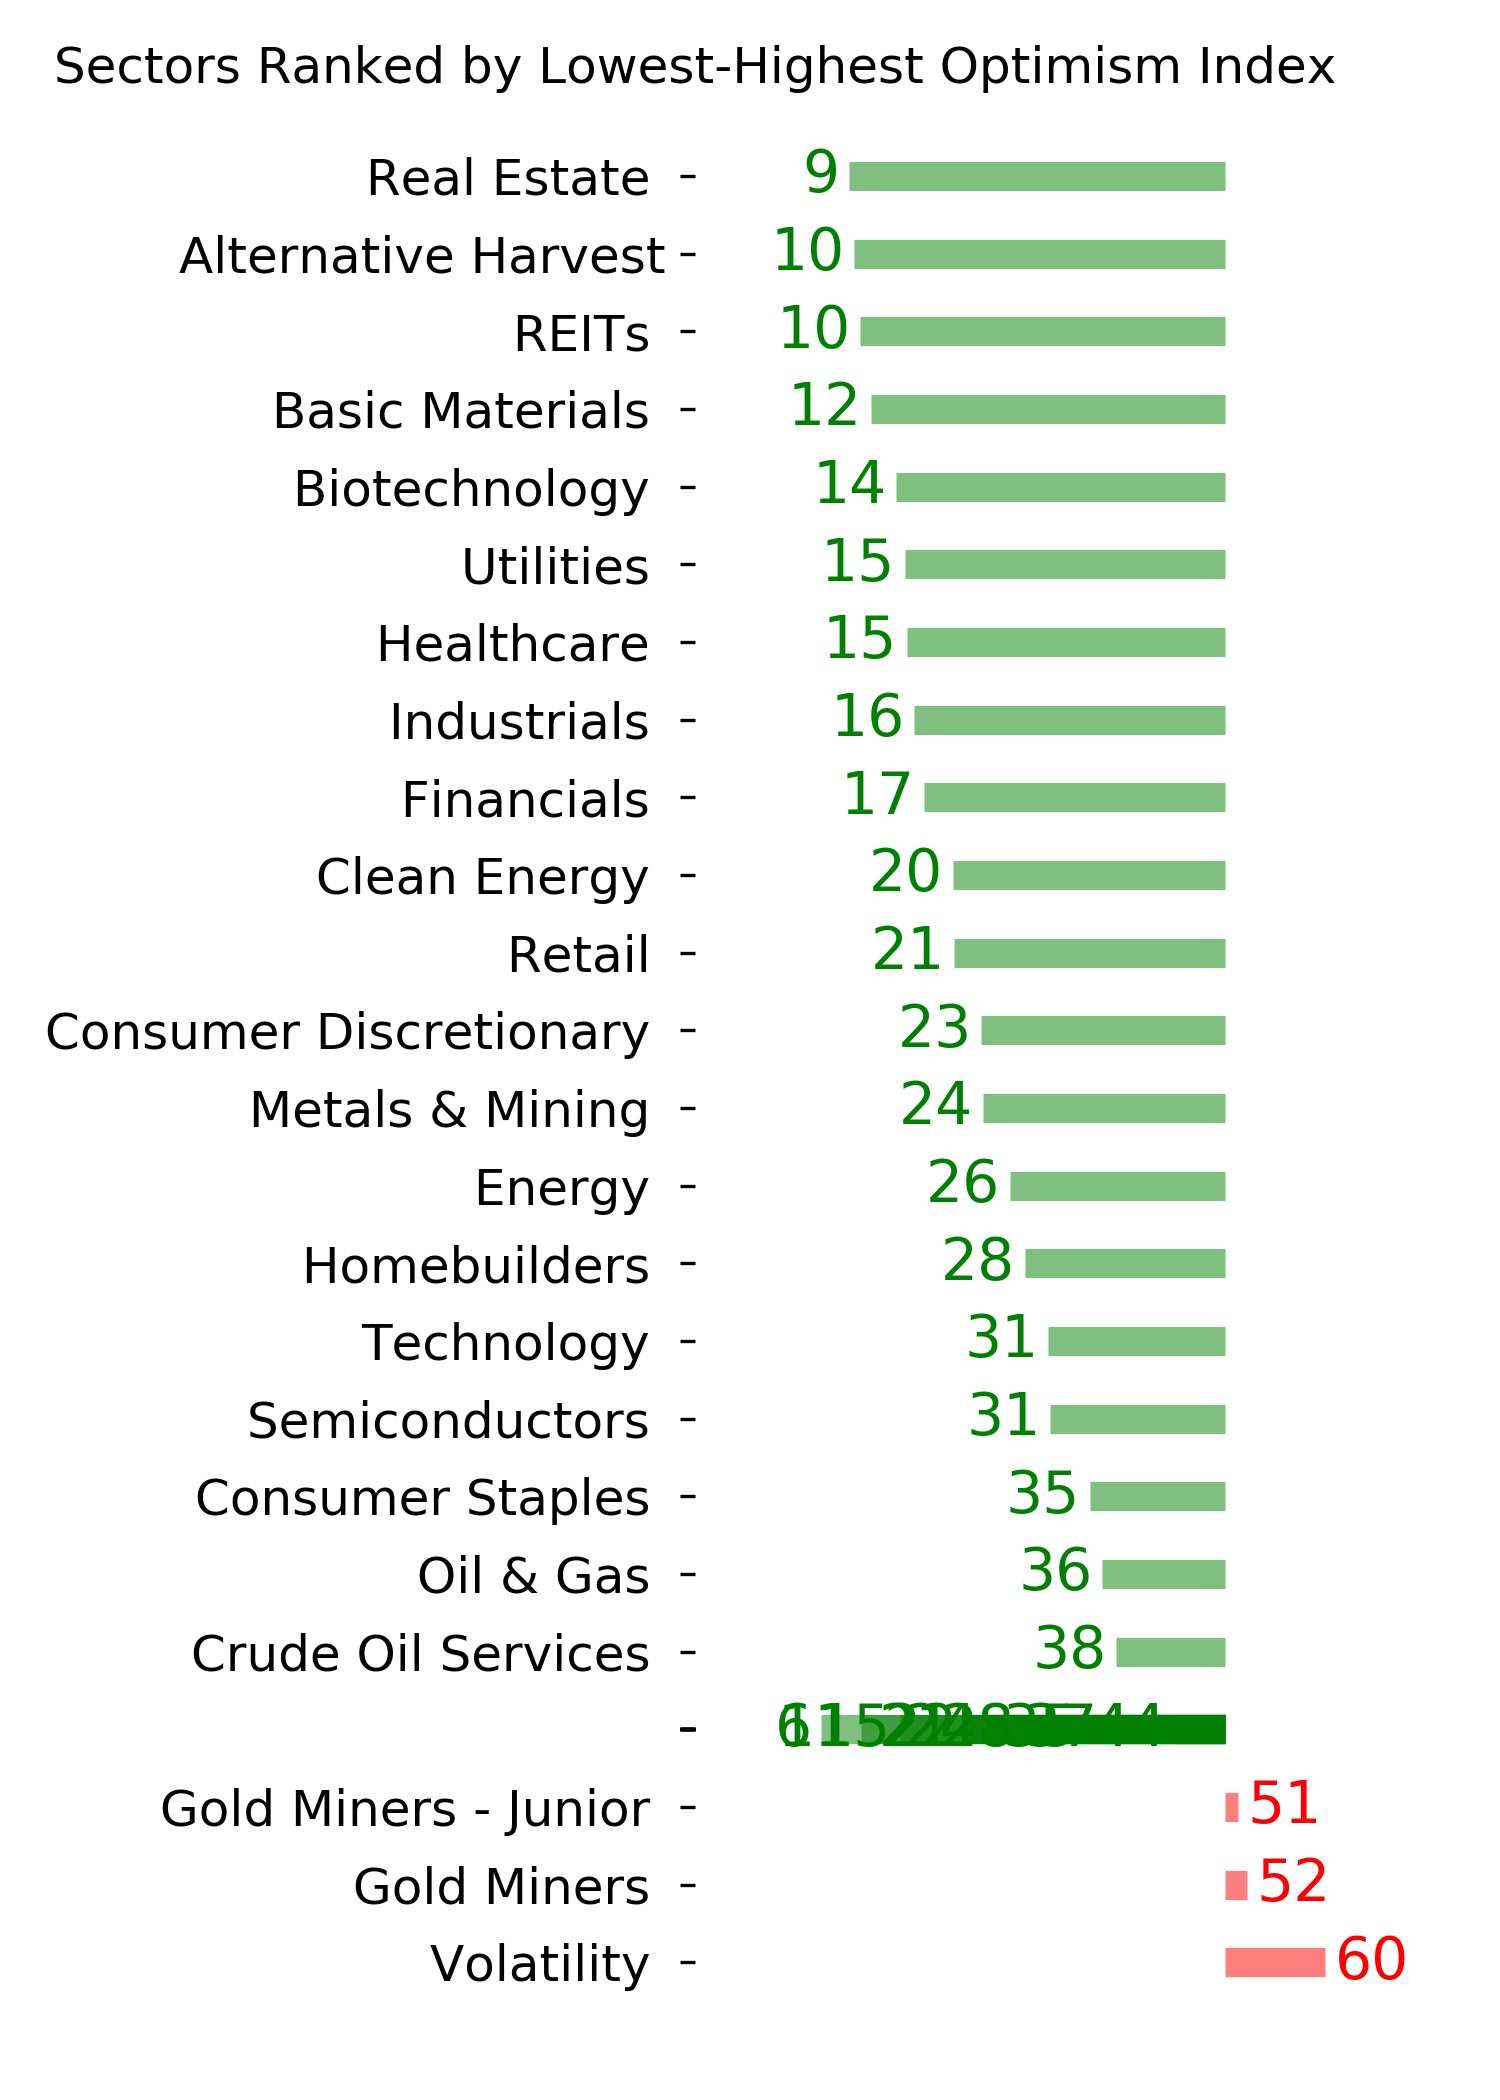
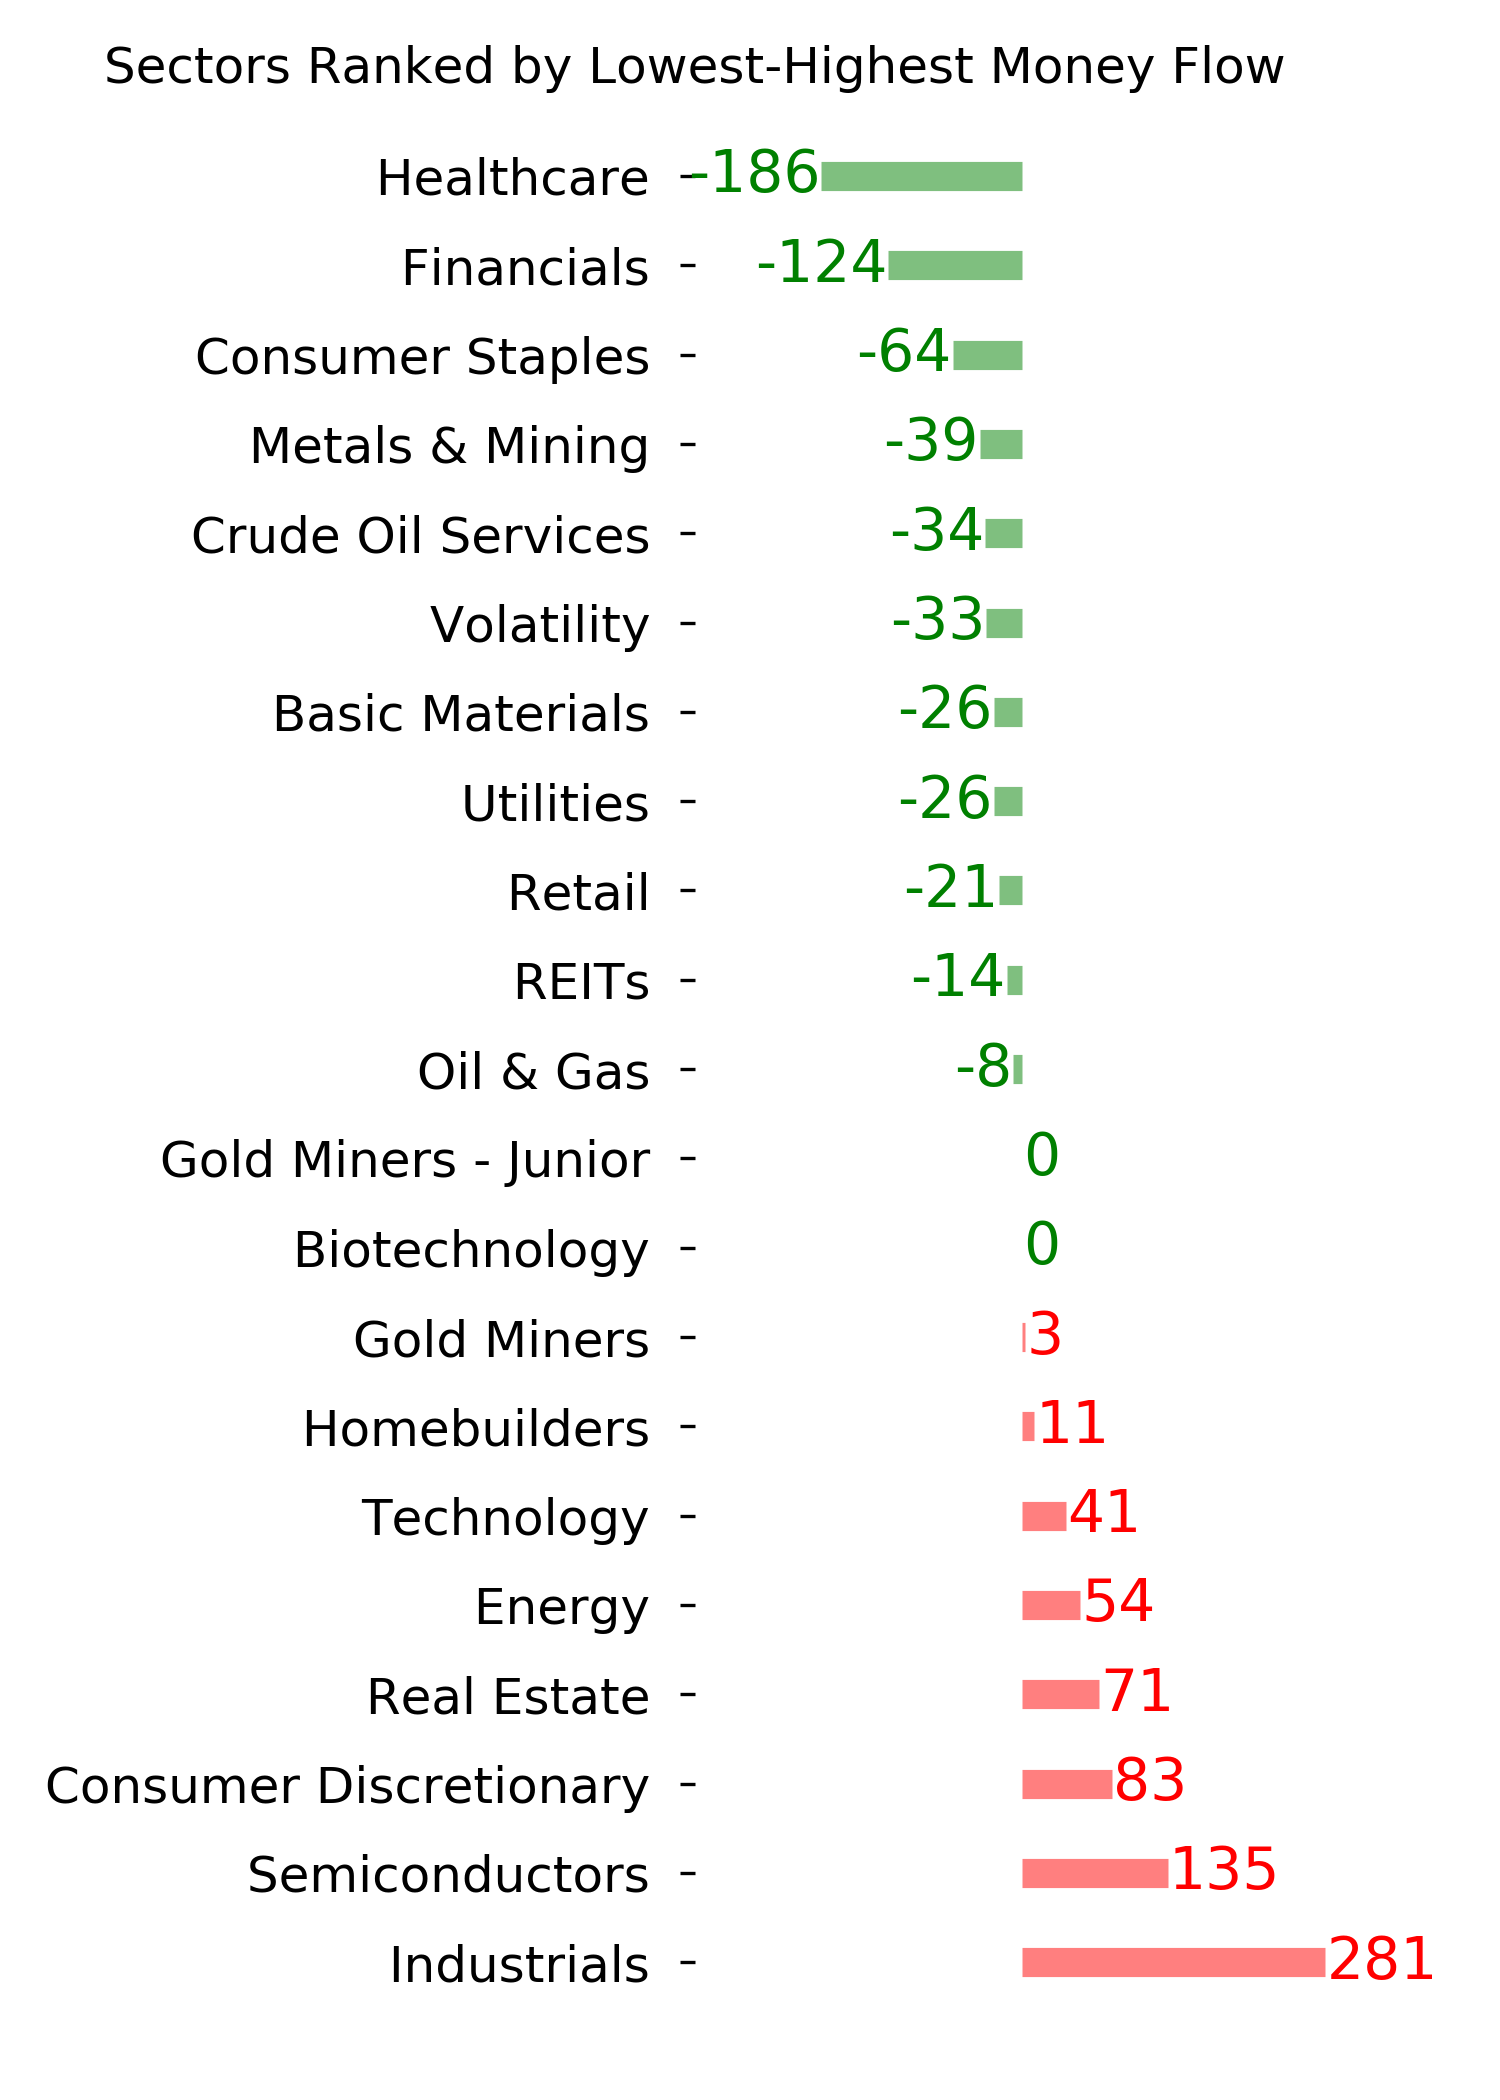
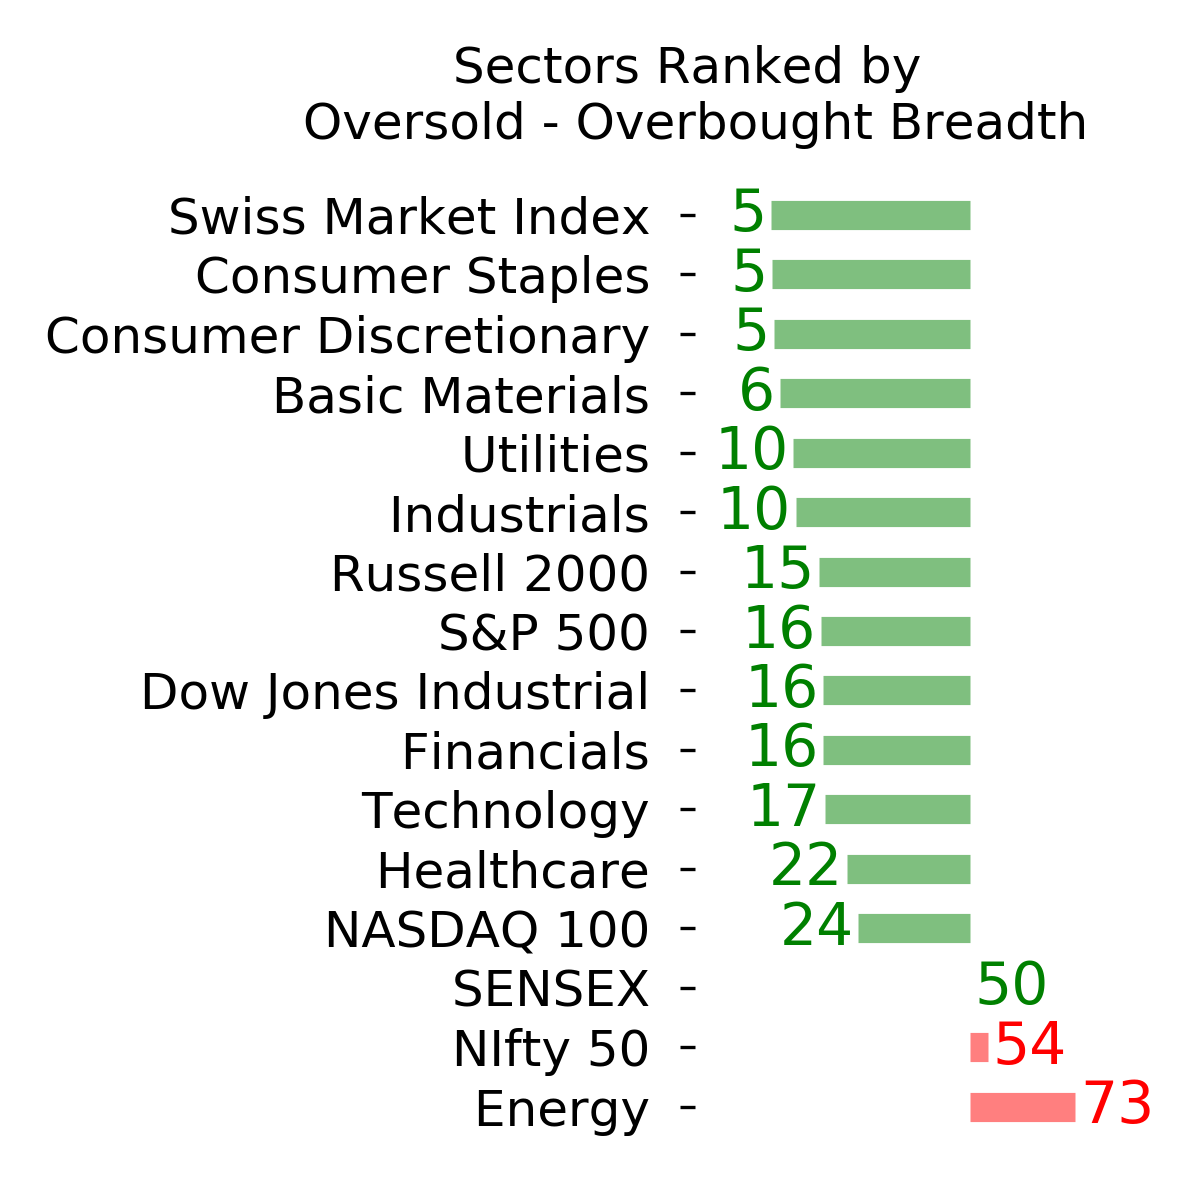
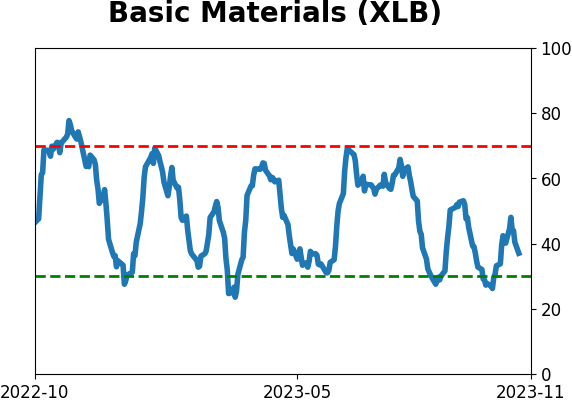
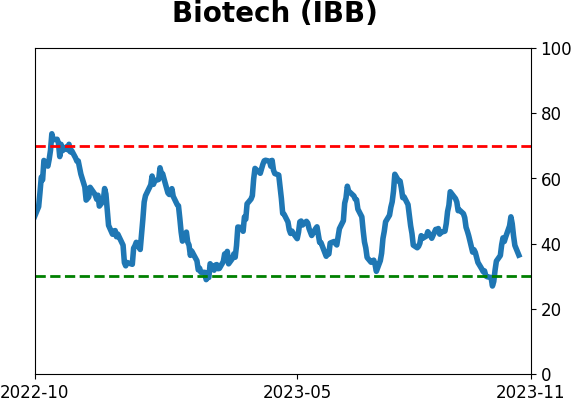
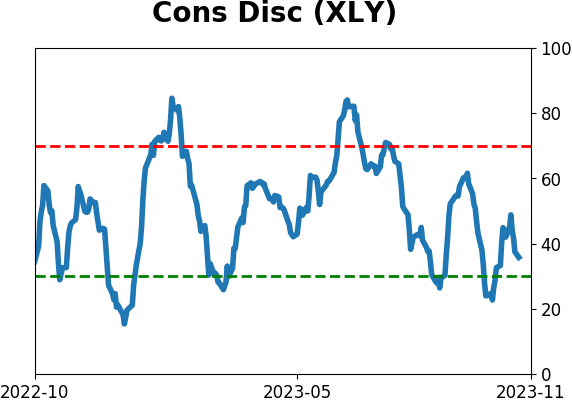
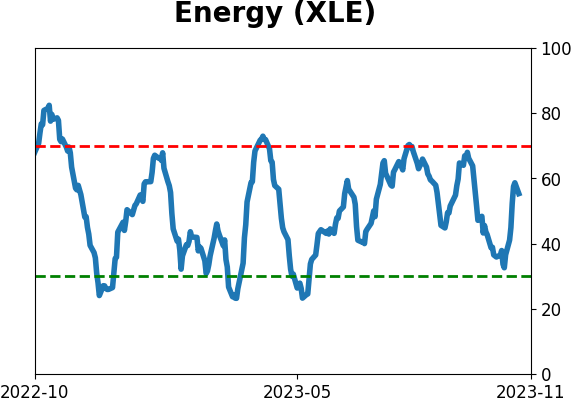
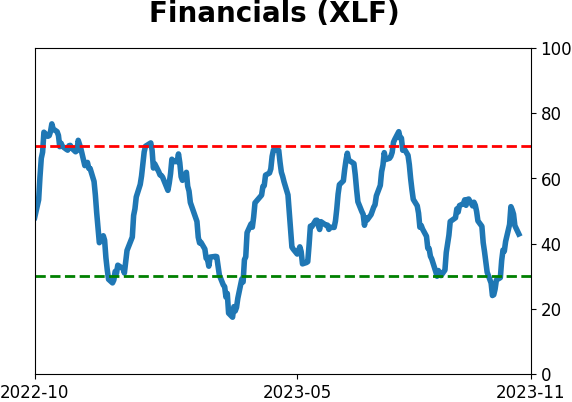
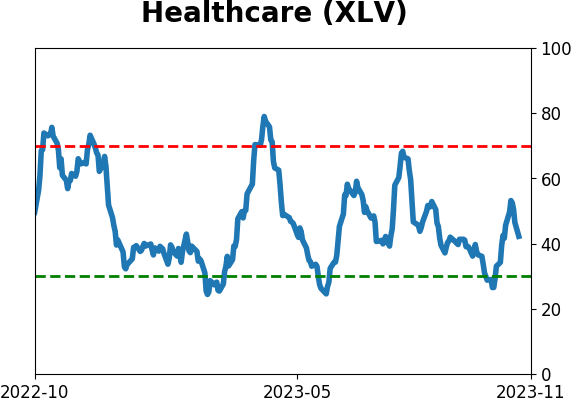
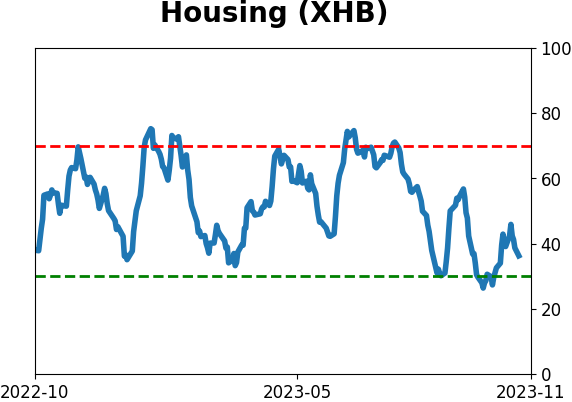
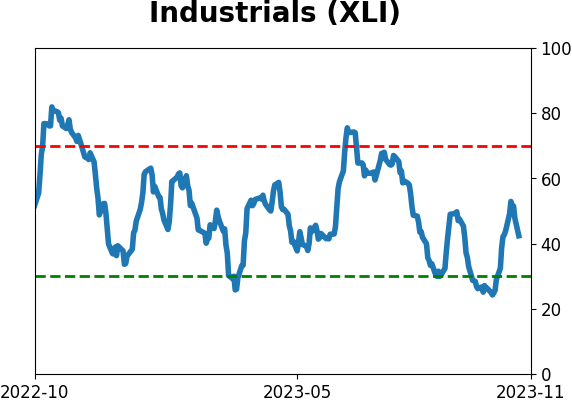
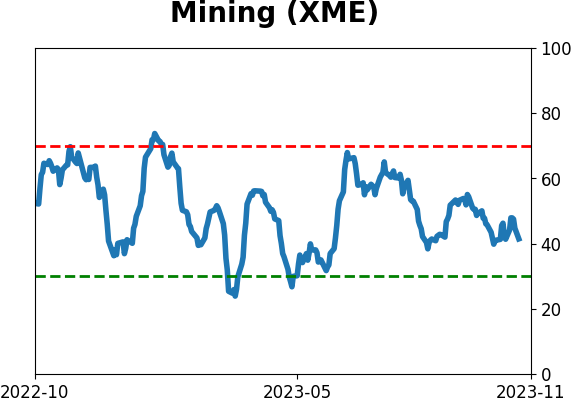
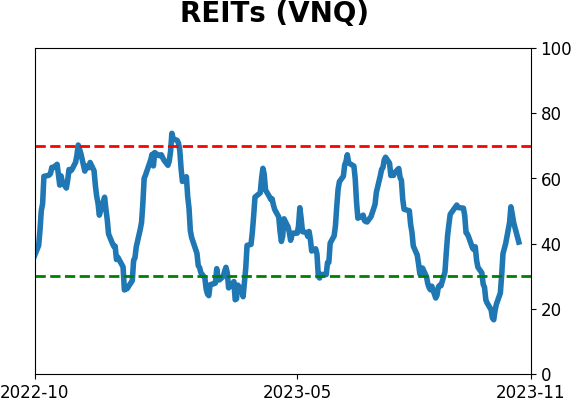
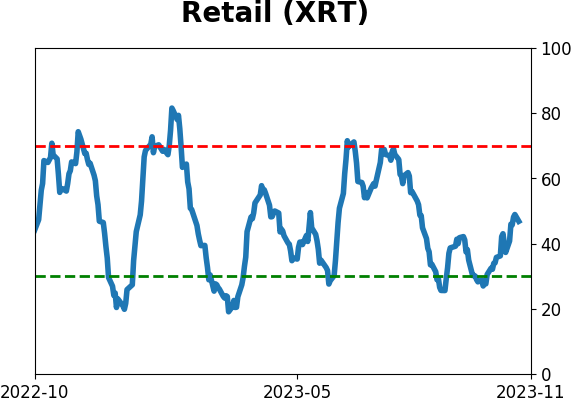
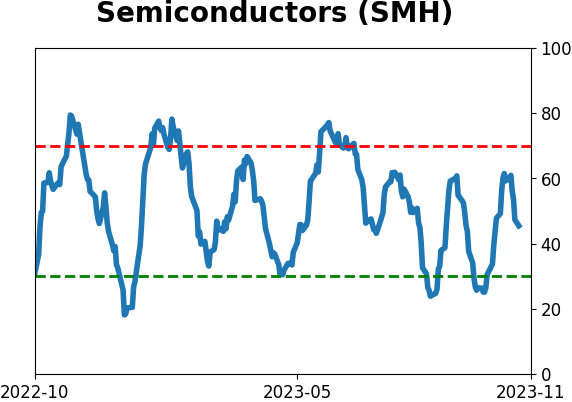
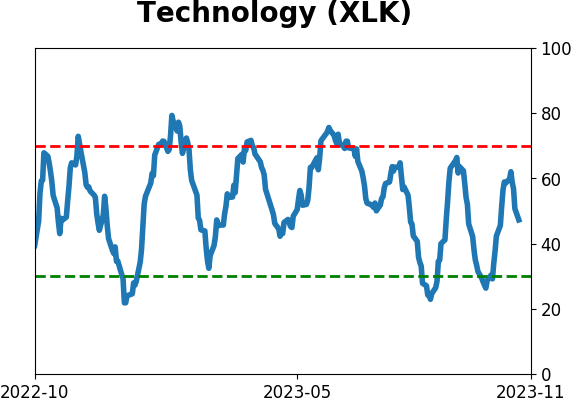
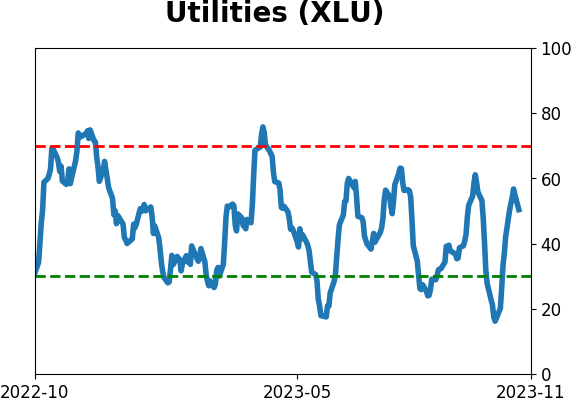
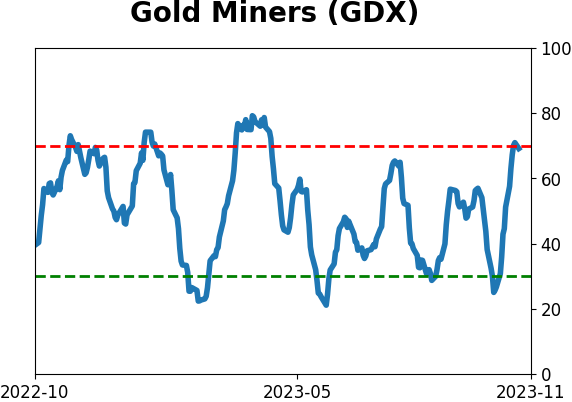
Sector ETF's - 10-Day Moving Average
|
|
|
Country ETF's - 10-Day Moving Average
|
|
|
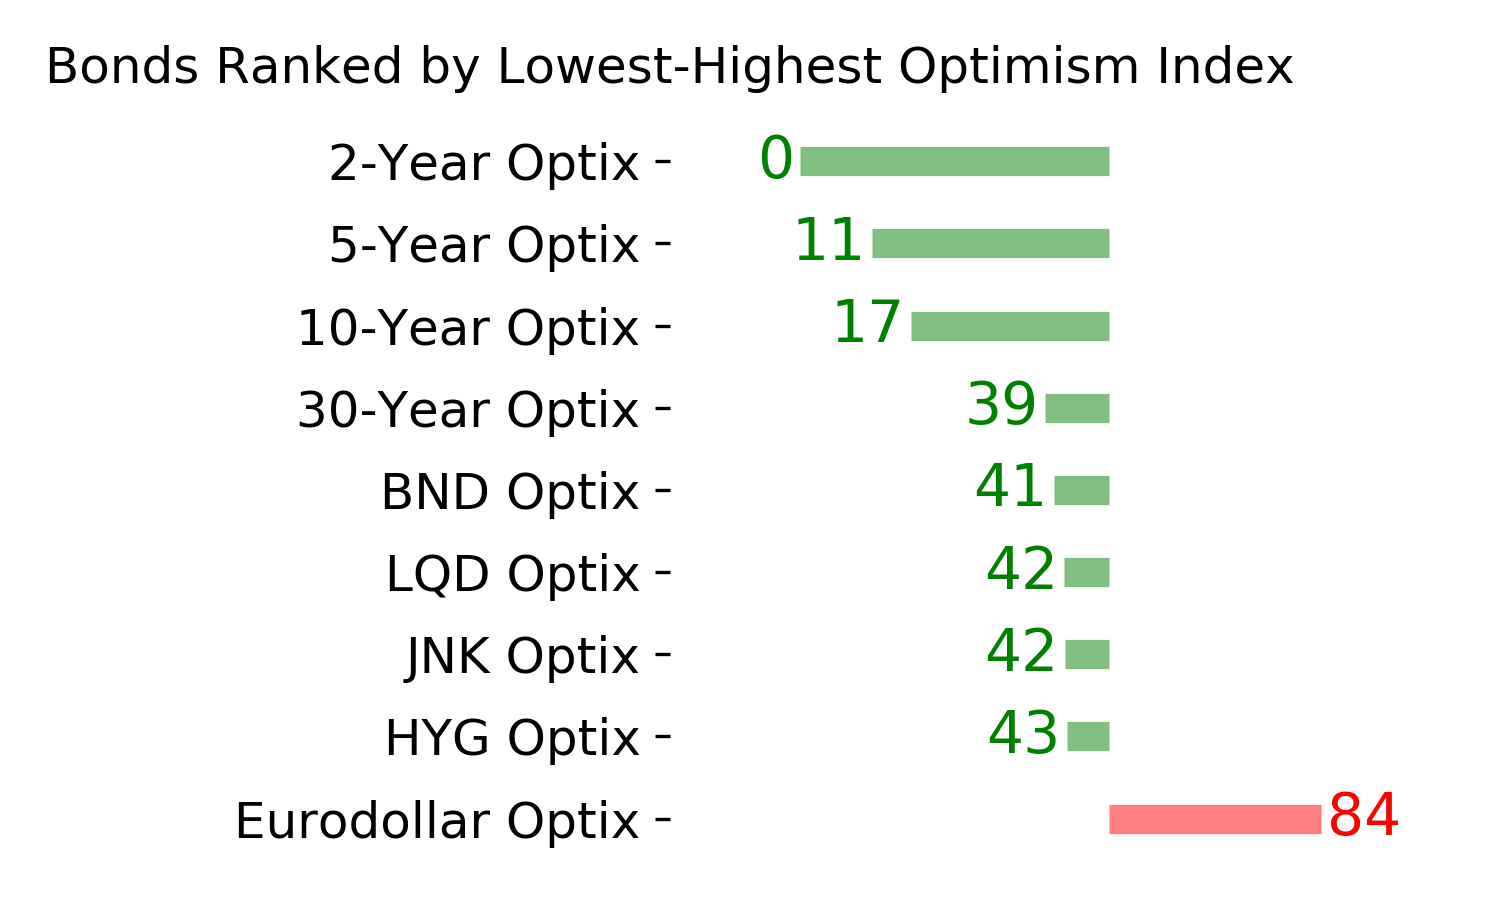
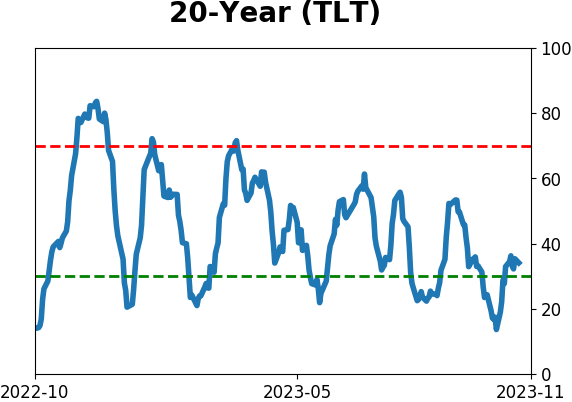
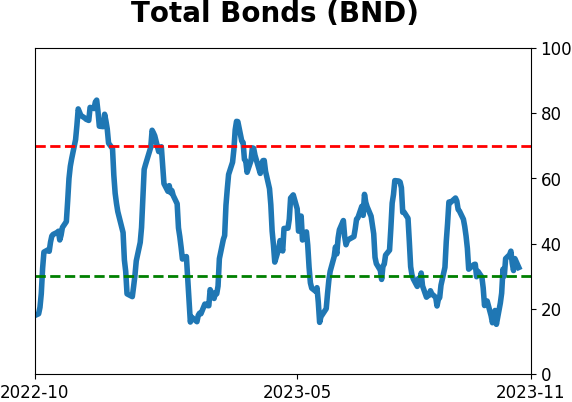
Bond ETF's - 10-Day Moving Average
|
|
|
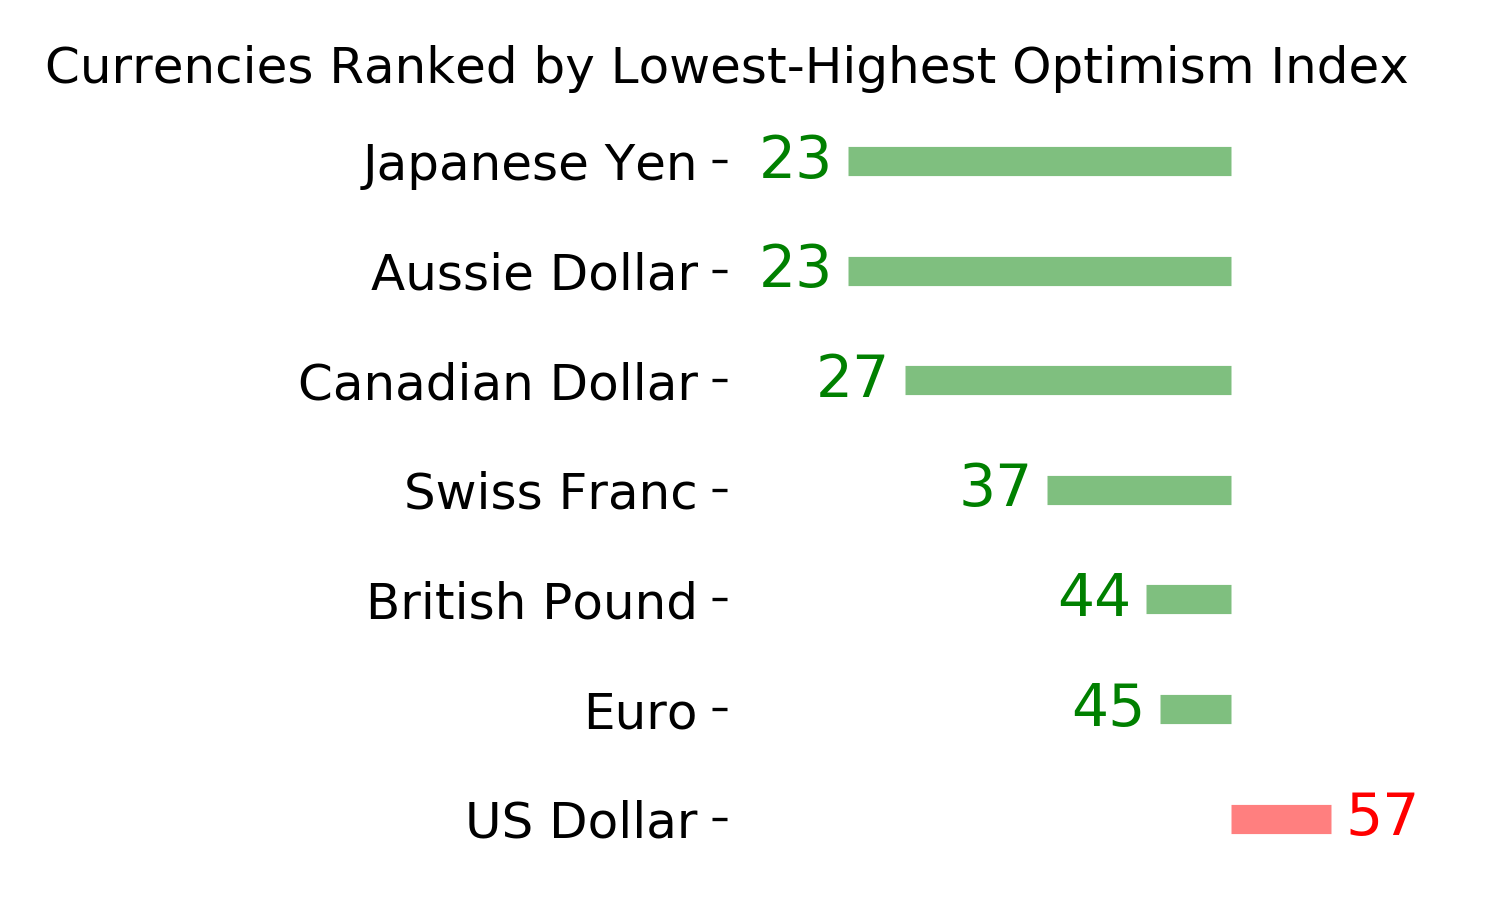
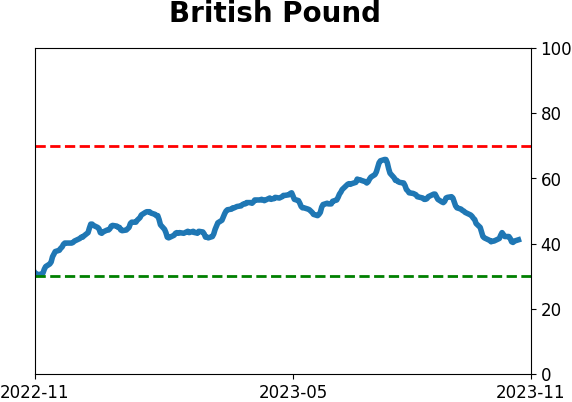
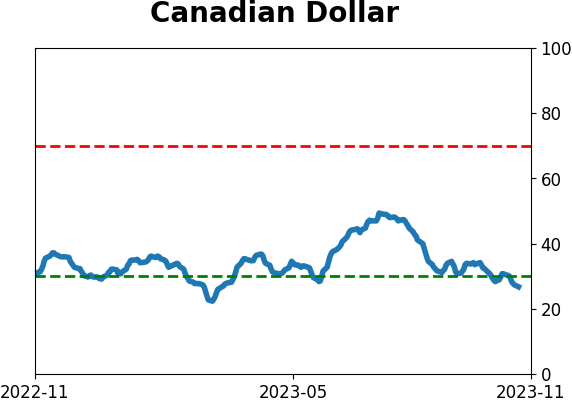
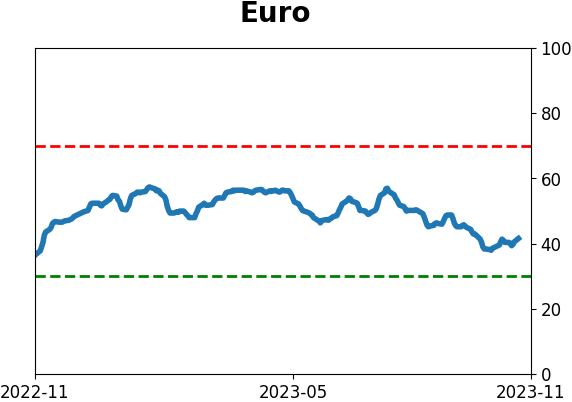
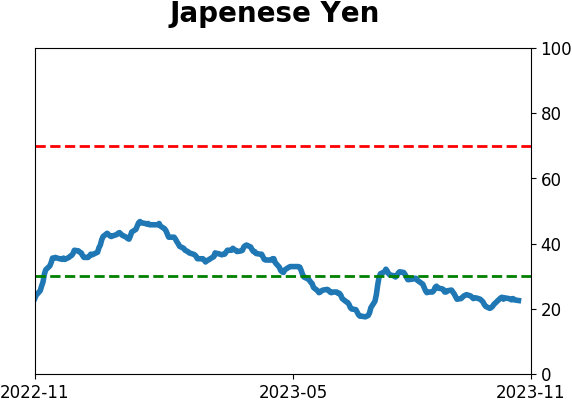
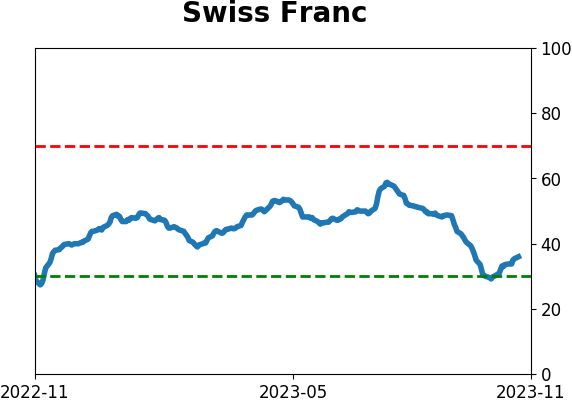
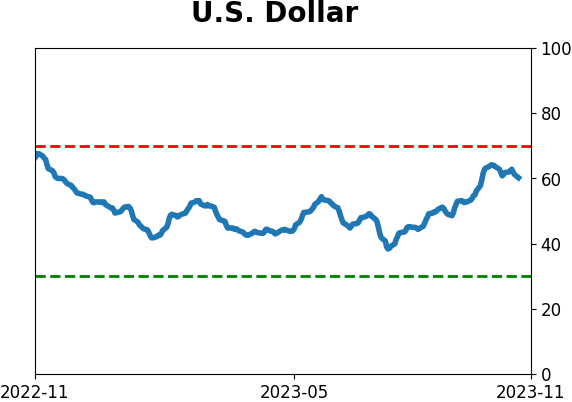
Currency ETF's - 5-Day Moving Average
|
|
|
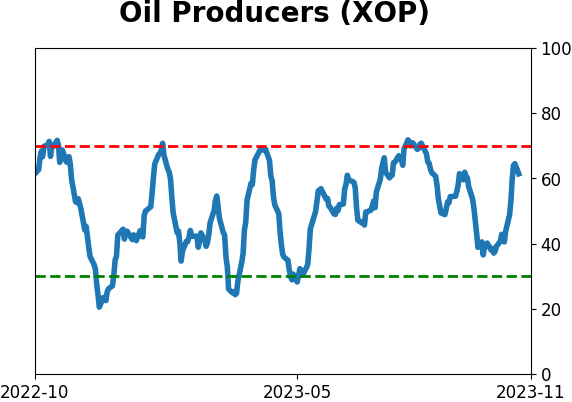
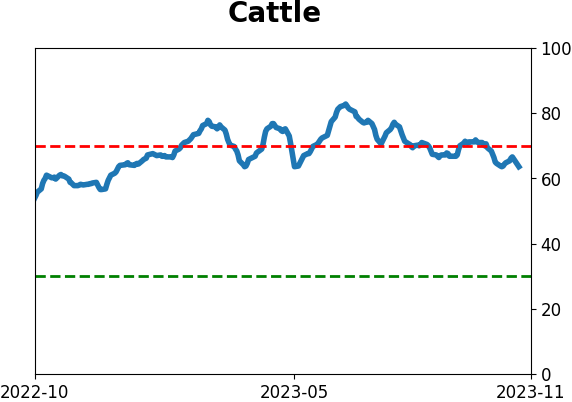
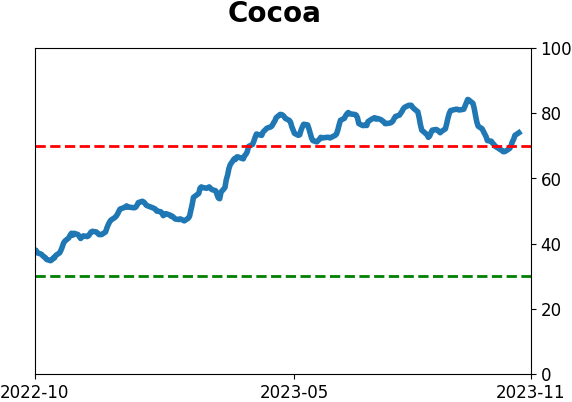
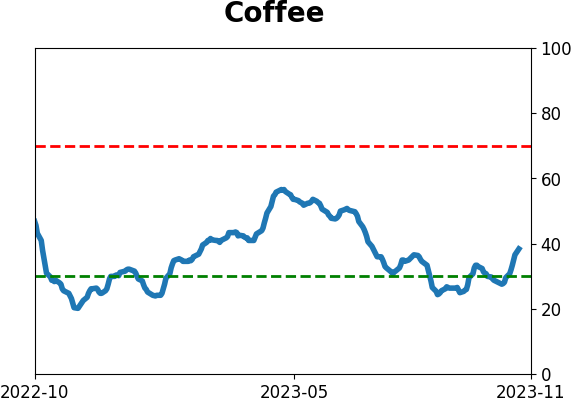
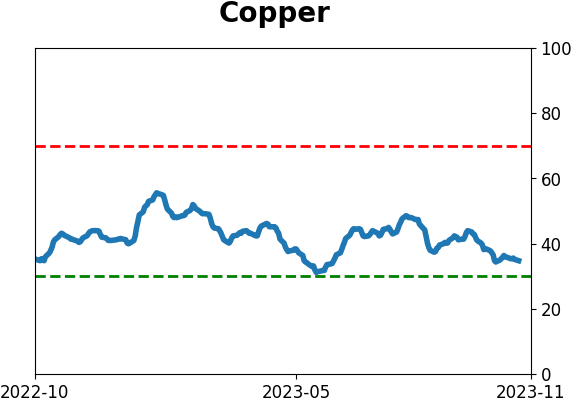
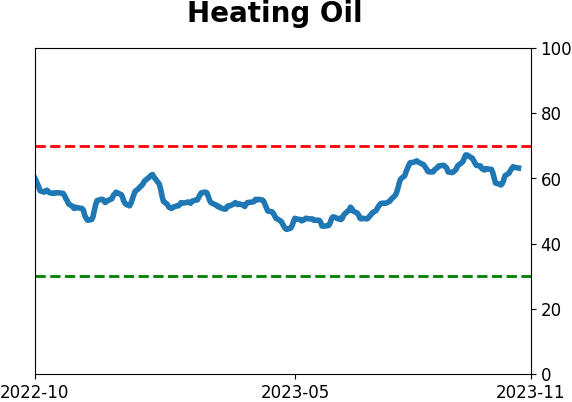
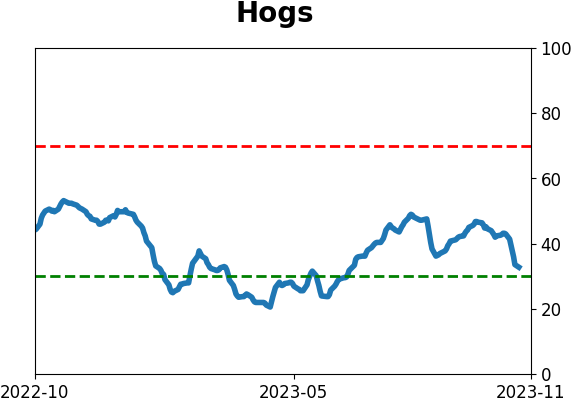
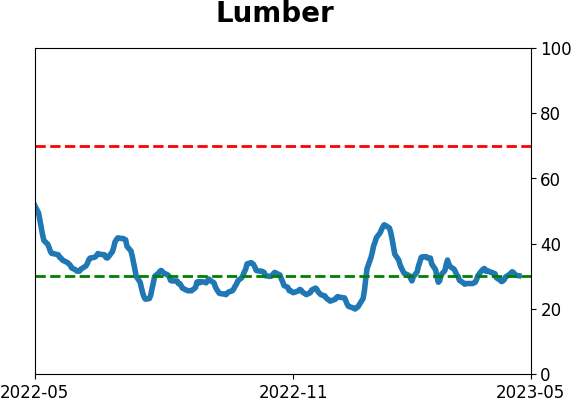
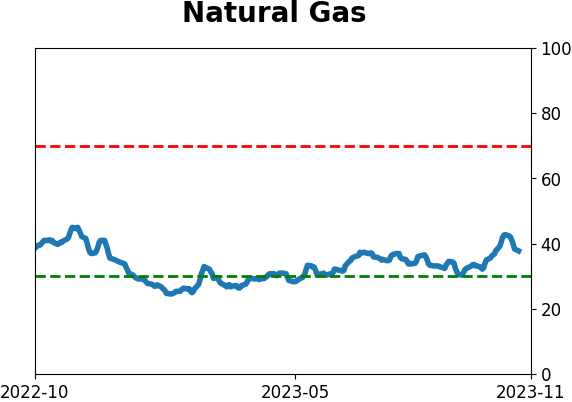
Commodity ETF's - 5-Day Moving Average
|
|