Headlines
|
|
The incessant rise in the dollar versus small-cap stocks:
The U.S. dollar is showing one of its best-ever one-year returns. That is supposed to benefit small-cap stocks relative to large-cap stocks, and there is some evidence to support the claim.
|
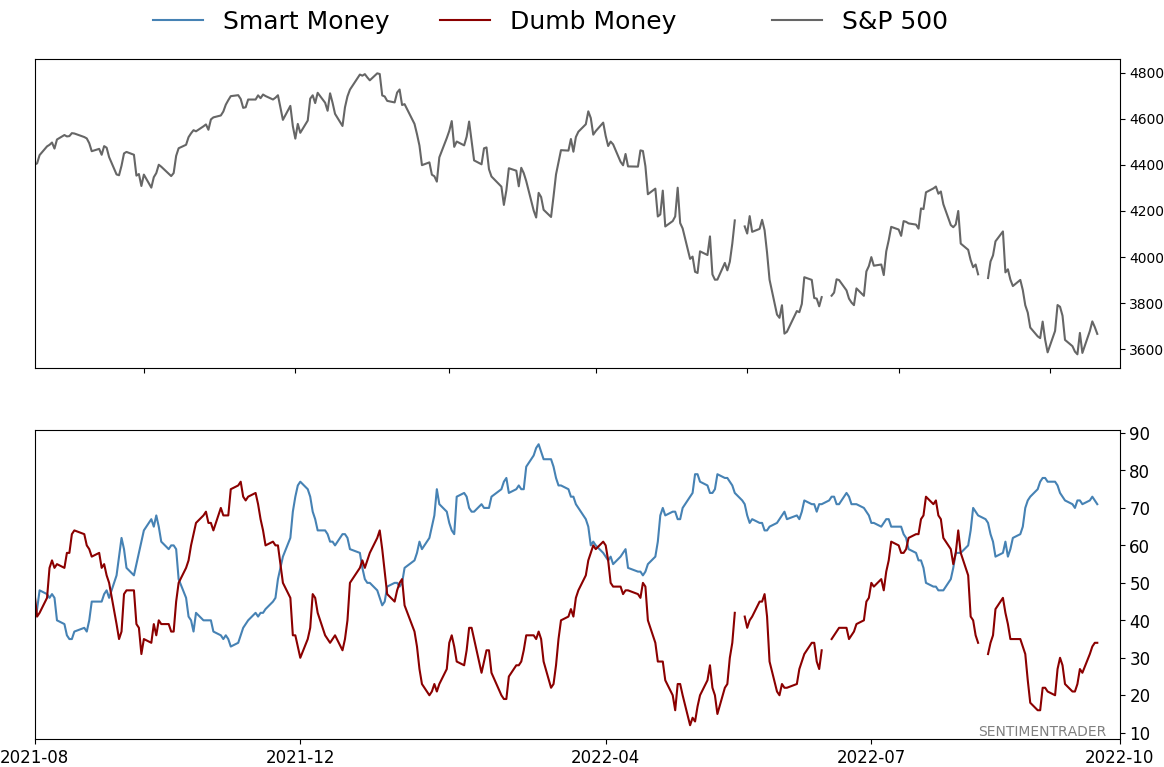
Smart / Dumb Money Confidence
|
Smart Money Confidence: 71%
Dumb Money Confidence: 34%
|
|
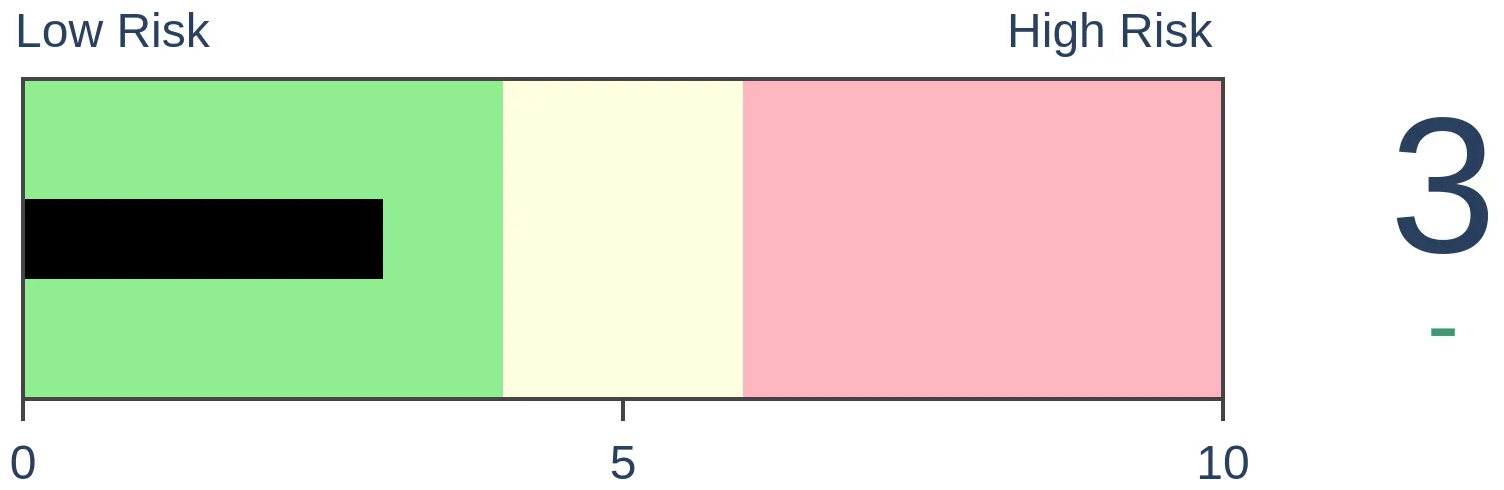
Risk Levels
Stocks Short-Term

|
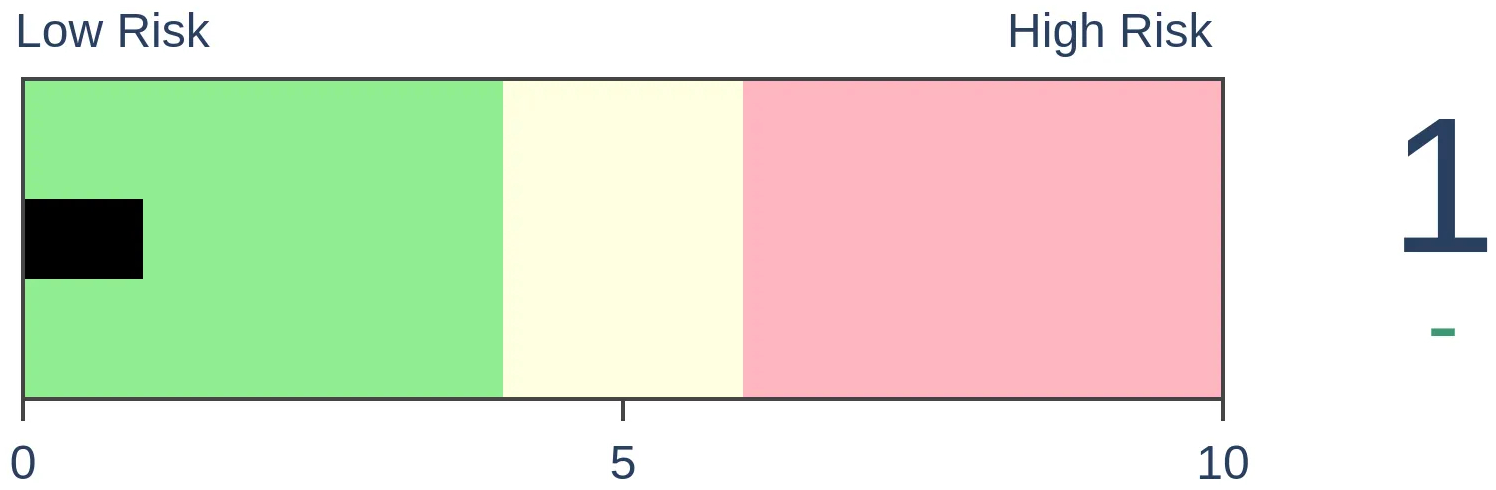
Stocks Medium-Term
|
|
Bonds
|
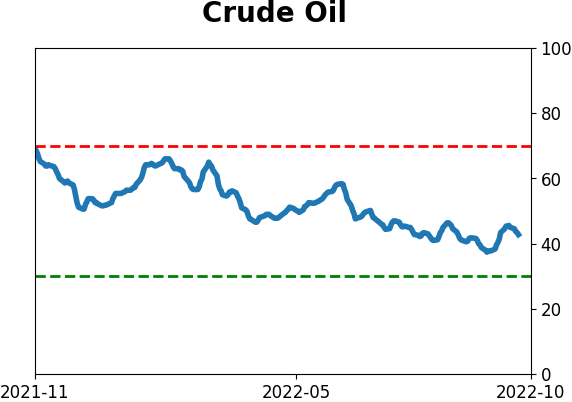
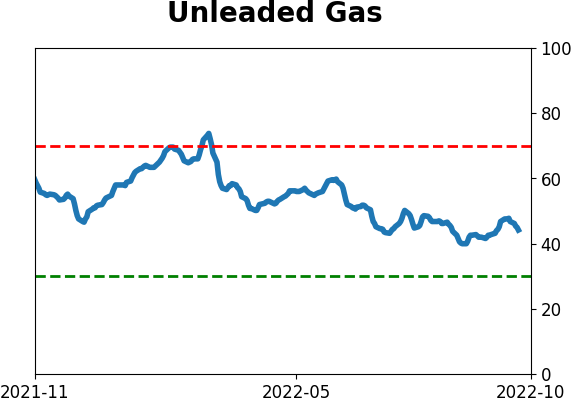
Crude Oil

|
|
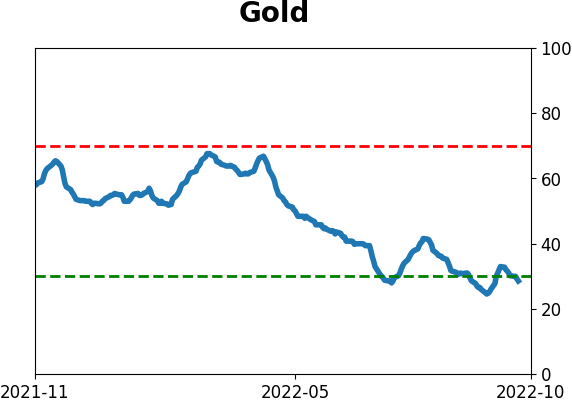
Gold
|
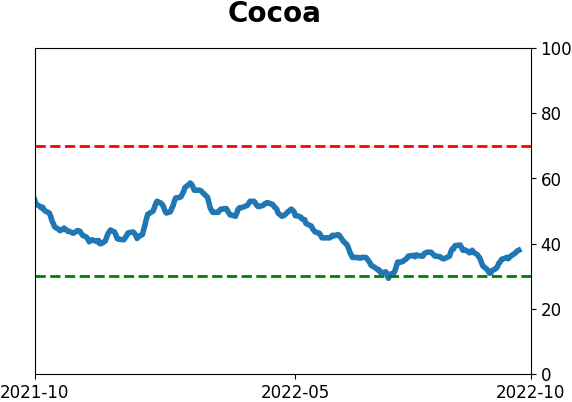
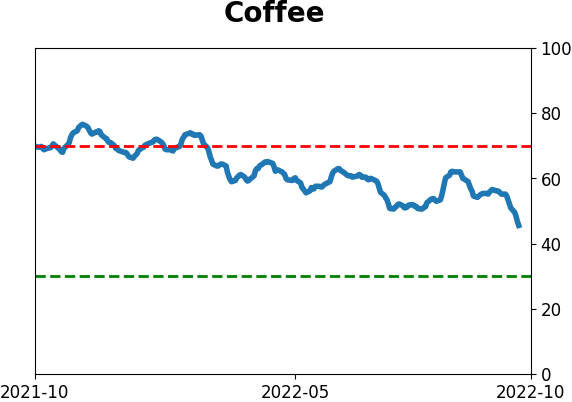
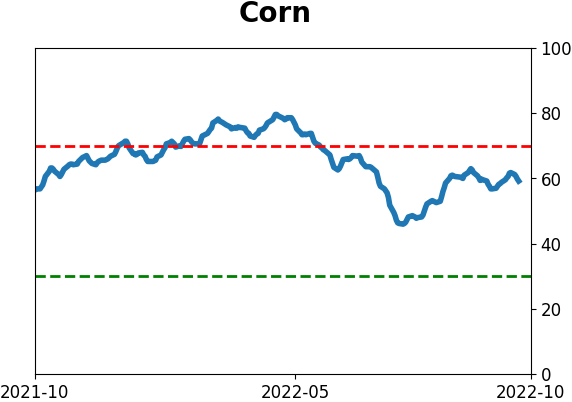
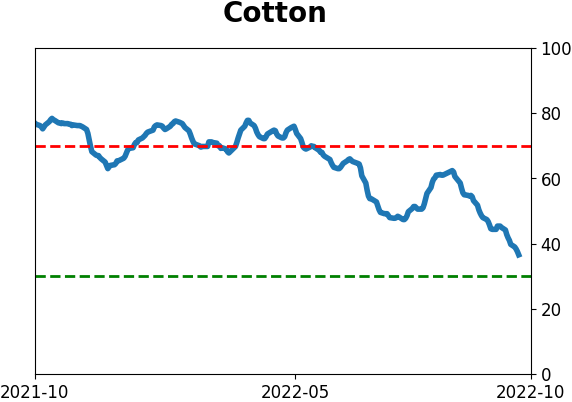
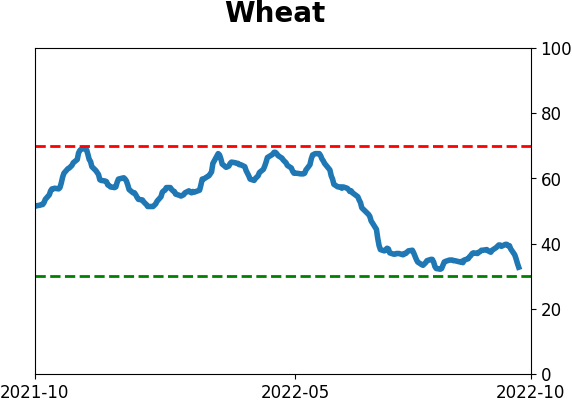
Agriculture
|
|
Research
By Jason Goepfert
BOTTOM LINE
The U.S. dollar is showing one of its best-ever one-year returns. That is supposed to benefit small-cap stocks relative to large-cap stocks, and there is some evidence to support the claim.
FORECAST / TIMEFRAME
None
|
Key points:
- The dollar is showing one of its largest trailing one-year returns on record
- Small-cap stocks have been hit, and the correlation between the two is nearing a record low
- There is some evidence that sharp rises in the dollar benefit small-cap over large-cap stocks going forward
The dollar has been on a tear, and it may benefit smaller stocks
More and more magazines are highlighting the "unstoppable" nature of the dollar. Opinions vary on the implications, but there is one group that most agree would stand to benefit. The Wall Street Journal noted:
Investors are increasingly turning to U.S.-centric, small-cap stocks as the dollar's staggering climb this year looms over the profits of multinational companies. A strong dollar can hurt U.S. companies that sell goods overseas by making those products less affordable.
Smaller companies are more insulated from adverse foreign-exchange effects because they derive more of their business stateside. Companies in the S&P 600 generate just 20% of their revenue outside the U.S., compared with S&P 500 constituents that make 40% of sales abroad, according to FactSet.
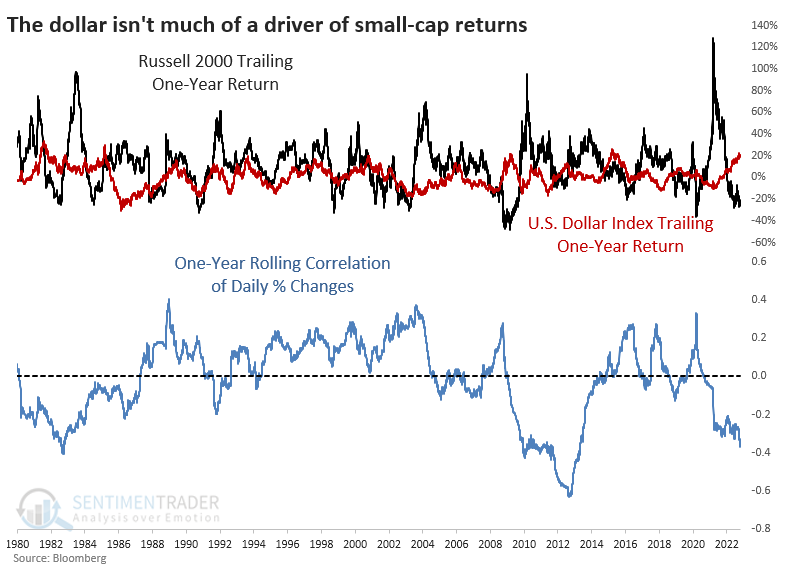
The one-year rolling return in the small-cap Russell 2000 index has turned decidedly negative, despite one of the most significant one-year gains in the dollar, so the quotes above are perplexing. The one-year rolling correlation of daily percentage changes between the Russell 2000 and the U.S. Dollar Index is at its 3rd most negative level in history.
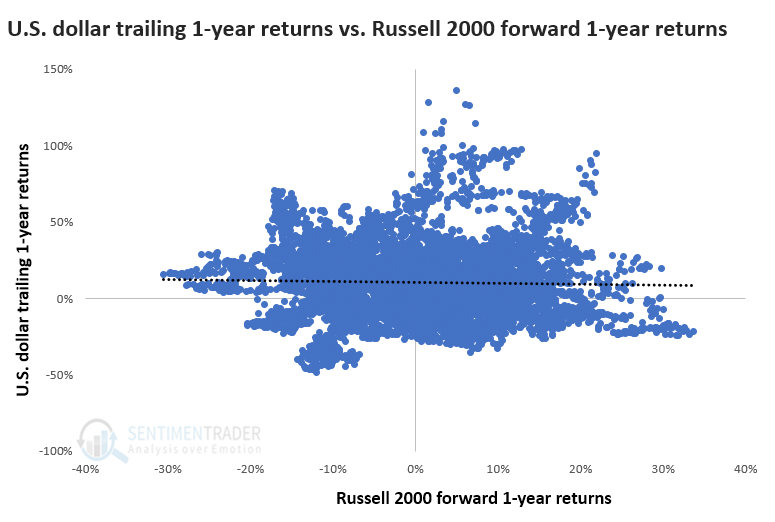
We're not as much concerned with past performance as future performance. The scatter plot of one-return trailing returns in the dollar versus future one-year returns in the Russell 2000 shows no correlation.
The inconsistency hits home if we look at a heat map of returns in the dollar versus small-cap stocks. The chart below shows 20 buckets of one-return returns in the dollar. The current return of more than +20% puts our current situation in the 20th bucket.
The Russell's average returns from about 20 days through 250 days forward are all red, meaning the lowest (or almost the lowest) out of the 20 buckets. The best returns (most consistent green shading) occurred in the first bucket - the worst one-year trailing returns in the dollar. The Russell also did well when the dollar suffered only modest year-over-year losses, ranking in the 6th through 9th buckets or when it was modestly strong (17th through 19th buckets).
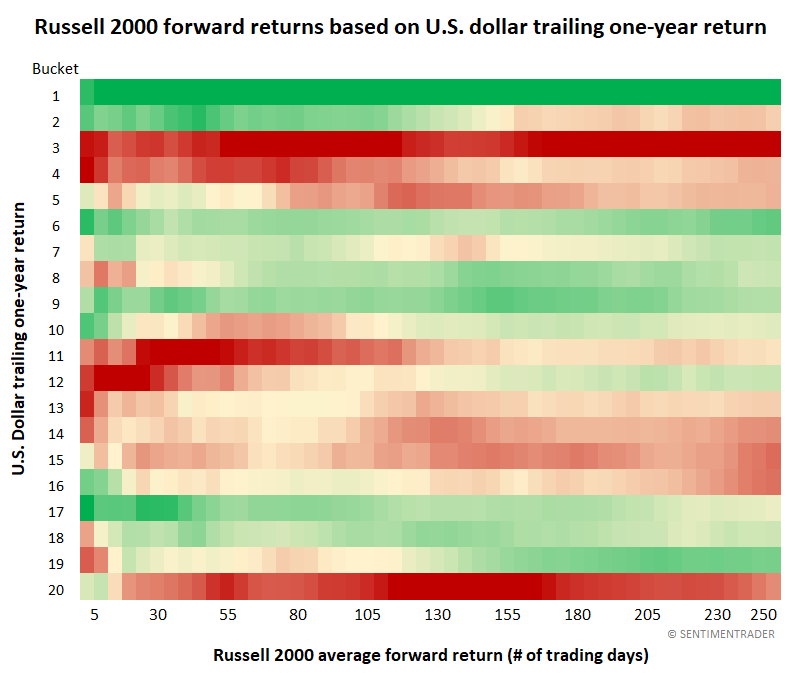
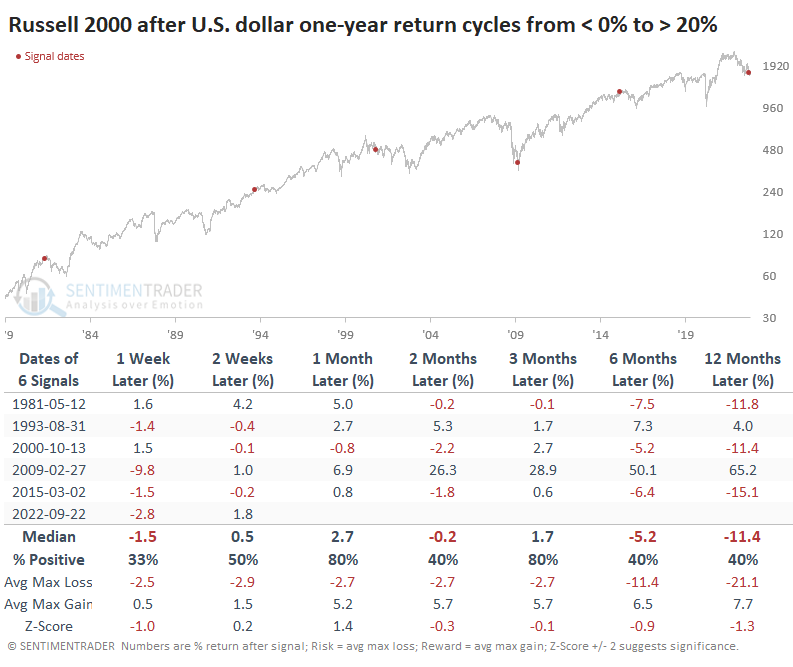
Once the one-year trailing return in the dollar reached 20% (rounded), the Russell 2000 struggled to hold gains going forward. The sample size is tiny, but three signals showed relatively large long-term losses, one a minor gain and one a large gain.
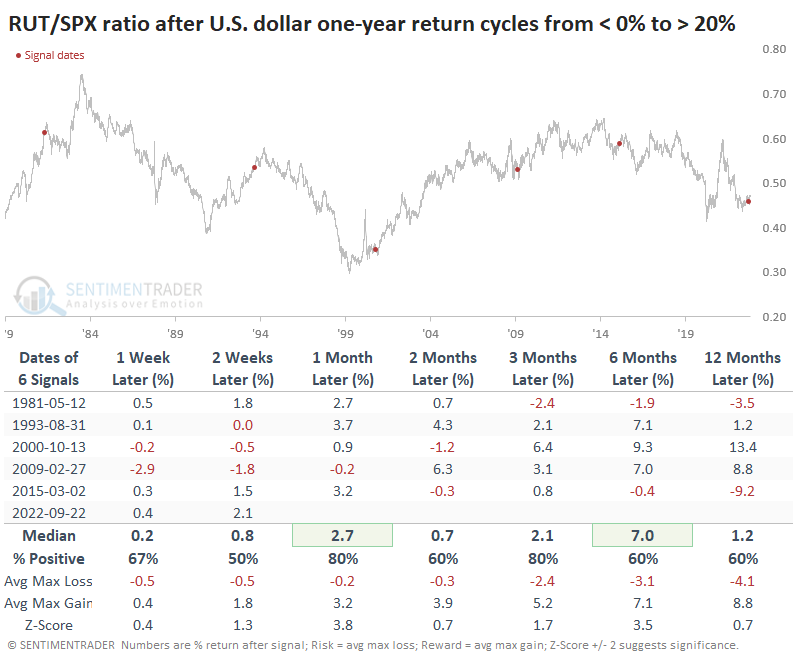
Relative to the S&P 500, small-cap stocks stood out. The Journal article alludes to this, and there is some merit. Across all time frames, the Russell 2000 outperformed the S&P most of the time, including four out of five times one and three months later.
What the research tells us...
It pays to test market cliches, as there is often only a hint of truth to them or not at all. The idea that small-cap stocks will necessarily benefit from a strong dollar is suspect, but there is some decent evidence that they can outperform their large-cap brethren in the months ahead.
Indicators at Extremes
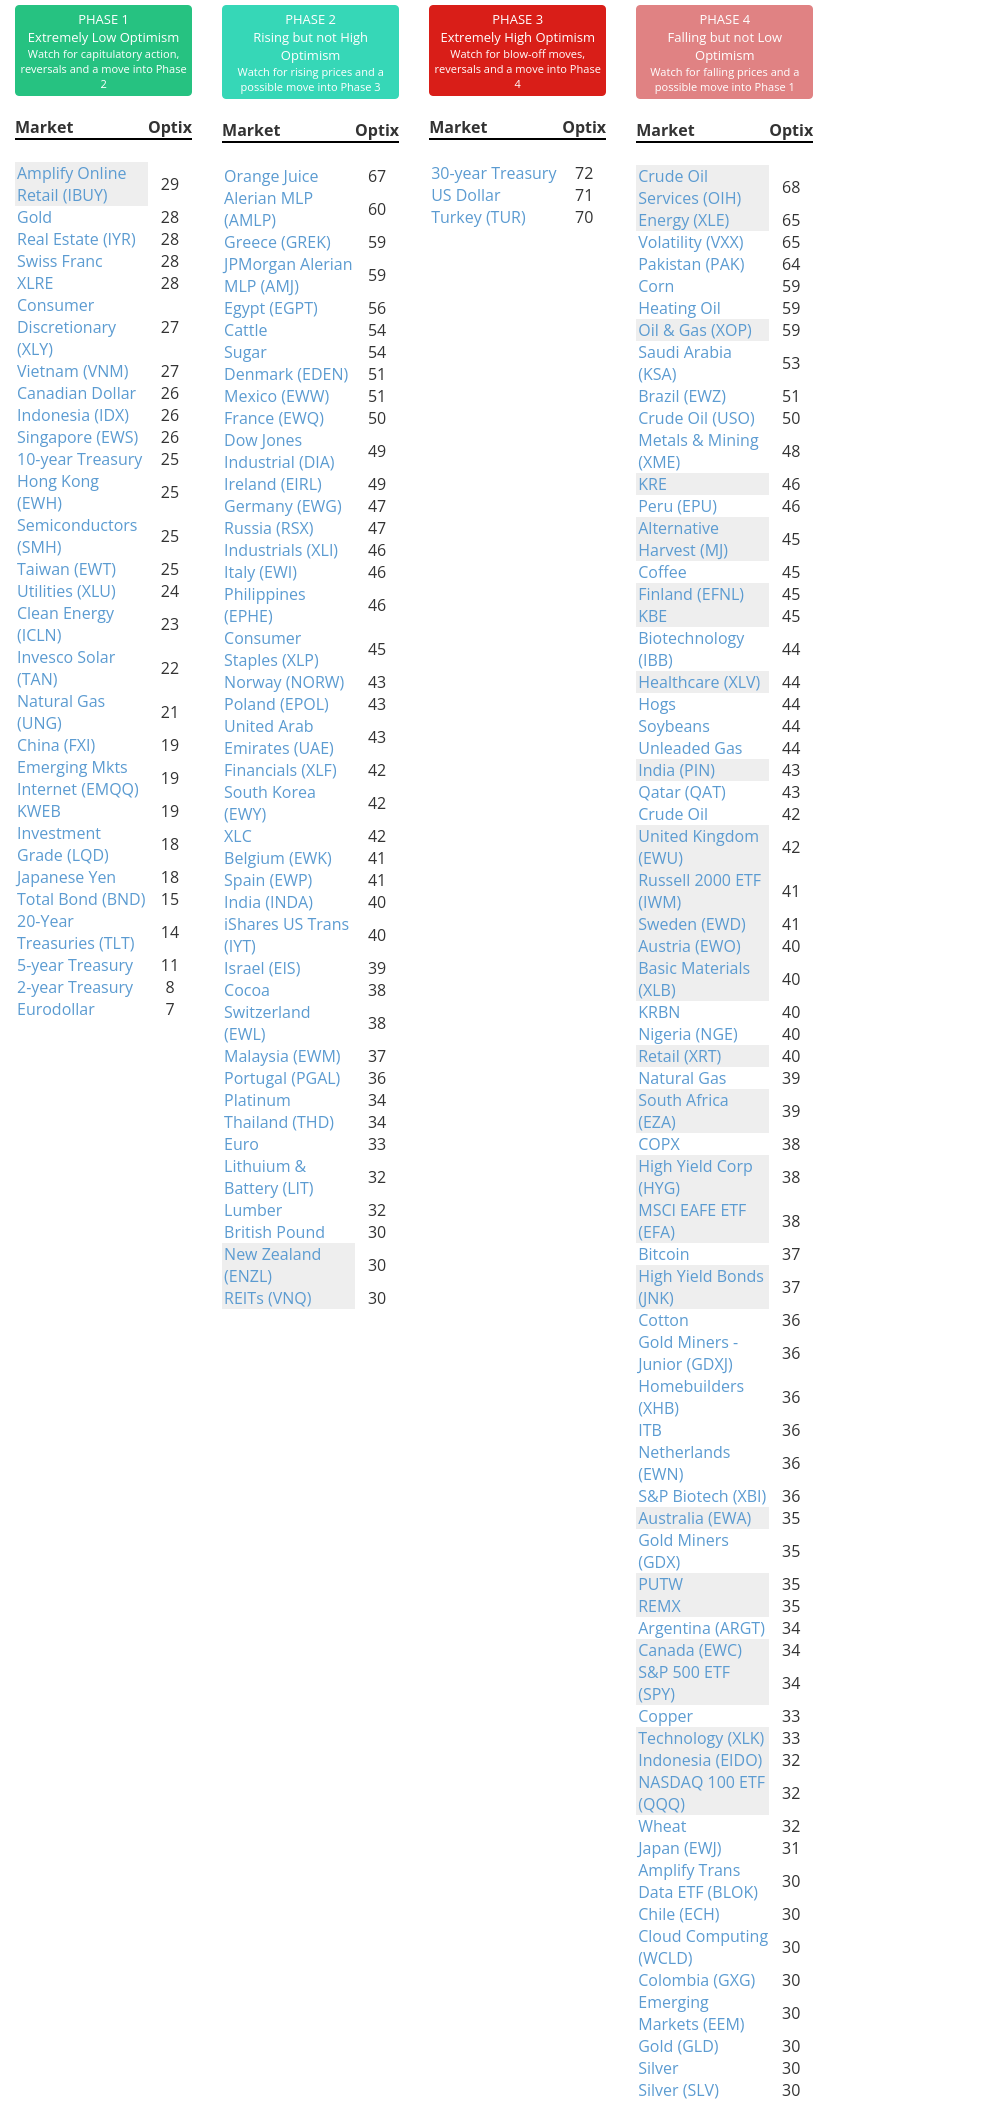
Phase Table
Ranks
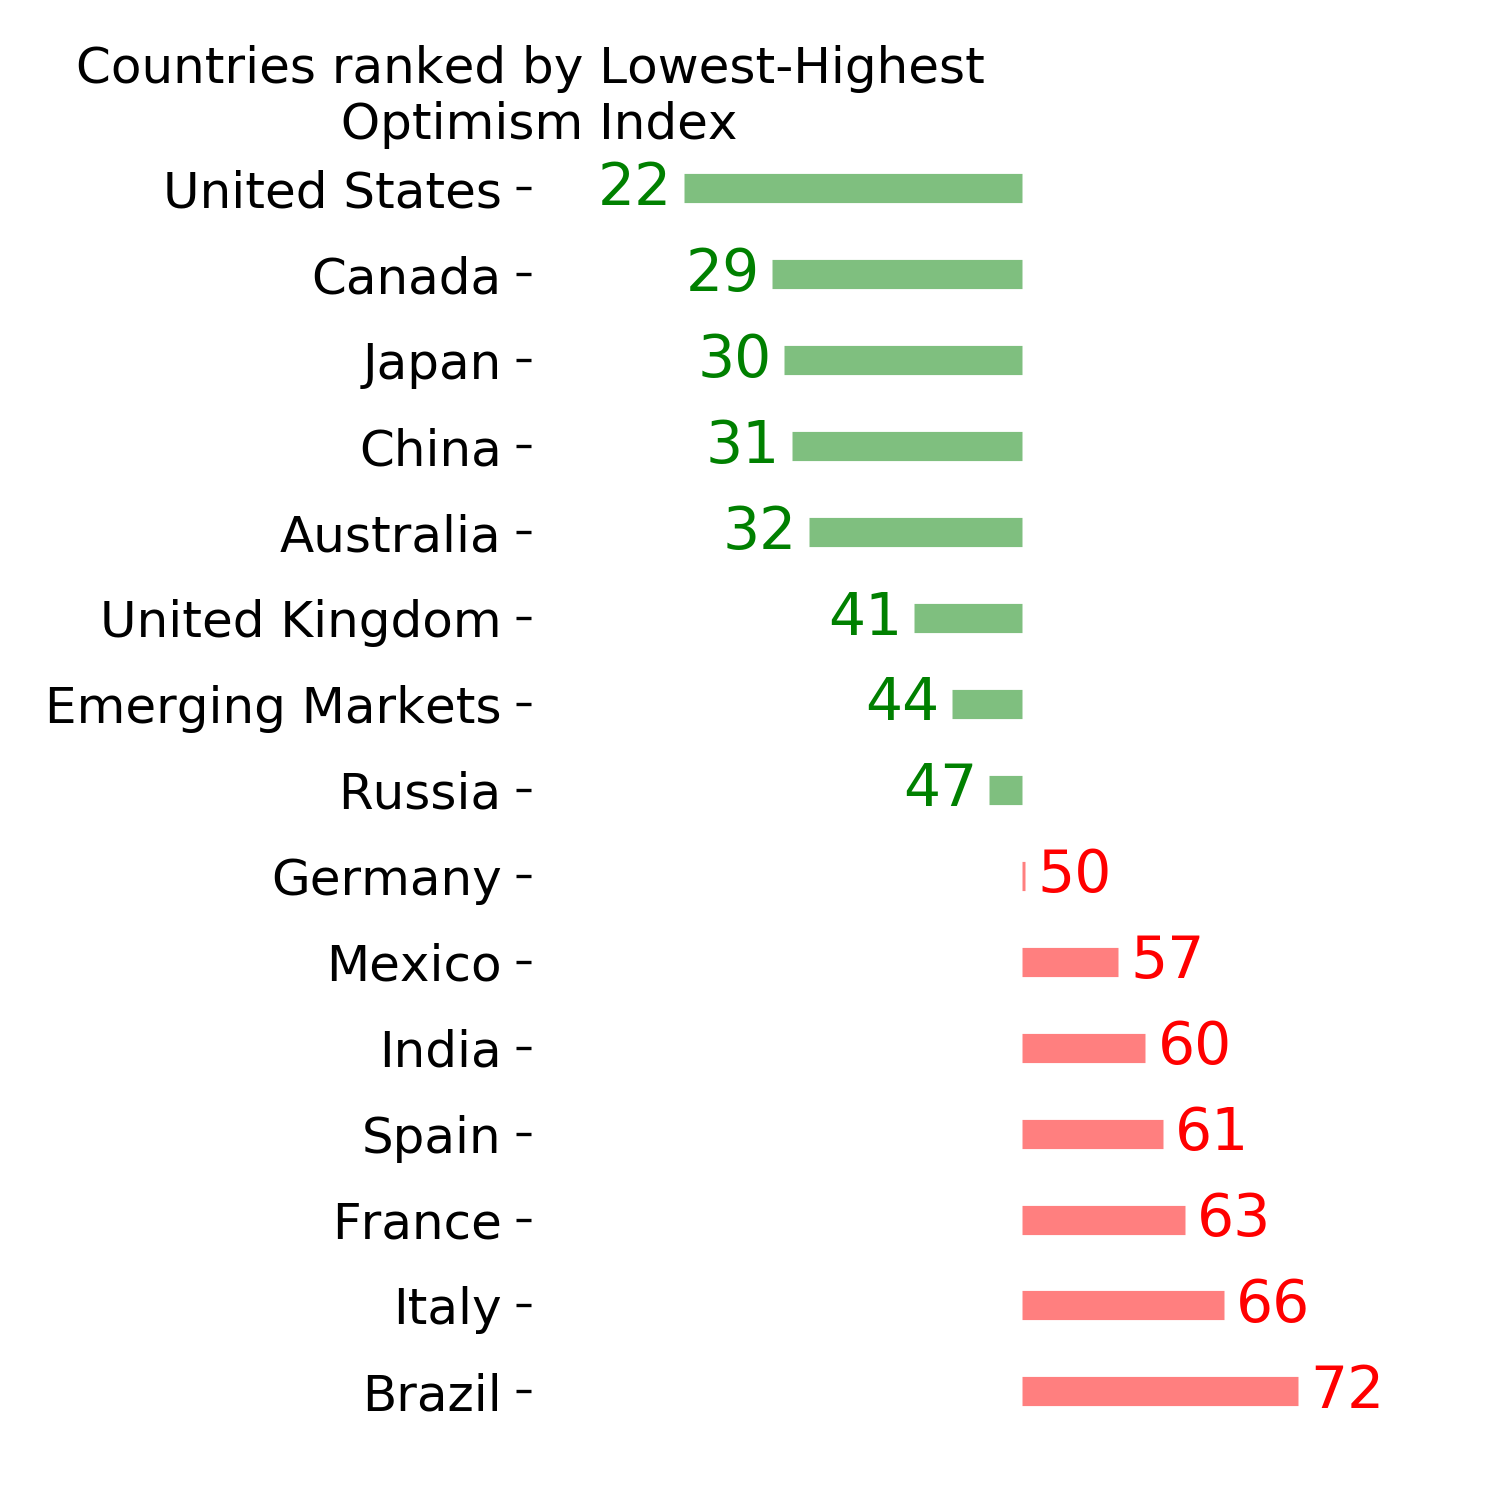
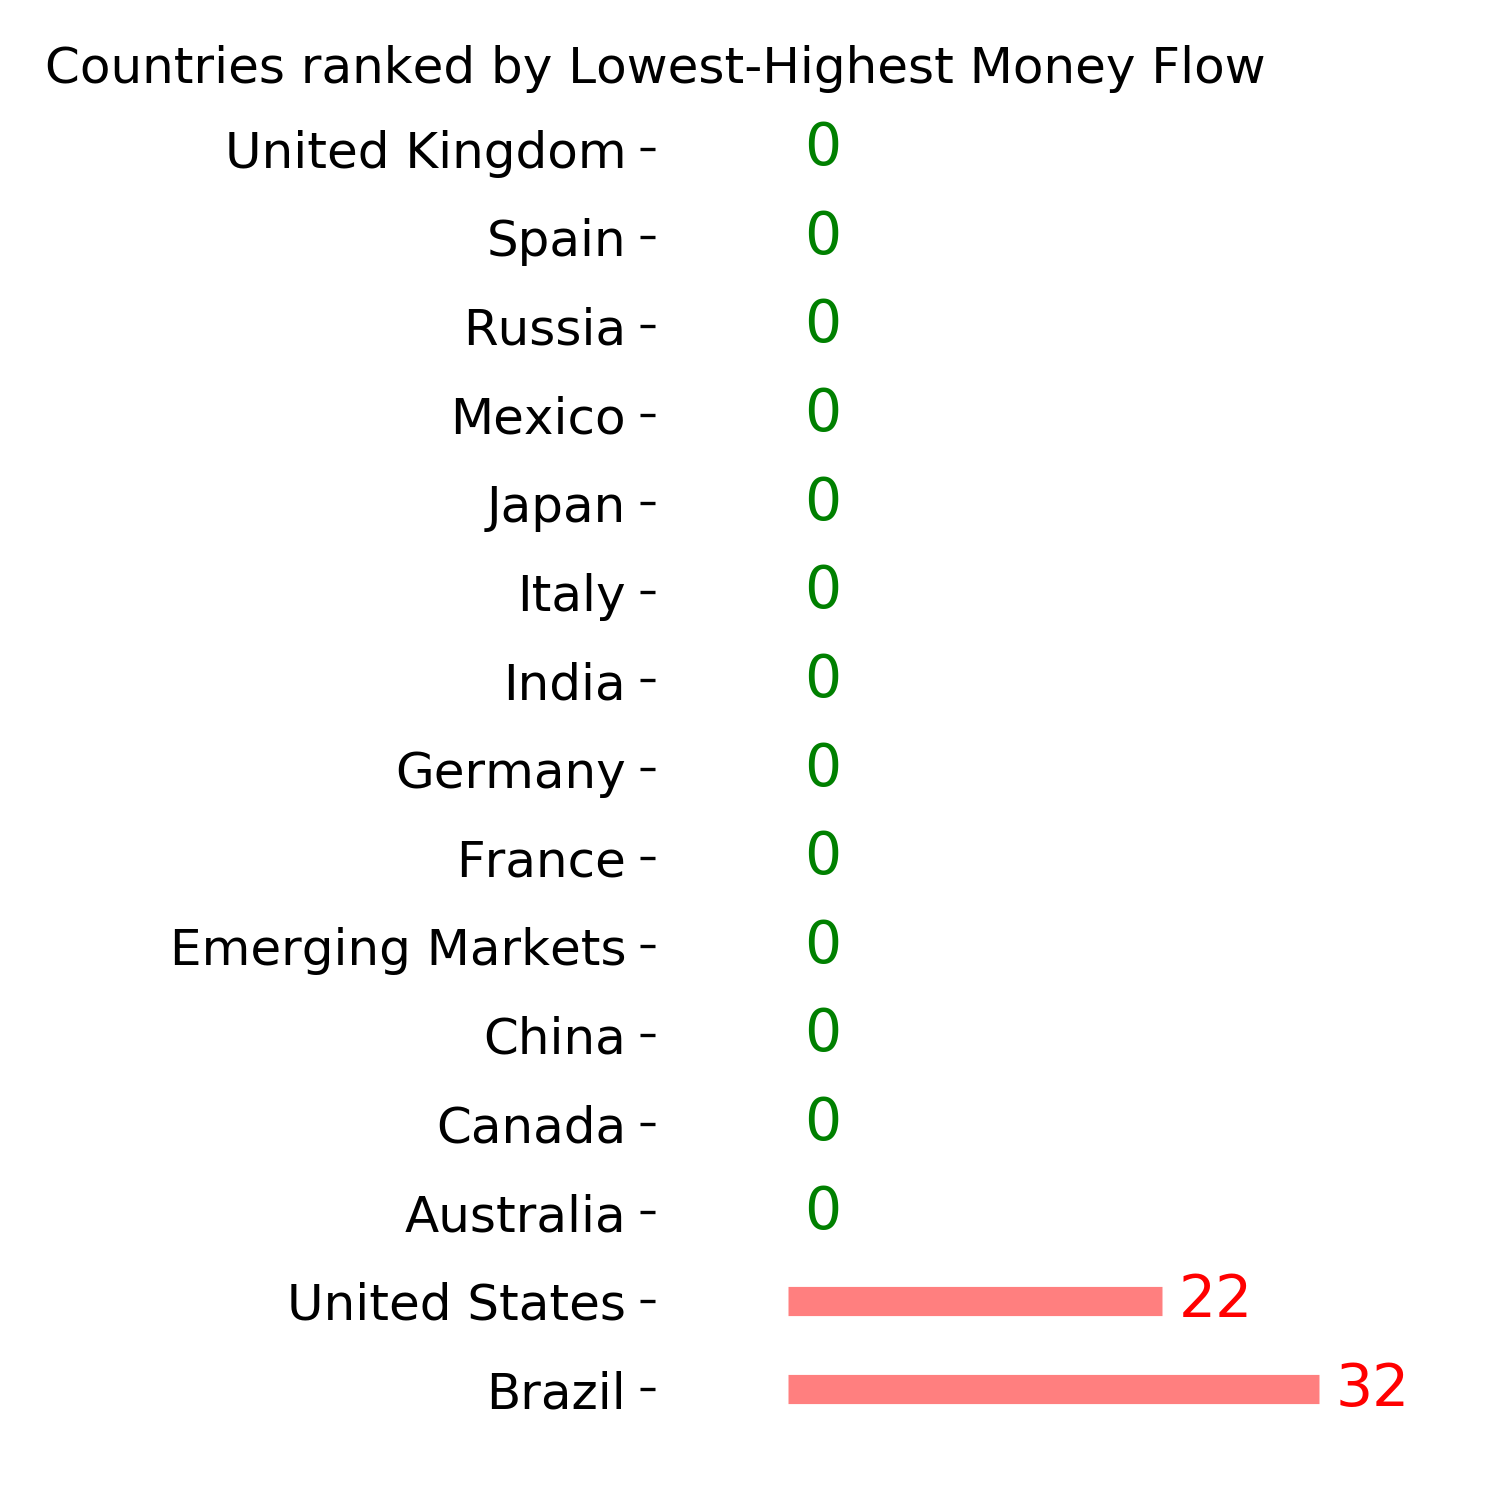
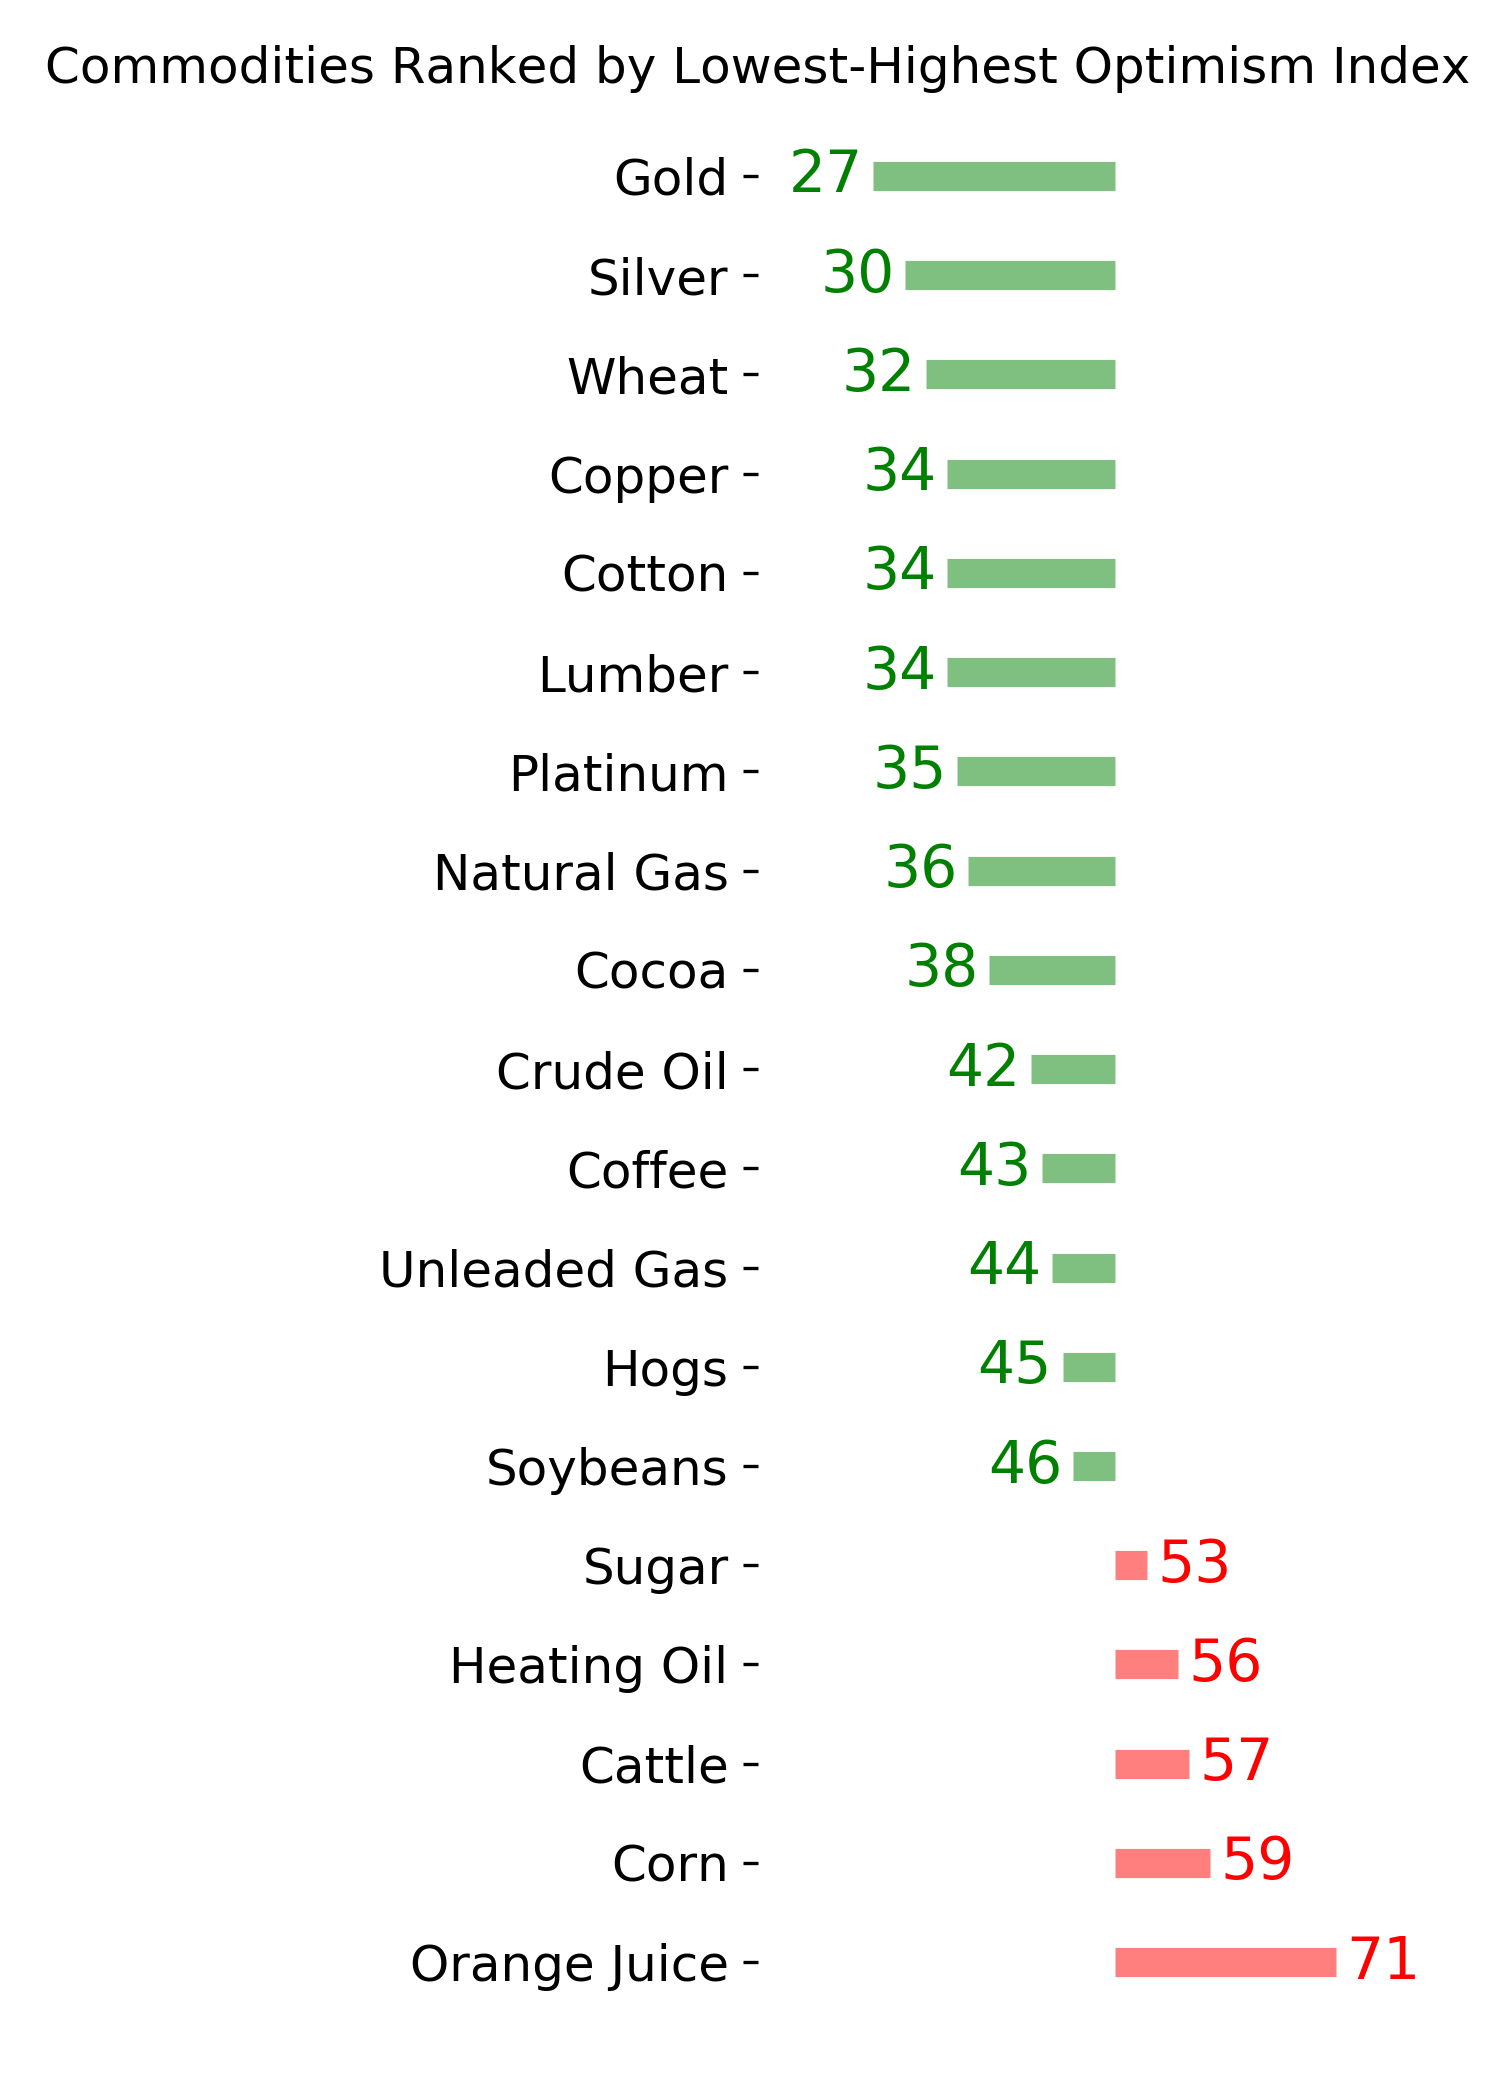
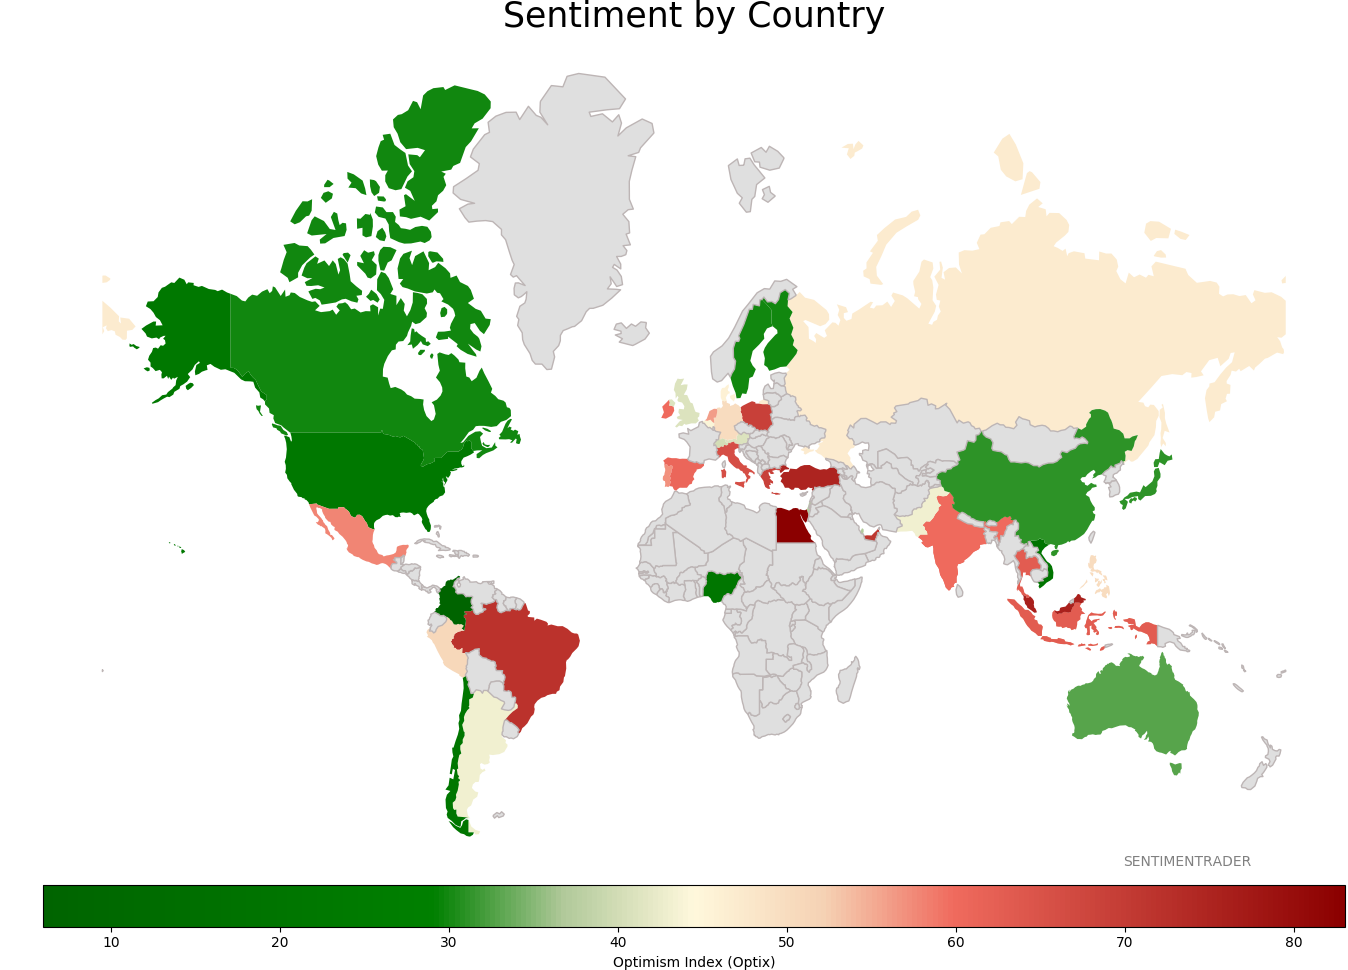
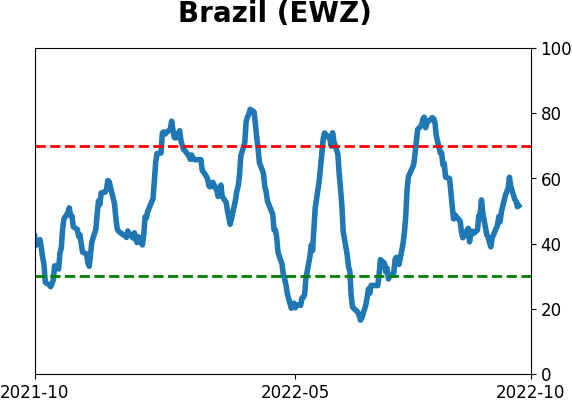
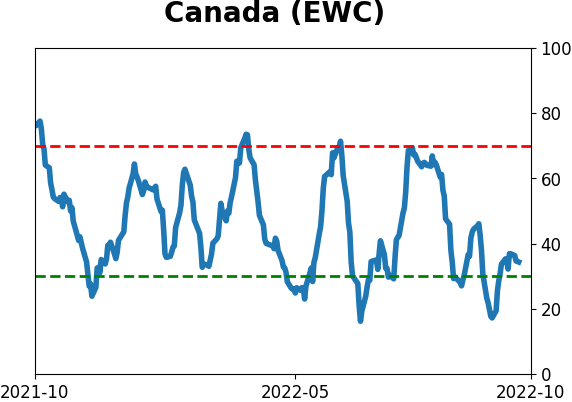
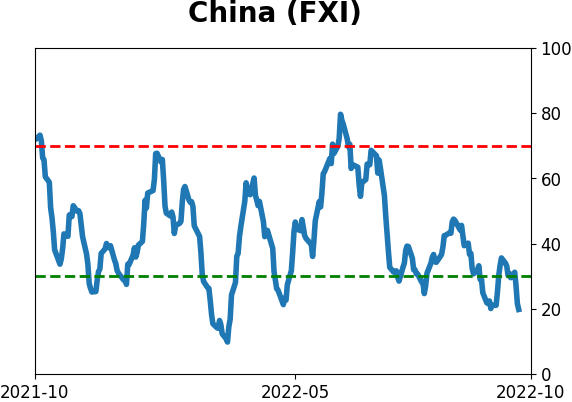
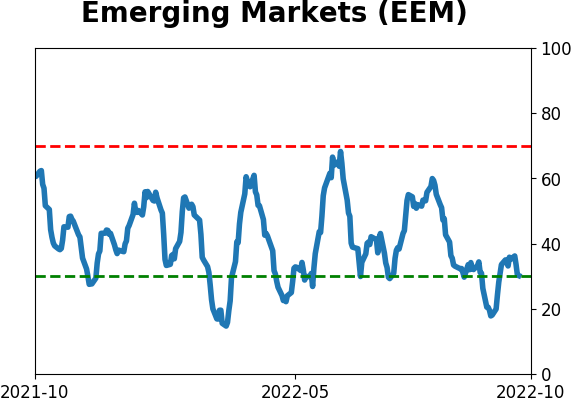
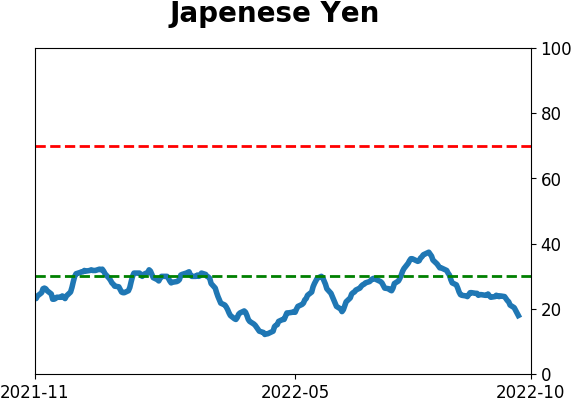
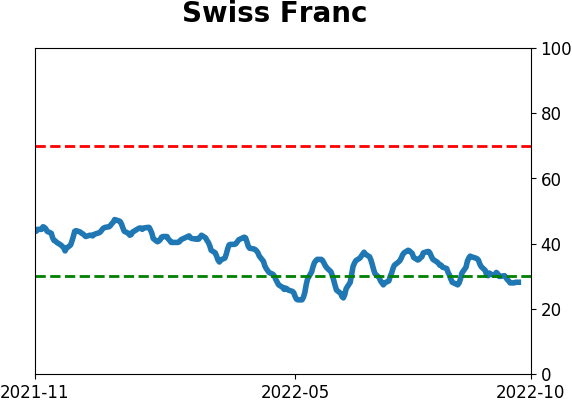
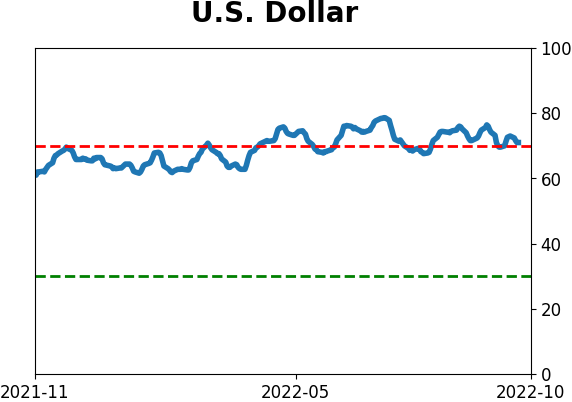
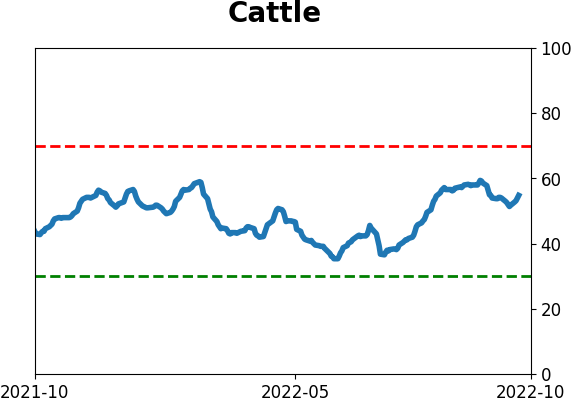
Sentiment Around The World
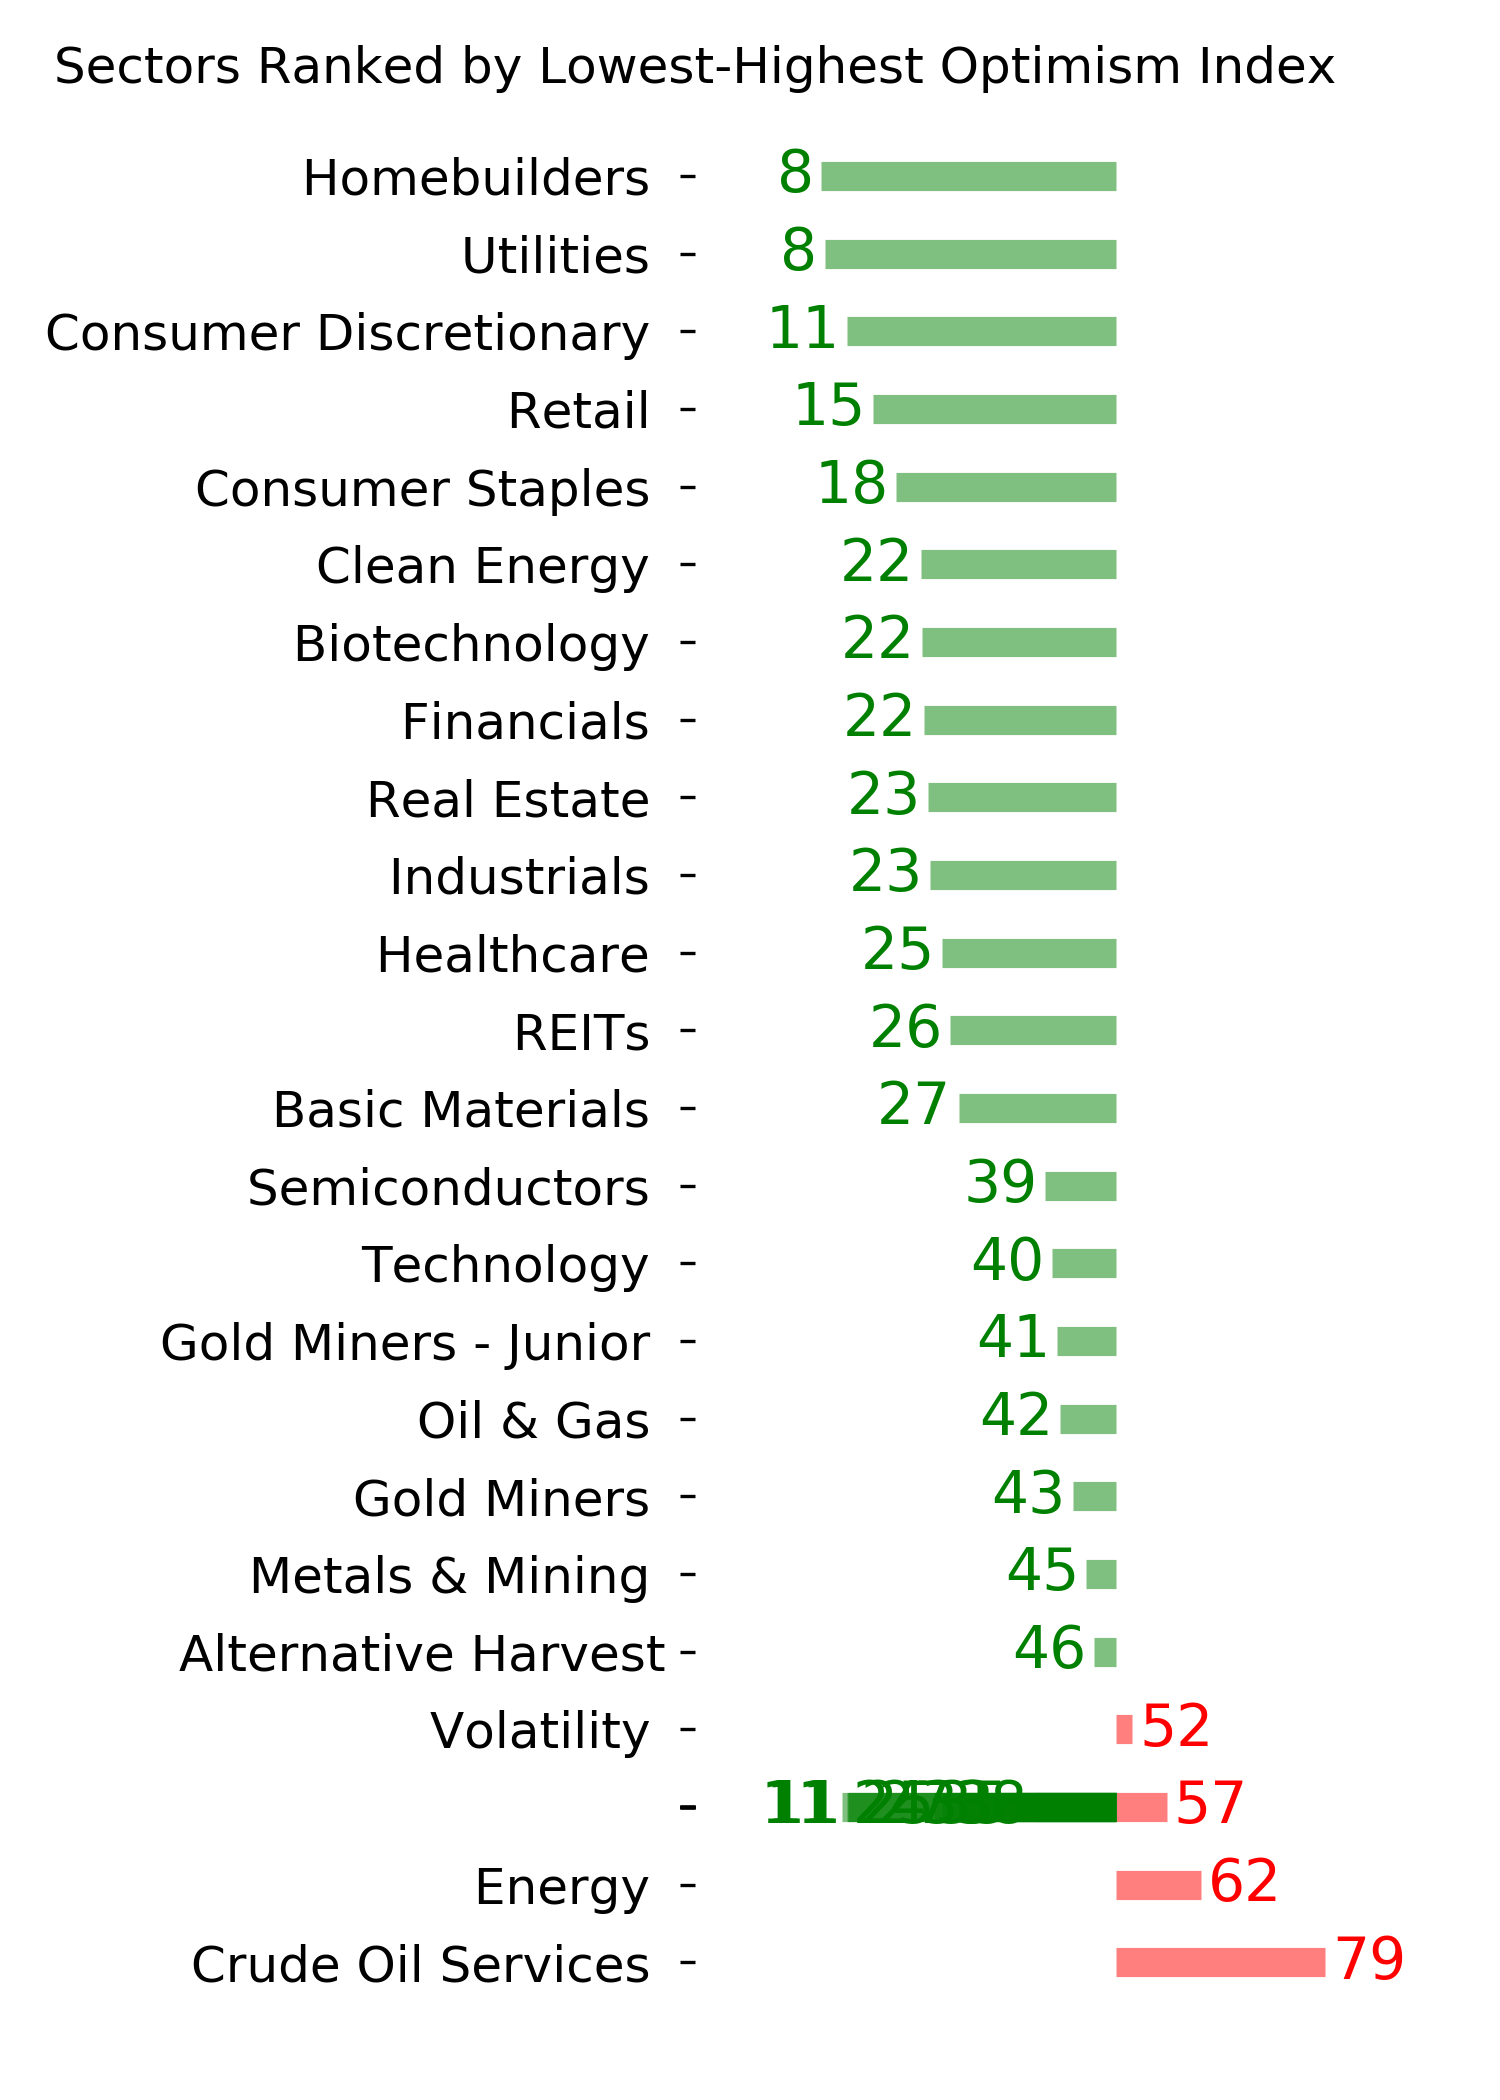
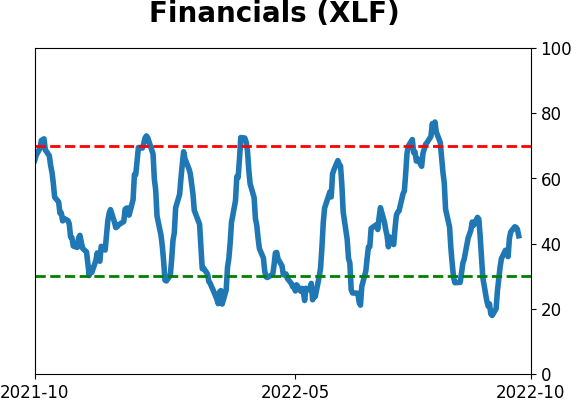
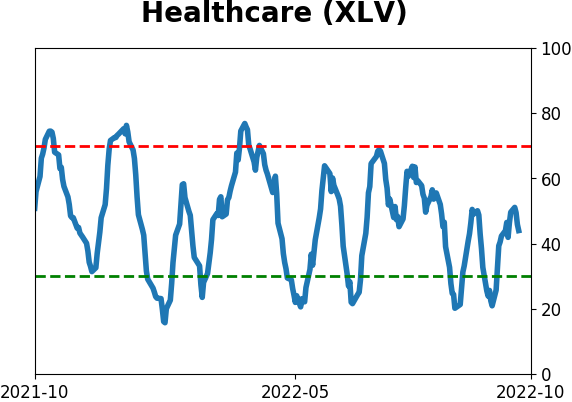
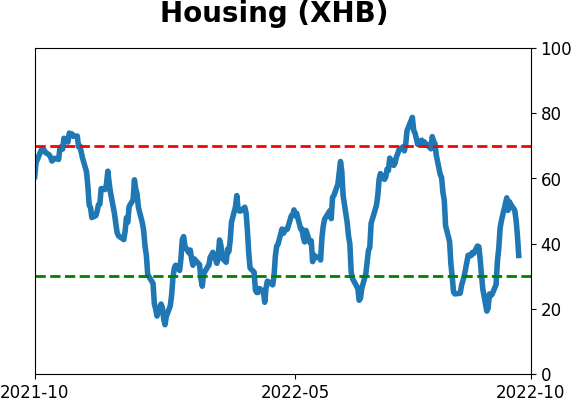
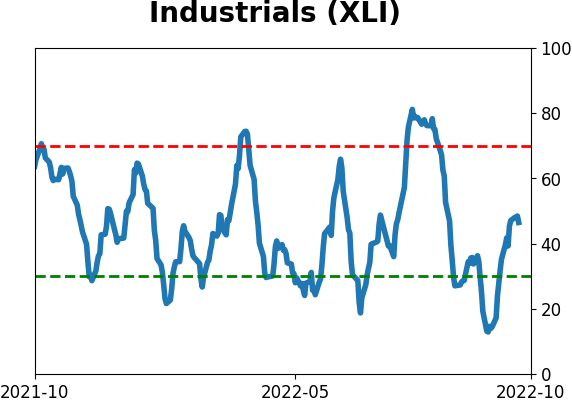
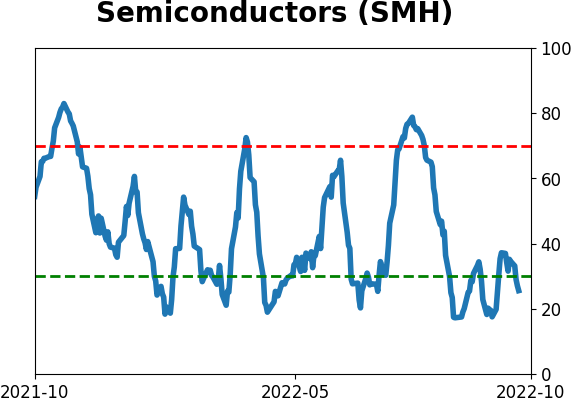
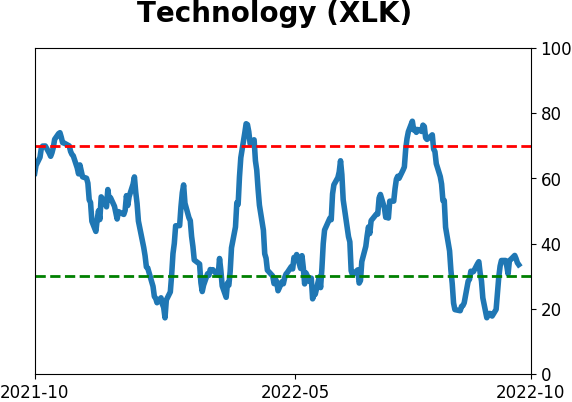
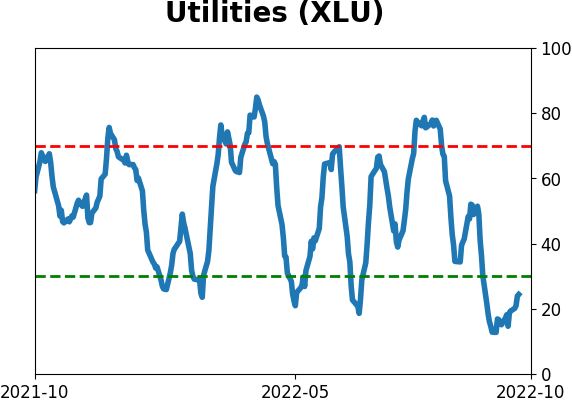
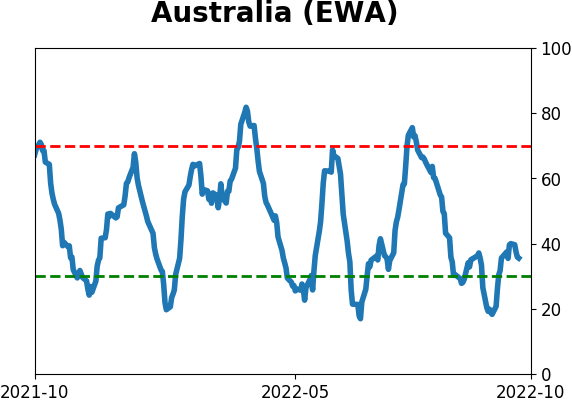
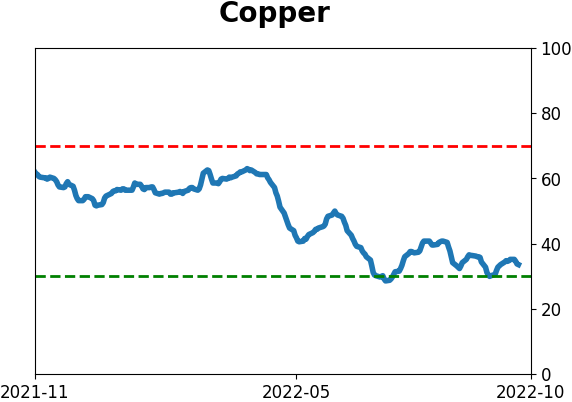
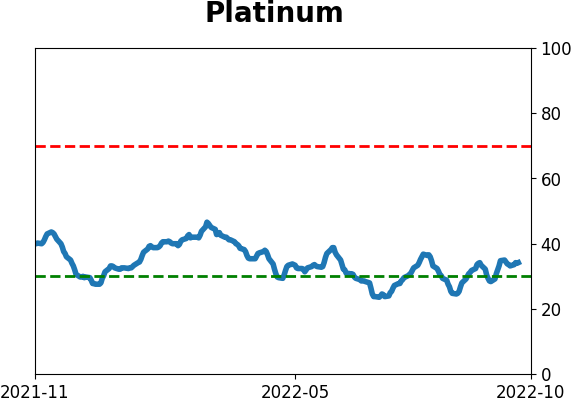
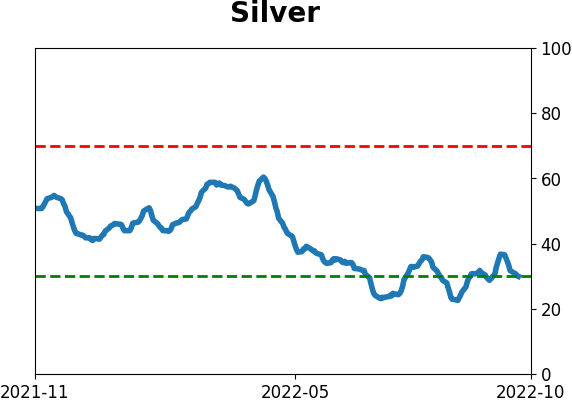
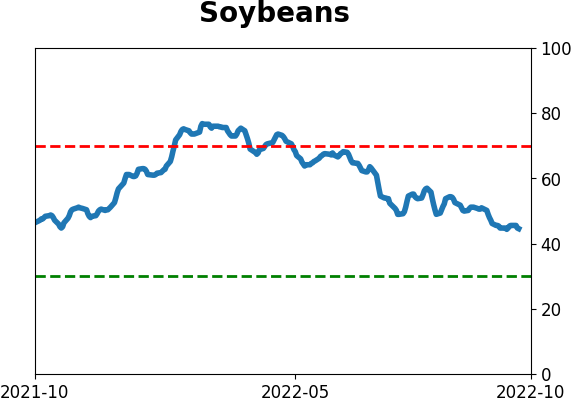
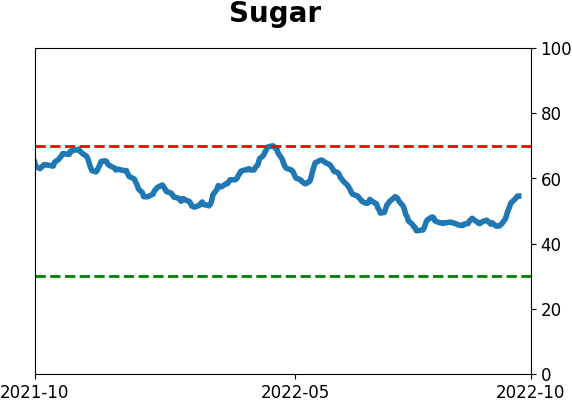
Optimism Index Thumbnails
|
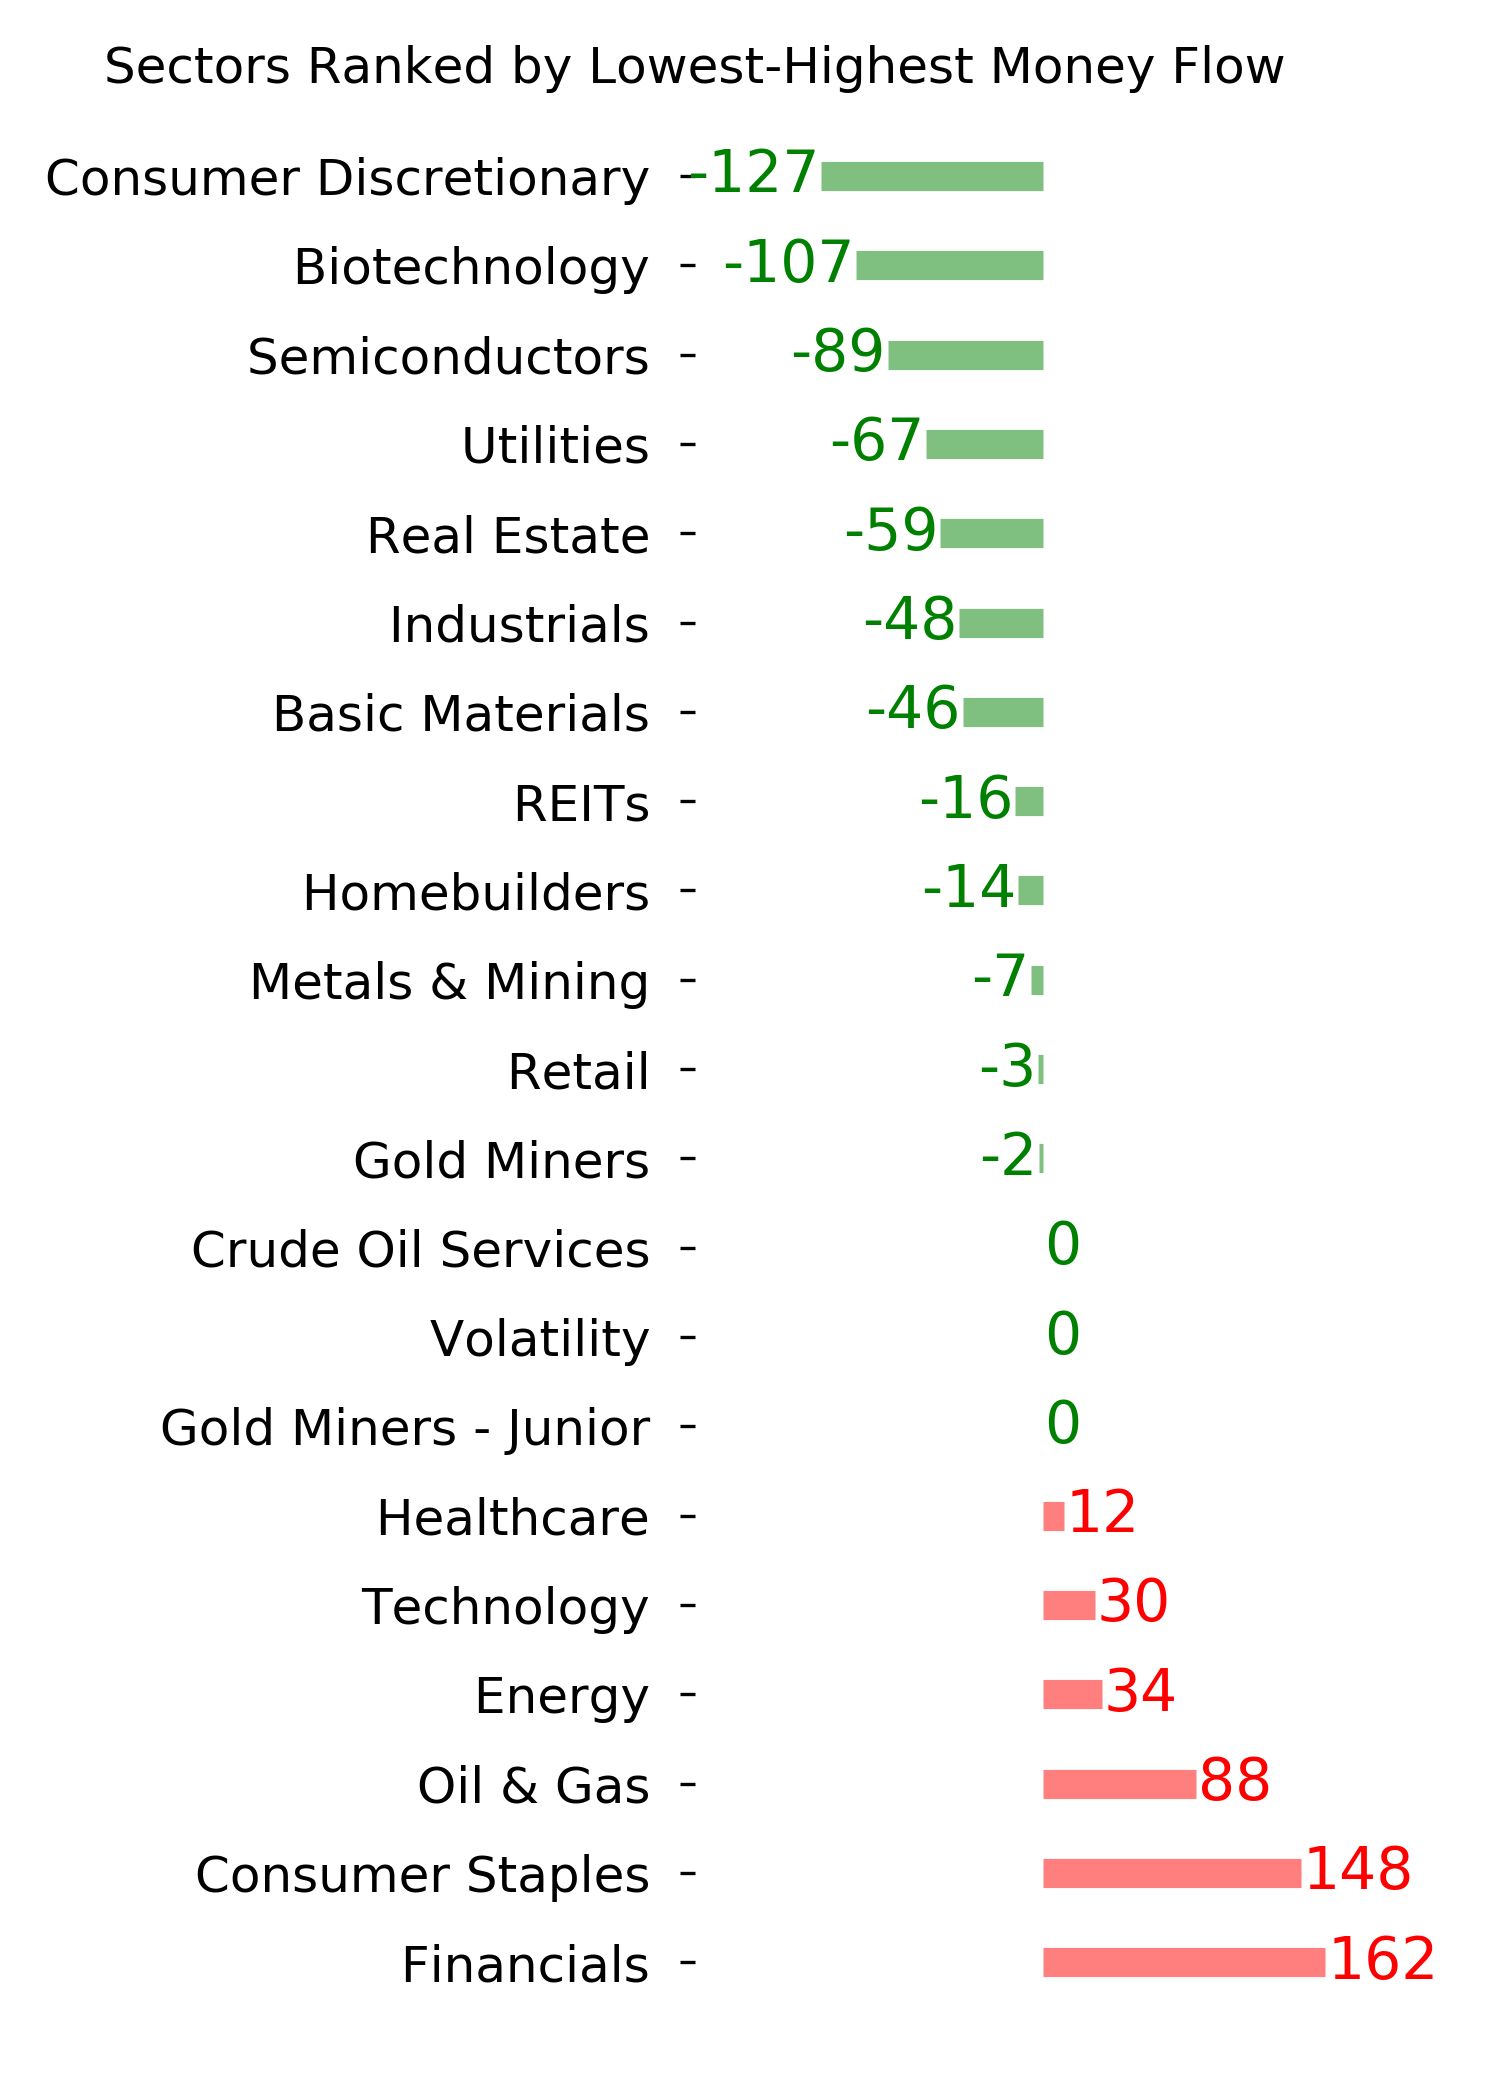
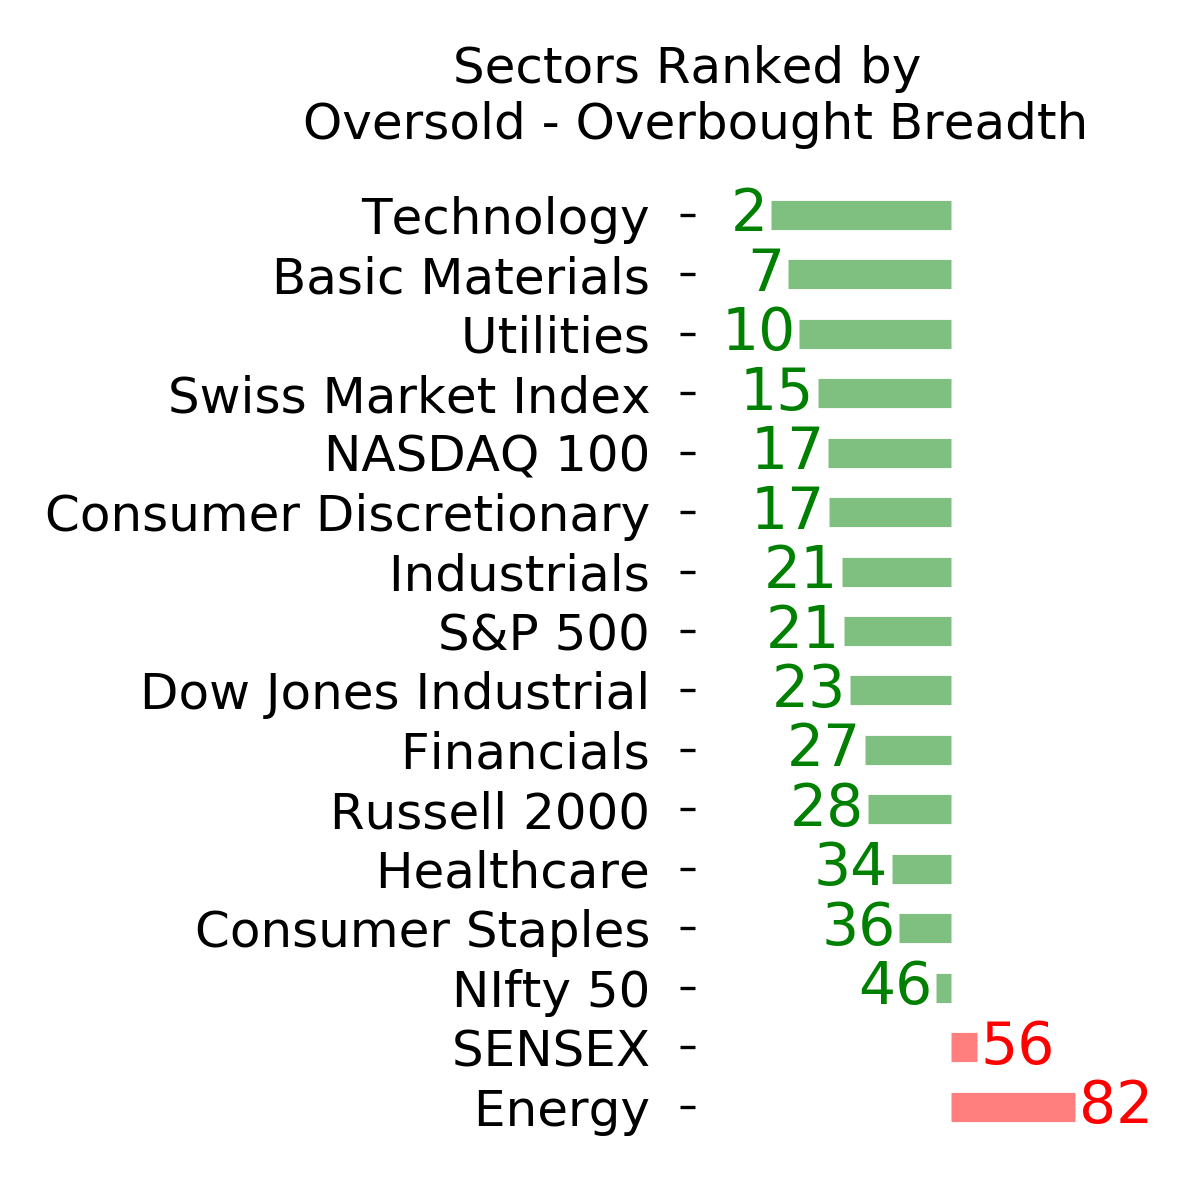
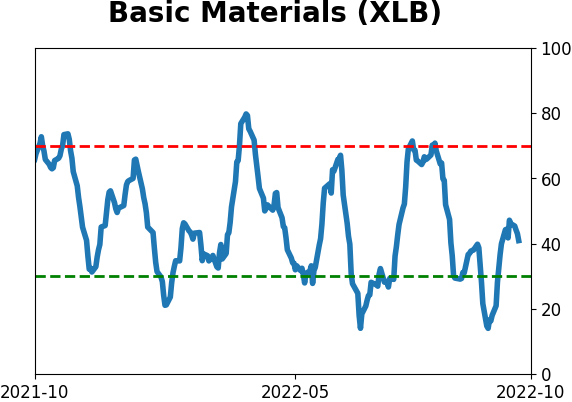
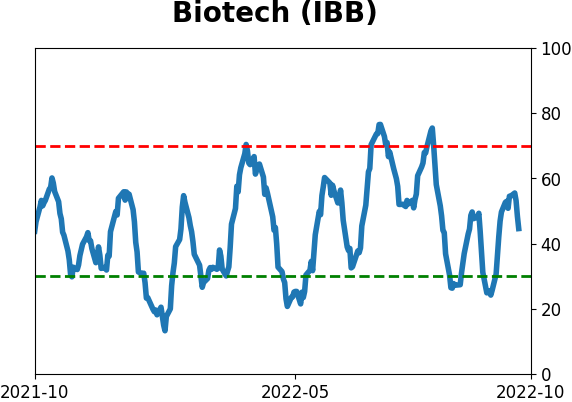
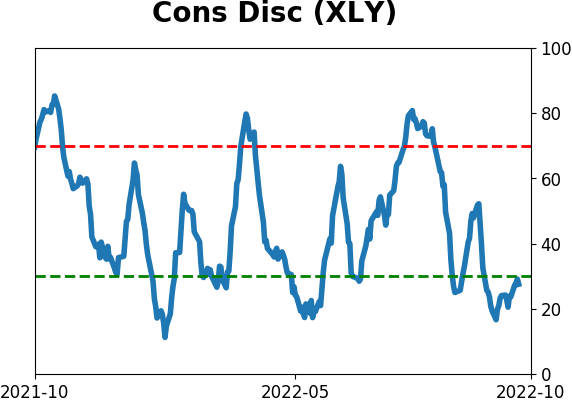
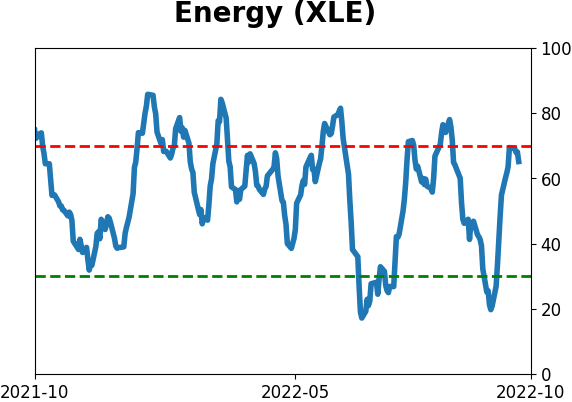
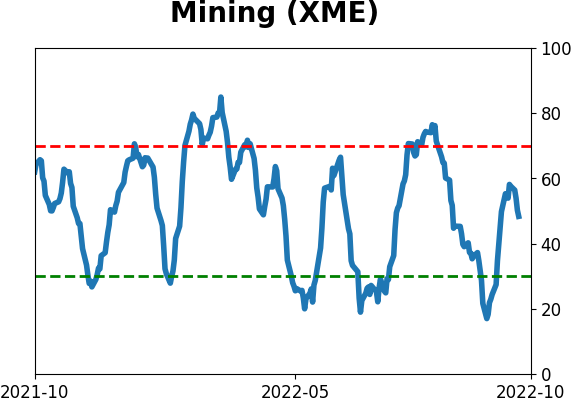
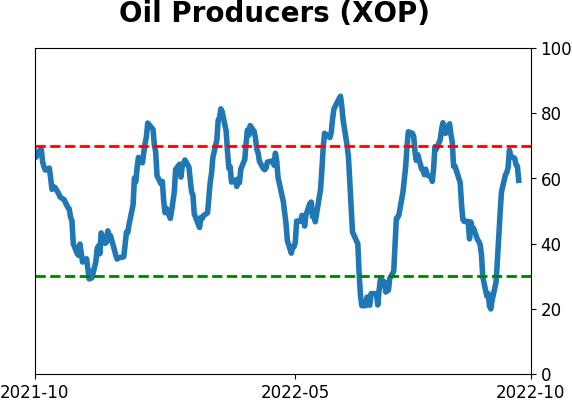
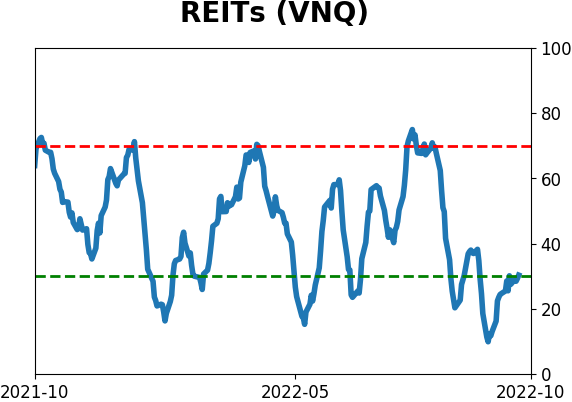
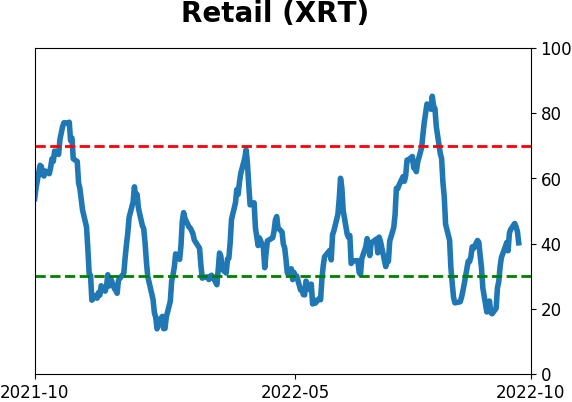
Sector ETF's - 10-Day Moving Average
|
|
|
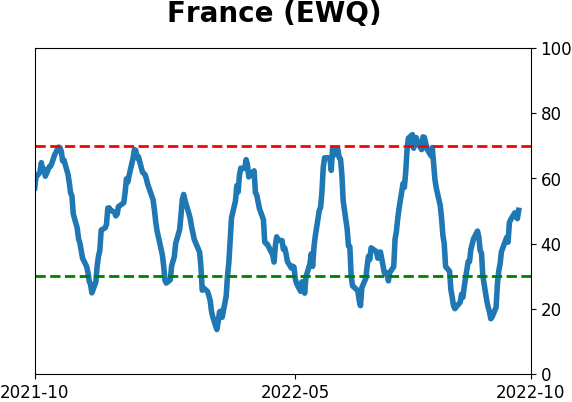
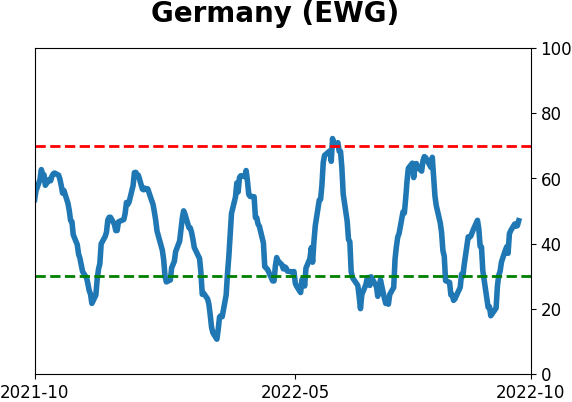
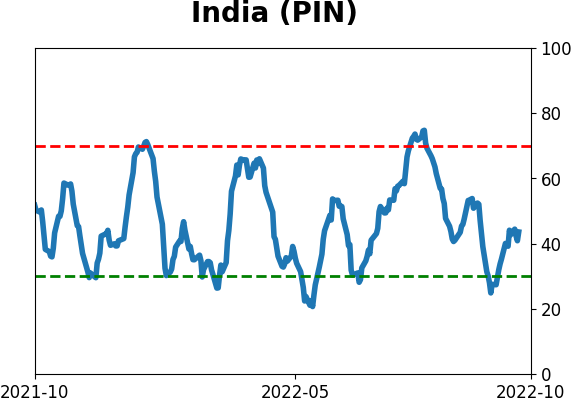
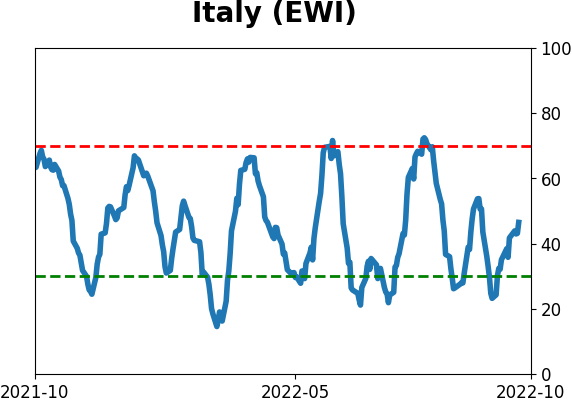
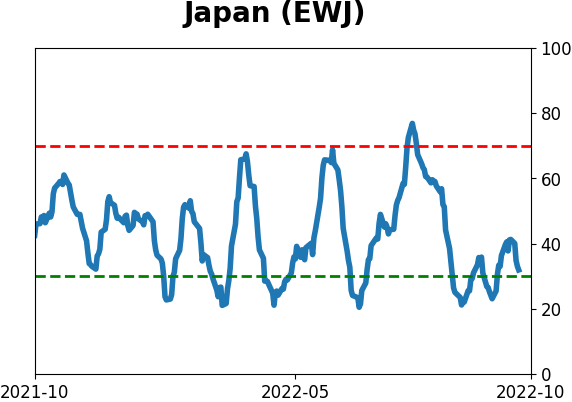
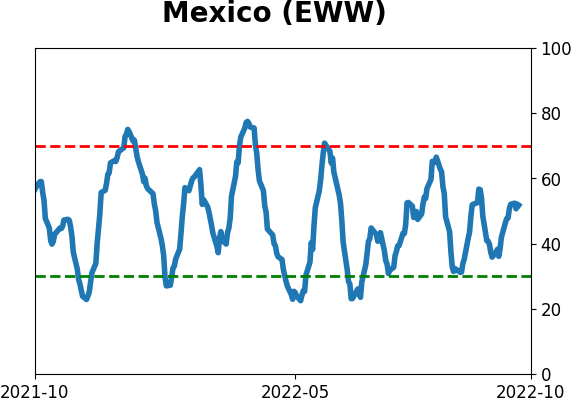
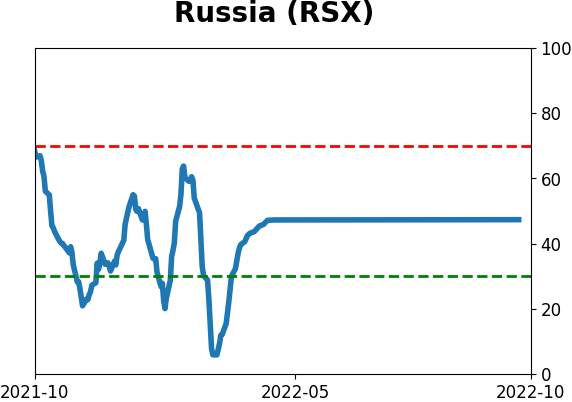
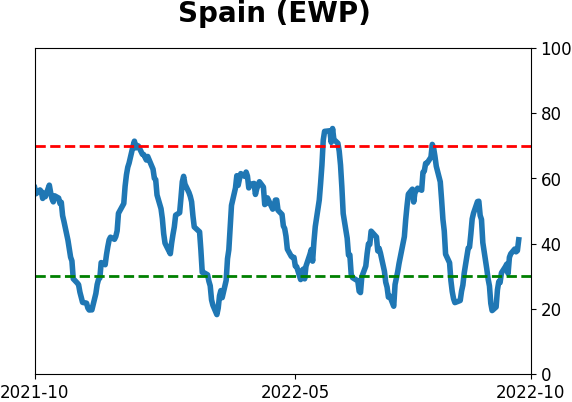
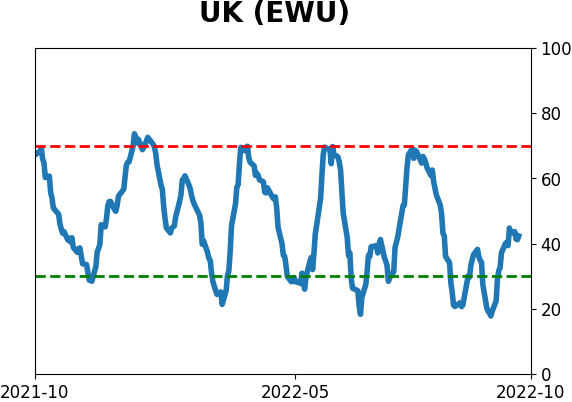
Country ETF's - 10-Day Moving Average
|
|
|
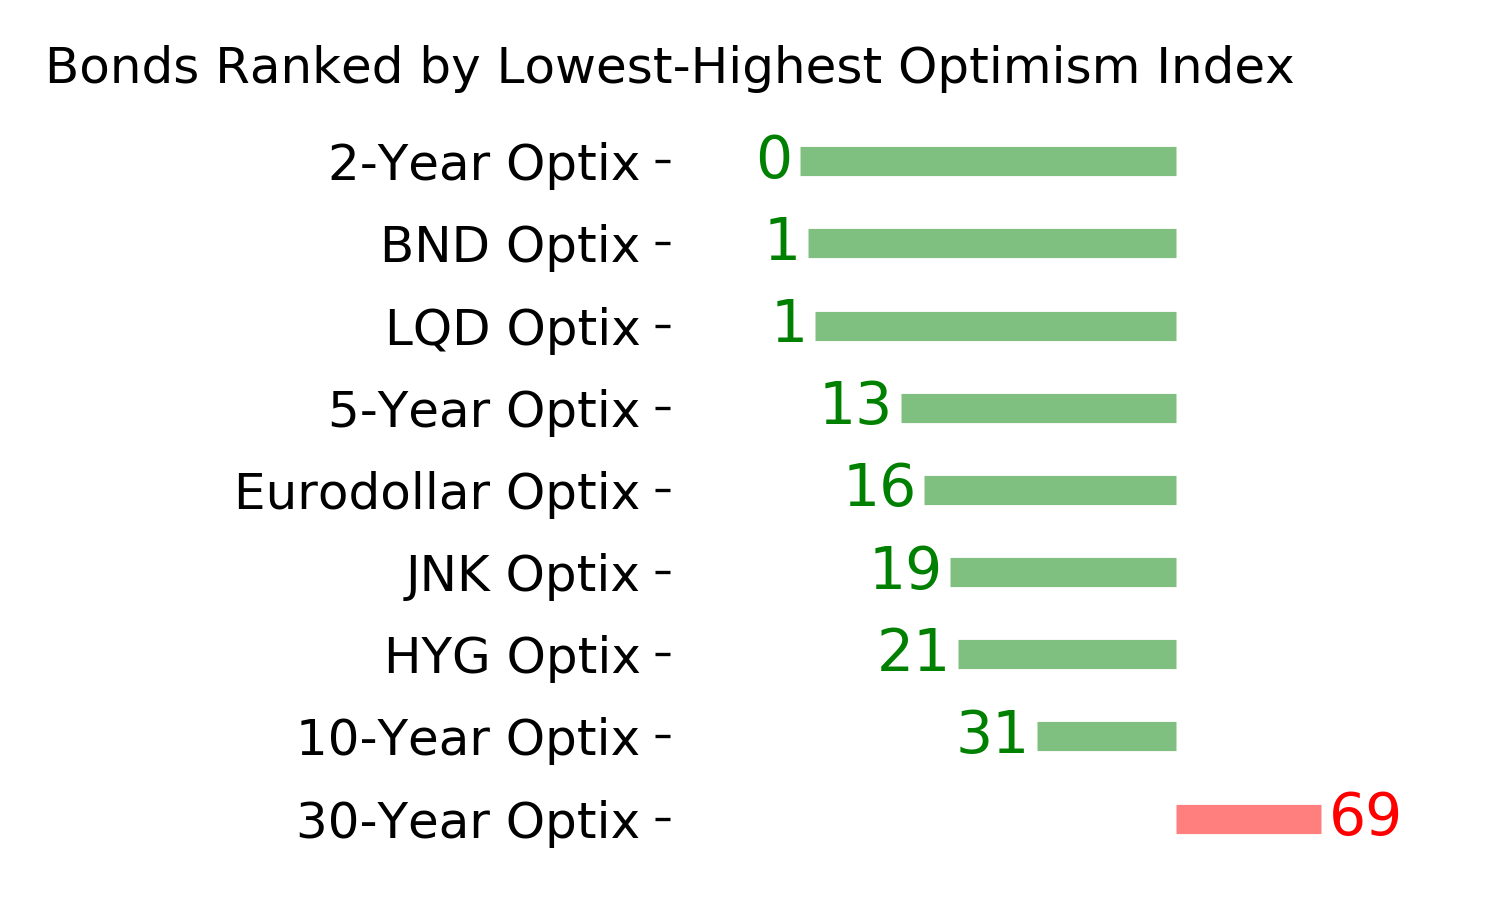
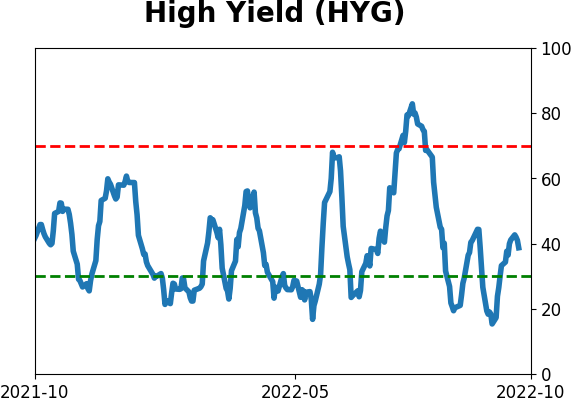
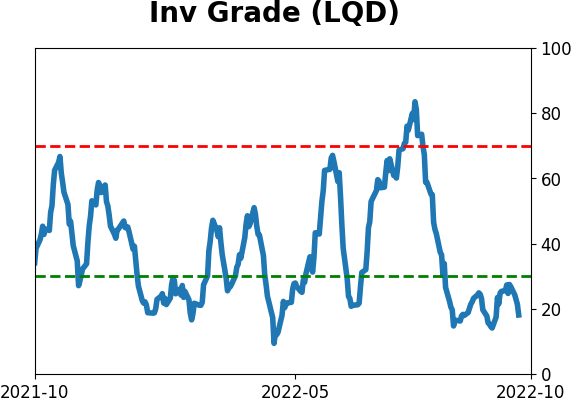
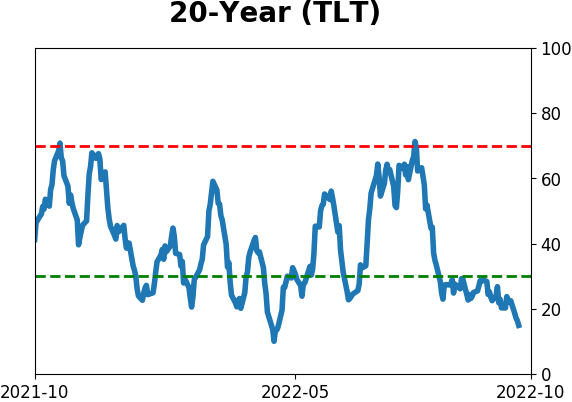
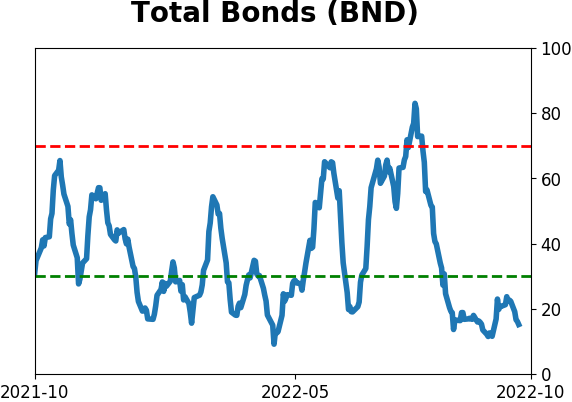
Bond ETF's - 10-Day Moving Average
|
|
|
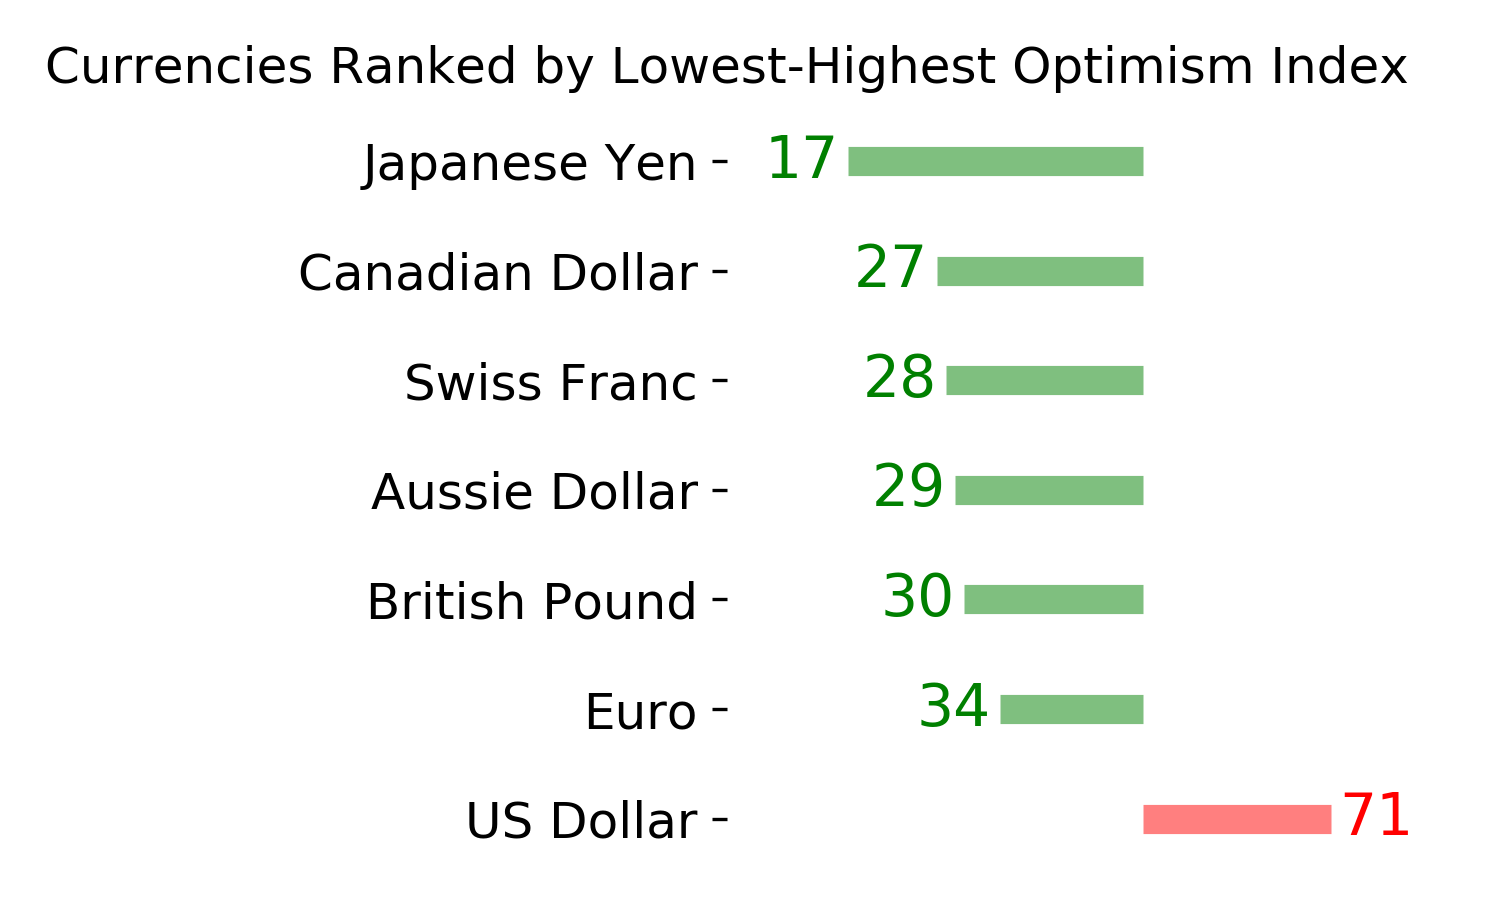
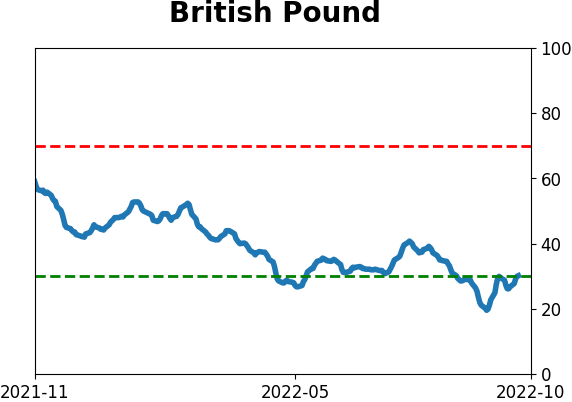
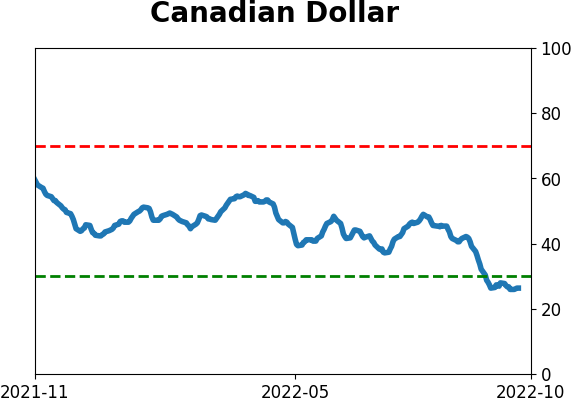
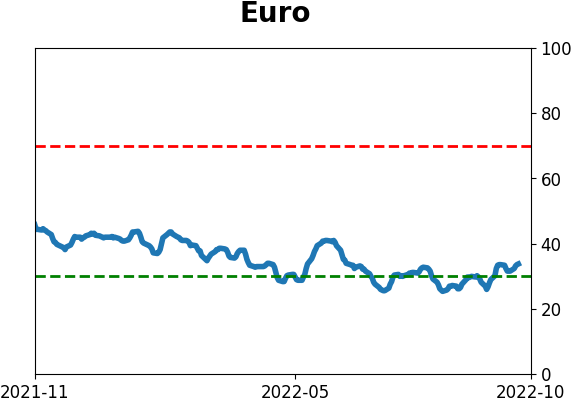
Currency ETF's - 5-Day Moving Average
|
|
|
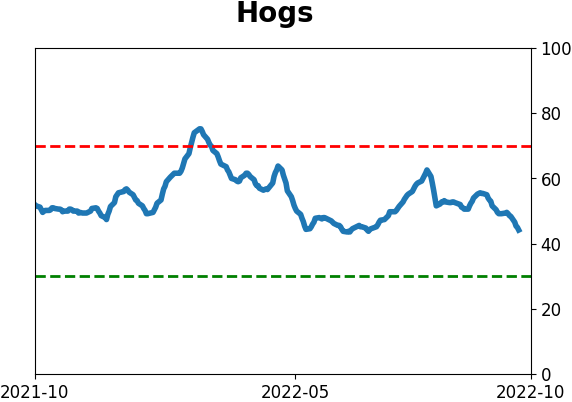
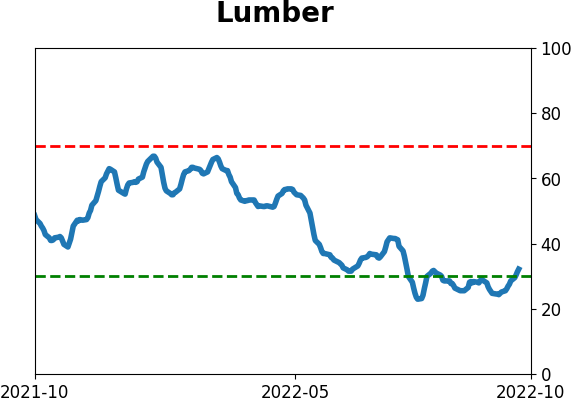
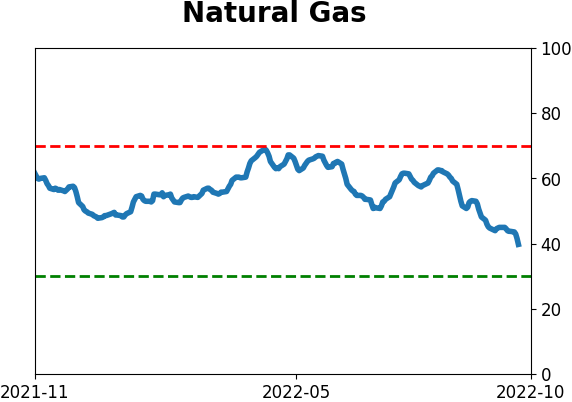
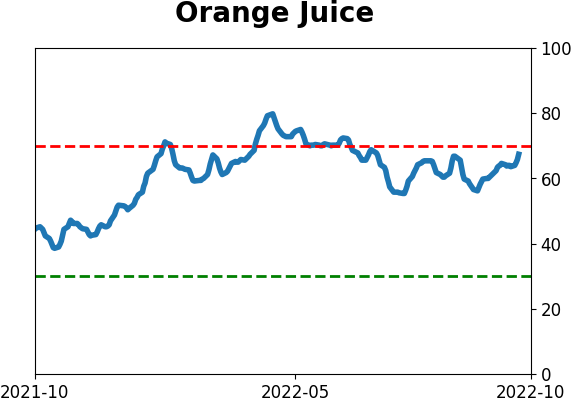
Commodity ETF's - 5-Day Moving Average
|
|