Headlines
|
|
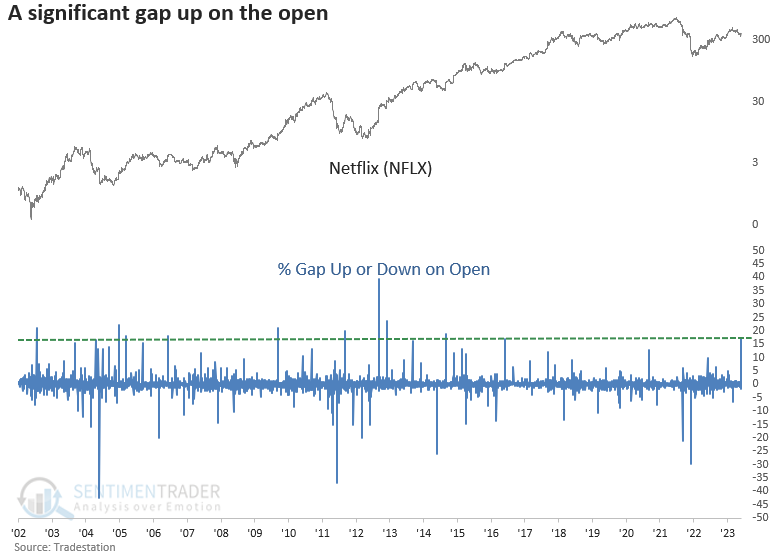
A massive gap up in Netflix:
Netflix opened up more than 16%, representing history's 10th most significant gap. After similar price patterns, the stock pauses for a few days before price momentum accelerates again.
|
Smart / Dumb Money Confidence
|
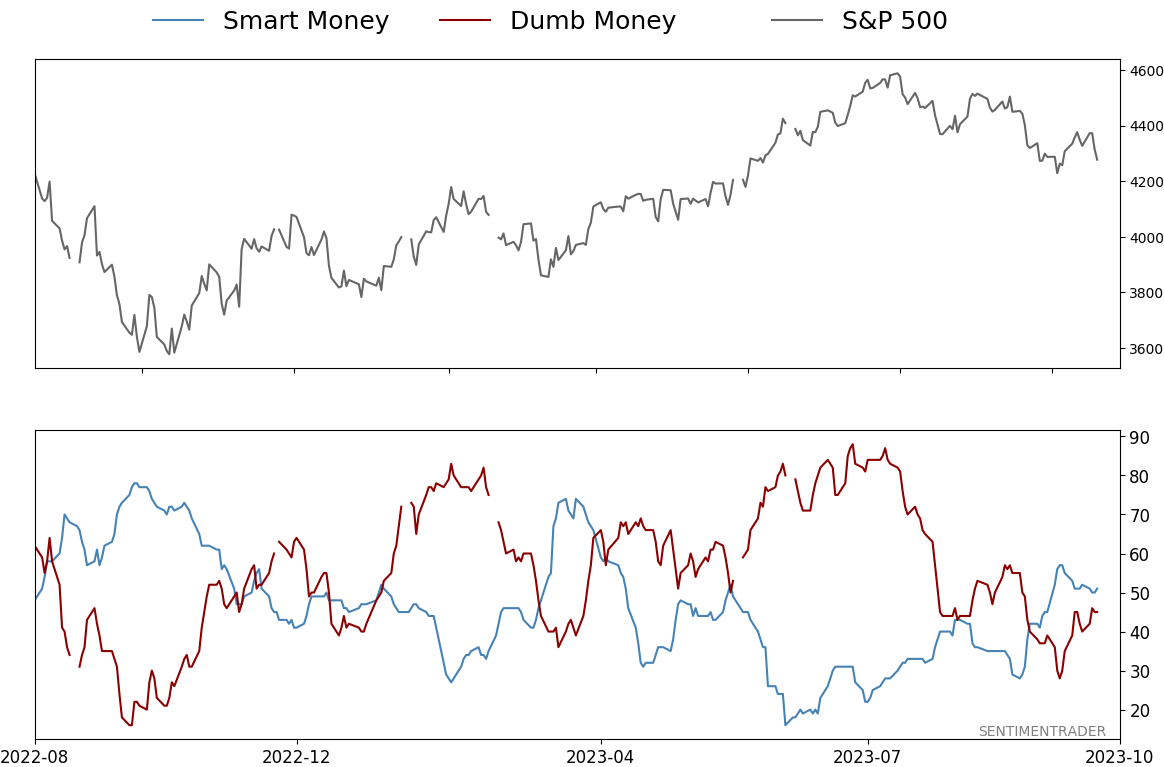
Smart Money Confidence: 51%
Dumb Money Confidence: 45%
|
|
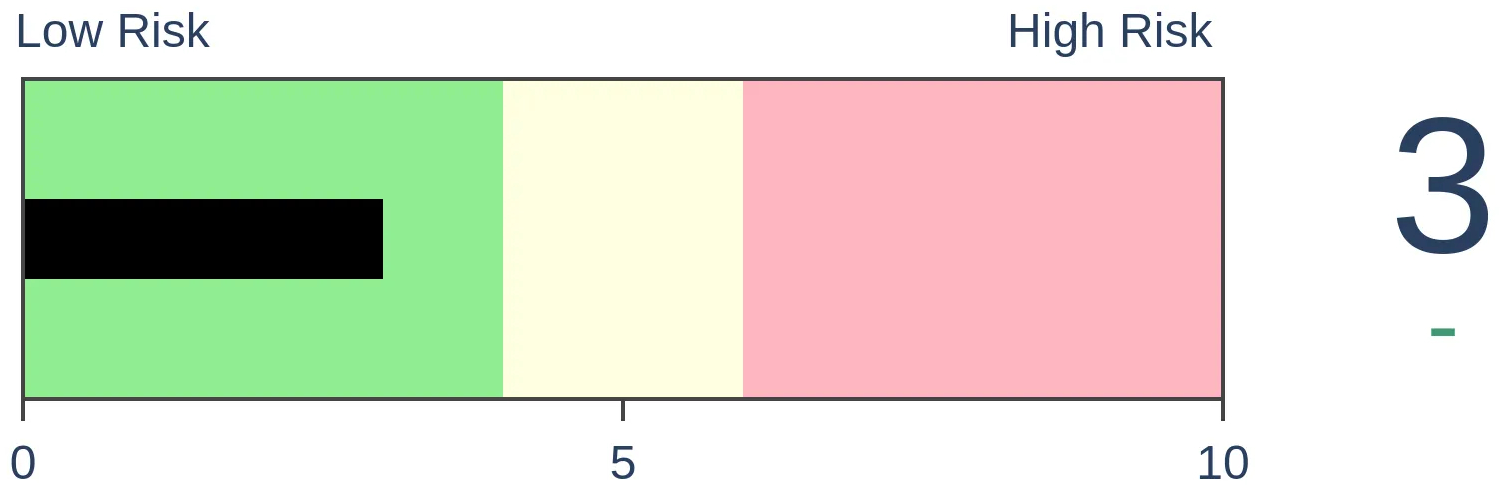
Risk Levels
Stocks Short-Term
|
Stocks Medium-Term

|
|
Bonds
|
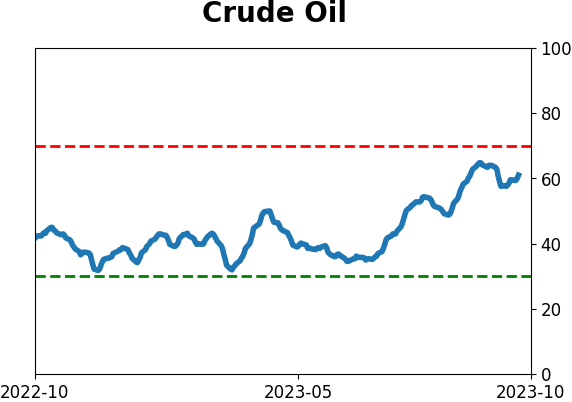
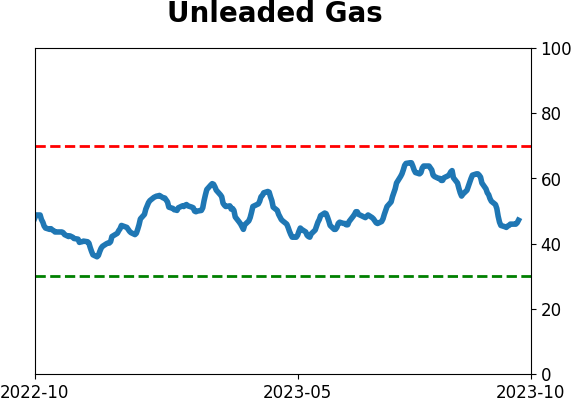
Crude Oil

|
|
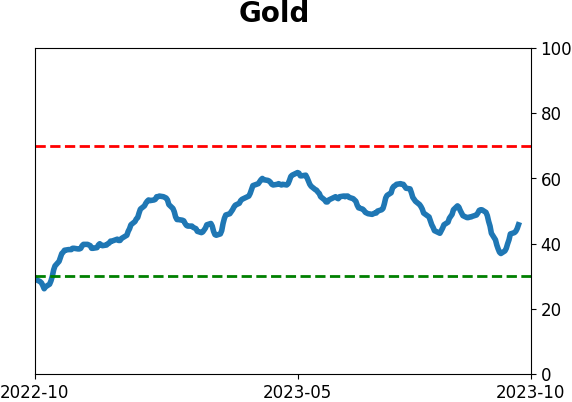
Gold
|
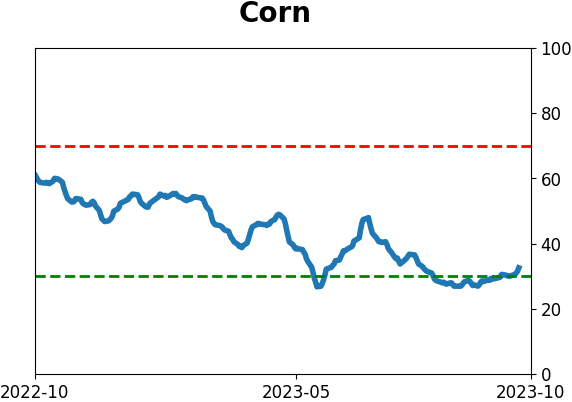
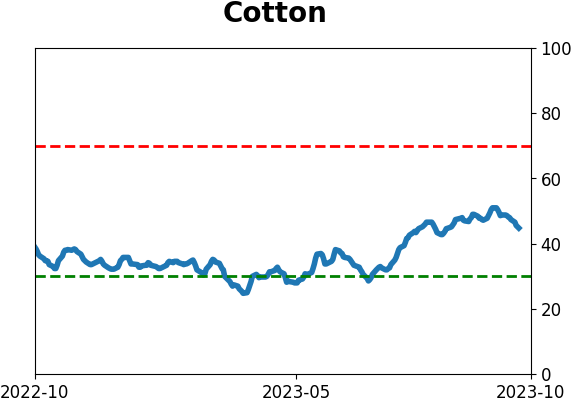
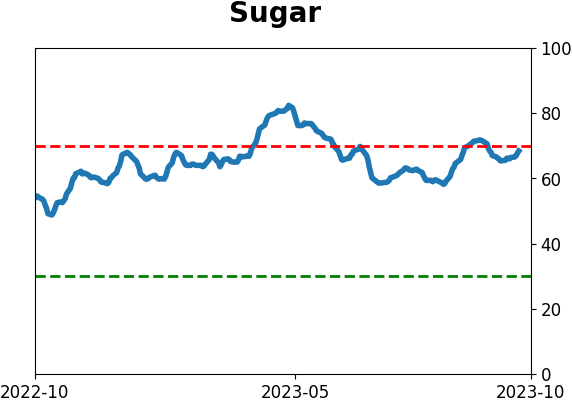
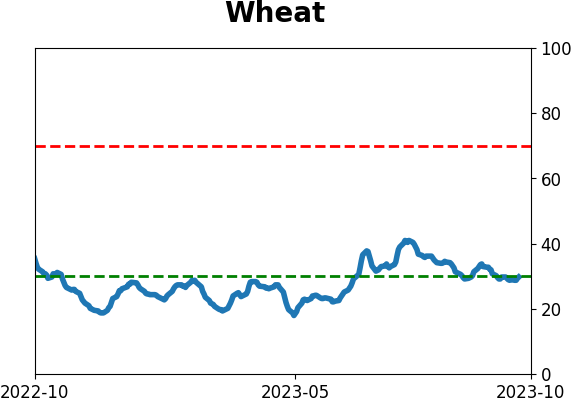
Agriculture
|
|
Research
By Dean Christians
BOTTOM LINE
Netflix opened up more than 16%, representing history's 10th most significant gap. After similar price patterns, the stock pauses for a few days before price momentum accelerates again.
FORECAST / TIMEFRAME
None
|
Key points:
- Netflix (NFLX) opened up 16.91%, recording one of the most significant gap-up amounts in history
- Similar surges on the open preceded a 79% win rate over the subsequent 15 trading sessions
- When the stock was in a downtrend on the day before the gap, Netflix was higher every time
A bullish gap-up open pattern
During my tenure as the head of a trading desk for a large-cap growth firm, we devoted a substantial amount of time scrutinizing the context surrounding our trades. One of the studies we conducted involved significant gap-up opens. The traders meticulously analyzed thousands of trades to determine whether we should capitalize on a substantial gap-up open or exercise restraint.
The data presented a compelling case. It demonstrated that, in the context of an extended downtrend, a significant gap-up open often acted as a decisive turning point as fundamental expectations had been reset, and it was okay to participate. On the other hand, when a stock enjoys an extended uptrend, a meaningful gap-up open typically indicates buyer exhaustion, and we should avoid adding exposure.
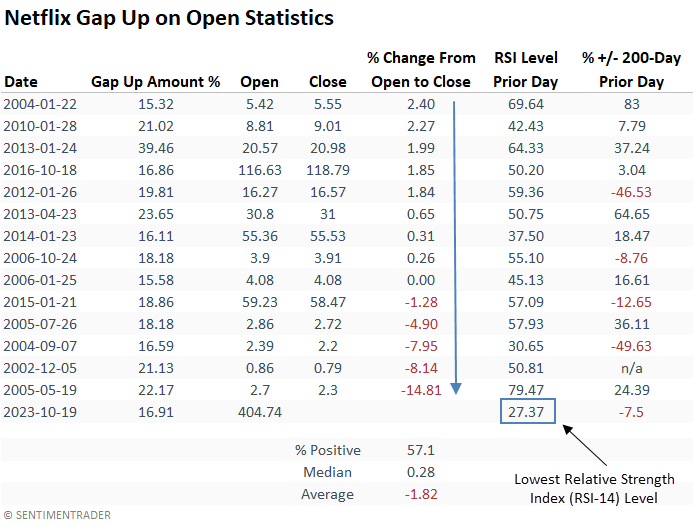
Netflix surprised the market by opening up 16.91% at the beginning of the trading session, marking the 15th time it has opened up more than 15%. This remarkable gain is now history's 10th-largest opening gap.
Context around the Netflix gap
Suppose you bought Netflix on the open when it gapped up 15% or more and sold it on the close. In that case, the trade shows a win rate of 57% with a median gain of 0.28% and an average loss of -1.82%.
The best open-to-close gain of 2.4% occurred when the stock traded 83% above its 200-day average on the day before the gap-up opening. However, that gap marked a 4-year high in Netflix. So, history suggests one should avoid buying a significant gap up open when a stock is extended above its long-term average.
Similar gap-up patterns preceded positive prices
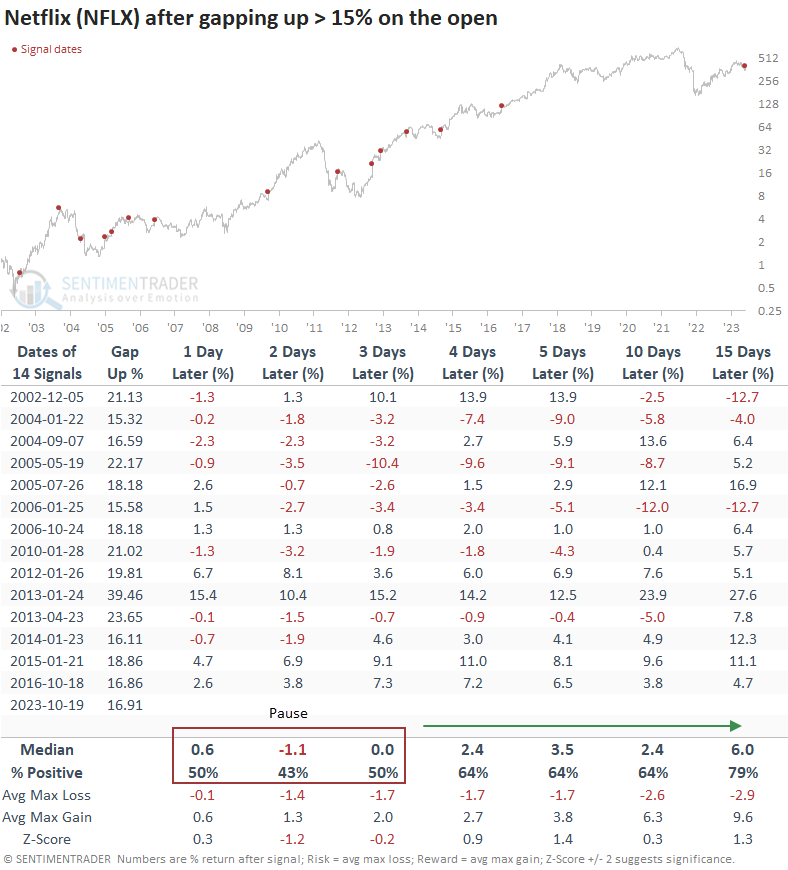
When Netflix gaps up 15% or more to open trading, the stock consolidates the gains over the following three sessions. After the pause, the momentum continues, with the stock showing a median gain of 6% and a solid win rate of 79%. More recent gaps show a gain for eight consecutive signals.
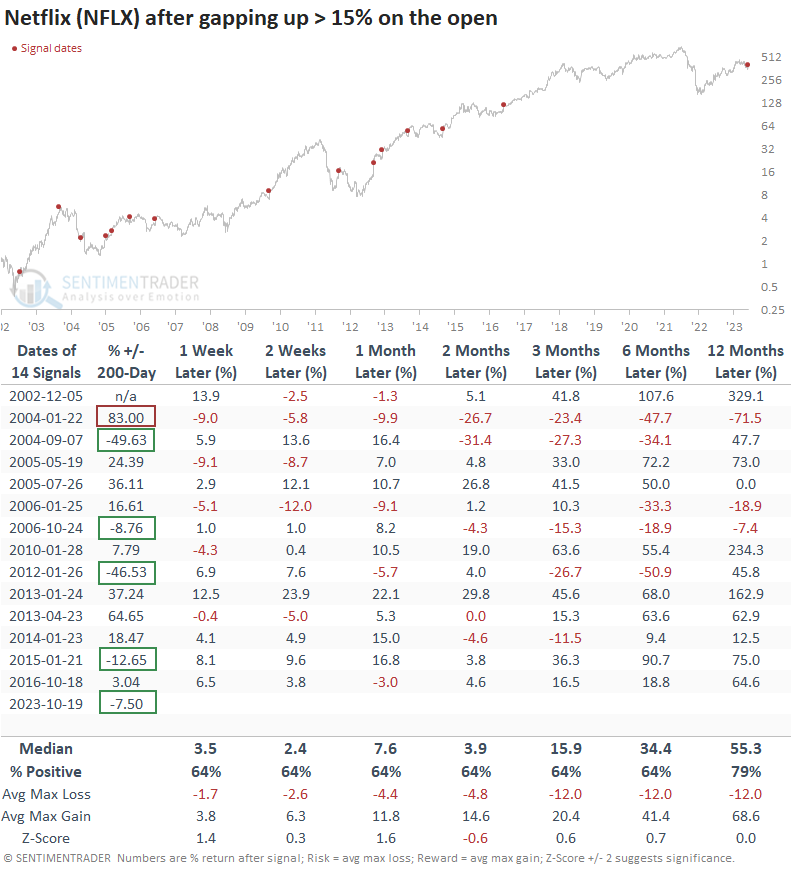
Netflix was positive at some point over the following three months in all but one instance. That precedent occurred in January 2004 when the gap happened after a significant advance from the 2002 bear market low, and the stock was trading 83% above its 200-day average.
What the research tells us...
Netflix gained more than 16% at the opening of the trading session. Similar gaps suggest a multi-day pause that refreshes the bullish momentum. Over the subsequent three weeks, the stock displayed a win rate of 79% with a median gain of 6%. A year later, the results still look bullish, with a similar win rate but an eye-popping median gain of 55%. As with all of our research ideas, traders should apply proper risk management techniques to potential trading ideas.
Indicators at Extremes
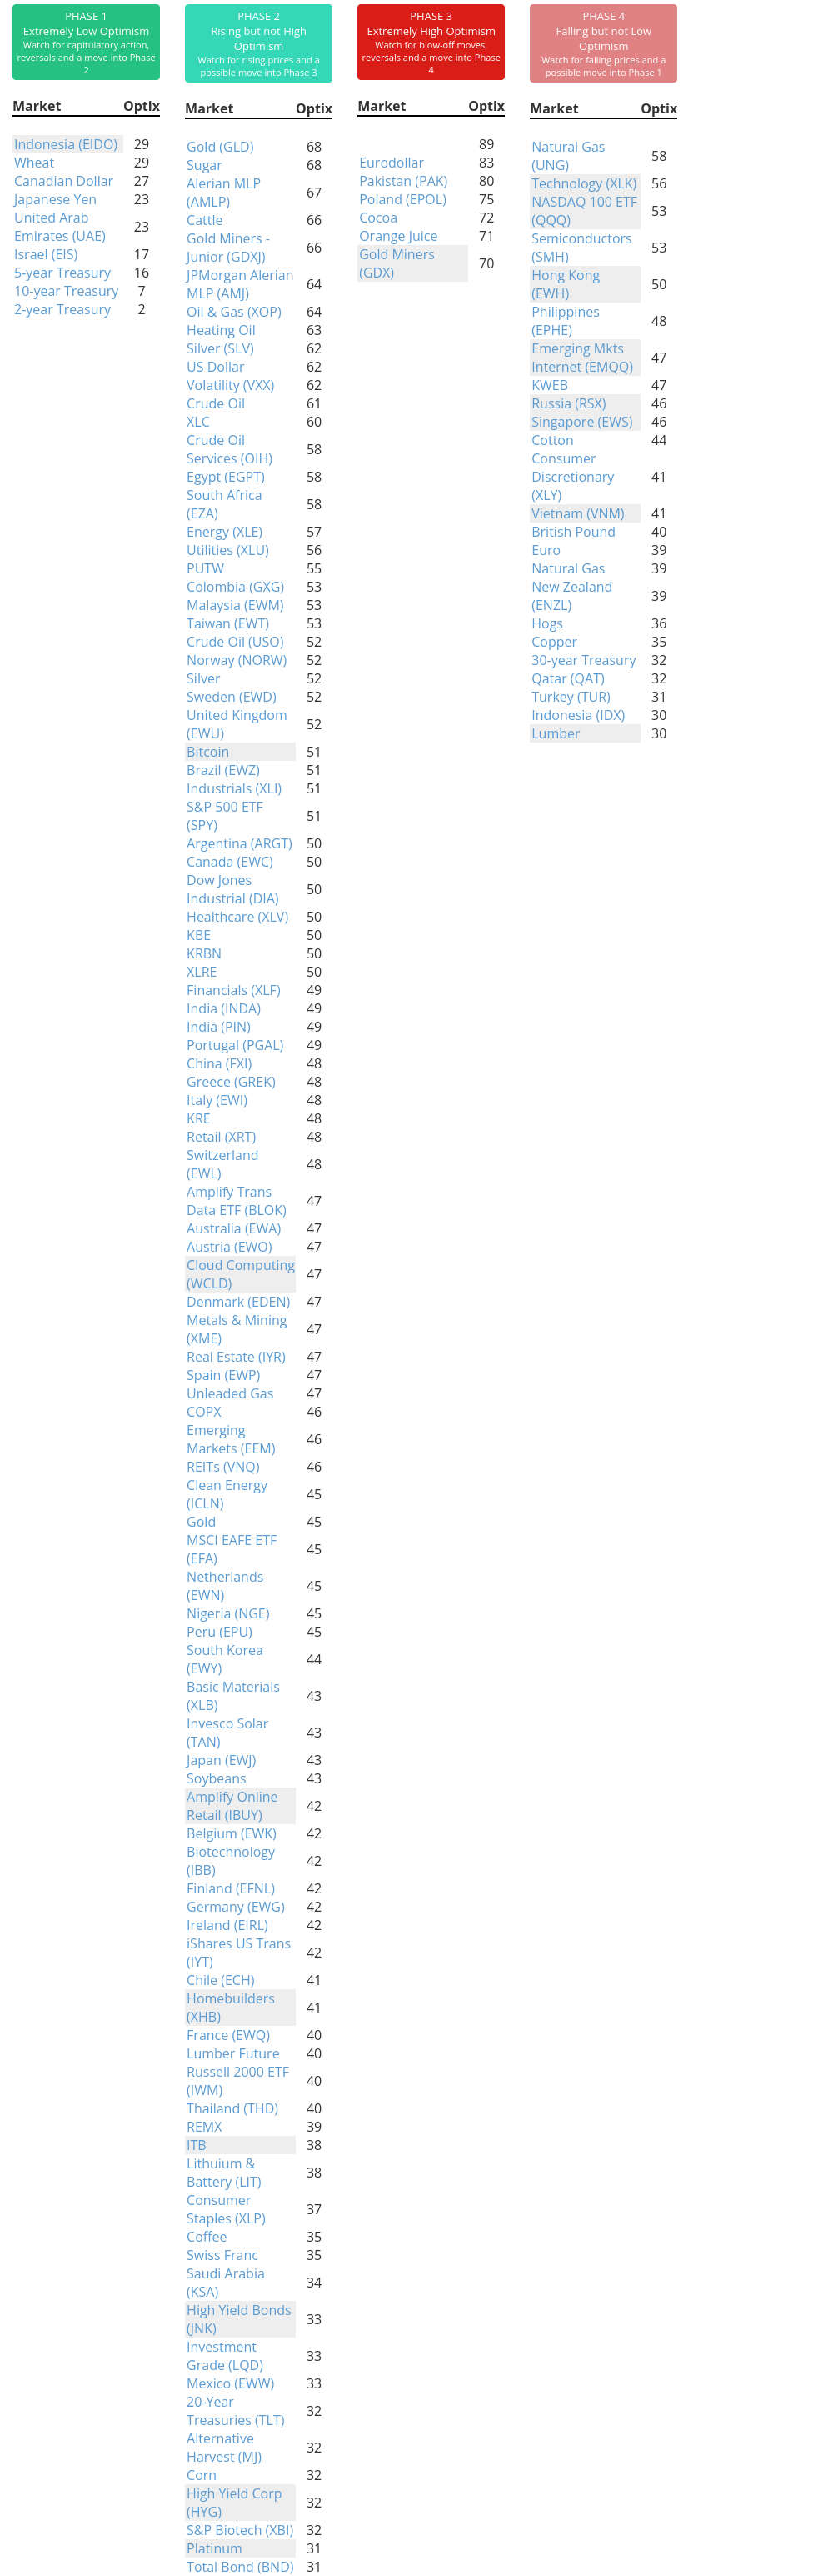
Phase Table
Ranks
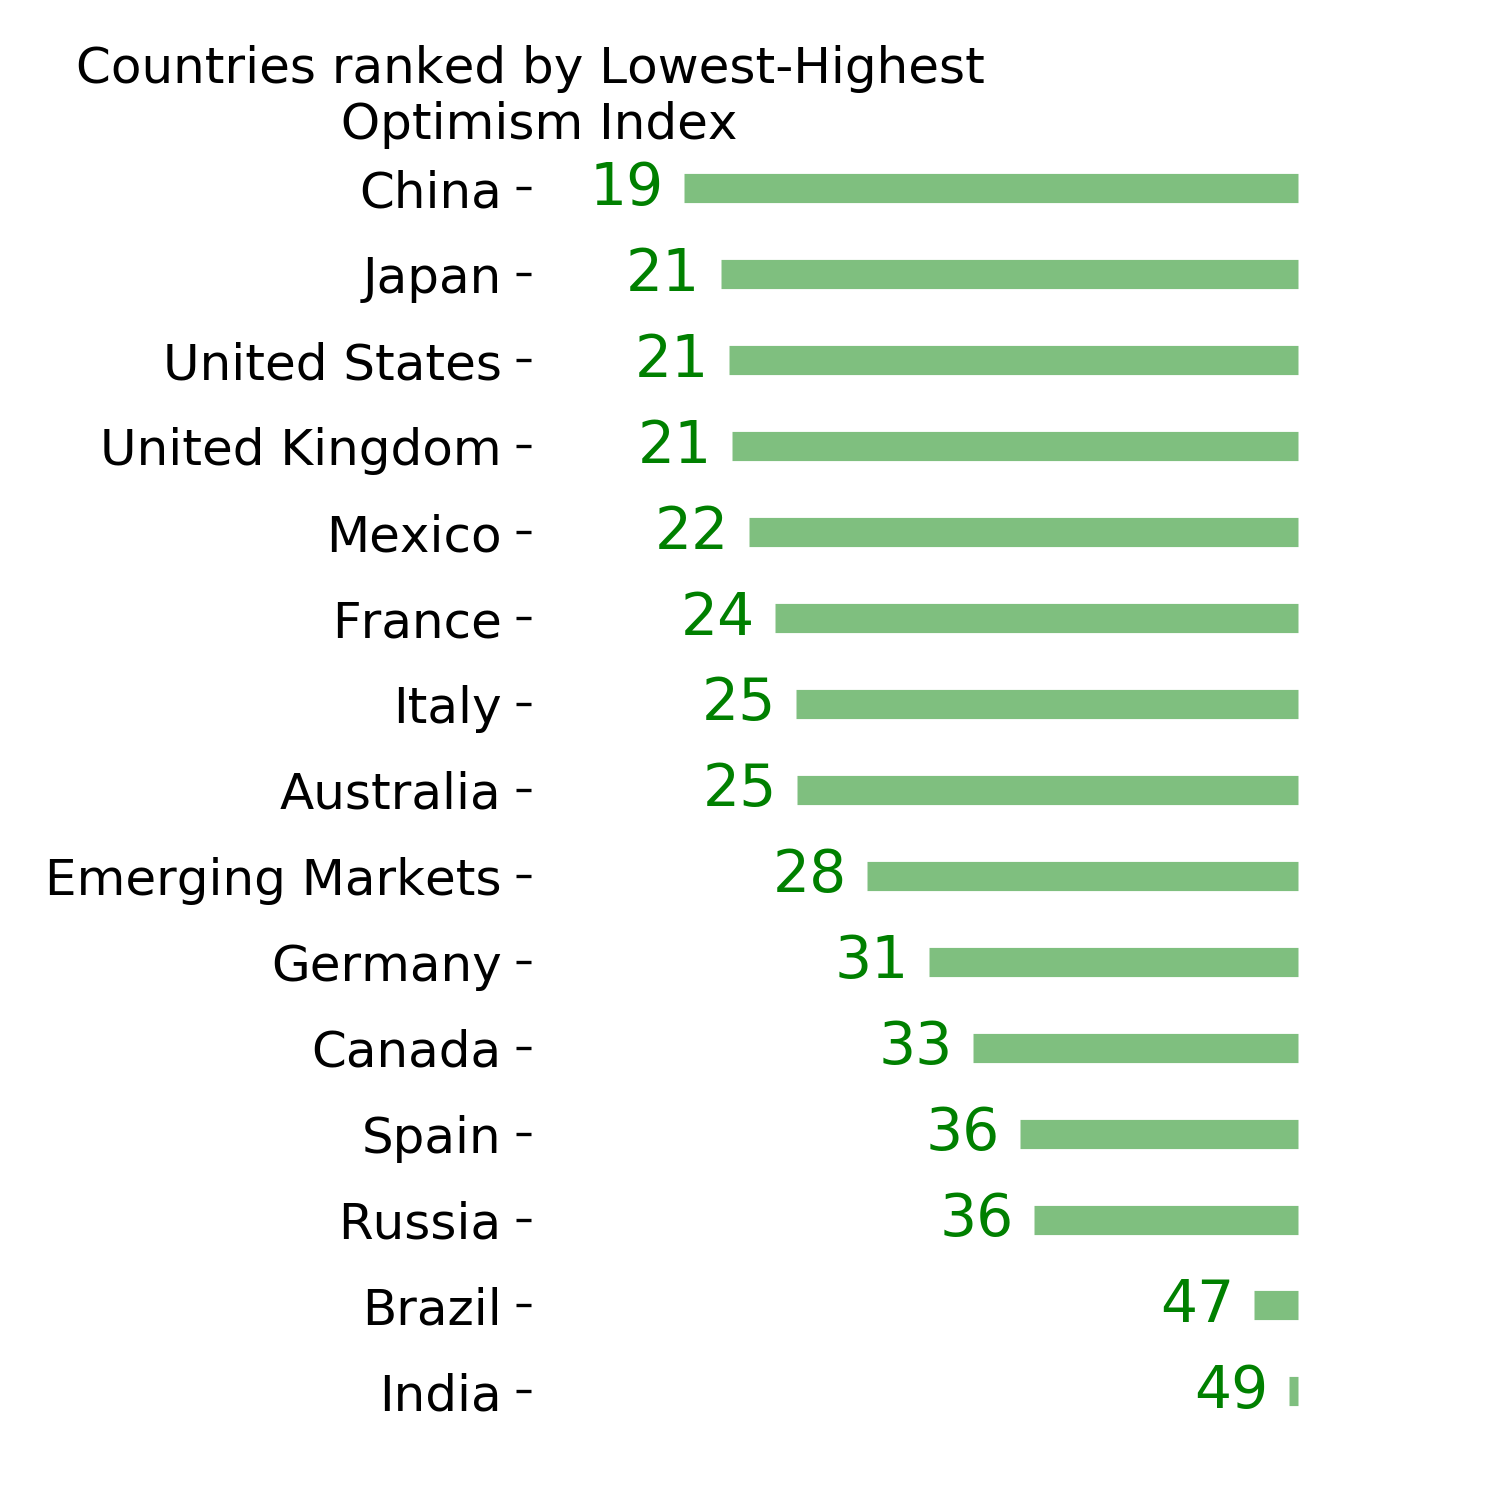
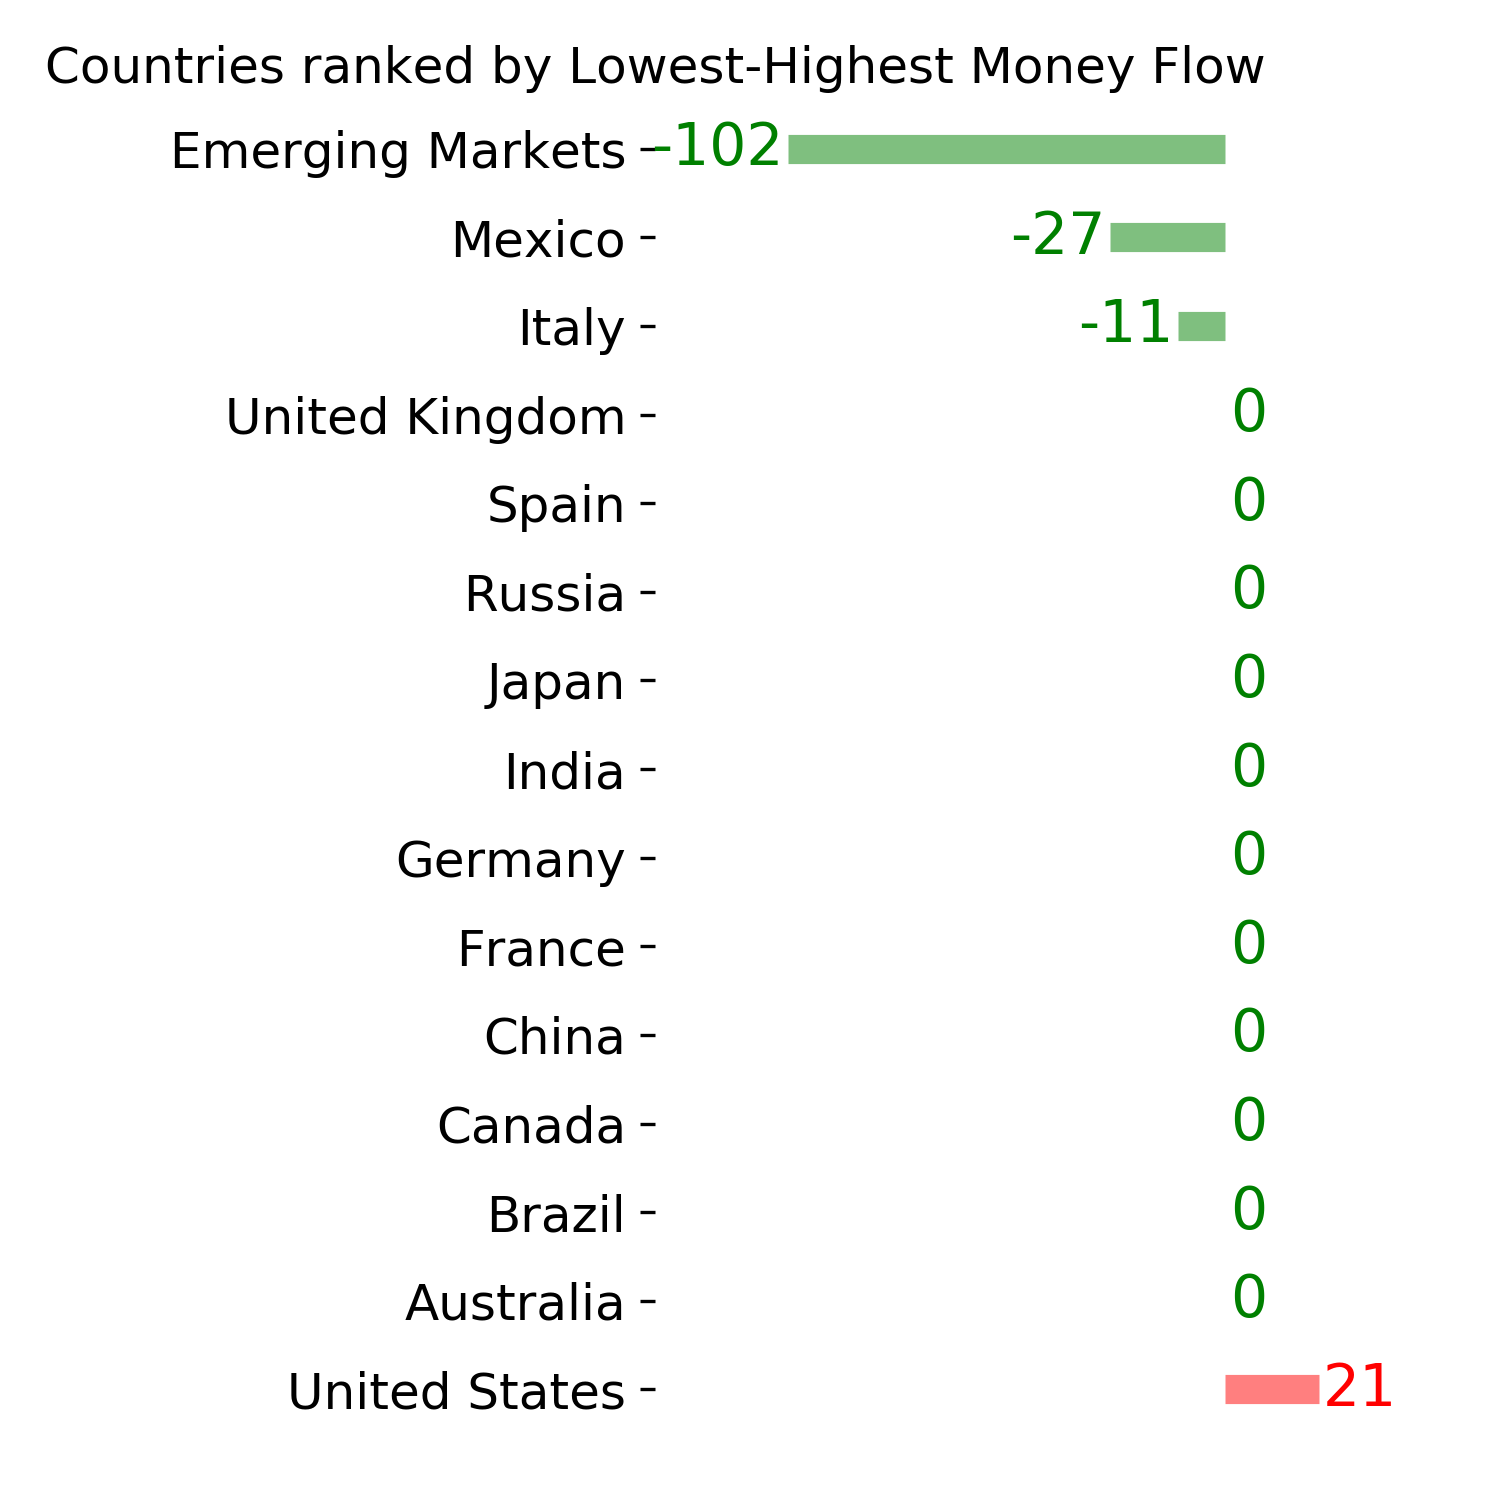
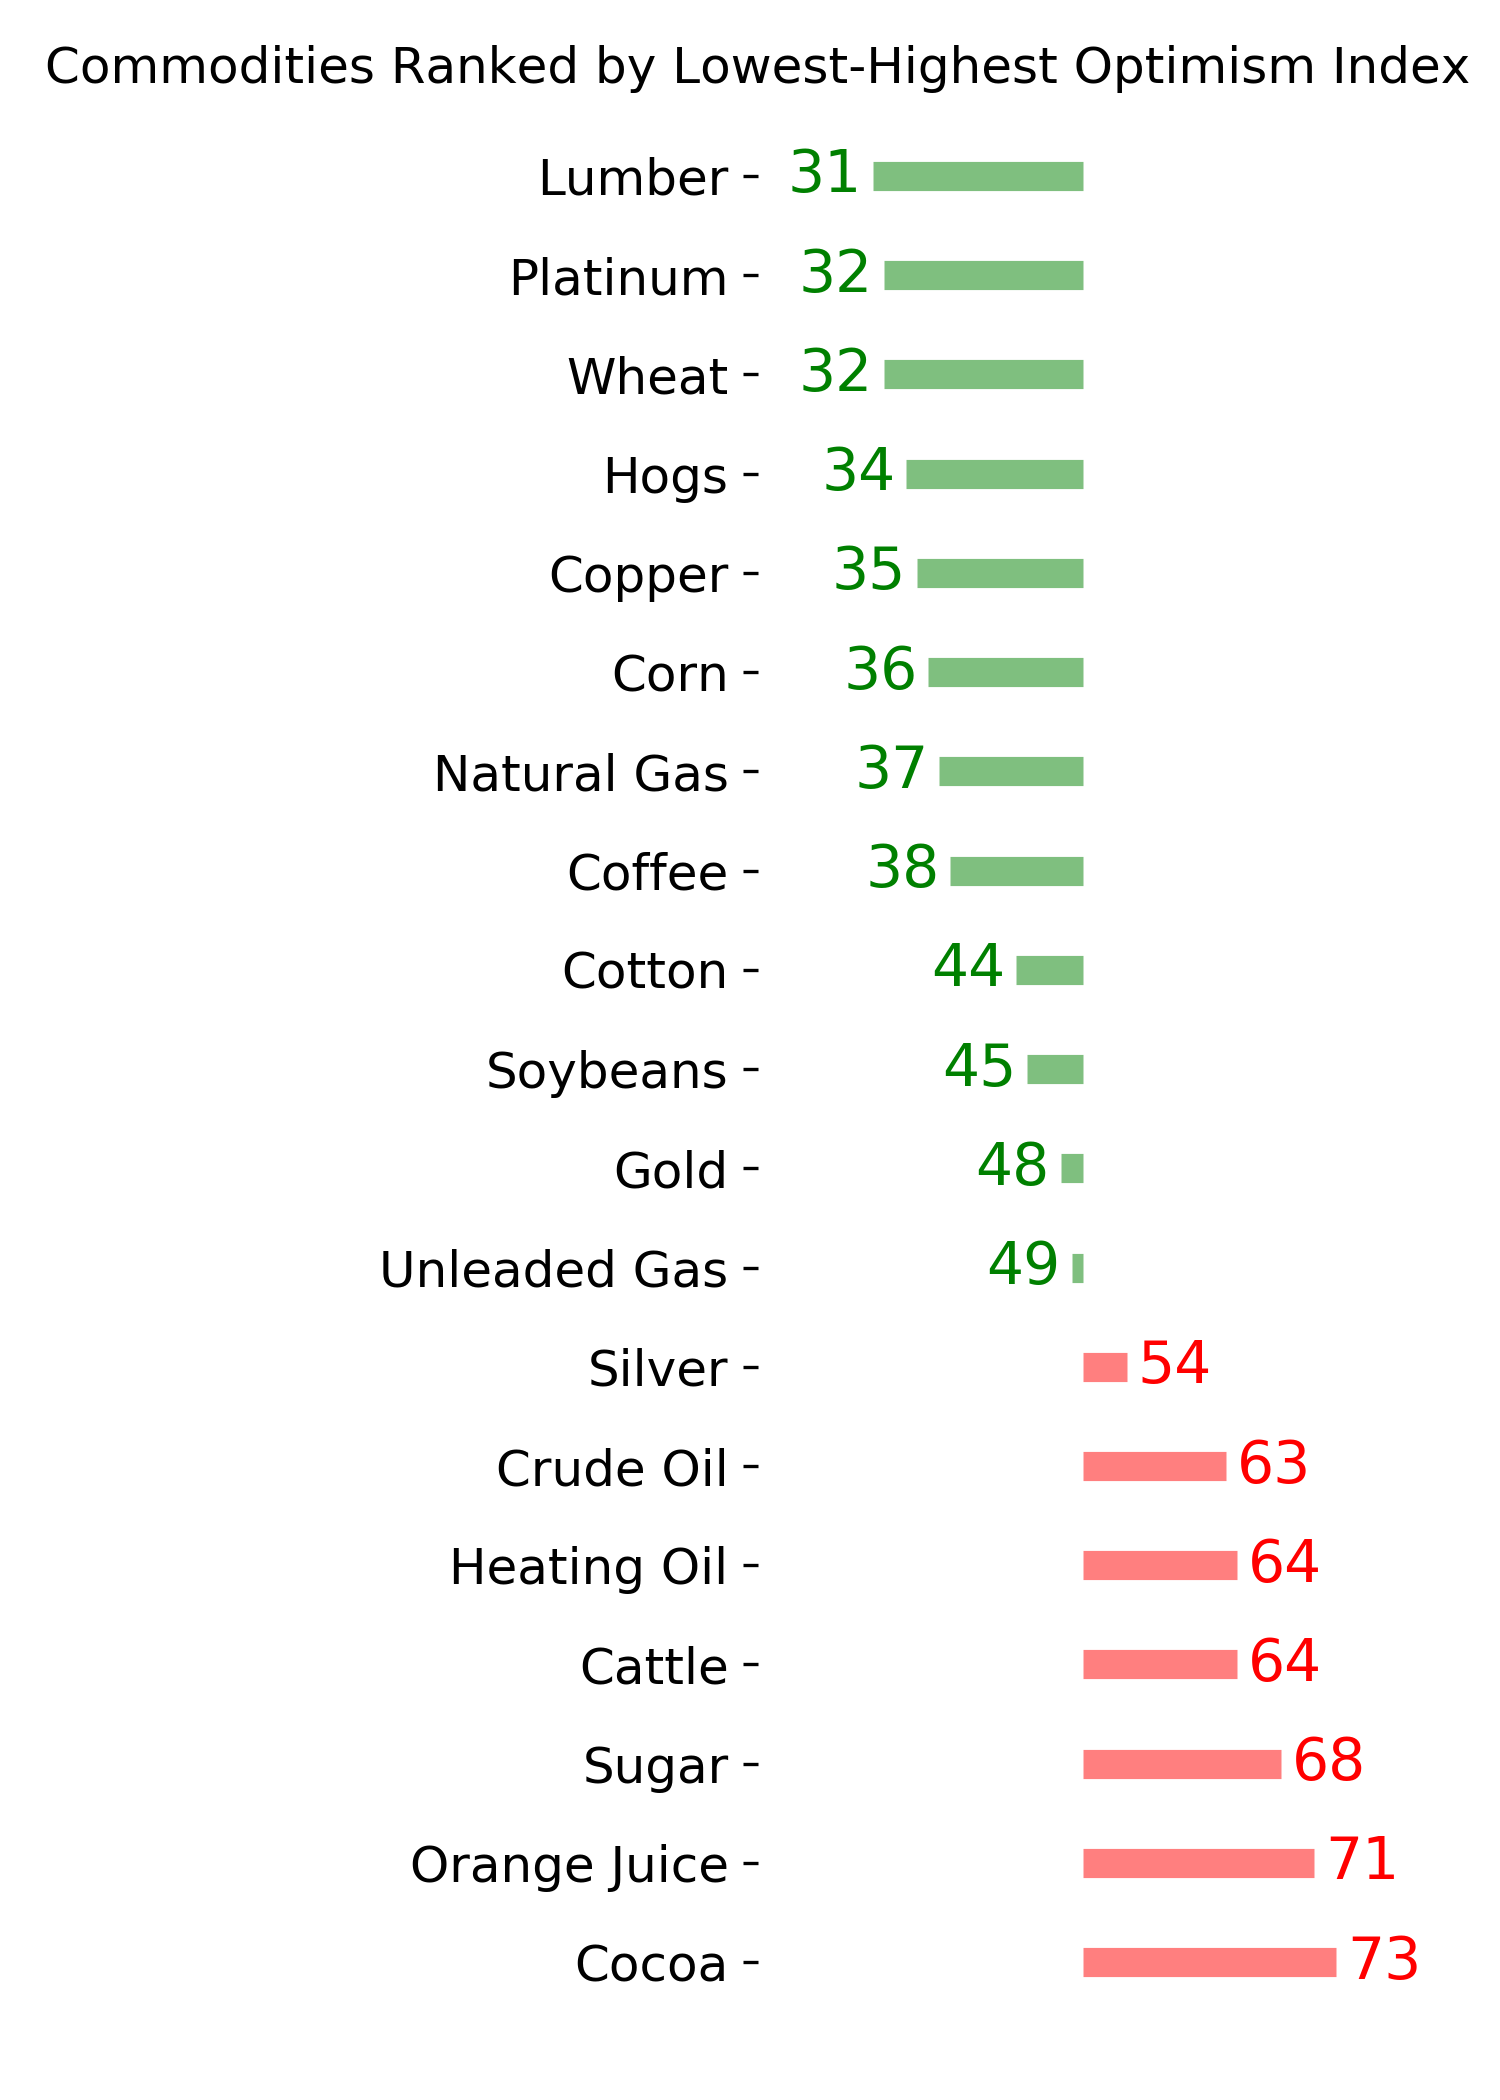
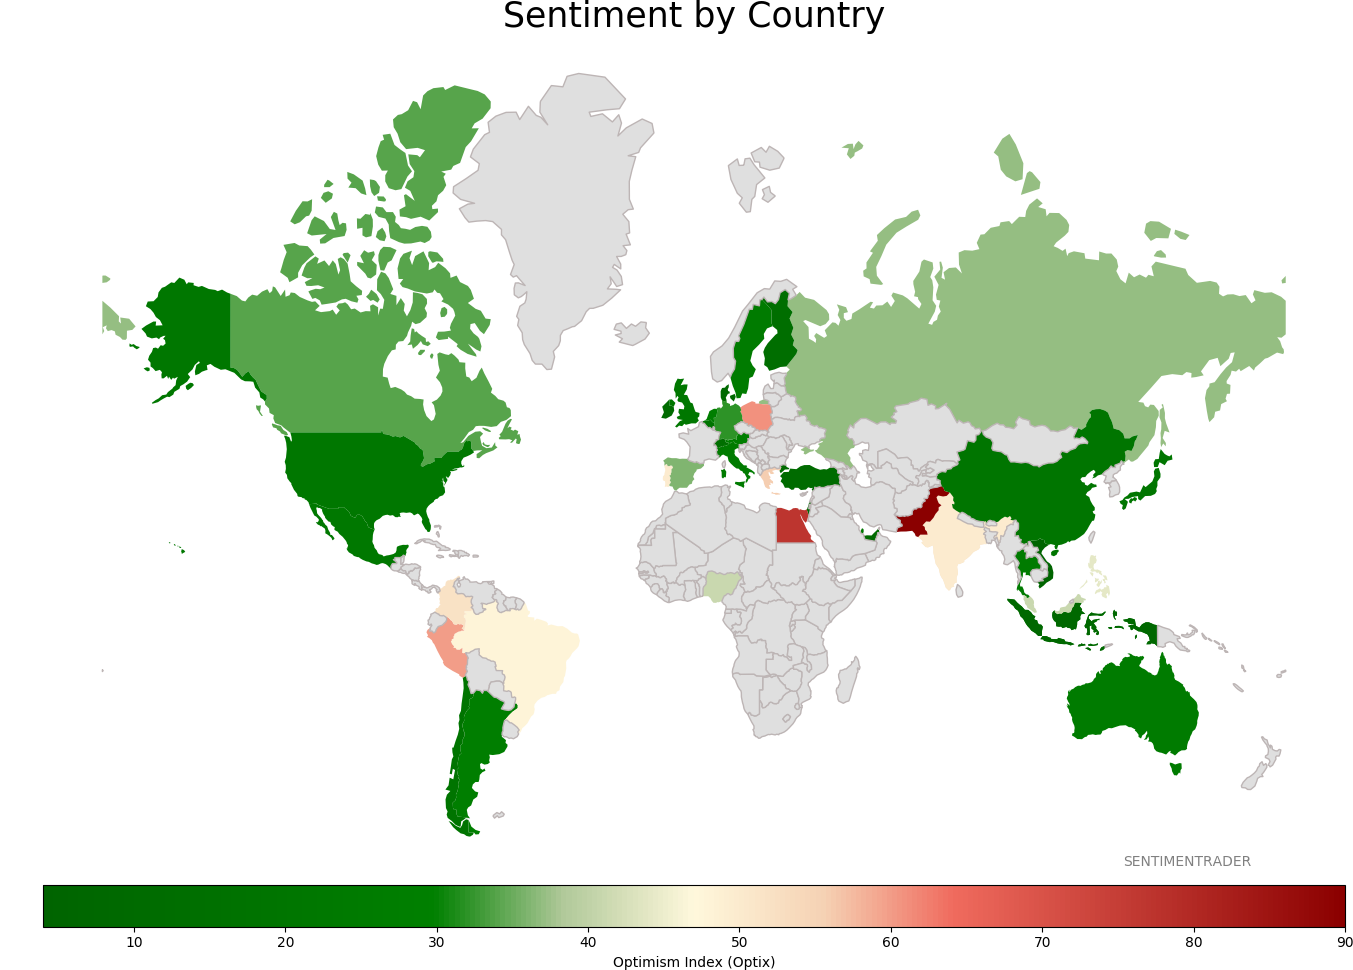
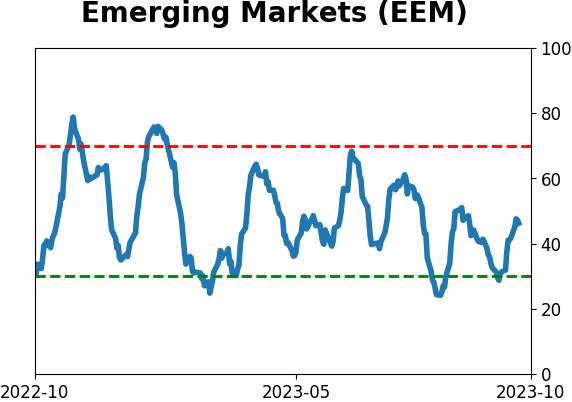
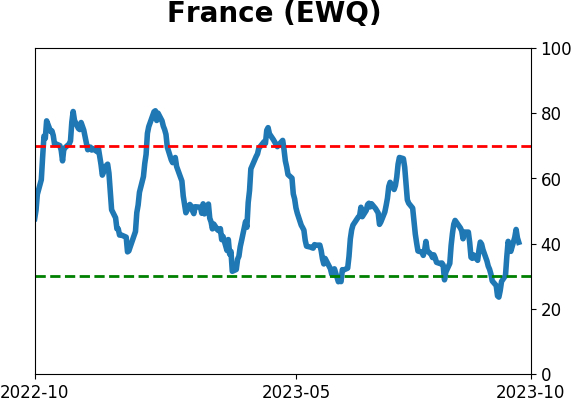
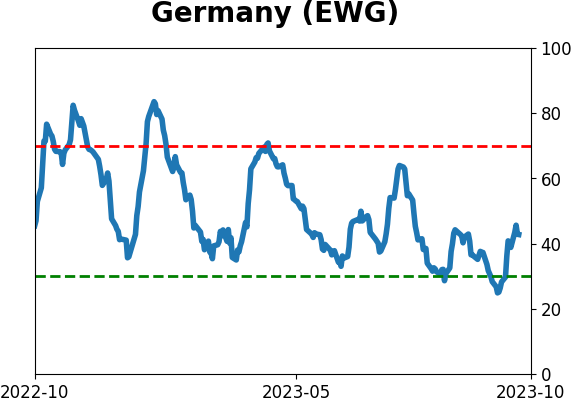
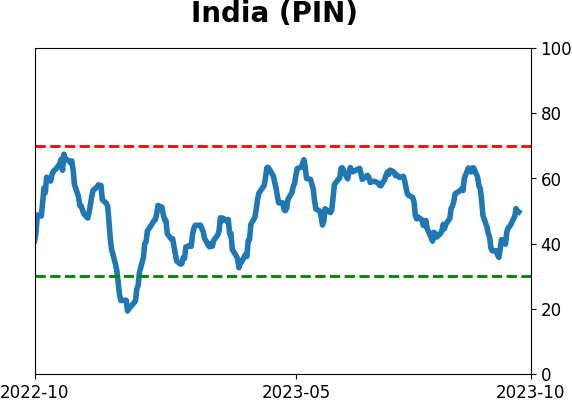
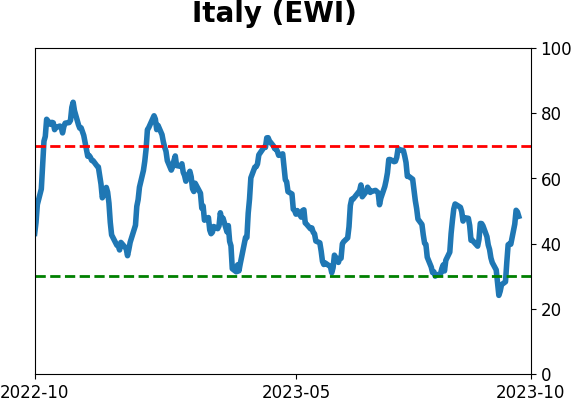
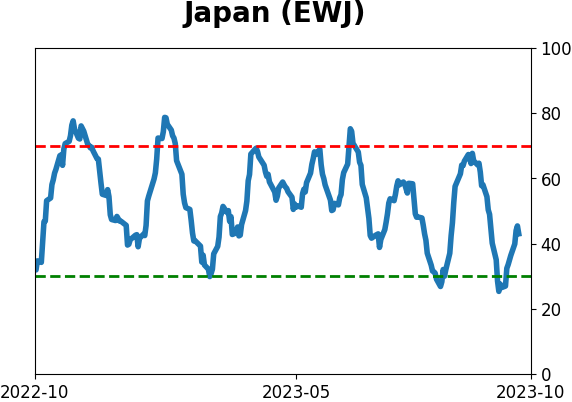
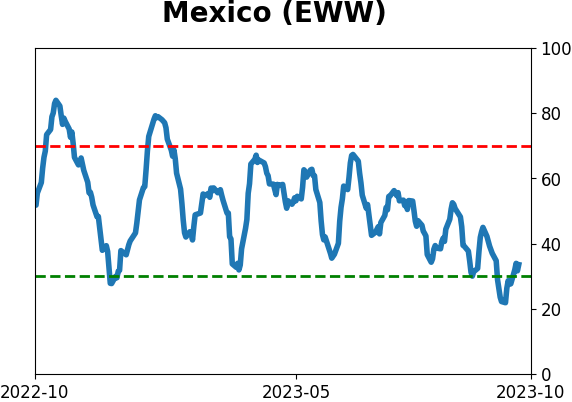
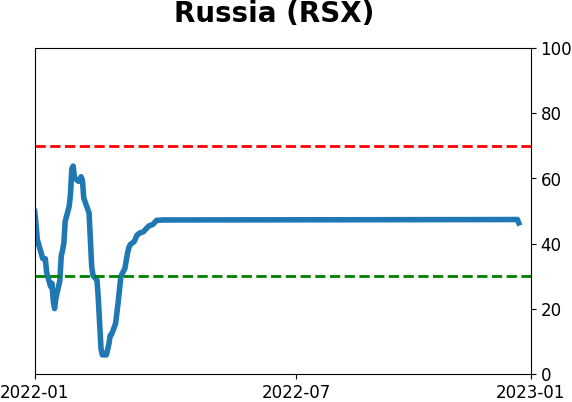
Sentiment Around The World
Optimism Index Thumbnails
|
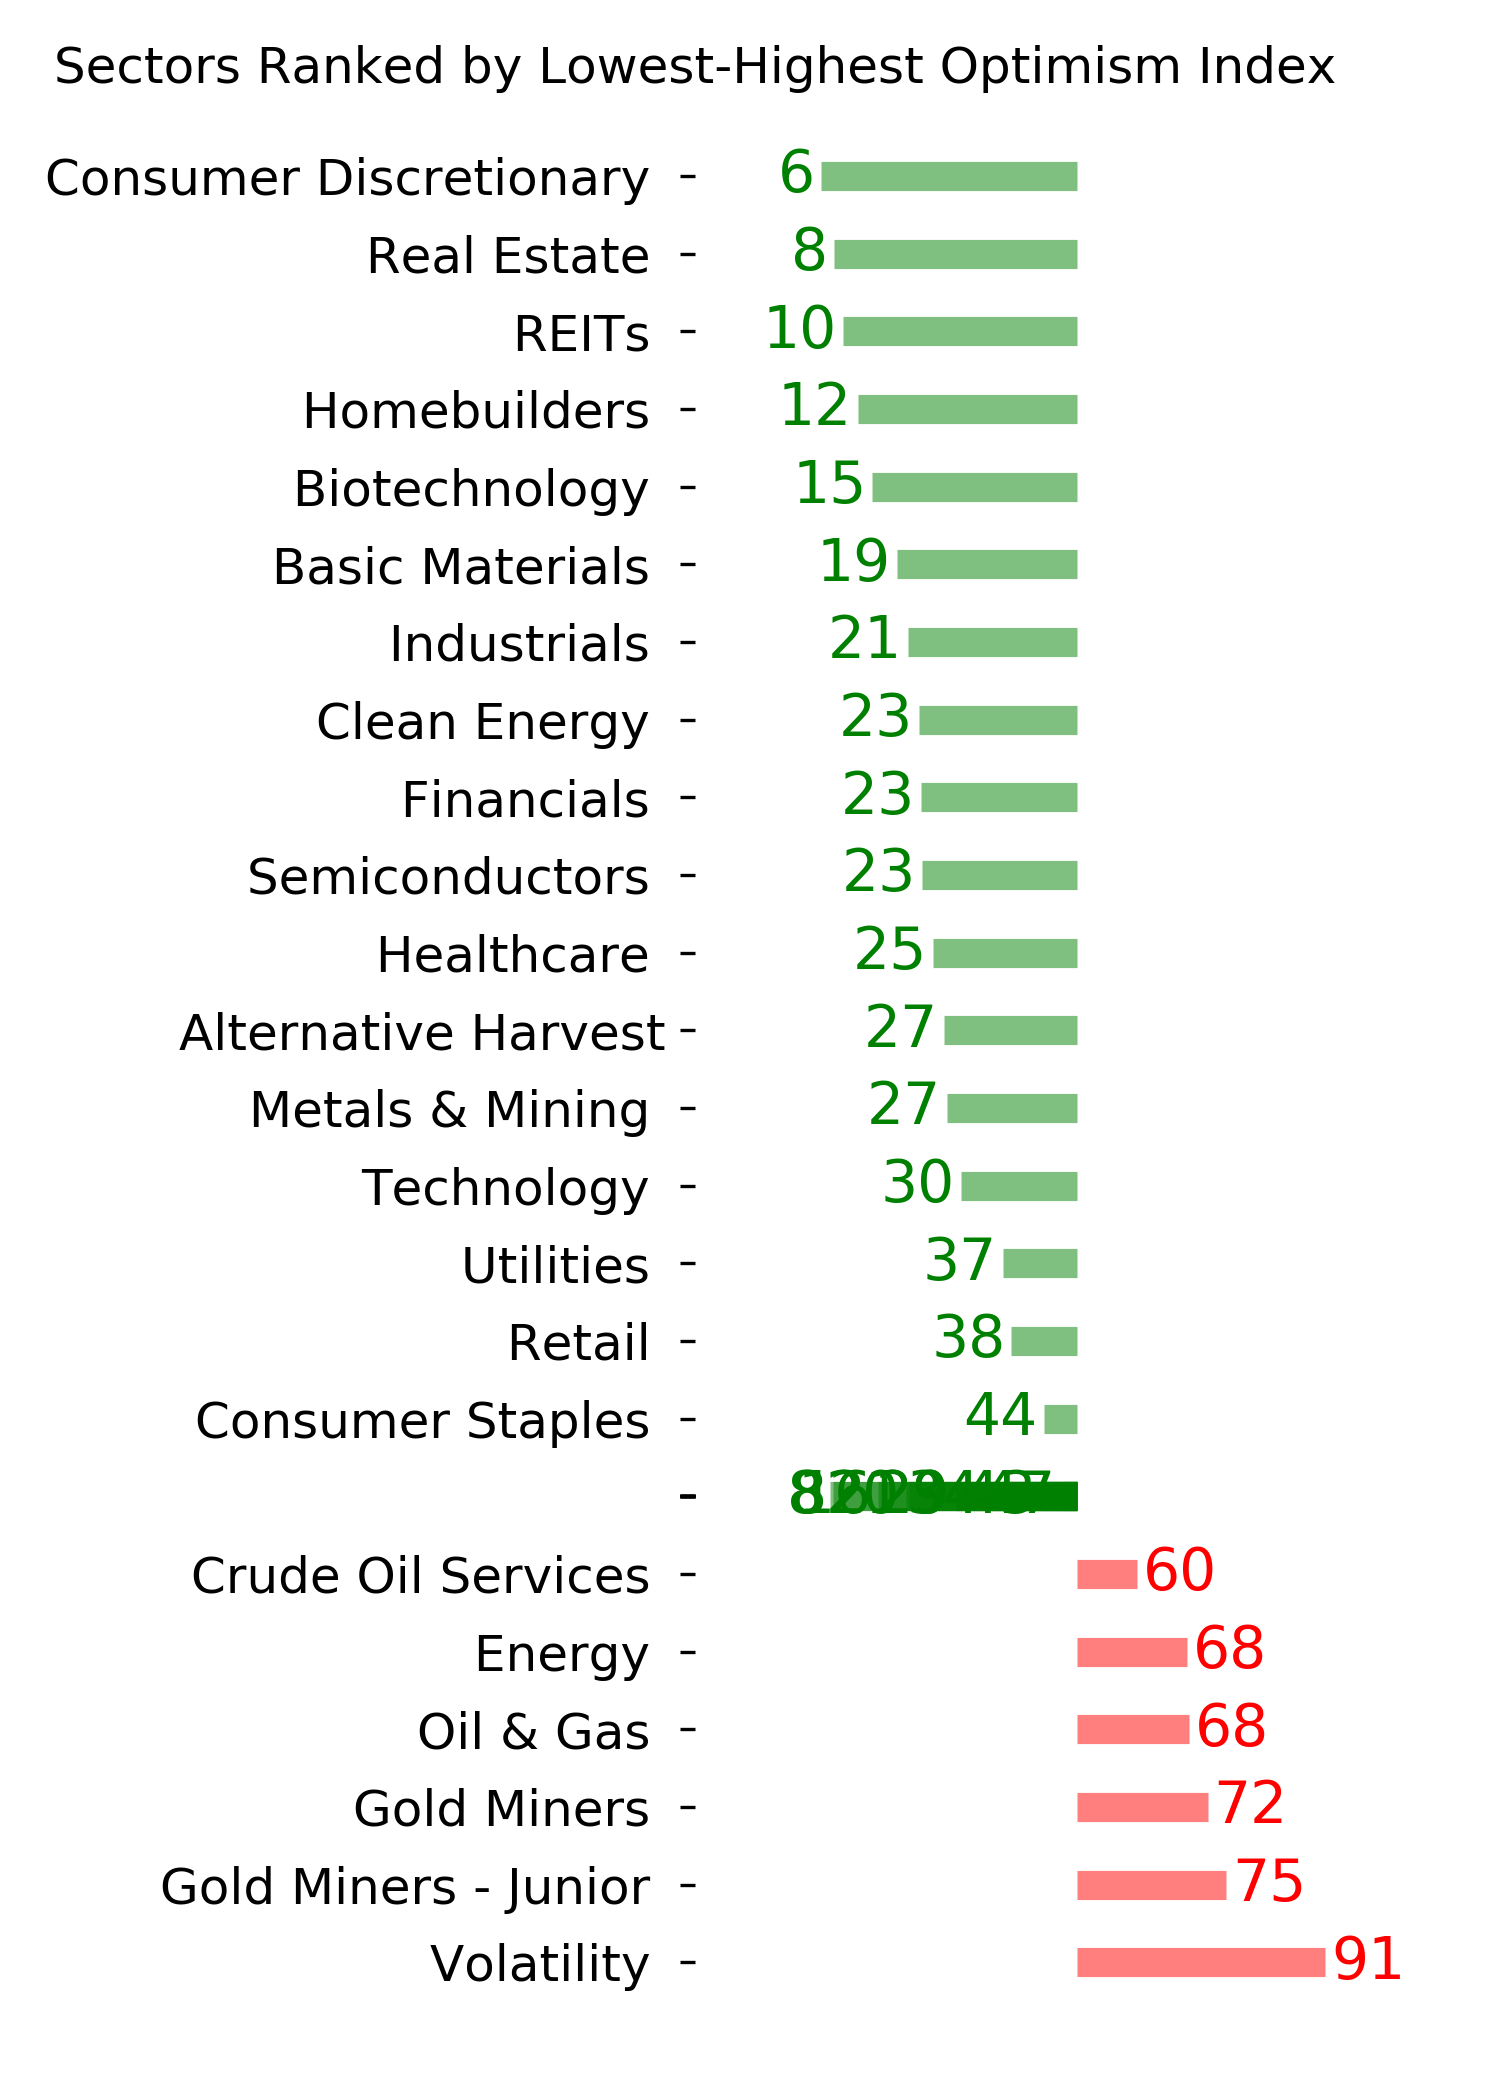
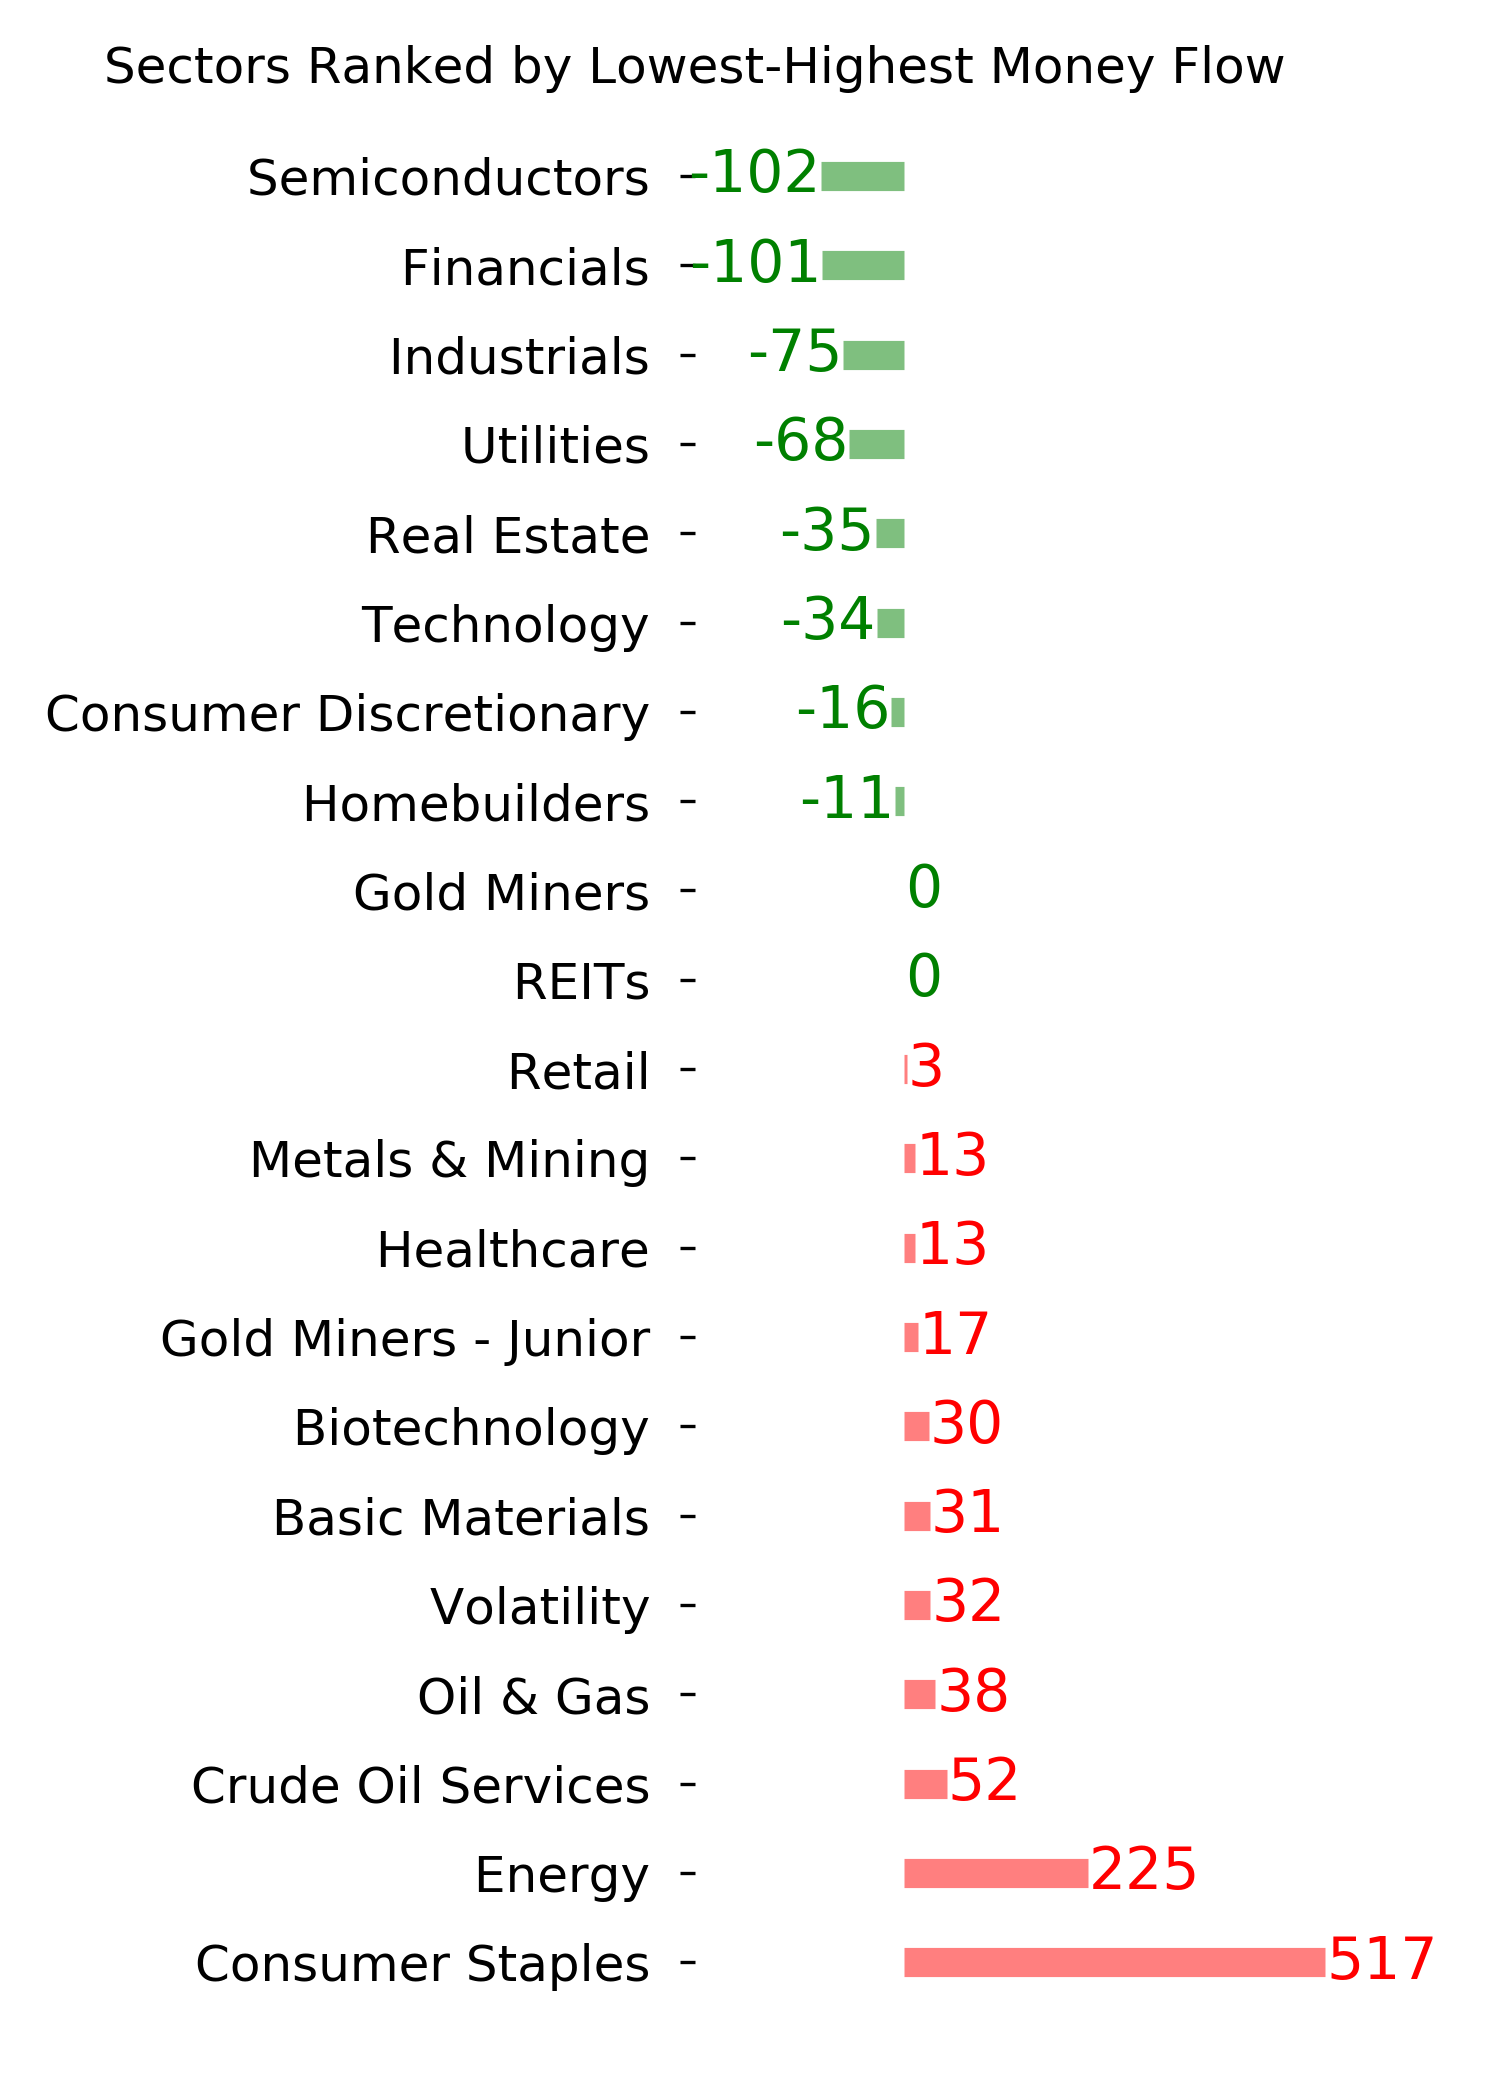
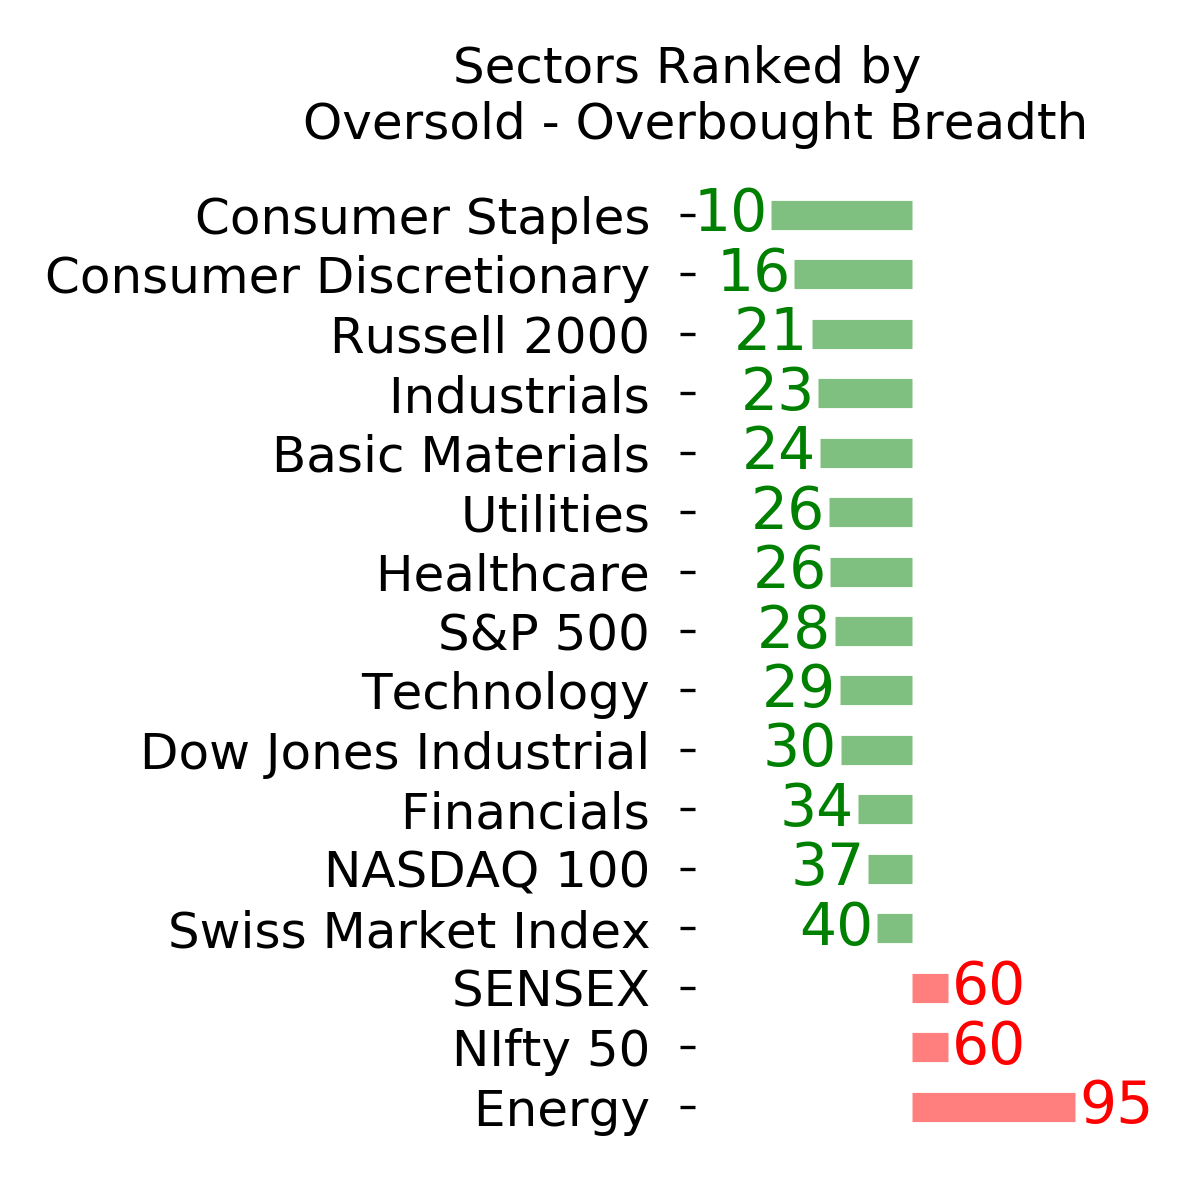
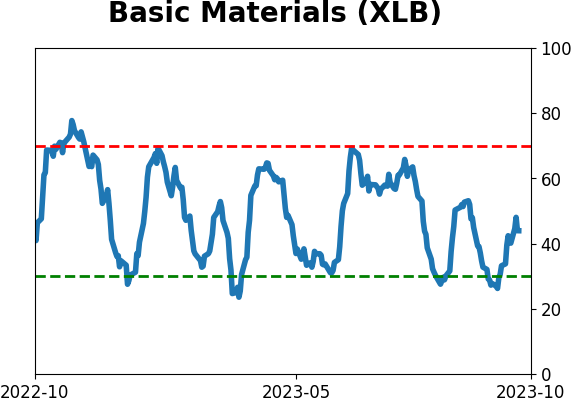
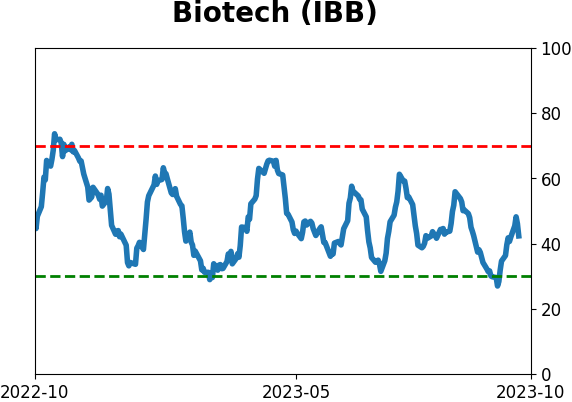
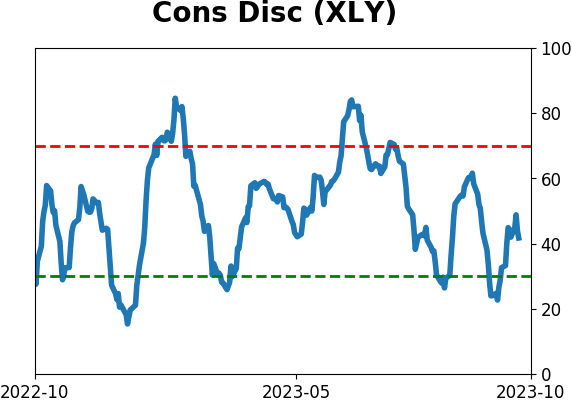
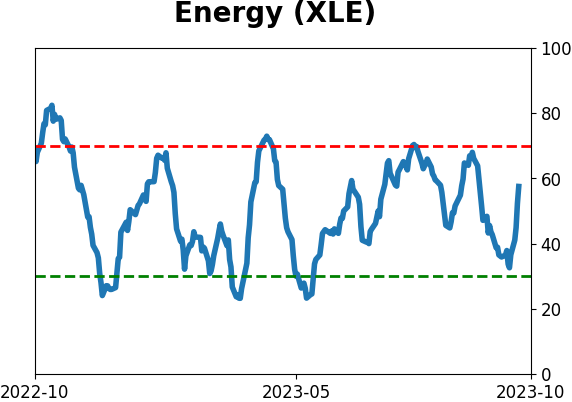
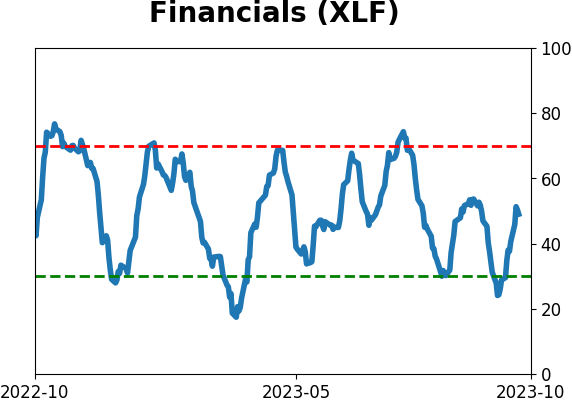
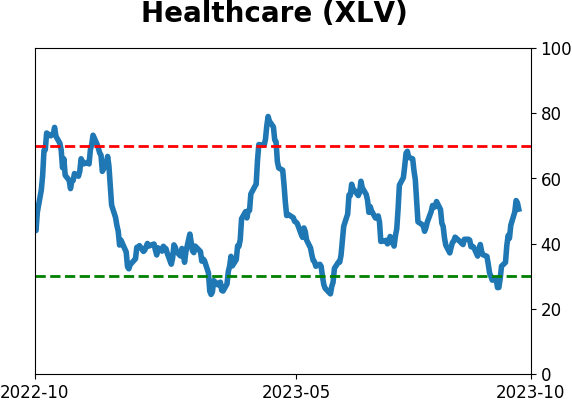
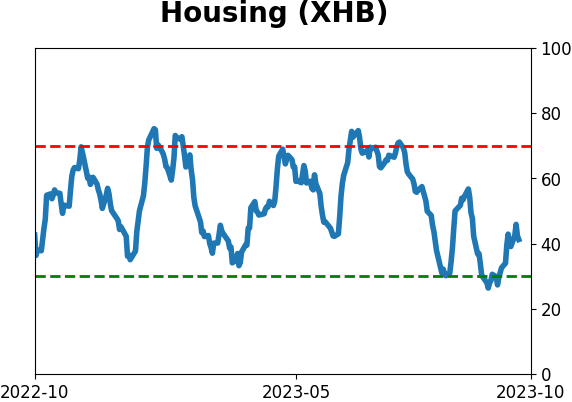
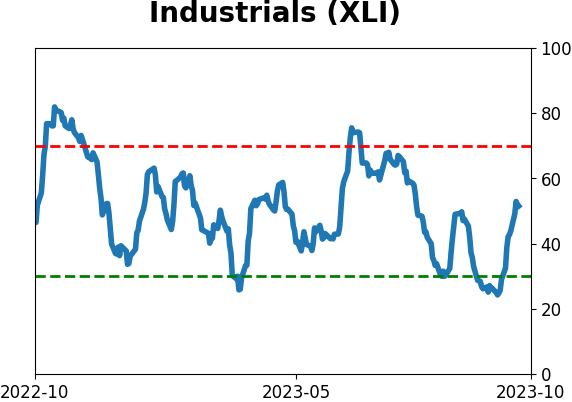
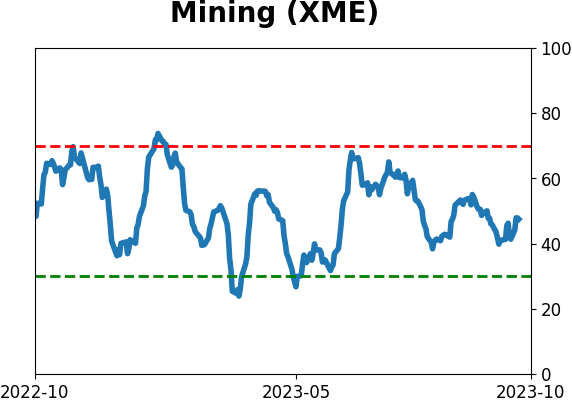
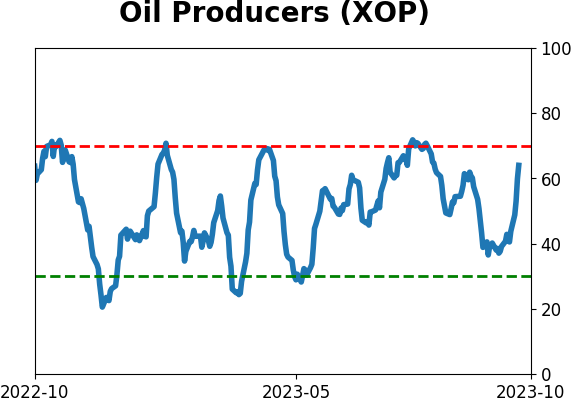
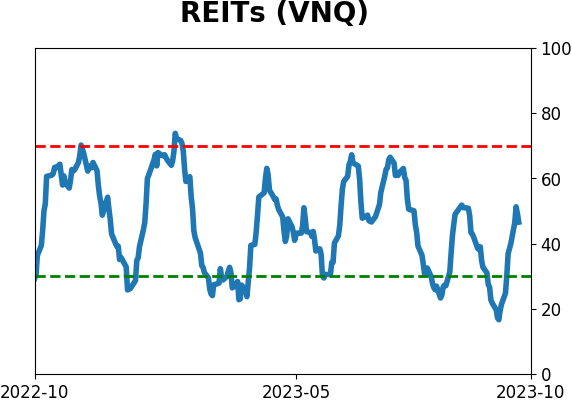
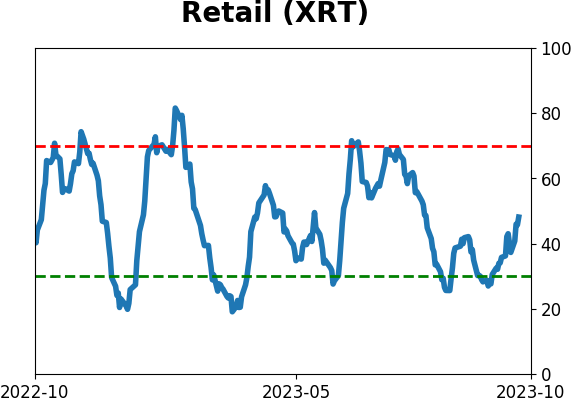
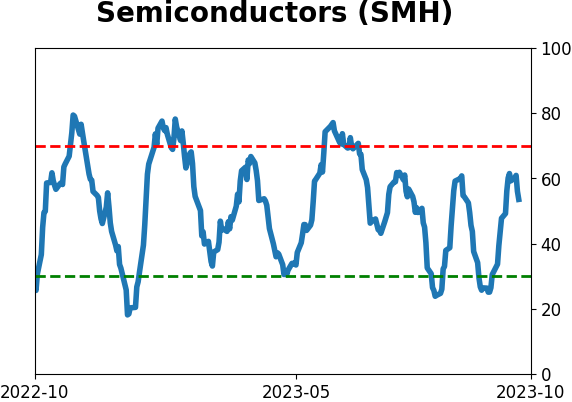
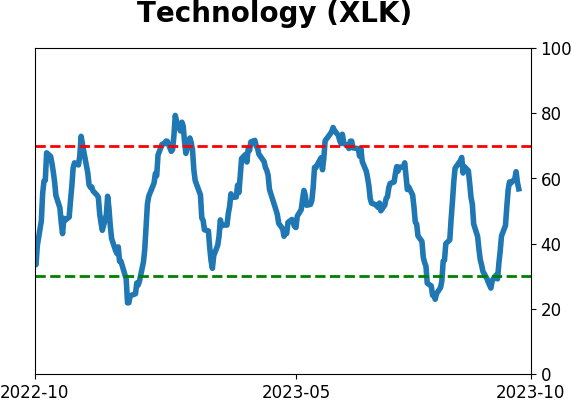
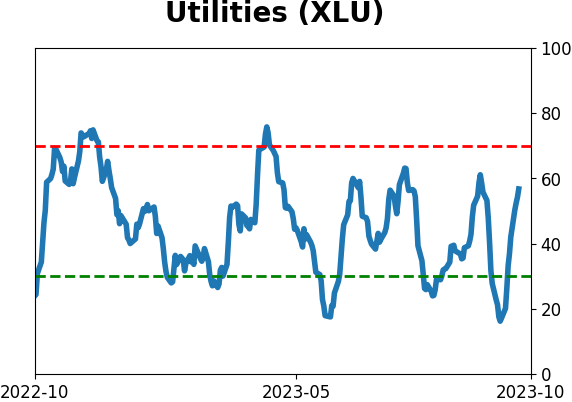
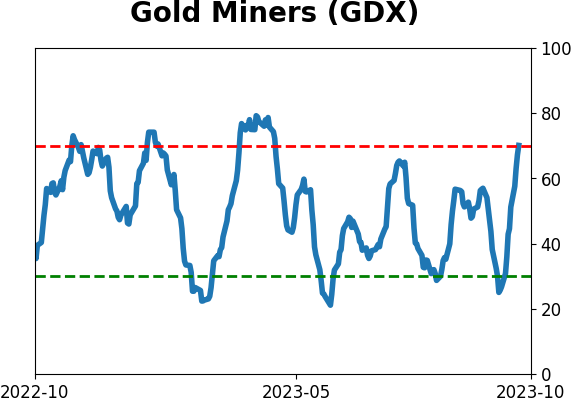
Sector ETF's - 10-Day Moving Average
|
|
|
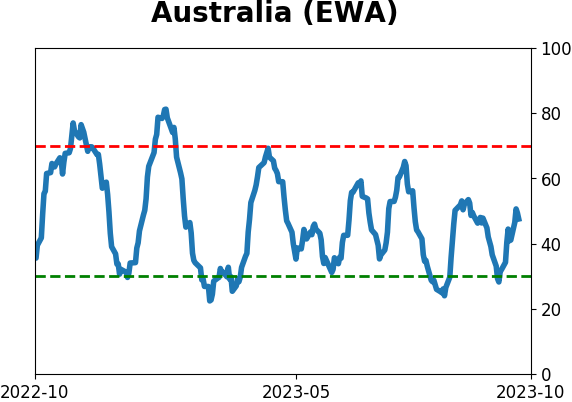
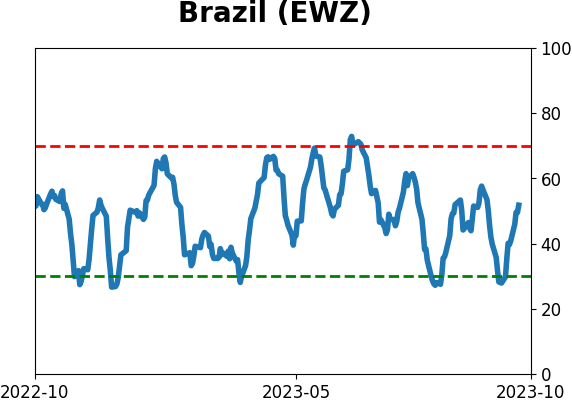
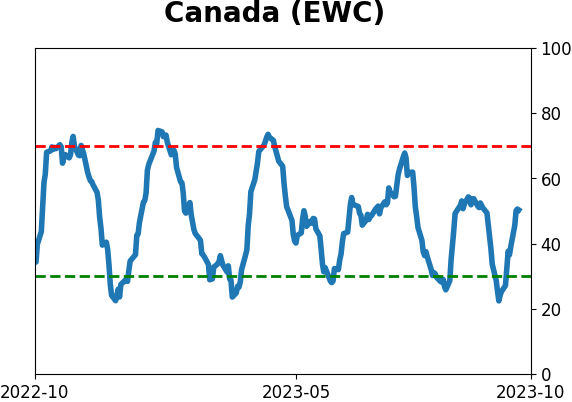
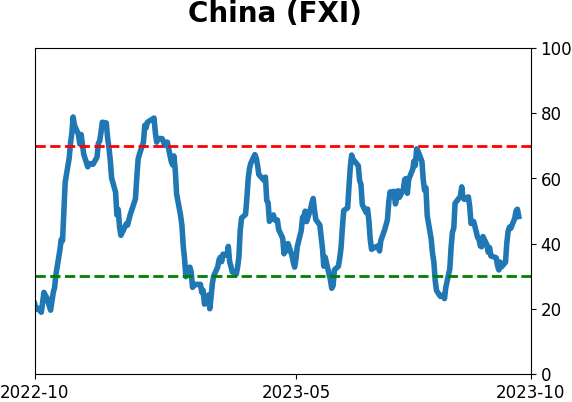
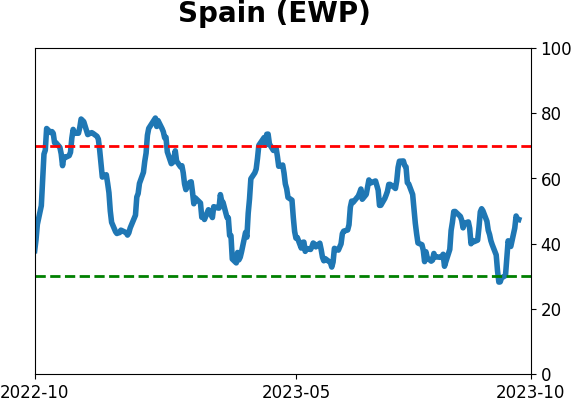
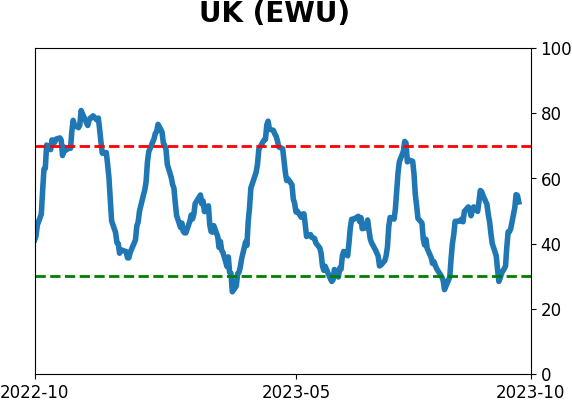
Country ETF's - 10-Day Moving Average
|
|
|
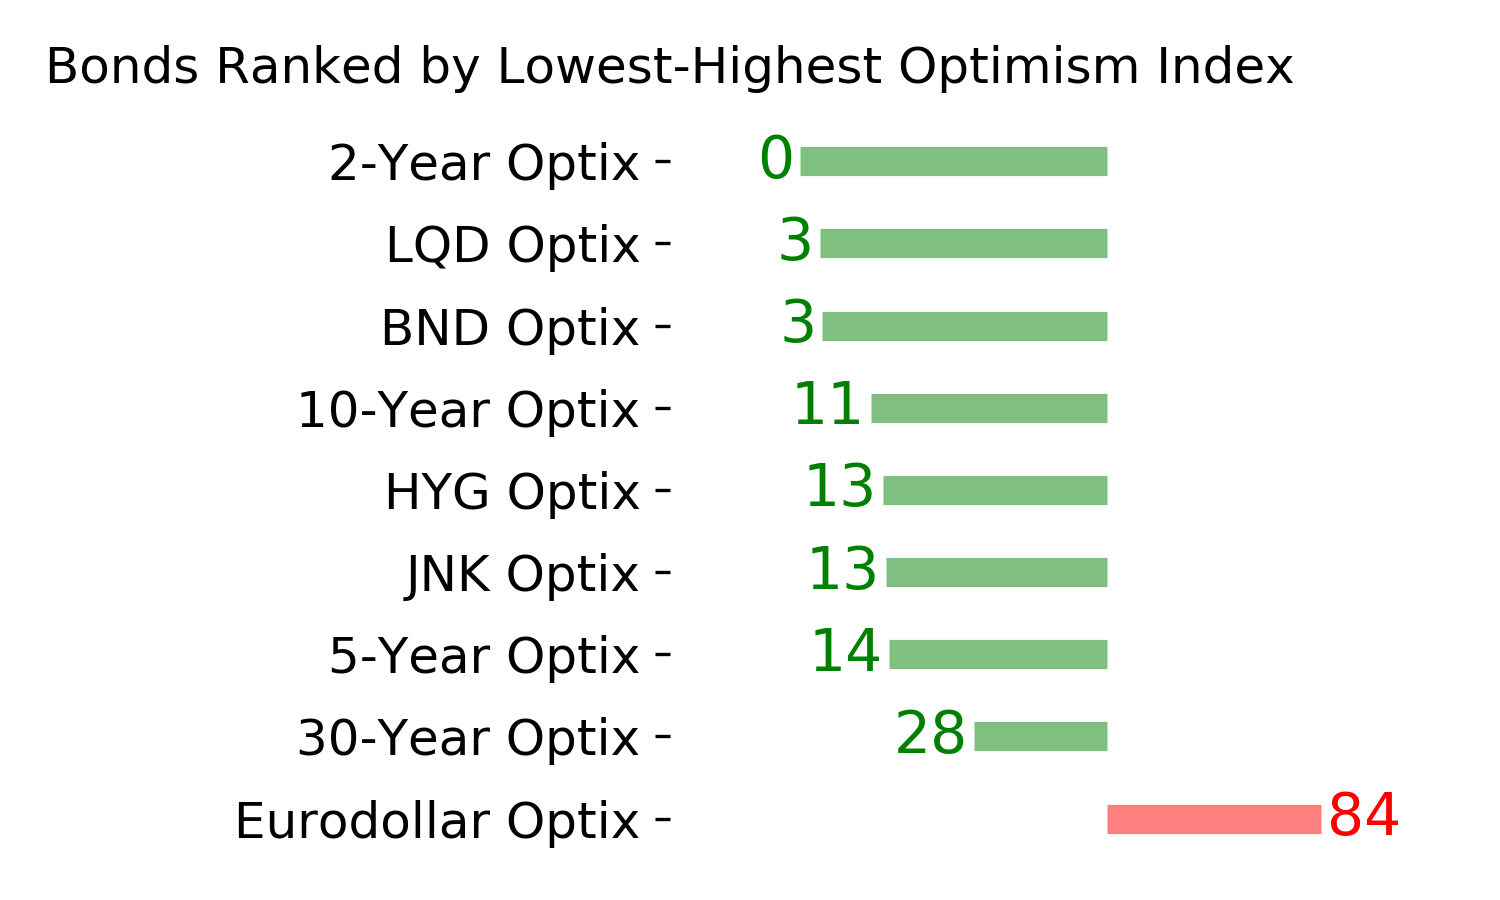
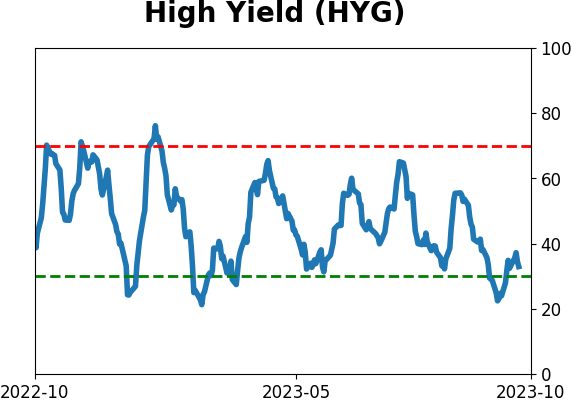
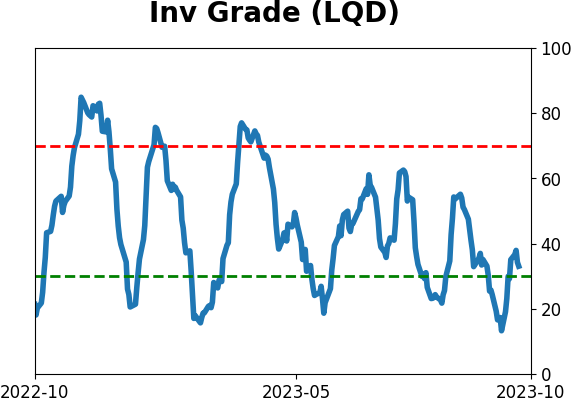
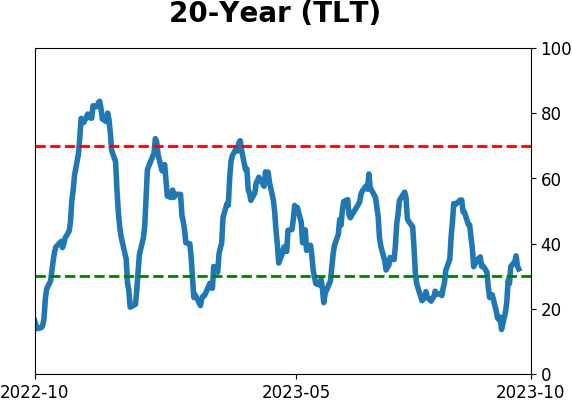
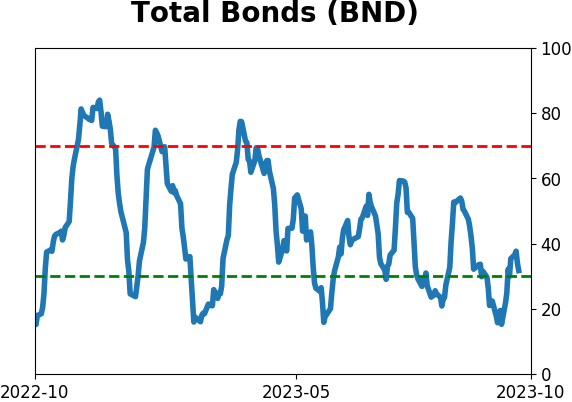
Bond ETF's - 10-Day Moving Average
|
|
|
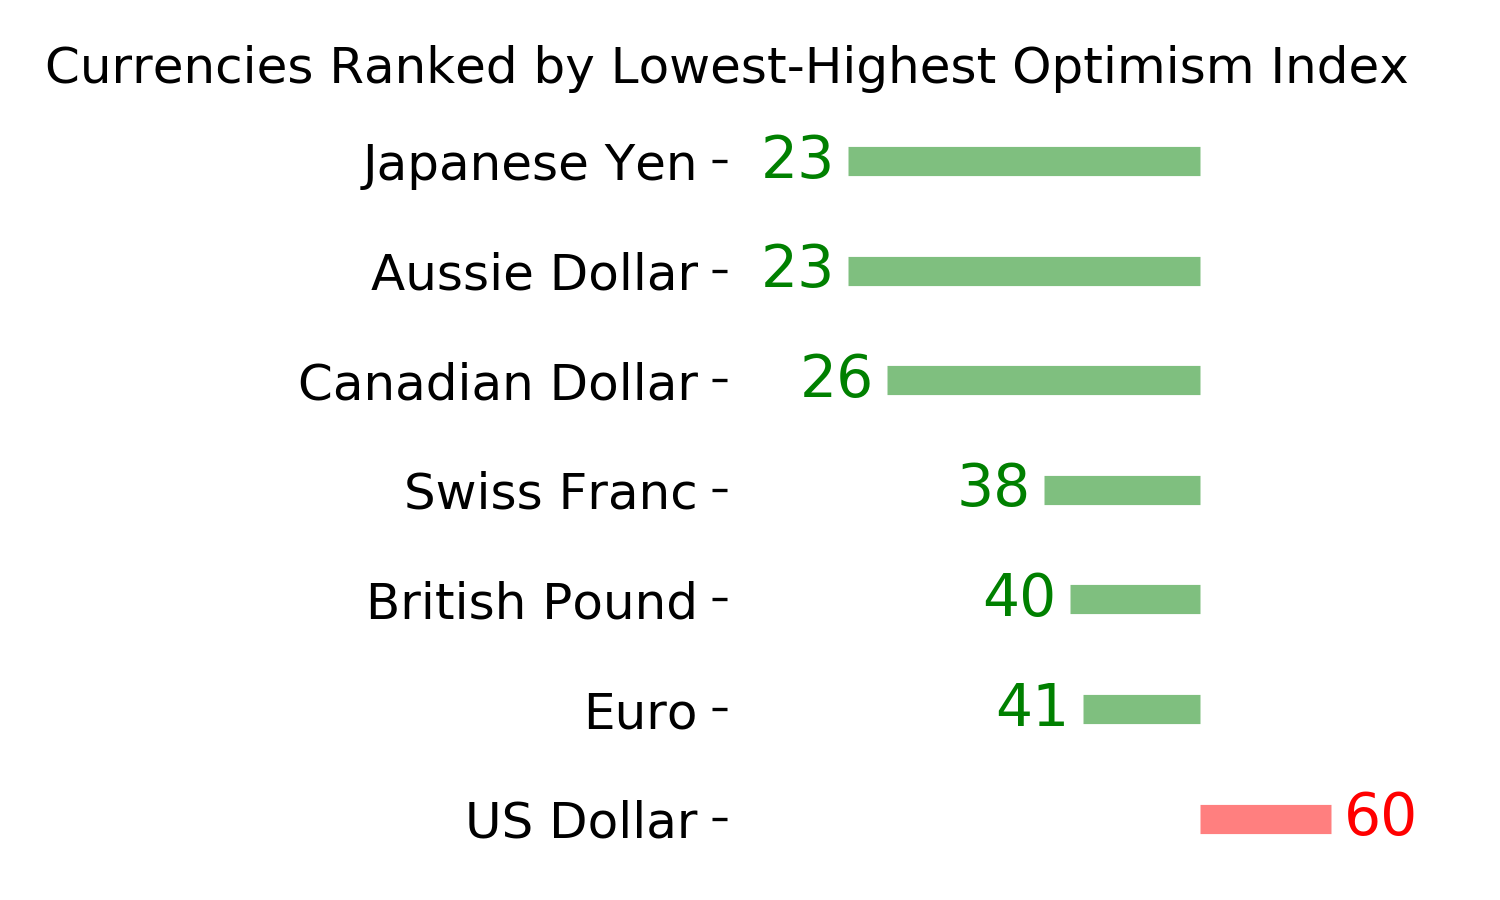
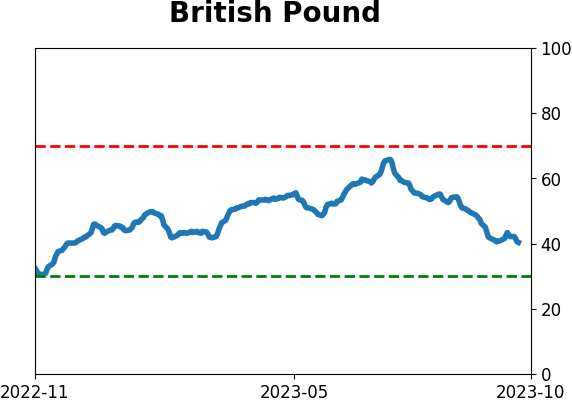
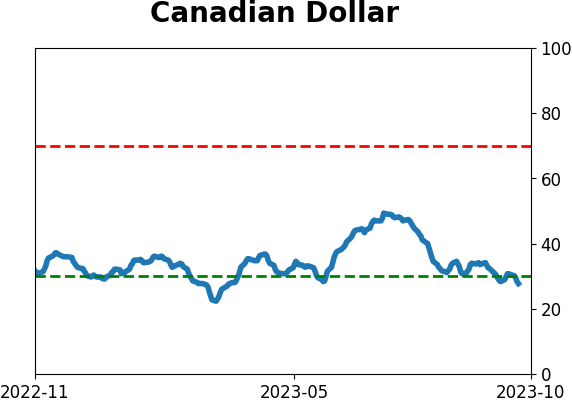
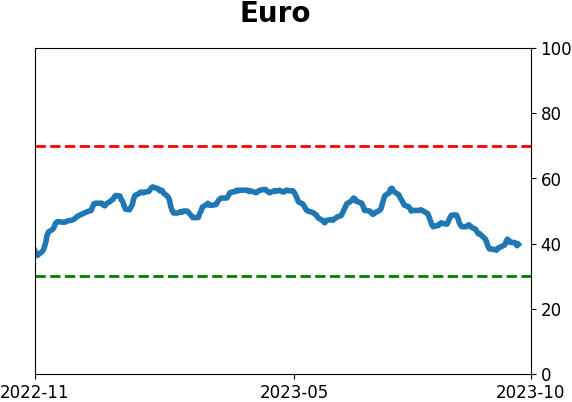
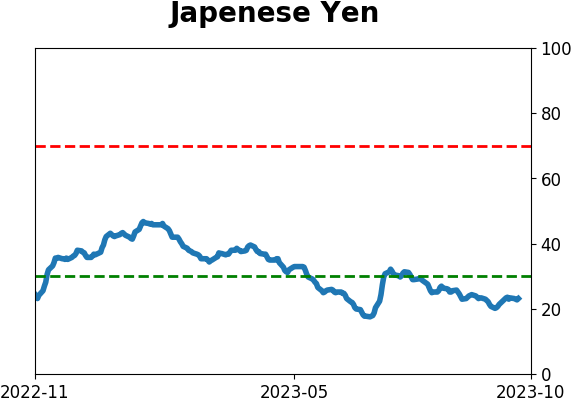
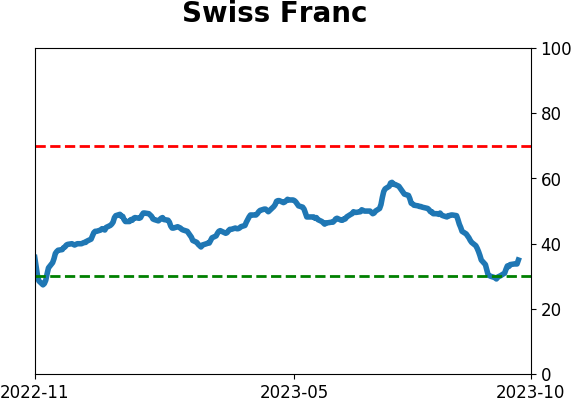
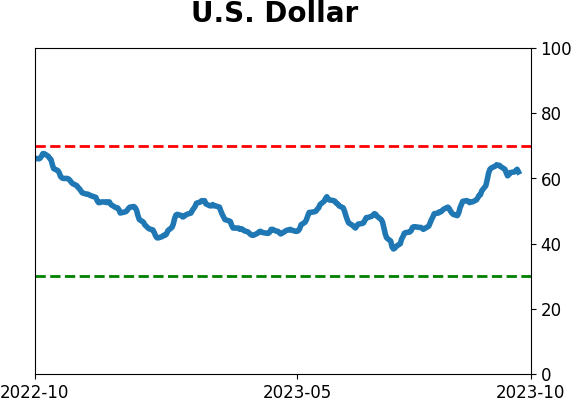
Currency ETF's - 5-Day Moving Average
|
|
|
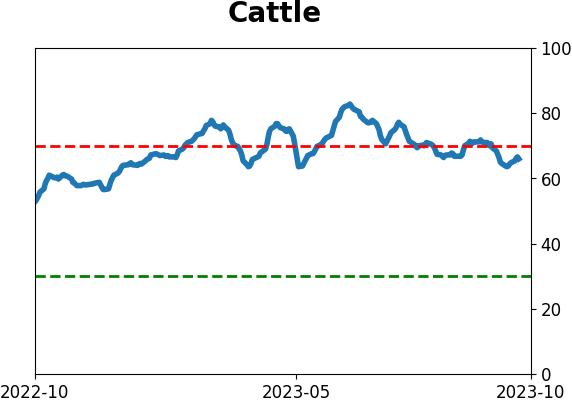
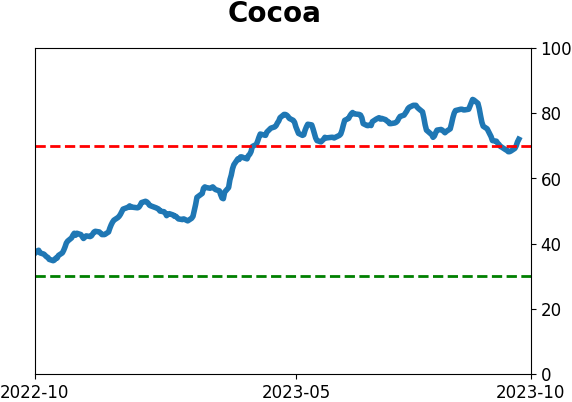
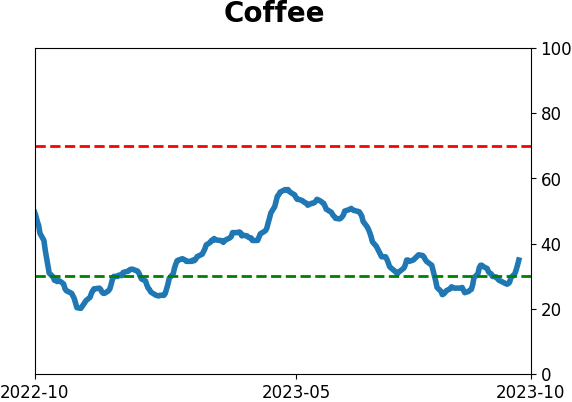
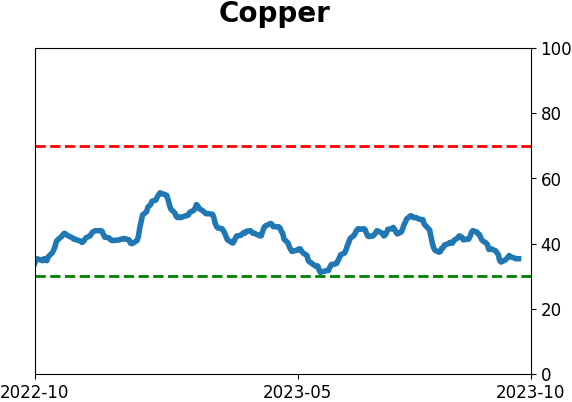
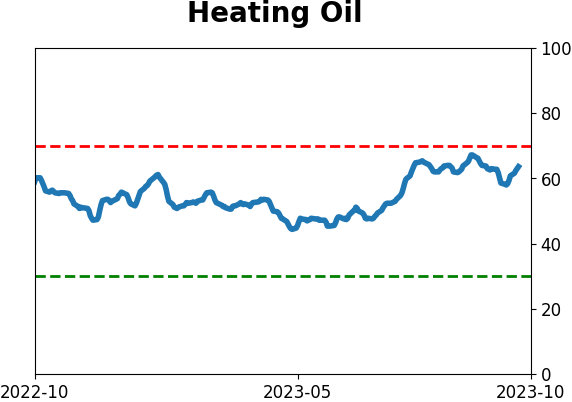
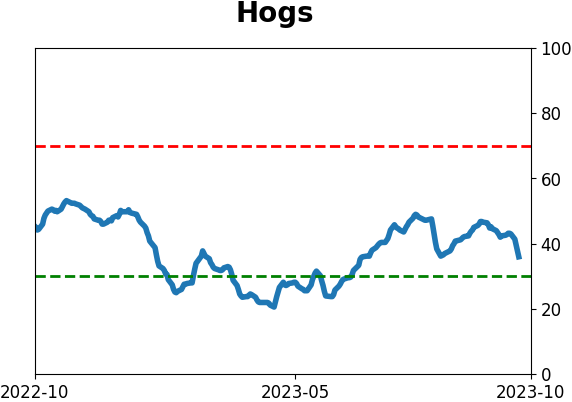
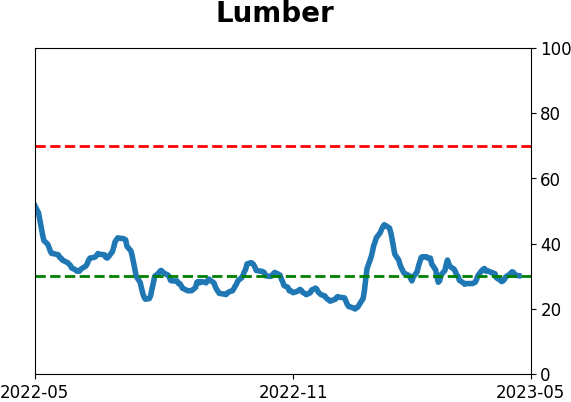
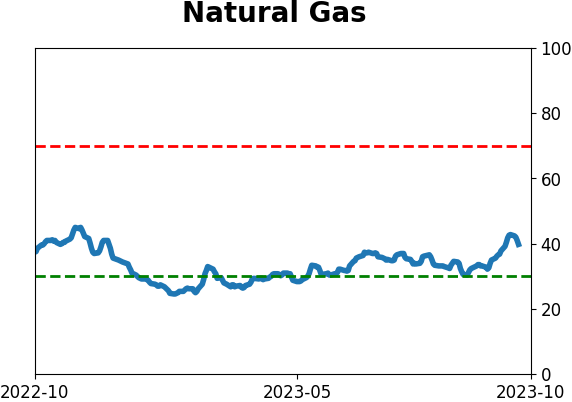
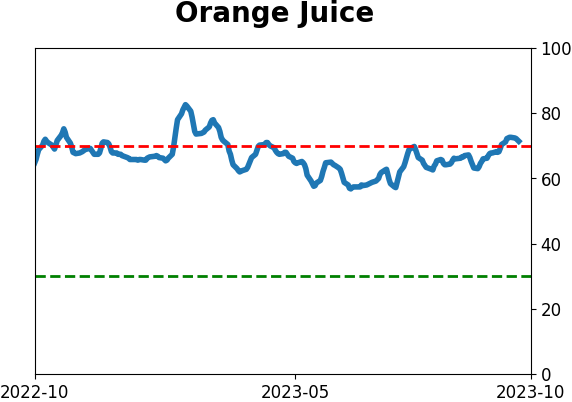
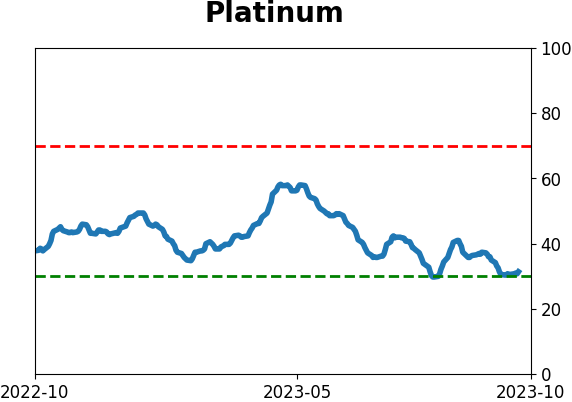
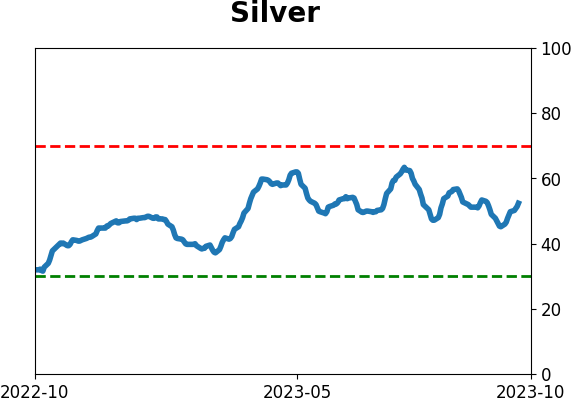
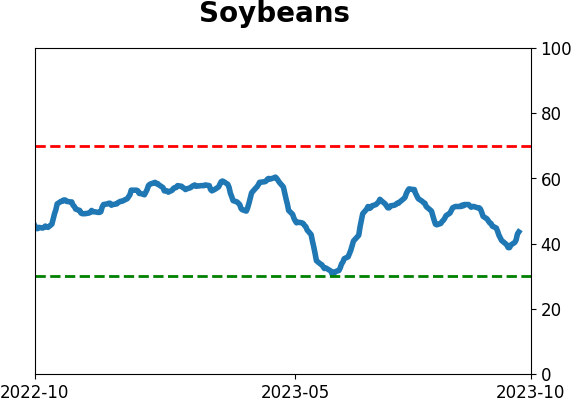
Commodity ETF's - 5-Day Moving Average
|
|