Headlines
|
|
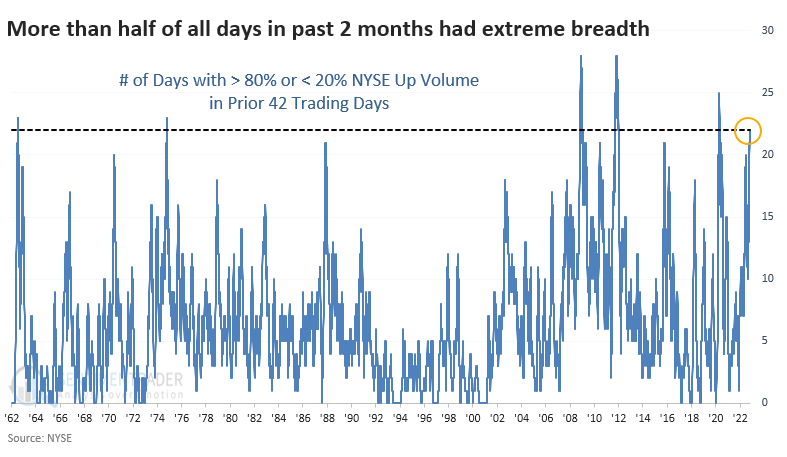
All or nothing days reach historic proportions:
Over the past two months, more than half of the days witnessed all-or-nothing behavior, with more than 80% or less than 20% of volume flowing into advancing securities. This is on par with only a handful of markets in the past 60 years, all of which preceded gains of 20% or more in the S&P 500 over the following year.
|
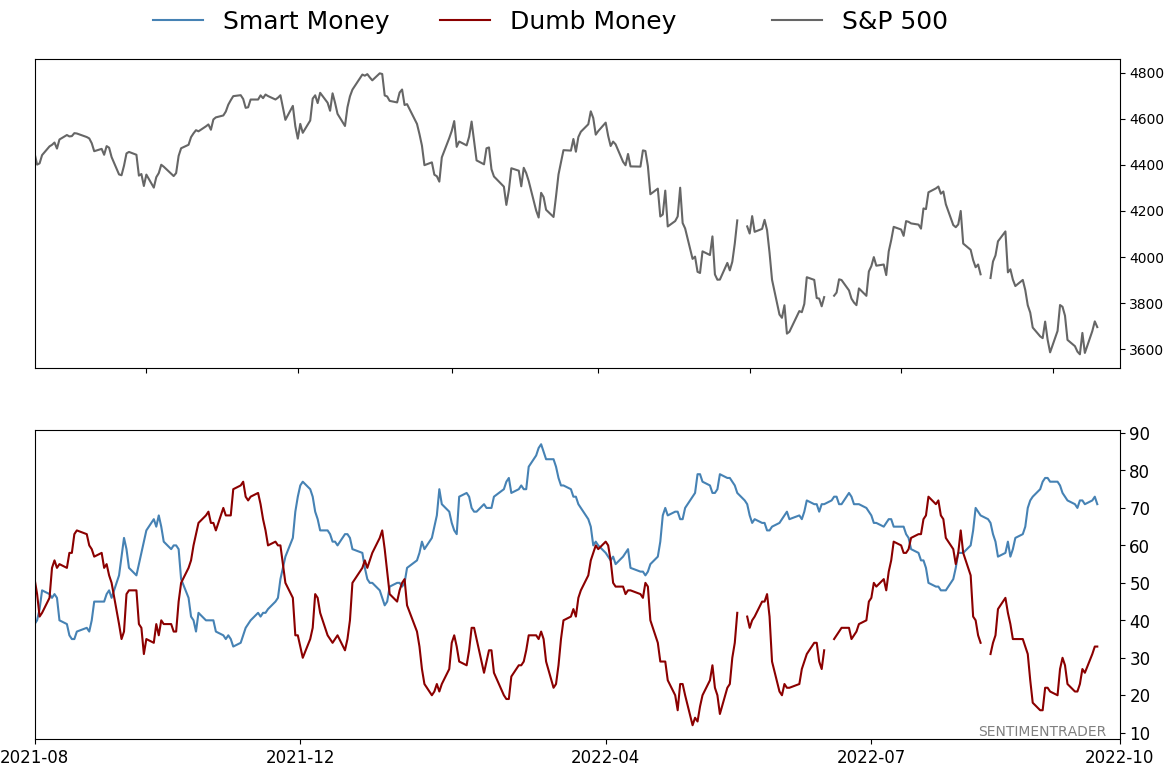
Smart / Dumb Money Confidence
|
Smart Money Confidence: 71%
Dumb Money Confidence: 33%
|
|
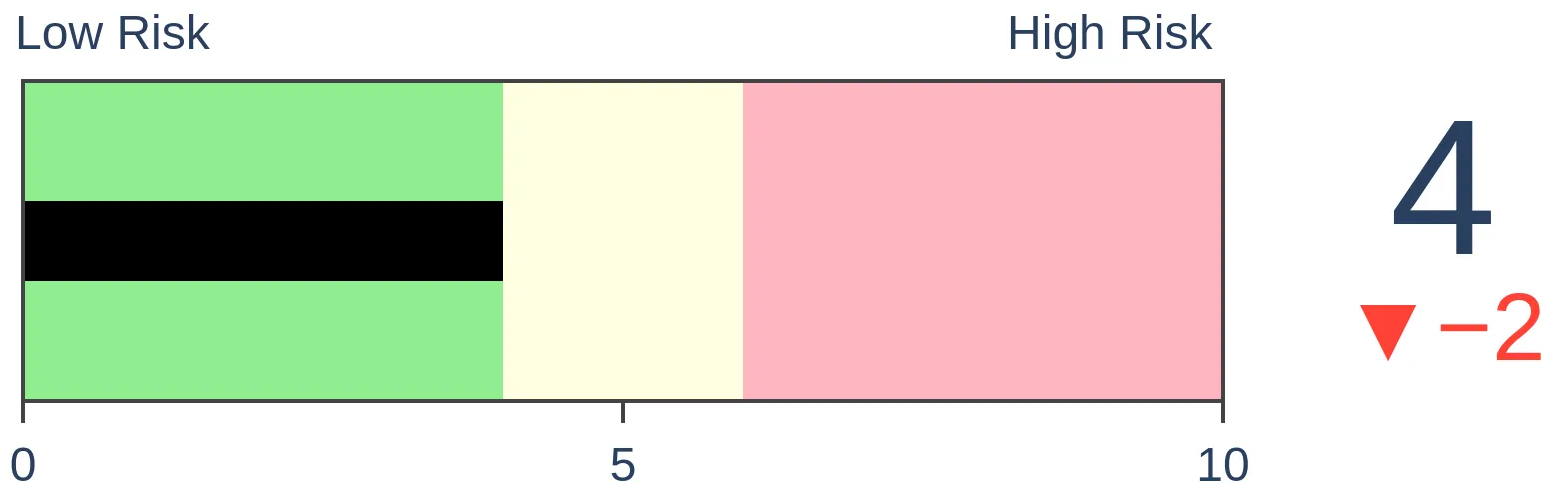
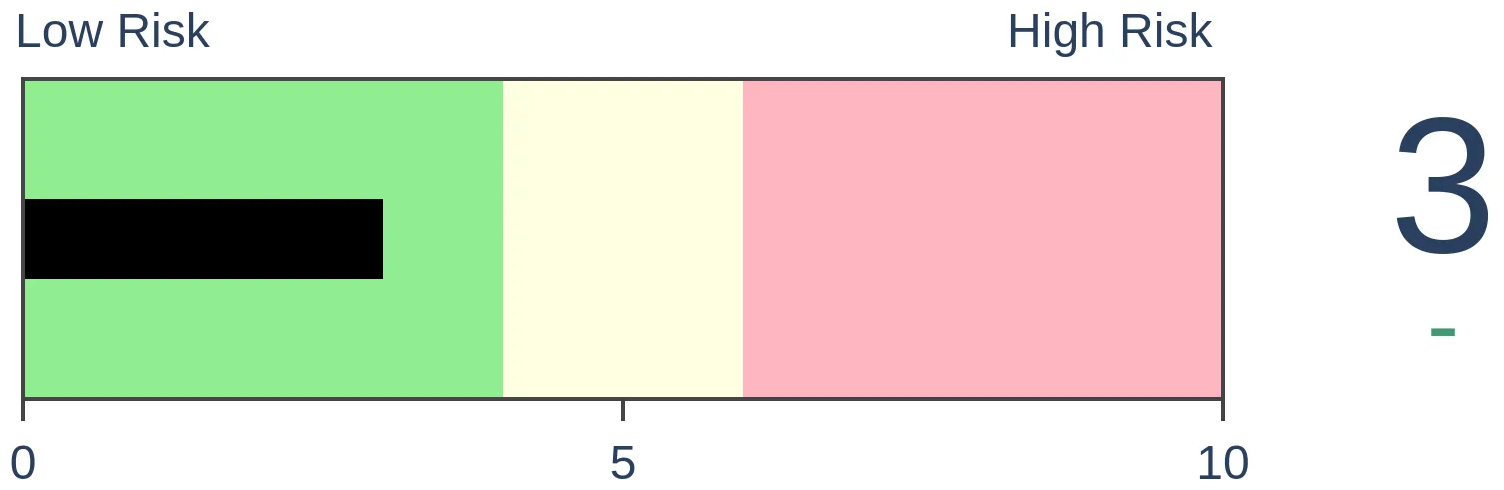
Risk Levels
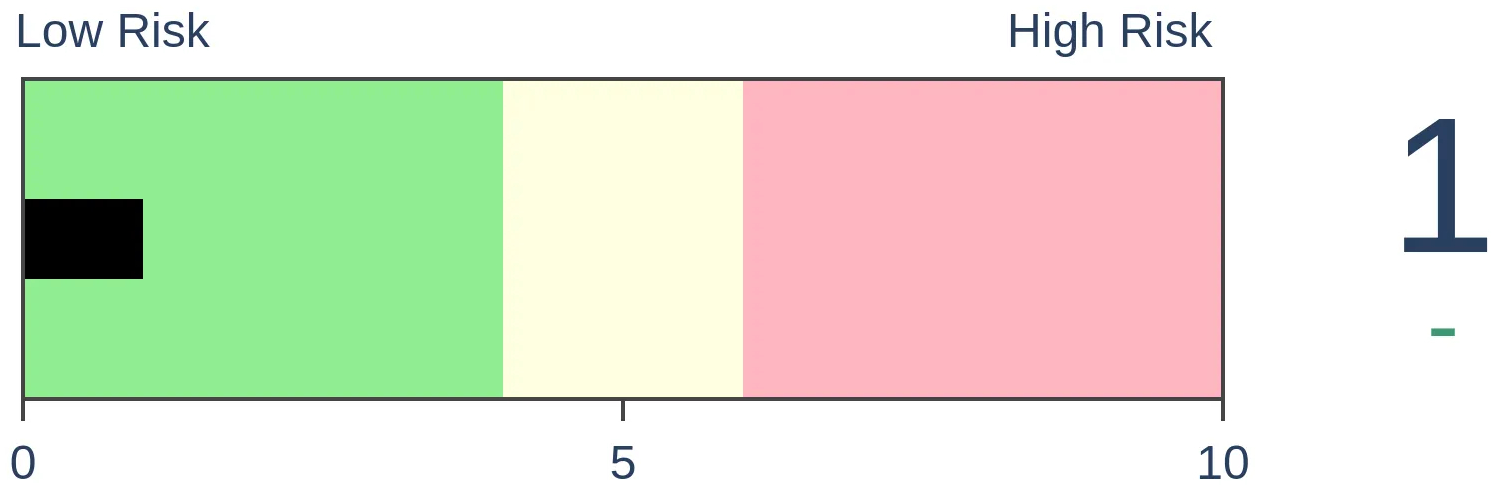
Stocks Short-Term
|
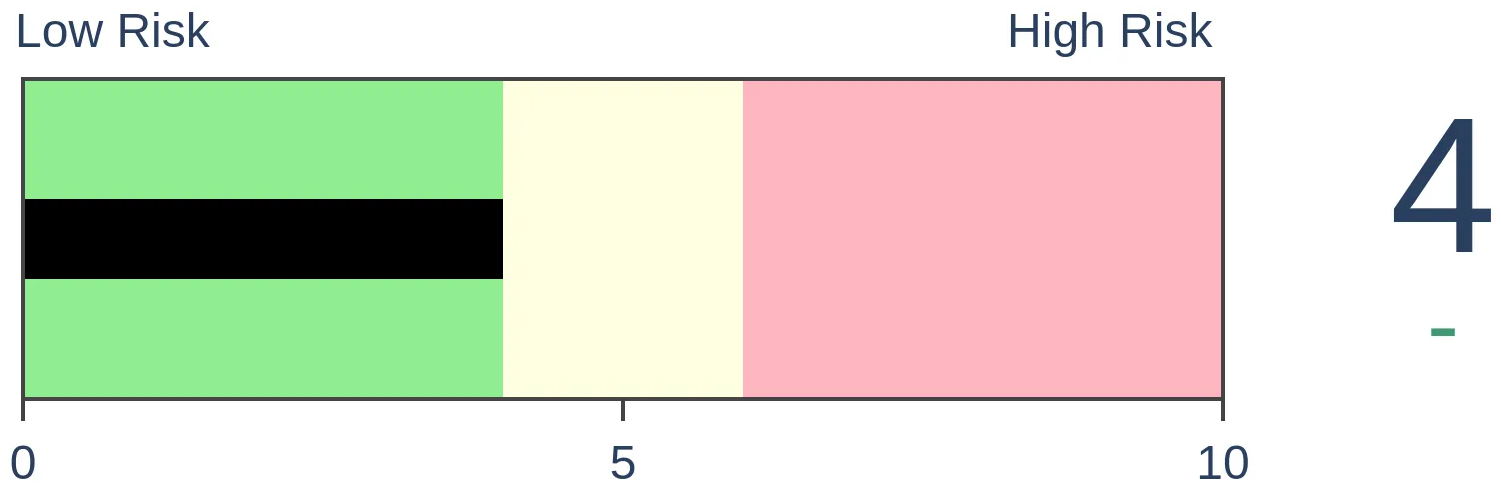
Stocks Medium-Term
|
|
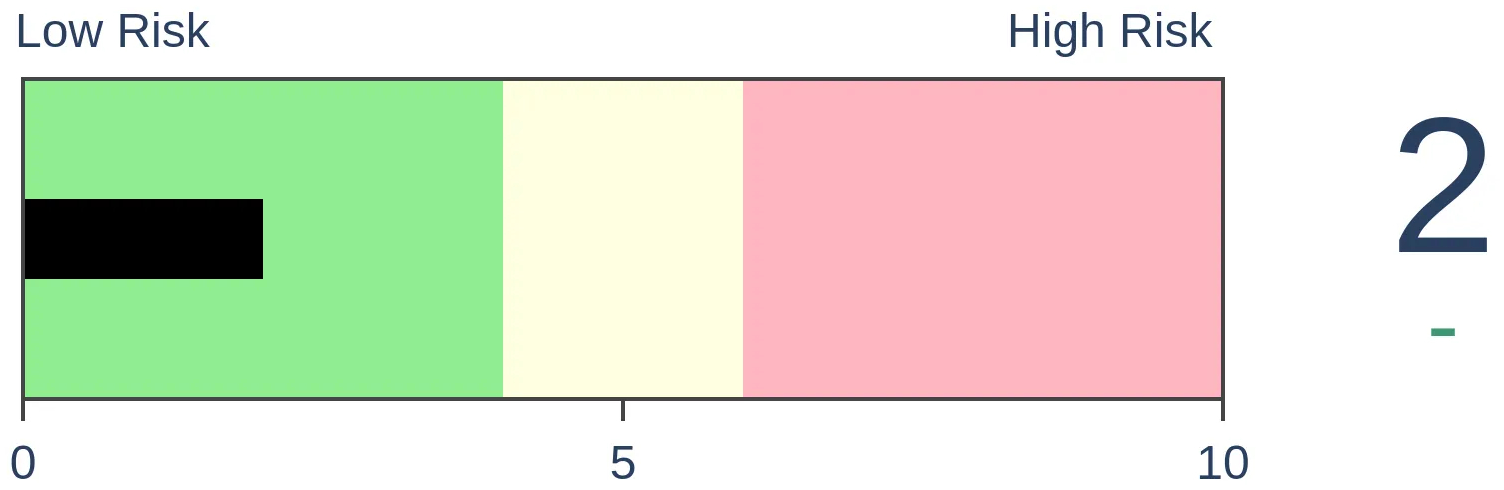
Bonds
|
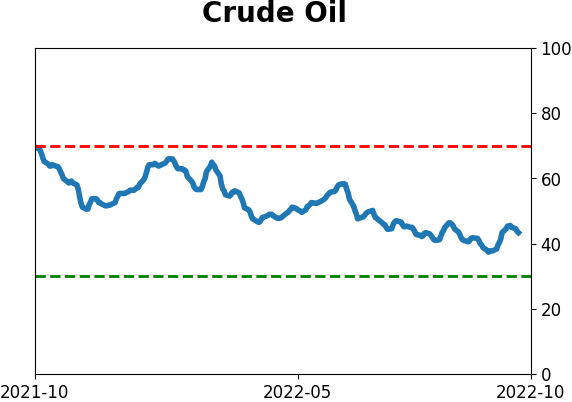
Crude Oil
|
|
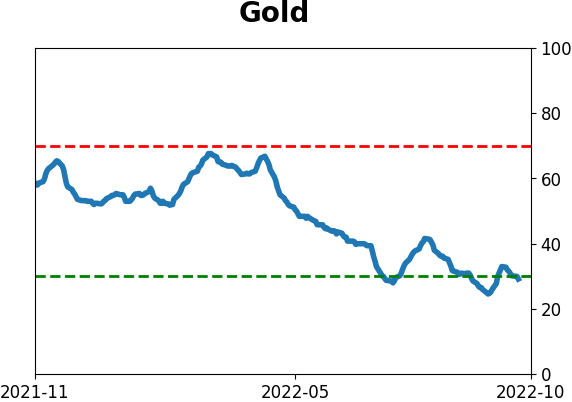
Gold
|
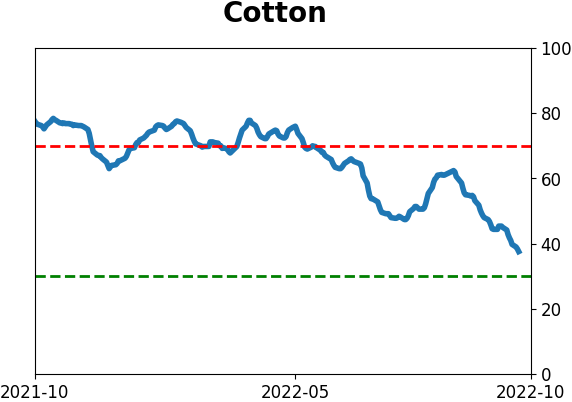
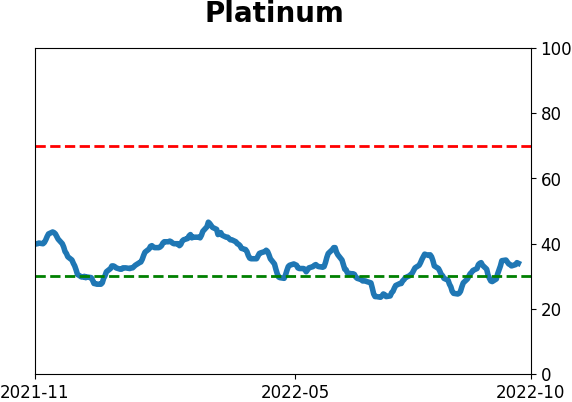
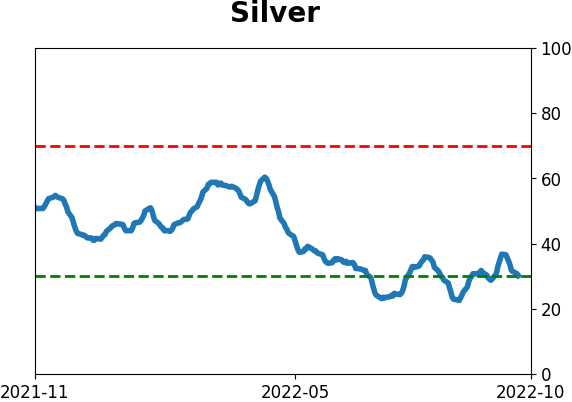
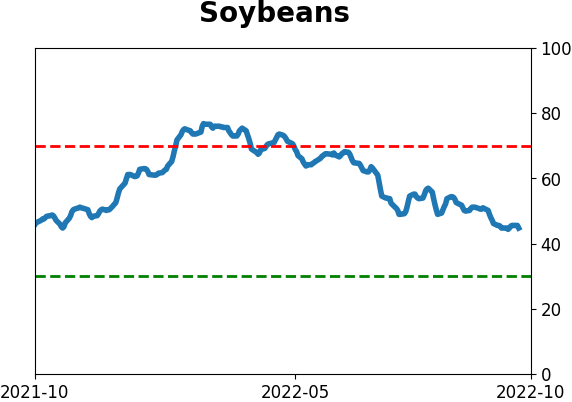
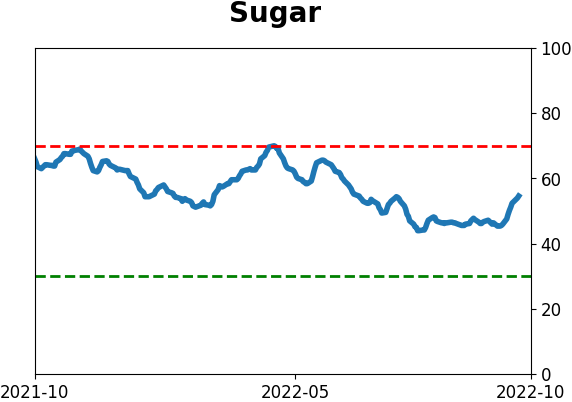
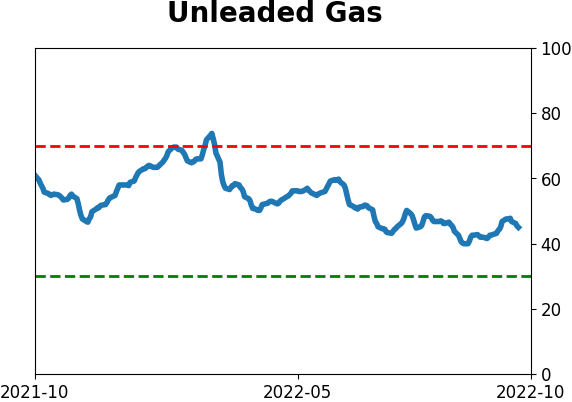
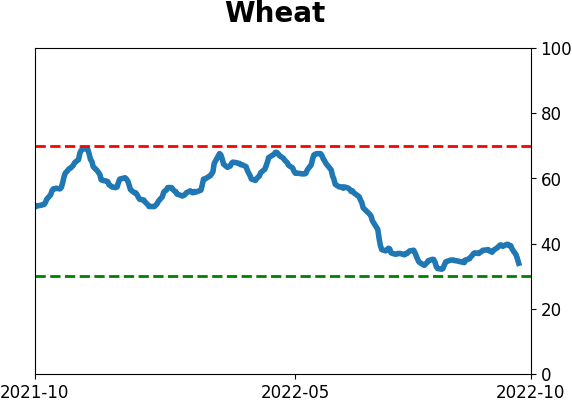
Agriculture

|
|
Research
By Jason Goepfert
BOTTOM LINE
Over the past two months, more than half of the days witnessed all-or-nothing behavior, with more than 80% or less than 20% of volume flowing into advancing securities. This is on par with only a handful of markets in the past 60 years, all of which preceded gains of 20% or more in the S&P 500 over the following year.
FORECAST / TIMEFRAME
None
|
Key points:
- More than half of all trading days in the past two months were all-or-nothing
- On those days, more than 80% of volume flowed into advancing securities, or less than 20% did
- The handful of similar displays all preceded gains of 20% or more during the following year
Every other day, investors are buying or selling everything at once
High-frequency trading programs are running wild, market liquidity is historically low, and investors face an unprecedented decline in financial assets. All of that, and more, is serving up a nearly constant barrage of all-or-nothing days when virtually everything seems to rise or fall in concert.
During a bear market, it's not surprising to see many days with less than 20% of volume on the NYSE flowing into advancing securities. The Backtest Engine shows a solid range of red dots over the past couple of months.
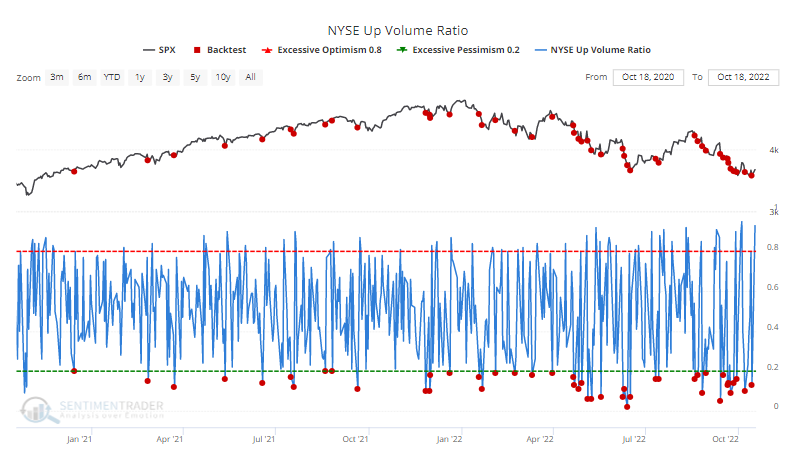
But there have also been many days with Up Volume holding above 80%, as shorts scrambled to cover shares and some lesser version of FOMO took hold.
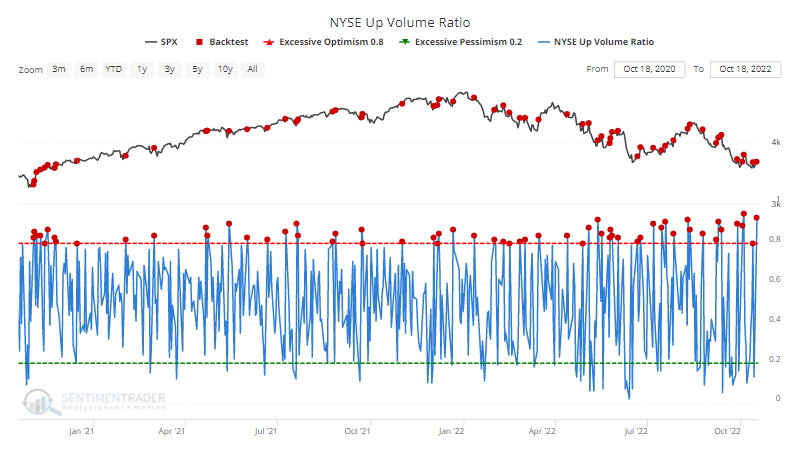
The total number of extreme days in the past two months has now accounted for more than half of all trading days, a remarkable accomplishment that ranks among the most volatile in 60 years.
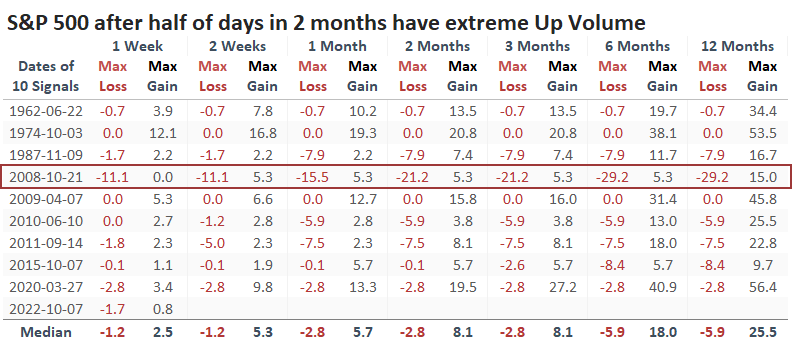
More than half of days being all-or-nothing preceded gains
Heavy volatility should be expected during bear markets. When it gets to this level of investors whipping from one side to the other on more than half of all days, those bear markets were about over. The S&P 500 showed at least a 20% gain the following year every time.
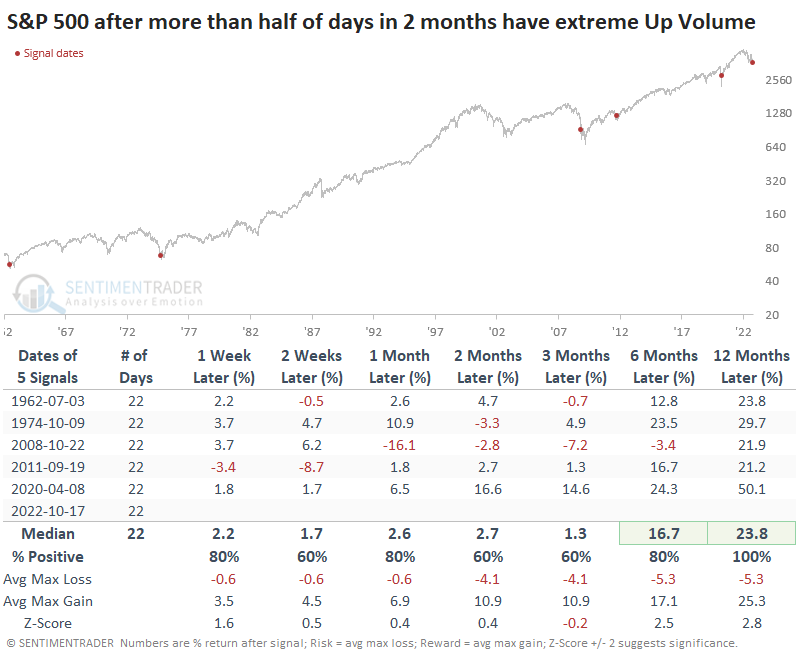
Conditions like we're seeing now are so unusual that it breeds tiny sample sizes. The sample size doubles if we relax the parameters to exactly half of days with extreme volume flows. The one-year median return dipped a bit, but a year later, all the signals still showed a positive return.
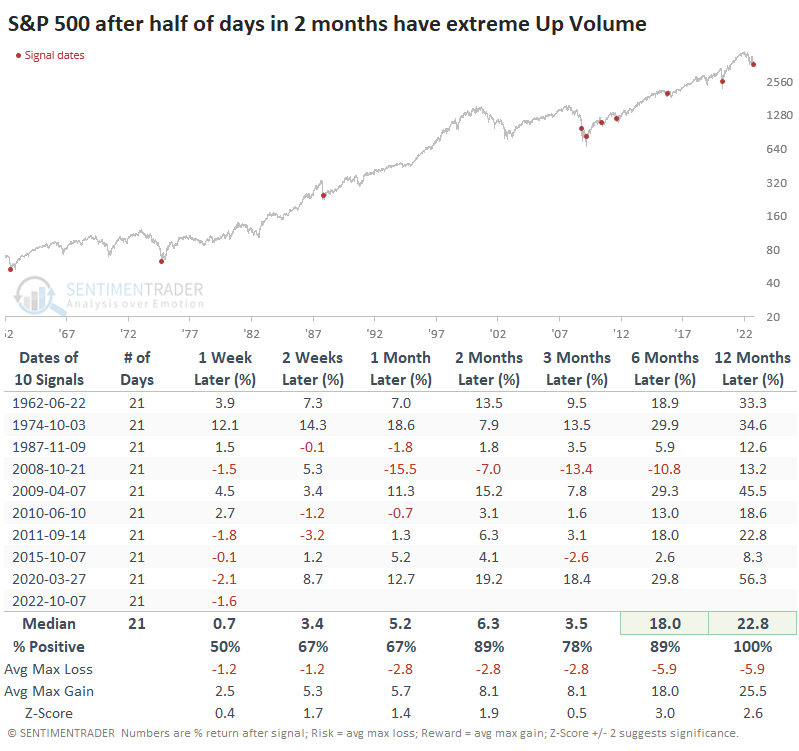
It took a lot of intestinal fortitude to endure the drawdown in 2008 before showing a long-term gain. Investors who bought at the time of the signal suffered more than a 20% drawdown before it recovered. That was the only instance that suffered anything more than an 8.4% drawdown at any point within the following year.
What the research tells us...
Bear markets foster price volatility and a rising correlation among stocks and other assets. We've certainly seen that during this bear, especially since August. It has reached a point where the volatility on various fronts is at a level that has typically coincided with the death throes of a bear market, as opposed to the beginning or middle stages.
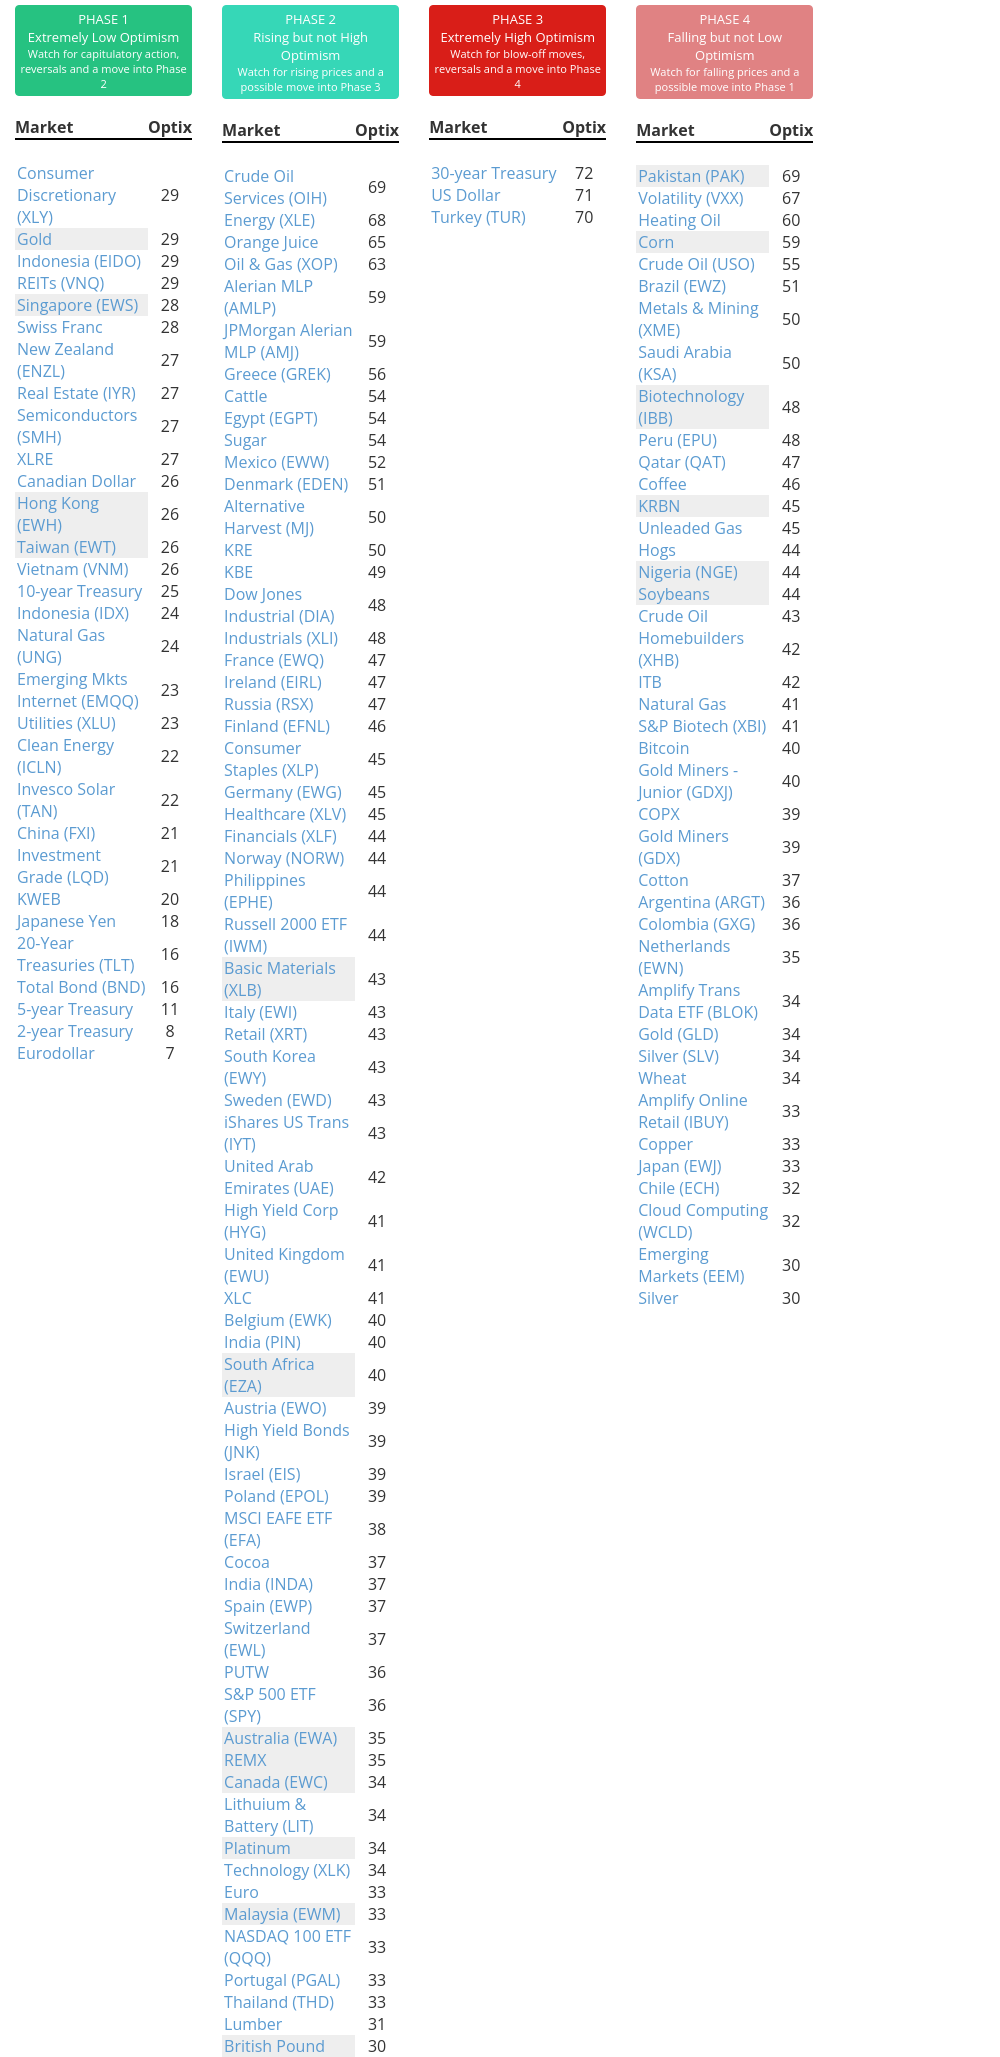
Indicators at Extremes
Phase Table
Ranks
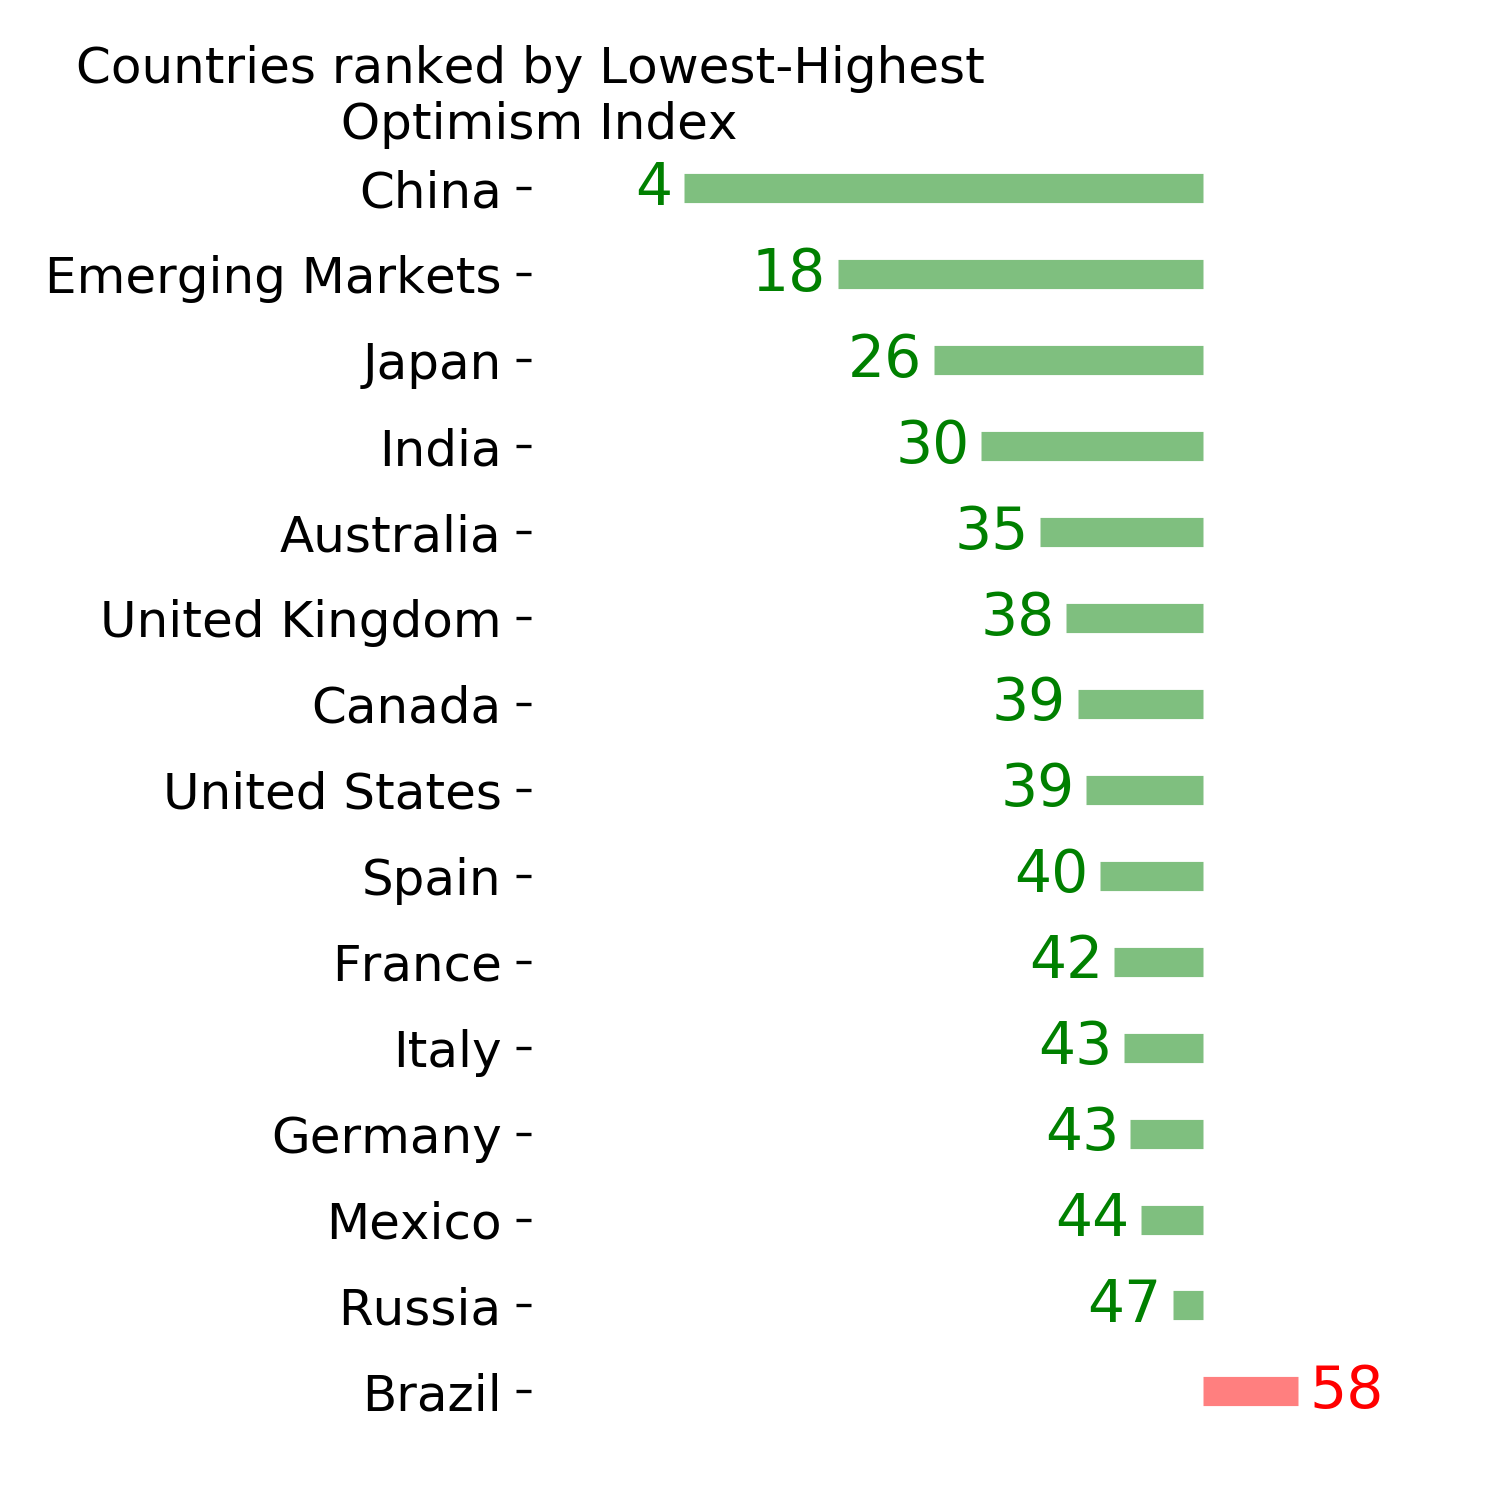
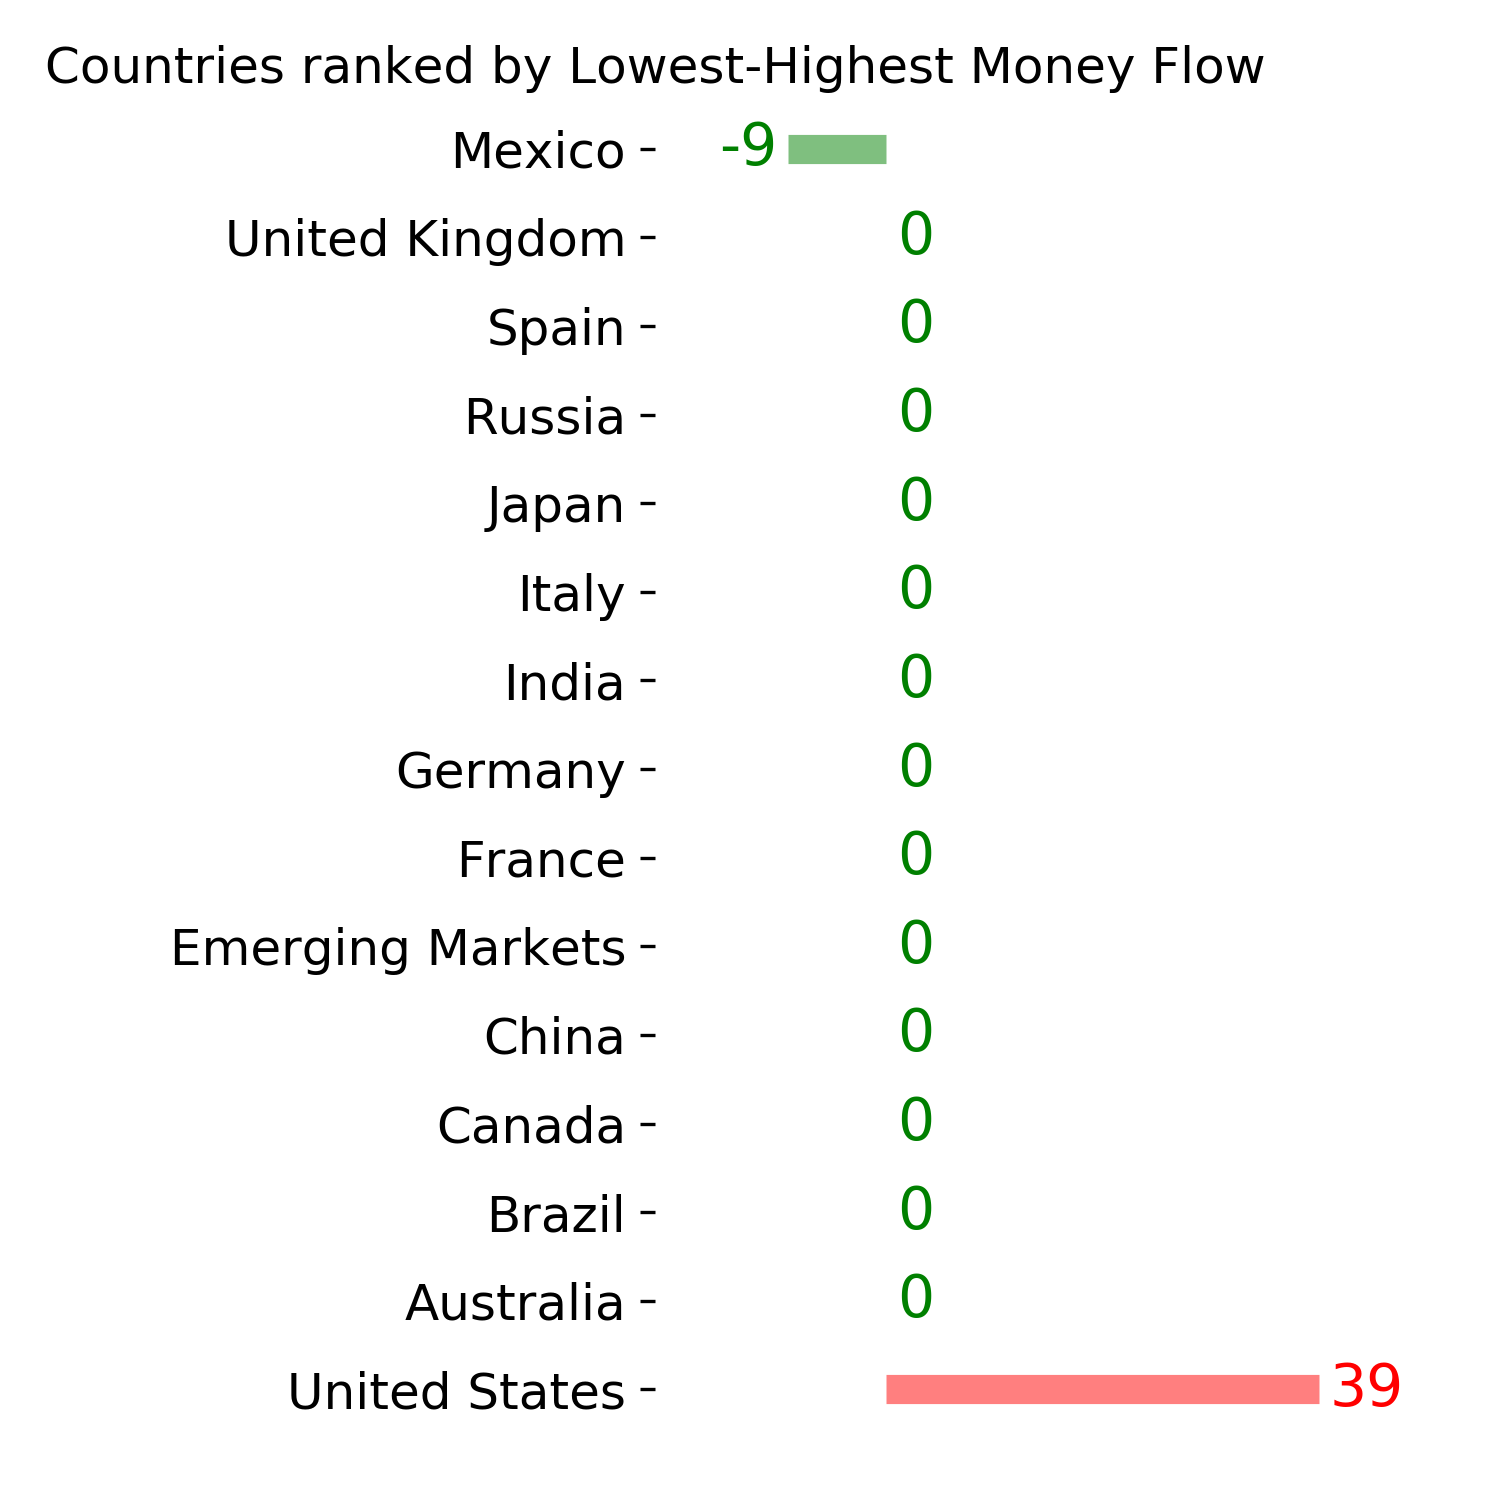
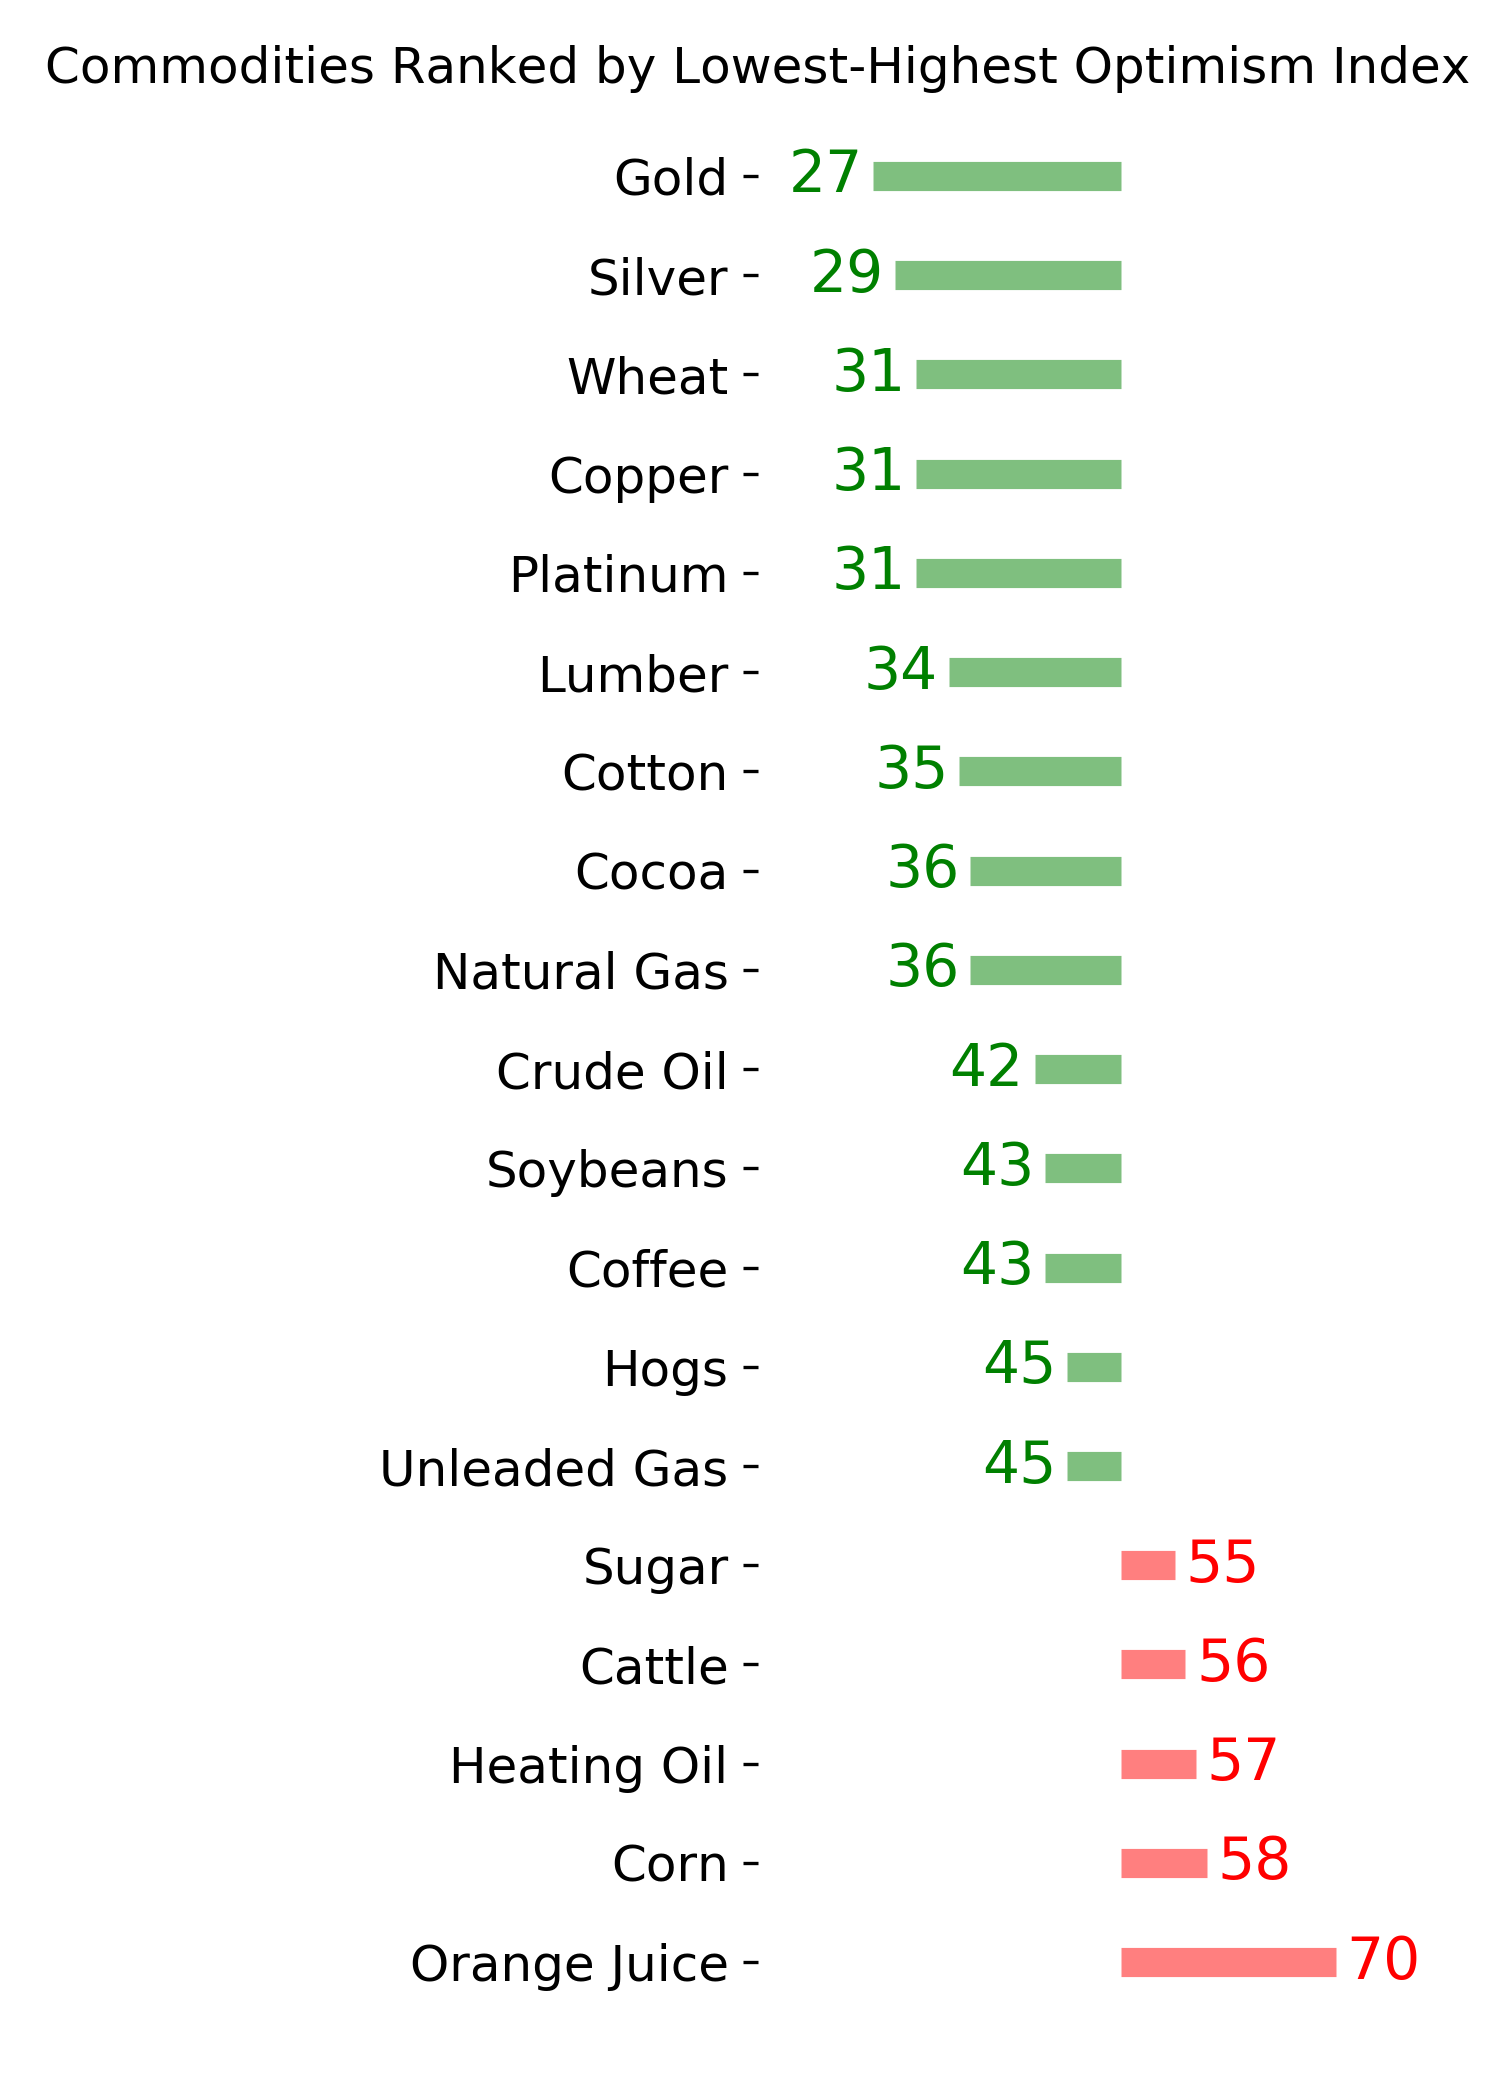
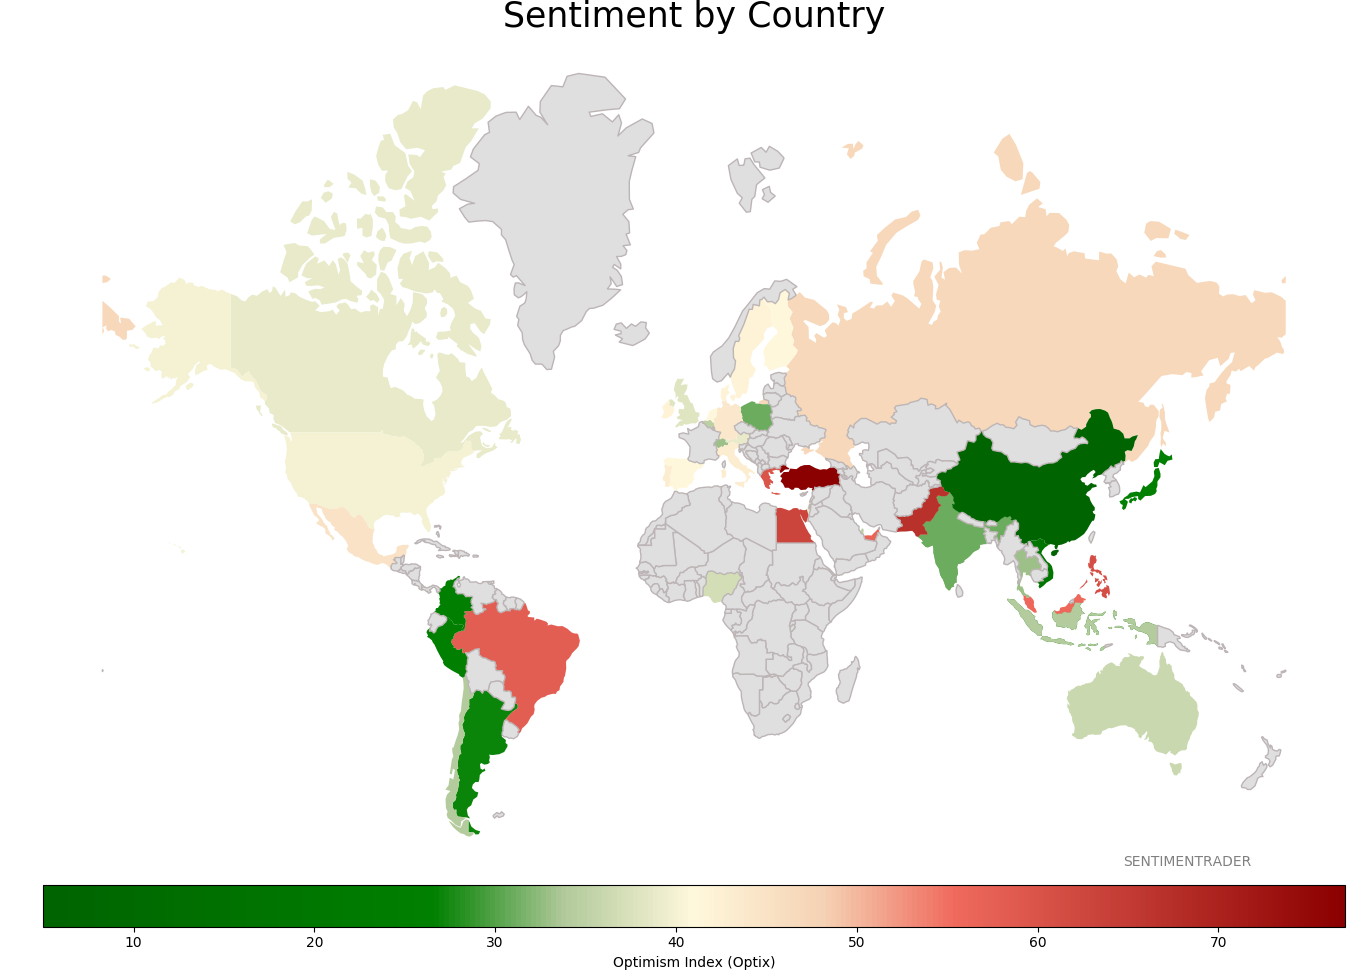
Sentiment Around The World
Optimism Index Thumbnails
|
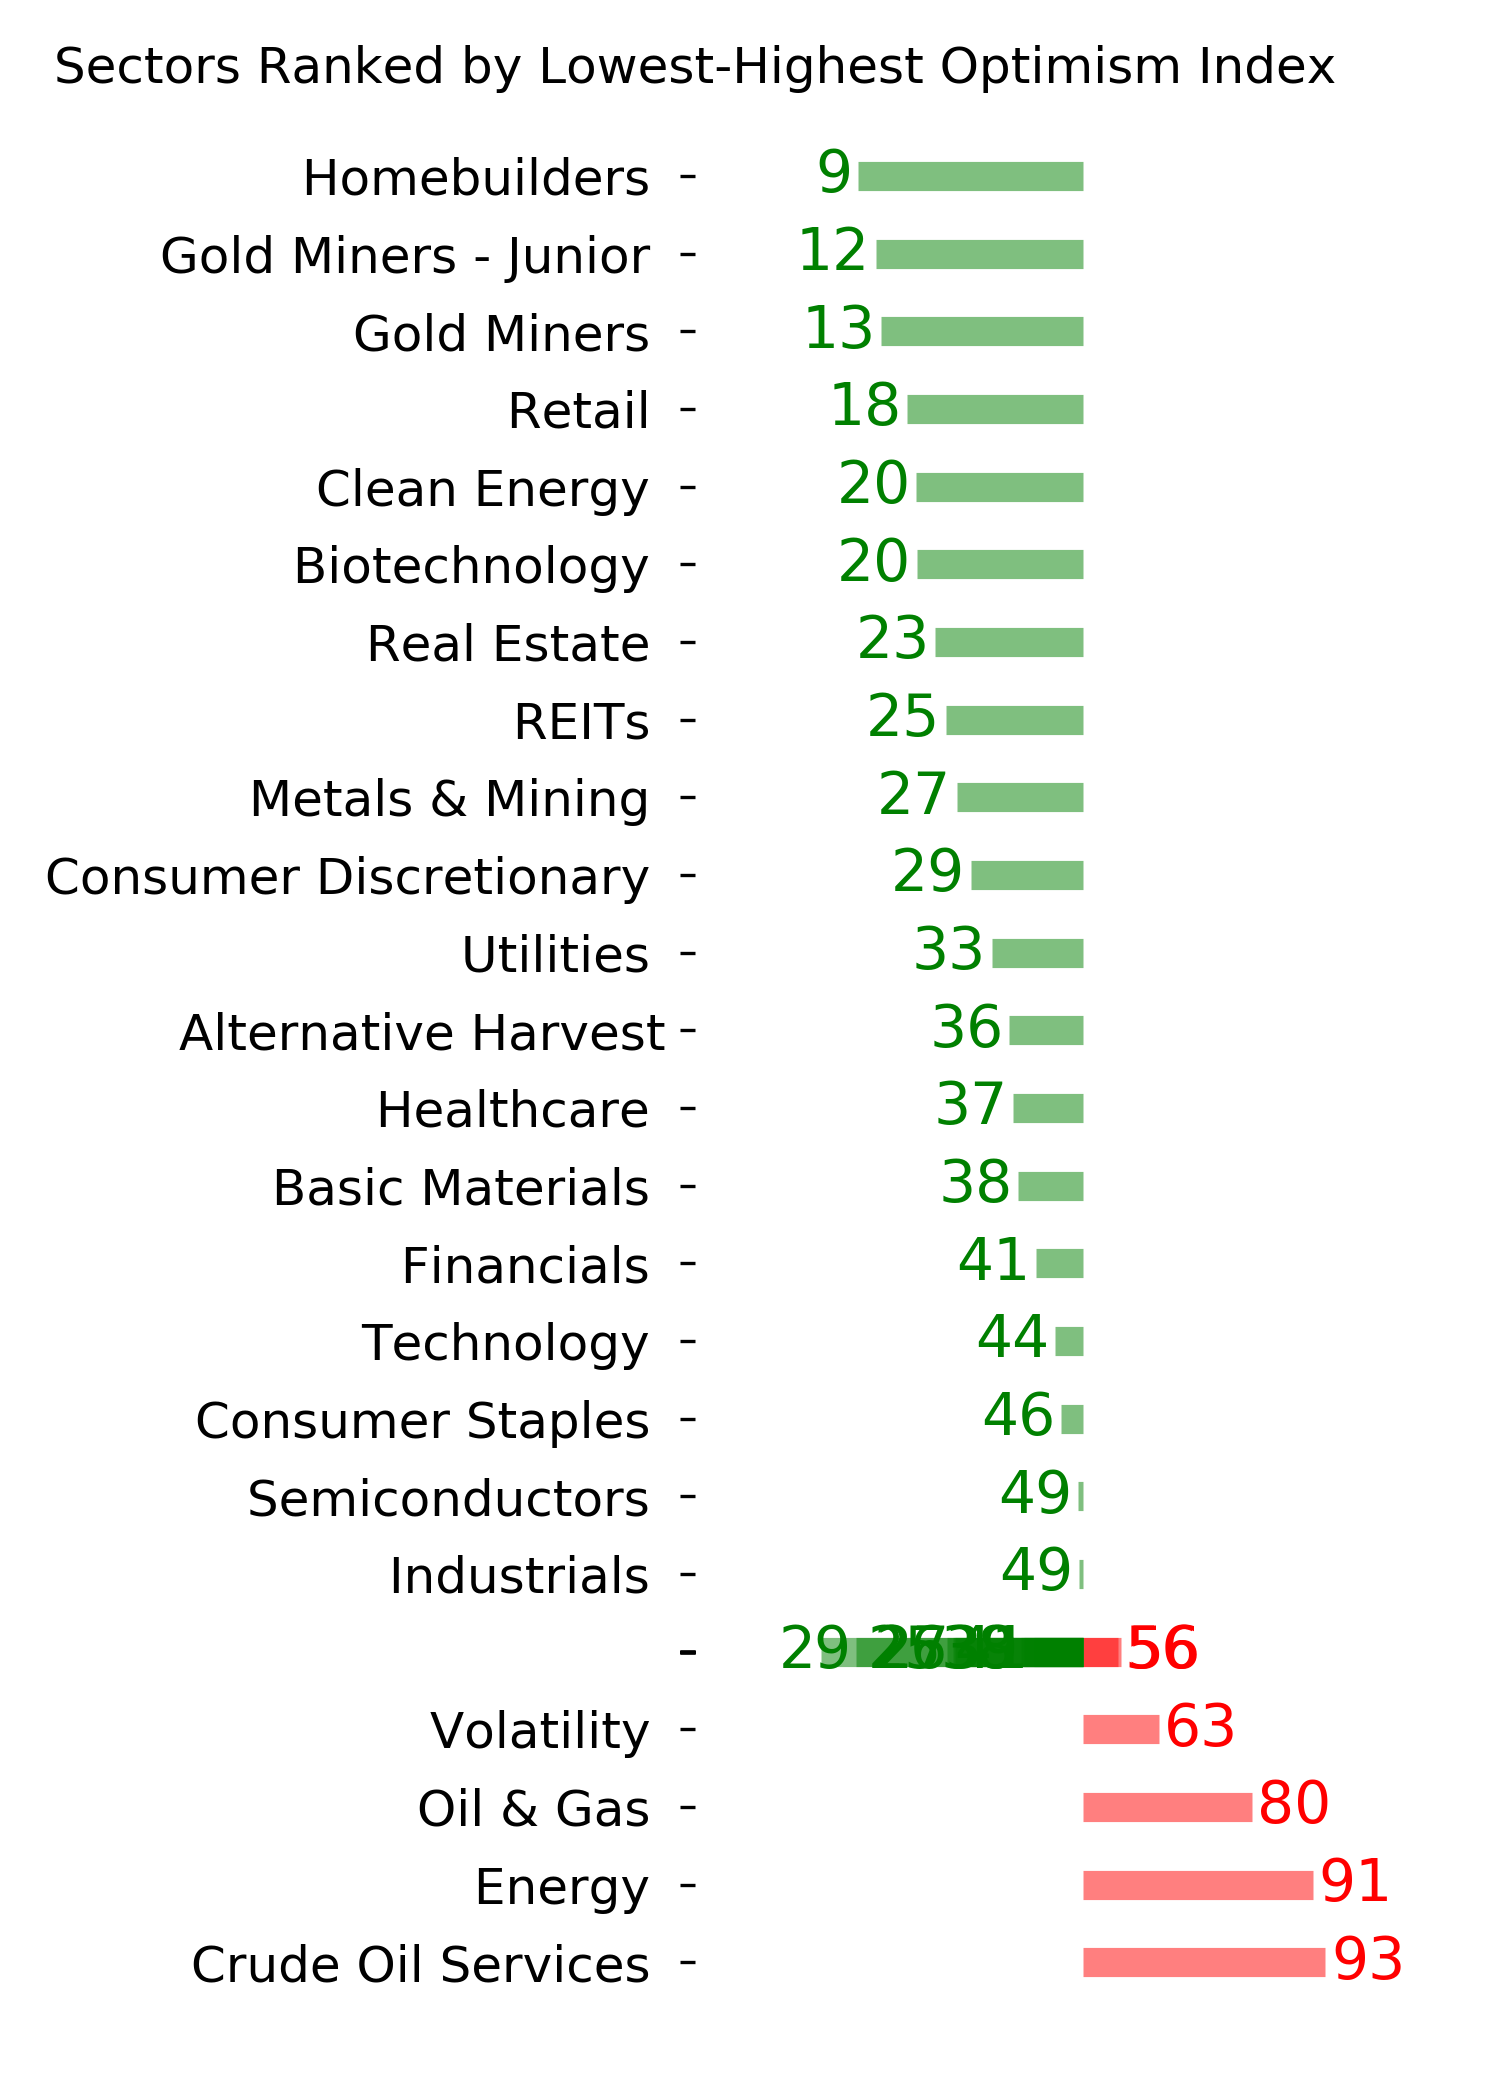
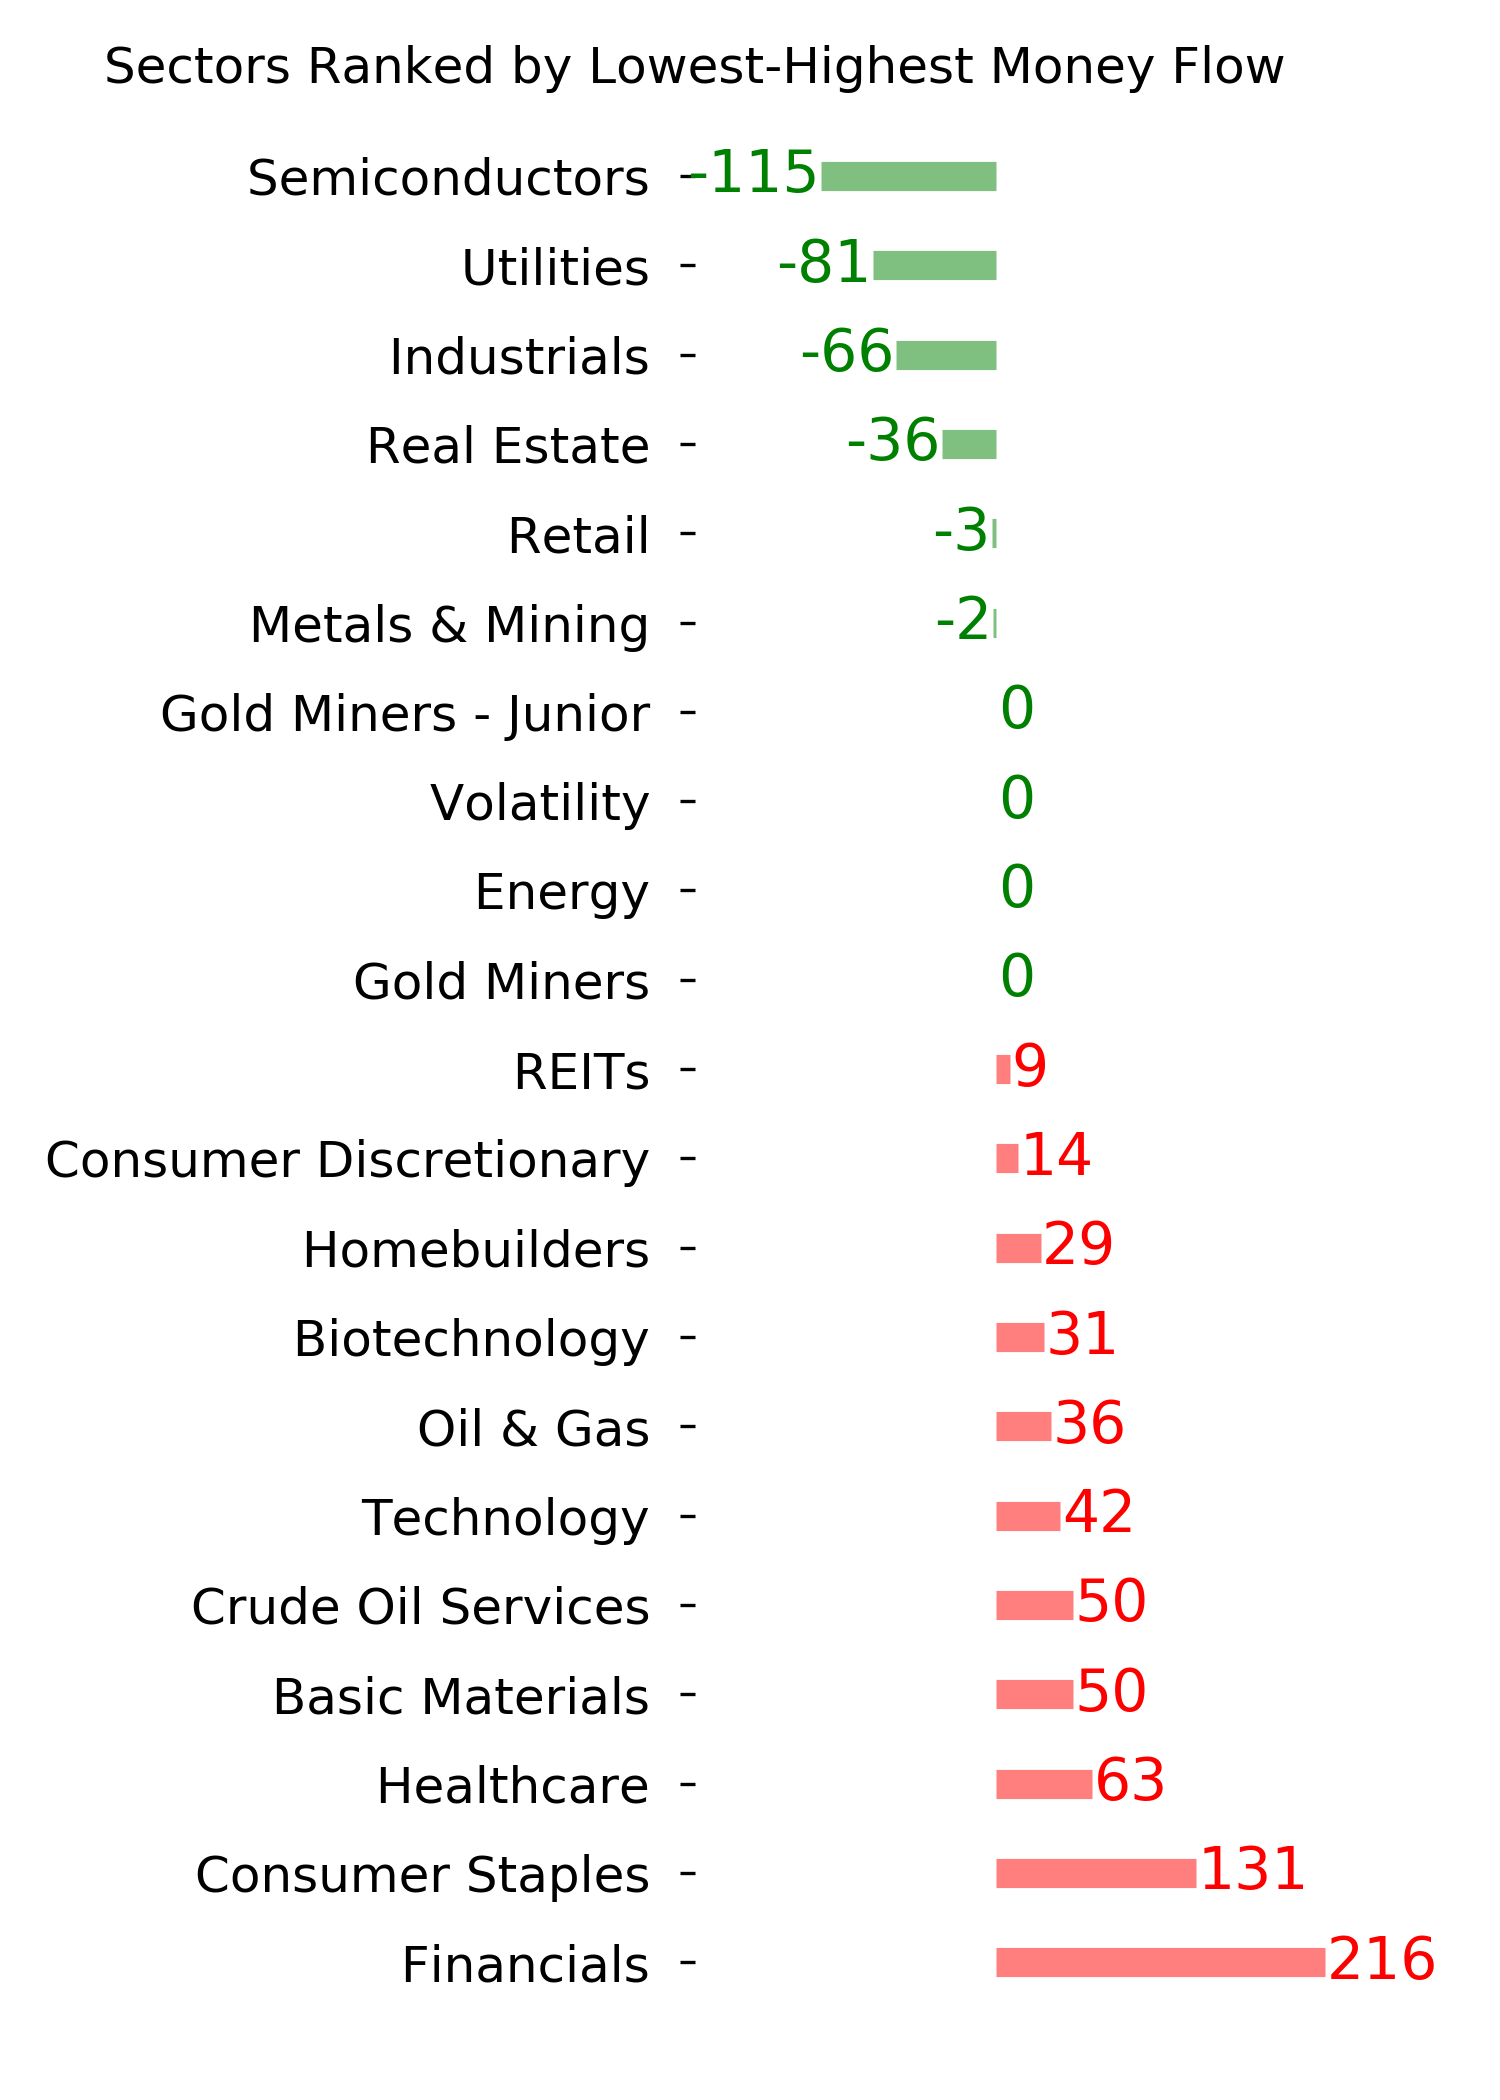
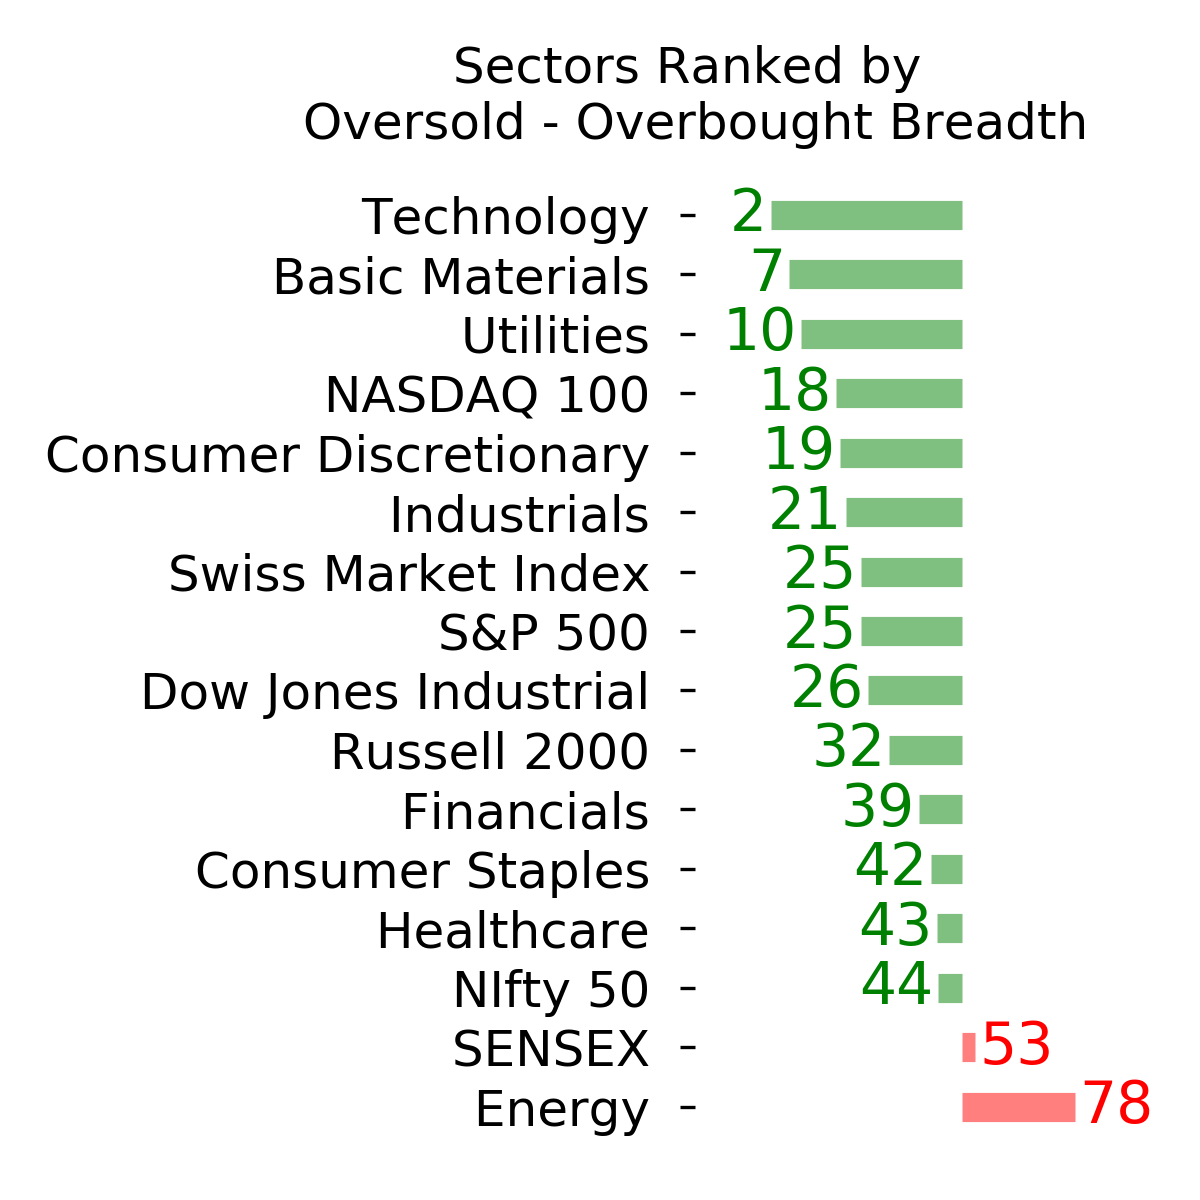
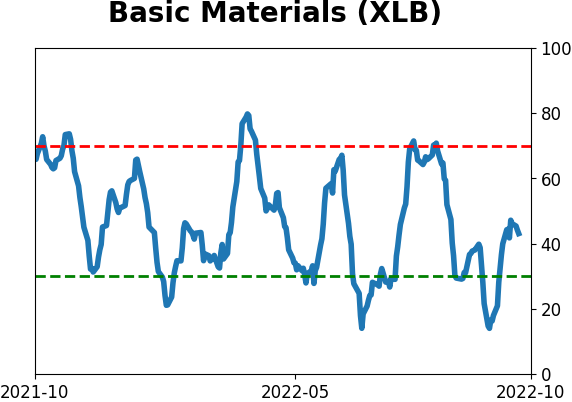
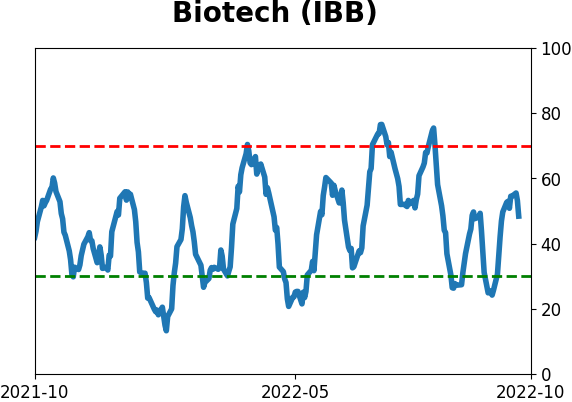
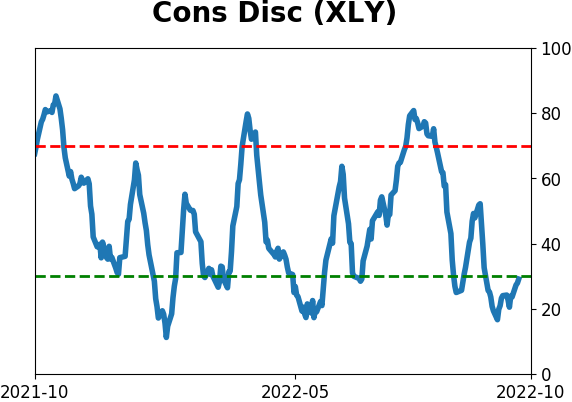
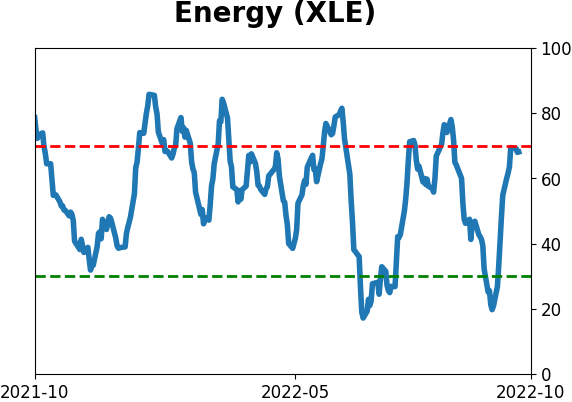
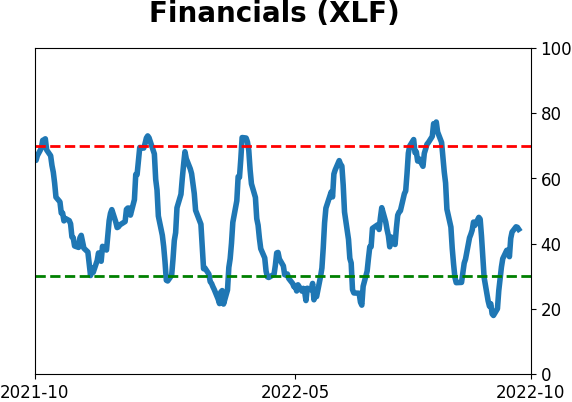
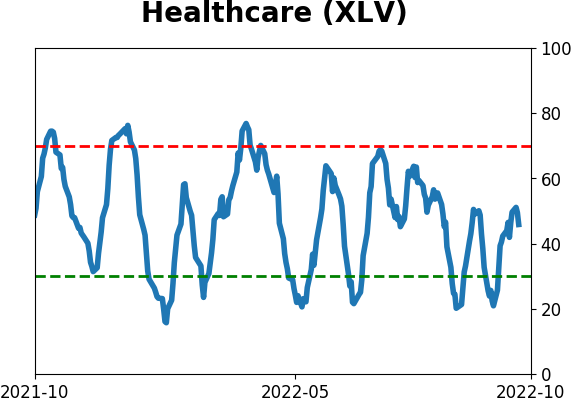
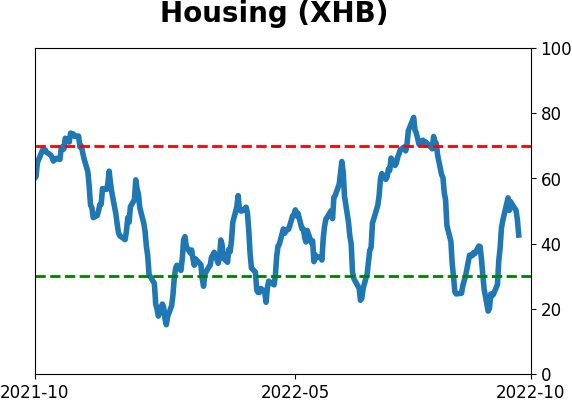
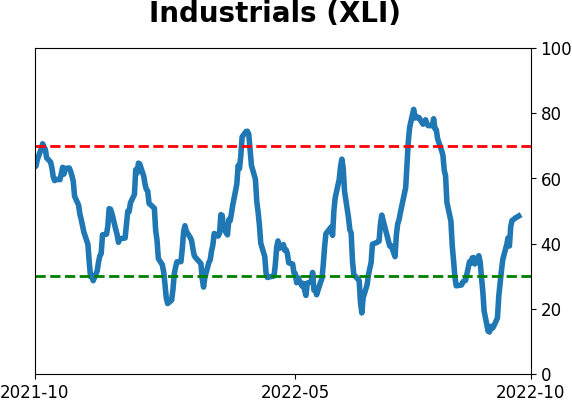
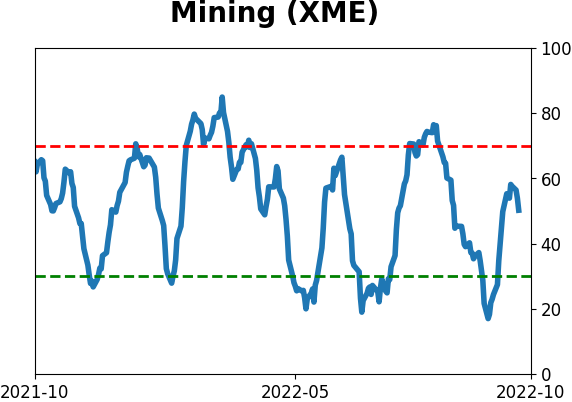
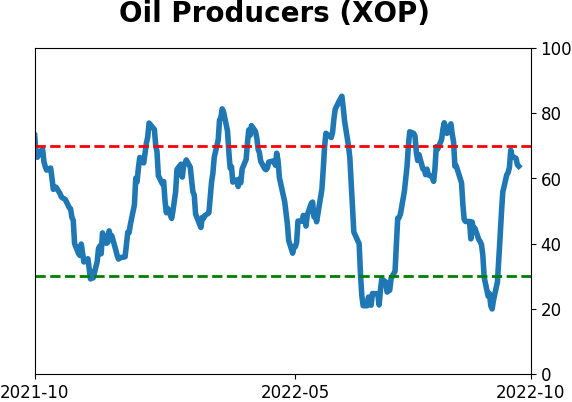
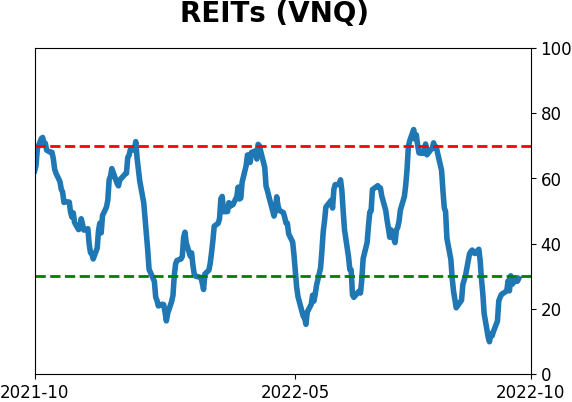
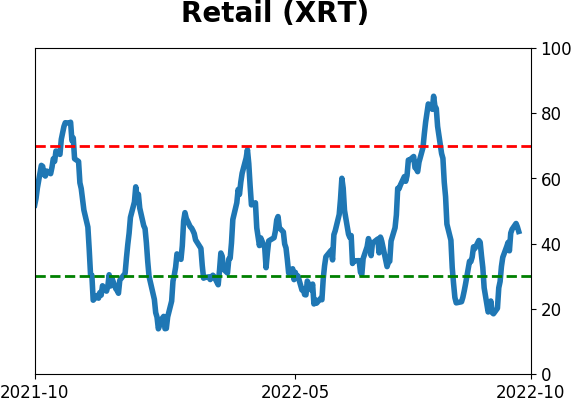
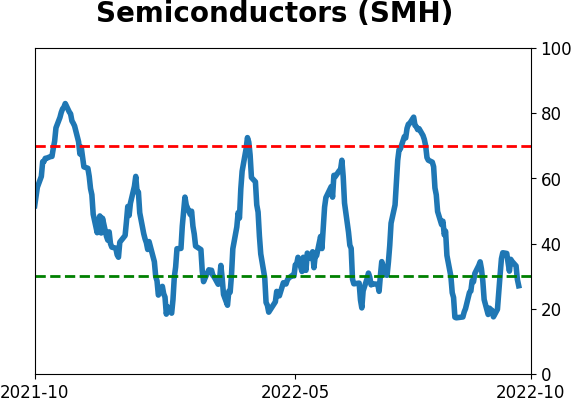
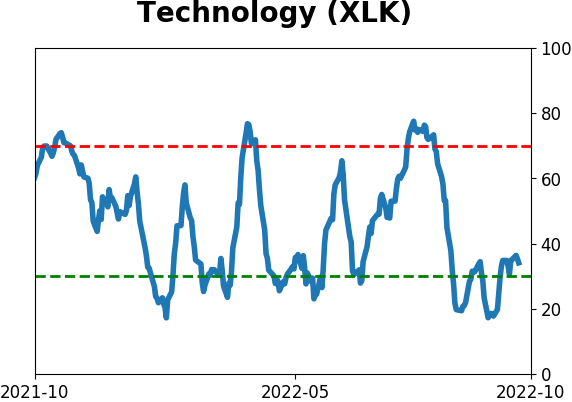
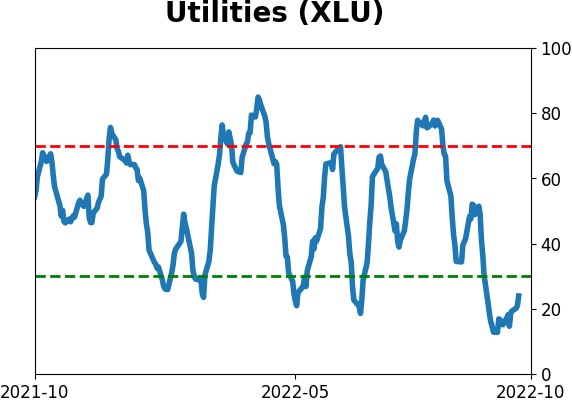
Sector ETF's - 10-Day Moving Average
|
|
|
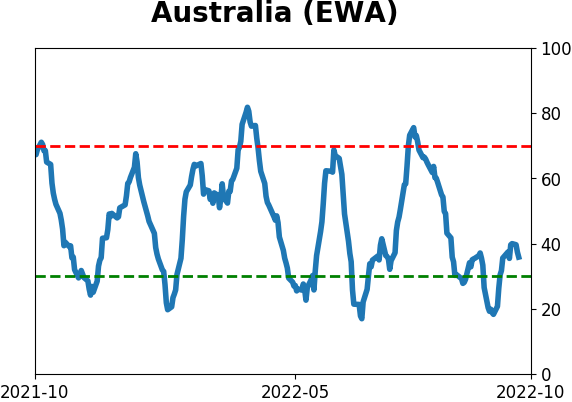
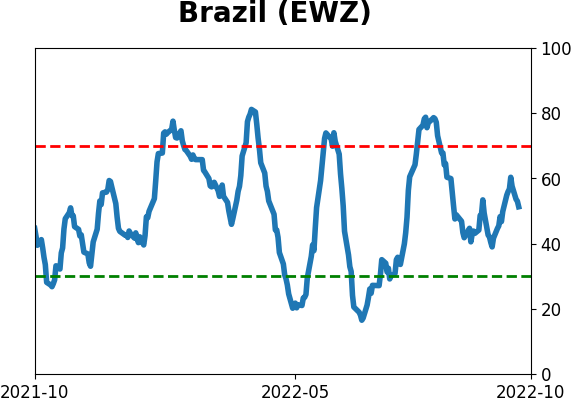
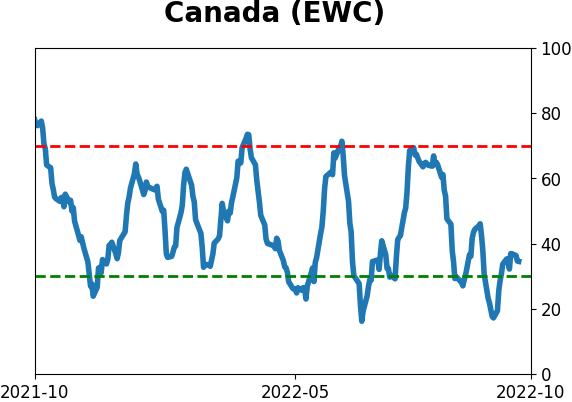
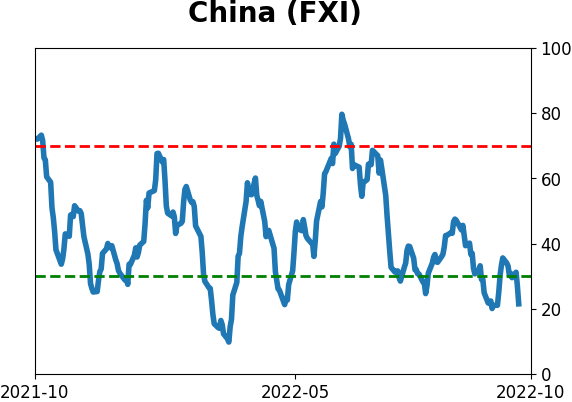
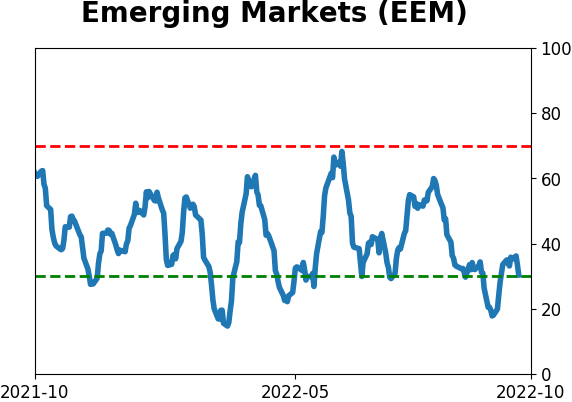
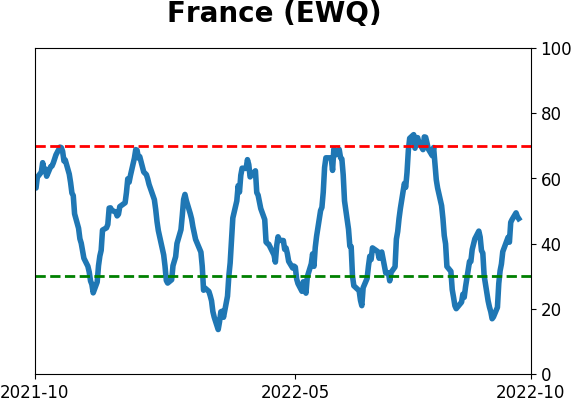
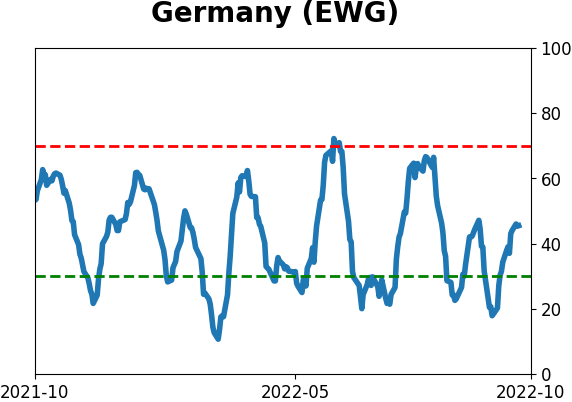
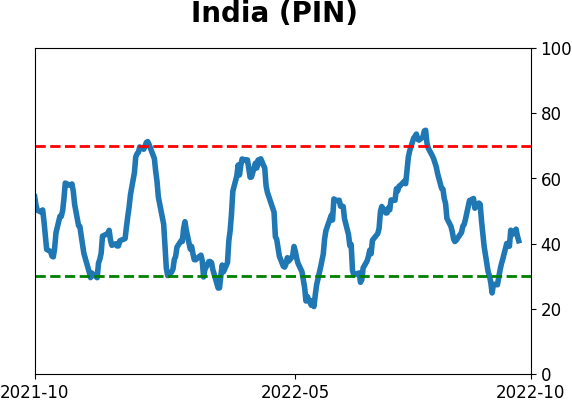
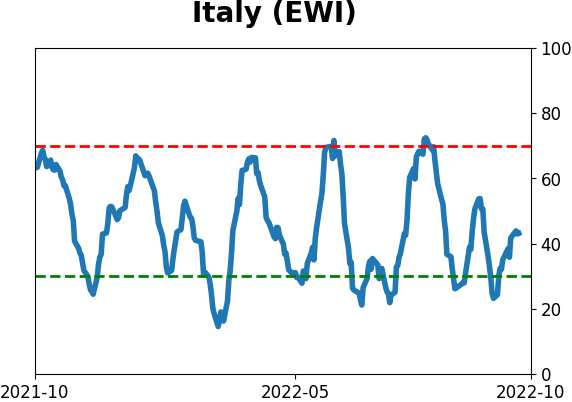
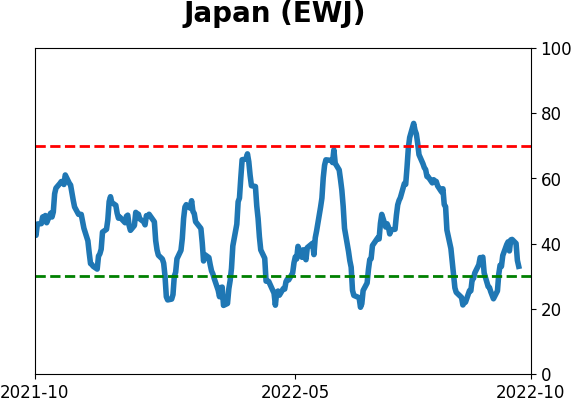
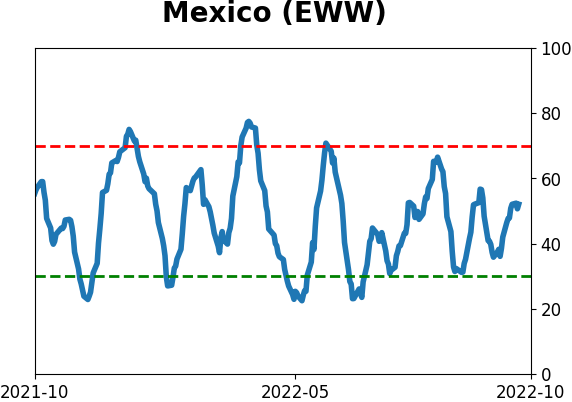
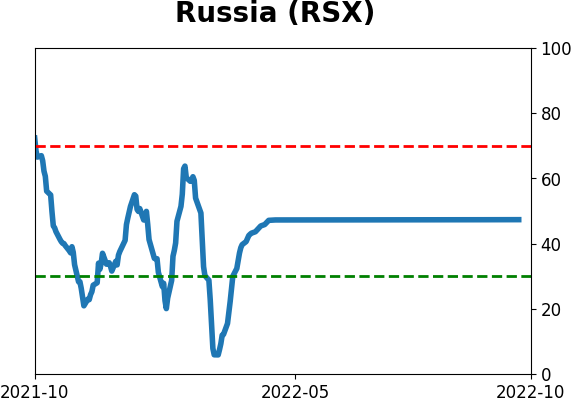
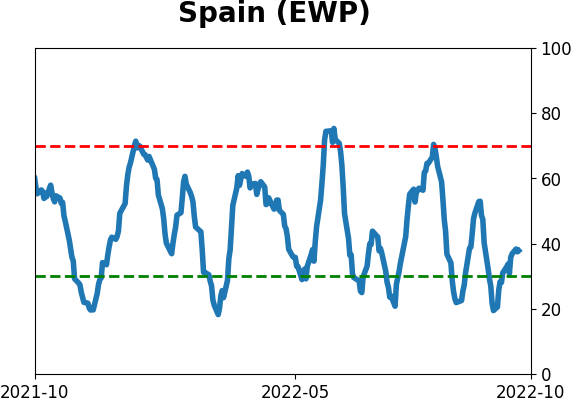
Country ETF's - 10-Day Moving Average
|
|
|
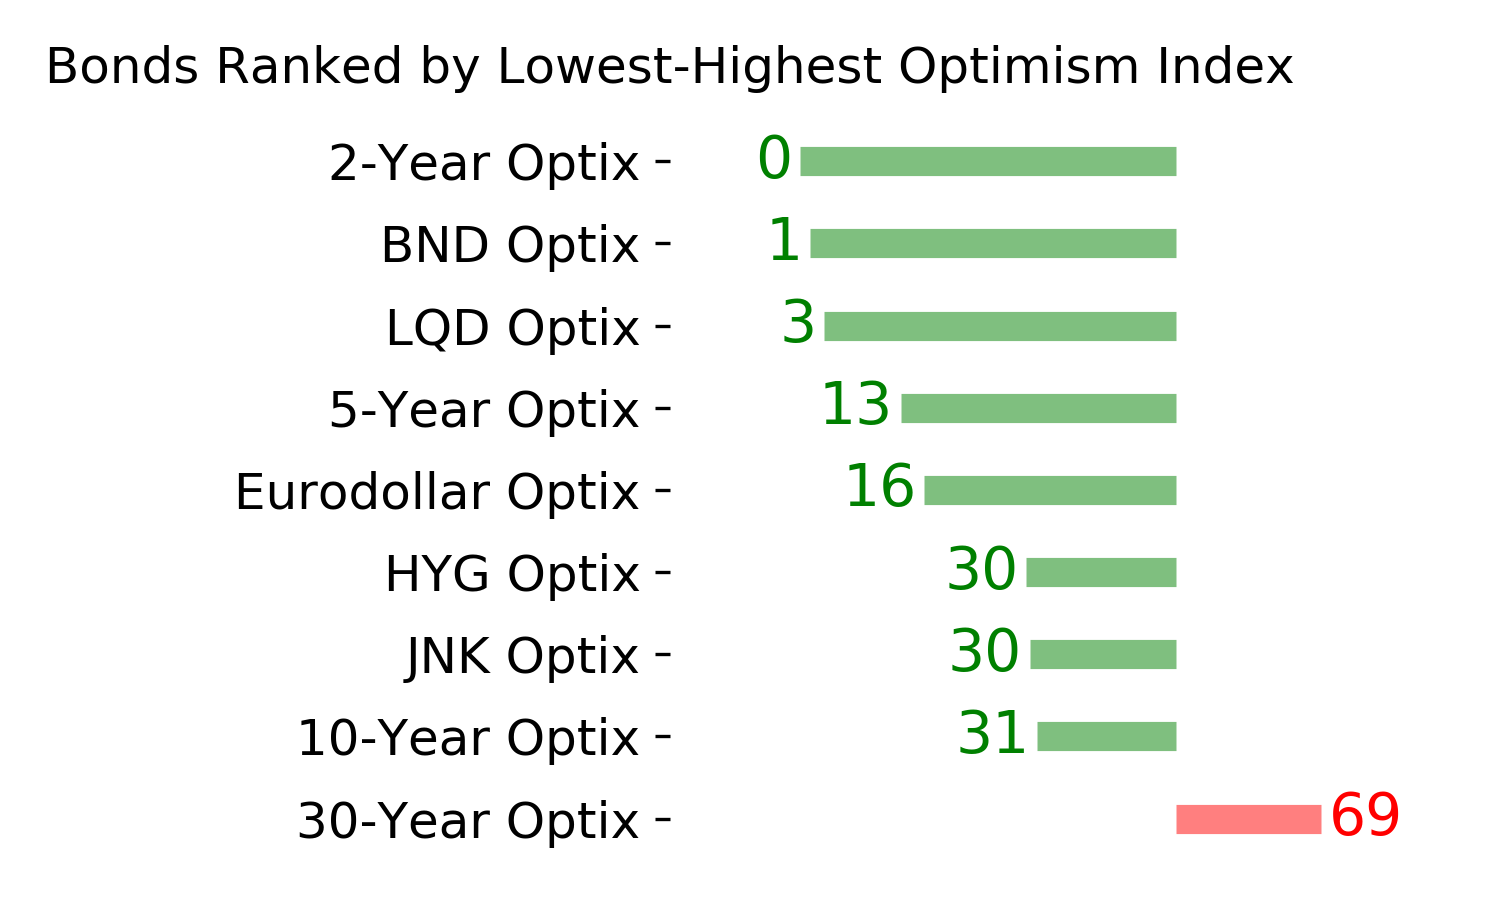
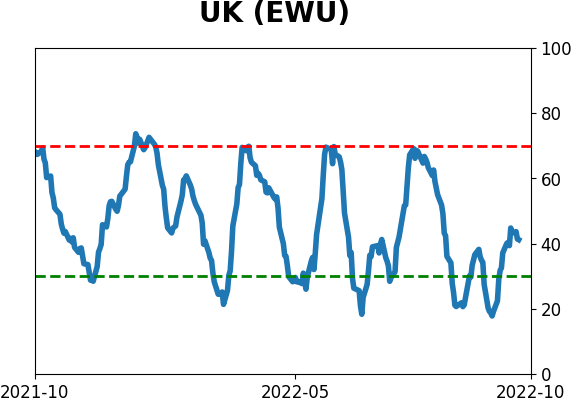
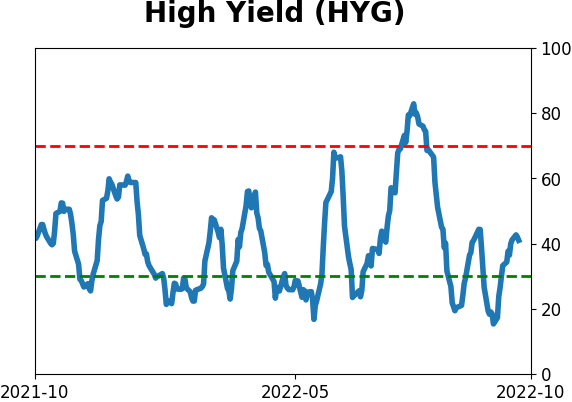
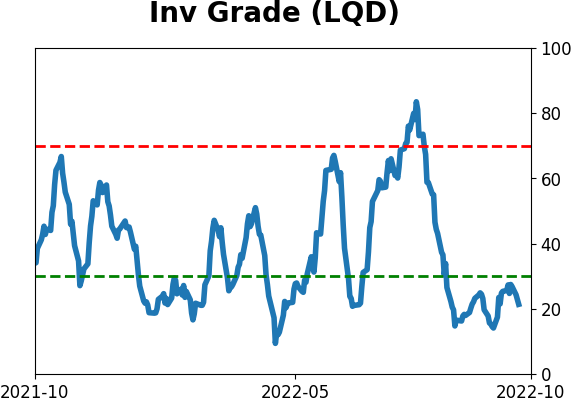
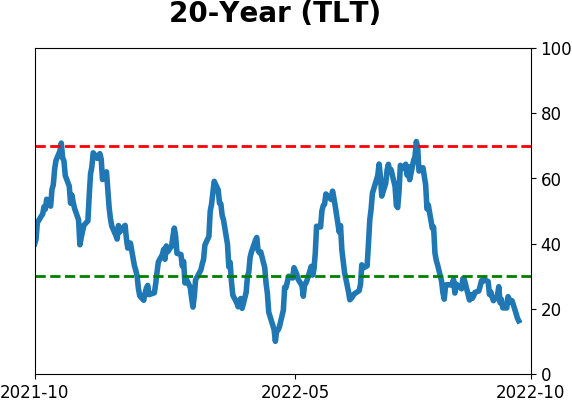
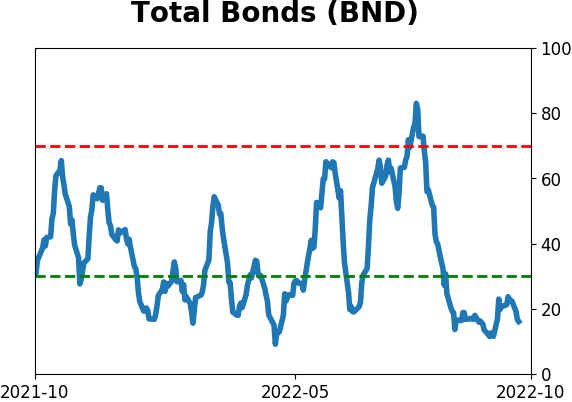
Bond ETF's - 10-Day Moving Average
|
|
|
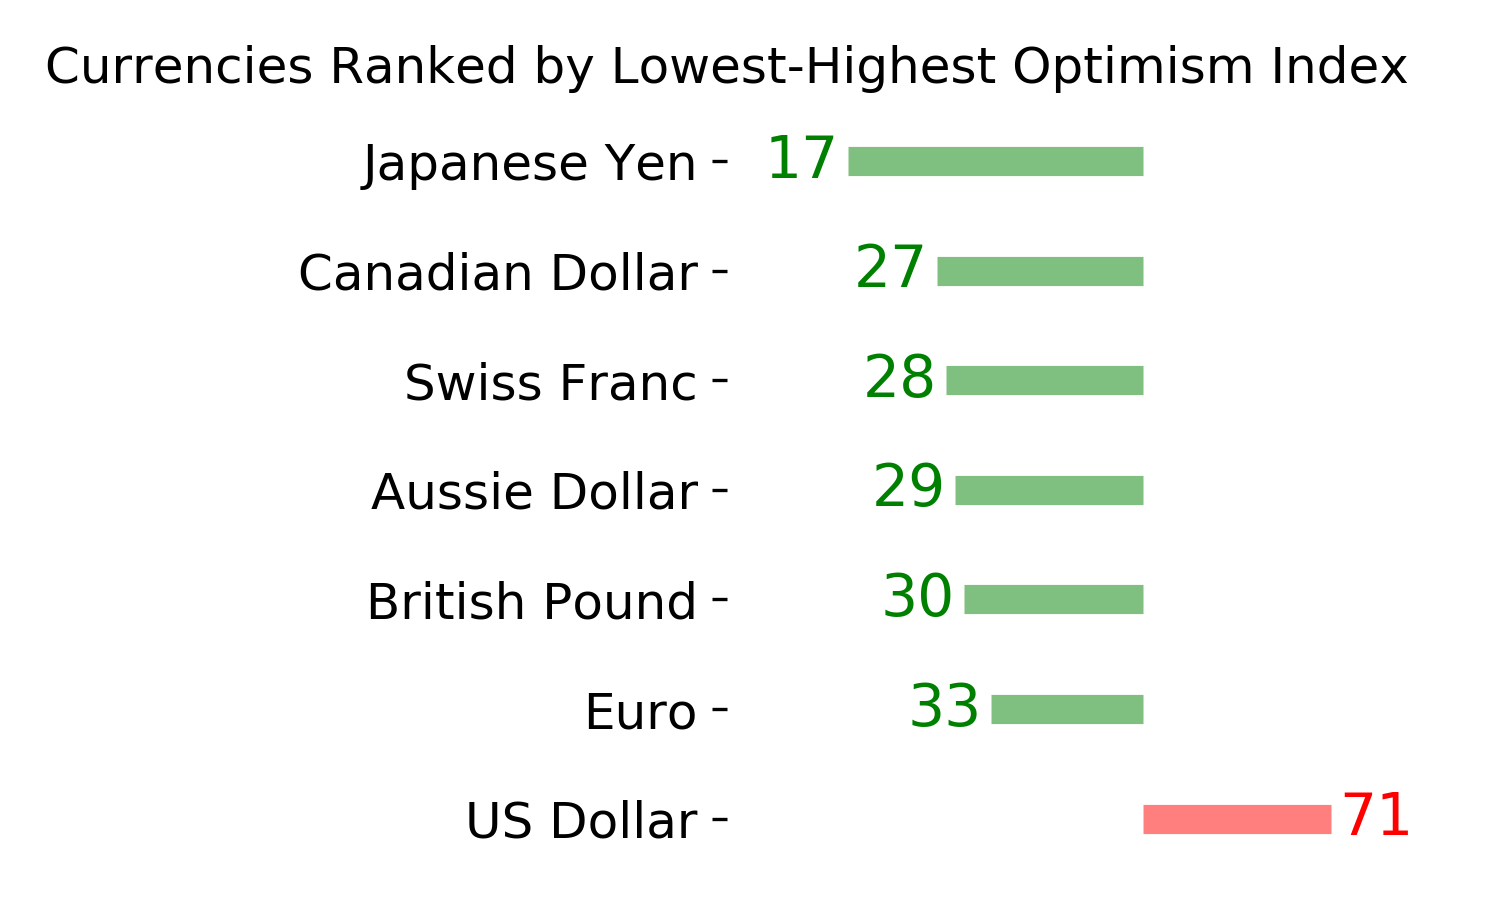
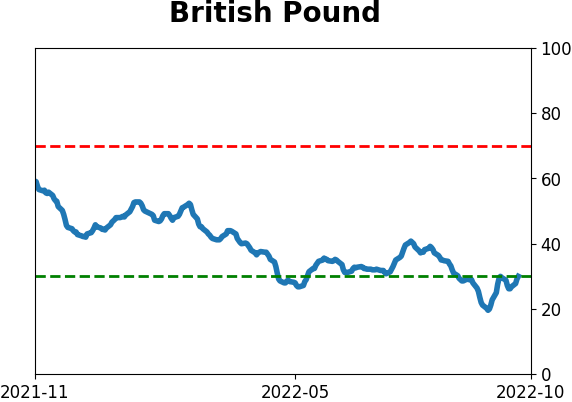
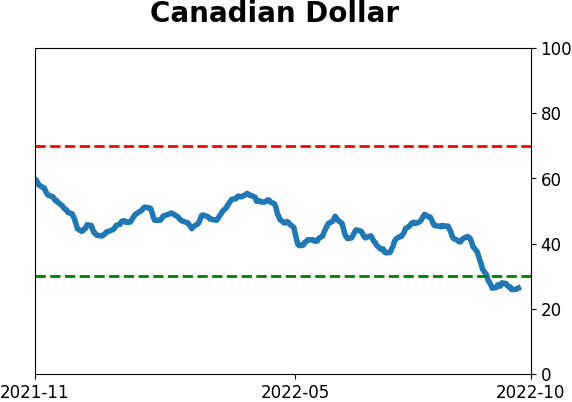
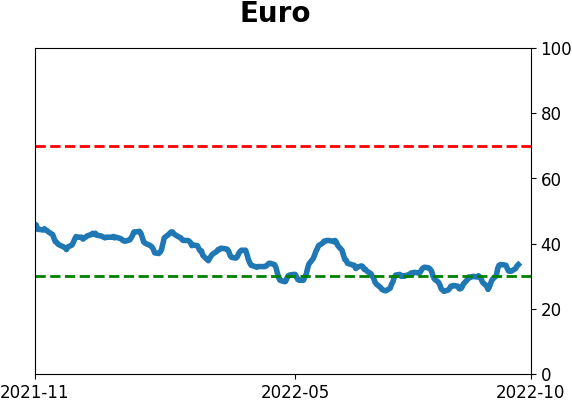
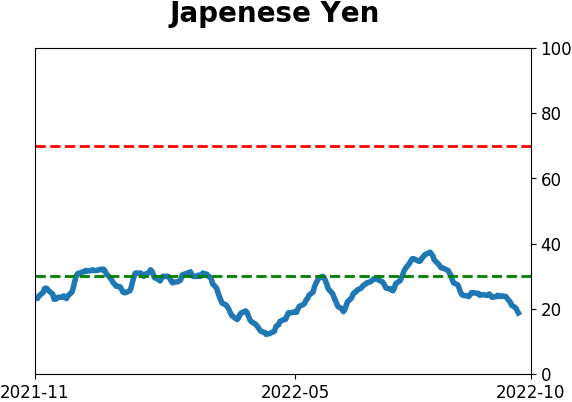
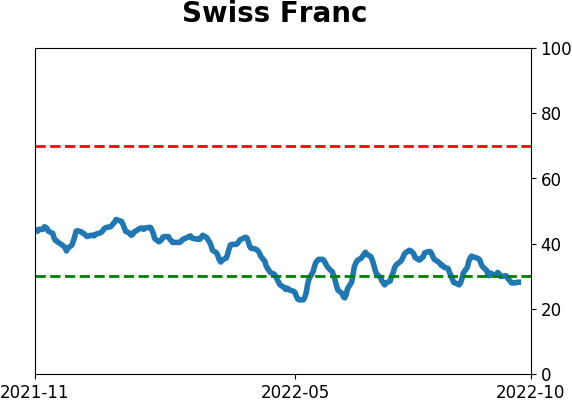
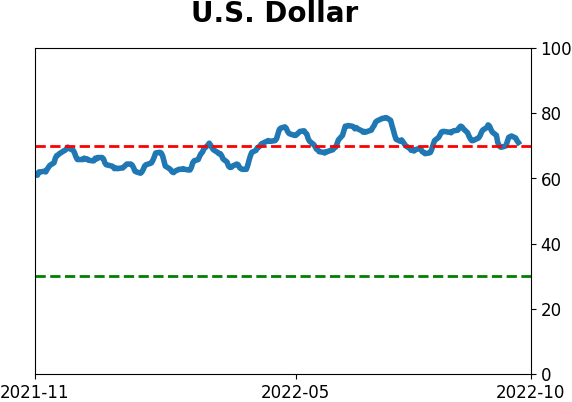
Currency ETF's - 5-Day Moving Average
|
|
|
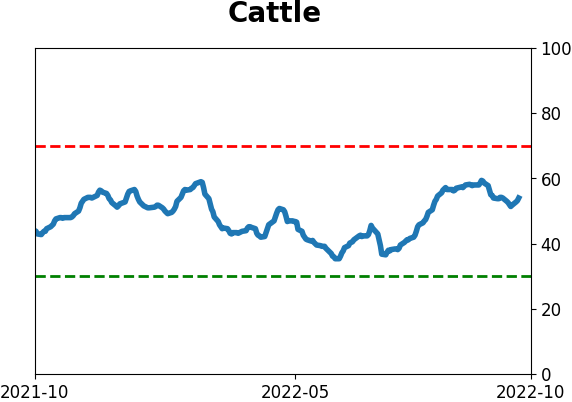
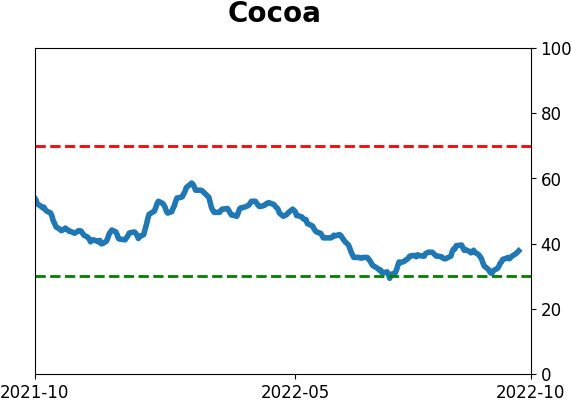
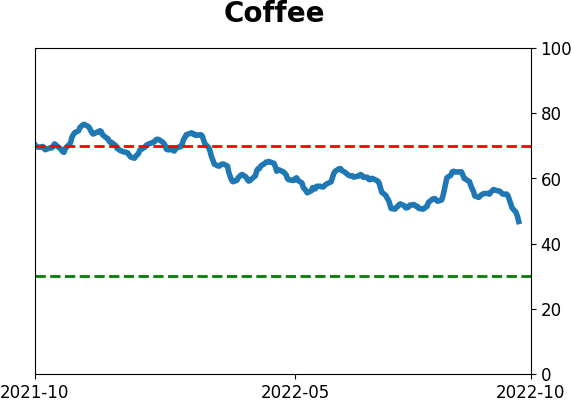
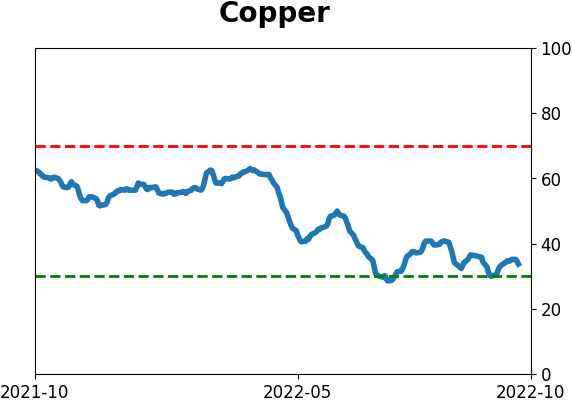
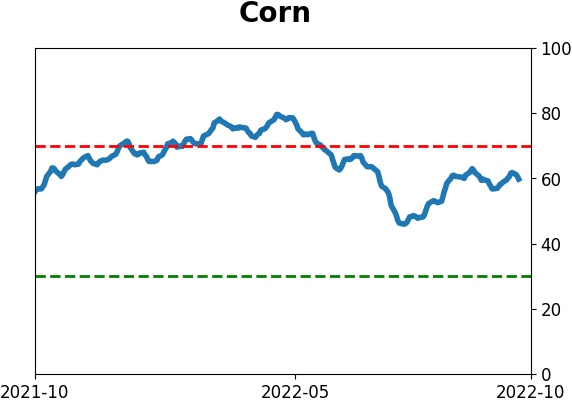
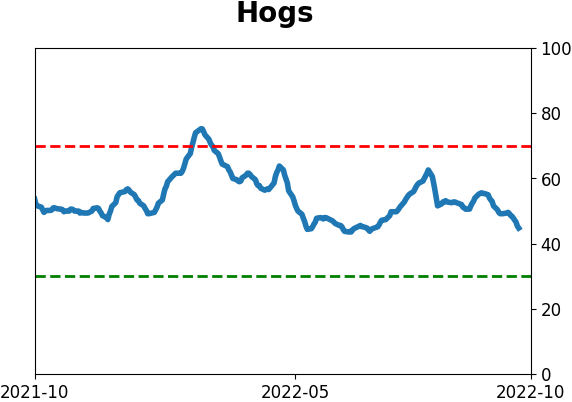
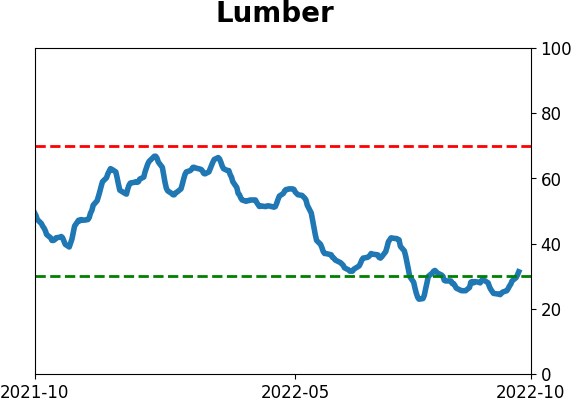
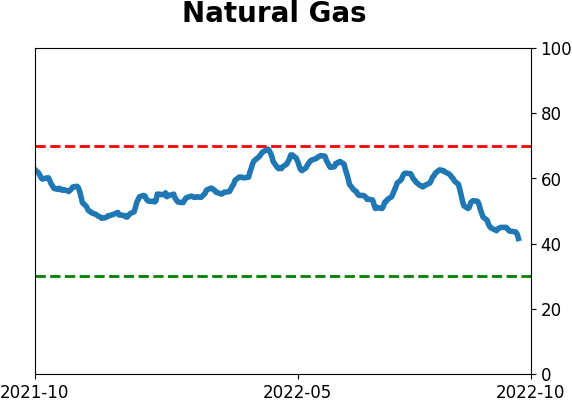
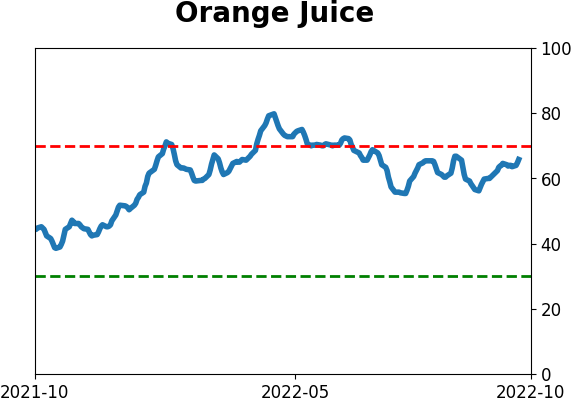
Commodity ETF's - 5-Day Moving Average
|
|