Headlines
|
|
Closed end municipal bond funds suffer a historic discount:
Municipal bond funds are among the corners of the investment landscape that have become untouchable. A particular set of challenges for some of the bonds have caused the discounts on some closed-end funds to blow out to 14% or more. Over the past 35 years, similarly wide discounts proved to be opportunities.
|
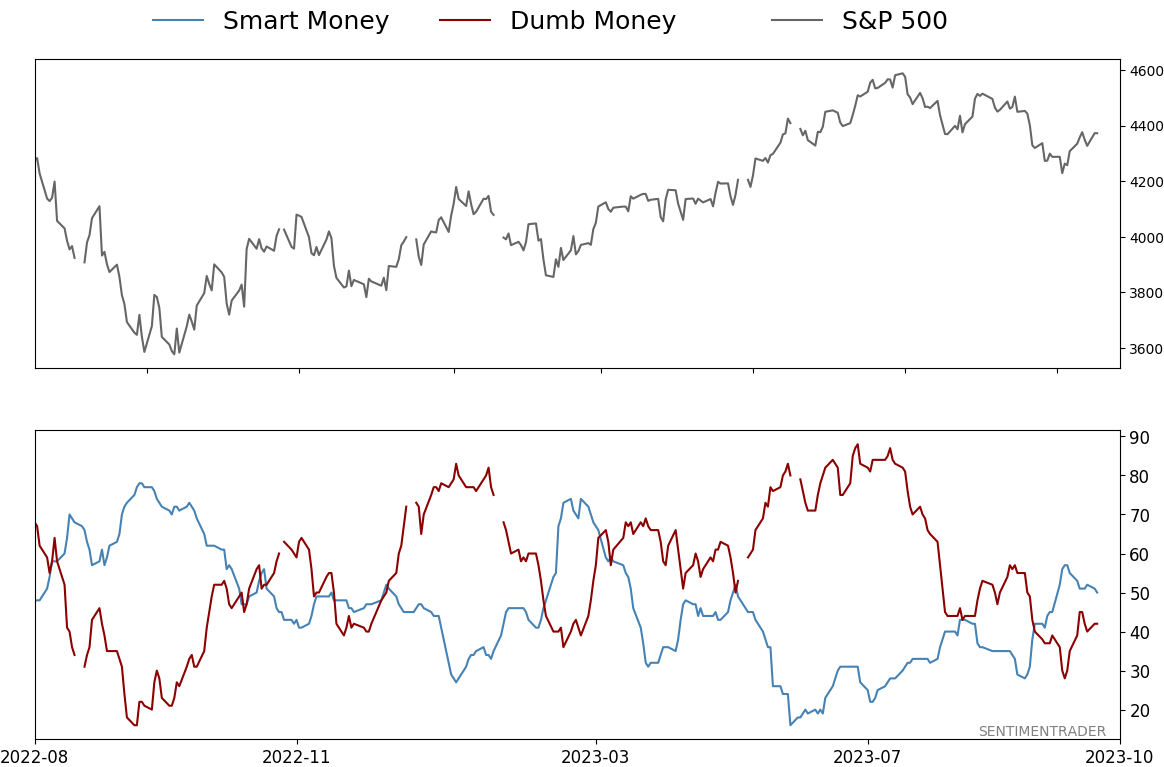
Smart / Dumb Money Confidence
|
Smart Money Confidence: 50%
Dumb Money Confidence: 42%
|
|
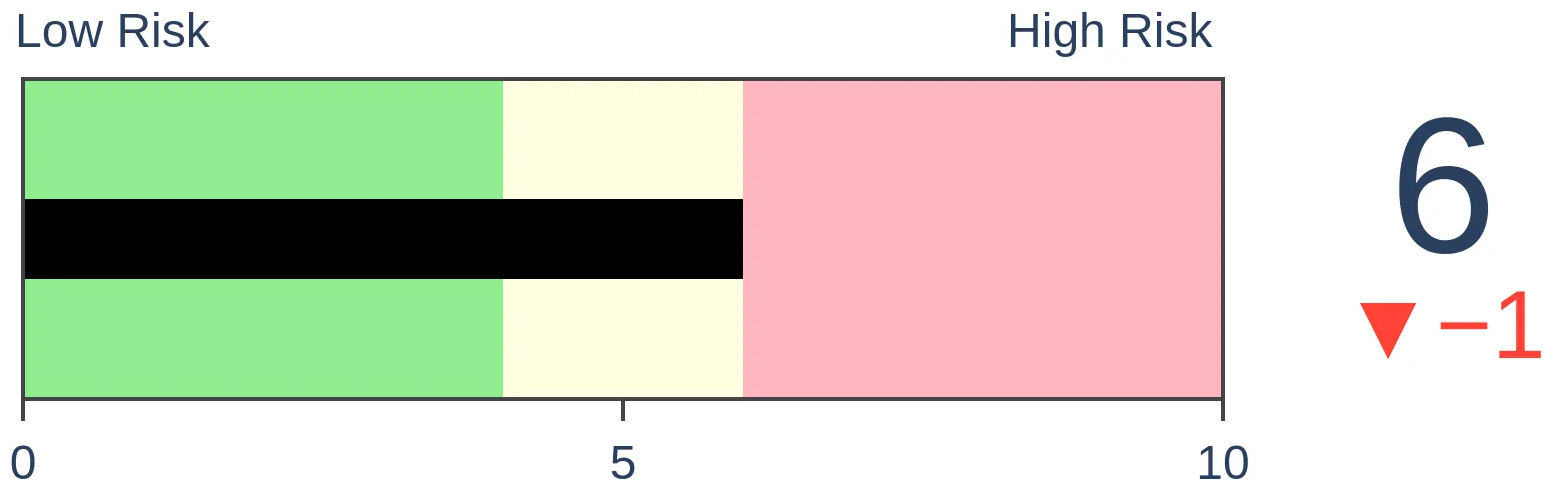
Risk Levels
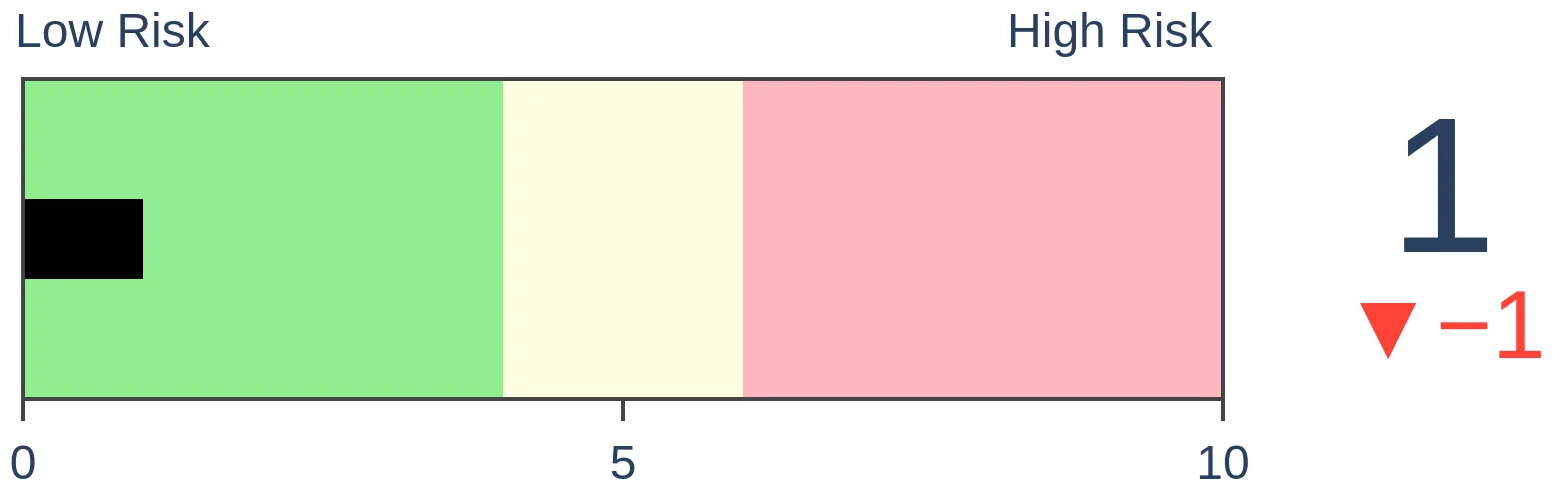
Stocks Short-Term
|
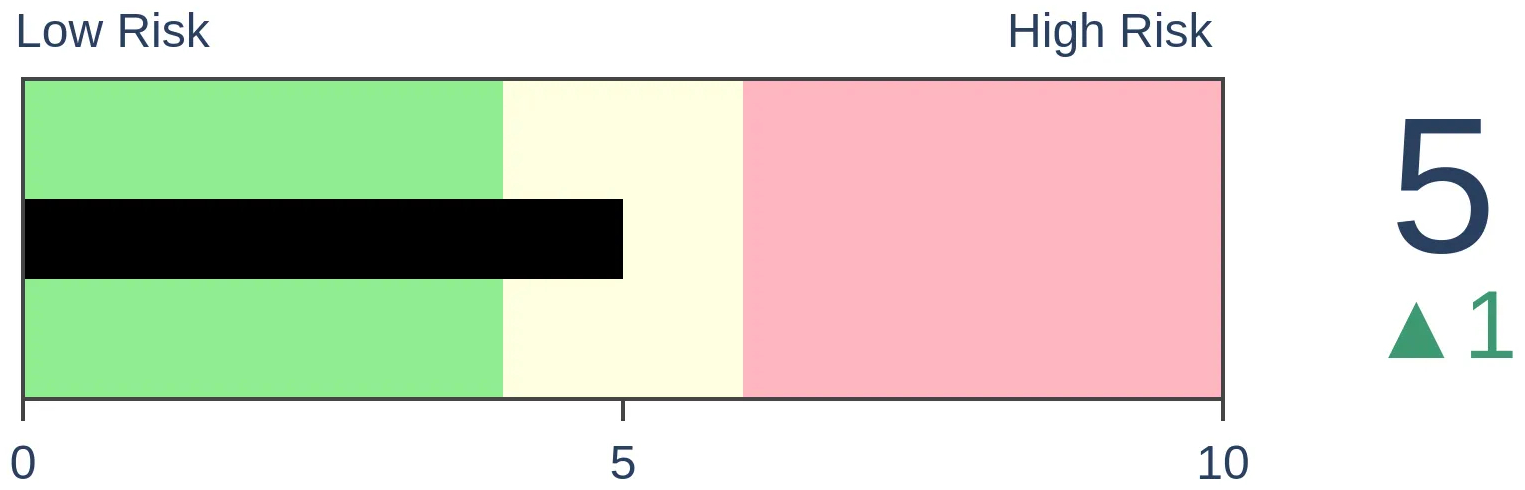
Stocks Medium-Term

|
|
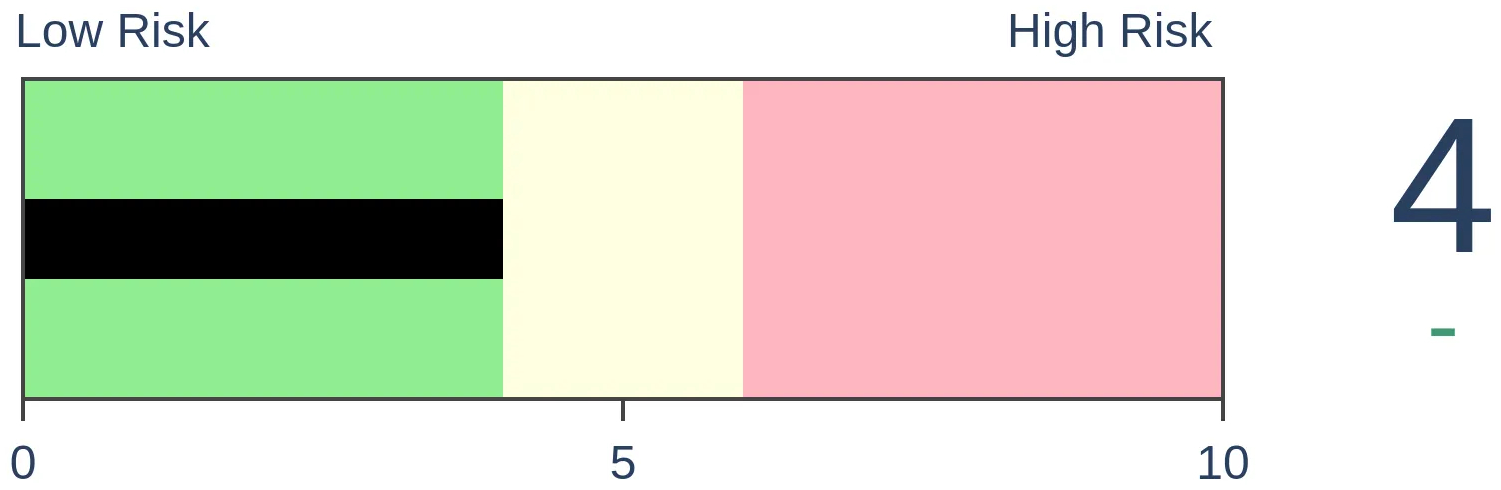
Bonds
|
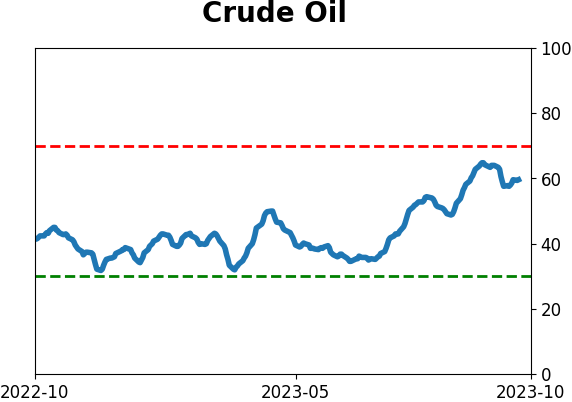
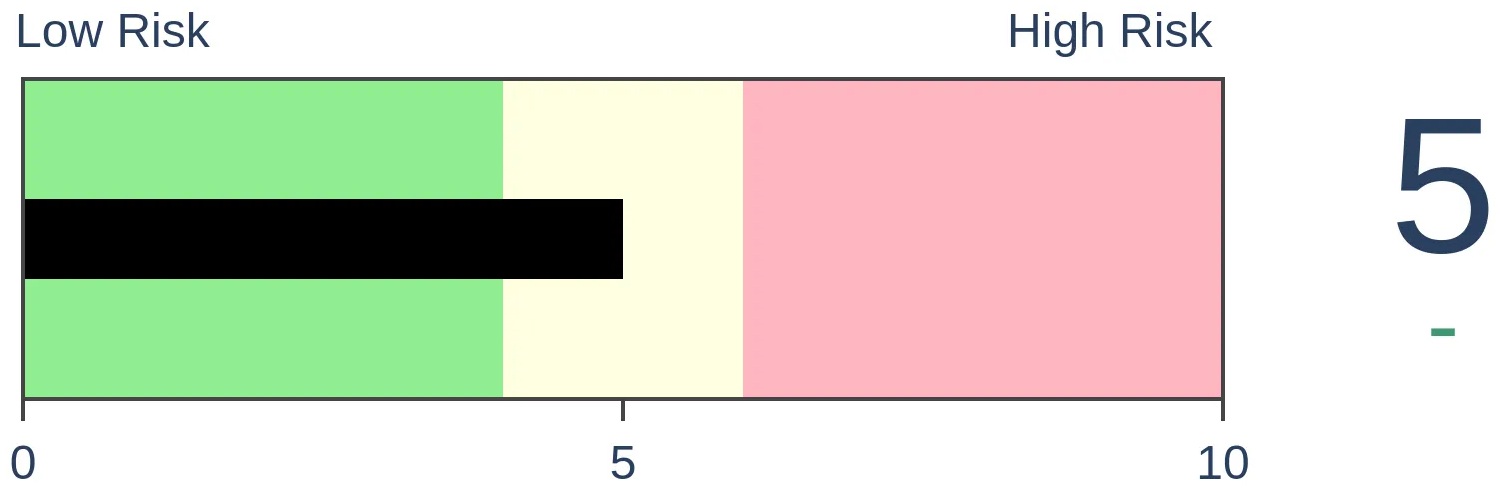
Crude Oil
|
|
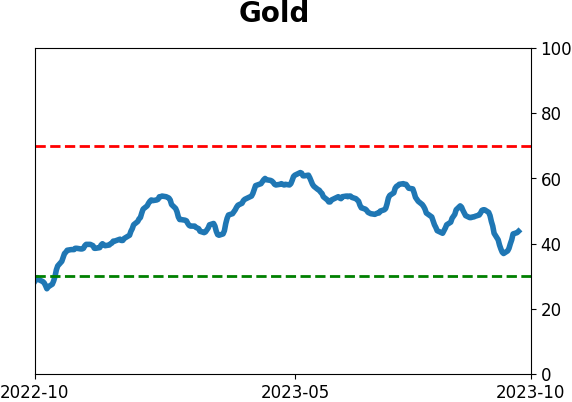
Gold
|
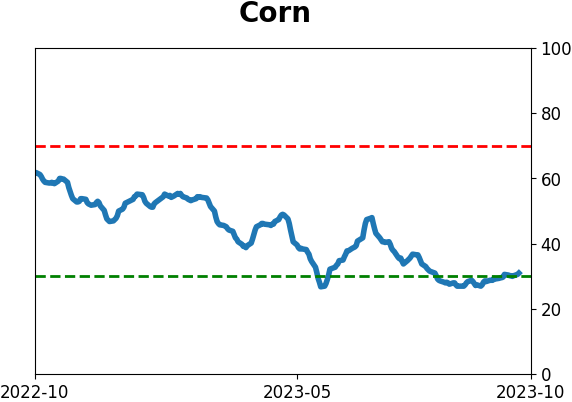
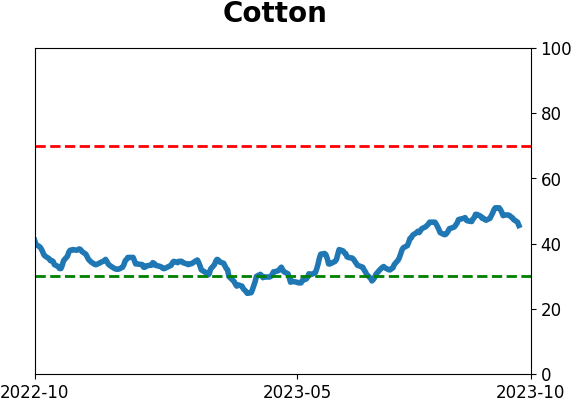
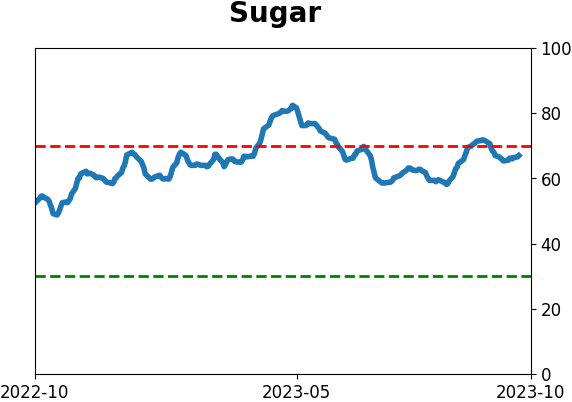
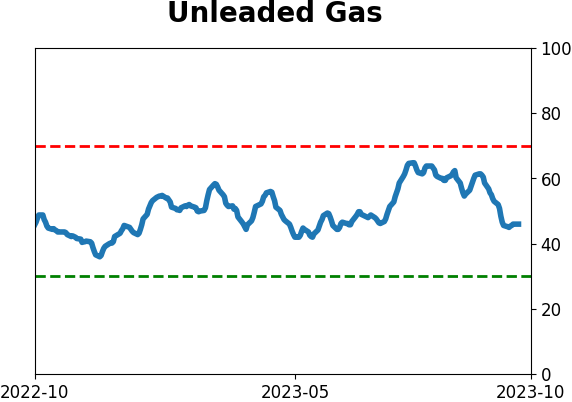
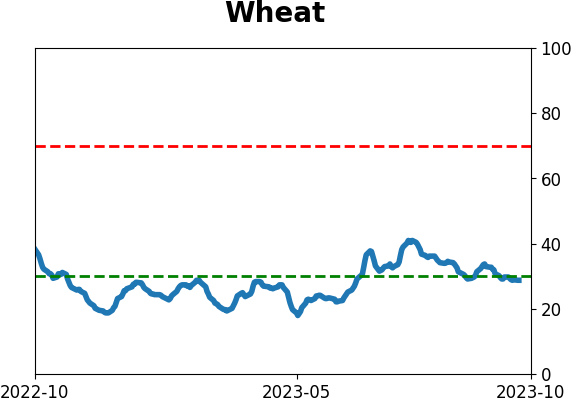
Agriculture
|
|
Research
By Jason Goepfert
BOTTOM LINE
Municipal bond funds are among the corners of the investment landscape that have become untouchable. A particular set of challenges for some of the bonds have caused the discounts on some closed-end funds to blow out to 14% or more. Over the past 35 years, similarly wide discounts proved to be opportunities.
FORECAST / TIMEFRAME
None
|
Key points:
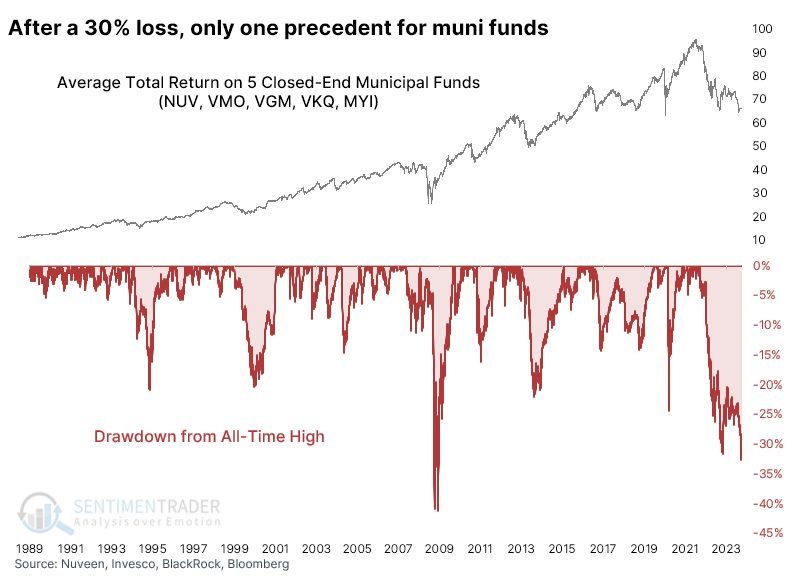
- Closed-end municipal bond funds have suffered huge losses over the past year, down 30% or more
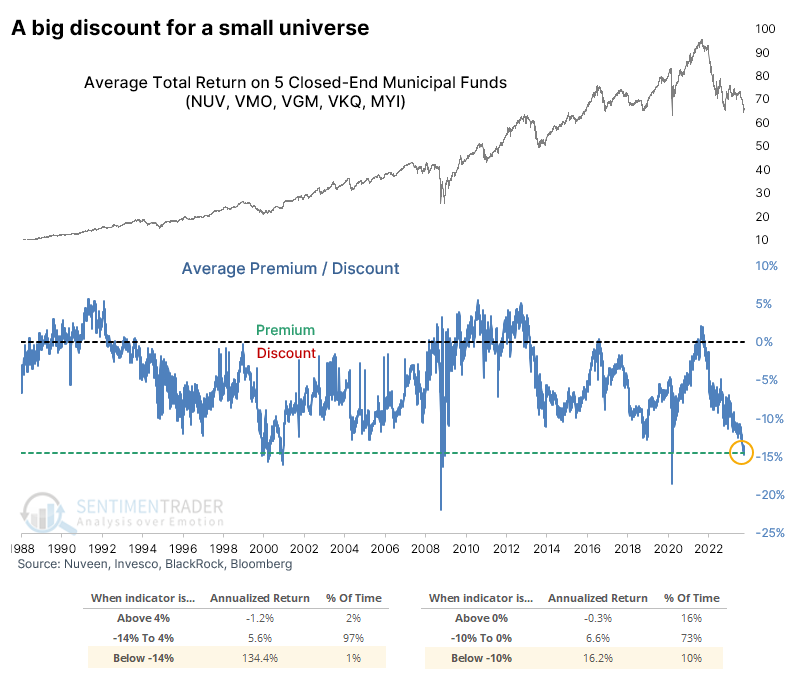
- Five established funds are currently trading at more than 14% discounts to their net asset value
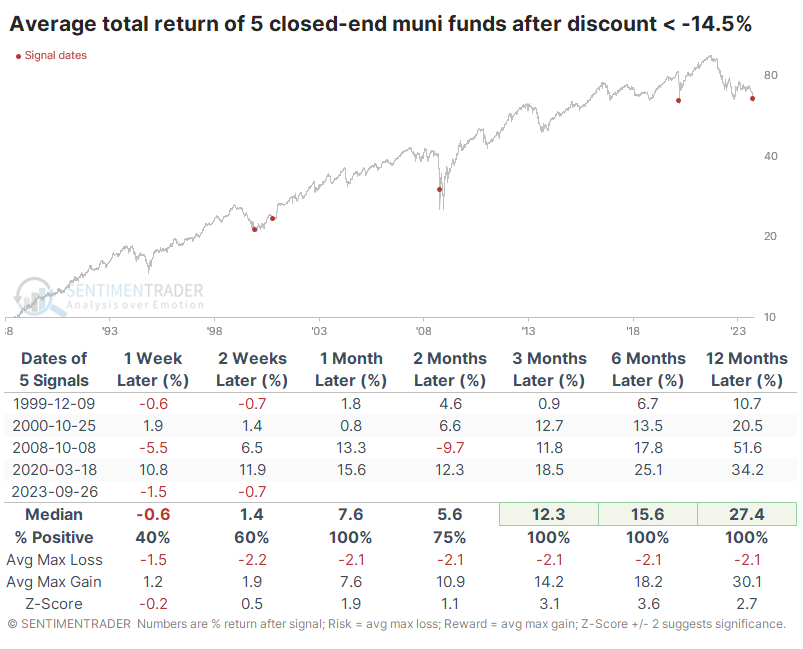
- The few other times the funds traded at such wide discounts, they showed significant gains ahead
A risky time to have held a "safe" fund
While major indexes took a spill over the past couple of months, they've mostly held well above their lows from last fall. Some isolated pockets, like defensive stocks, have not reacted well and are probing or exceeding those lows.
Municipal bonds can be added to that list. As highlighted by The Wall Street Journal:
Some municipal-bond funds are suffering their worst stretch since the 2008-09 financial crisis, an acute example of how two years of rising interest rates have slammed investors' portfolios.
Closed-end municipal-bond funds have been particularly hard-hit because they often use borrowed money to invest in fixed-rate, long-term bonds sold by state and local governments. The leverage helps boost the returns from debt that is ultrasafe, but pays relatively little interest.
When looking specifically at closed-end municipal bond funds, there has never been a time when they've traded so poorly for so long. A proxy index of five funds that have among the longest history (that I could find, anyway) has drawn down more than 30% from their peak. That was exceeded briefly during the 2008 financial crisis but is far beyond anything outside of that and has gone on for longer.
The funds are trading at a historically wide discount to their net asset value. The chart below shows the average premium/discount for the five funds going back to 1988.
The risk/reward on these investments has been poor when they trade at a premium to their asset value, with a negative annualized total return. However, when they have traded at a -10% or worse discount, the annualized return has spiked to +16.2%. After the few days when the discount blew out to -14% or larger discount (where they are today), that return skyrockets to +134.4%. This is where we should understand the disclaimer about past performance not being a guarantee of future results.
The five funds chosen for this proxy index were not cherry-picked because they have wide discounts to NAV. I screened the larger universe of closed-end muni funds and picked the five I could find with the longest history. Another proxy index using ten funds with the next-longest history dates back to 1999, and that average discount is even wider than the discount for the five shown above.
Massive discounts soon preceded reversions
Using a signal-based approach, the table below shows future total returns in the proxy index of these five funds when their average discount balloons to -14.5% or worse. This triggered in late September but remains the case today.
While this preceded some wicked volatility during the financial crisis, all the signals resolved higher from three months and beyond. A year later, each was up by double digits, though we have to consider the usual caveats about tiny sample sizes. Finding applicable precedents when dealing with once-a-decade kinds of moves is tough.
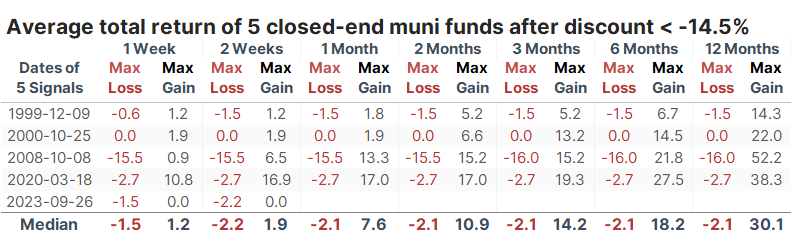
The table of maximum gains and losses across time frames shows the volatility in 2008. The funds were in a panic free-fall, along with virtually every other financial instrument. Within a week, the discounts blew out even further, and the funds lost more than 15% in value. Though it would have been challenging at the time, and maybe even foolhardy, if an investor had held on for just a bit longer, those losses were reversed and then some. Within a year, the funds gained more than 50%.
What the research tells us...
When we see a historically unusual spurt of behavior, we try to point it out, along with whatever the consequences were going back as far as we can. By definition, the sample sizes are going to be small. We're not trying to be peer-reviewing academics vying for tenure here. We're trying to find opportunities where investors may have overstepped in one direction or another. If there's one semi-constant in markets, it's investor behavior.
While tiny sample sizes aren't ideal, they can still be helpful because of the intractable tendency for humans to suffer jealousy, fear, euphoria, greed, and all the other goodies. Of course, this time is different when it comes to muni funds. It always is. Since they came into existence, they've never battled their current spate of challenges. So maybe the seeming panic among investors has been rendered irrelevant. I don't know. All I know is that betting on the exception is harder than the rule.
Indicators at Extremes
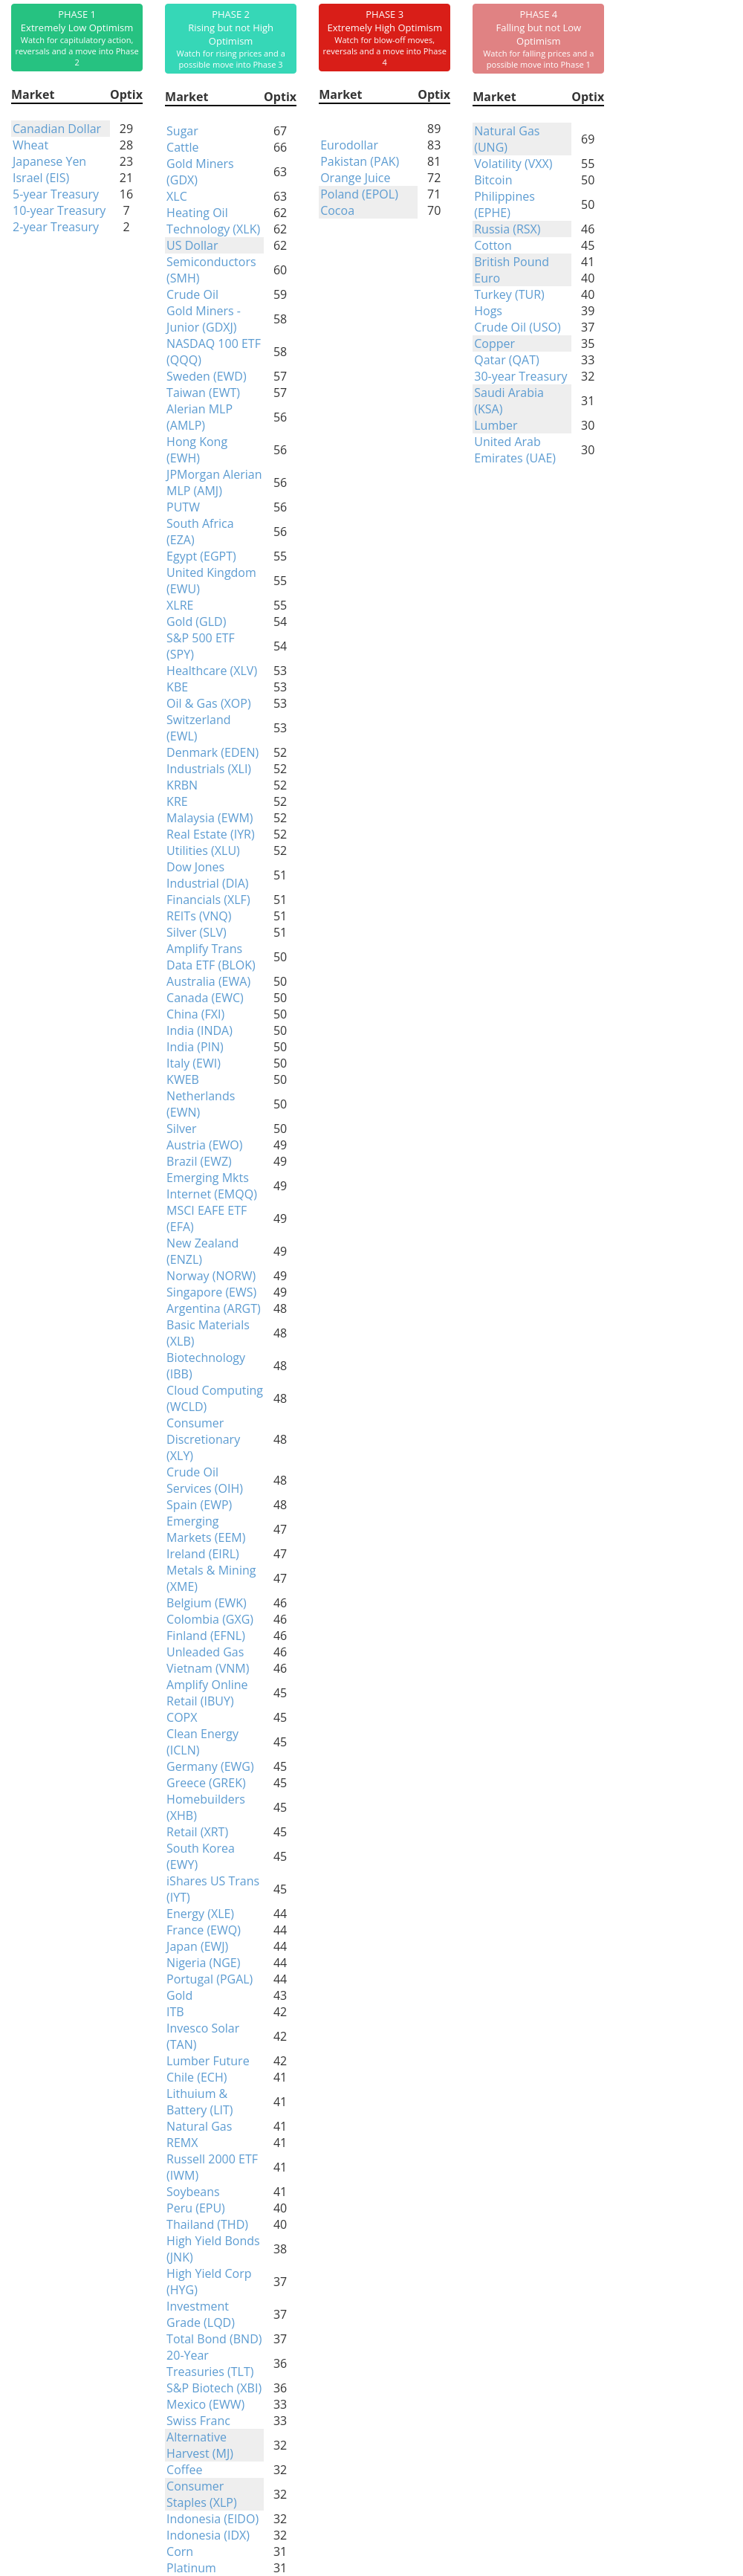
Phase Table
Ranks
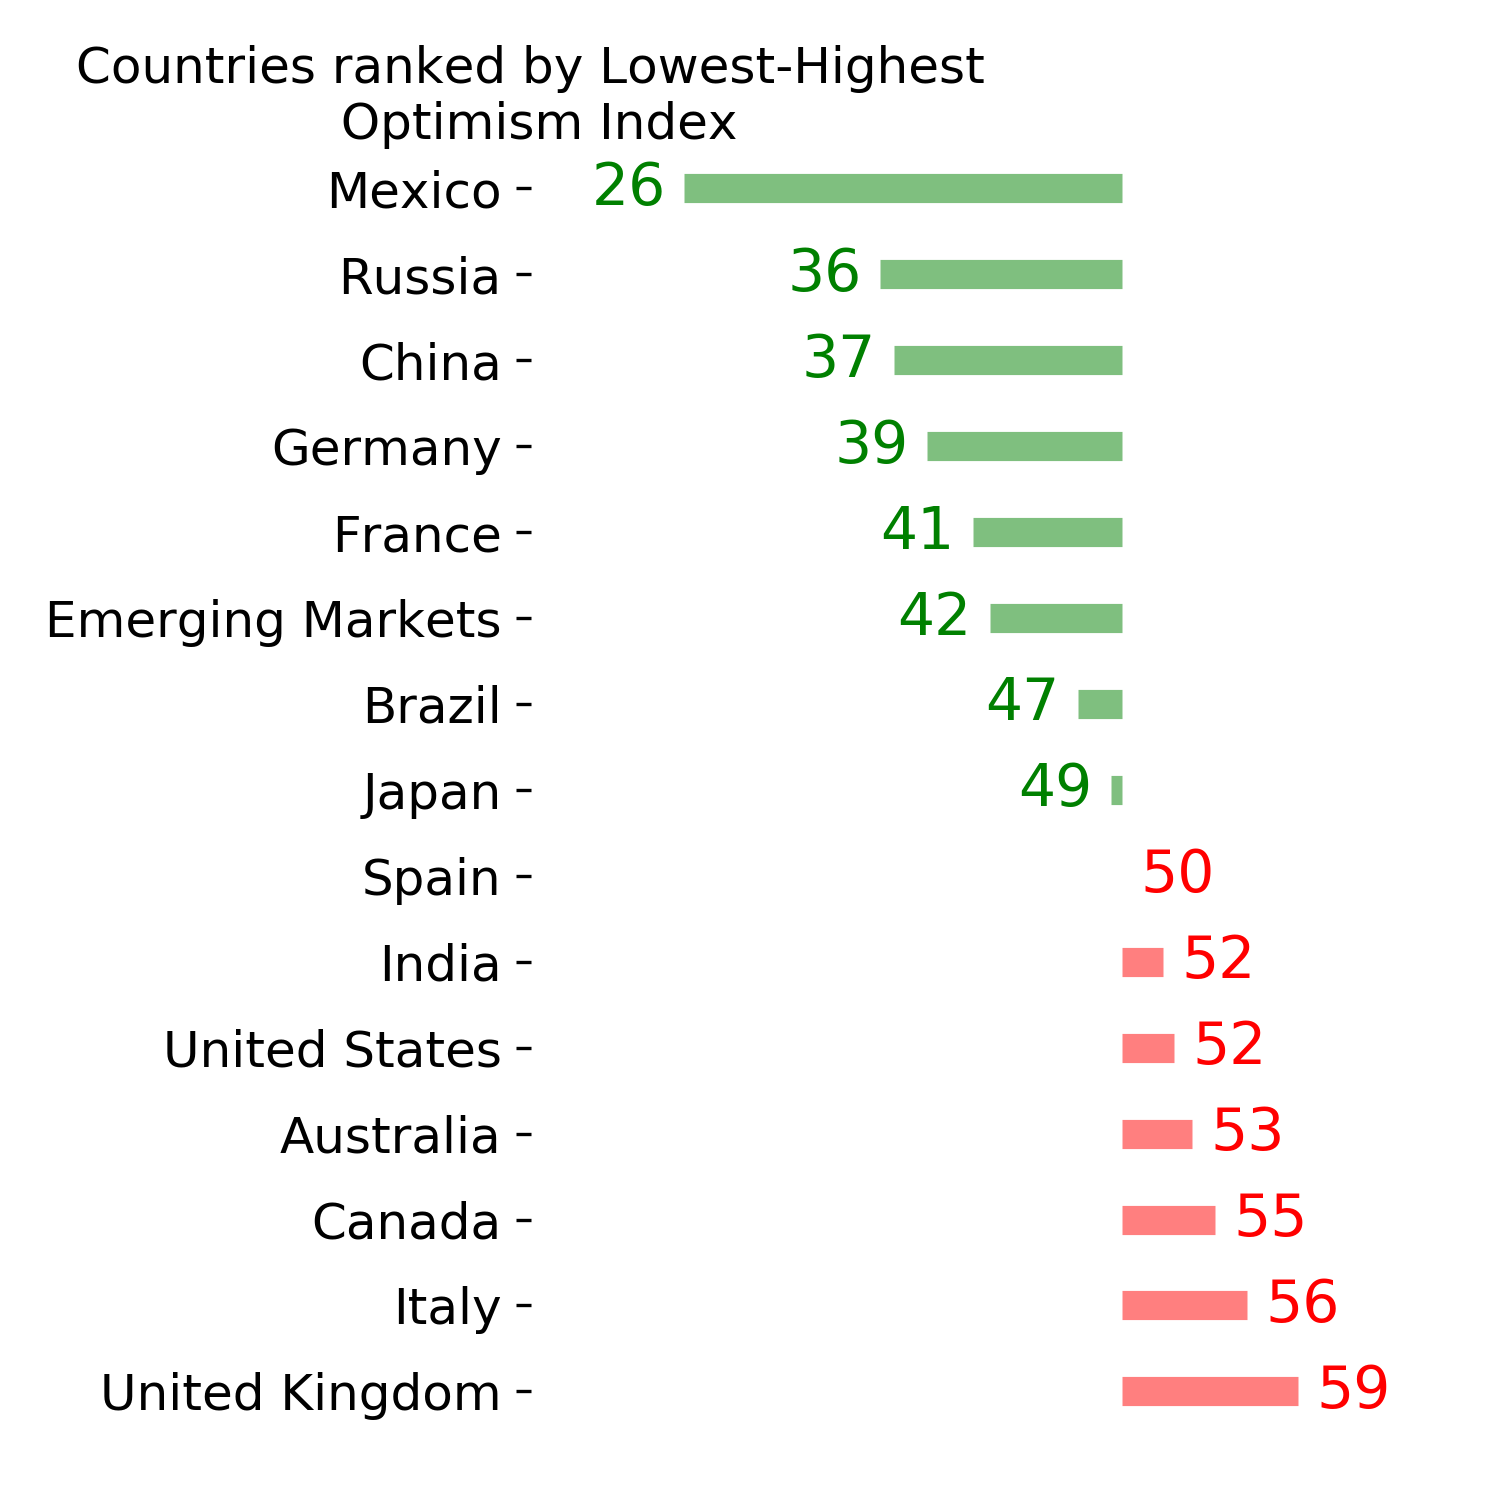
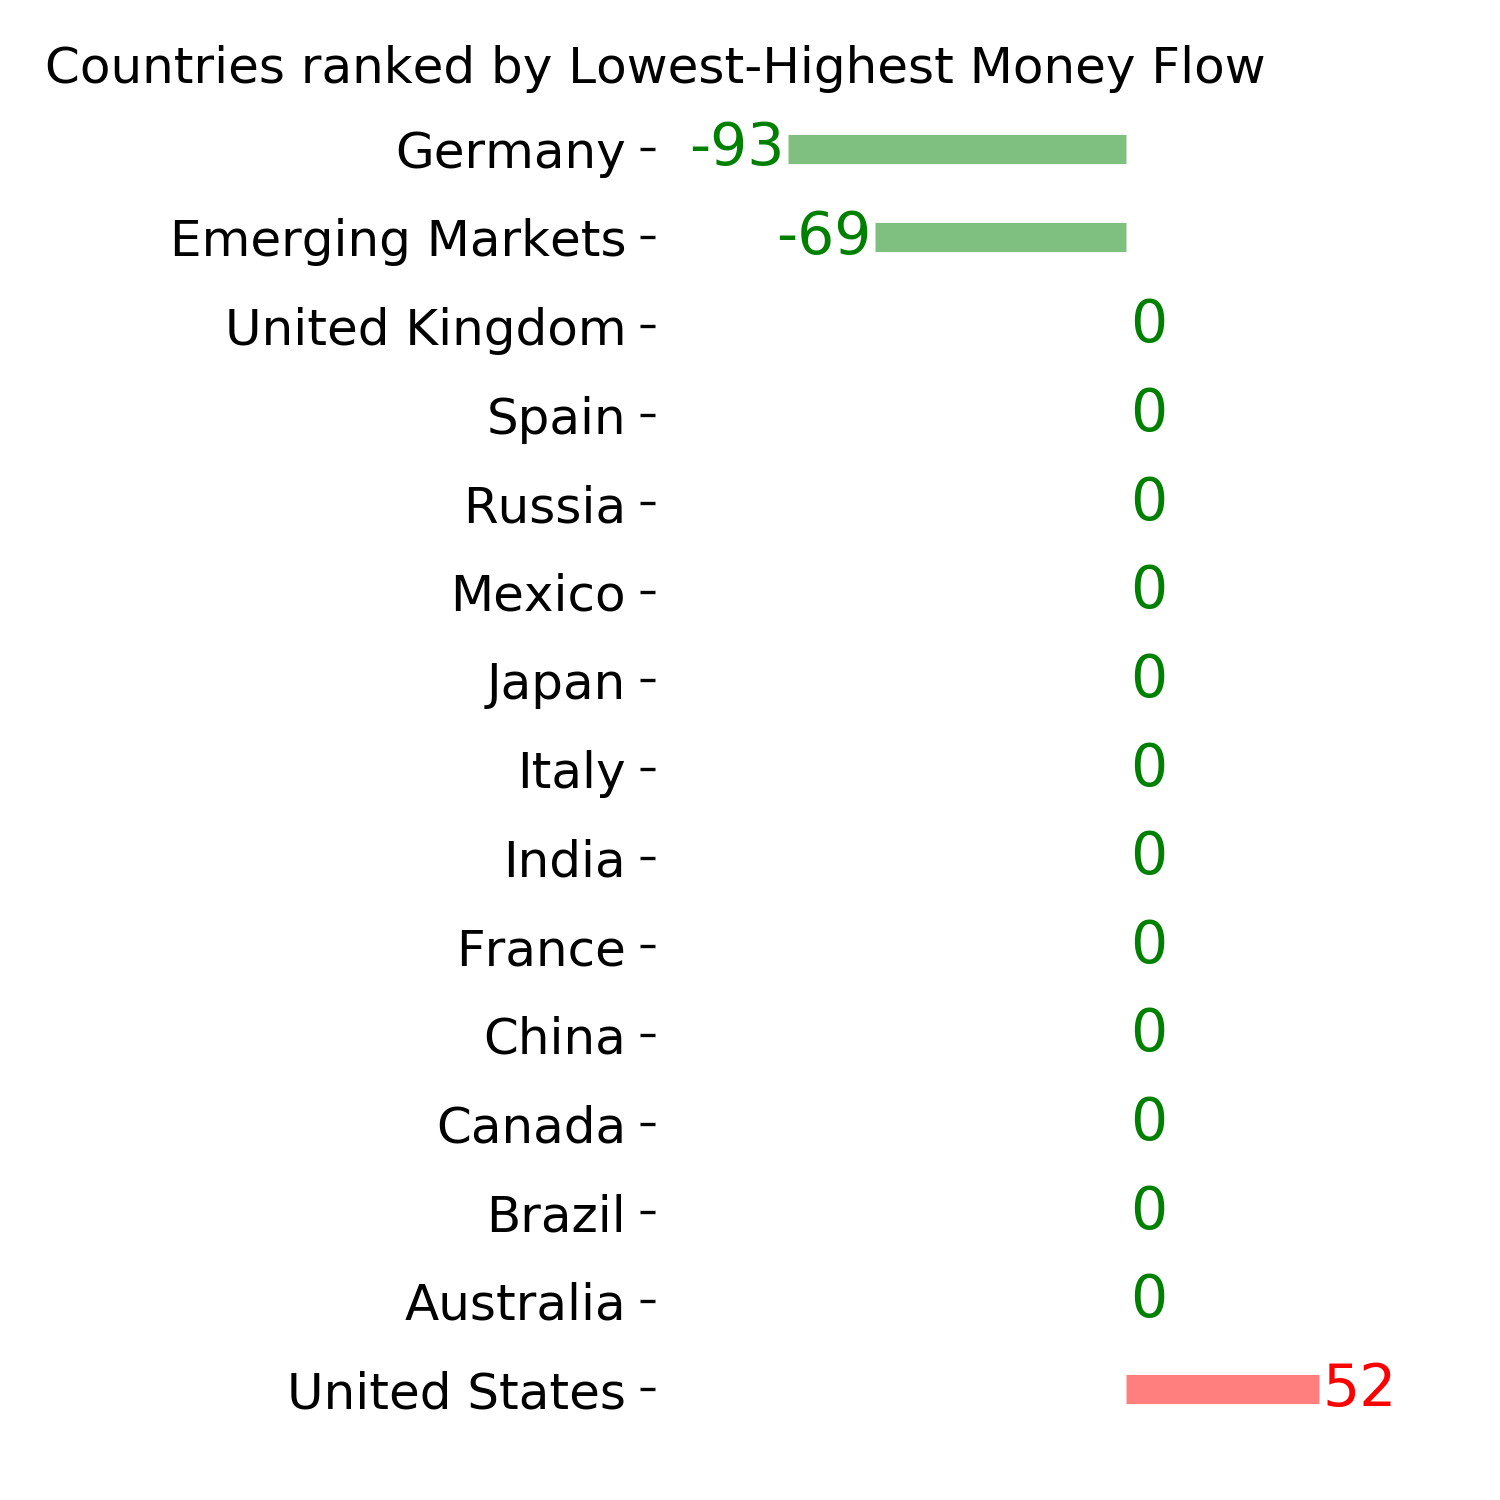
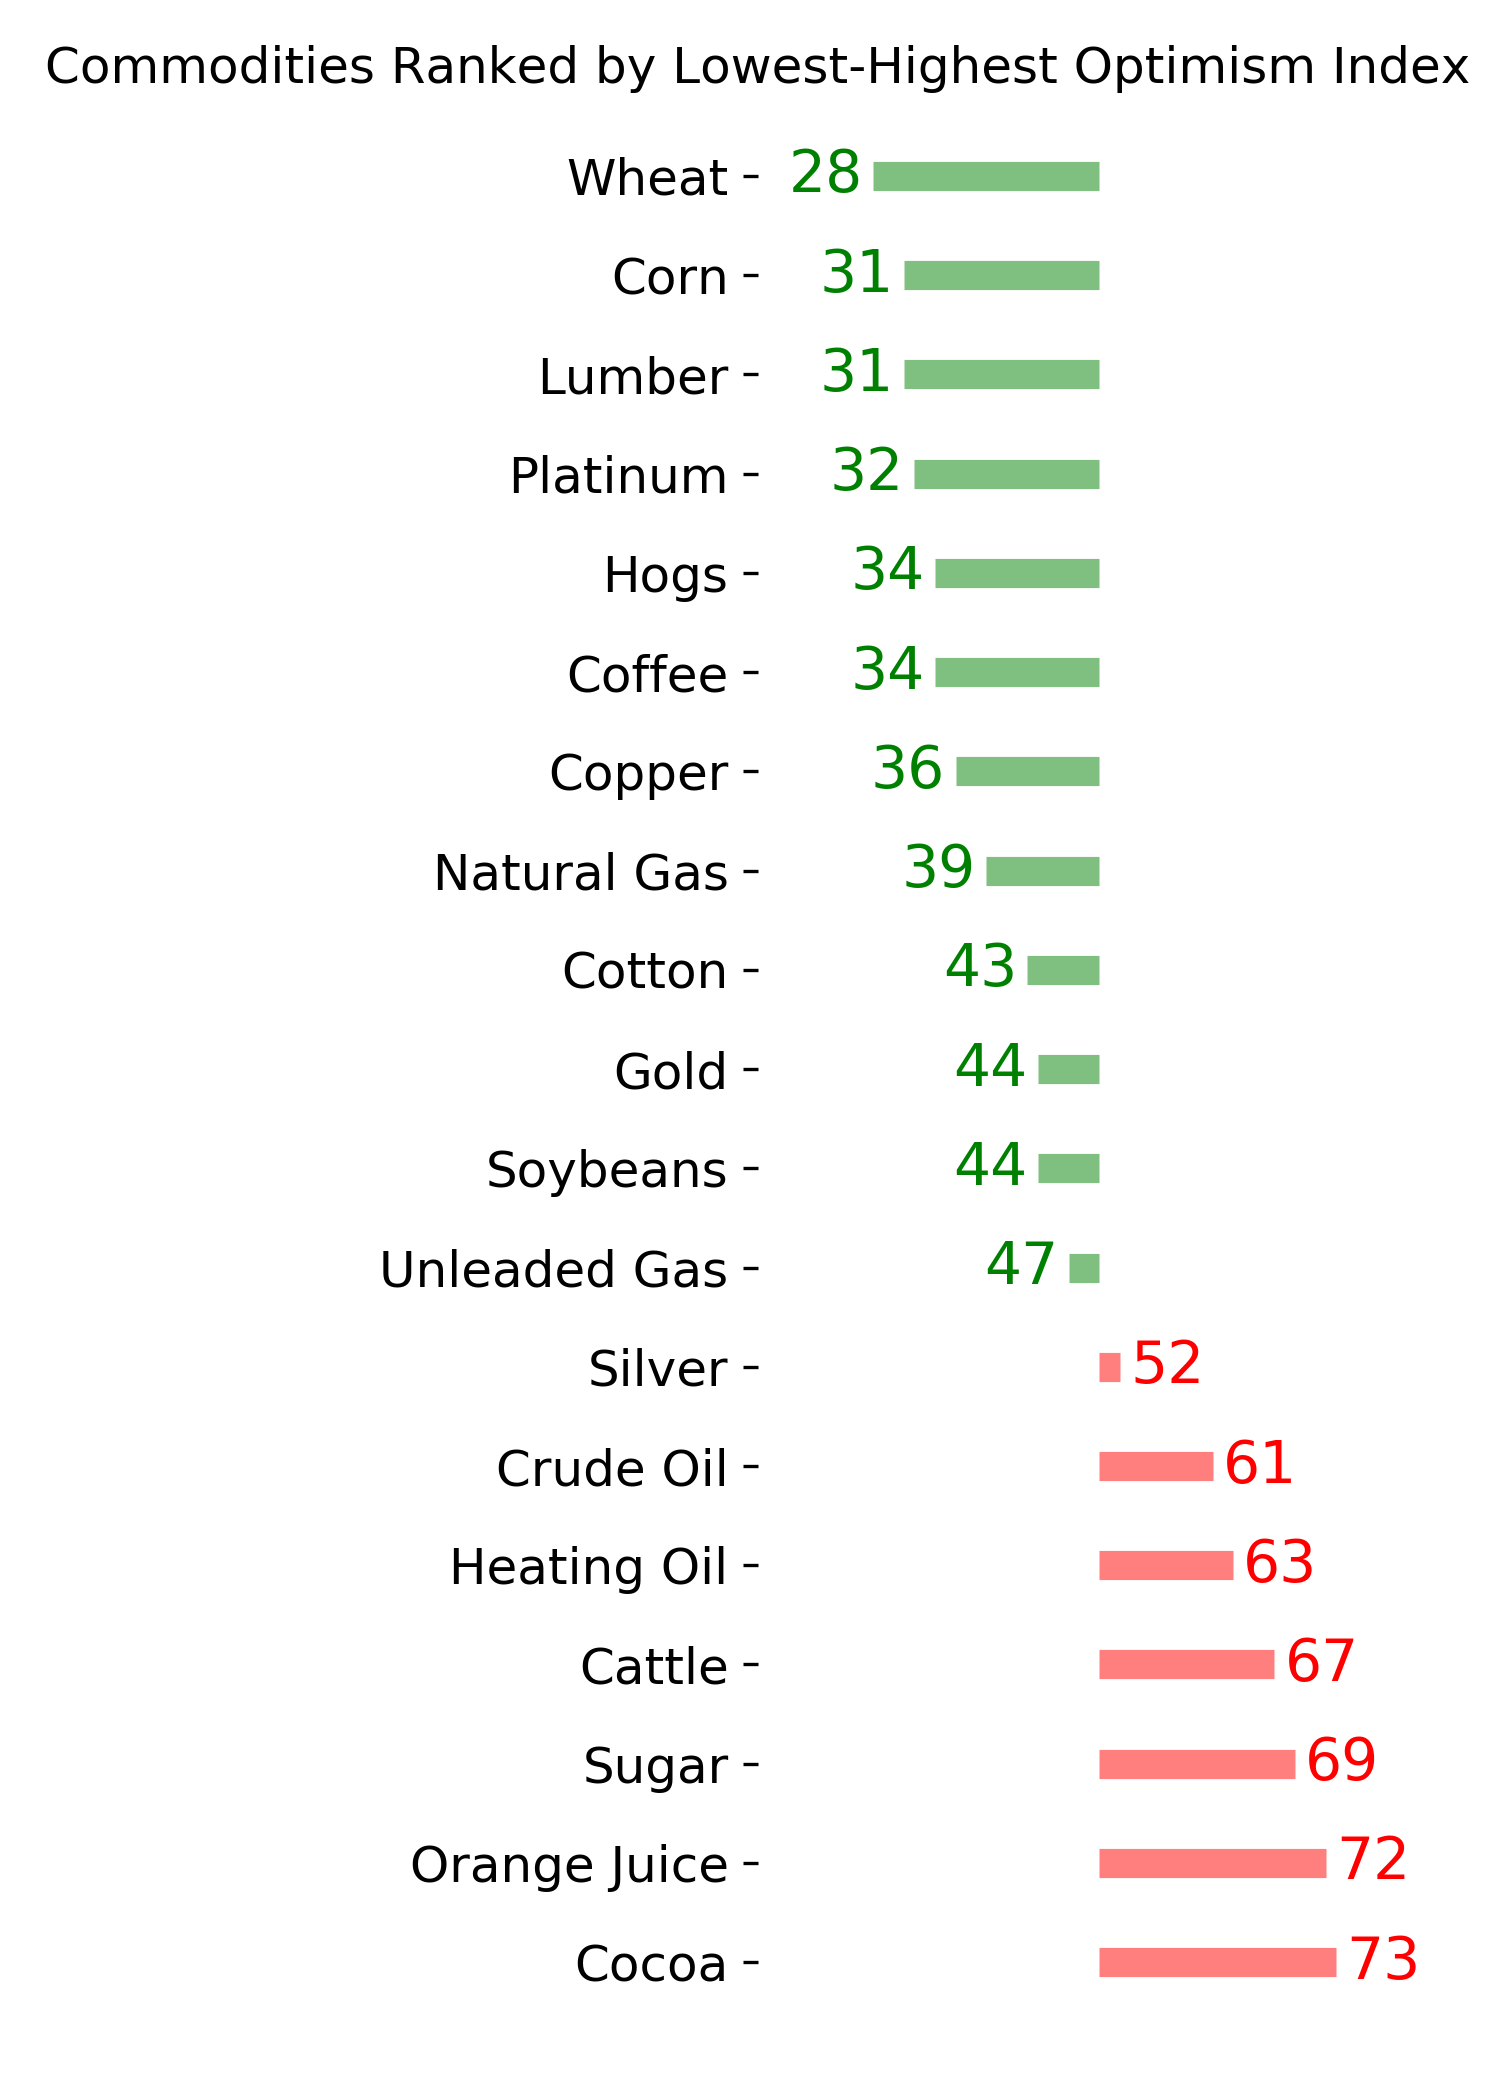
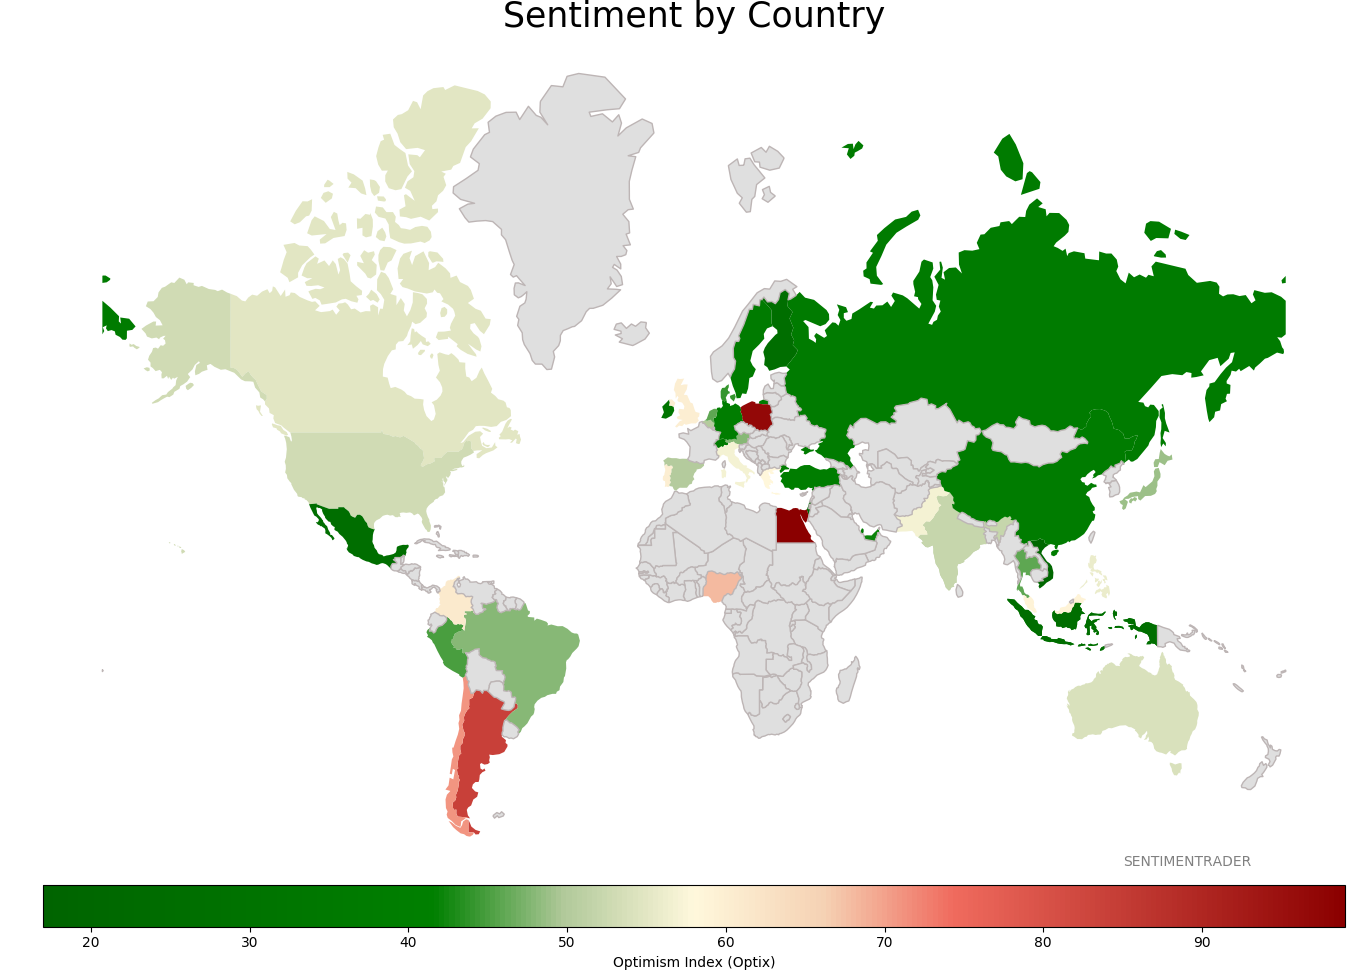
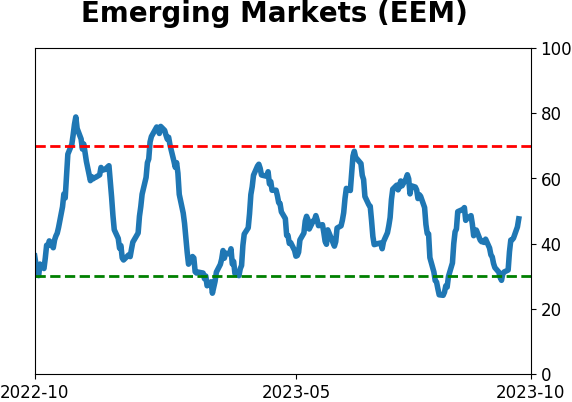
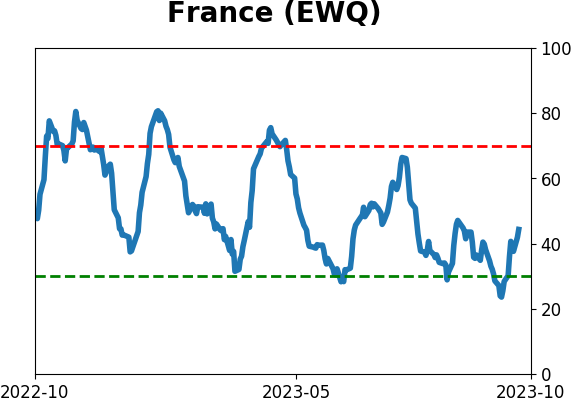
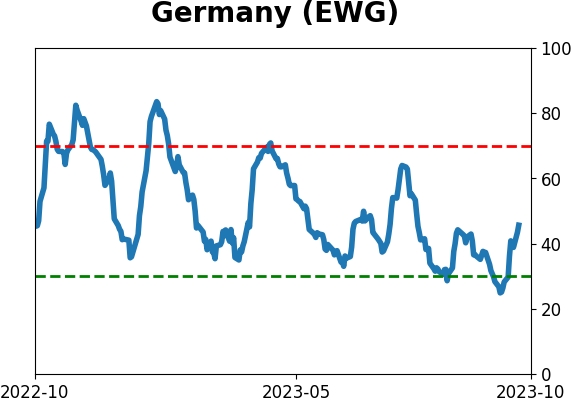
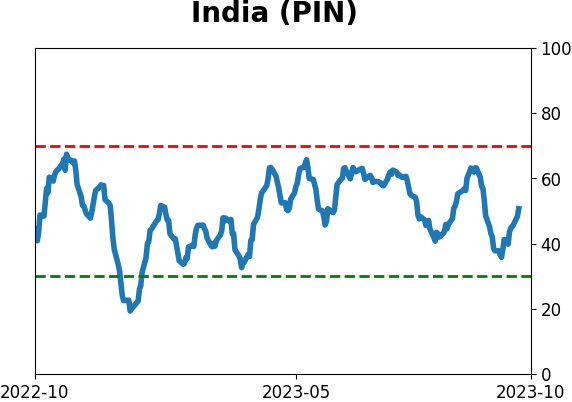
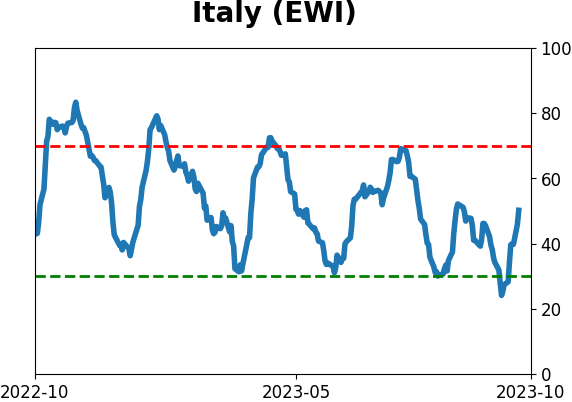
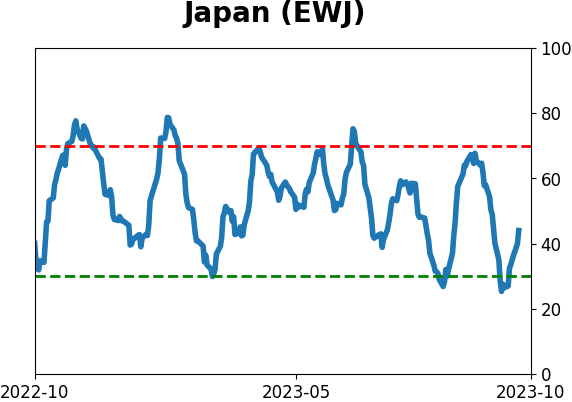
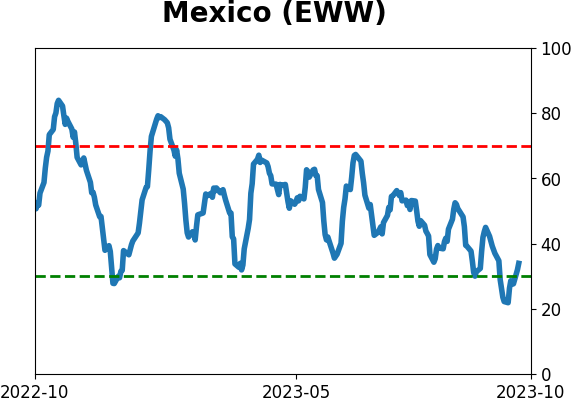
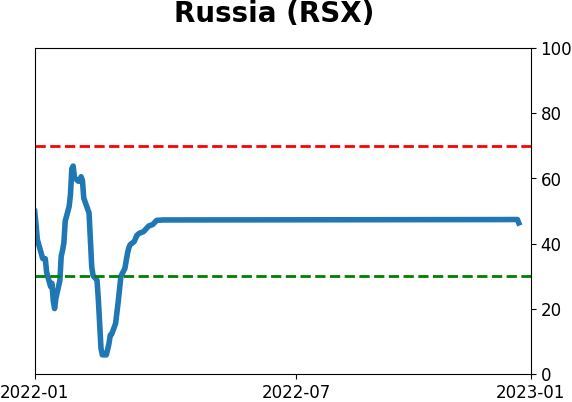
Sentiment Around The World
Optimism Index Thumbnails
|
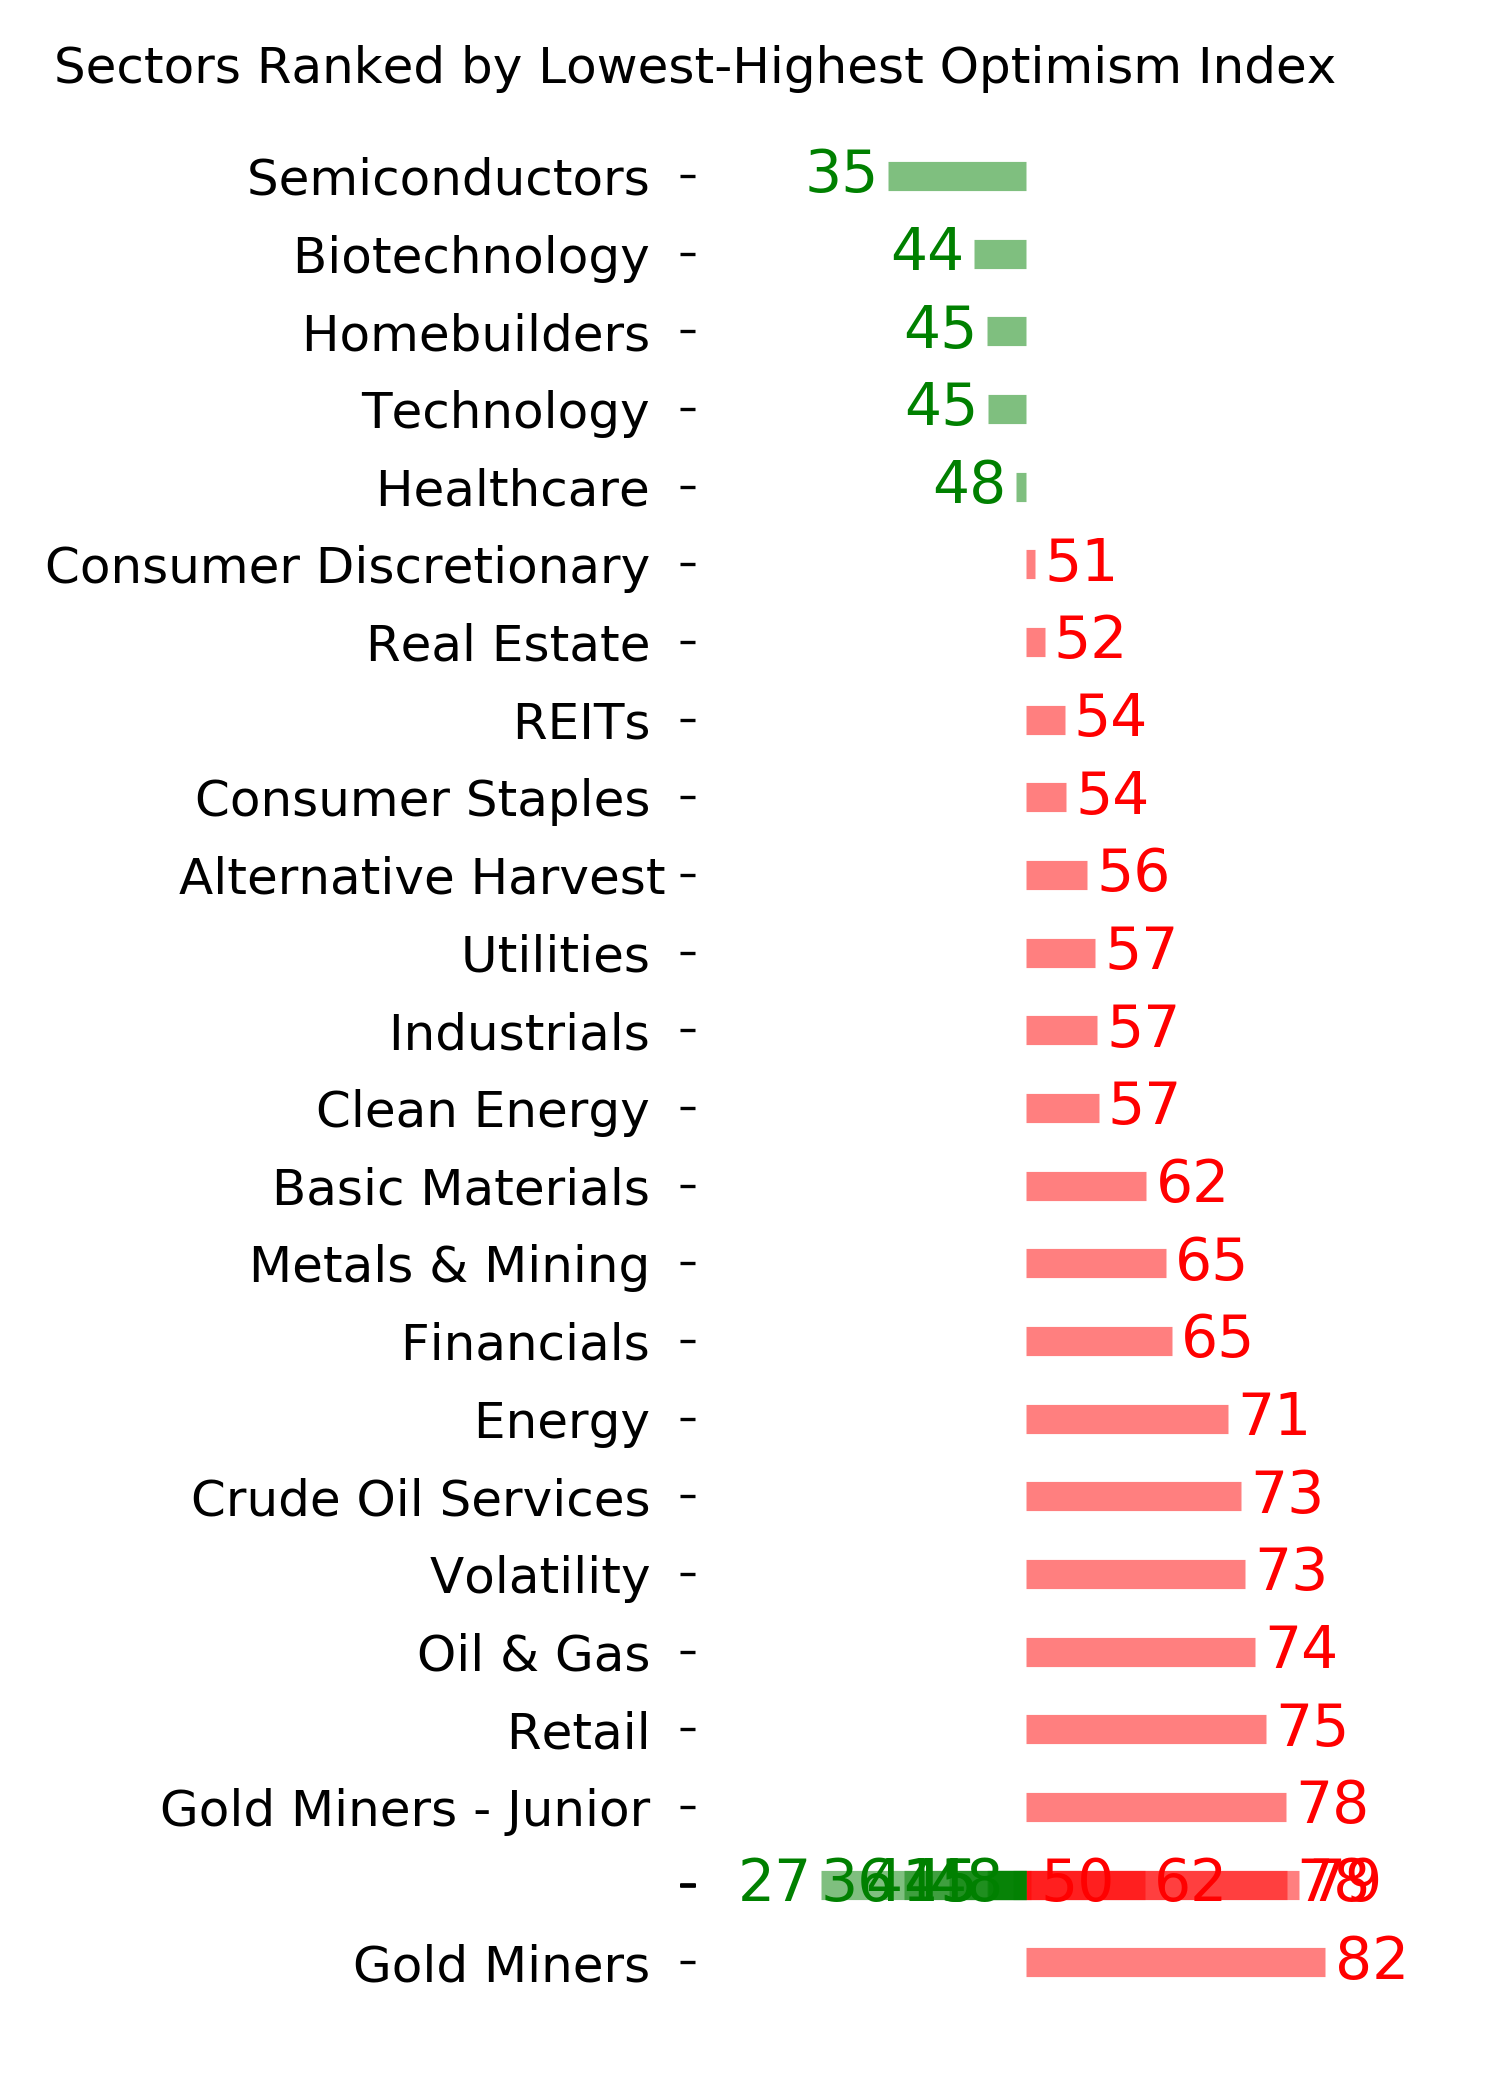
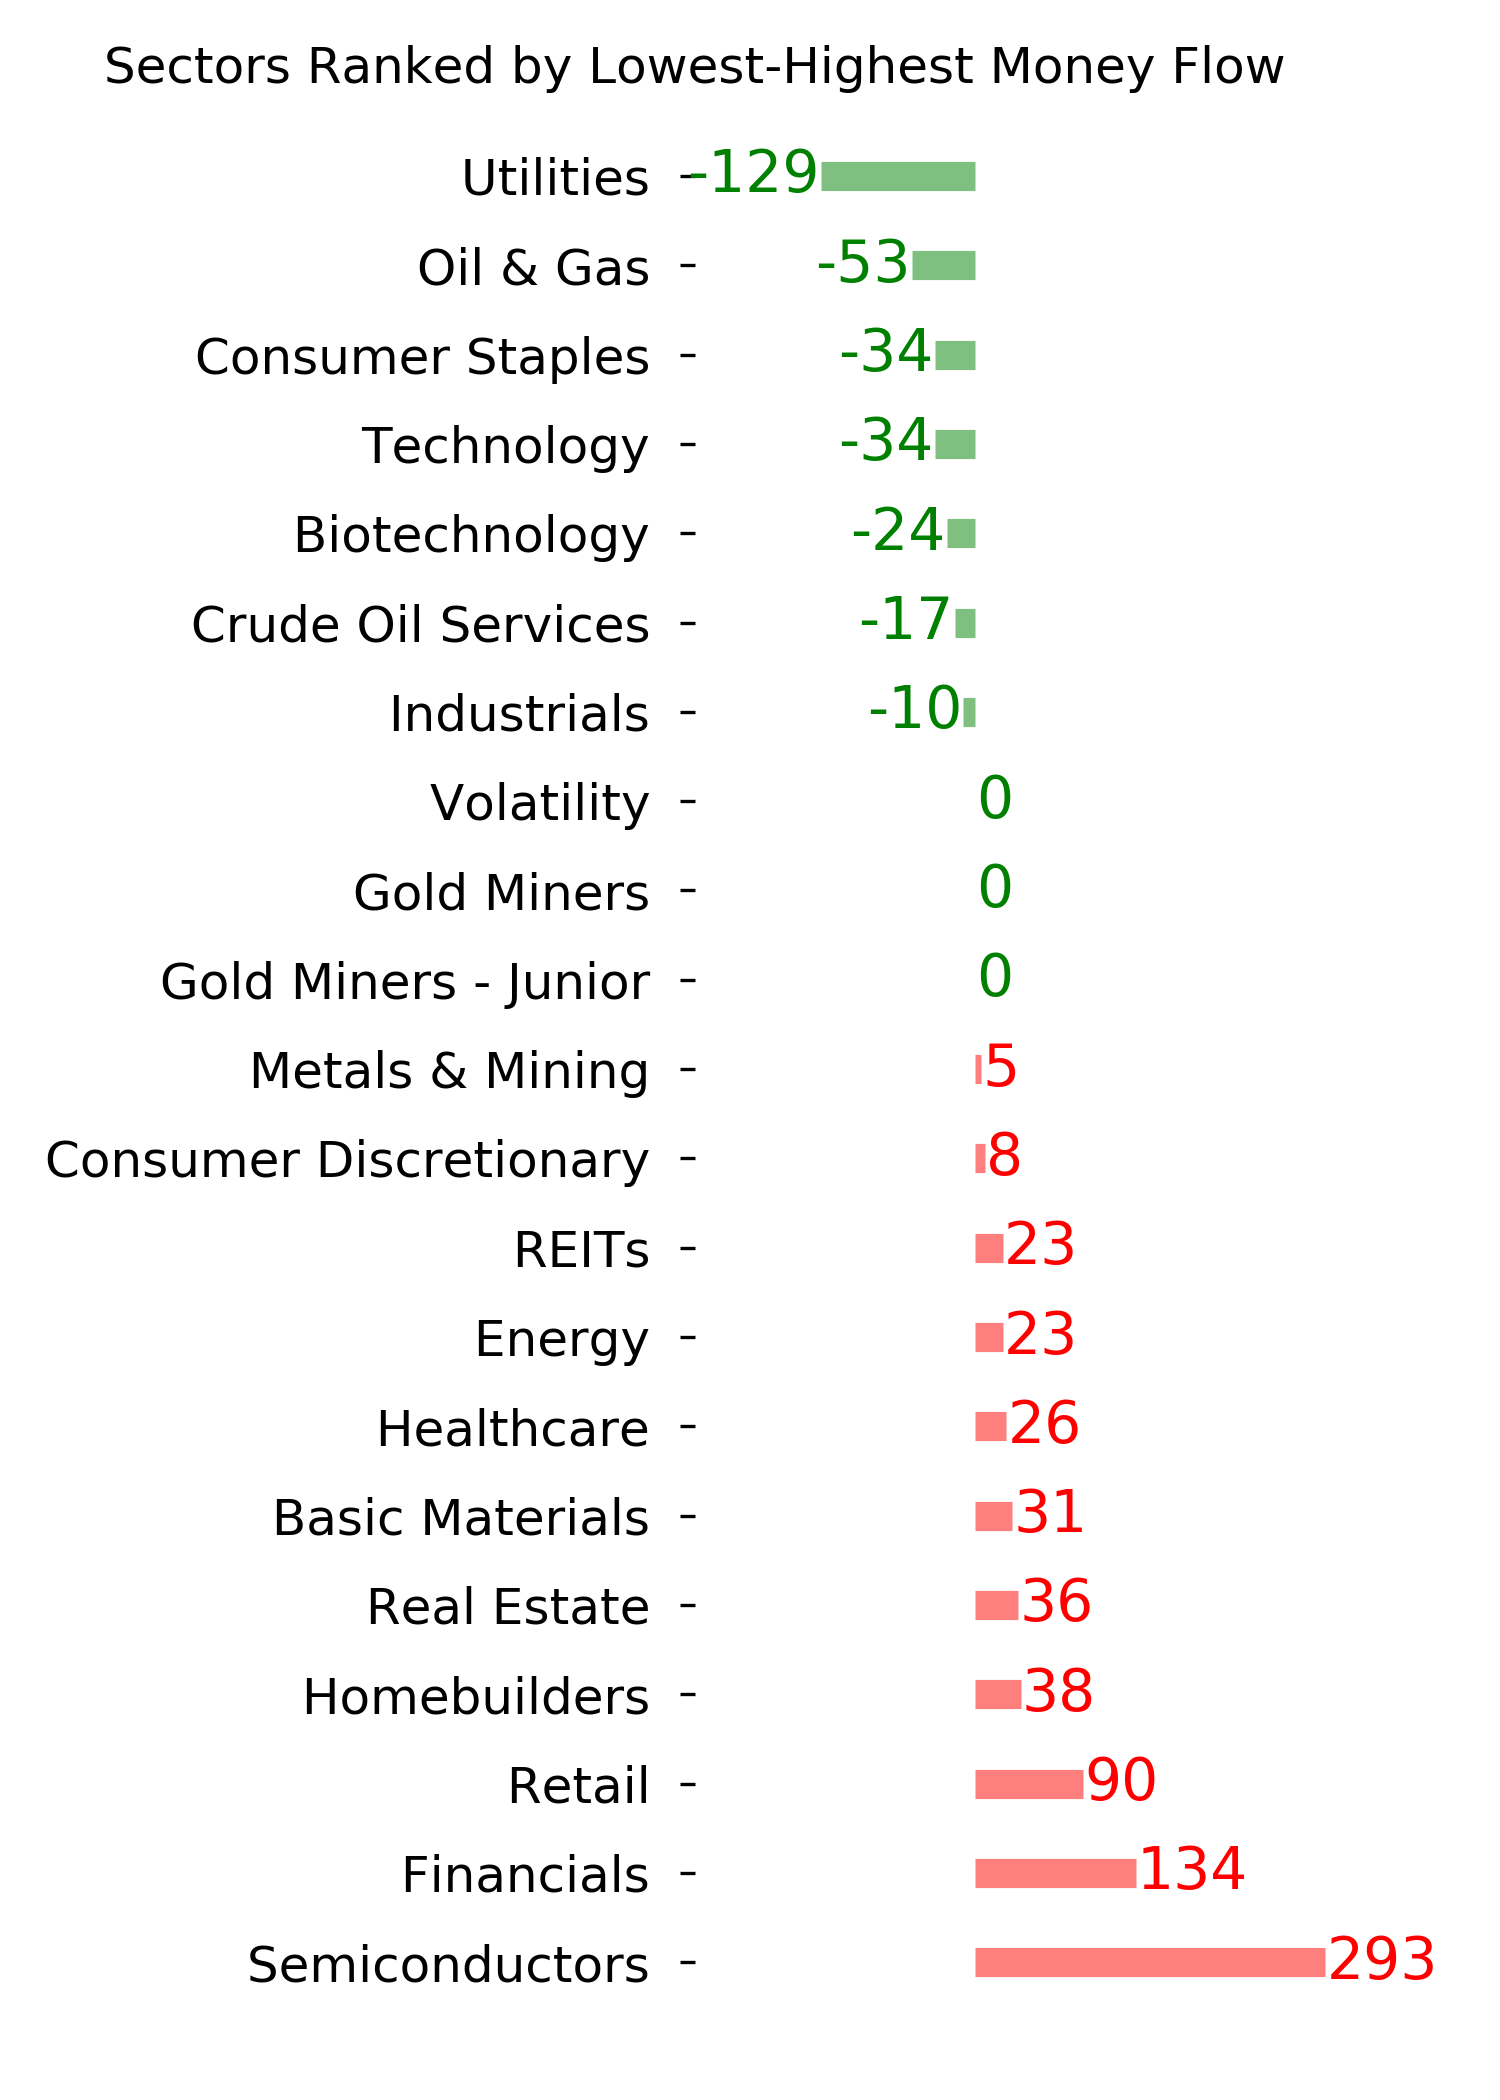
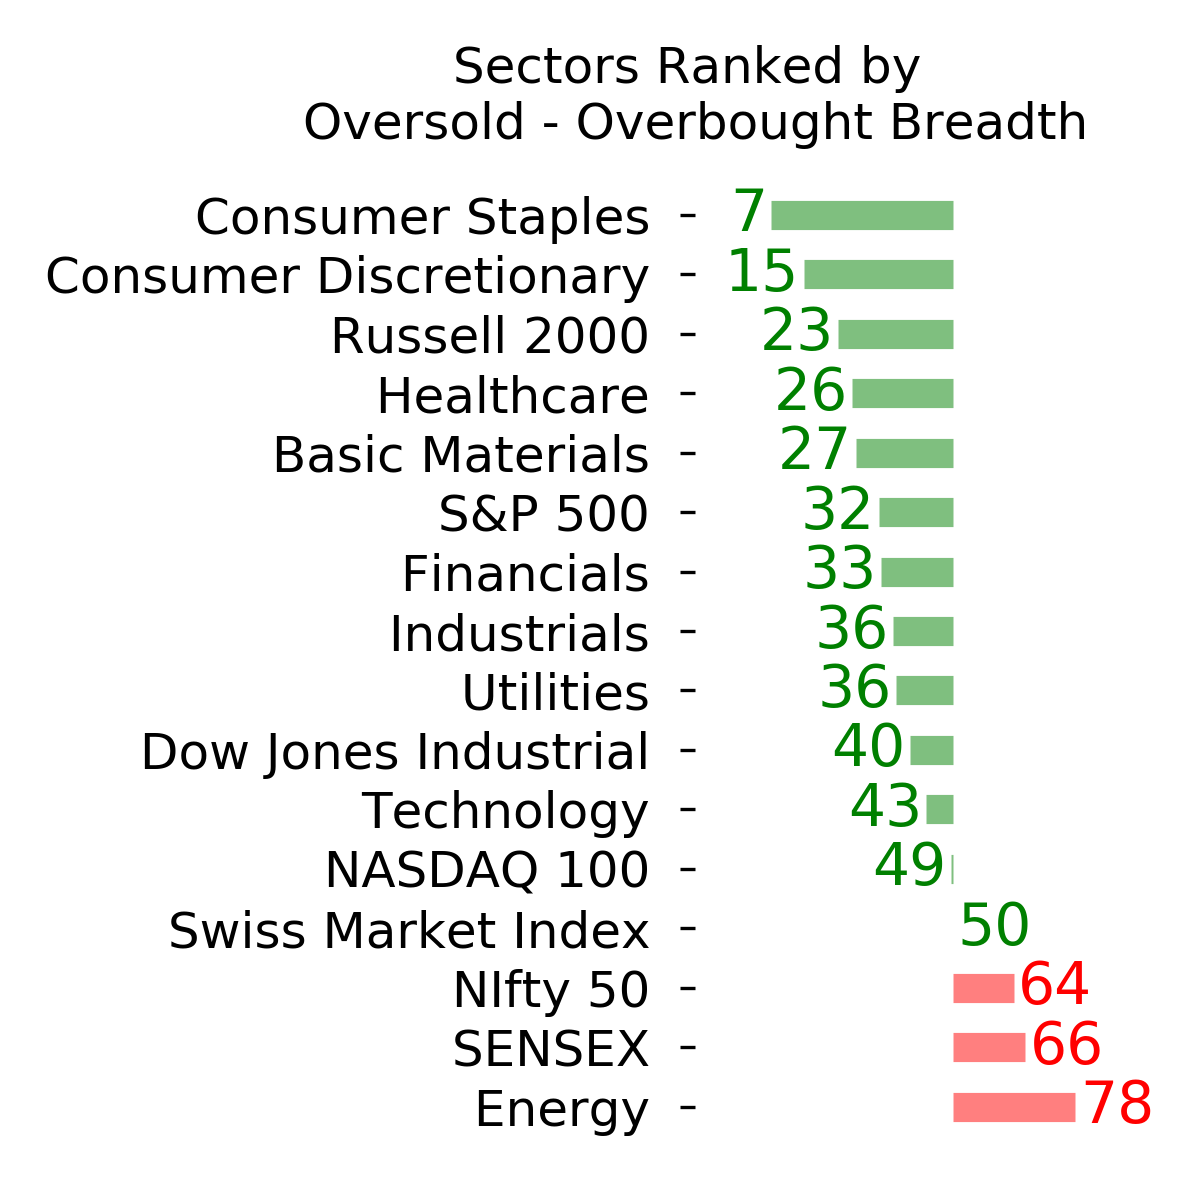
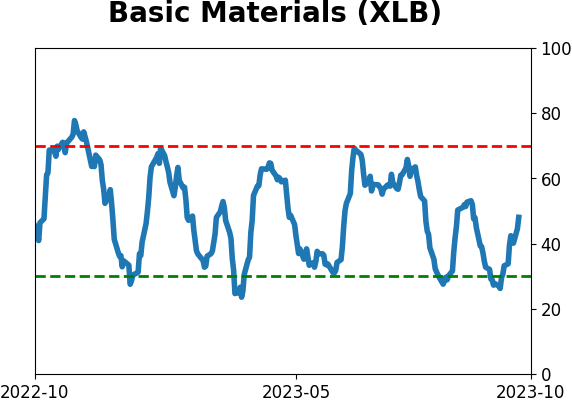
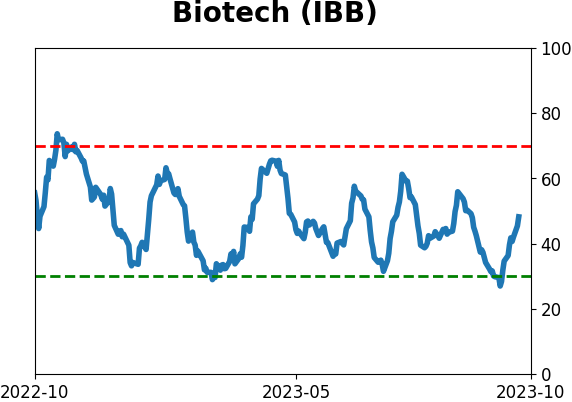
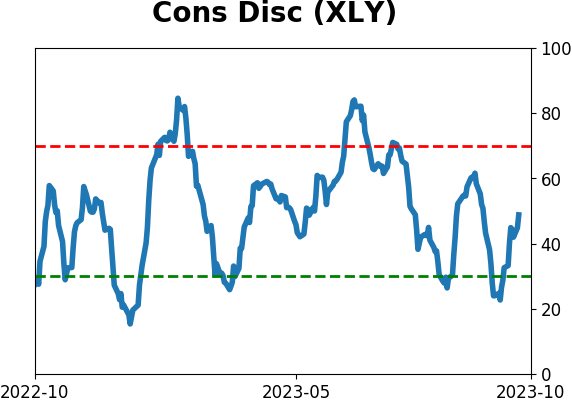
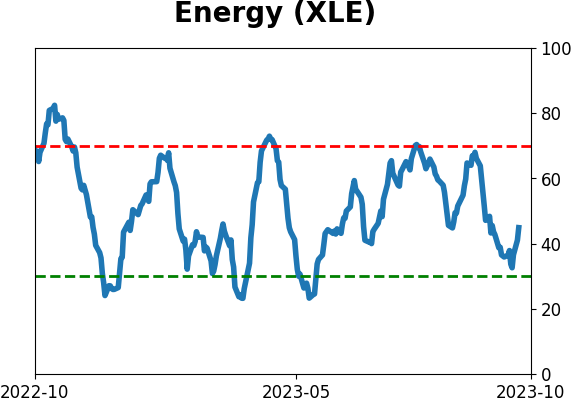
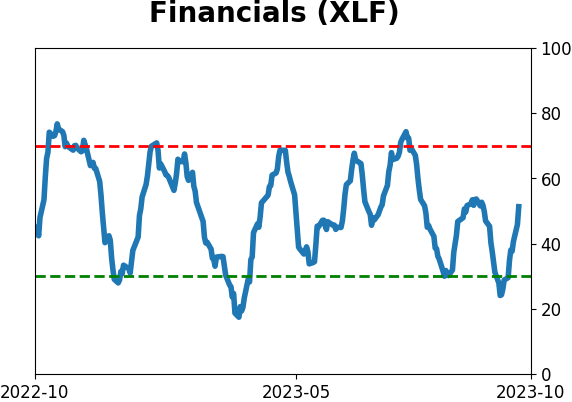
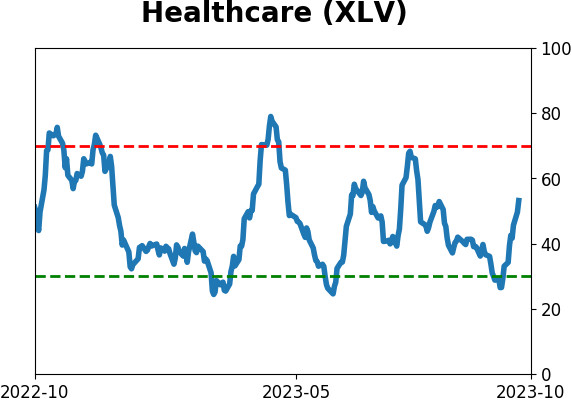
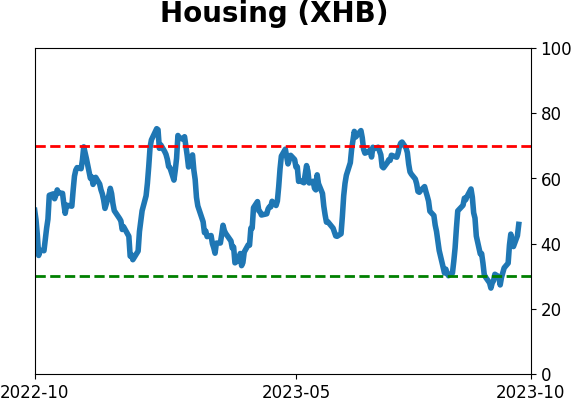
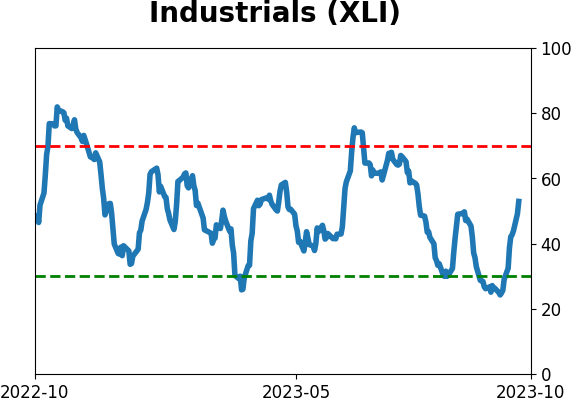
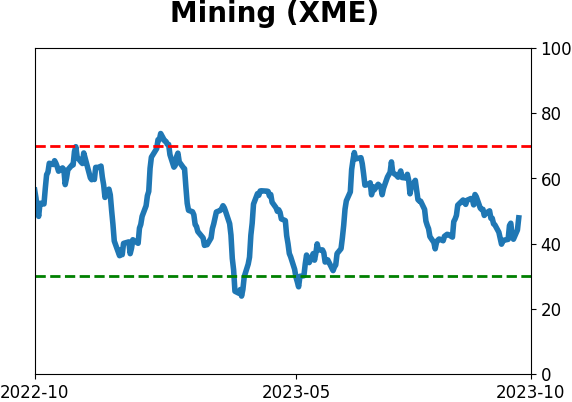
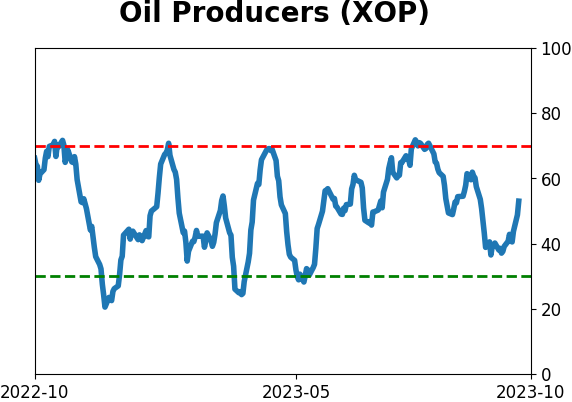
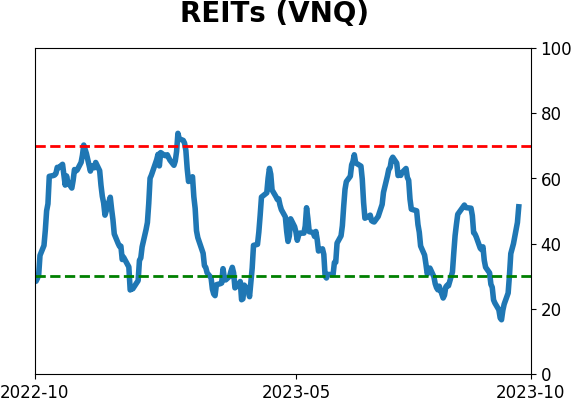
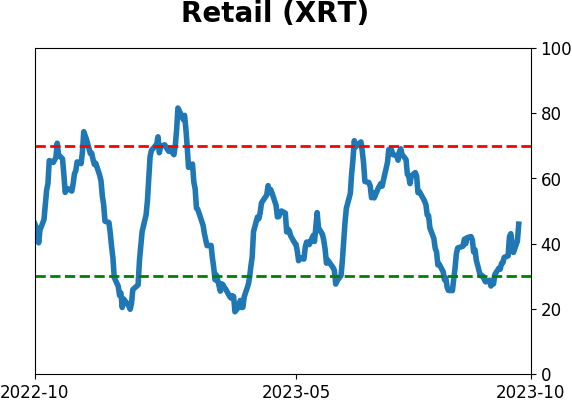
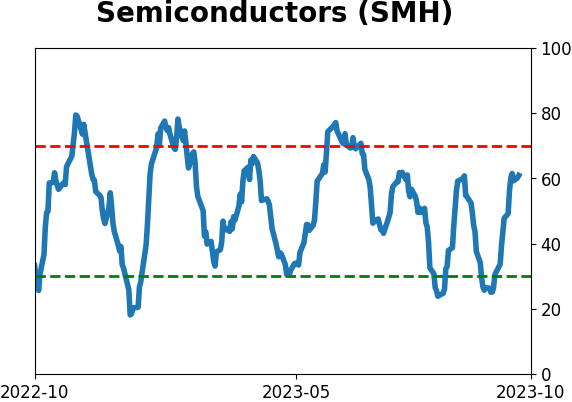
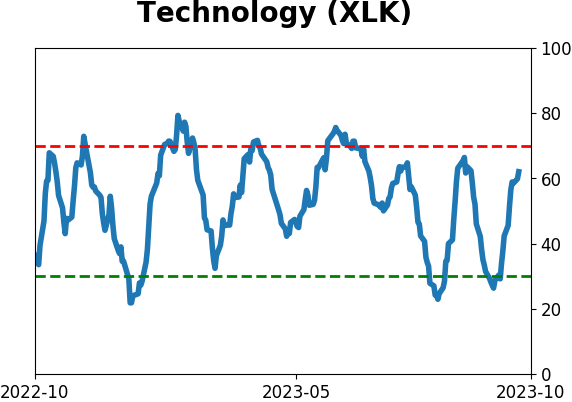
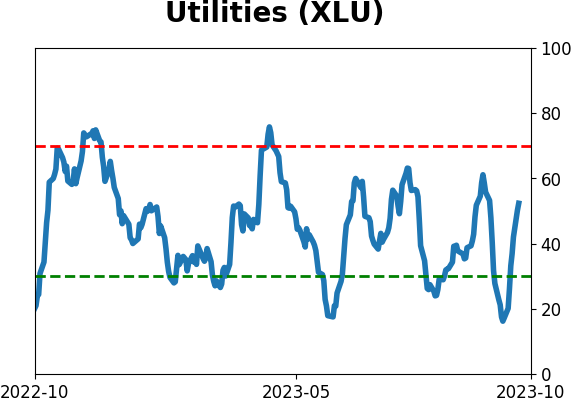
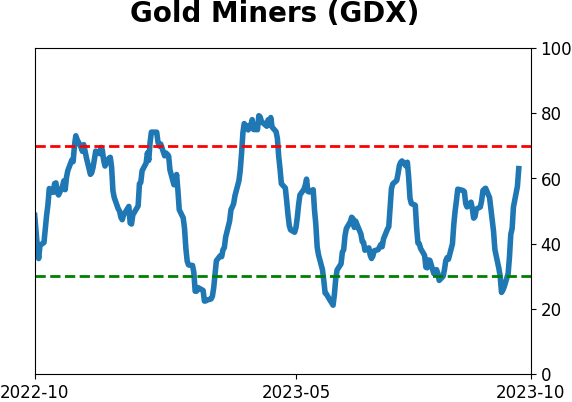
Sector ETF's - 10-Day Moving Average
|
|
|
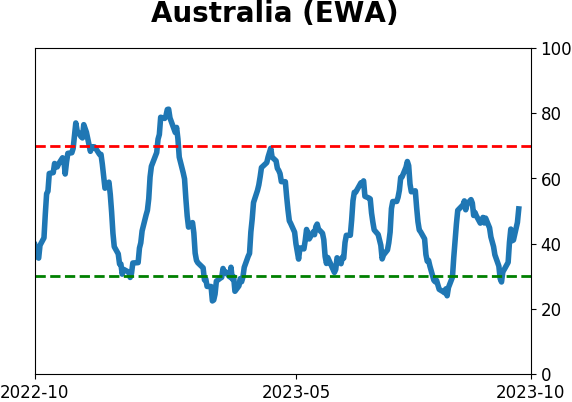
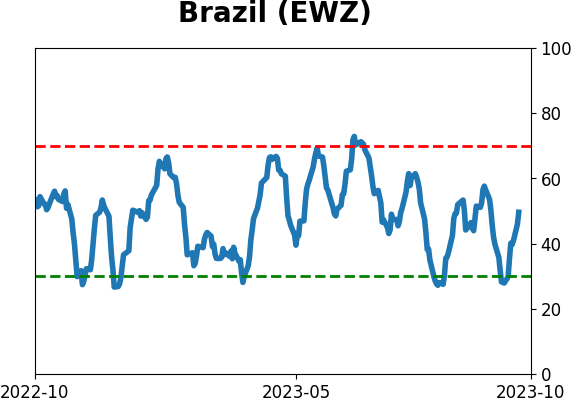
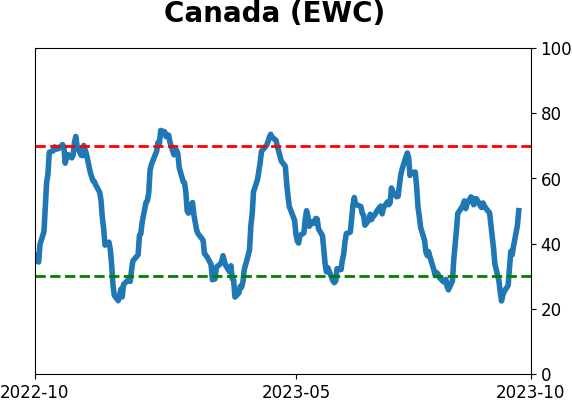
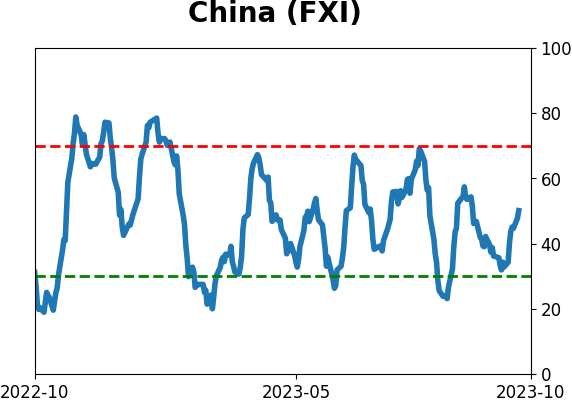
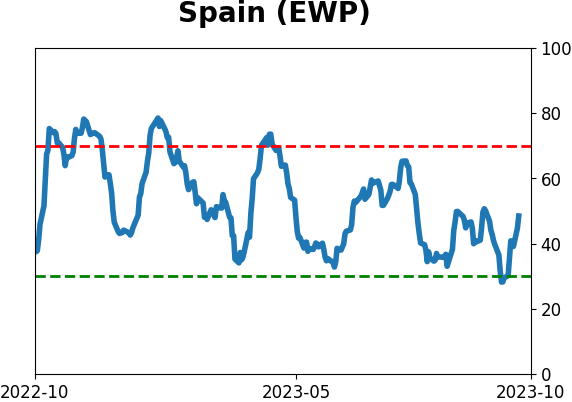
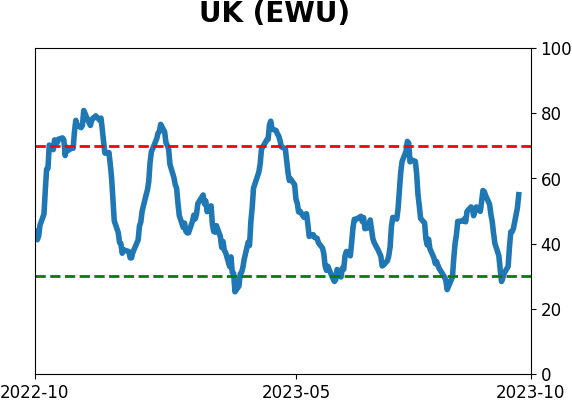
Country ETF's - 10-Day Moving Average
|
|
|
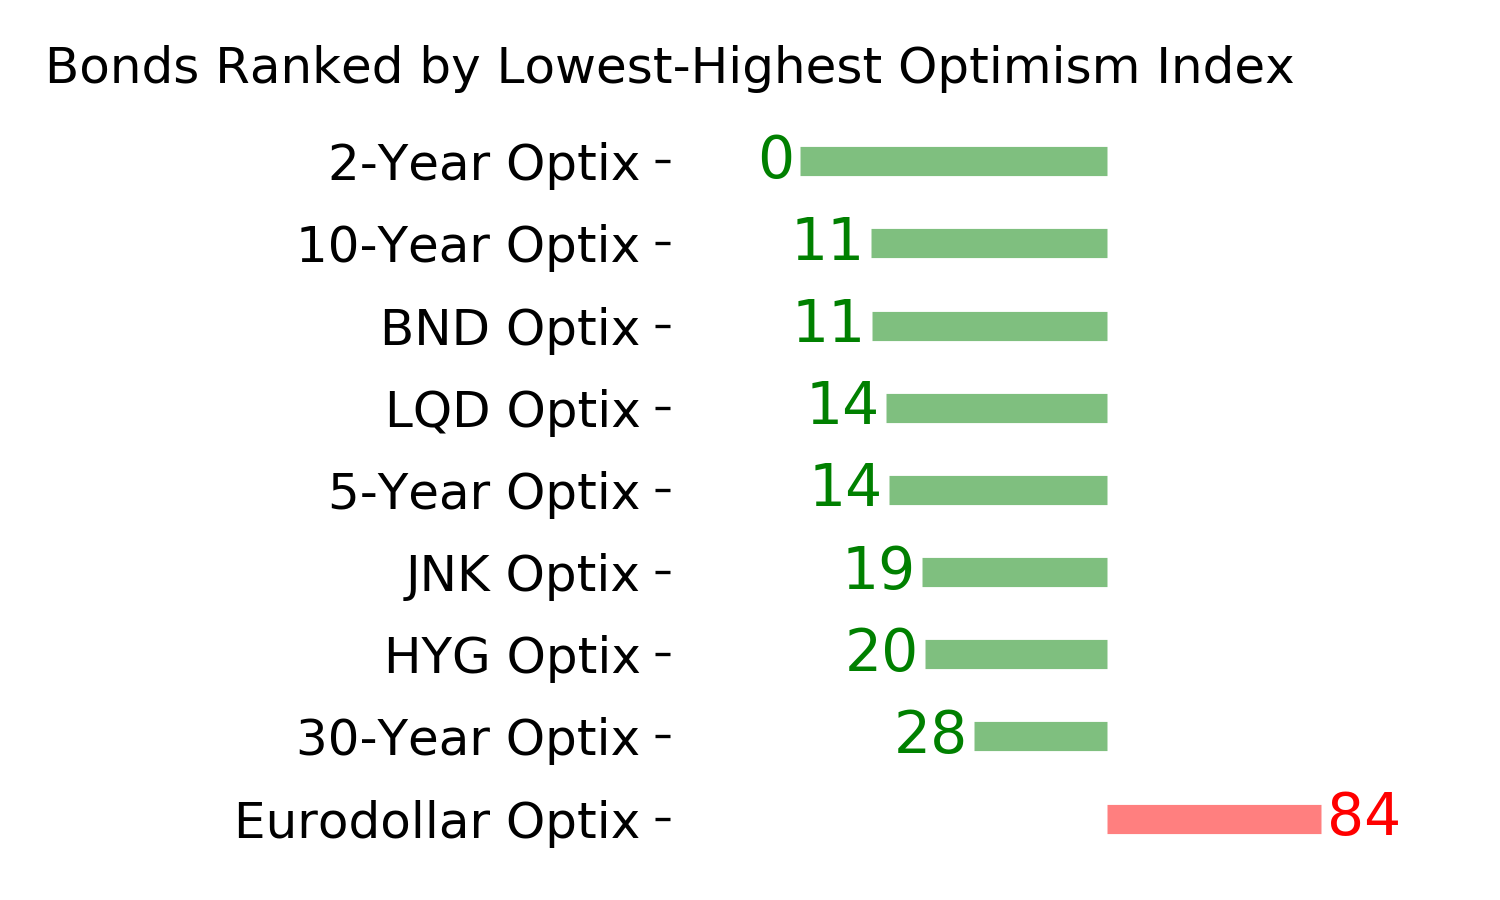
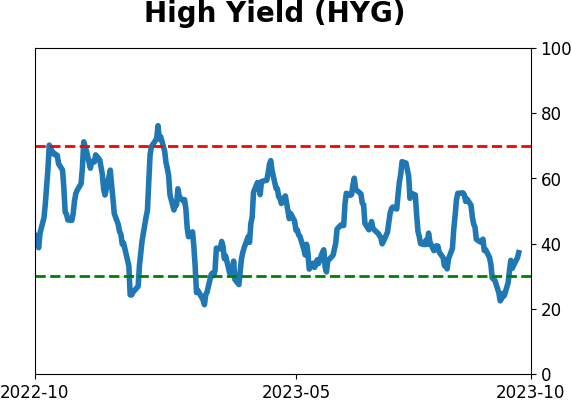
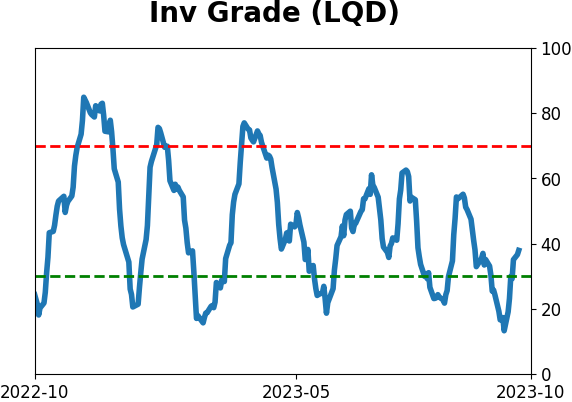
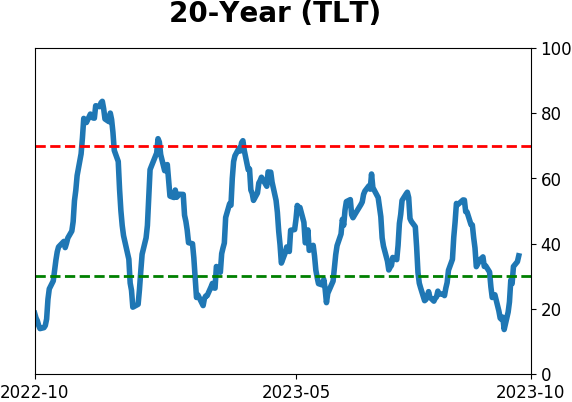
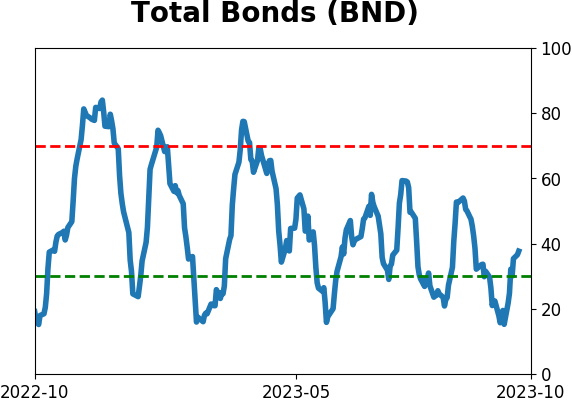
Bond ETF's - 10-Day Moving Average
|
|
|
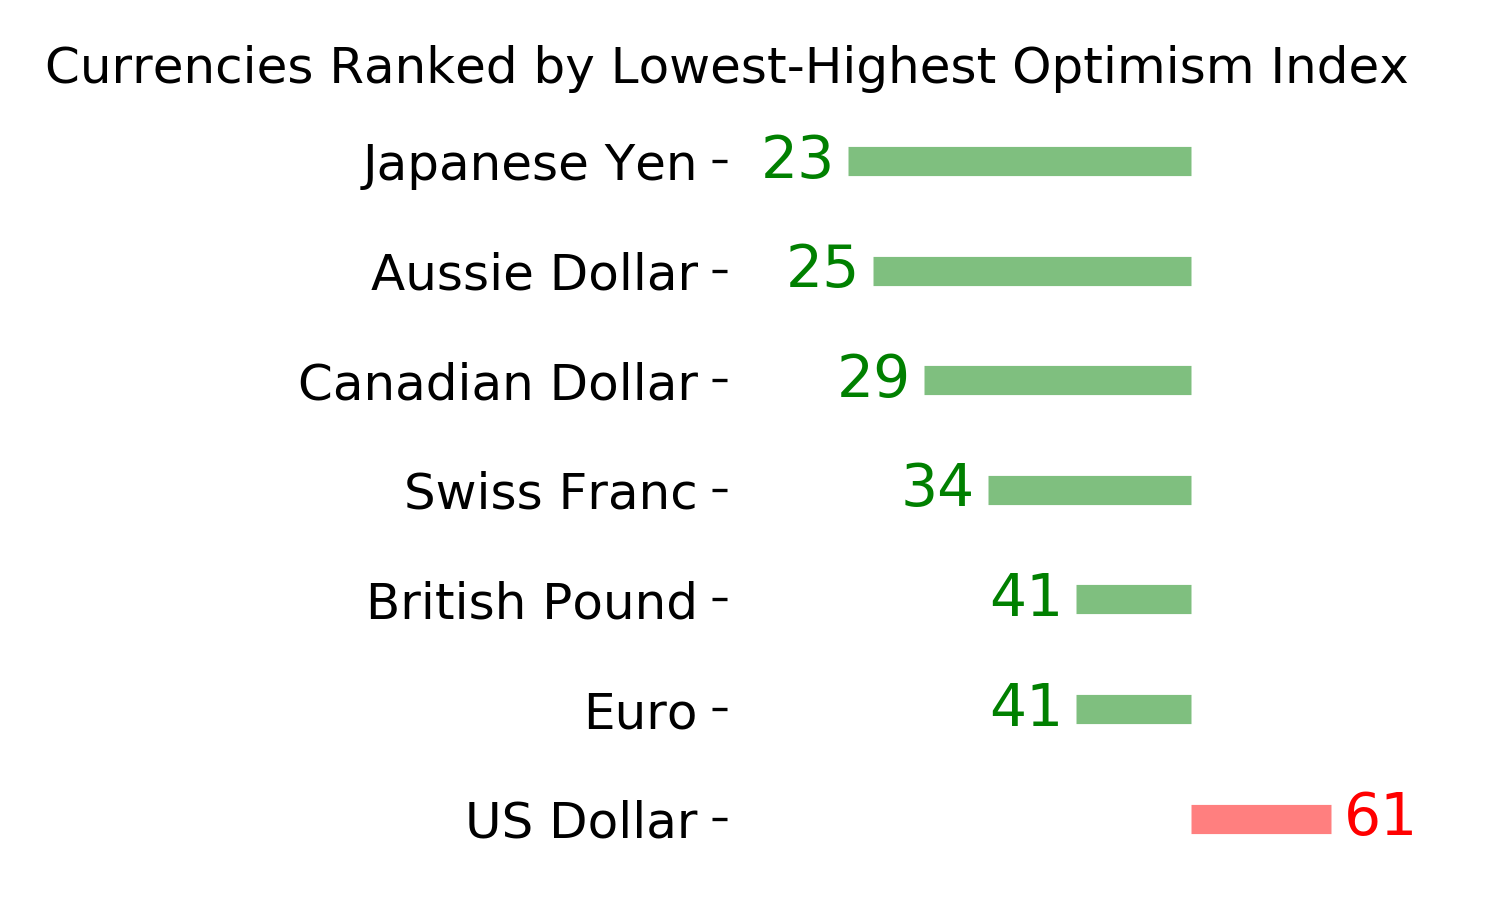
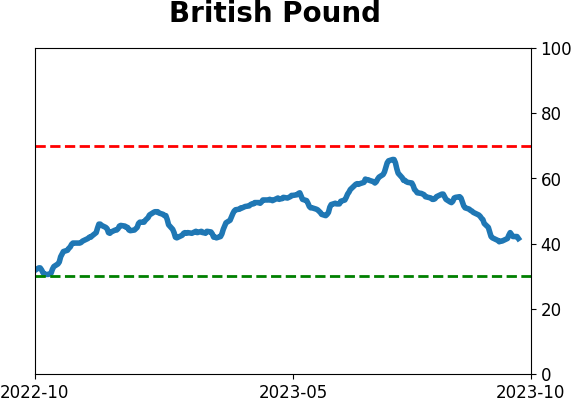
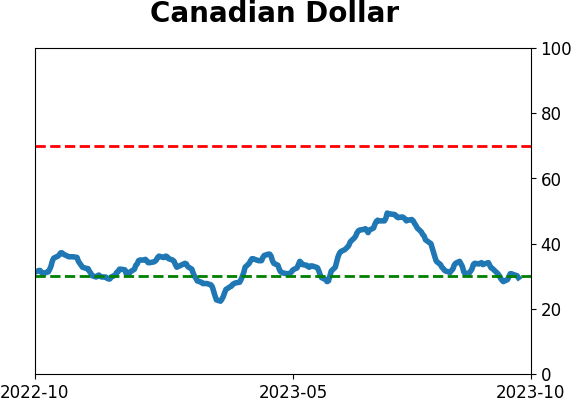
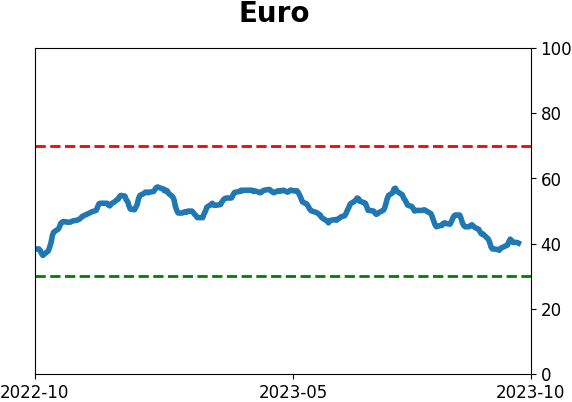
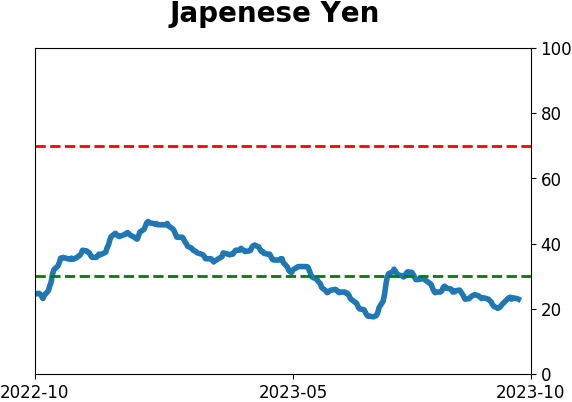
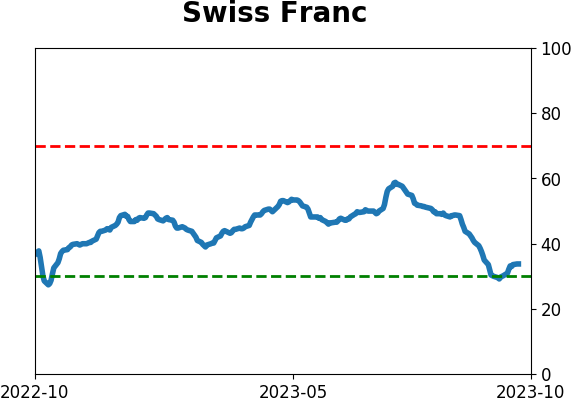
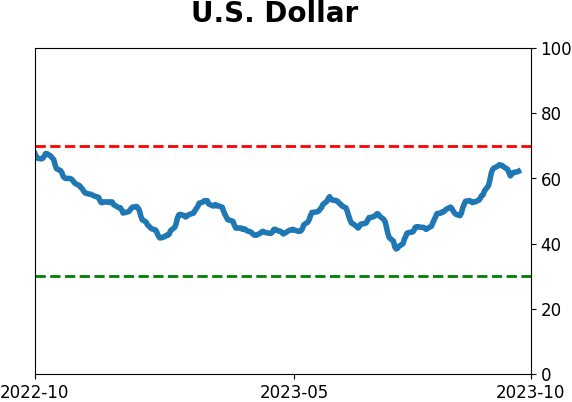
Currency ETF's - 5-Day Moving Average
|
|
|
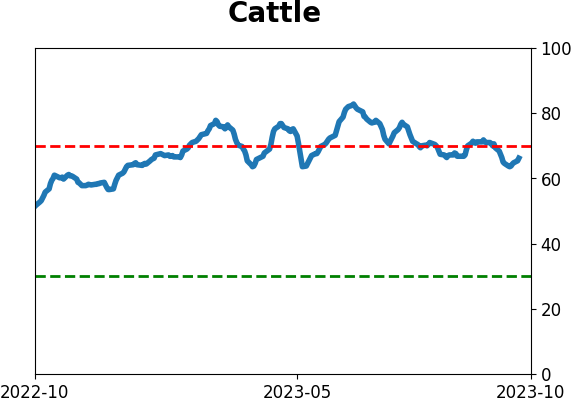
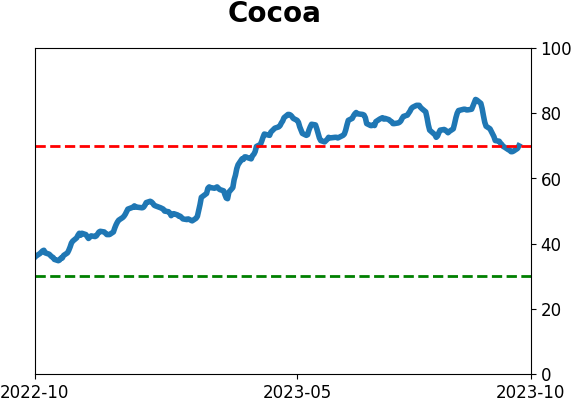
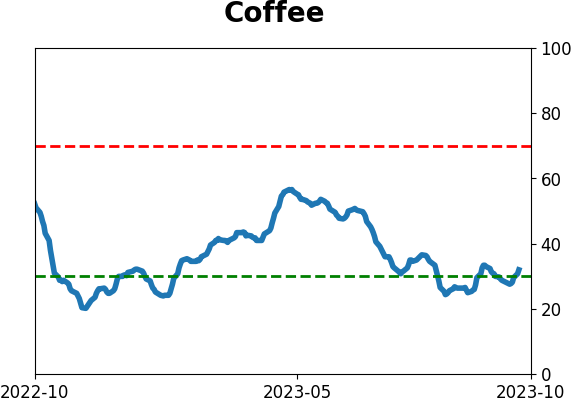
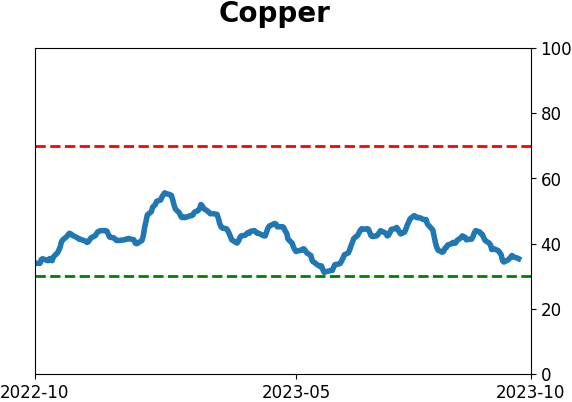
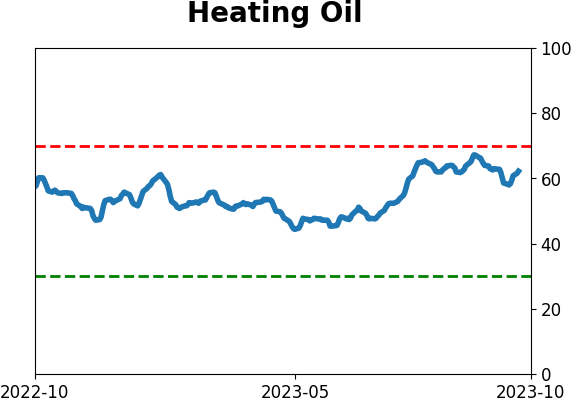
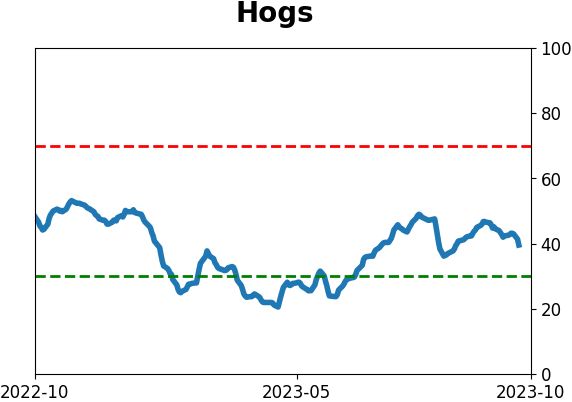
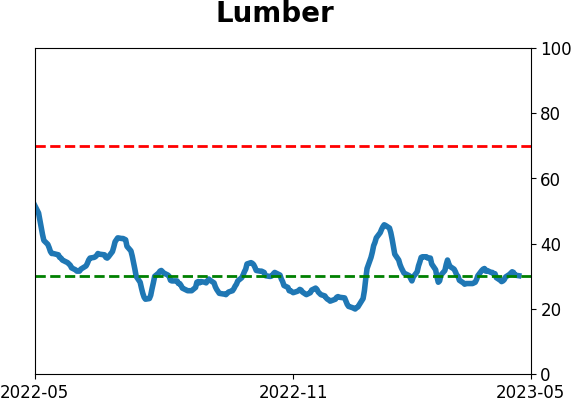
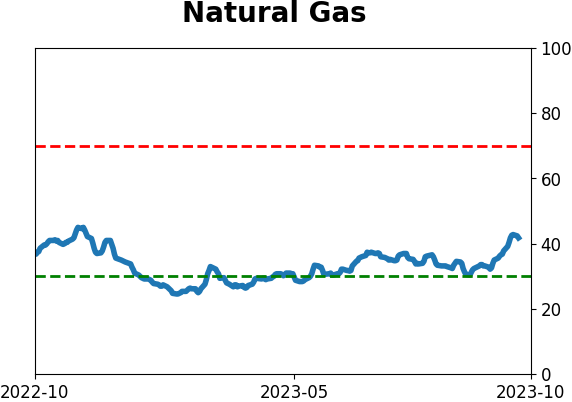
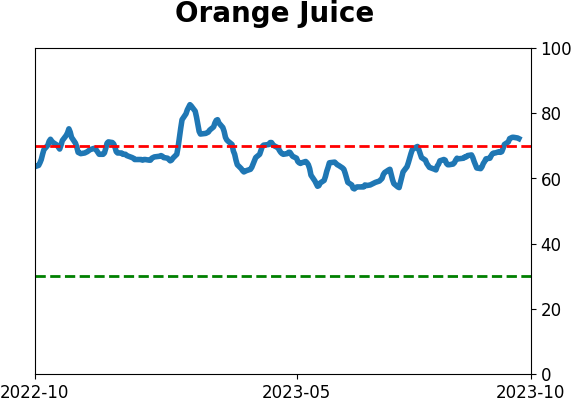
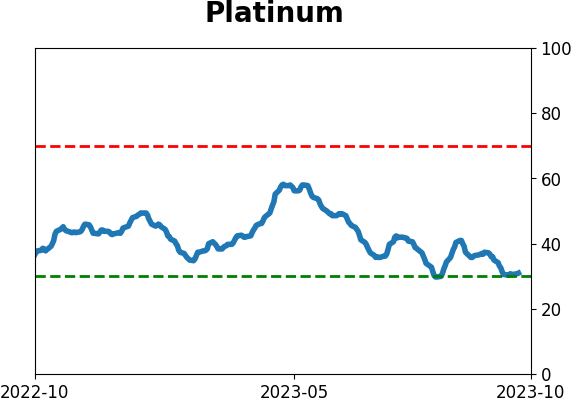
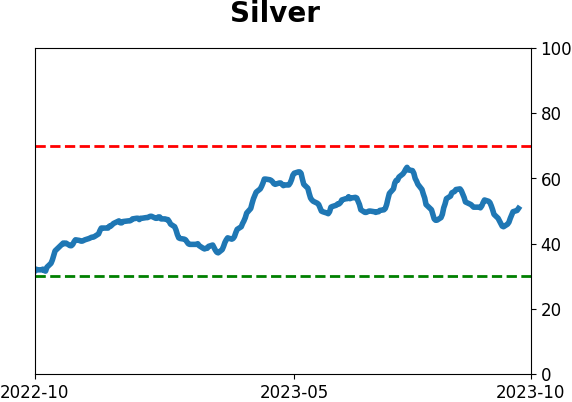
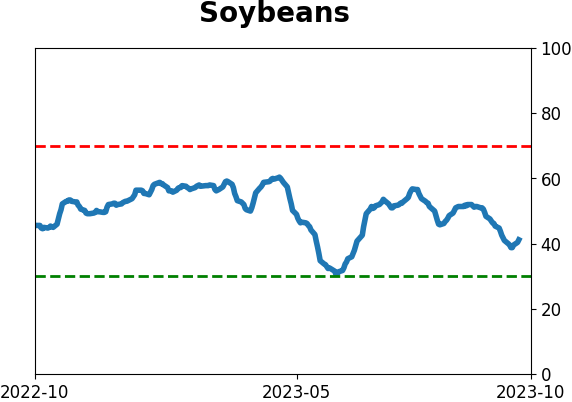
Commodity ETF's - 5-Day Moving Average
|
|