Headlines
|
|
Stocks slammed again as meltdown comparisons loom:
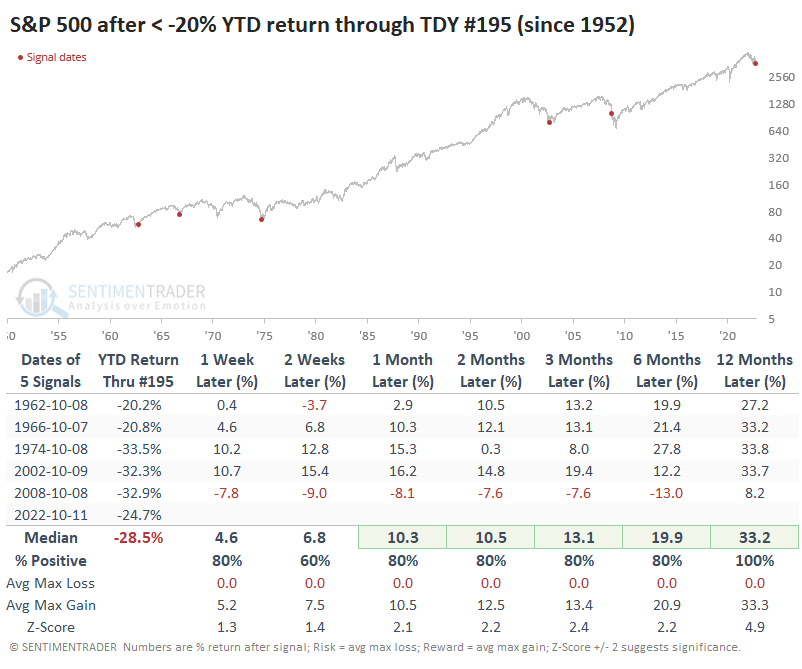
Through trading day #195 of the year, the S&P 500 is down more than 20%. There have been five other years with this large of a decline through this much of the year. Three of those didn't see a lower close, another a short and modest decline. All showed gains over the next year.
|
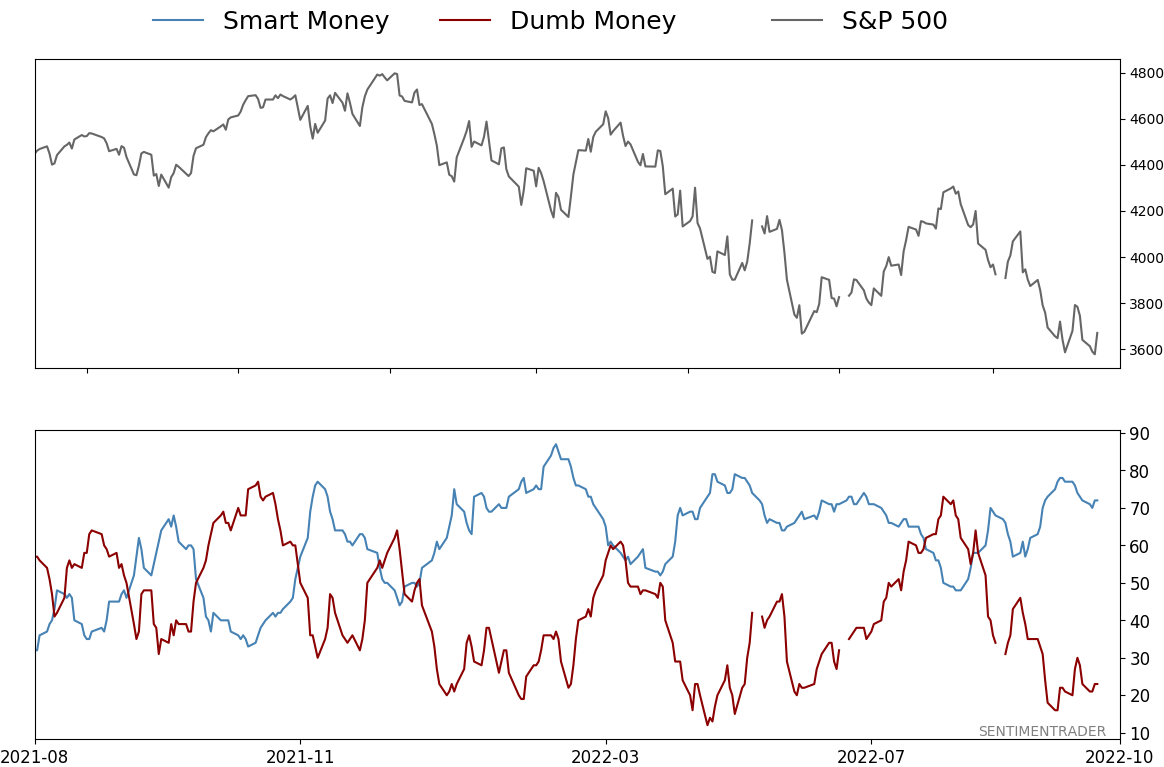
Smart / Dumb Money Confidence
|
Smart Money Confidence: 72%
Dumb Money Confidence: 23%
|
|
Risk Levels
Stocks Short-Term
|
Stocks Medium-Term
|
|
Bonds
|
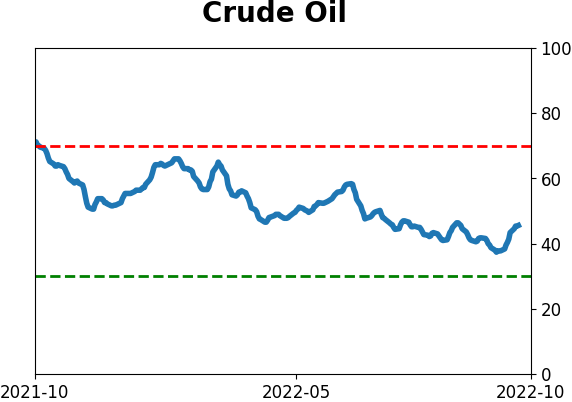
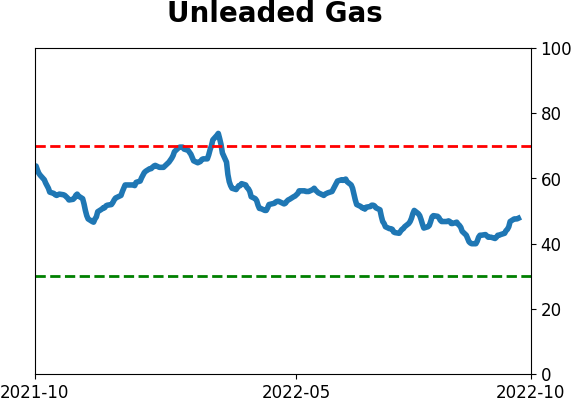
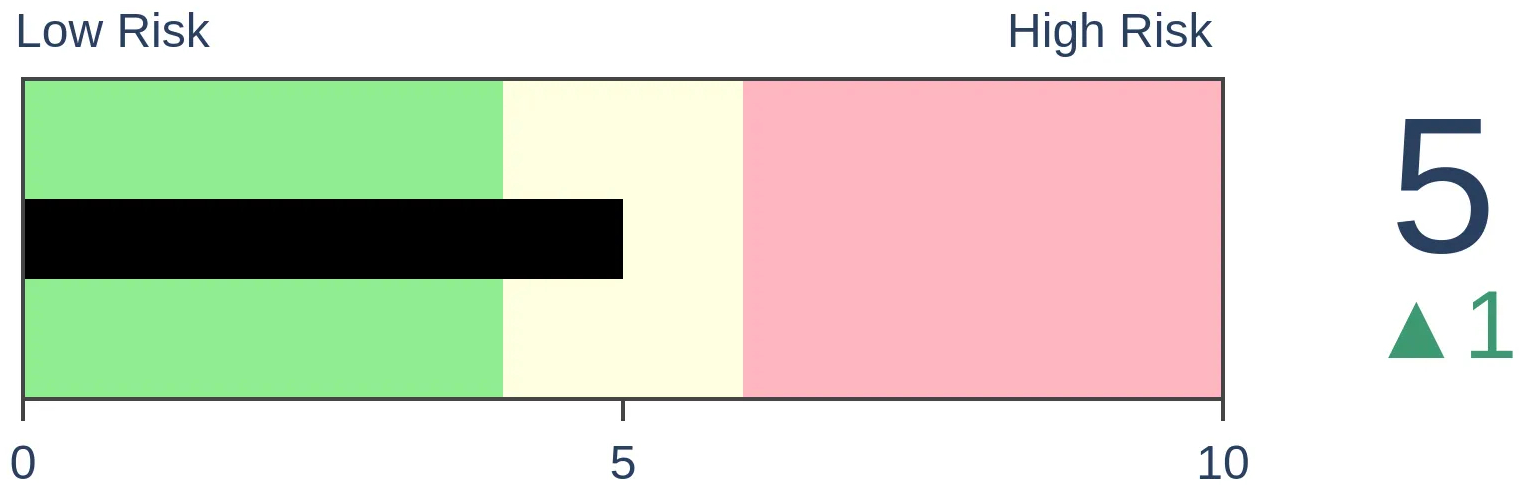
Crude Oil

|
|
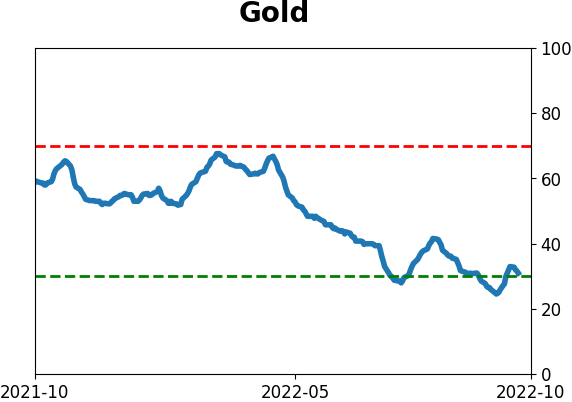
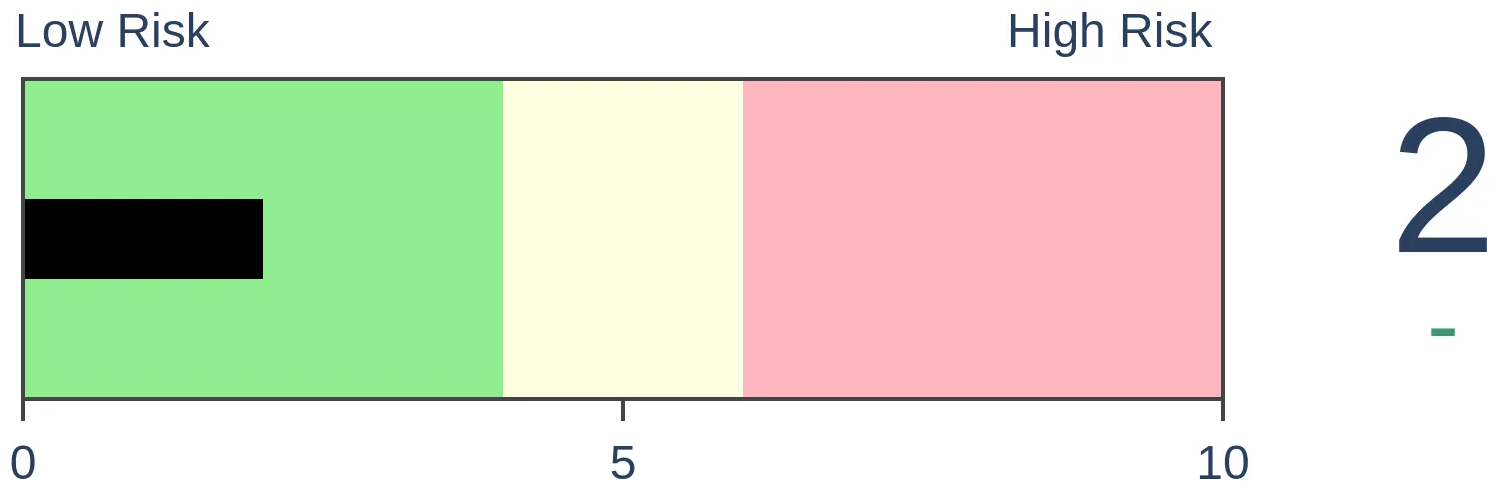
Gold
|
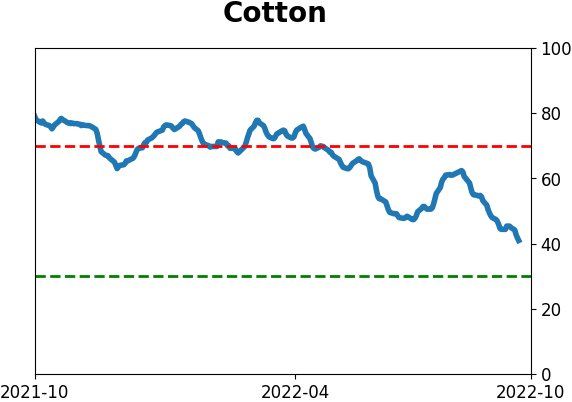
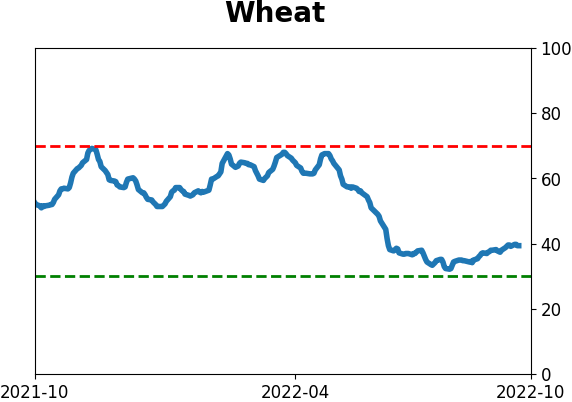
Agriculture
|
|
Research
By Jason Goepfert
BOTTOM LINE
Through trading day #195 of the year, the S&P 500 is down more than 20%. There have been five other years with this large of a decline through this much of the year. Three of those didn't see a lower close, another a short and modest decline. All showed gains over the next year.
FORECAST / TIMEFRAME
None
|
Key points:
- Through the 195th trading day of the year, the S&P 500 remains in bear market territory
- It joins only five other years since the end of Saturday trading in 1952
- Three of those didn't see a lower close for a year, another only a minor and temporary decline
We haven't seen too many bear markets this far into the calendar
There has been no shortage of research posted showing that October has been a volatile but often positive month for stocks. When adding in tendencies like election cycles, there has been a very strong positive bias starting about now.
It helps that stocks have already been hammered.
Through Trading Day of the Year (TDY) #195, the S&P 500 is still down more than 20% on the year. Since the elimination of Saturday trading, this matches only a handful of other years.
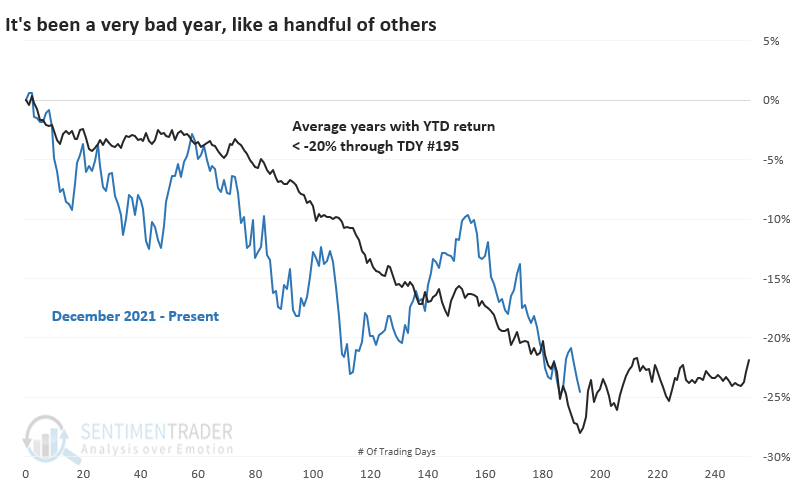
It's interesting how similar the years were heading into this point on the calendar and how they performed the rest of the year. The only outlier - and it was a big one - was the financial crisis.
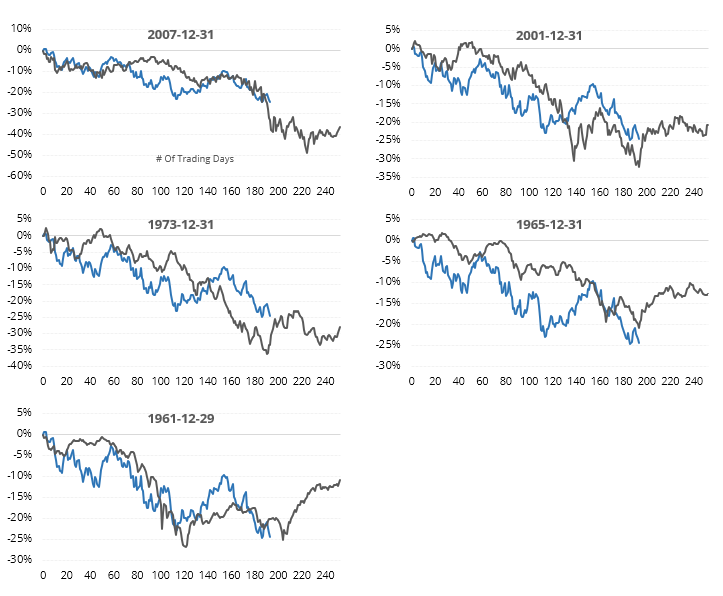
The S&P's returns in the weeks and months ahead were excellent, except for 2008. Remarkably, the maximum closing loss following three signals was 0% - the S&P didn't trade any lower than its close on day #195 for at least the following year. In 1962, the index lost another 6% over the next 11 trading days, then bottomed. In 2008, it took another 103 days.
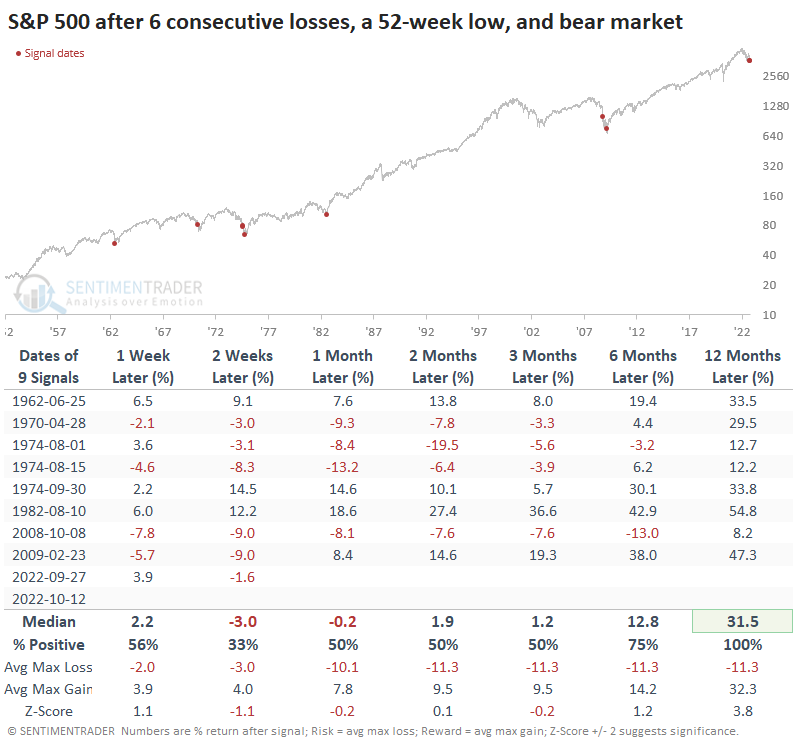
If we forget the calendar for a moment, the past week has been miserable for the S&P. It dropped for six consecutive sessions, closed at a 52-week low on Wednesday, and is mired in a bear market. For the latter, we're just using the commonly-accepted definition of a 20% drawdown from a 52-week high.
After similarly miserable stretches, it marked the end of bear markets in 1962, 1974, and 1982. But it preceded further losses several other times, with highly volatile trading over the next couple of weeks. Even though it was triggered during the midst of the meltdown in 2008, all the signals showed a positive one-year return, averaging nearly 32%.
Due to the worse-than-hoped-for CPI print, stocks got slammed on the open this morning. After the S&P 500 had already closed at a 52-week low the day prior, futures opened lower by more than 2%. This has only happened during the meltdowns in 2001-02, 2008-09, and 2020.
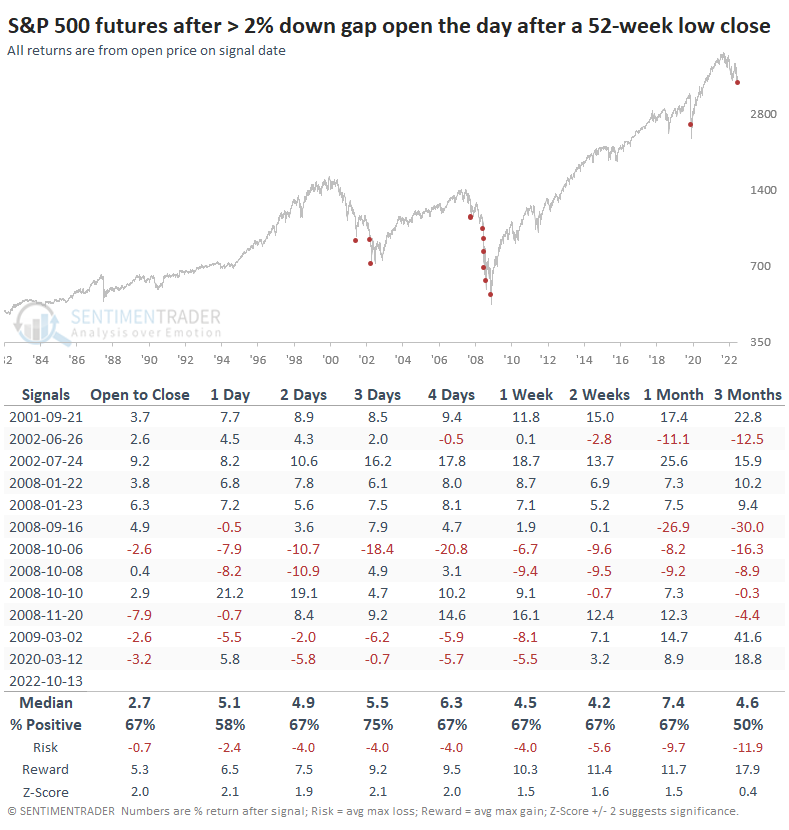
If we also stipulate that the S&P was amid at least a 5-day losing streak, we approach rarefied air since the 1982 inception of the futures market. If we use the day's low instead of the previous day's close for the 52-week low test, the only precedent is October 10, 2008.
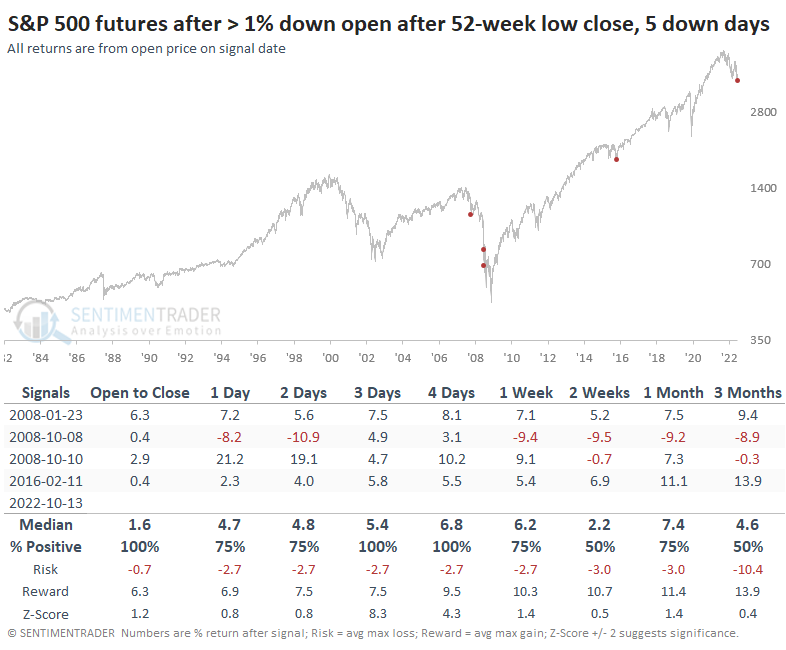
What the research tells us...
Tiny sample sizes are troublesome, though we can have a bit more confidence in them if their consistency in forward returns is high. That's arguable with this one, but it's notable that when severe price declines and seasonality combine, it can have powerful effects. Barring another financial crisis, which certainly seems to be a worry, the recent decline and seasonal combo look bullish.
Indicators at Extremes
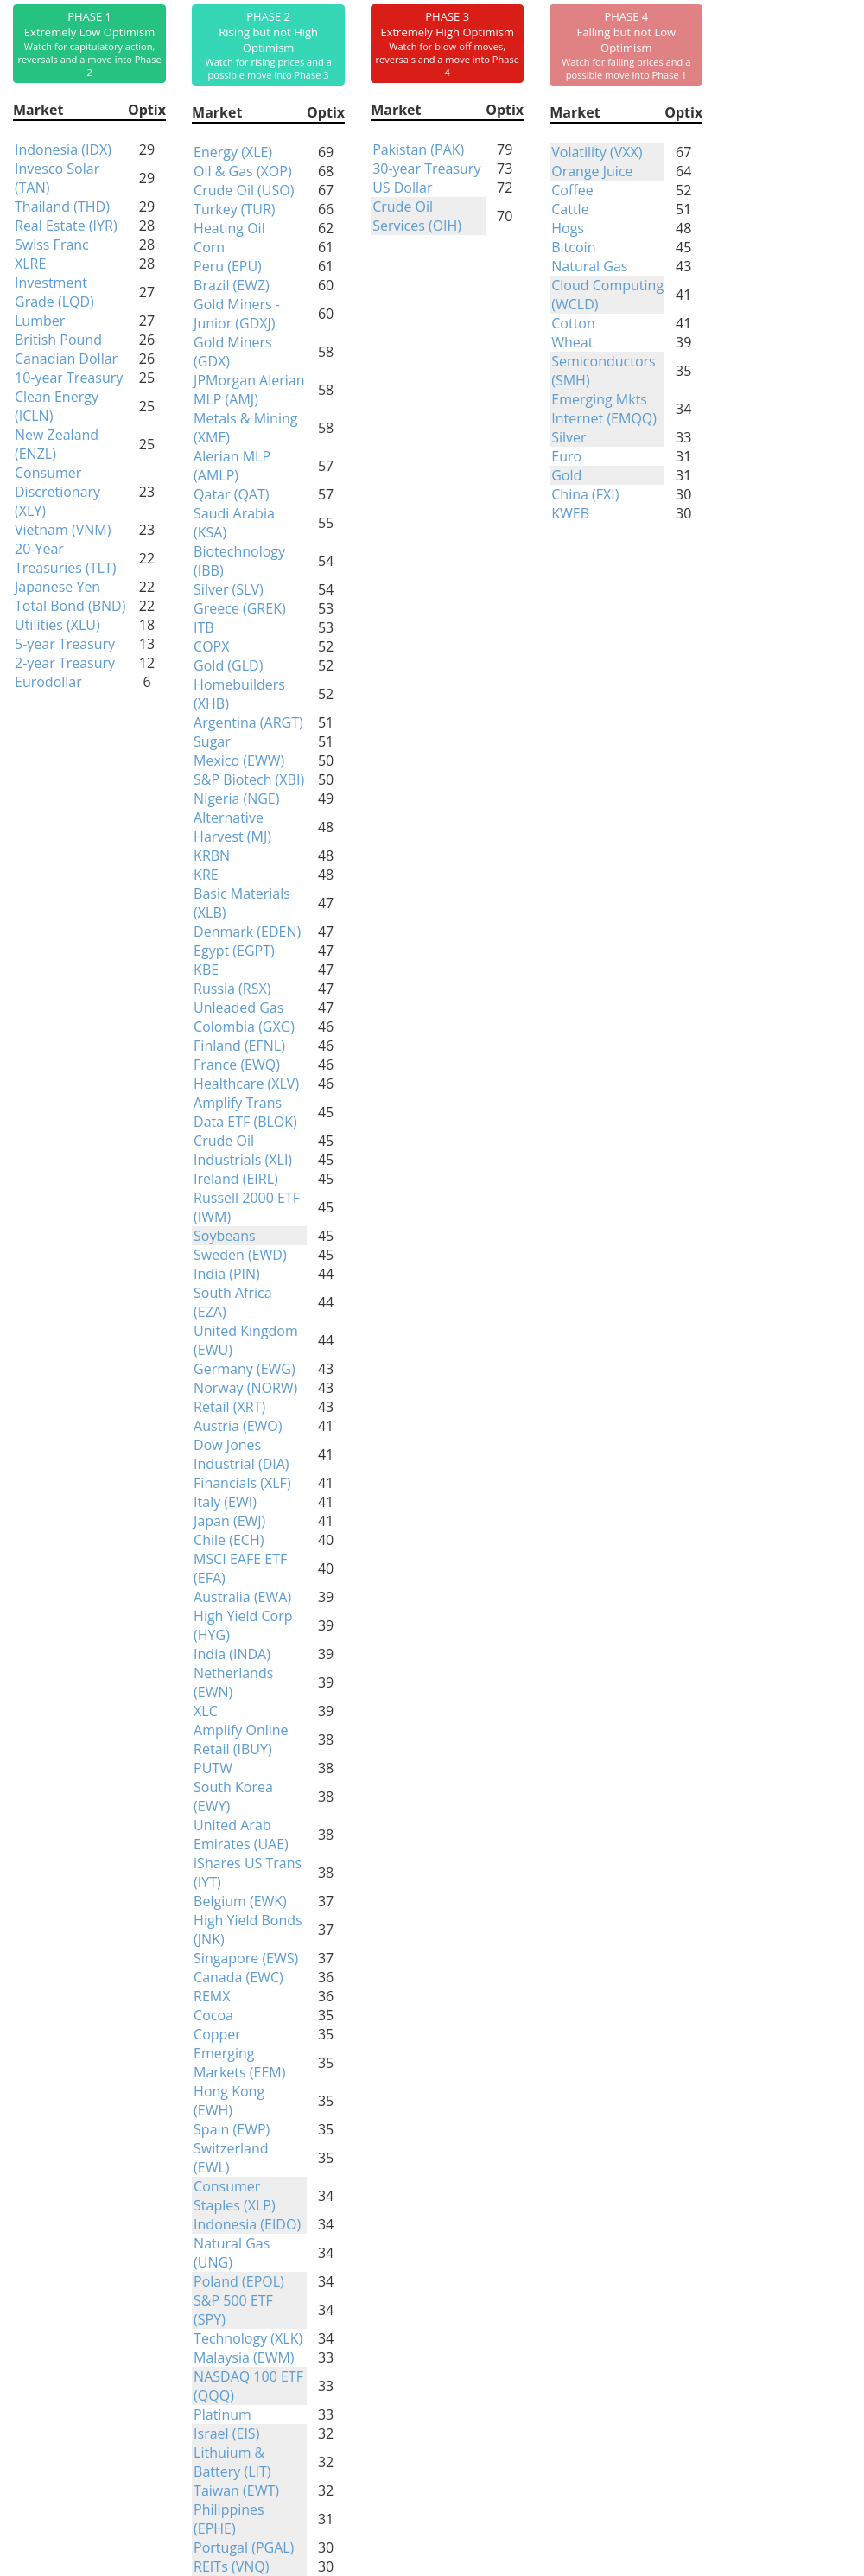
Phase Table
Ranks
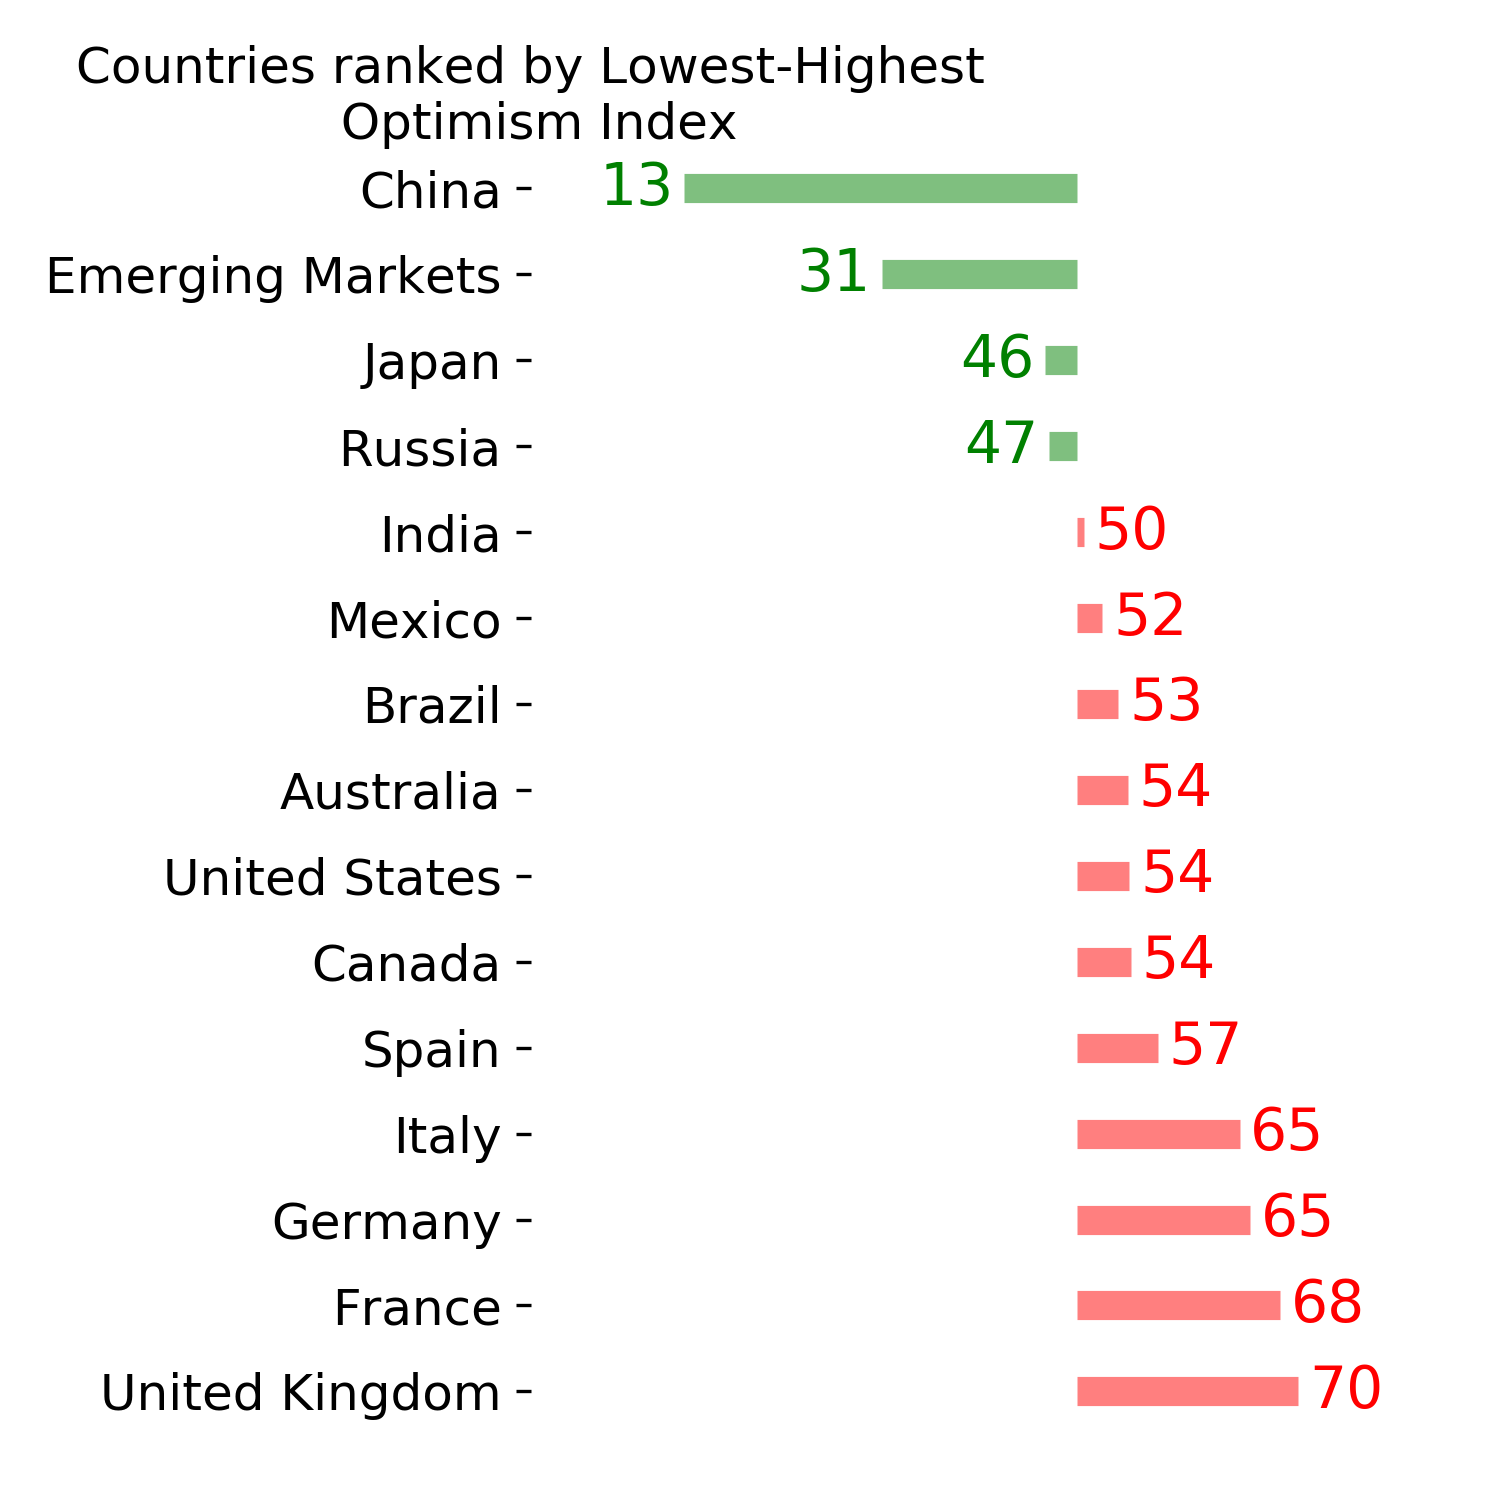
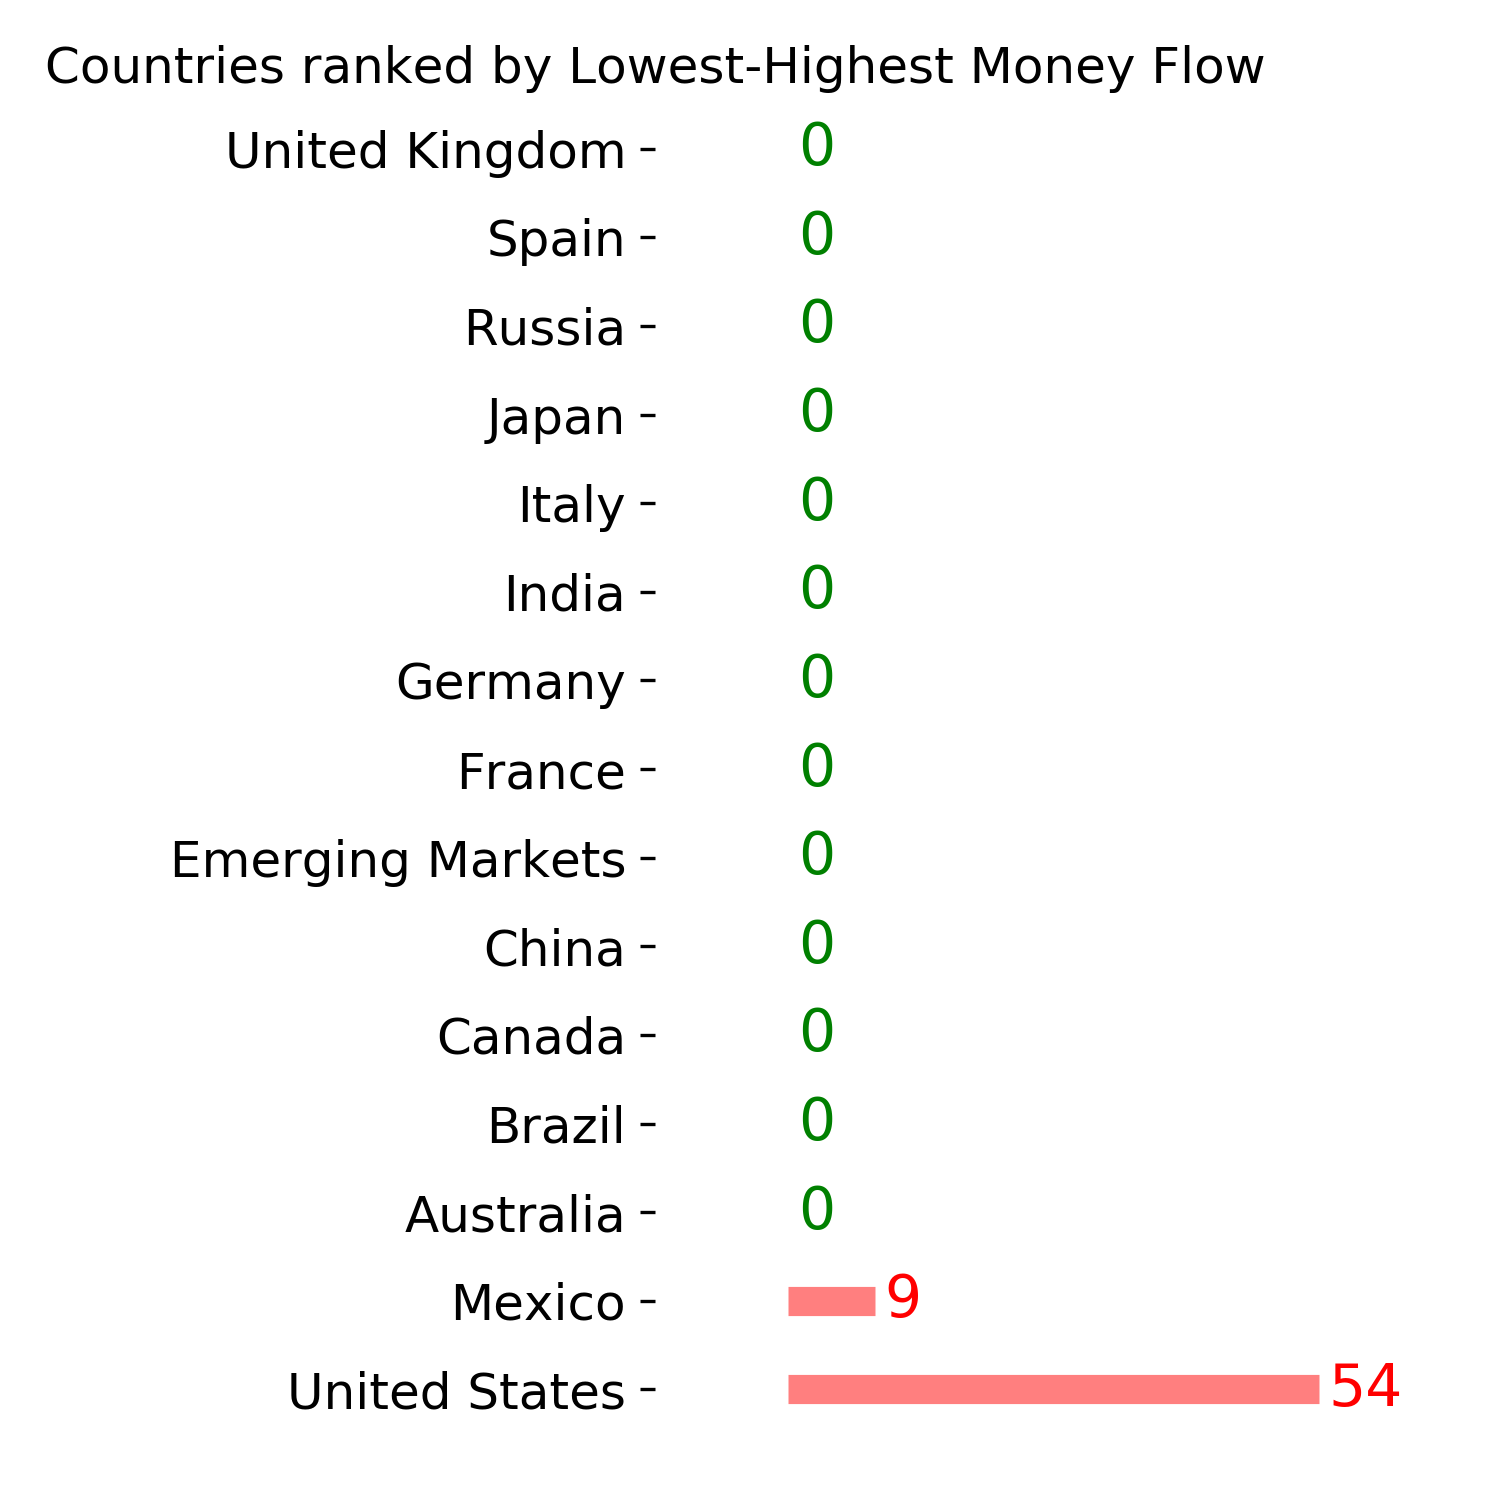
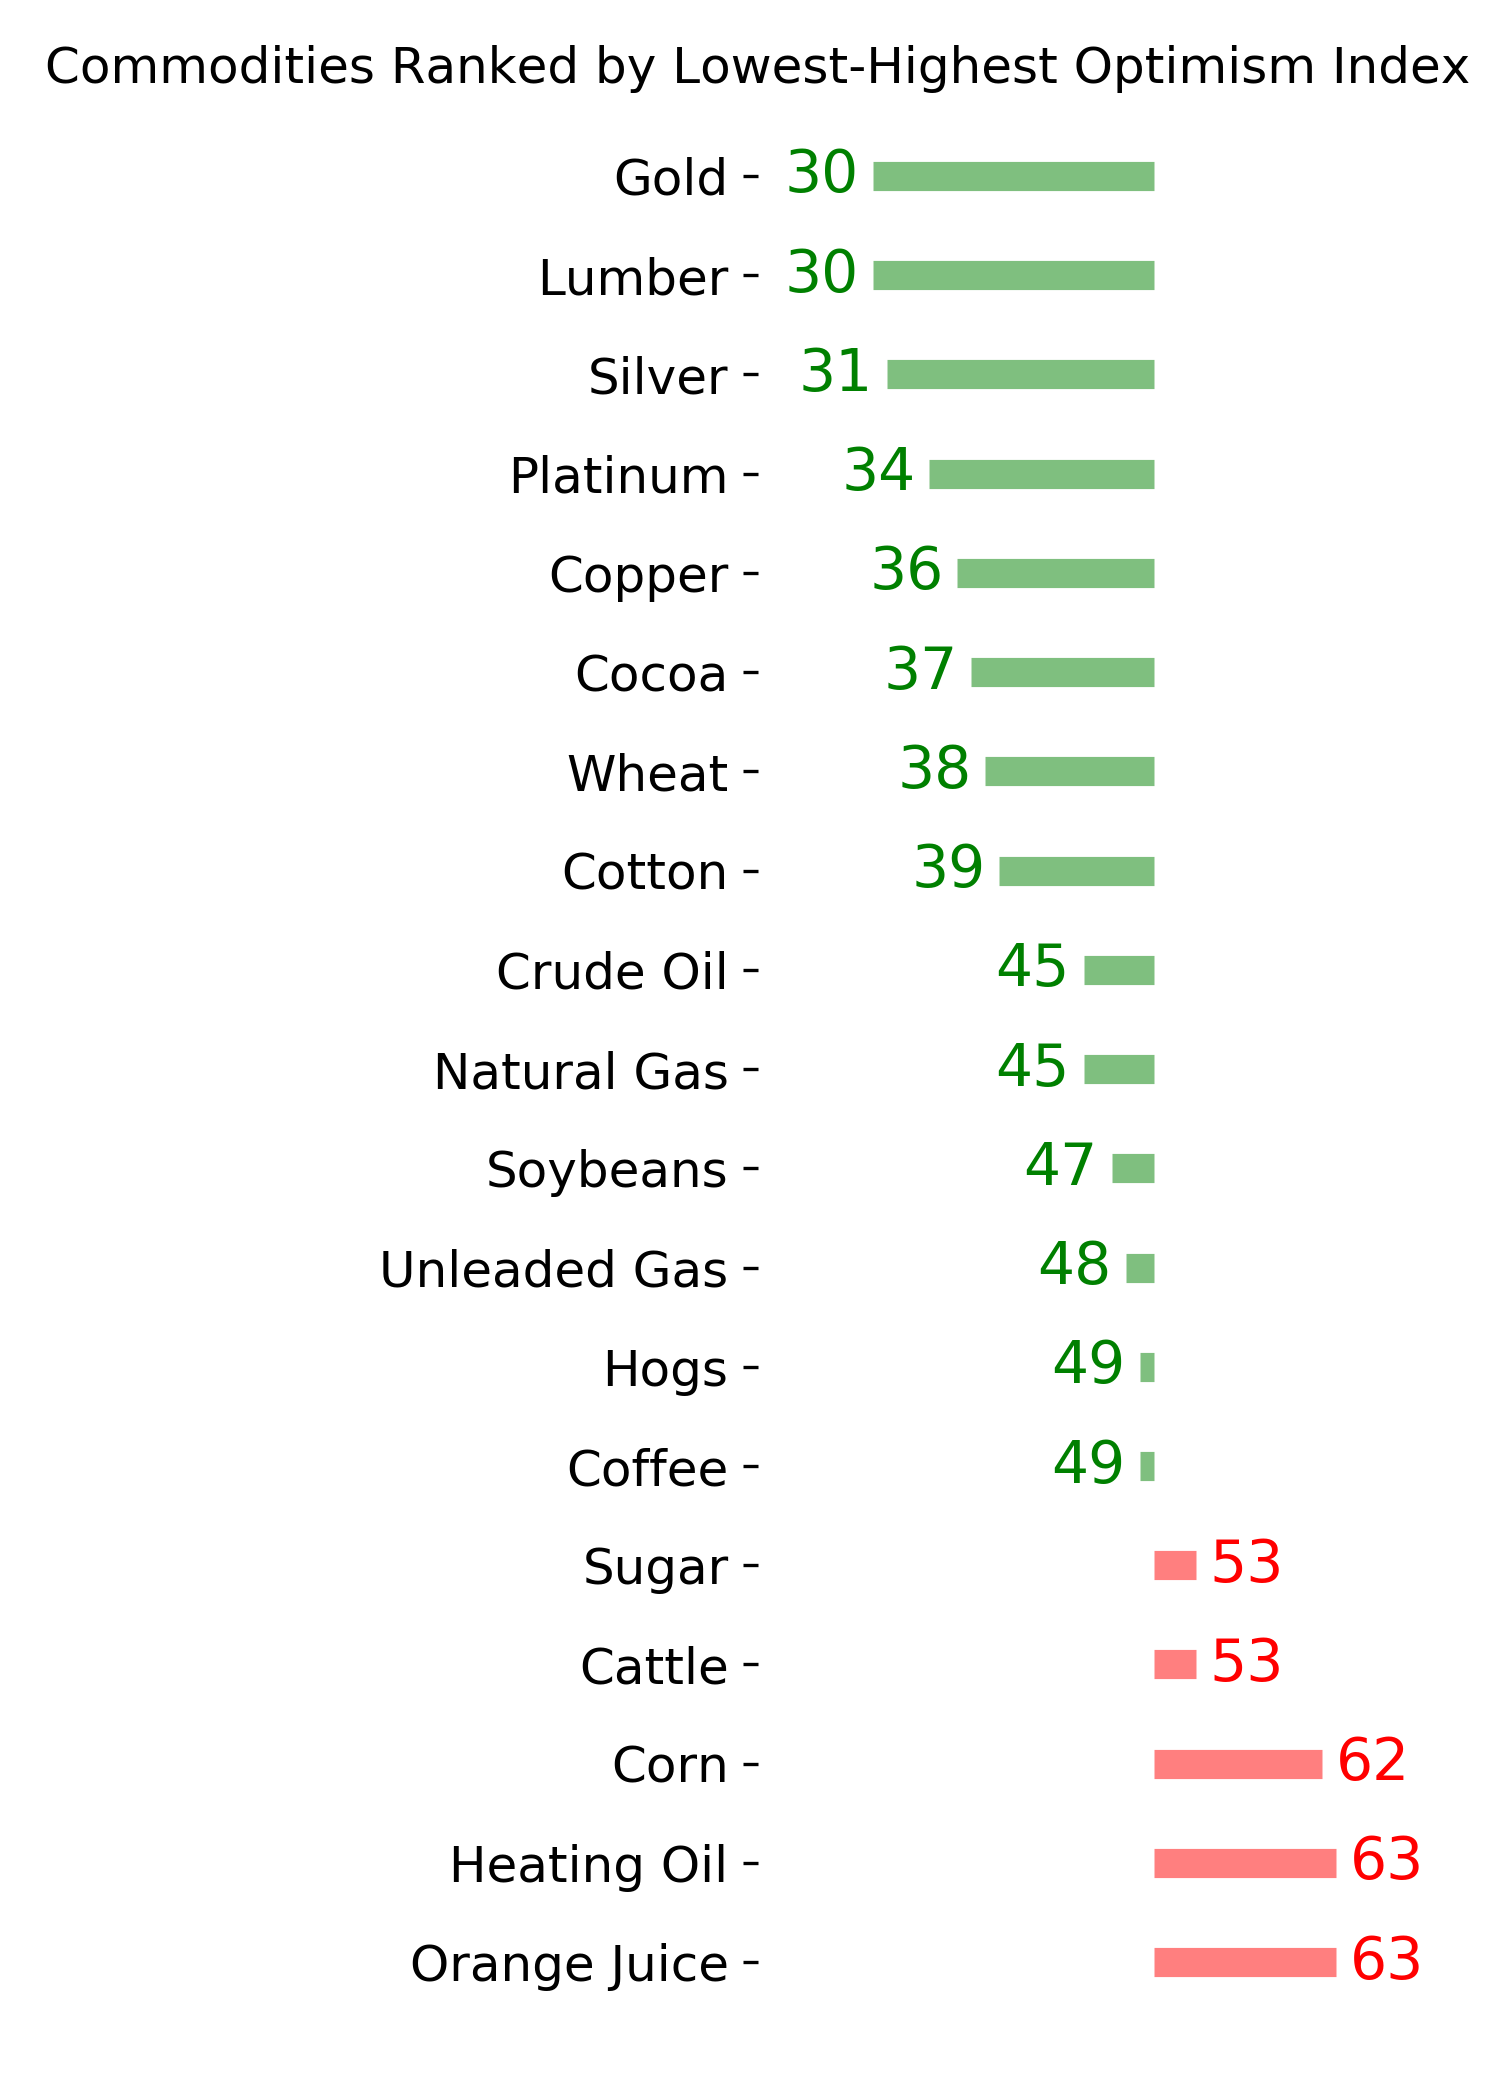
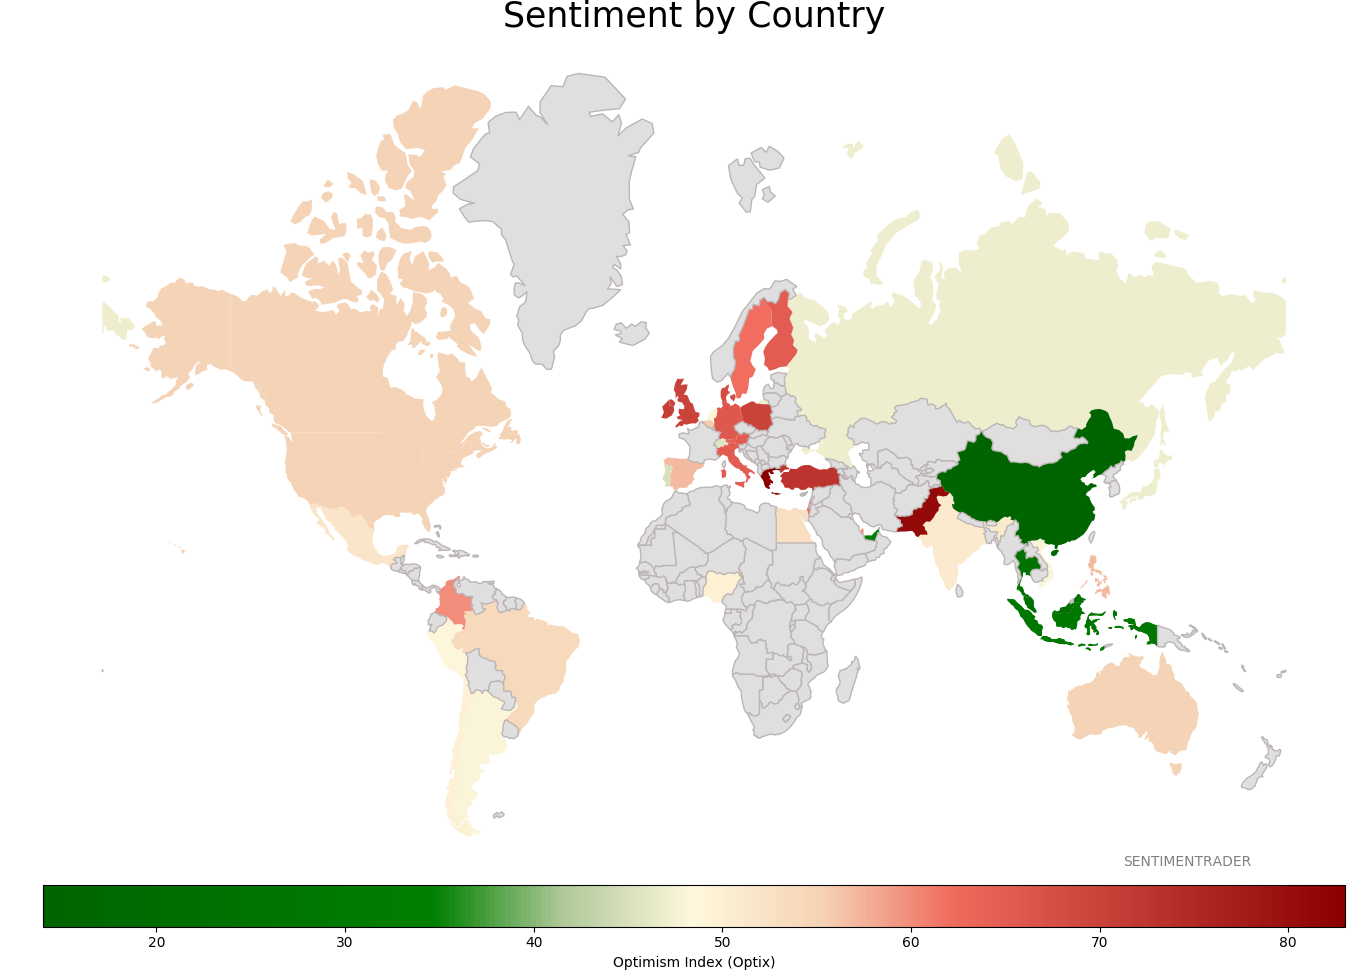
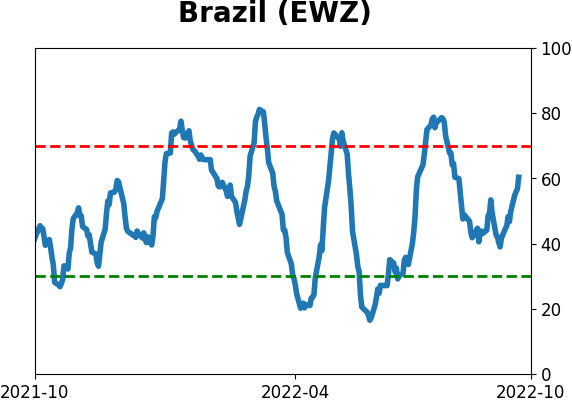
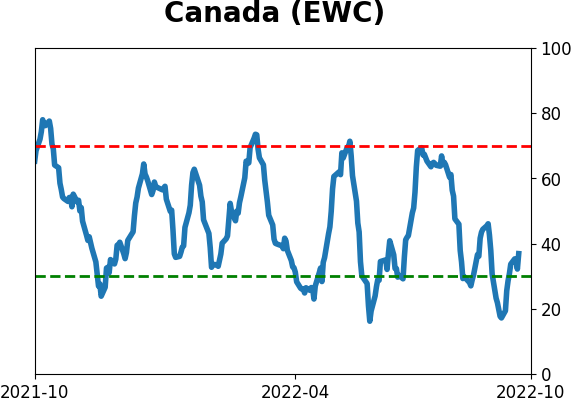
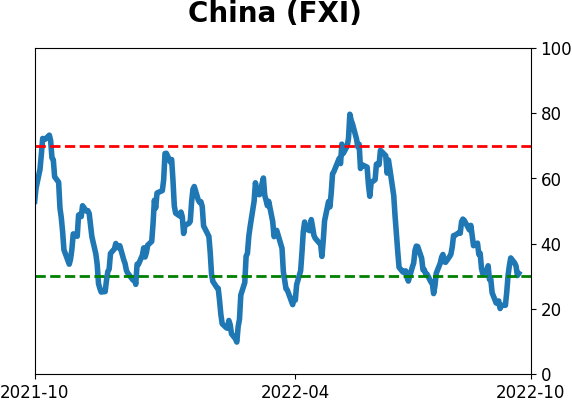
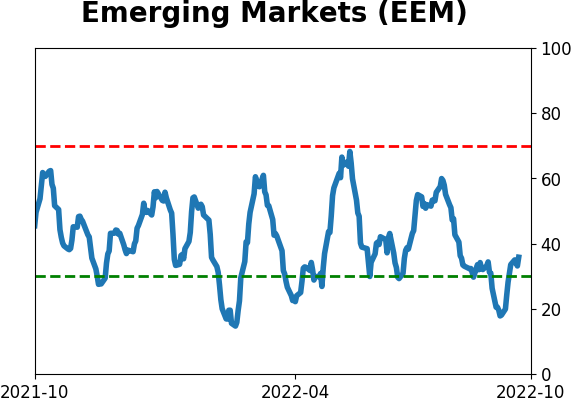
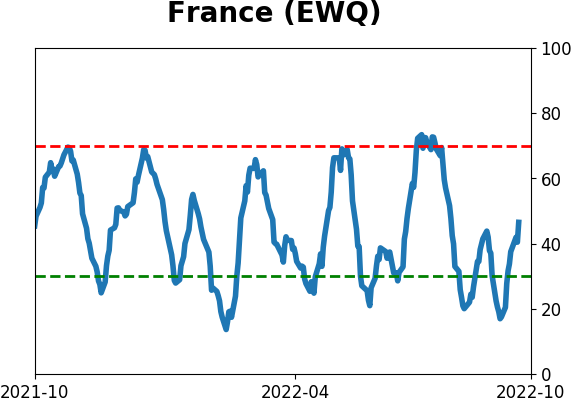
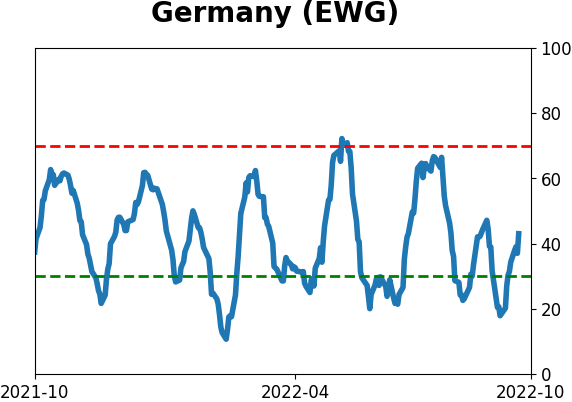
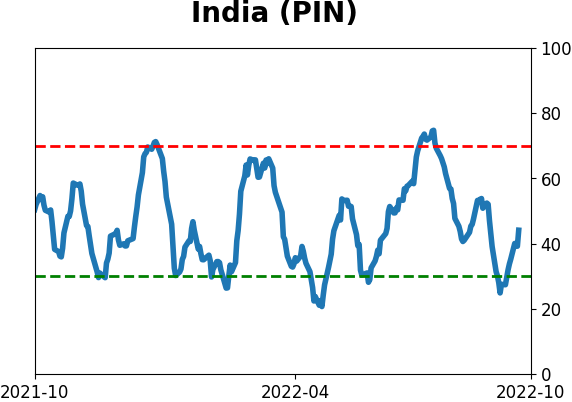
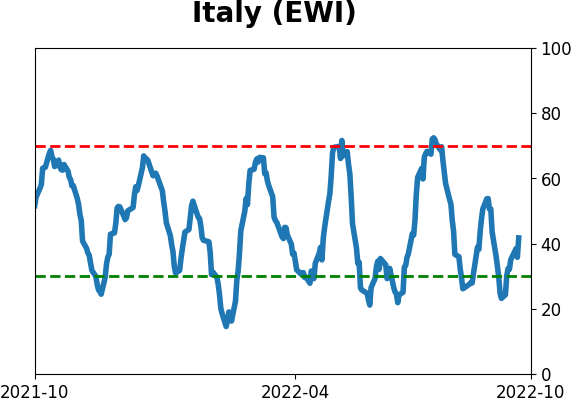
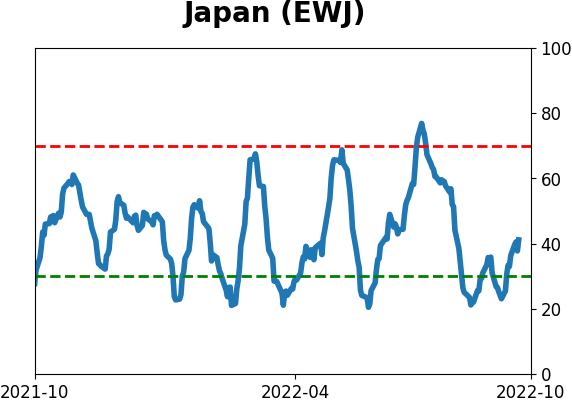
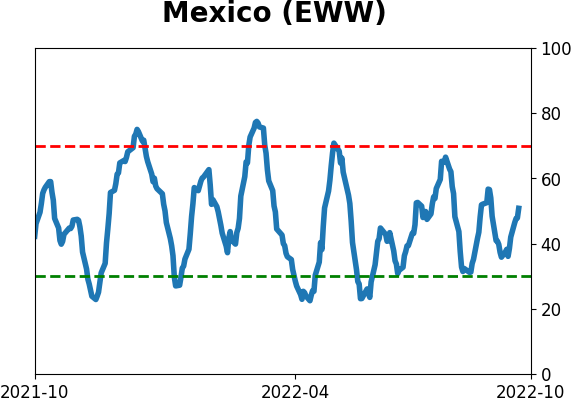
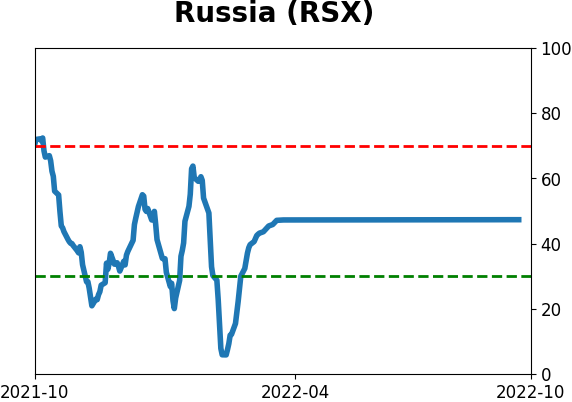
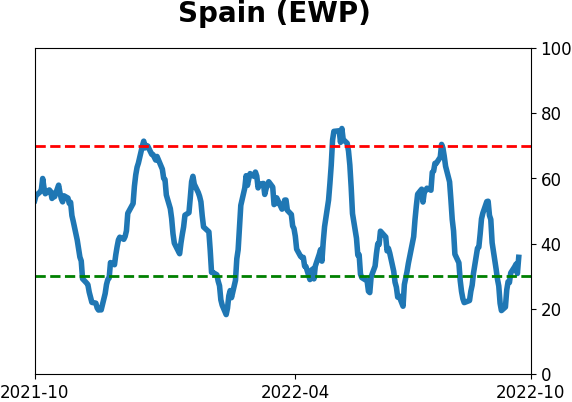
Sentiment Around The World
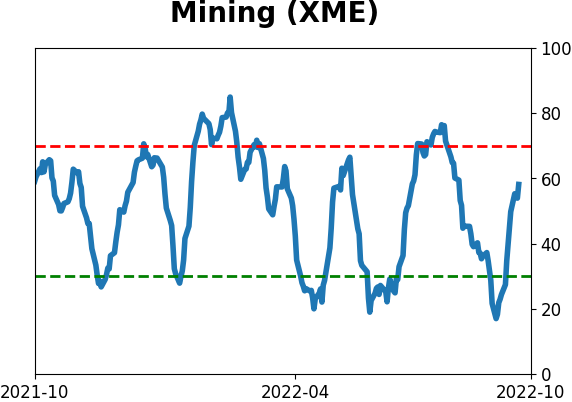
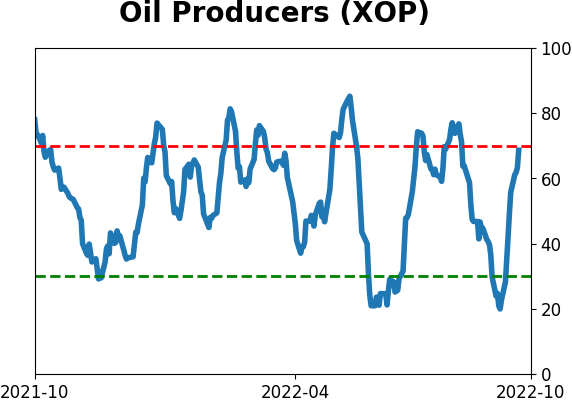
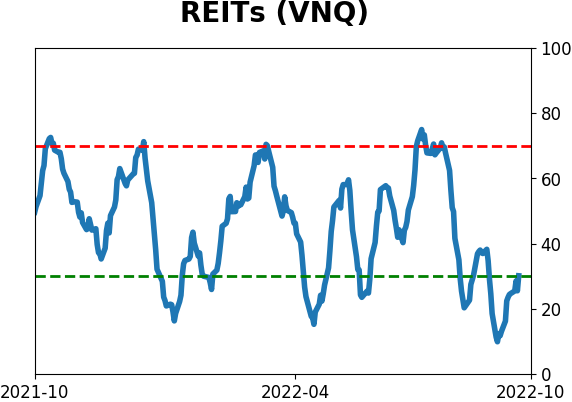
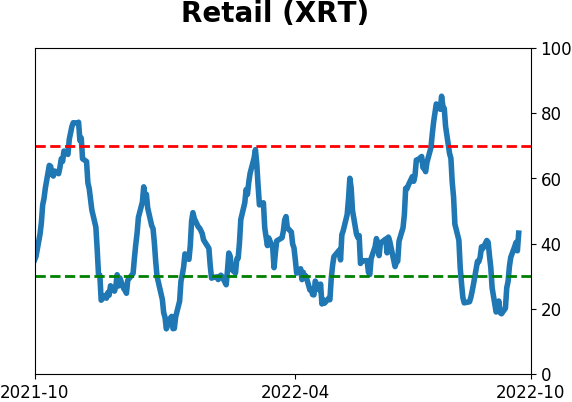
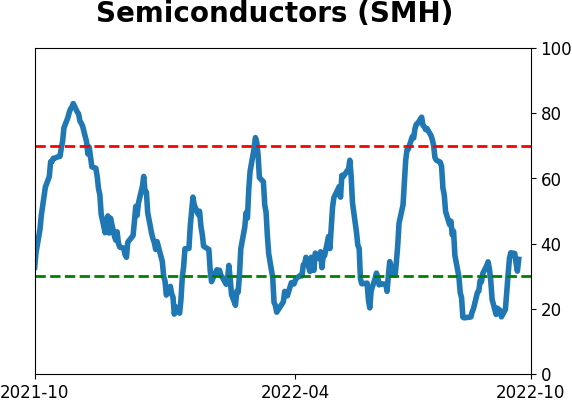
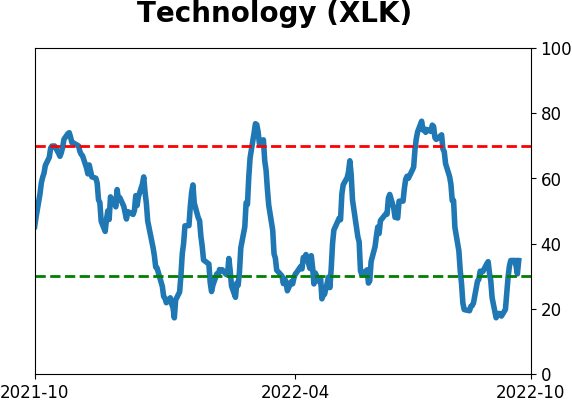
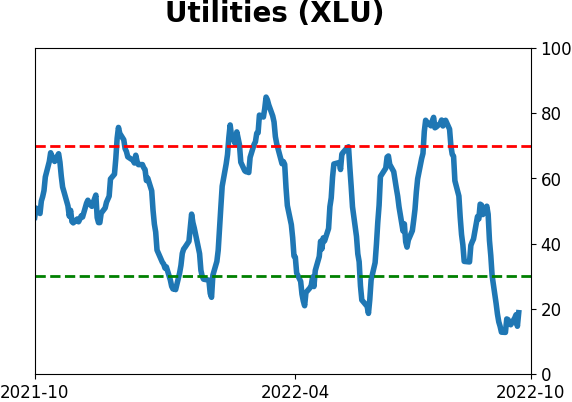
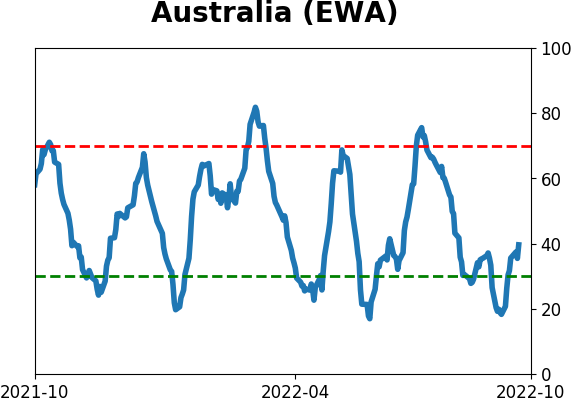
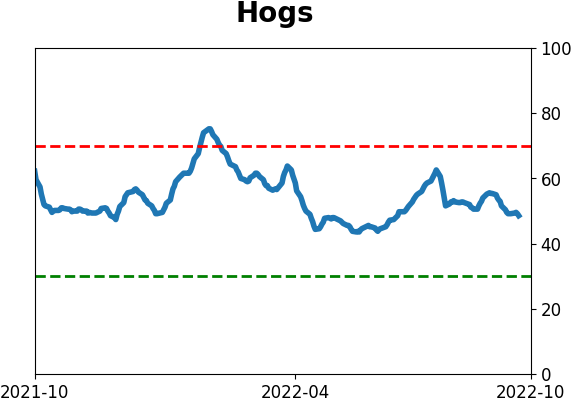
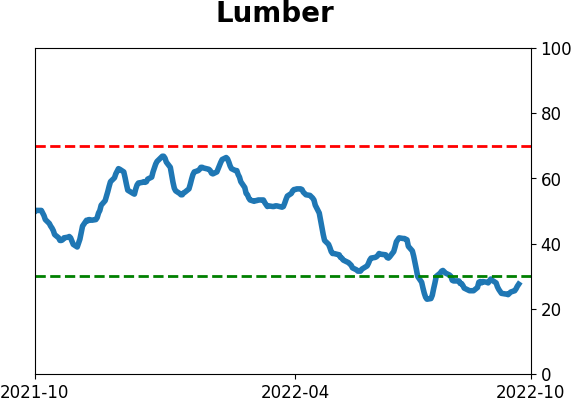
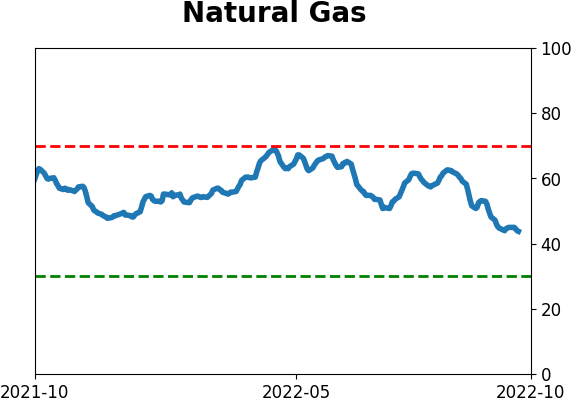
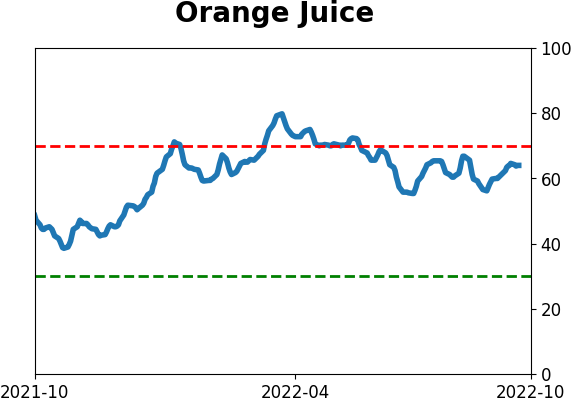
Optimism Index Thumbnails
|
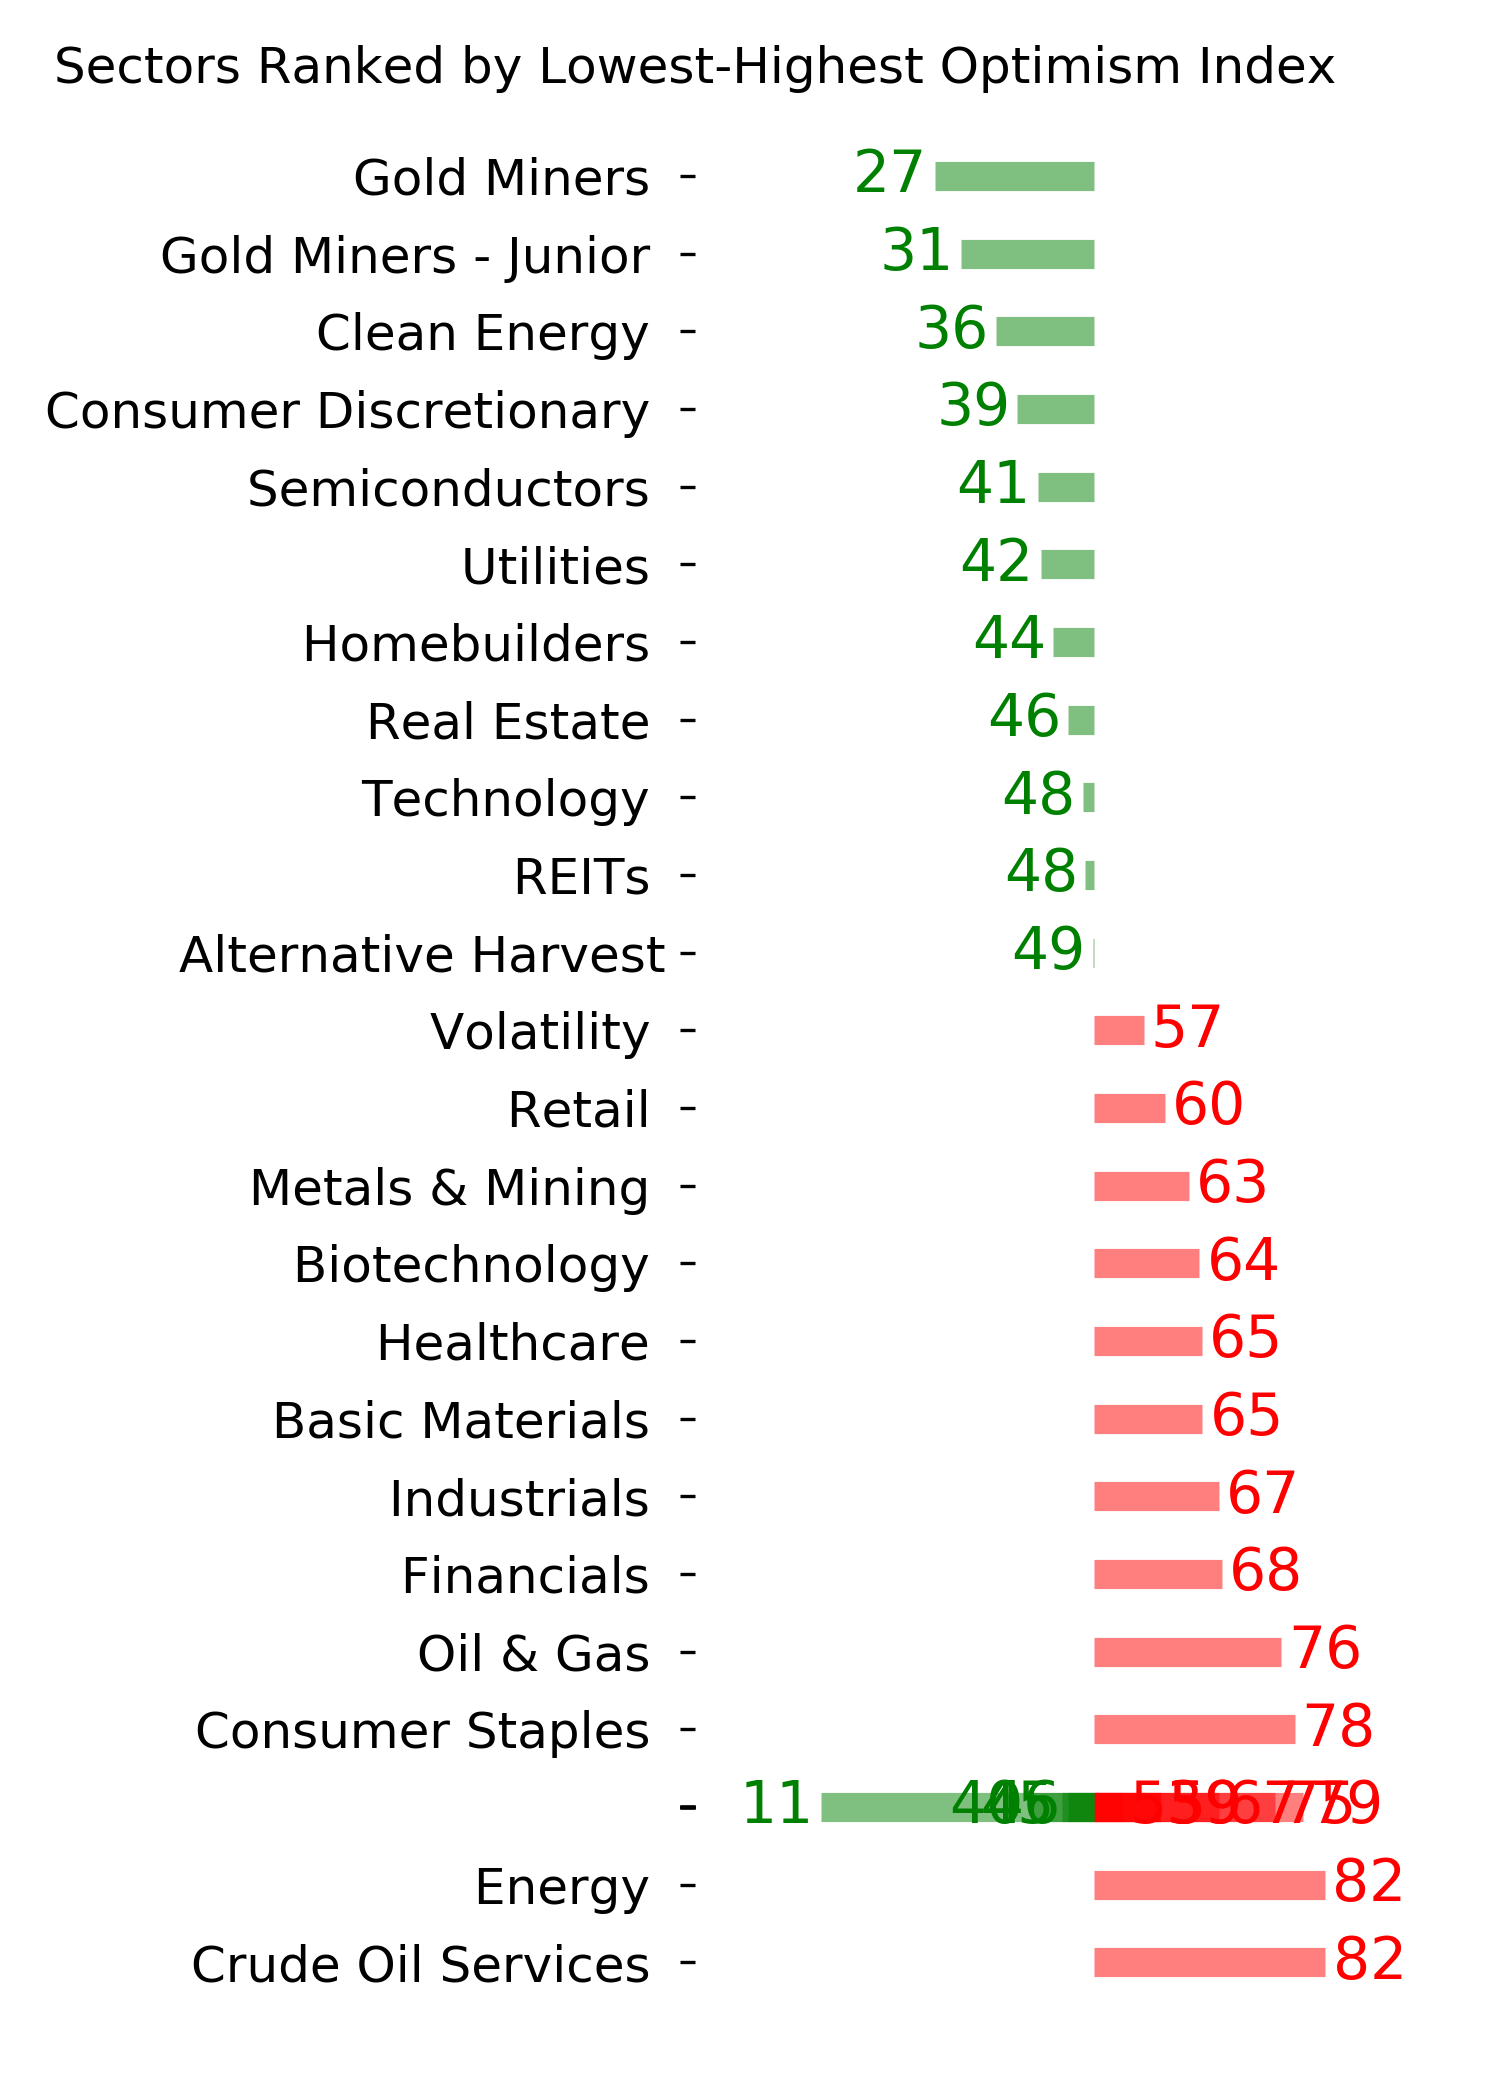
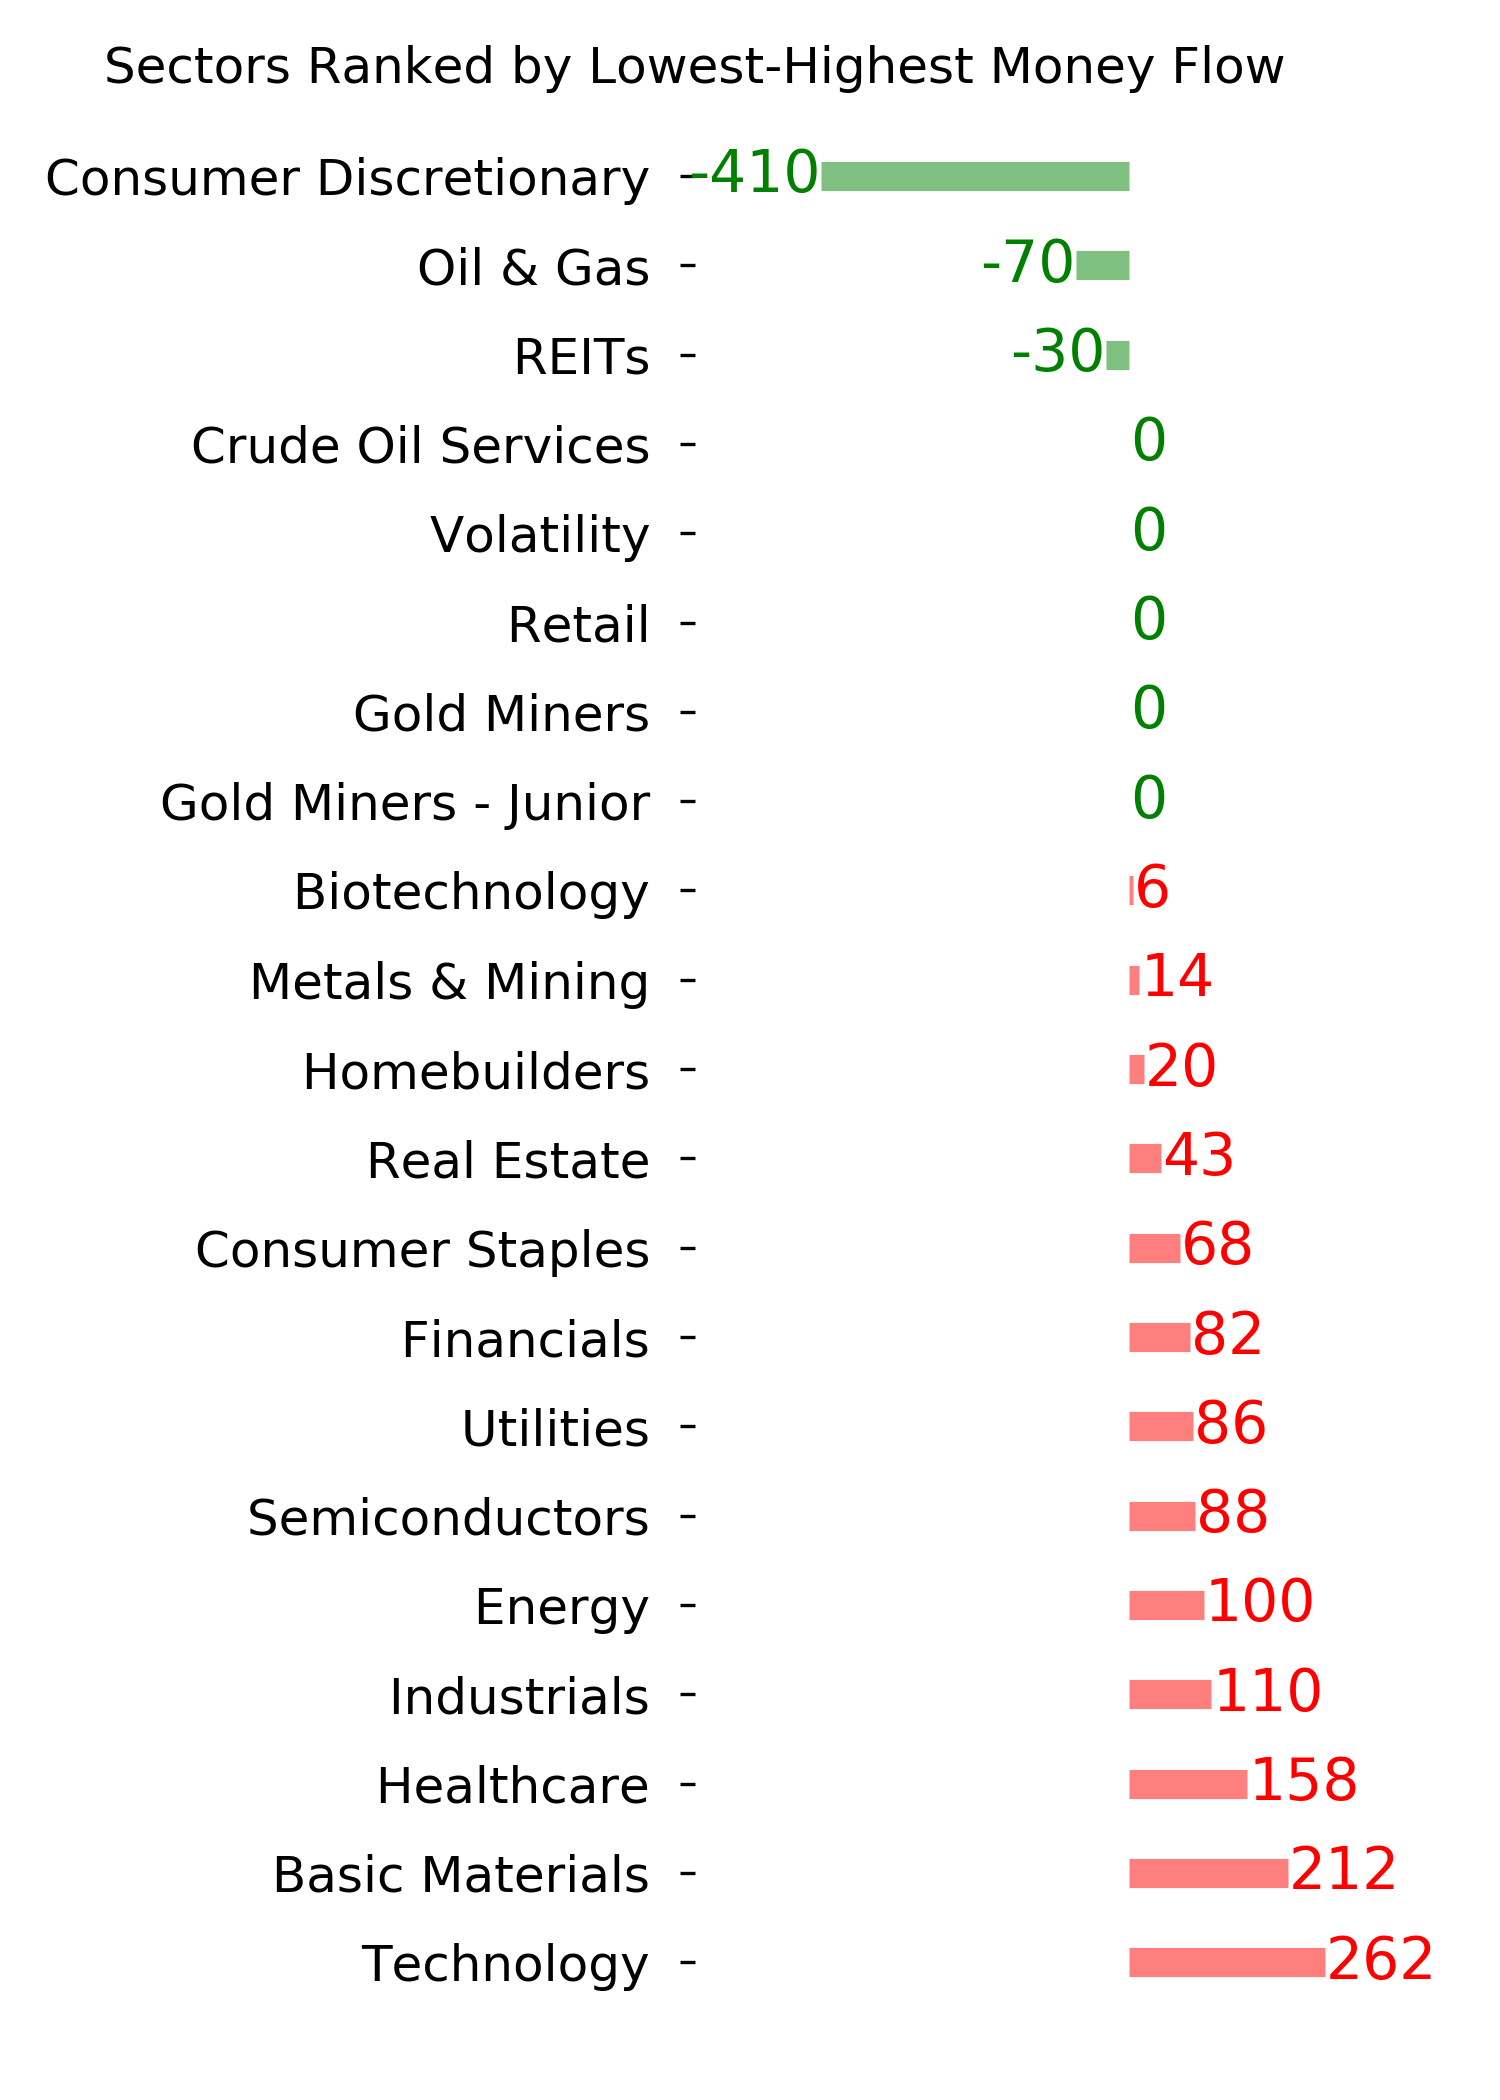
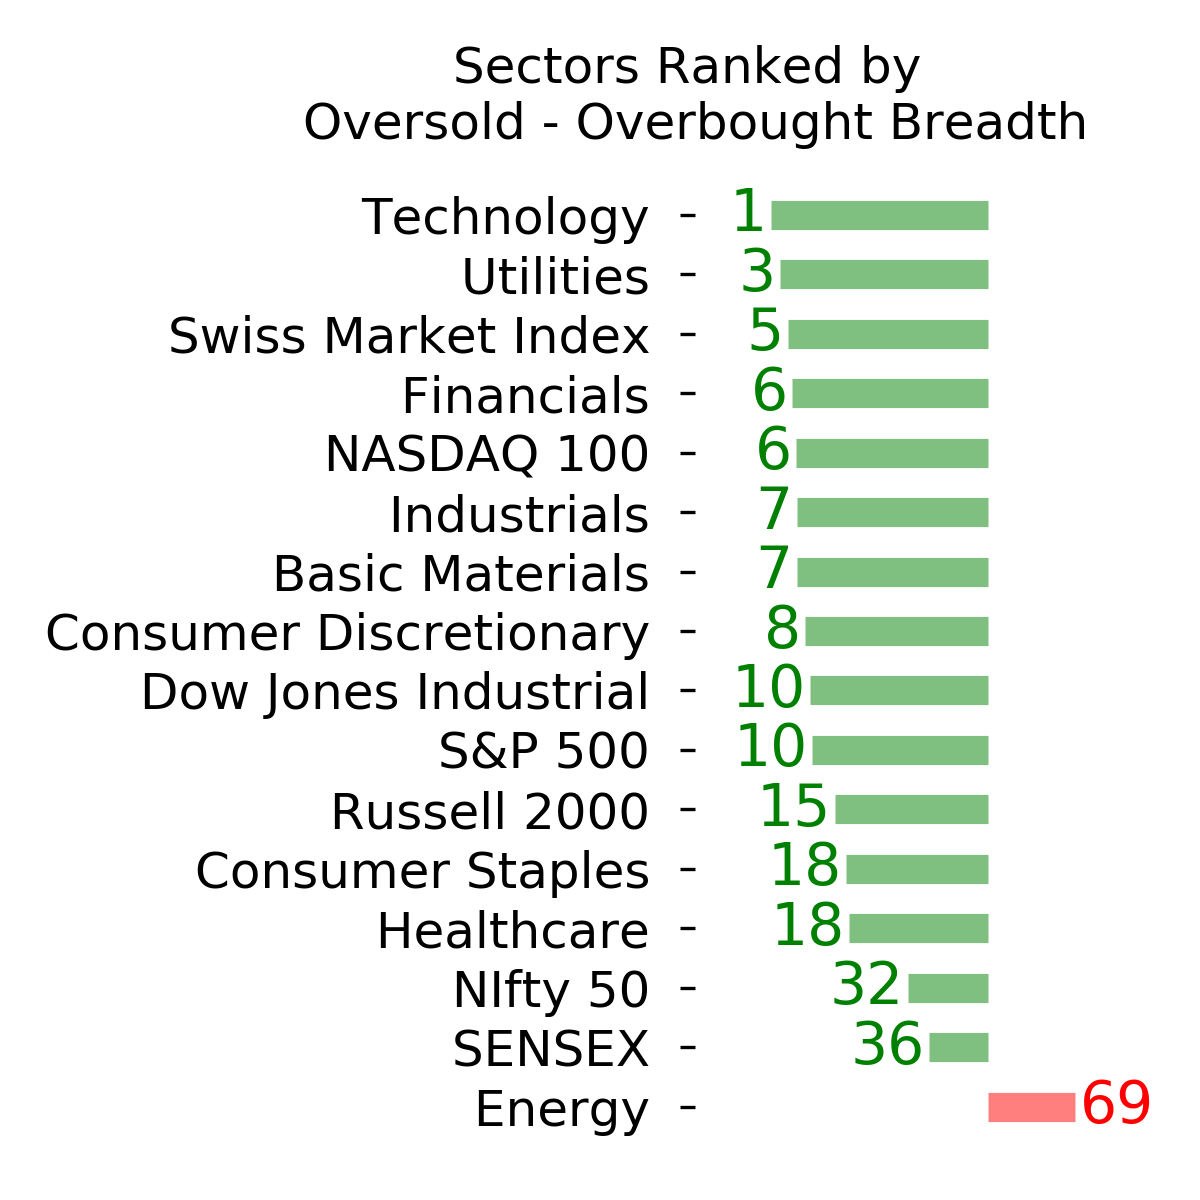
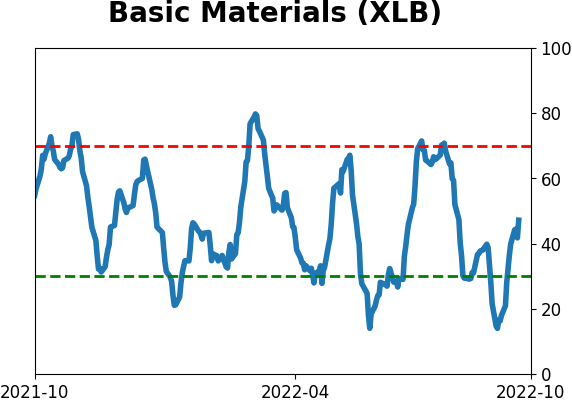
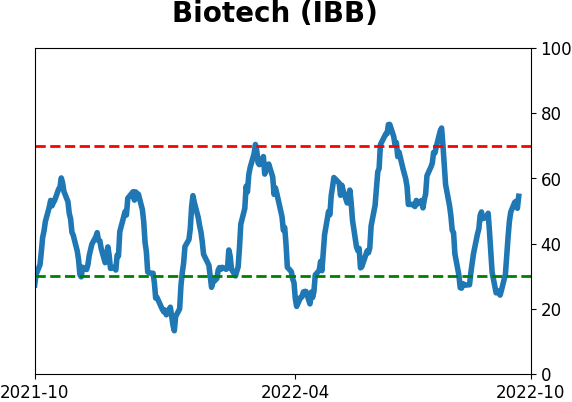
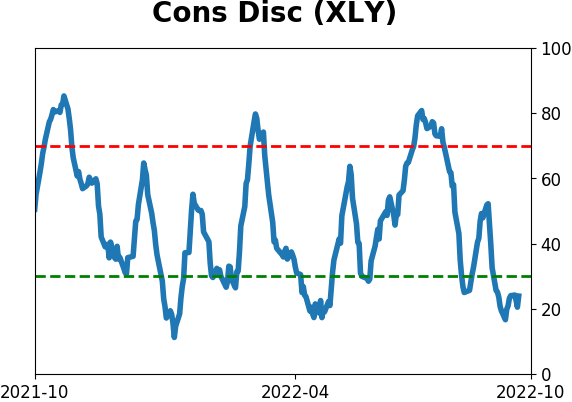
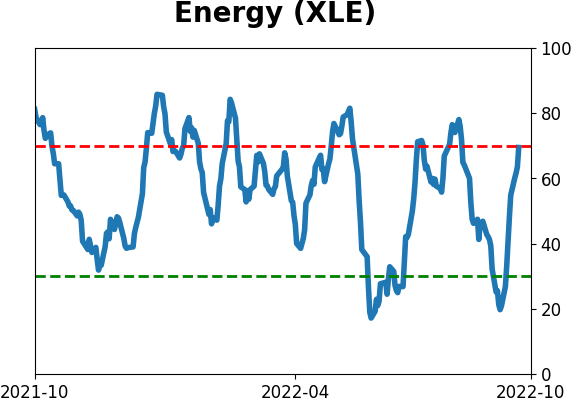
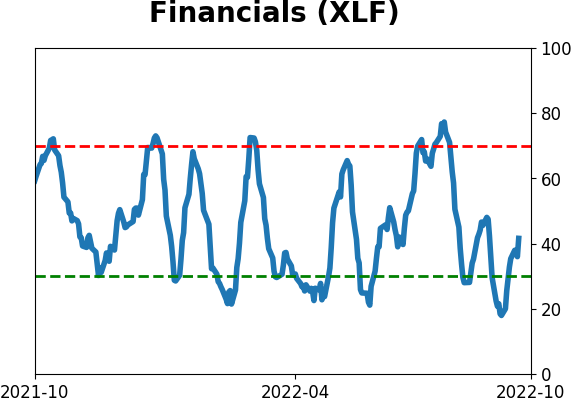
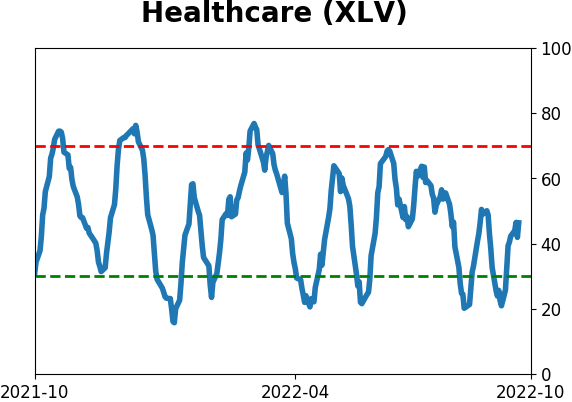
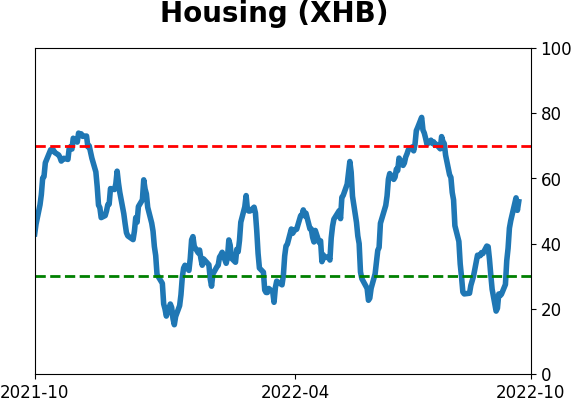
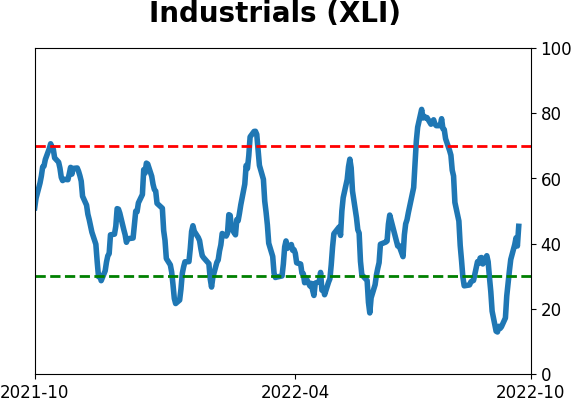
Sector ETF's - 10-Day Moving Average
|
|
|
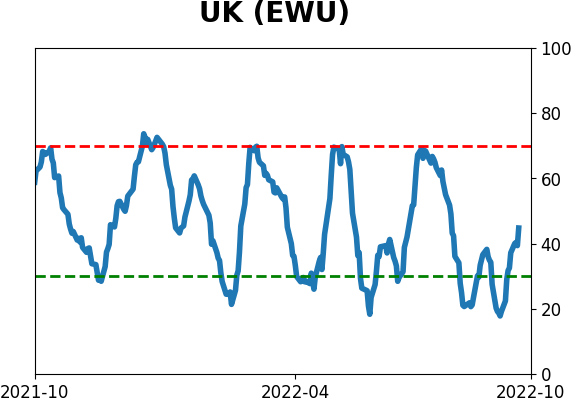
Country ETF's - 10-Day Moving Average
|
|
|
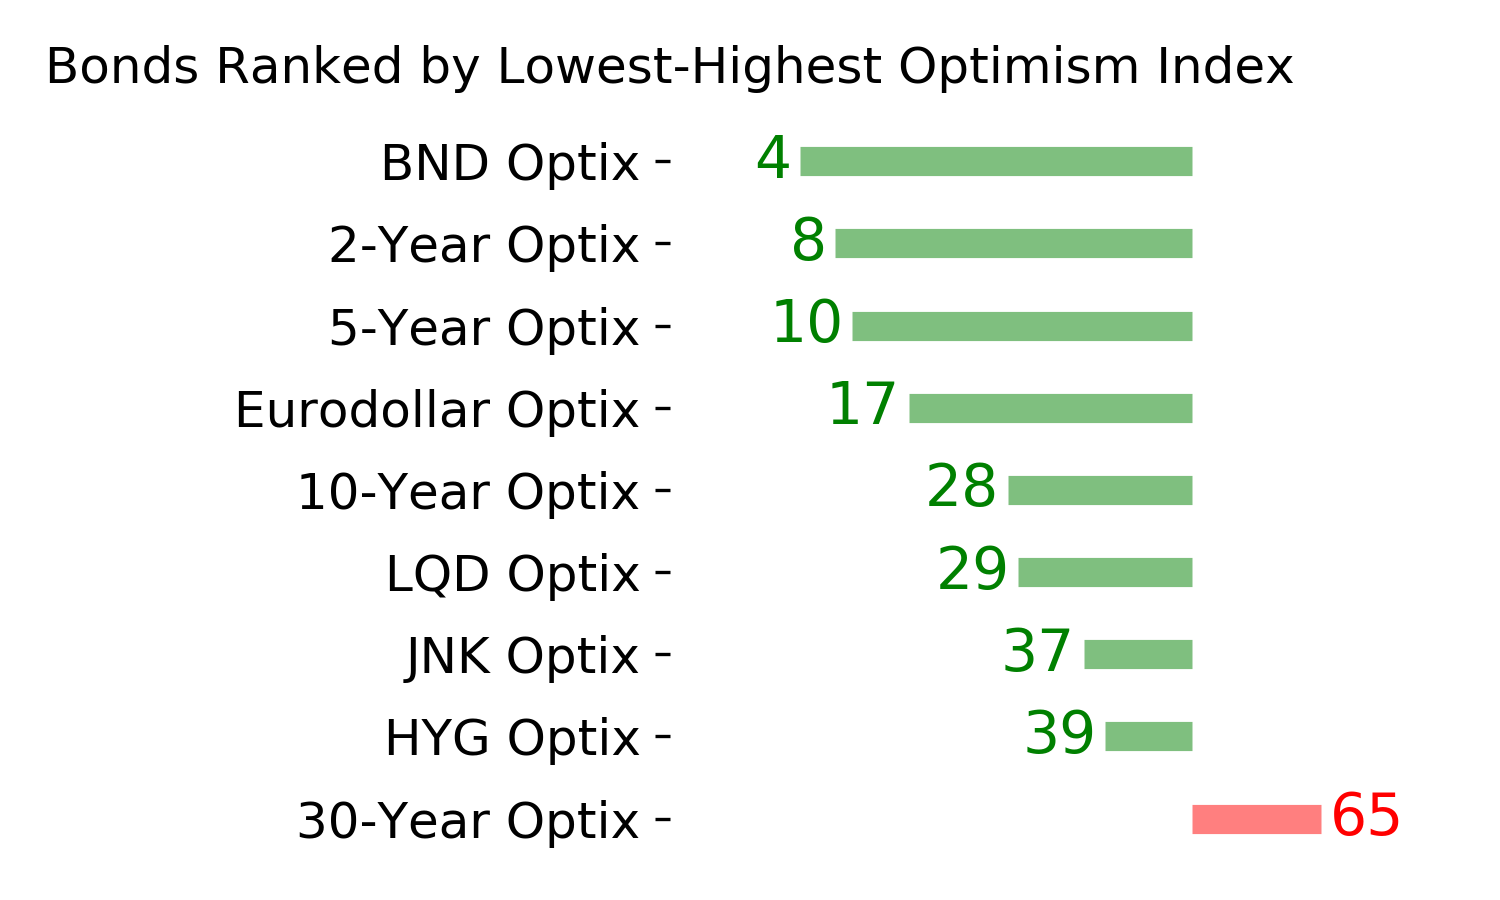
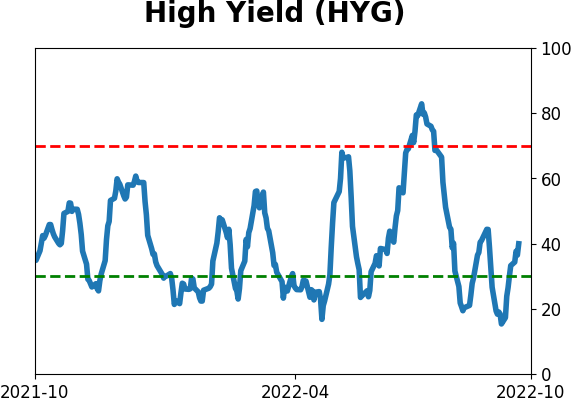
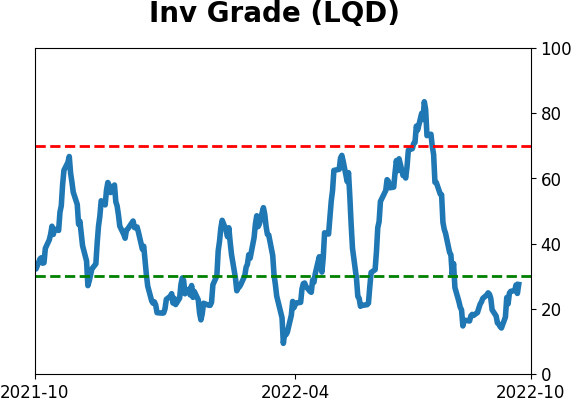
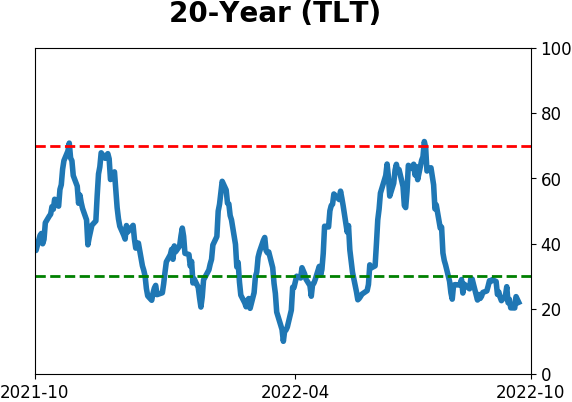
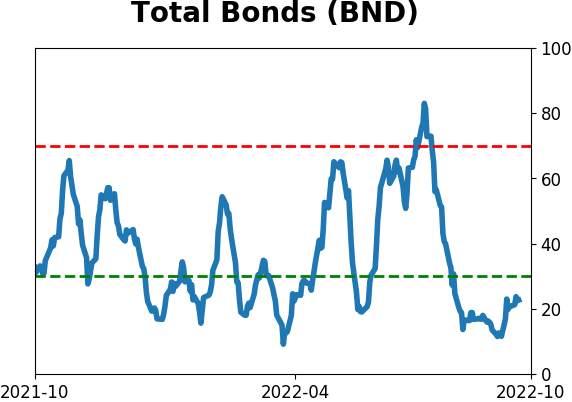
Bond ETF's - 10-Day Moving Average
|
|
|
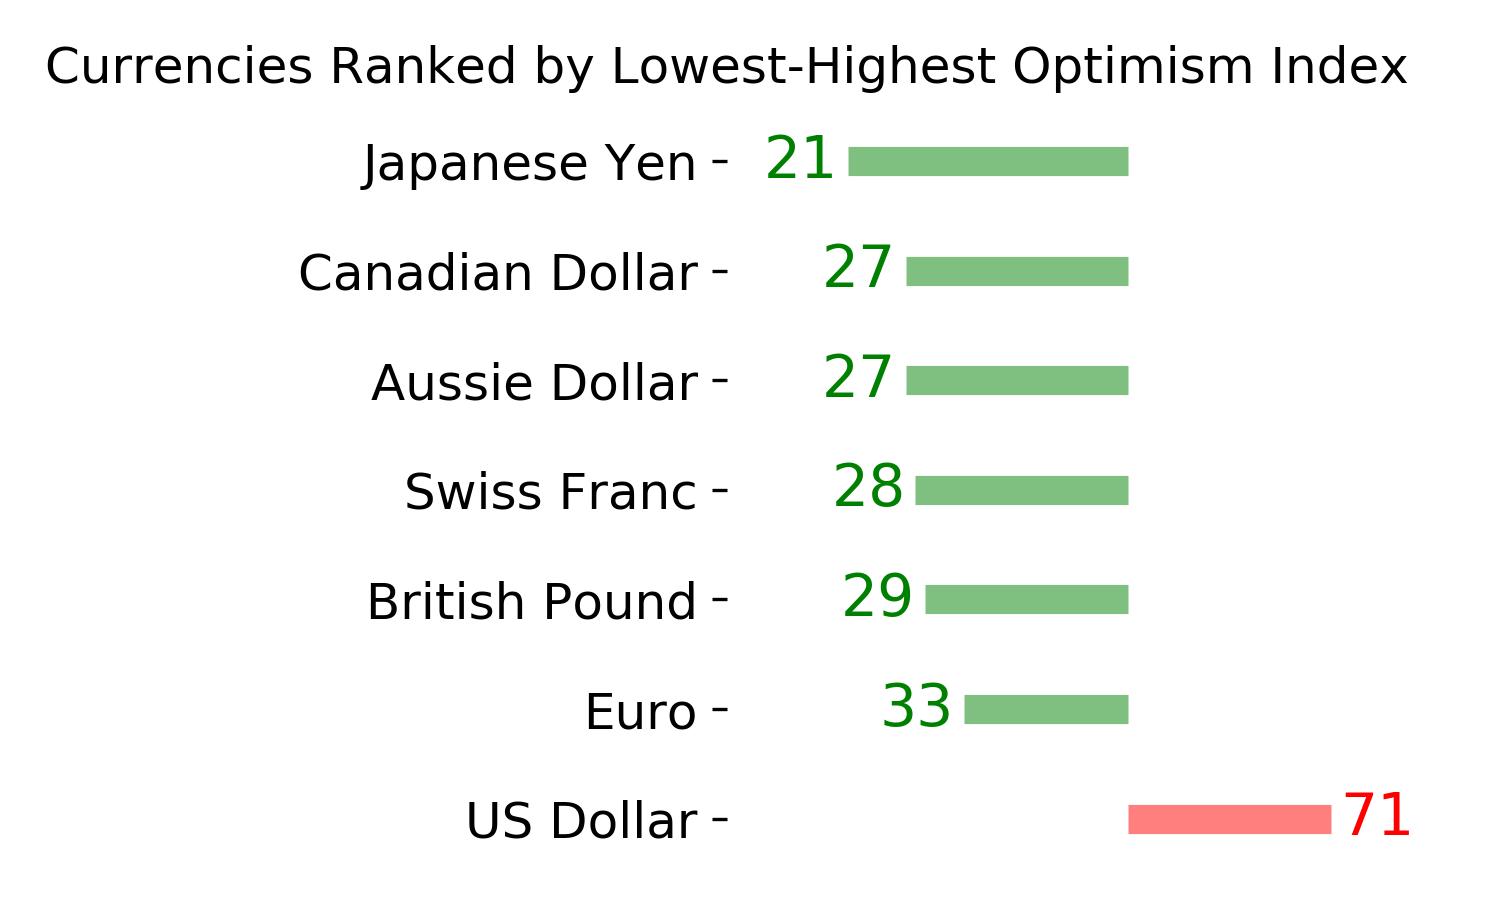
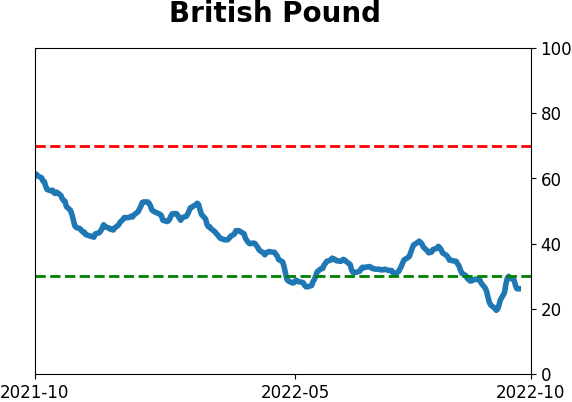
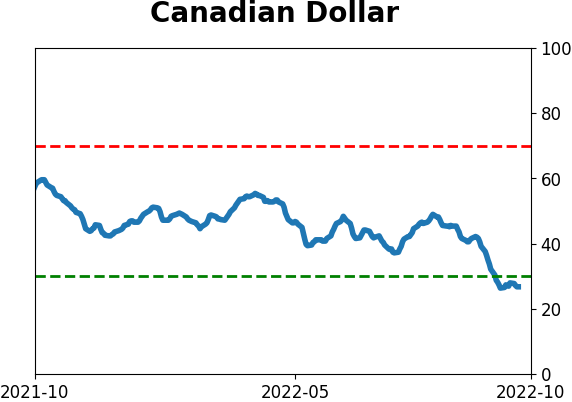
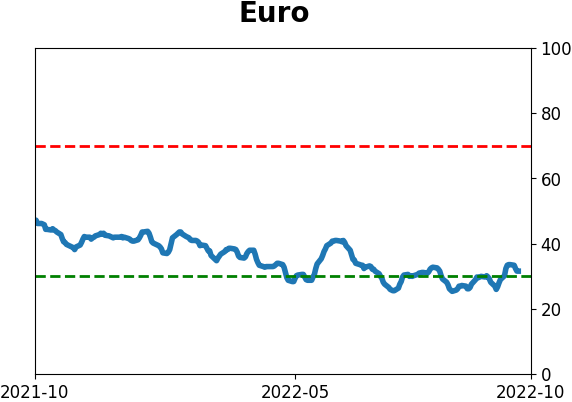
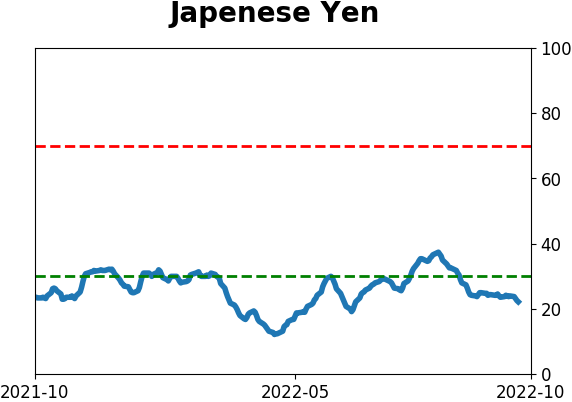
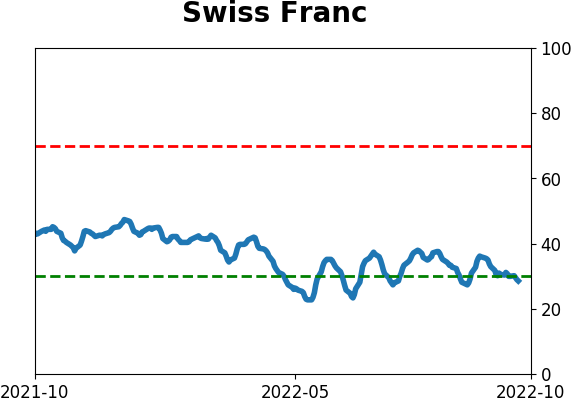
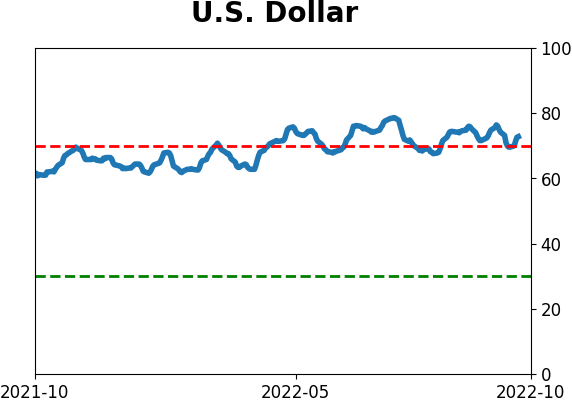
Currency ETF's - 5-Day Moving Average
|
|
|
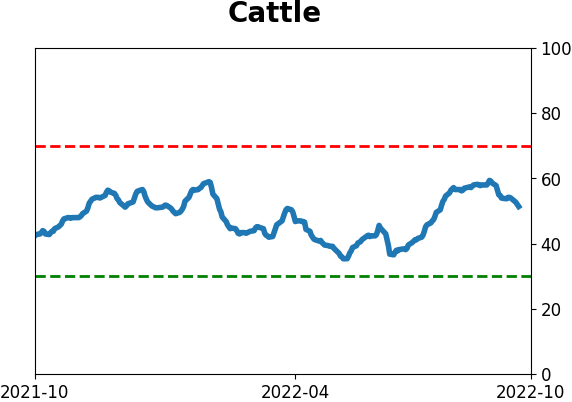
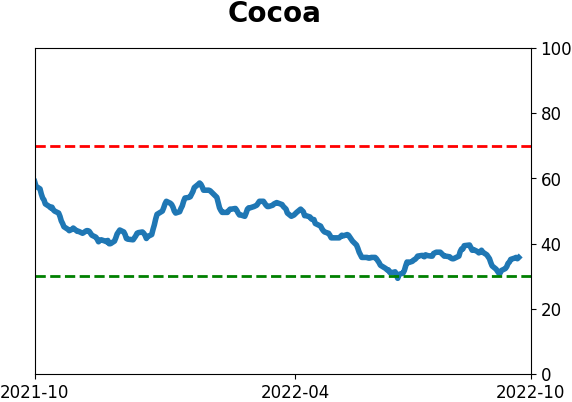
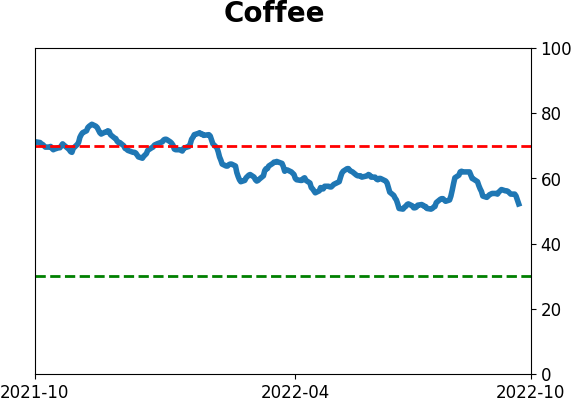
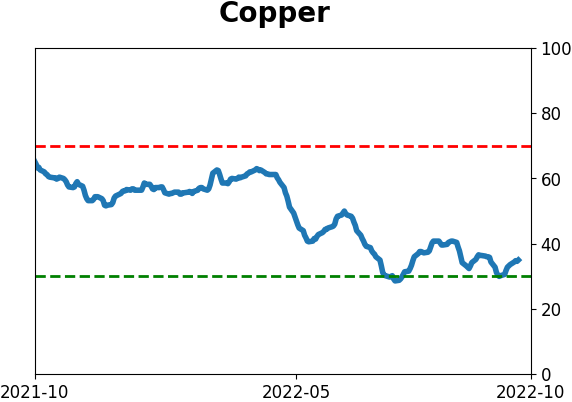
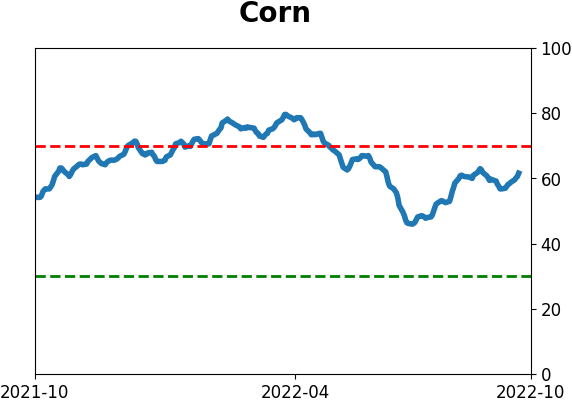
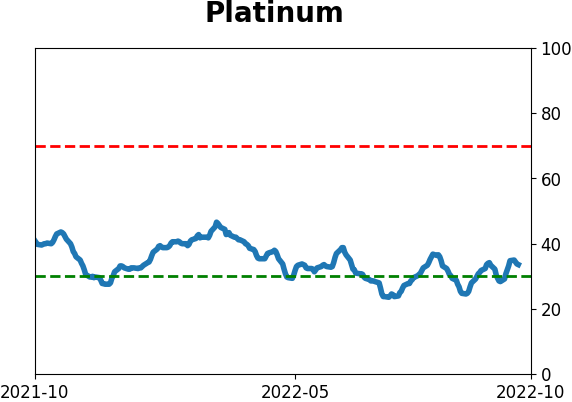
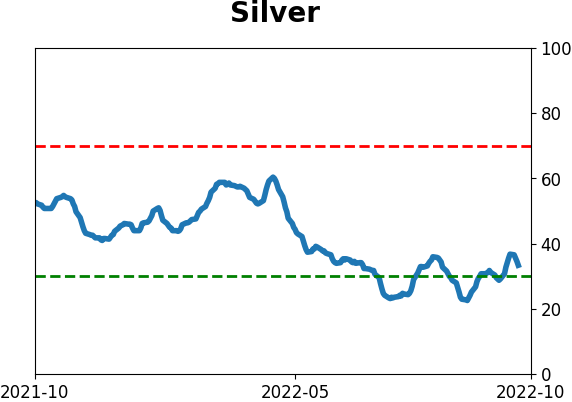
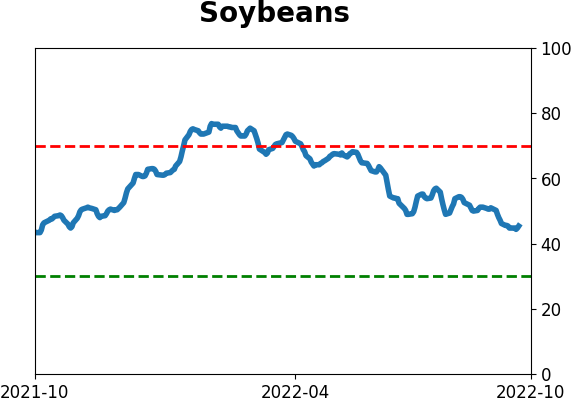
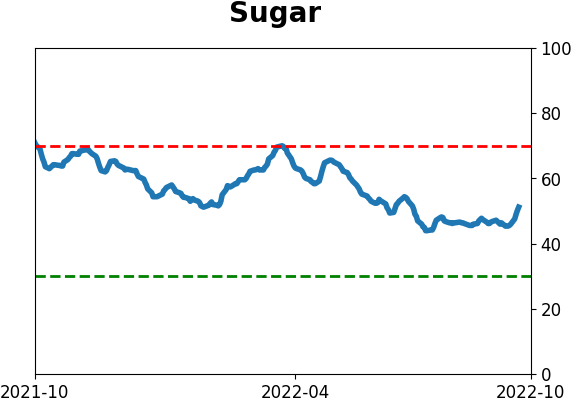
Commodity ETF's - 5-Day Moving Average
|
|