Headlines
|
|
The fear gauge triggered a buy signal for stocks:
A trading model that identifies when expected volatility increases to the upper end of its recent range, indicating fear, reversed lower, triggering a buy signal for stocks. Similar shifts in the volatility Index (VIX) produced excellent outcomes for the S&P 500.
|
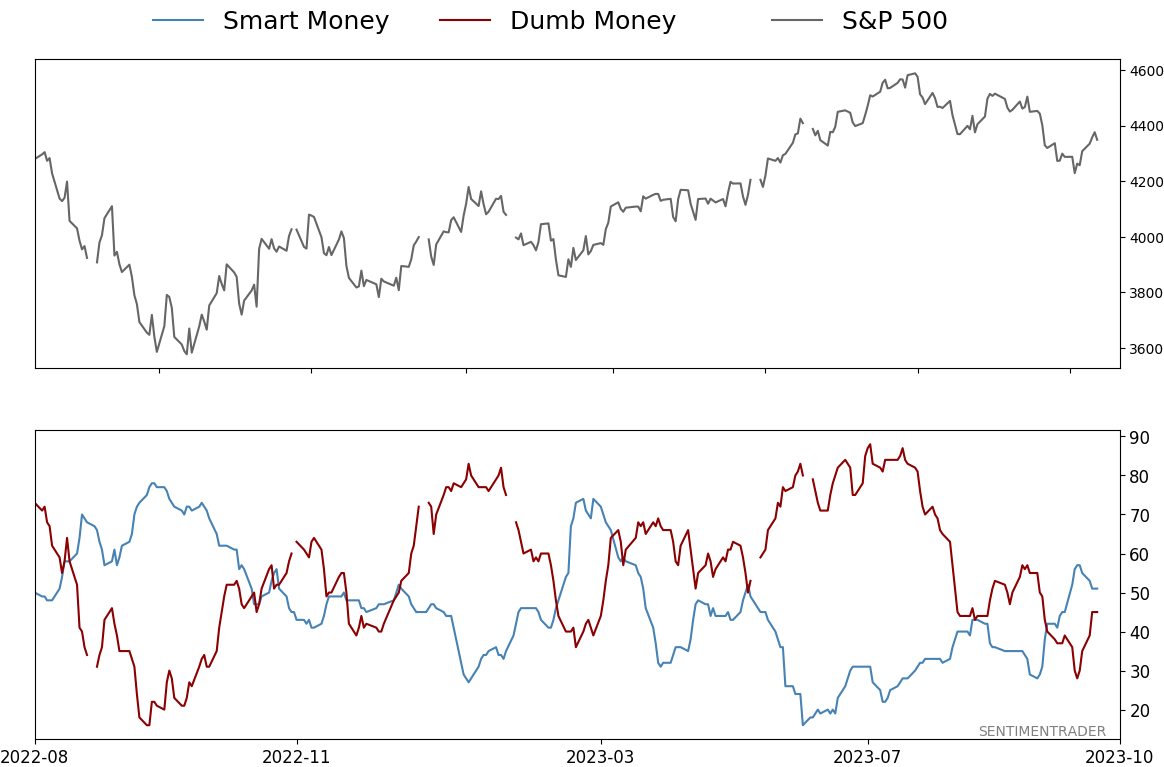
Smart / Dumb Money Confidence
|
Smart Money Confidence: 51%
Dumb Money Confidence: 45%
|
|
Risk Levels
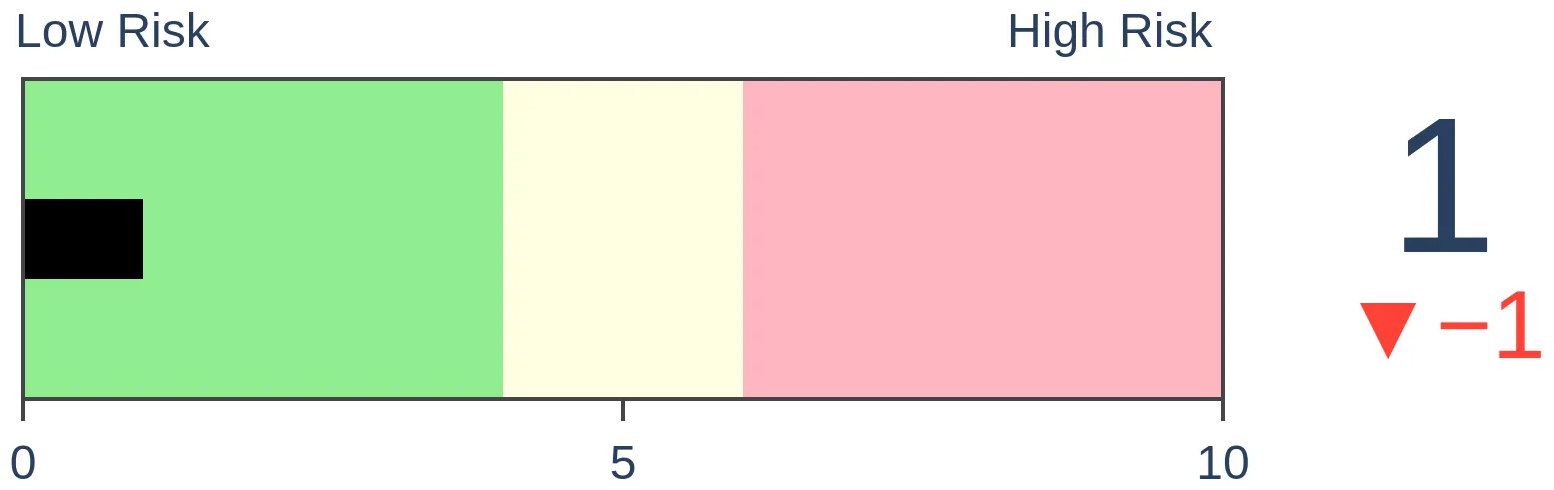
Stocks Short-Term
|
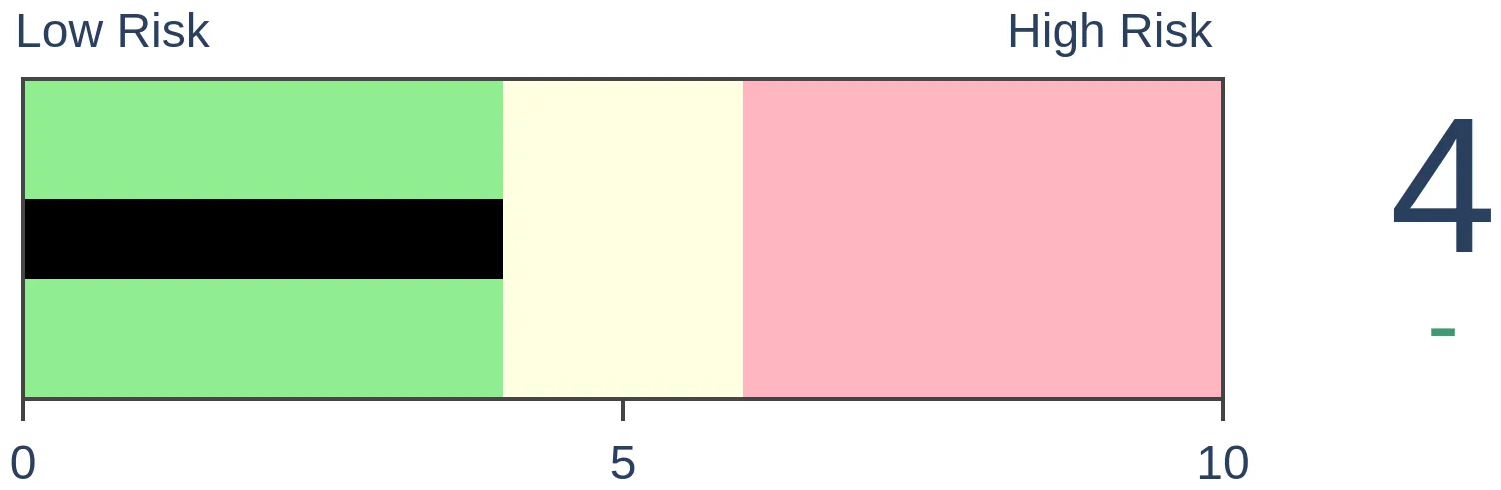
Stocks Medium-Term

|
|
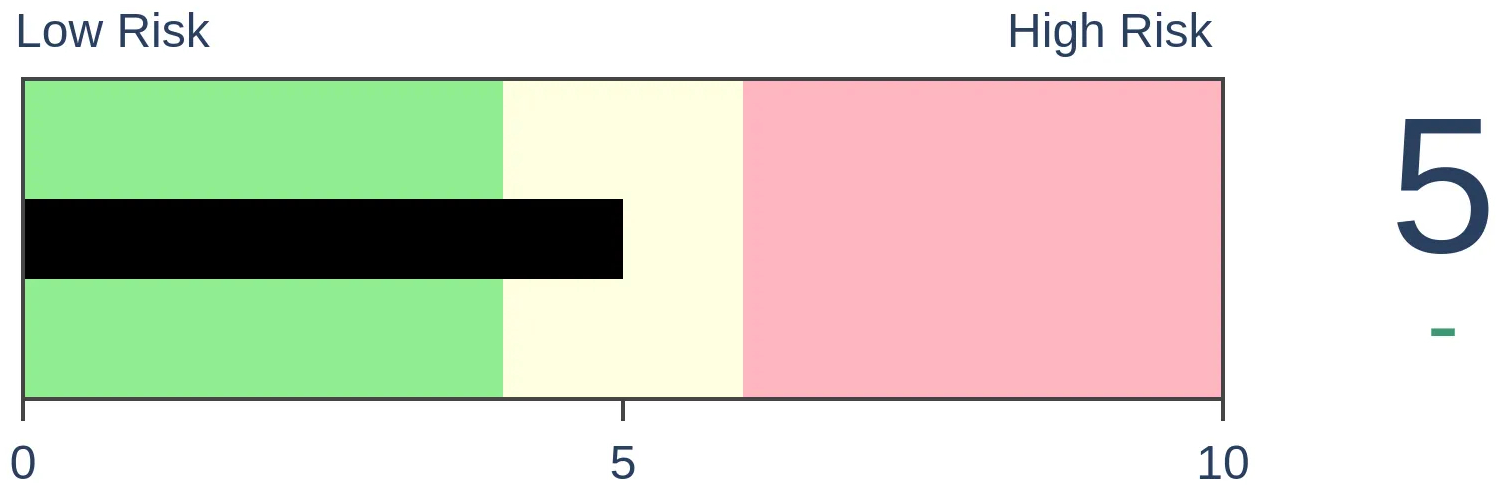
Bonds
|
Crude Oil

|
|
Gold
|
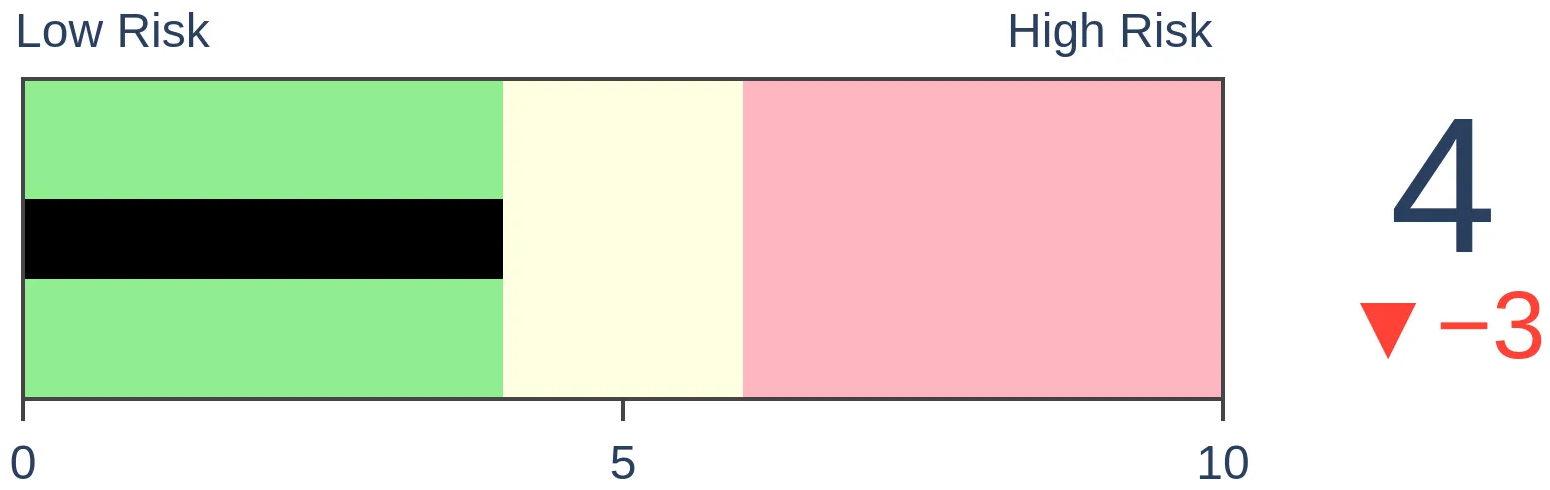
Agriculture
|
|
Research
By Dean Christians
BOTTOM LINE
A trading model that identifies when expected volatility increases to the upper end of its recent range, indicating fear, reversed lower, triggering a buy signal for stocks. Similar shifts in the volatility Index (VIX) produced excellent outcomes for the S&P 500.
FORECAST / TIMEFRAME
None
|
Key points:
- The Volatility Index (VIX) reversed from the upper end of its 84-day range, triggering a buy signal for stocks
- Similar shifts in volatility preceded a rally in the S&P 500 with above-average returns across several horizons
- Precedents that occurred in October or in a long-term uptrend show similar bullish outcomes
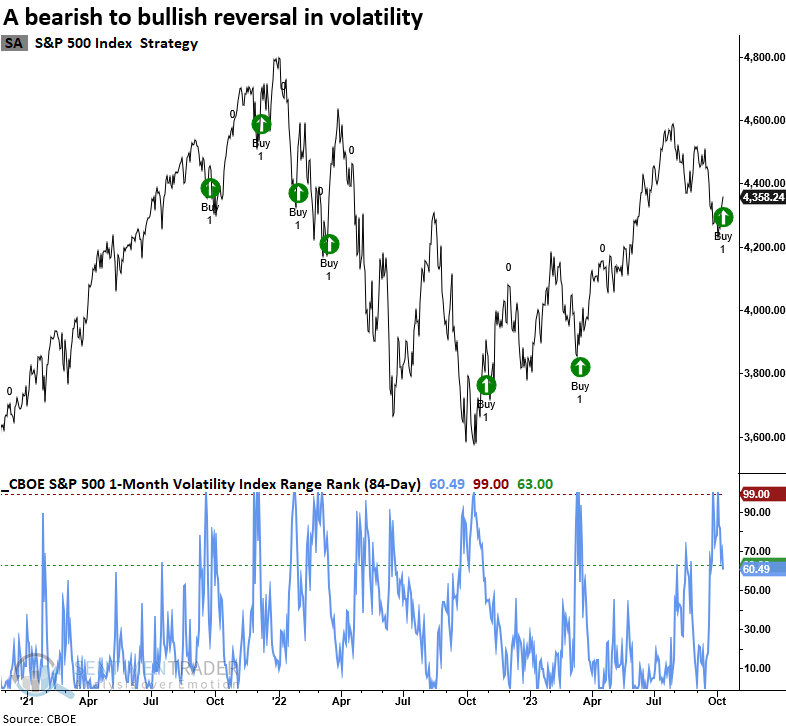
A bullish shift in expected volatility
Over the course of a typical stock market correction, volatility, sentiment, and price-based indicators generally follow a repeatable pattern. Volatility surges, sentiment indicators reflect pessimism and price-based measures become oversold.
As the corrective phase wanes, the pendulum shifts from bearish characteristics to bullish attributes, providing a more favorable risk/reward entry point for traders that use a signal-driven approach to raise or lower market exposure.
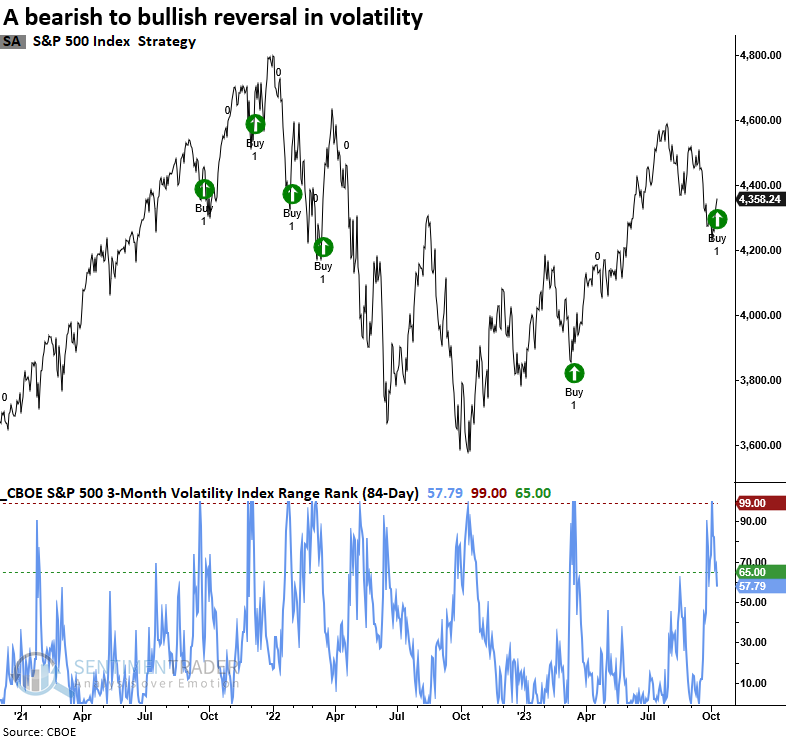
One measure of expected volatility, the CBOE Volatility Index (VIX), increased to the highest level in the previous 84 trading sessions. Subsequently, it reversed lower, triggering a buy signal for the S&P 500.
The previous alert in March 2023 led to a 12% gain over the subsequent six months.
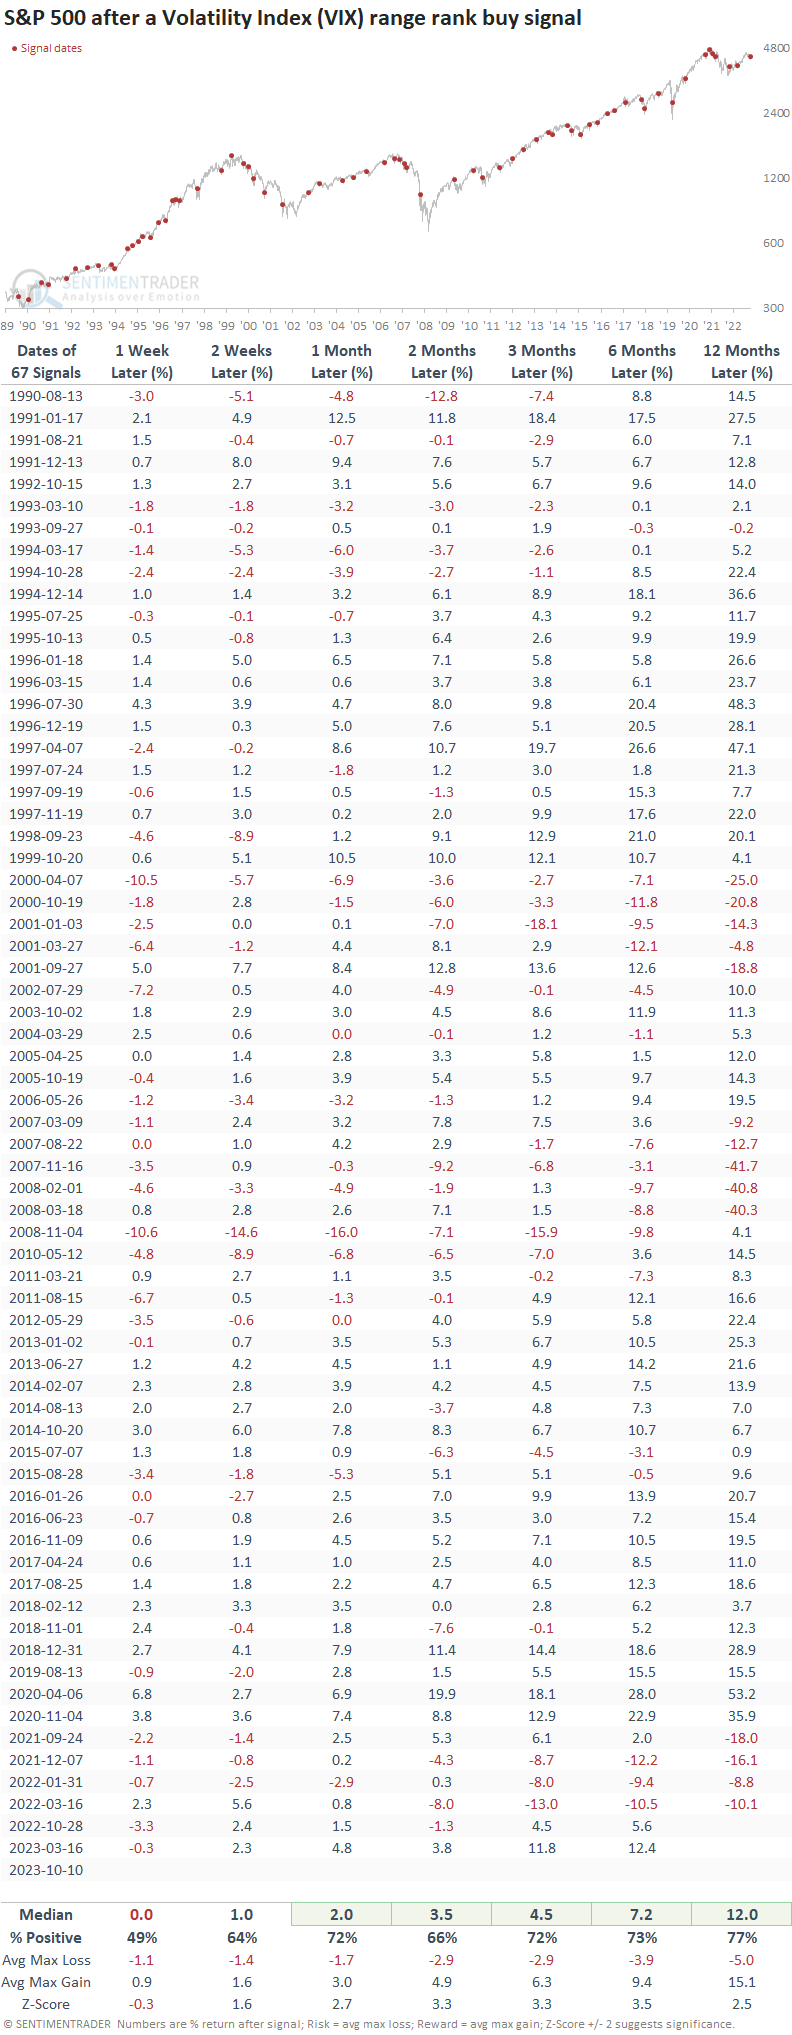
Similar volatility reversals preceded positive returns
When the 84-day range rank of the Volatility Index (VIX) cycles from 100% to less than 63% and index momentum is positive, the shift in the fear gauge tends to mark a bearish to a bullish turning point for the S&P 500.
Returns, win rates, and z-score were excellent over medium and long-term horizons.
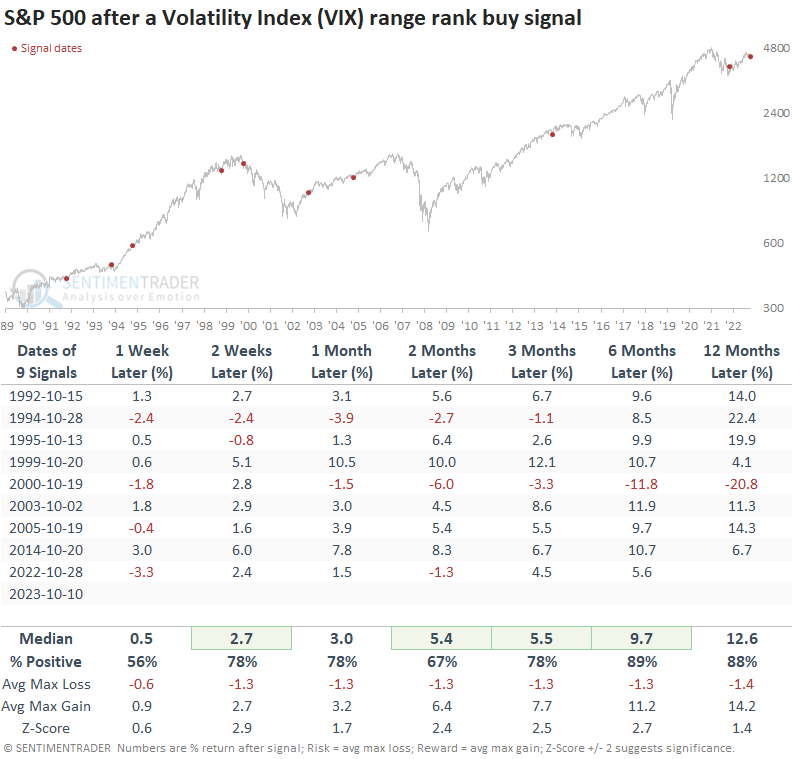
Seasonality
By narrowing our analysis to precedents in October, the onset of a seasonal stock market tailwind, we find that returns and win rates improve upon the already bullish outcomes.
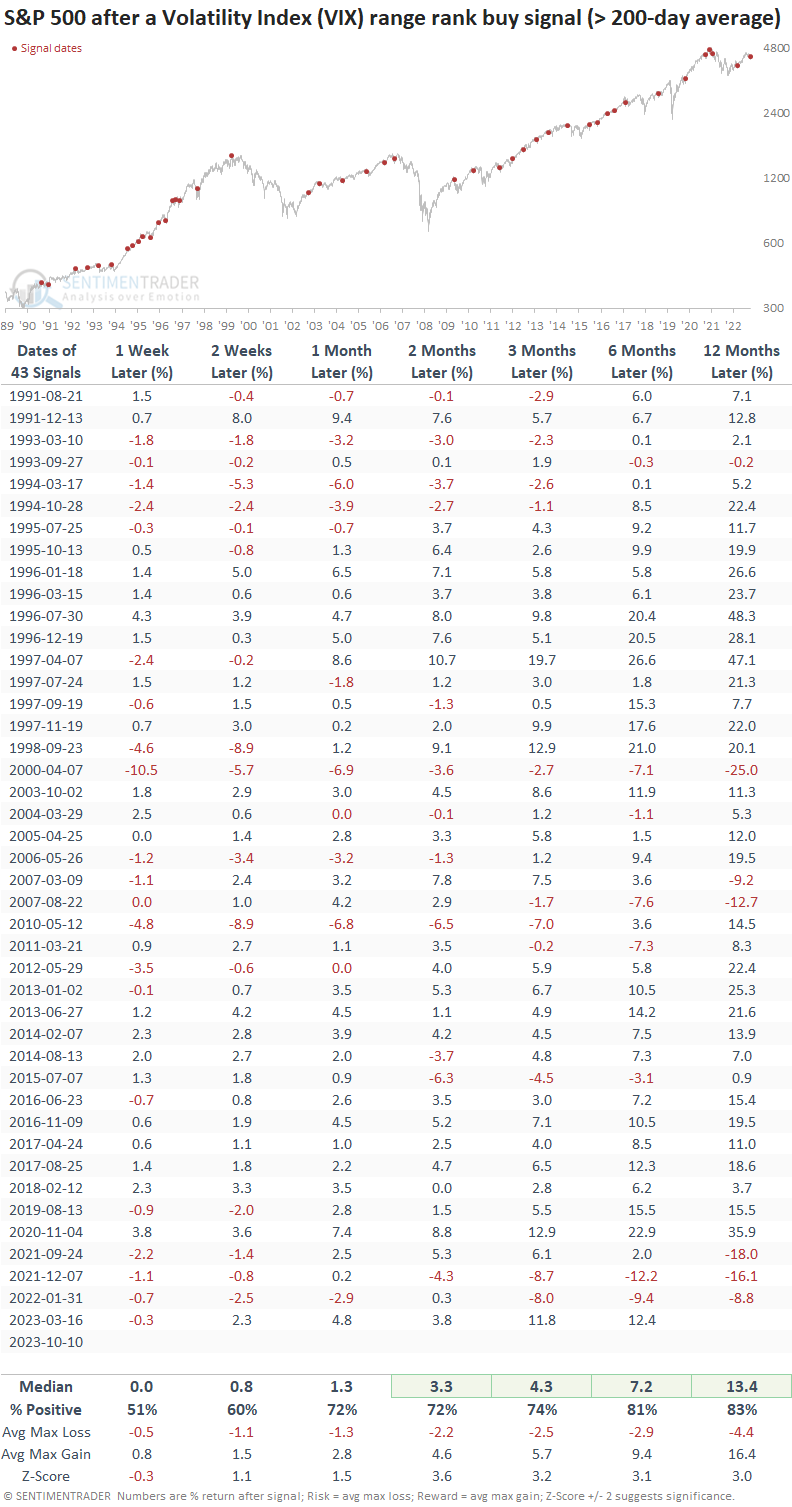
Signals in an uptrend
In cases where a volatility signal coincided with the S&P 500 trading above its 200-day moving average, returns, win rates, and z-scores maintained a bullish bias. It's worth noting that uptrend alerts demonstrated marginally better win rates while maintaining similar returns.
The CBOE S&P 500 3-Month Volatility Index also triggered a buy signal on 2023-10-10. So, expected volatility is falling across multiple durations.
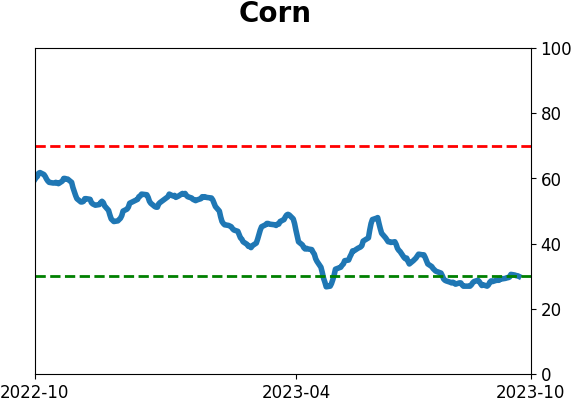
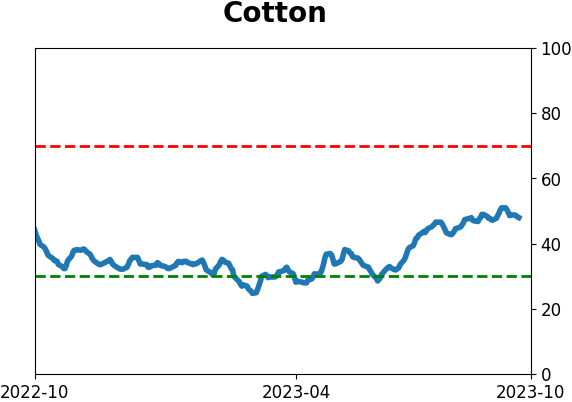
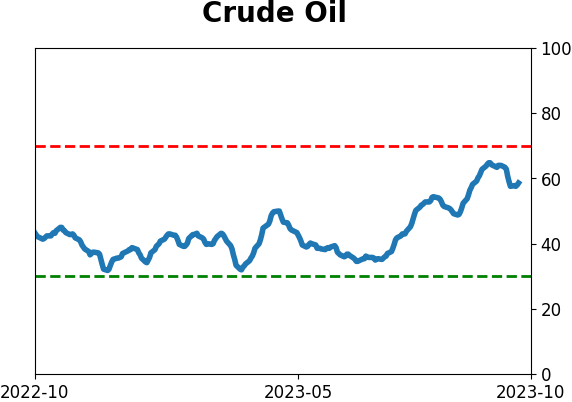
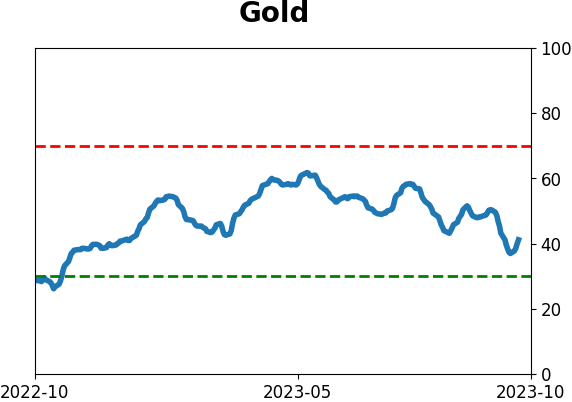
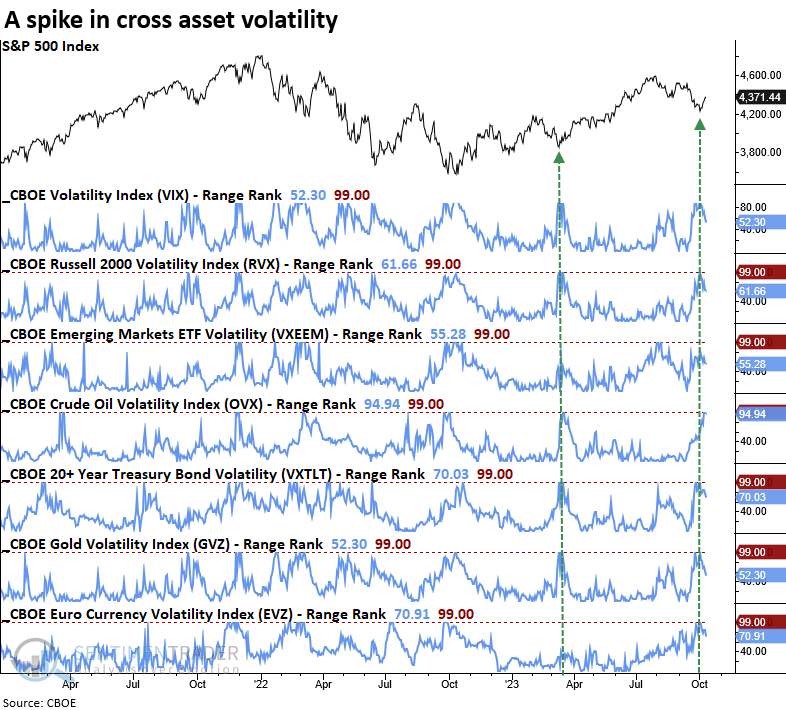
Volatility across asset classes suggests broad-based fear
Expected volatility for several asset classes surged over the prior 84 trading sessions, similar to the drawdown period in March 2023.
What the research tells us...
The Volatility Index (VIX), a measure of expected volatility, increased to the top of its 84-day range and reversed lower, triggering a bullish signal for stocks. Similar alerts produced excellent outcomes for the S&P 500 over medium and long-term horizons. Results were slightly more favorable when precedents occurred in October or within a long-term uptrend like now. Expected volatility across several asset classes suggests broad-based fear, typically a bullish sign for stocks.
Indicators at Extremes
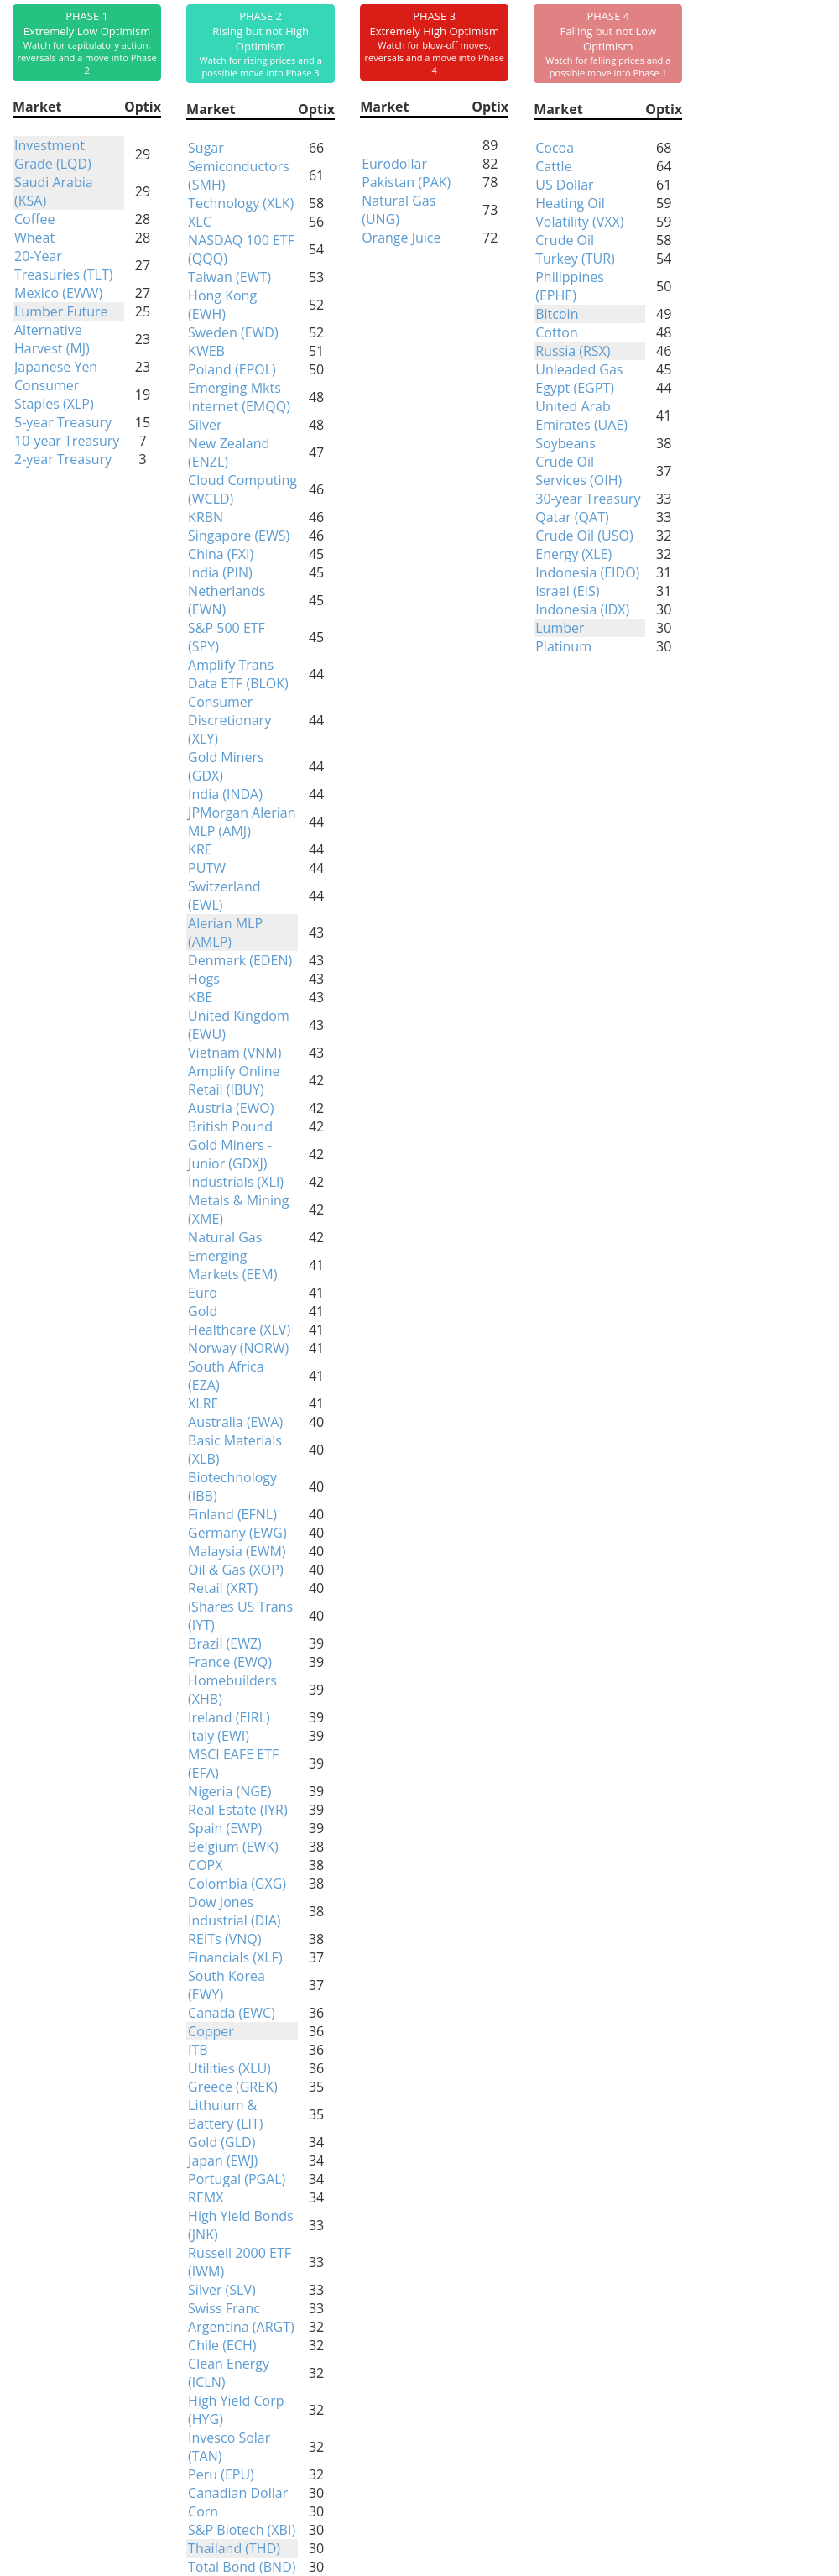
Phase Table
Ranks
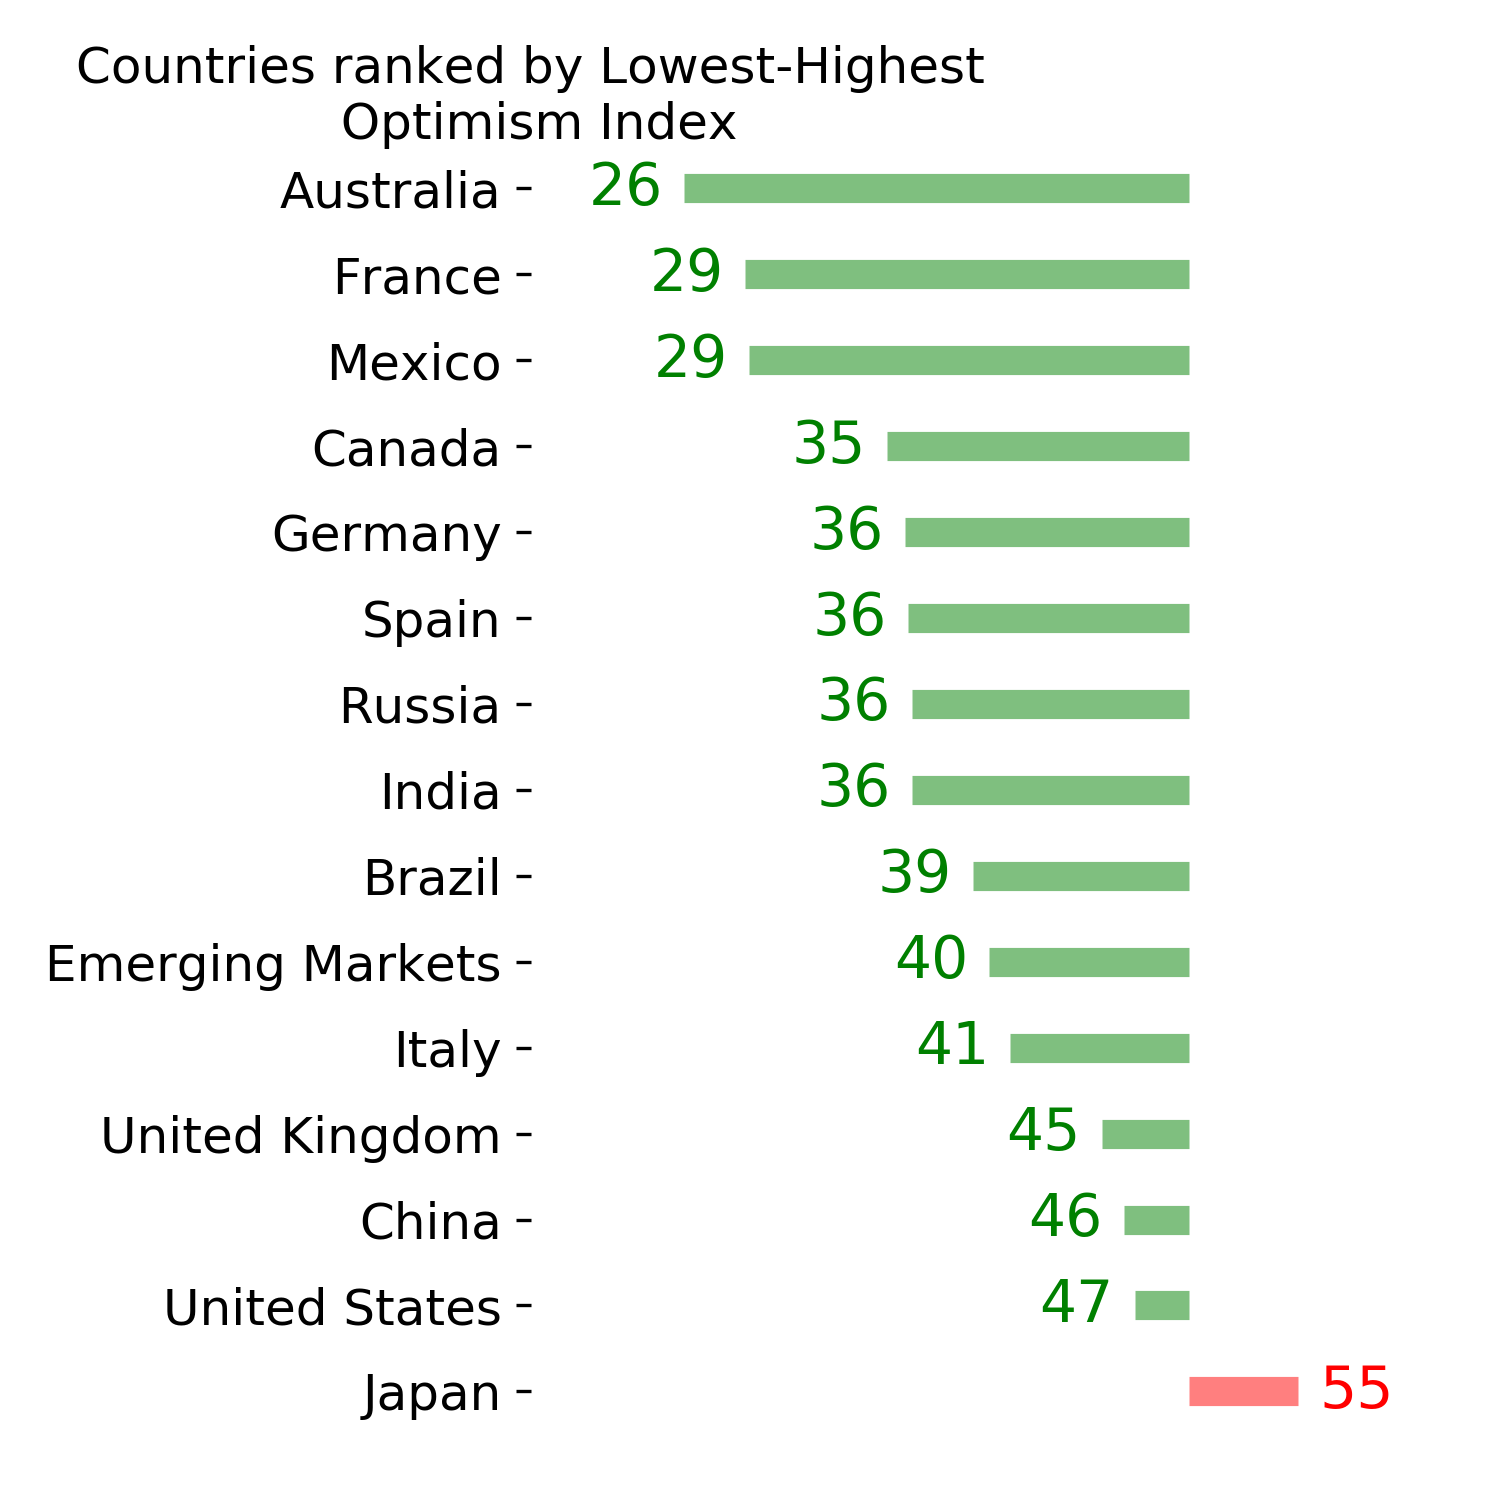
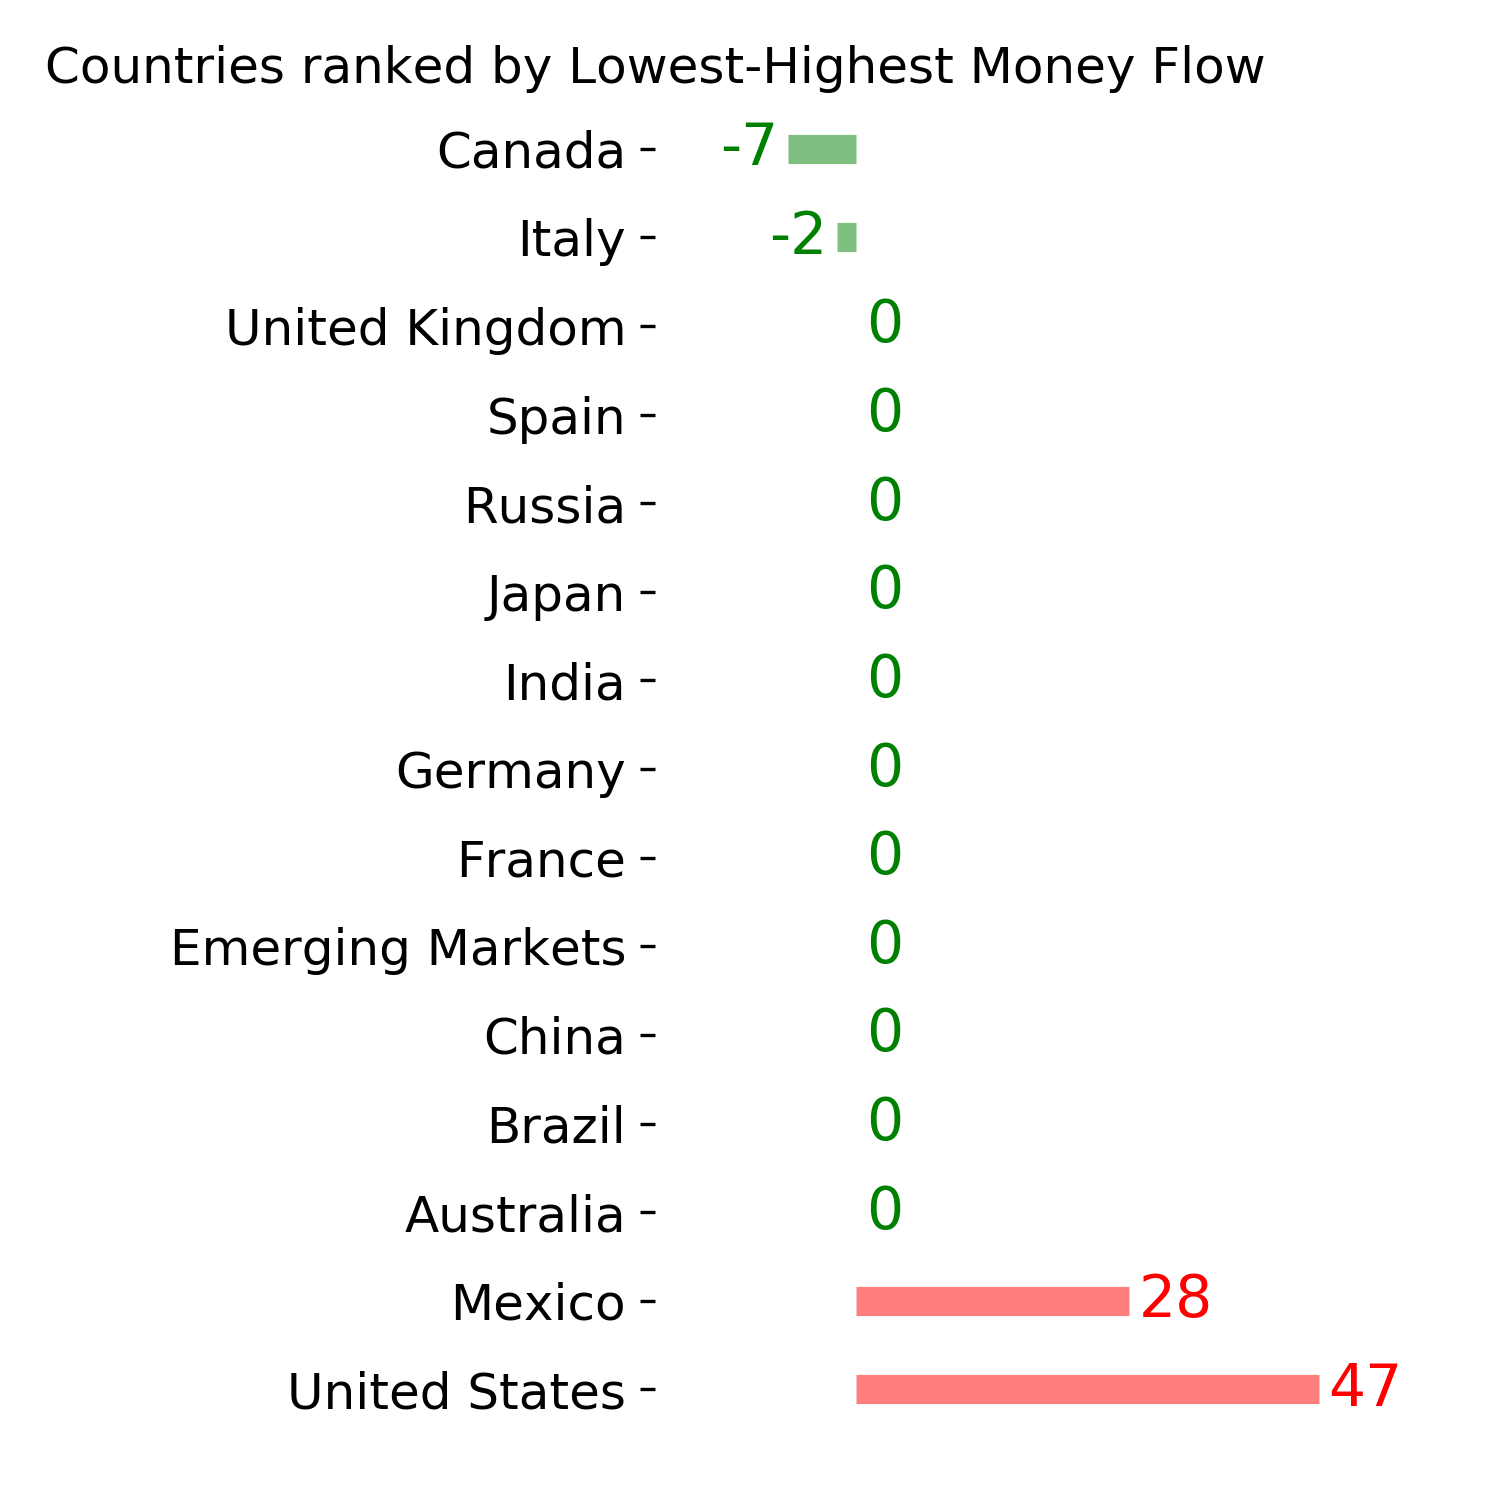
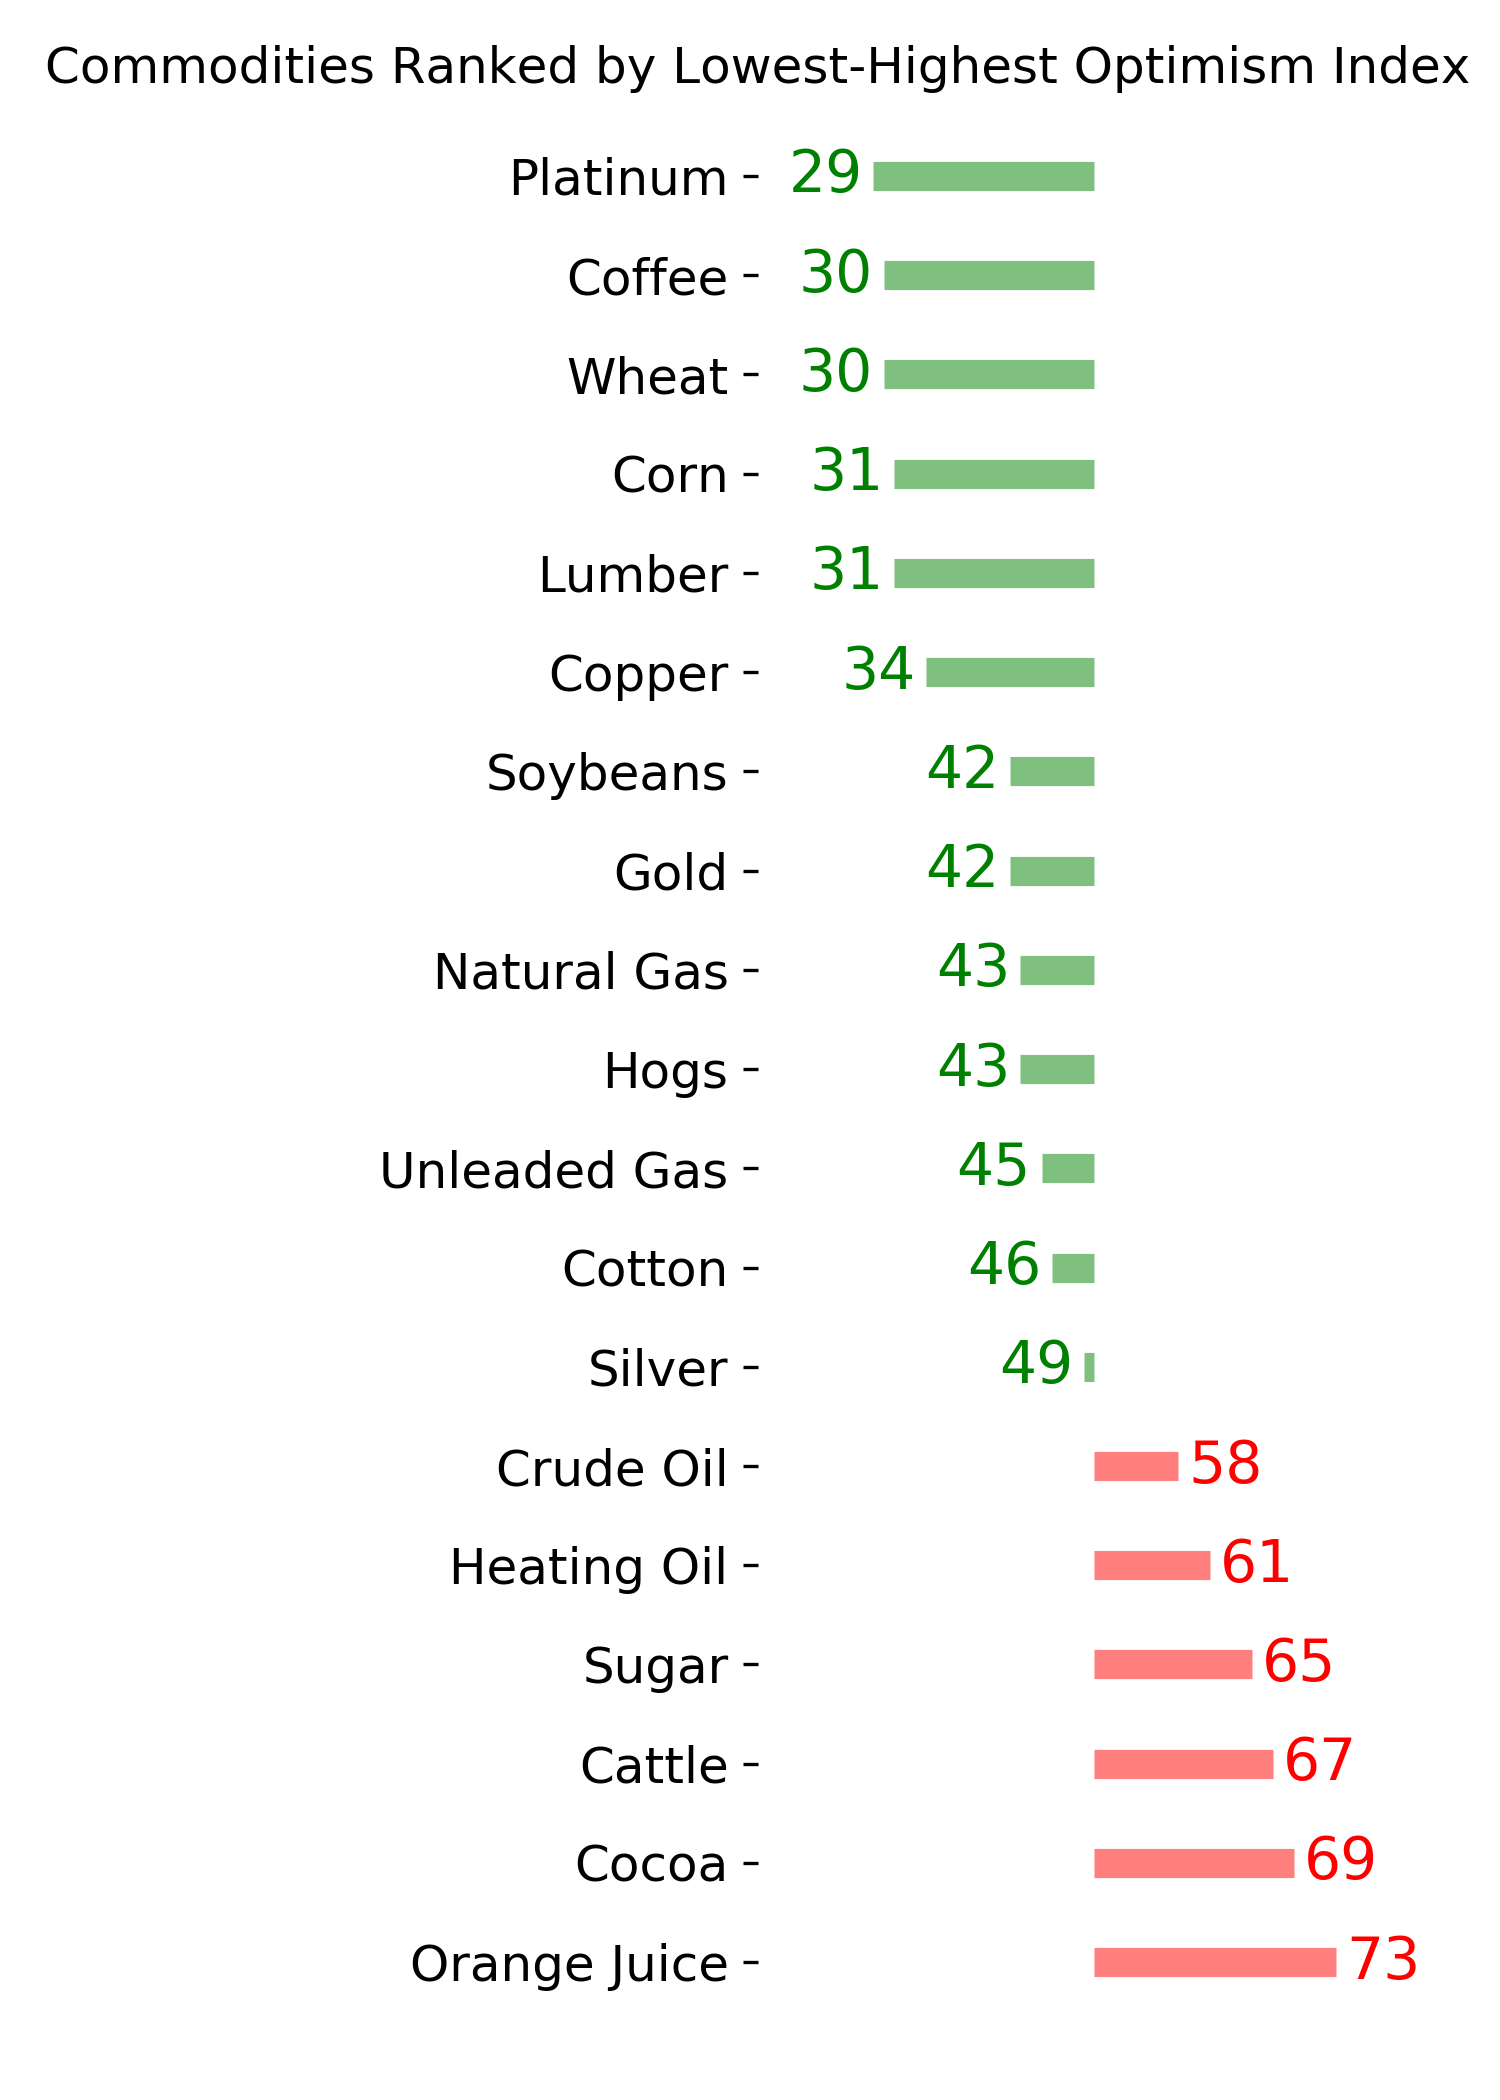
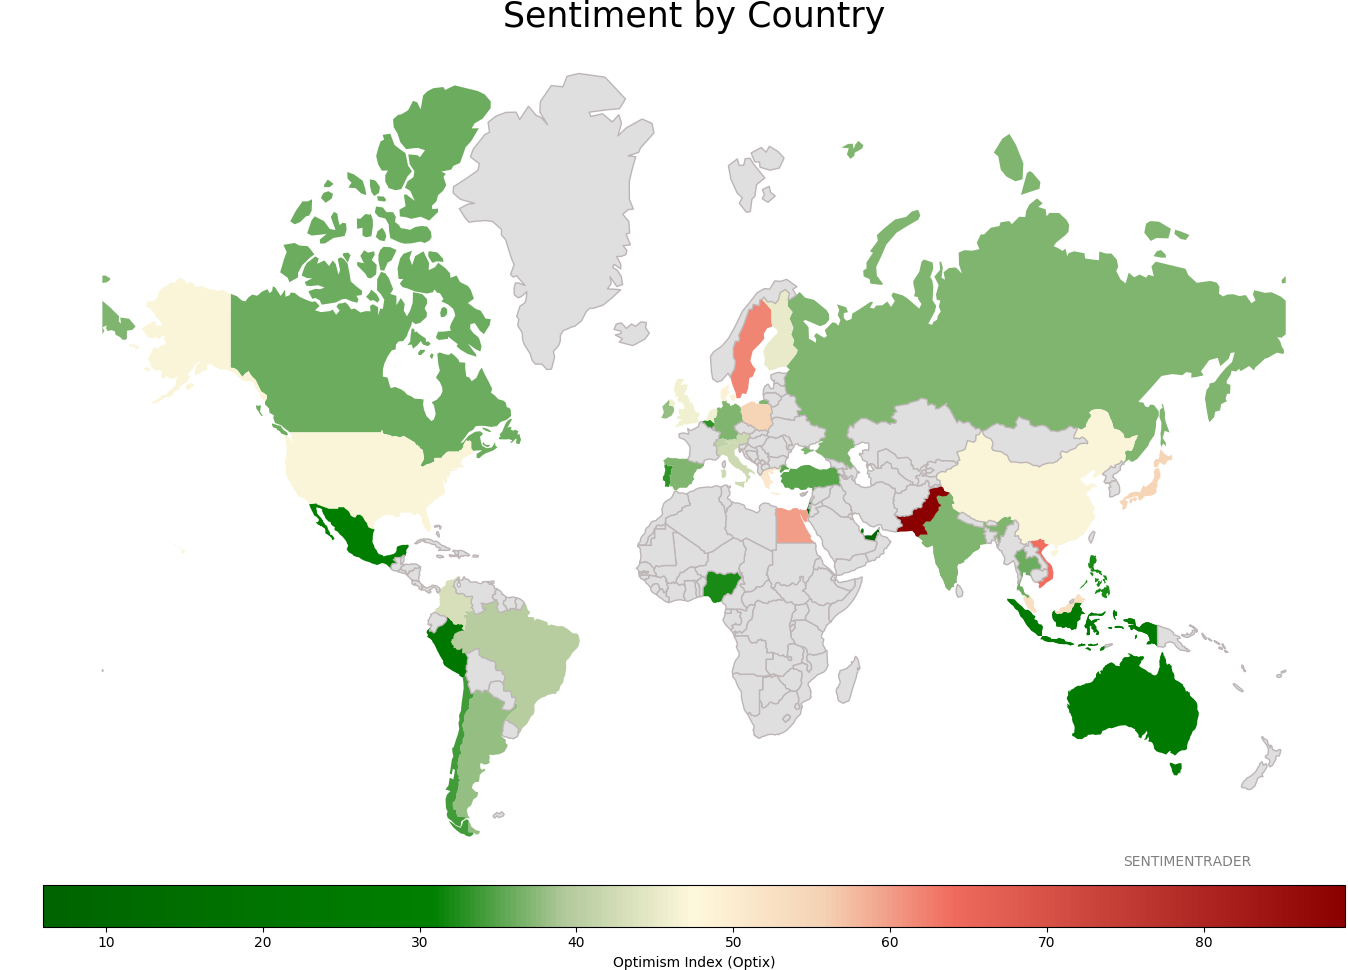
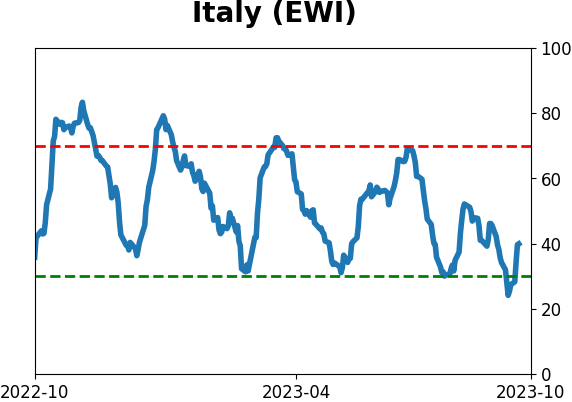
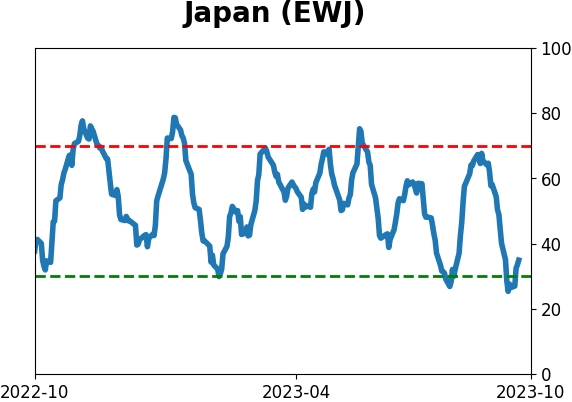
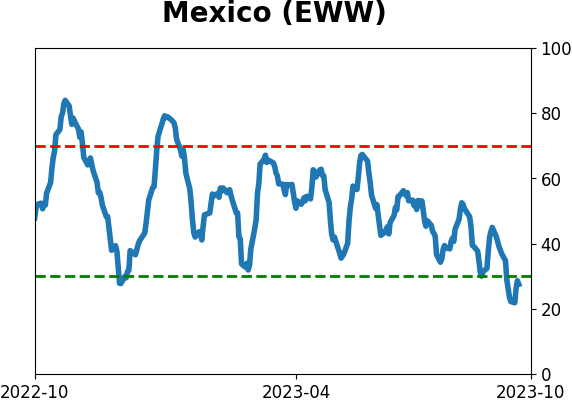
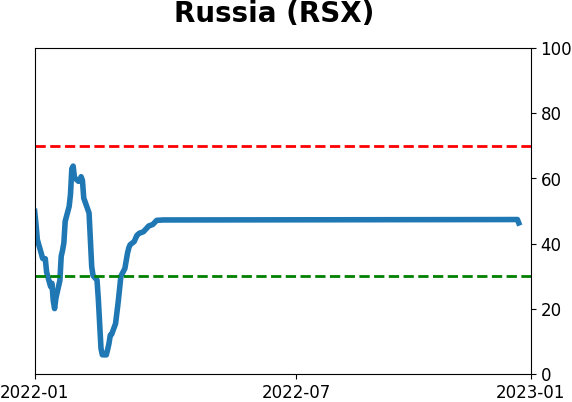
Sentiment Around The World
Optimism Index Thumbnails
|
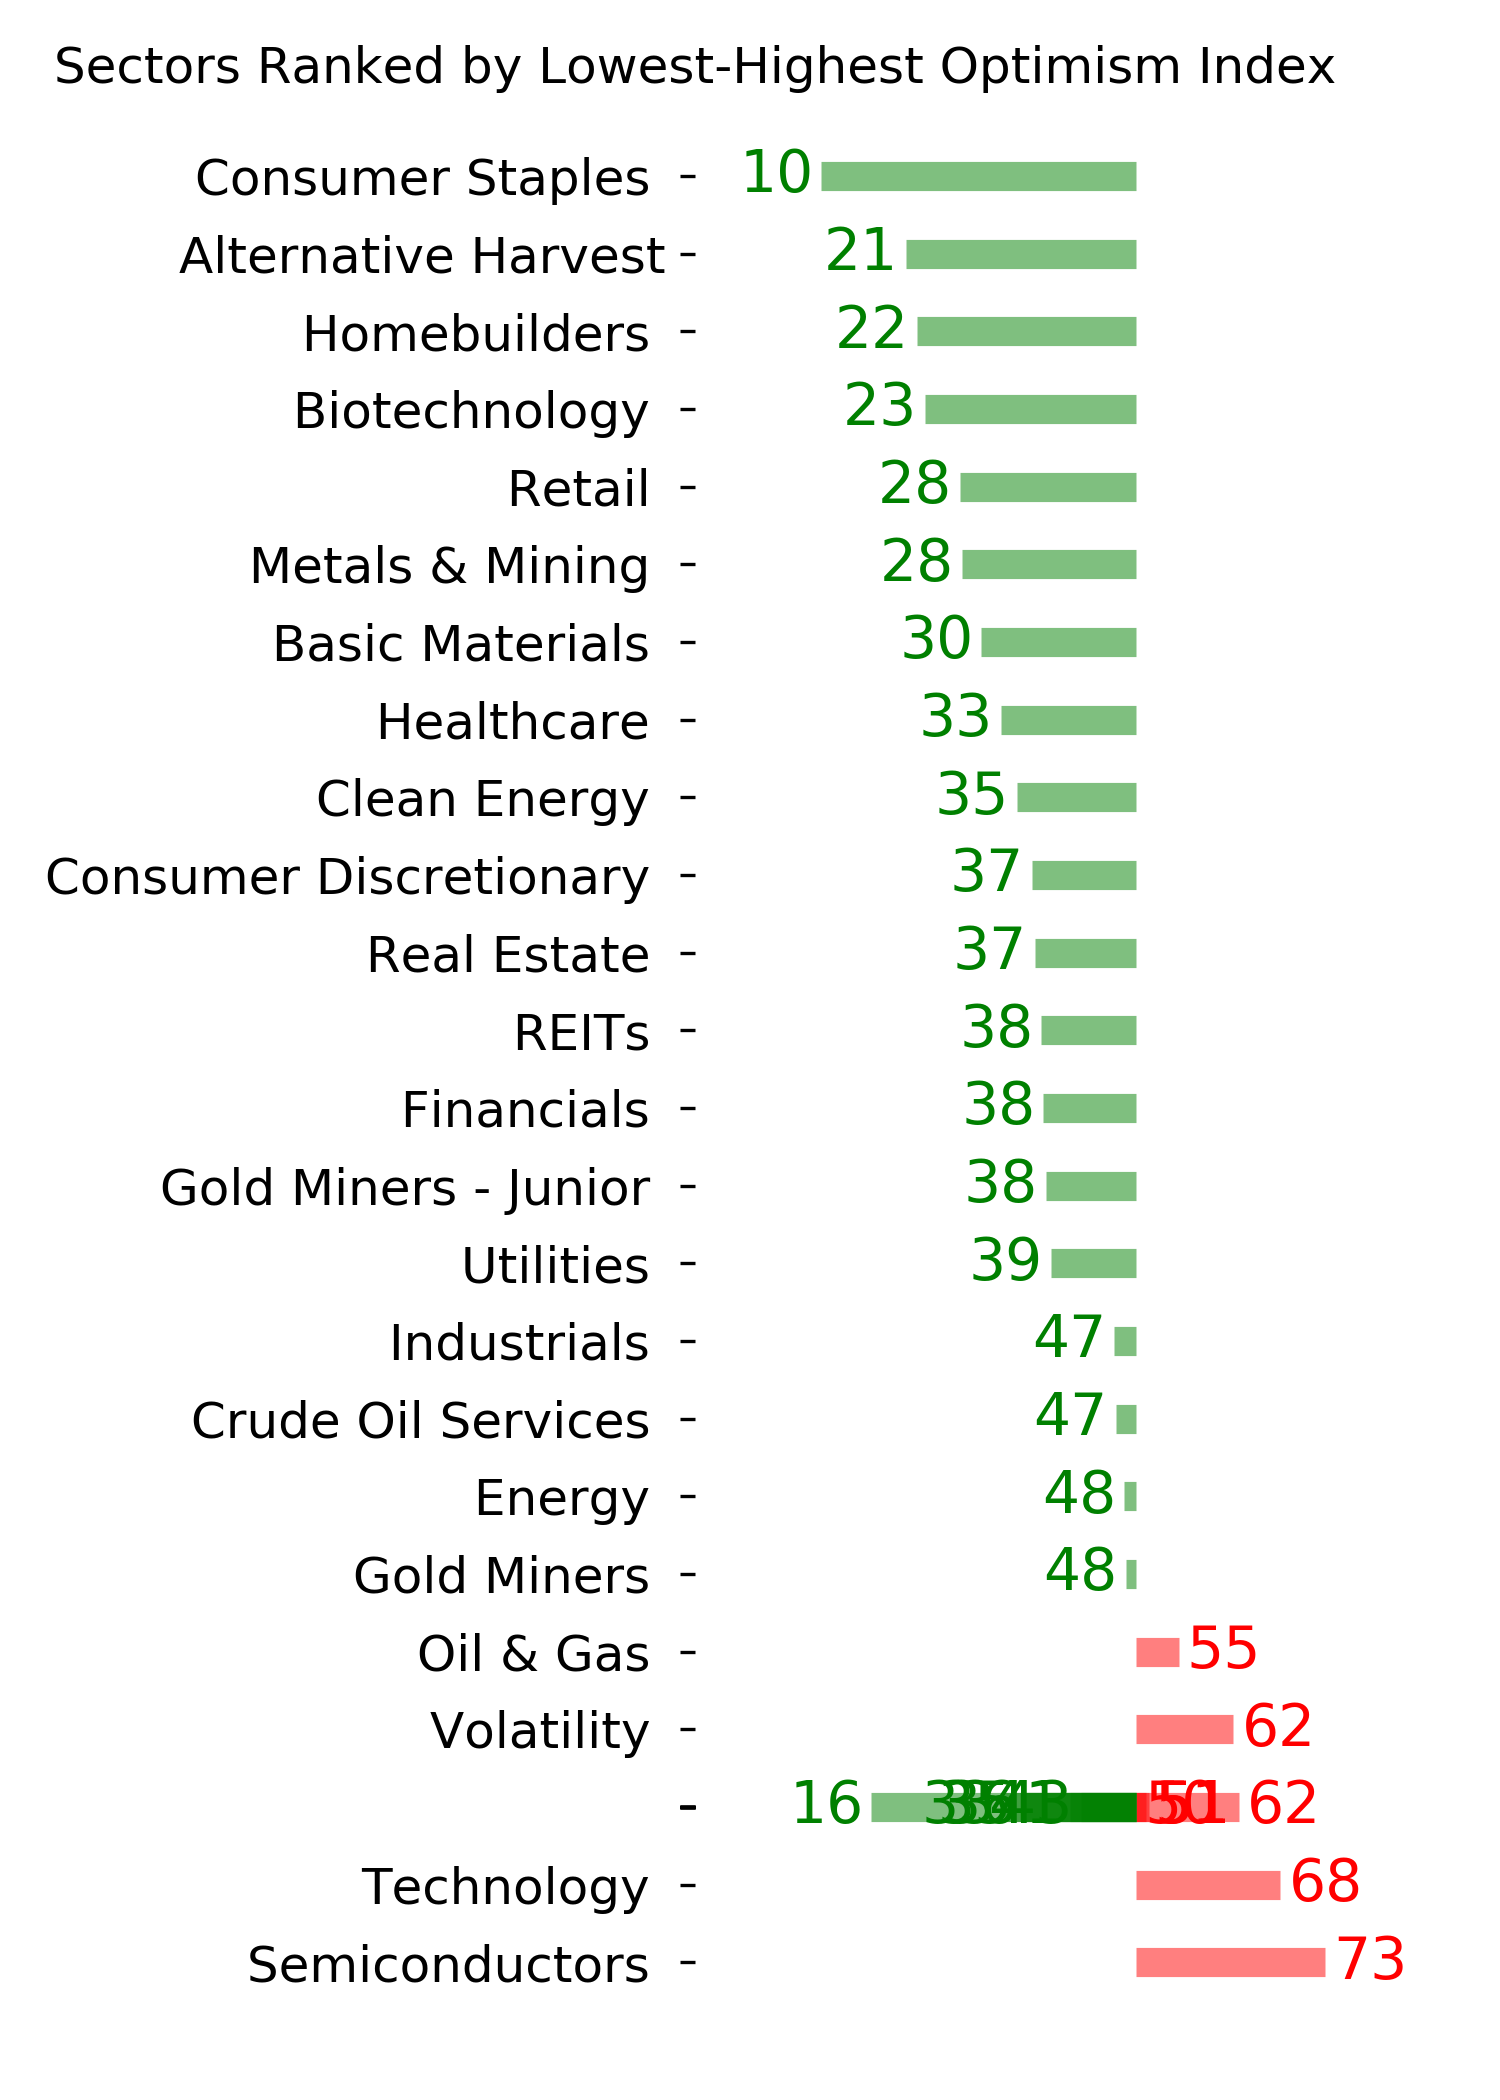
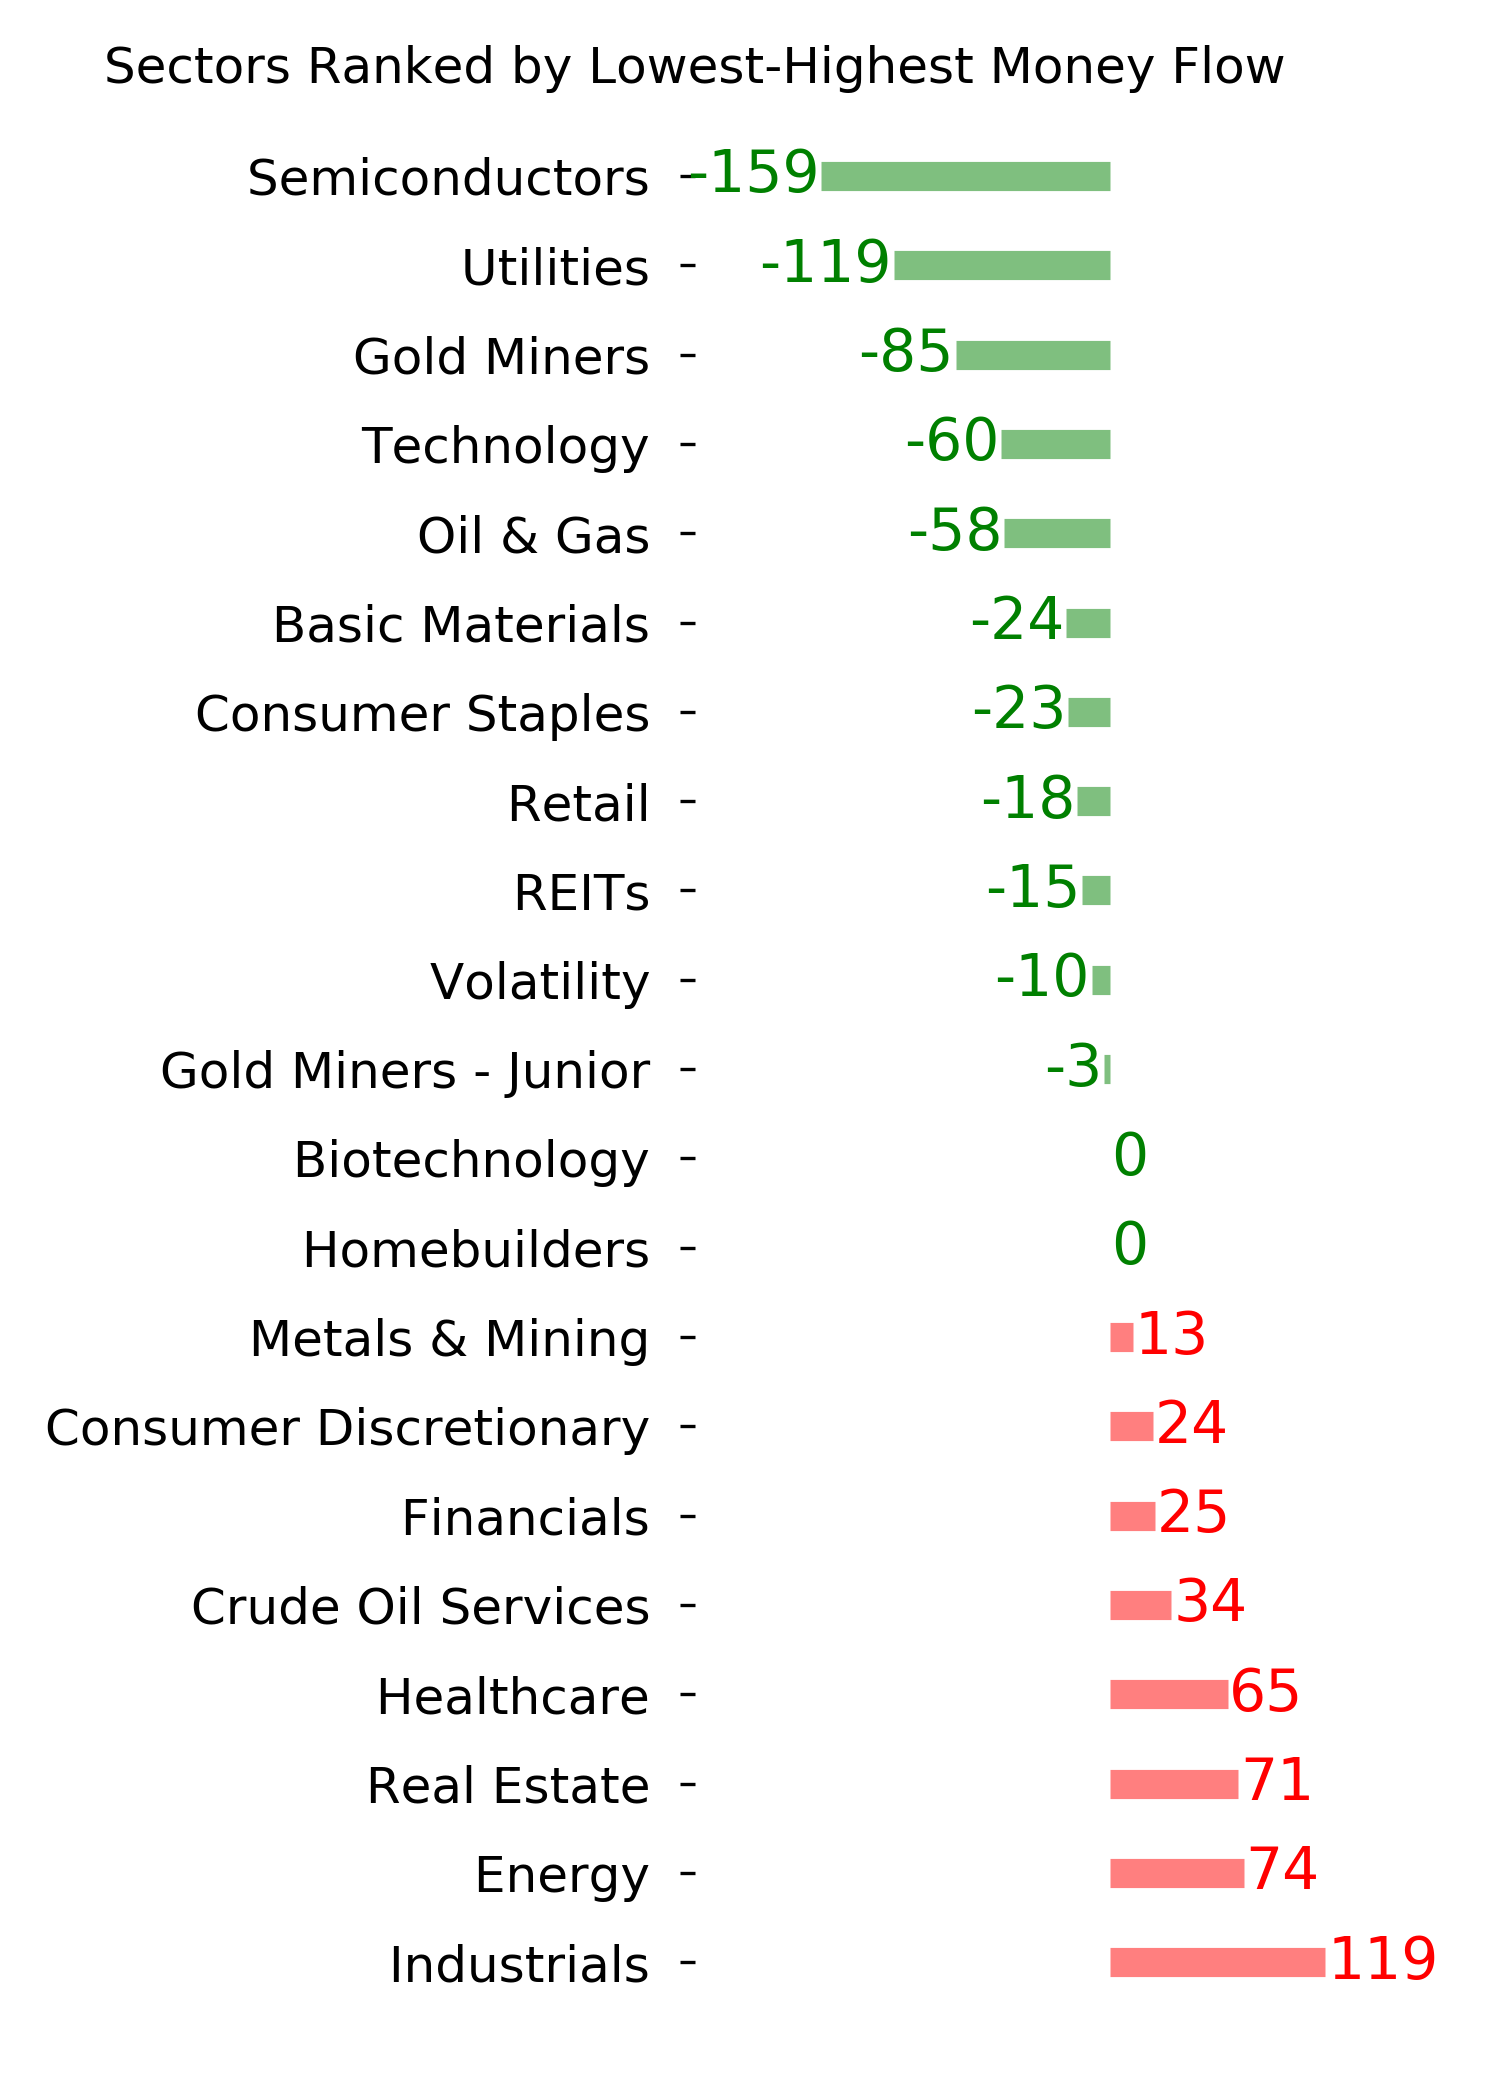
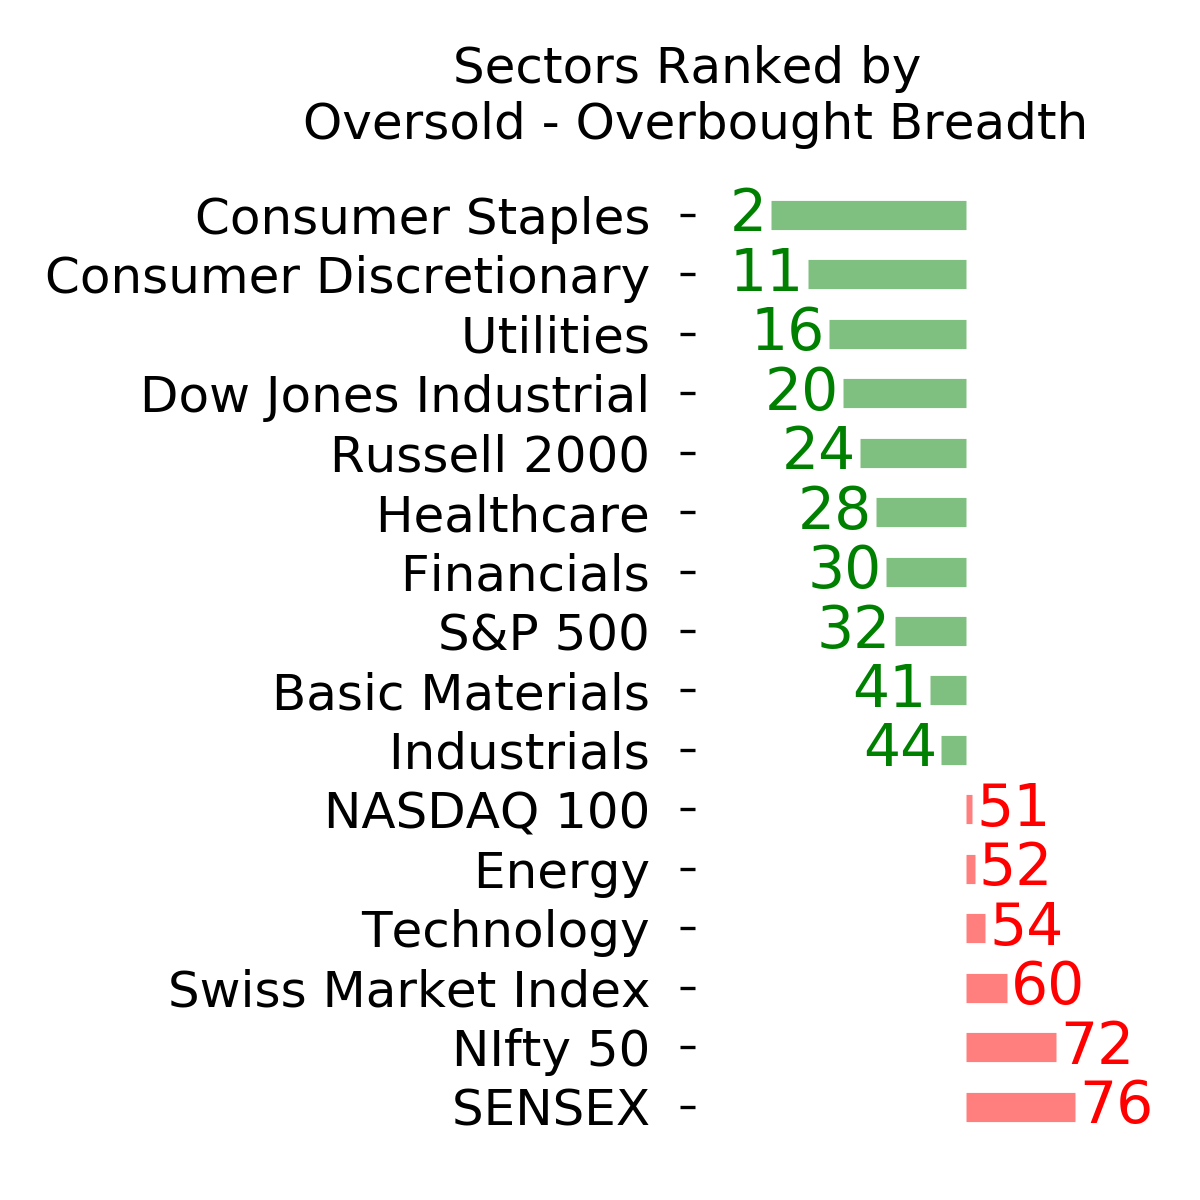
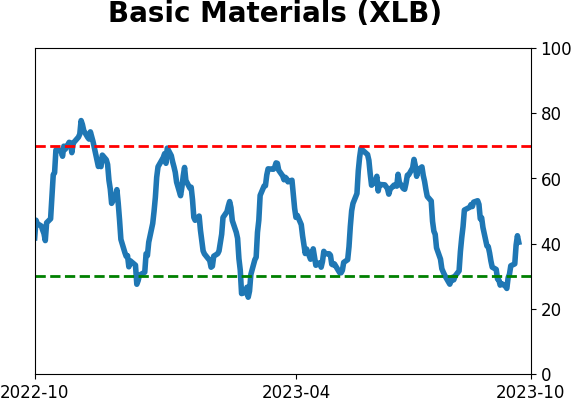
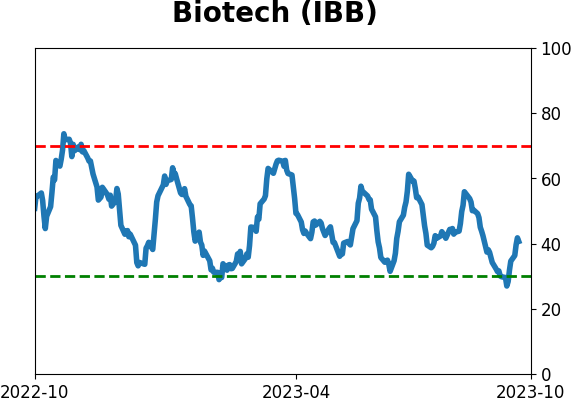
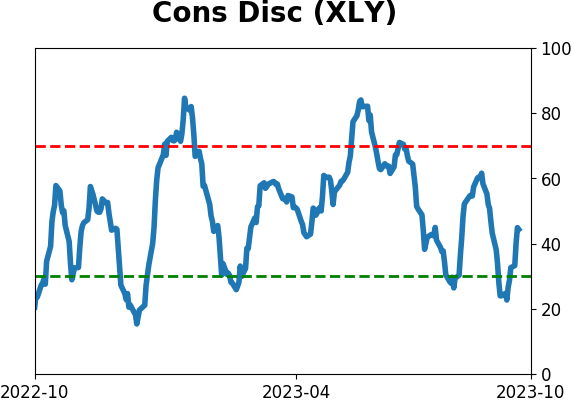
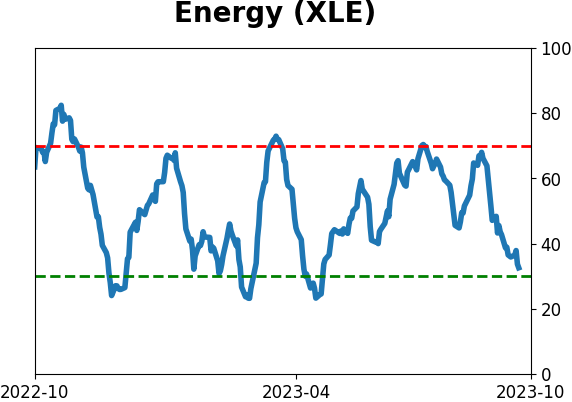
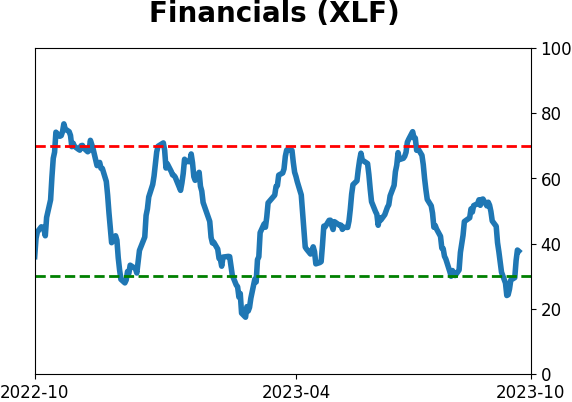
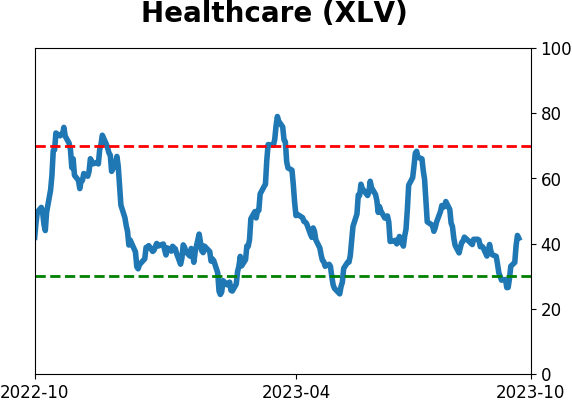
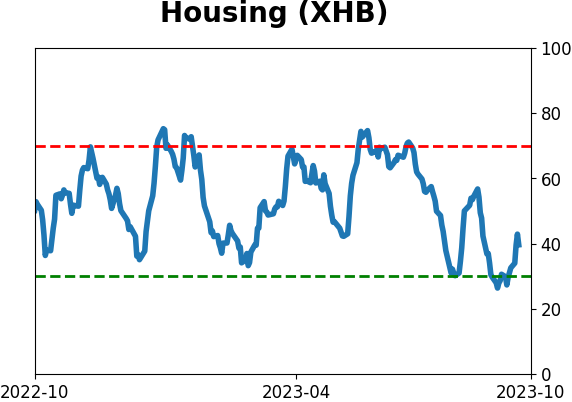
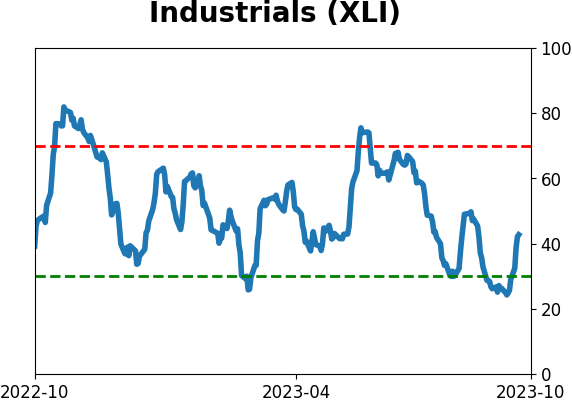
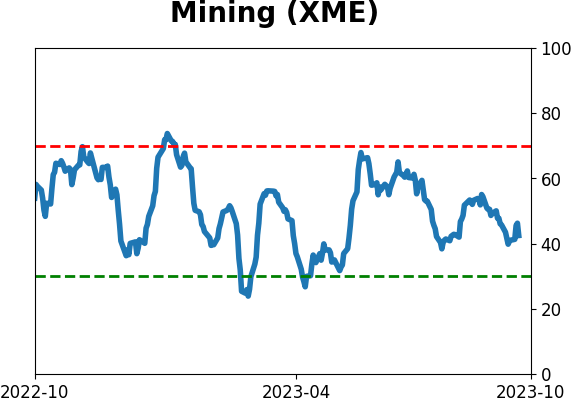
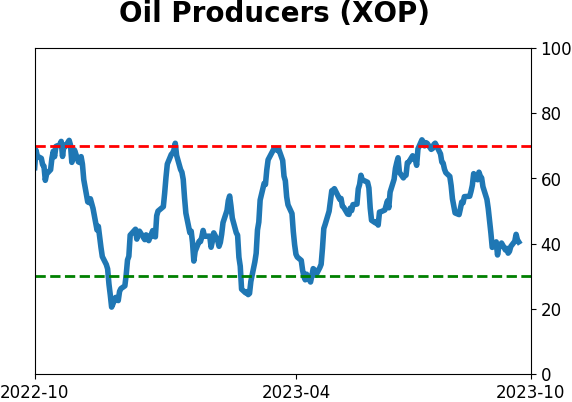
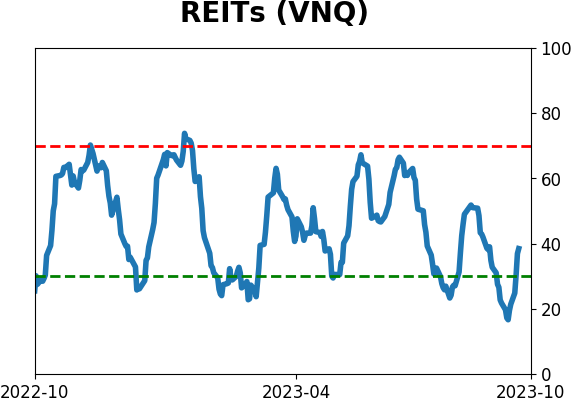
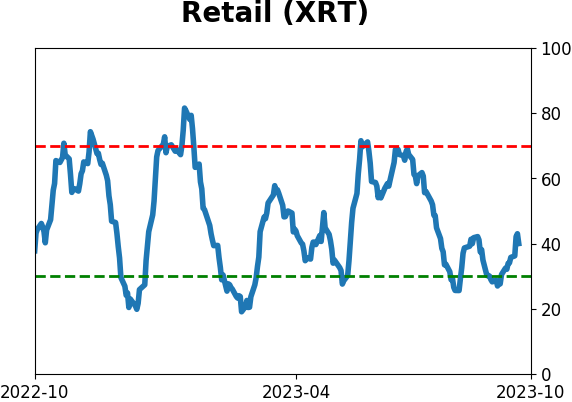
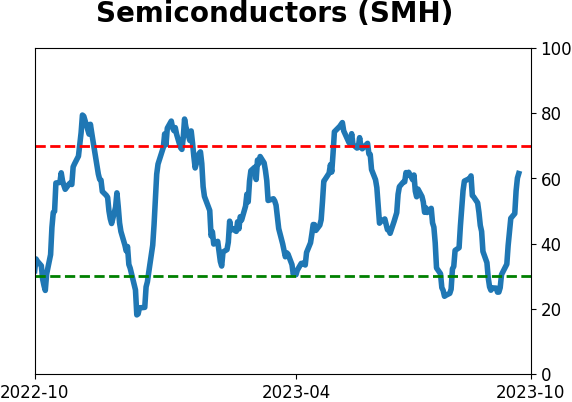
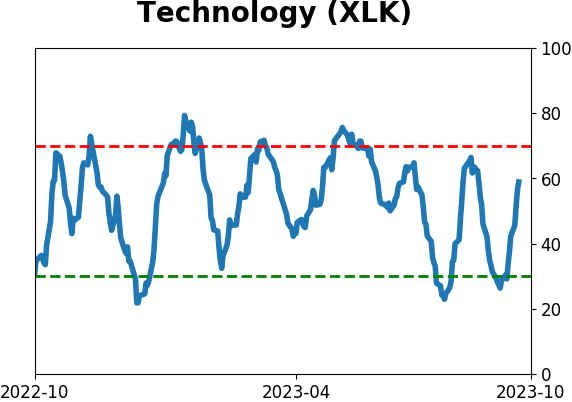
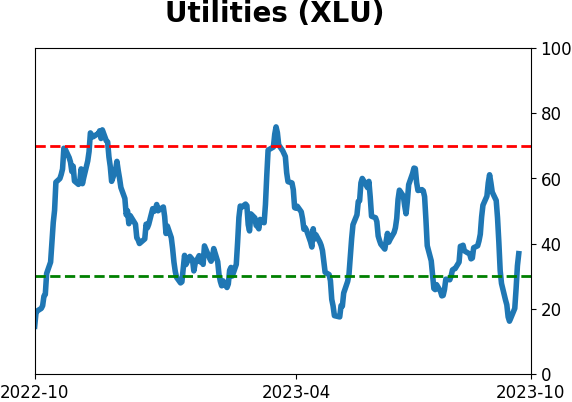
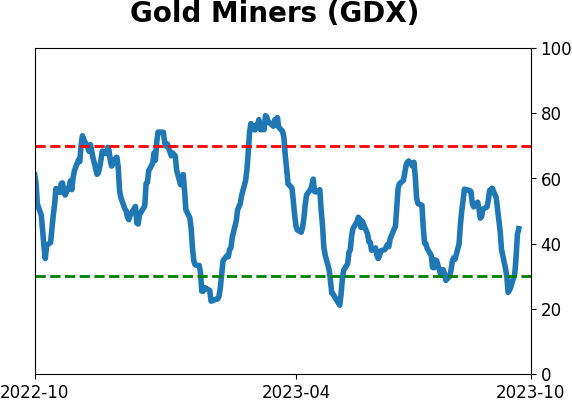
Sector ETF's - 10-Day Moving Average
|
|
|
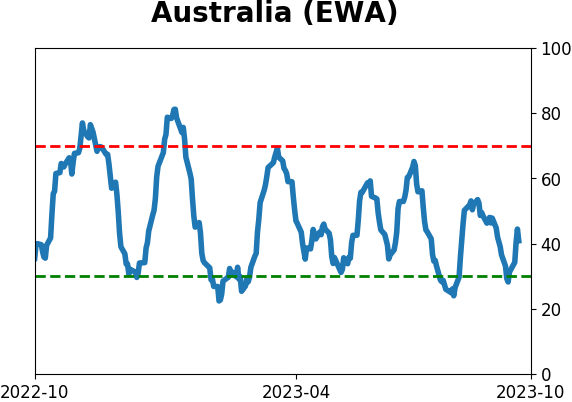
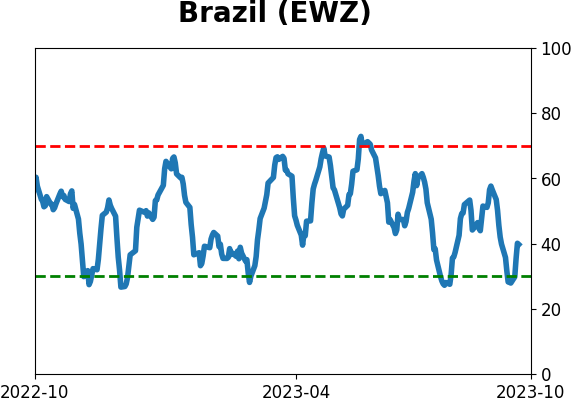
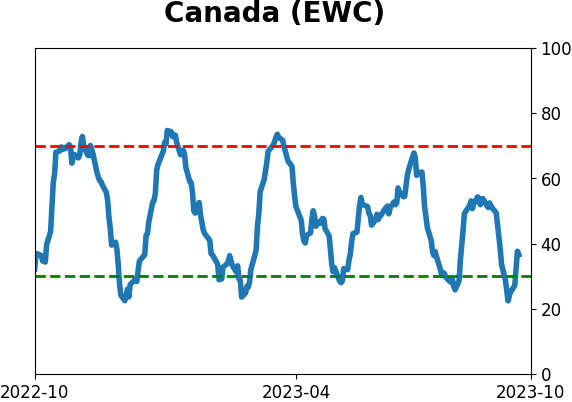
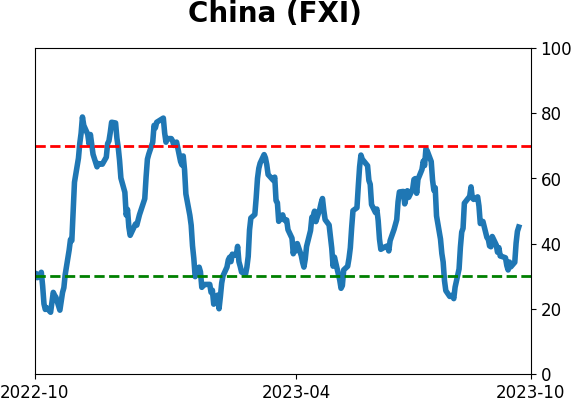
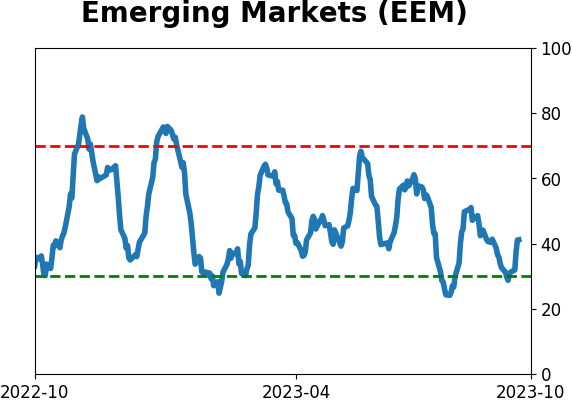
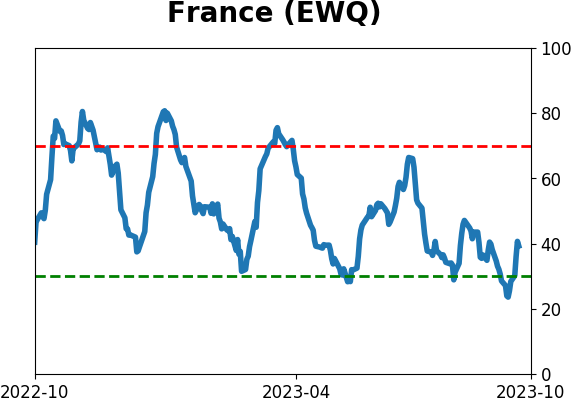
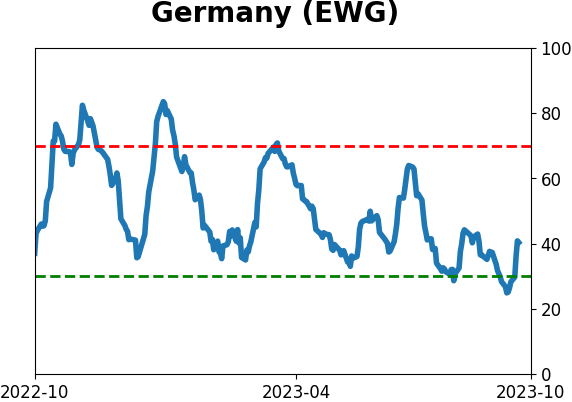
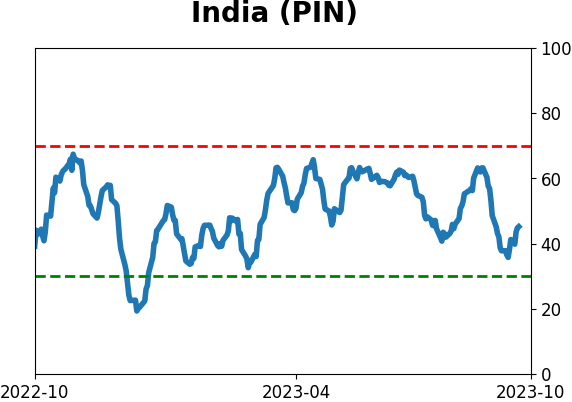
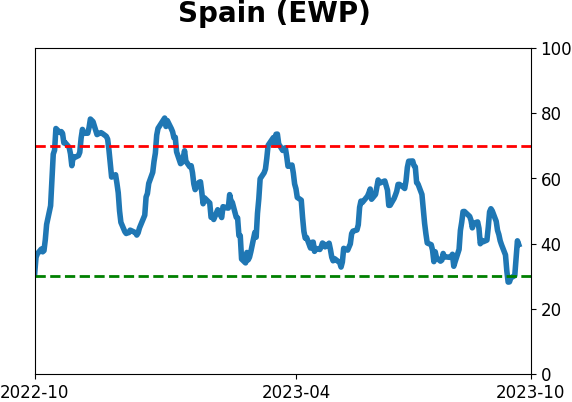
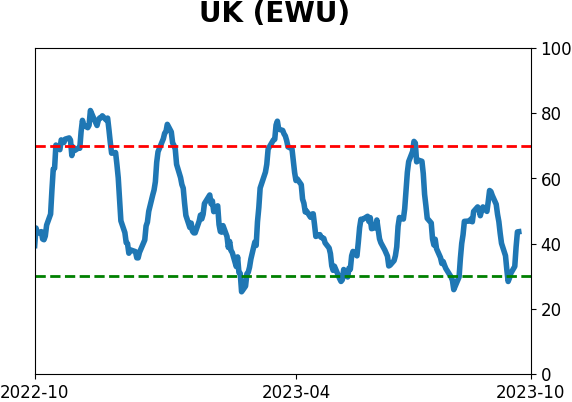
Country ETF's - 10-Day Moving Average
|
|
|
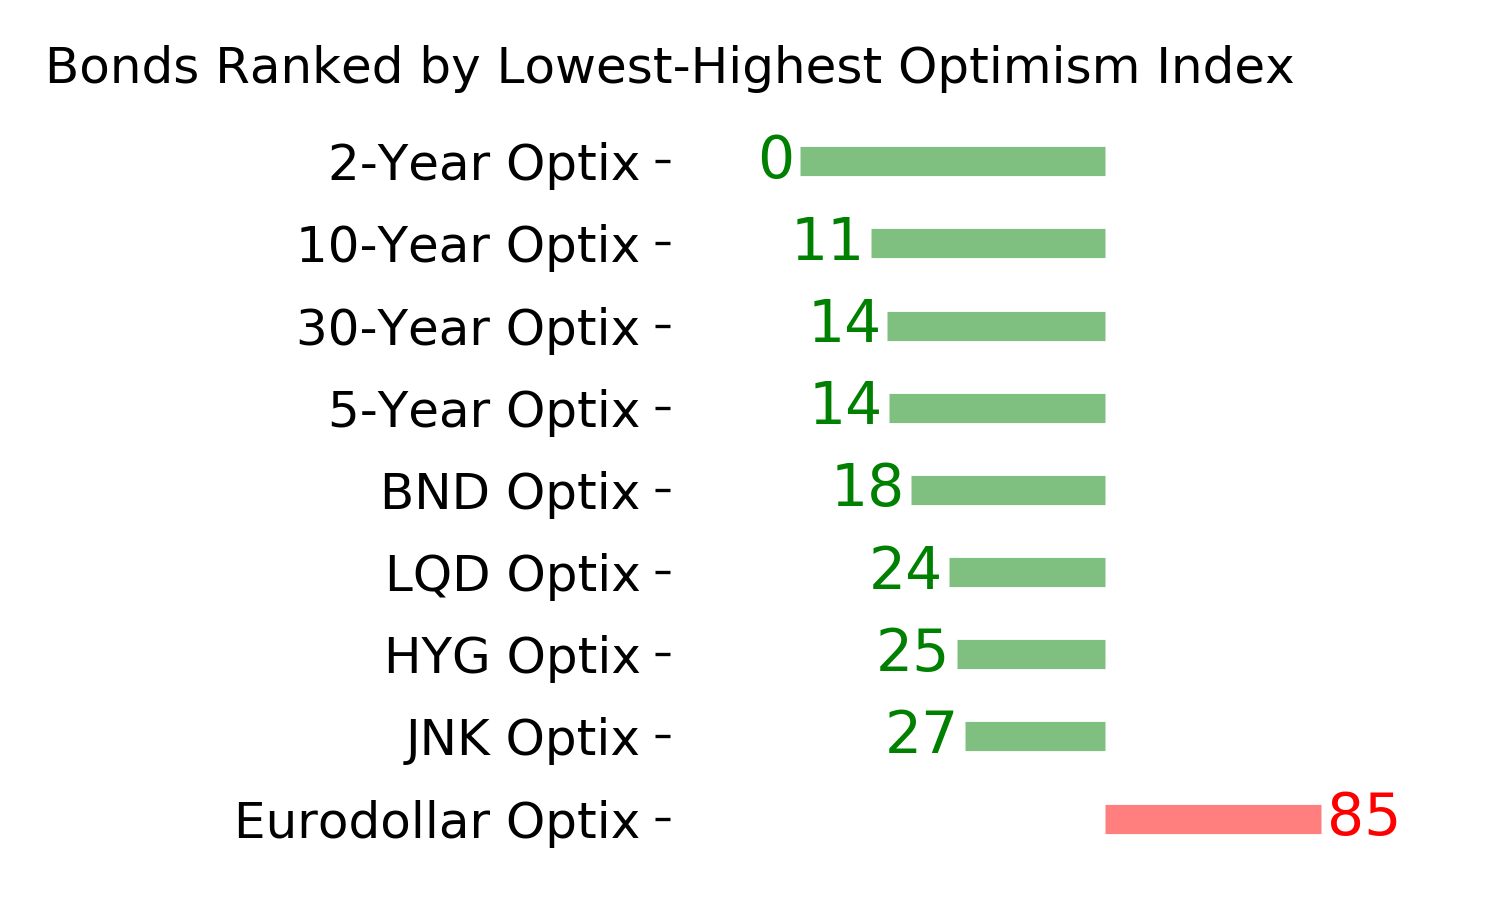
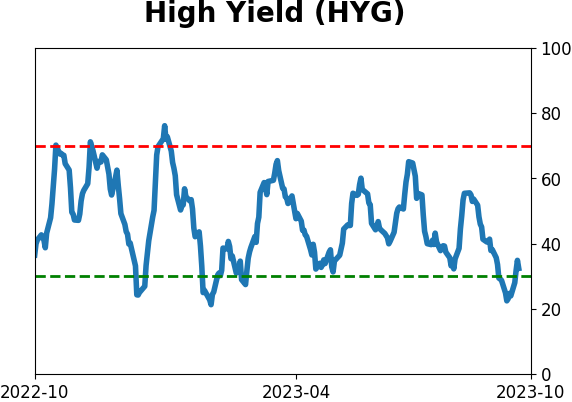
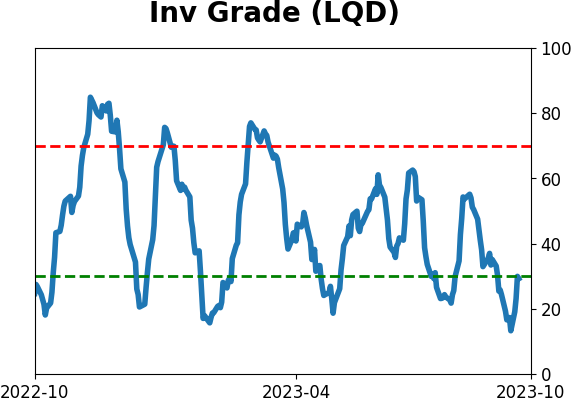
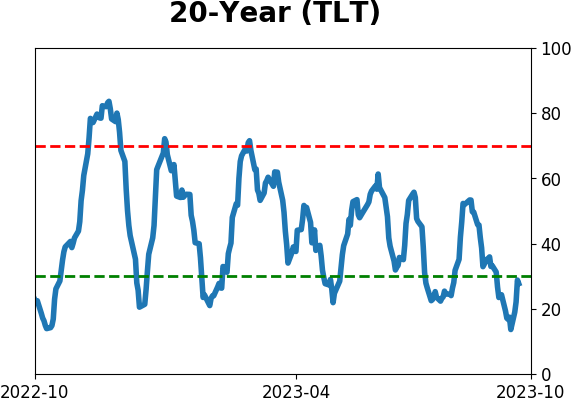
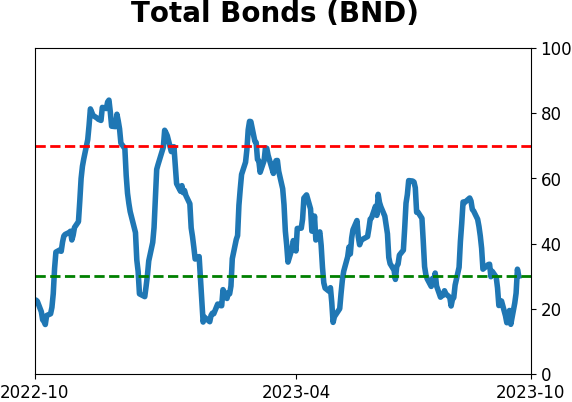
Bond ETF's - 10-Day Moving Average
|
|
|
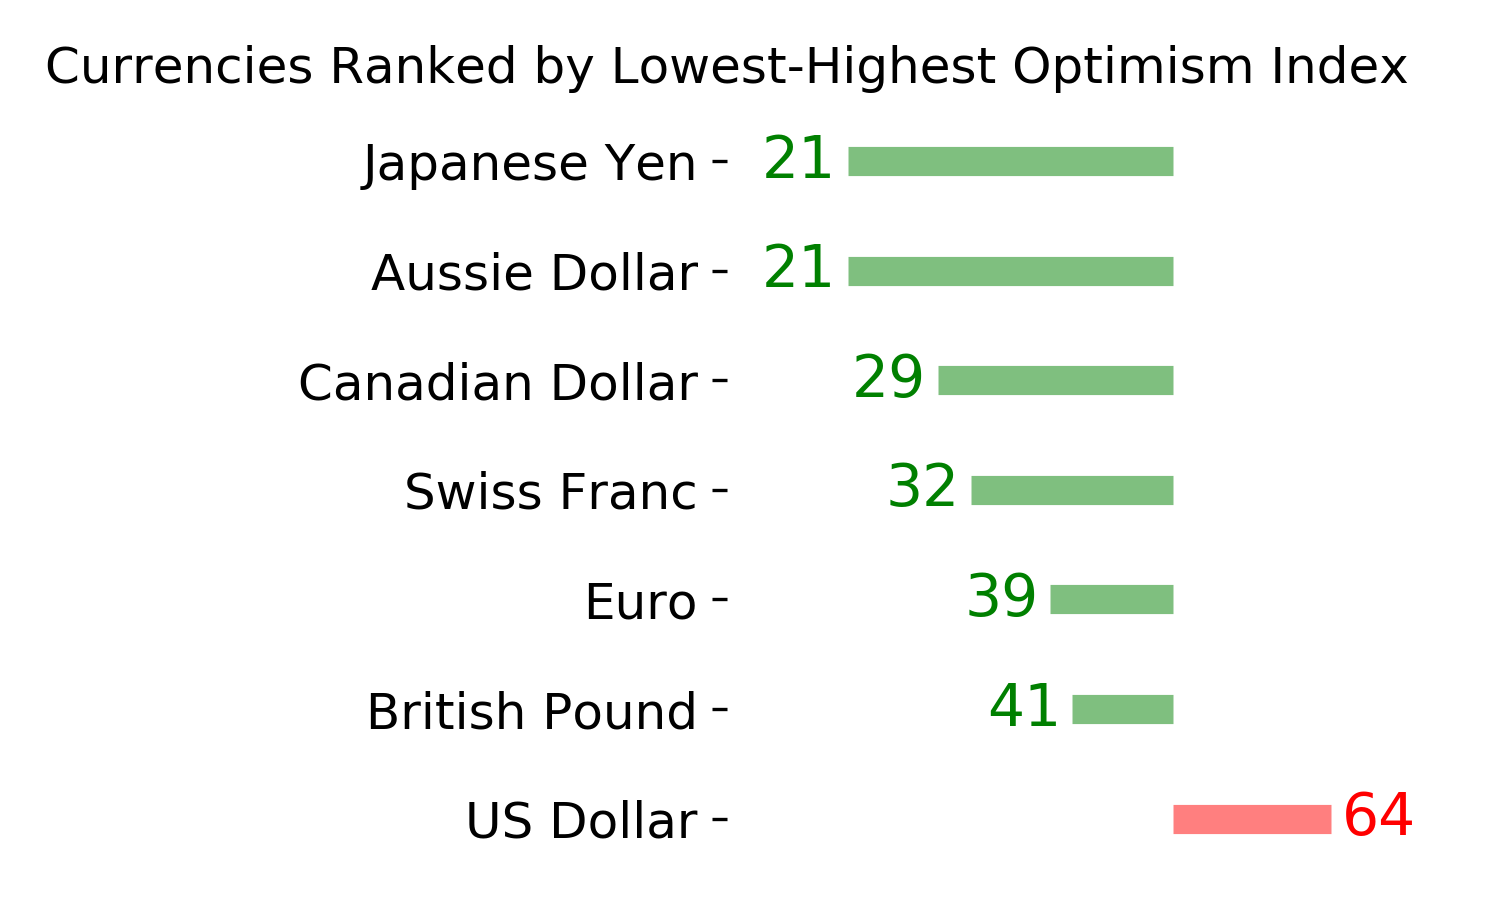
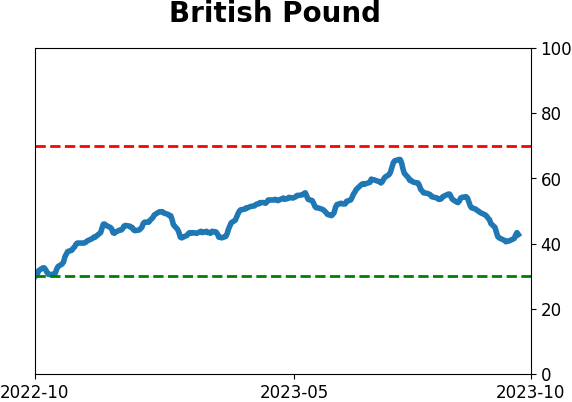
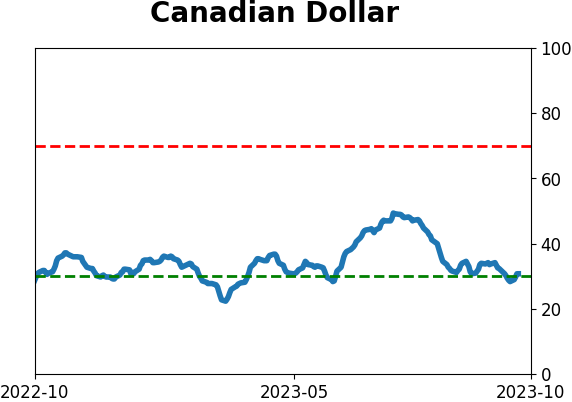
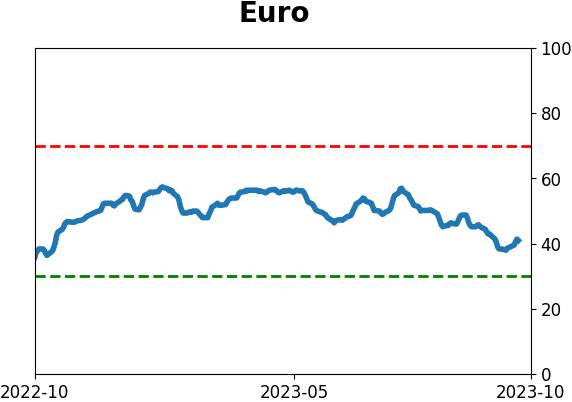
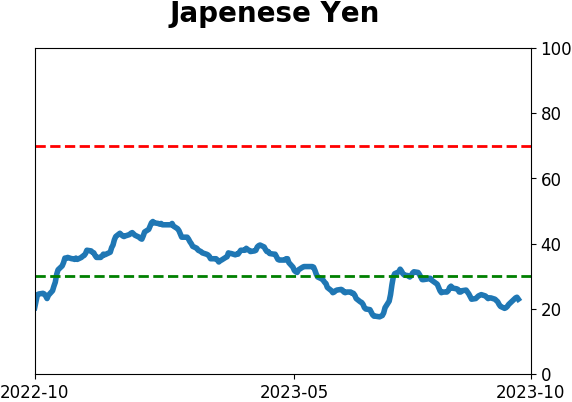
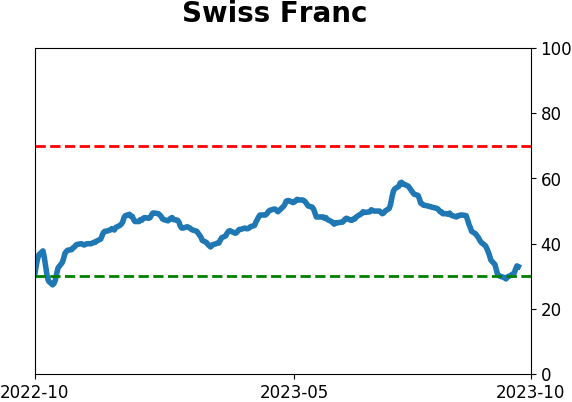
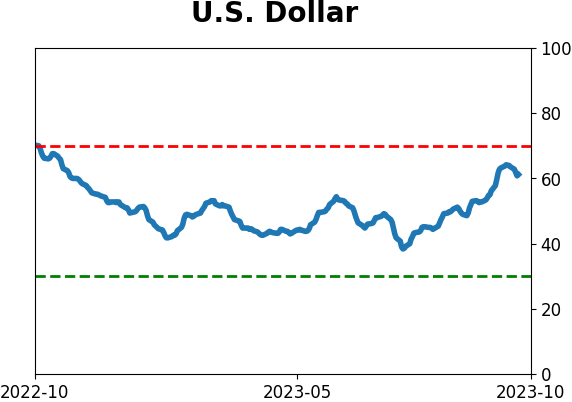
Currency ETF's - 5-Day Moving Average
|
|
|
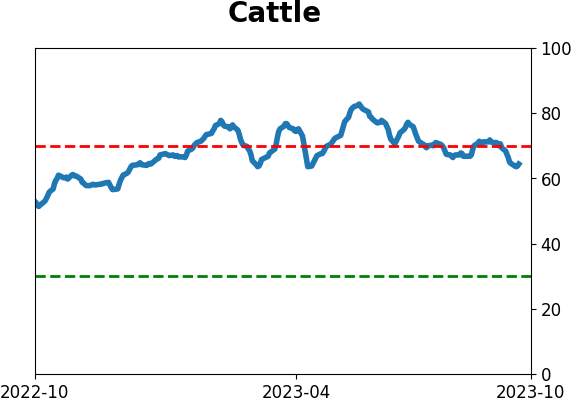
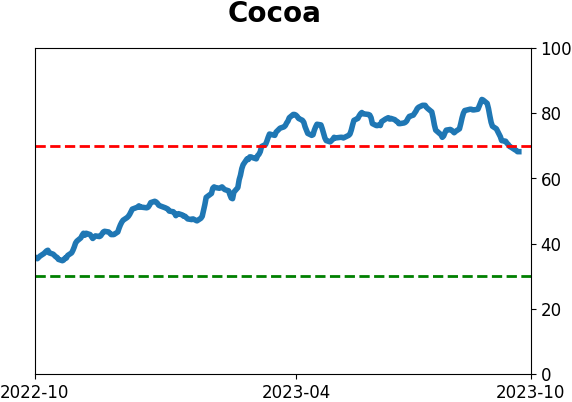
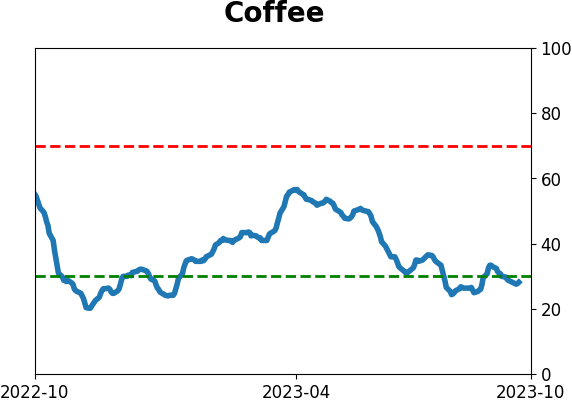
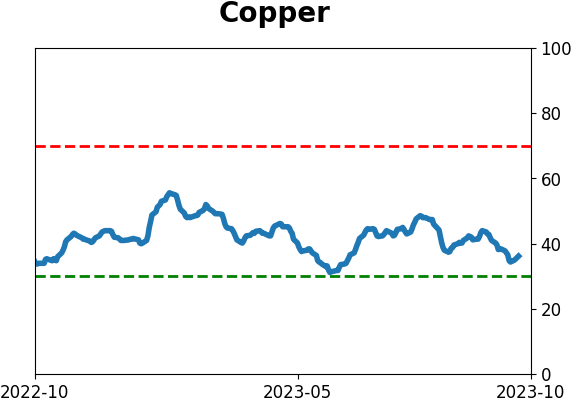
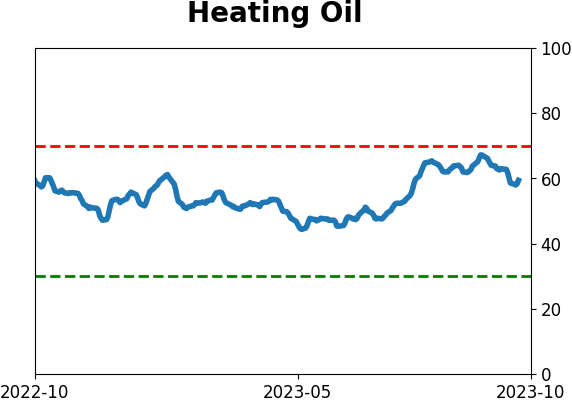
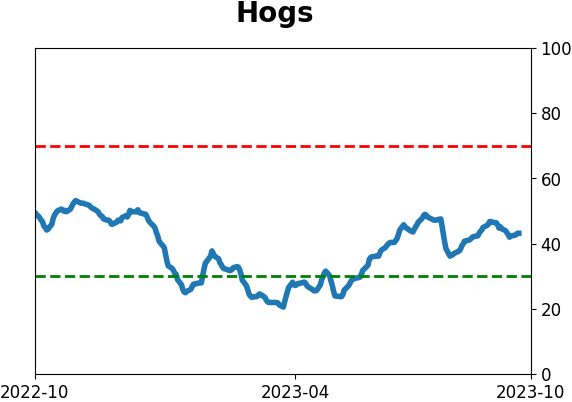
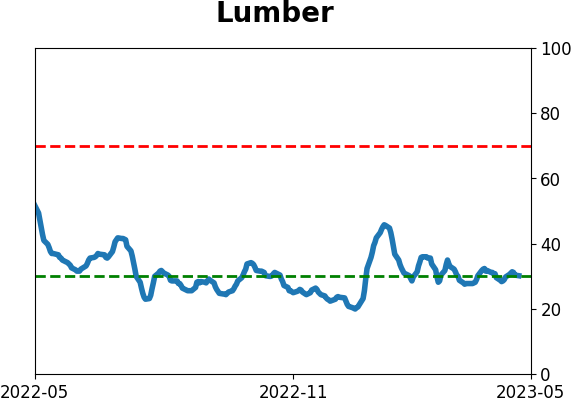
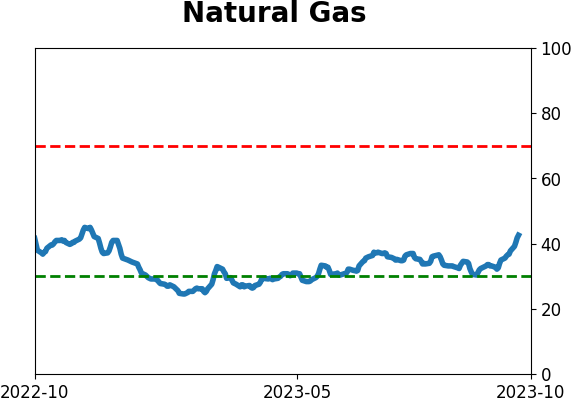
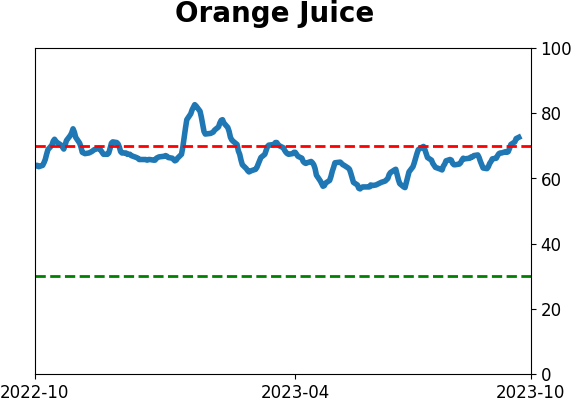
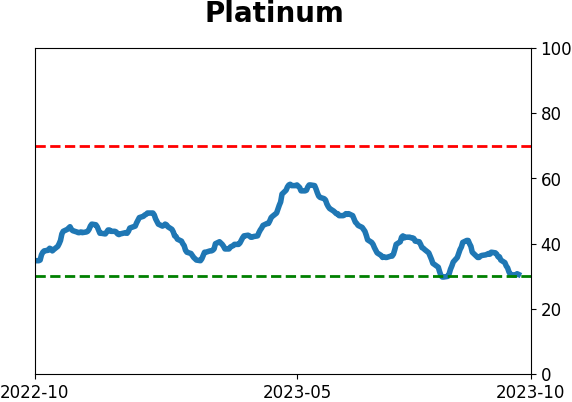
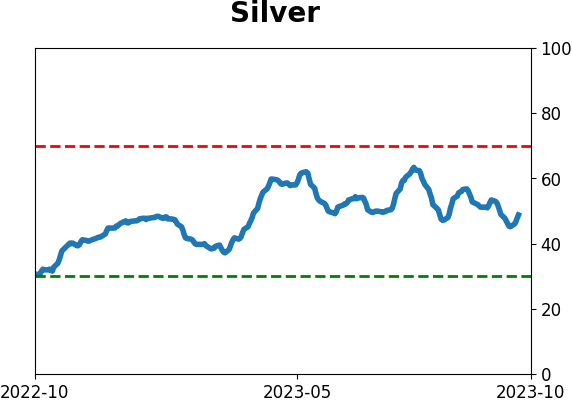
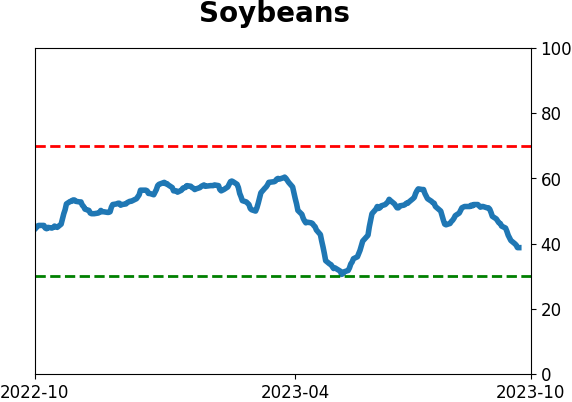
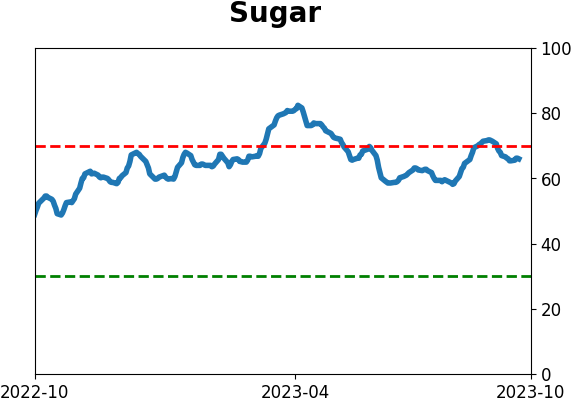
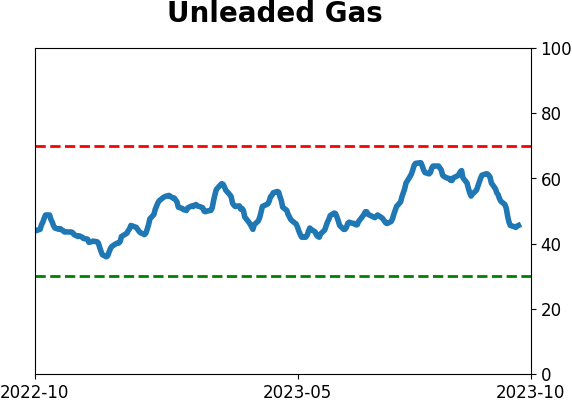
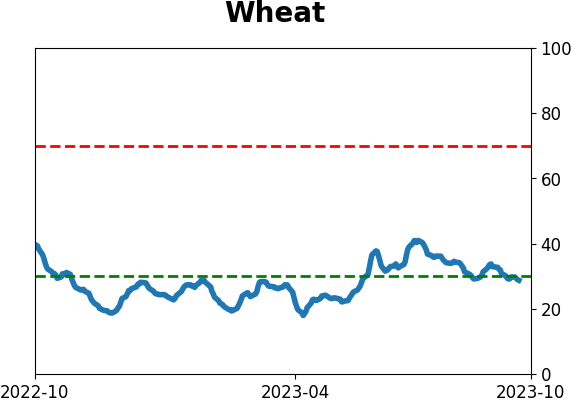
Commodity ETF's - 5-Day Moving Average
|
|