Headlines
|
|
Options traders just won't quit:
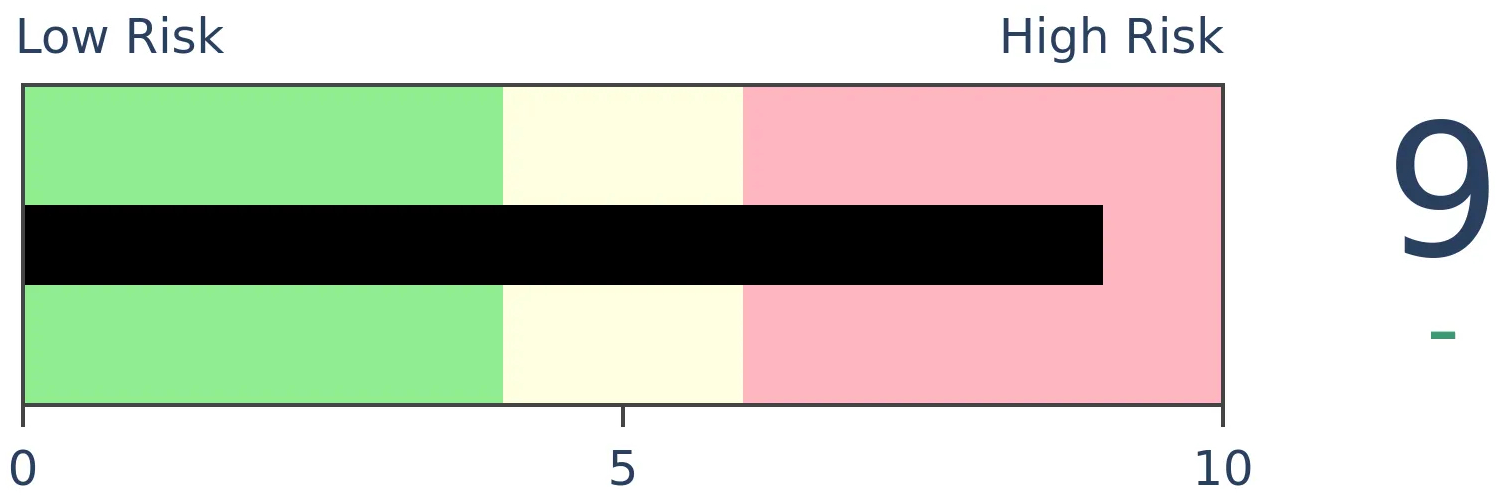
Last week, options traders returned to their speculative ways. It's not as extreme as it was in August, but Gamma Exposure has spiked again and overall speculative activity ranks among the highest 2% of all weeks in 20 years.
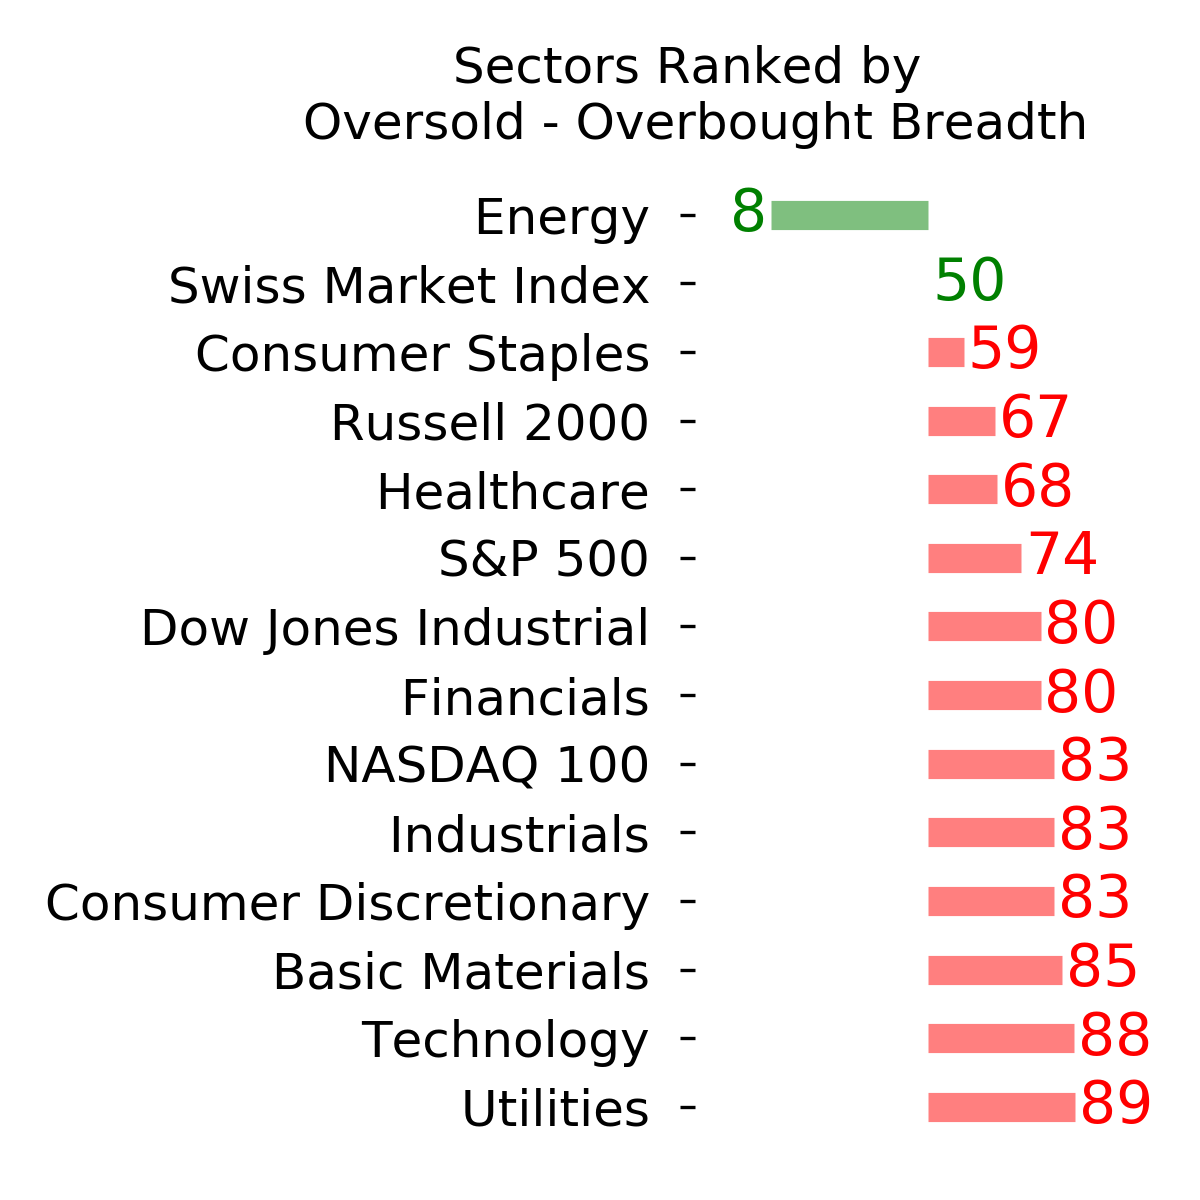
More small-cap recovery signs: Thanks to the recent surge that propelled the Russell 2000 to a historic gain, almost all of the stocks in the index are trading above their 10-day moving averages. Over the past 3 days, an average of more than 90% of small-cap stocks closed above their short-term averages. Over the past 20 years, there have been 19 other days when this triggered, and 3 months later, the Russell 2000 was higher after all 19, per the Backtest Engine. Its average return was over 8%.
Gap and go (and go and go and go): For the 1st time in its history, the most important ETF in the world has gapped higher for the 4th straight day, and added to its opening gains each time. There have been a handful of times when SPY has gone 3 in a row before, and we'll have some data on that tomorrow. At the same time, traders are buying far out-of-the-money put options as a "cheap" hedge. This has preceded some very short-term weakness in the past, but nothing much beyond a couple of weeks.
Bottom Line:
- A positive environment favors becoming aggressive on signs of excessive pessimism.
| Other Sectors and Assets |
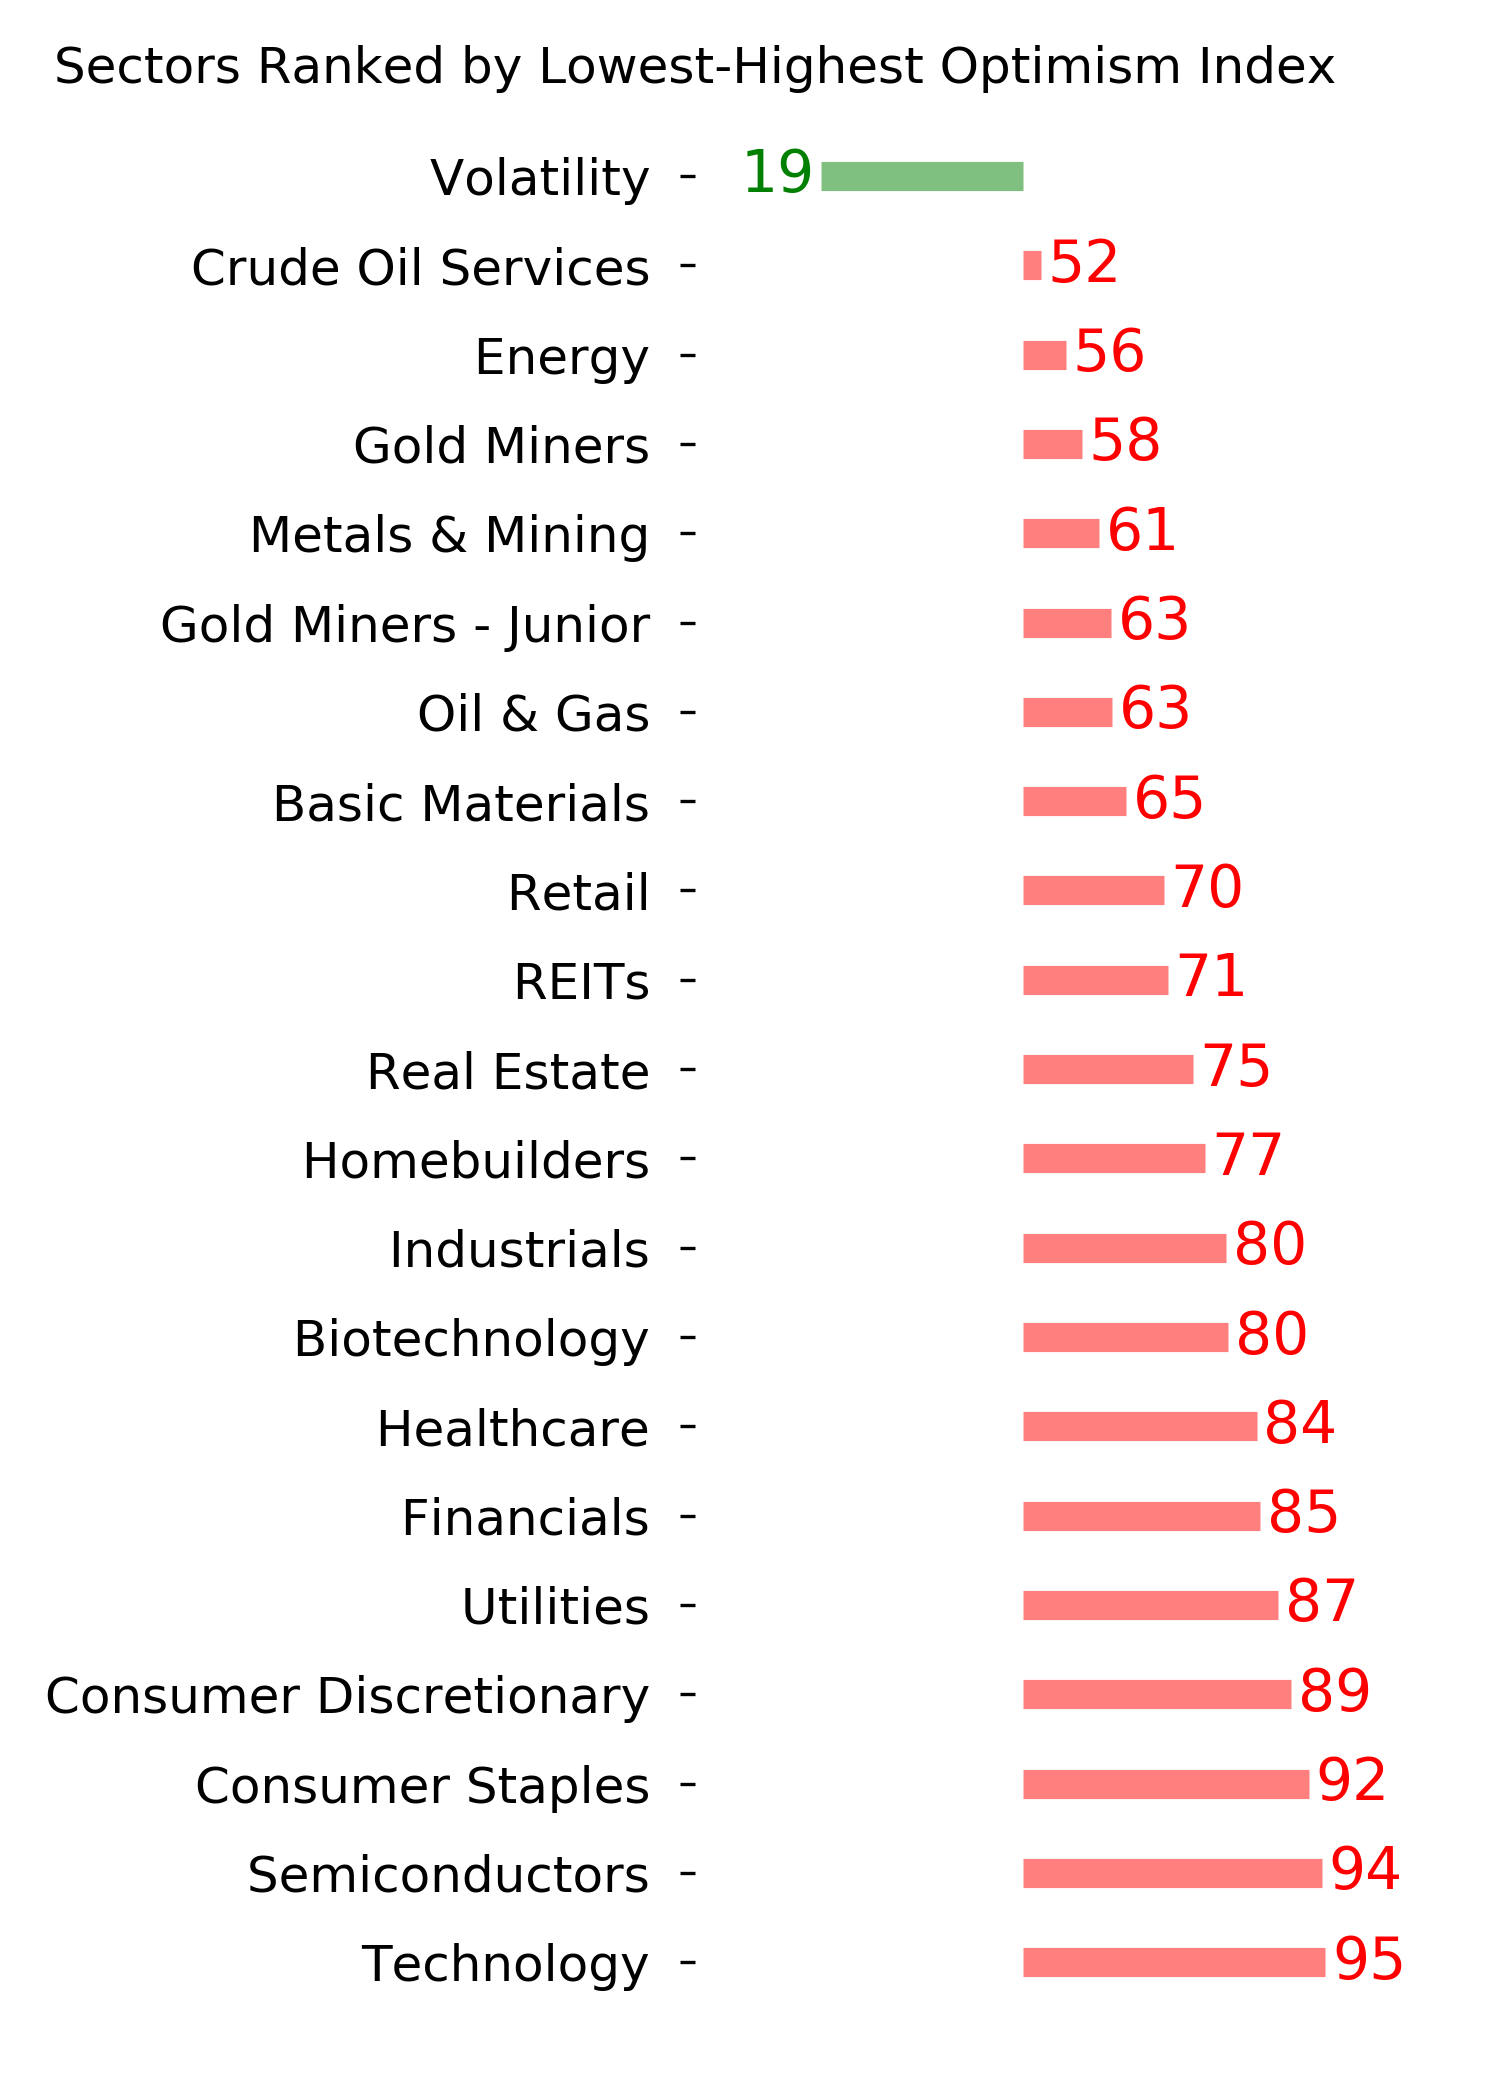
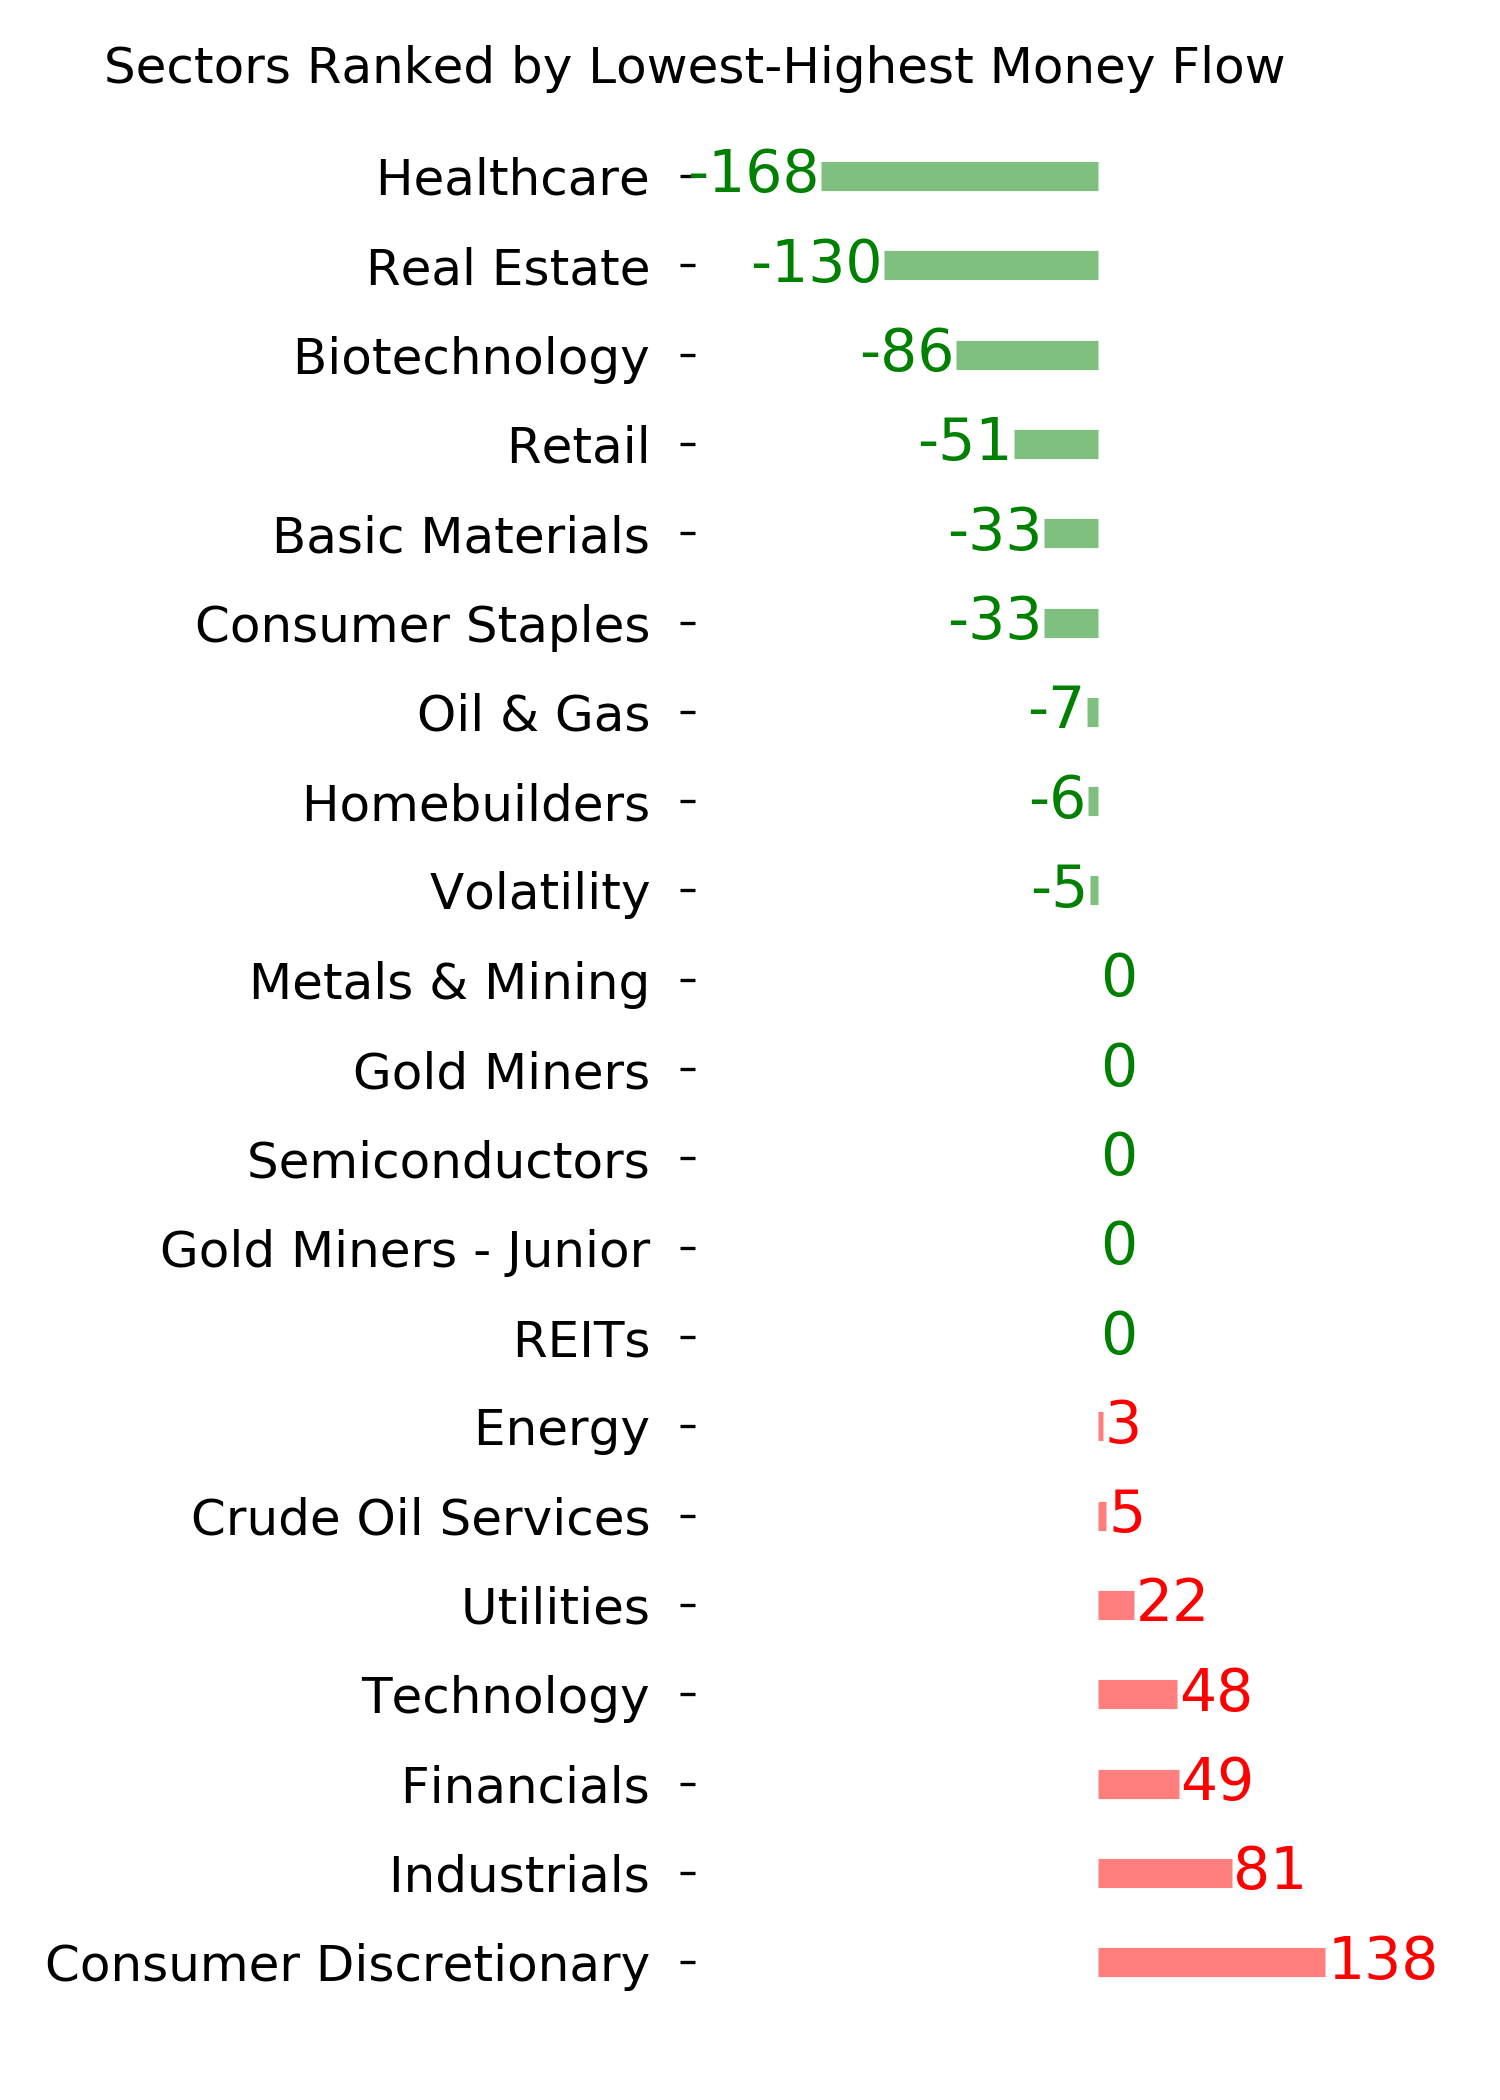
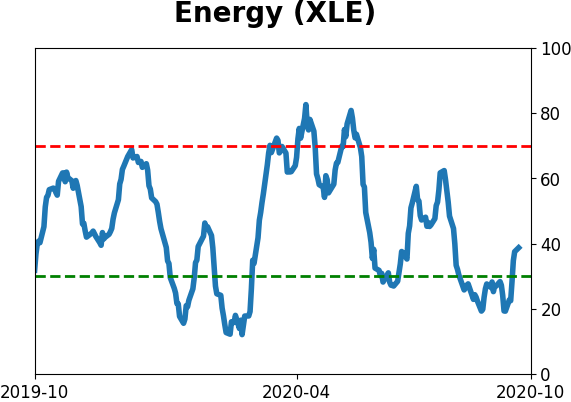
| | Positives | Negatives | | 1. Energy (here and here) | 1. Skewed tech (here and here) |
| 2. Dollar test |
|
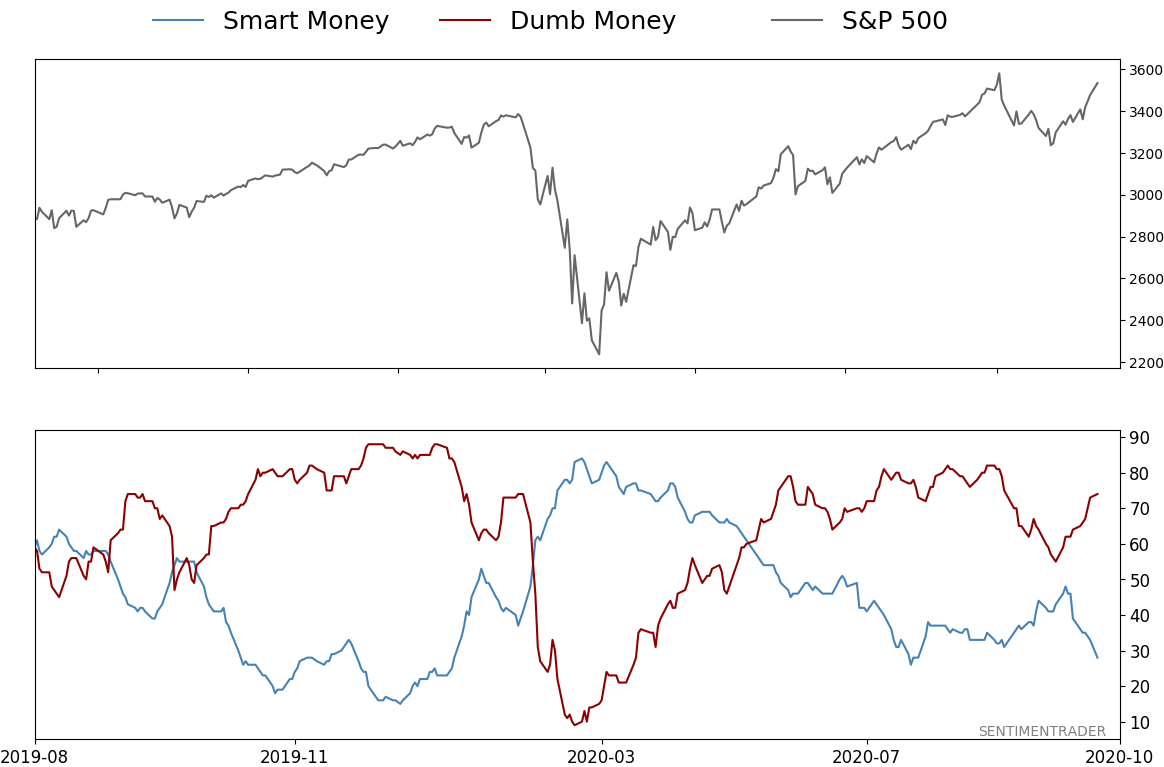
Smart / Dumb Money Confidence
|
Smart Money Confidence: 28%
Dumb Money Confidence: 74%
|
|
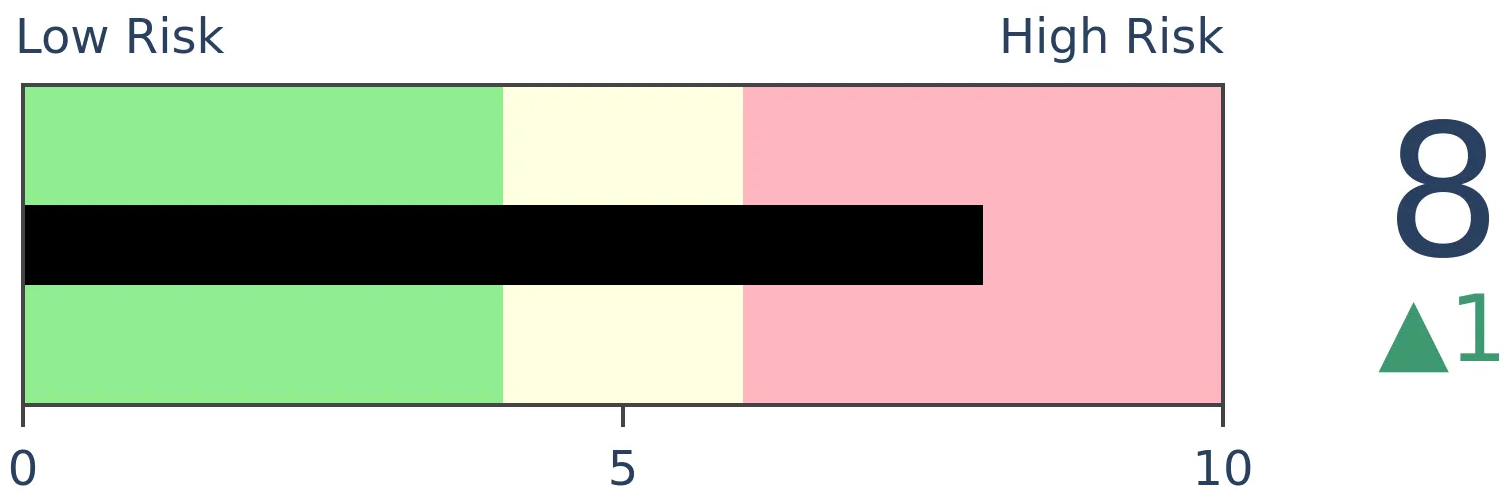
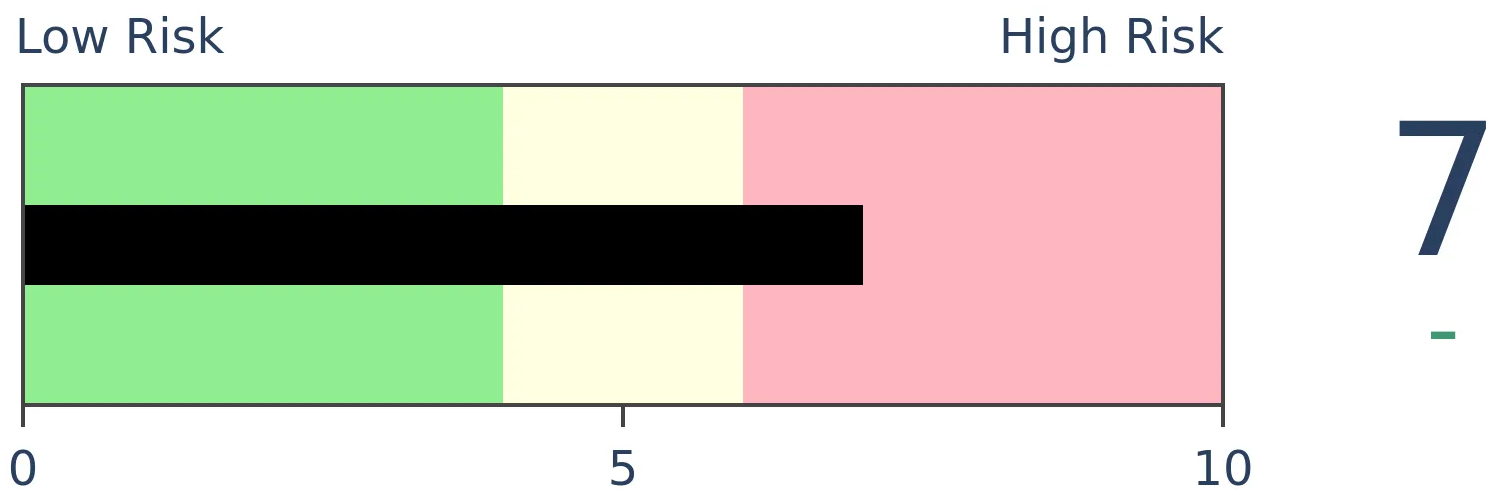
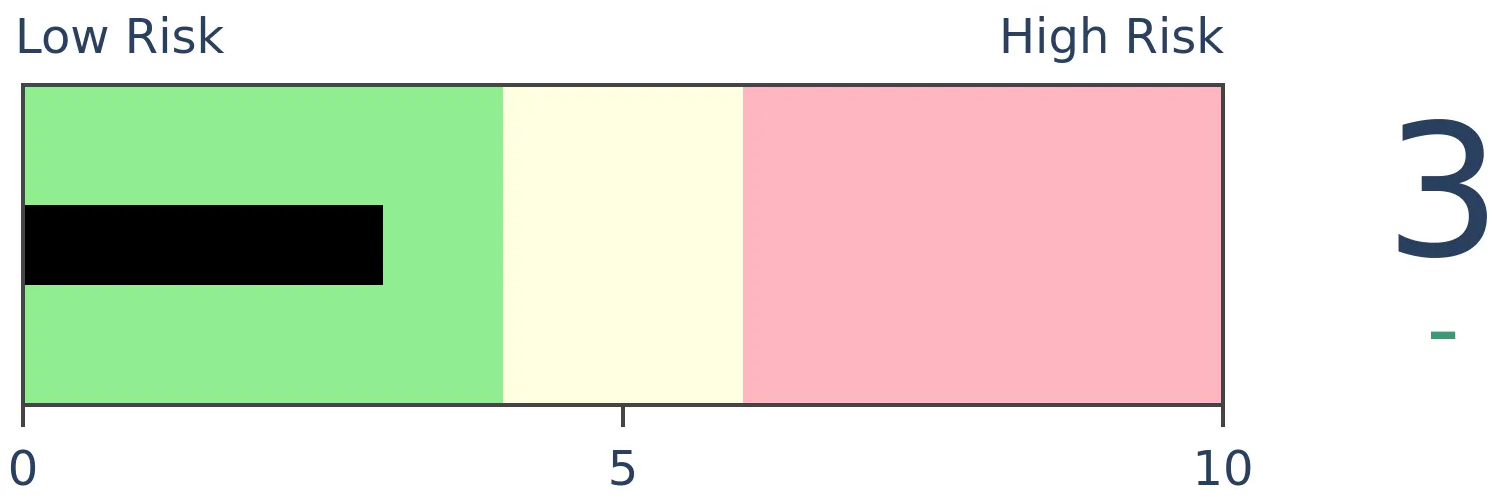
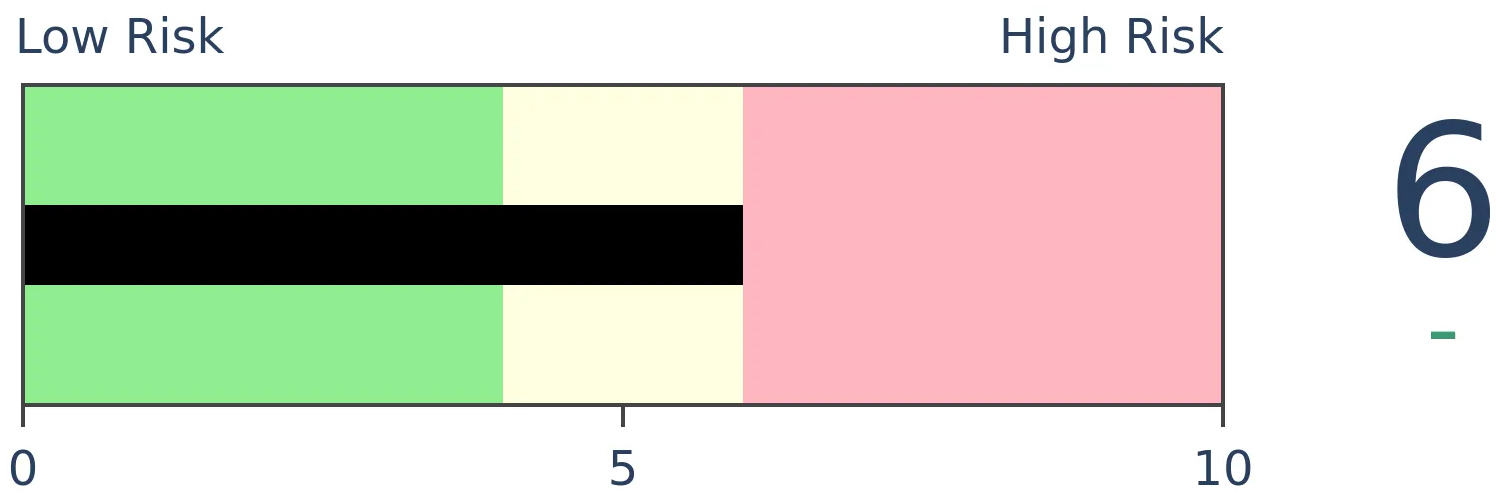
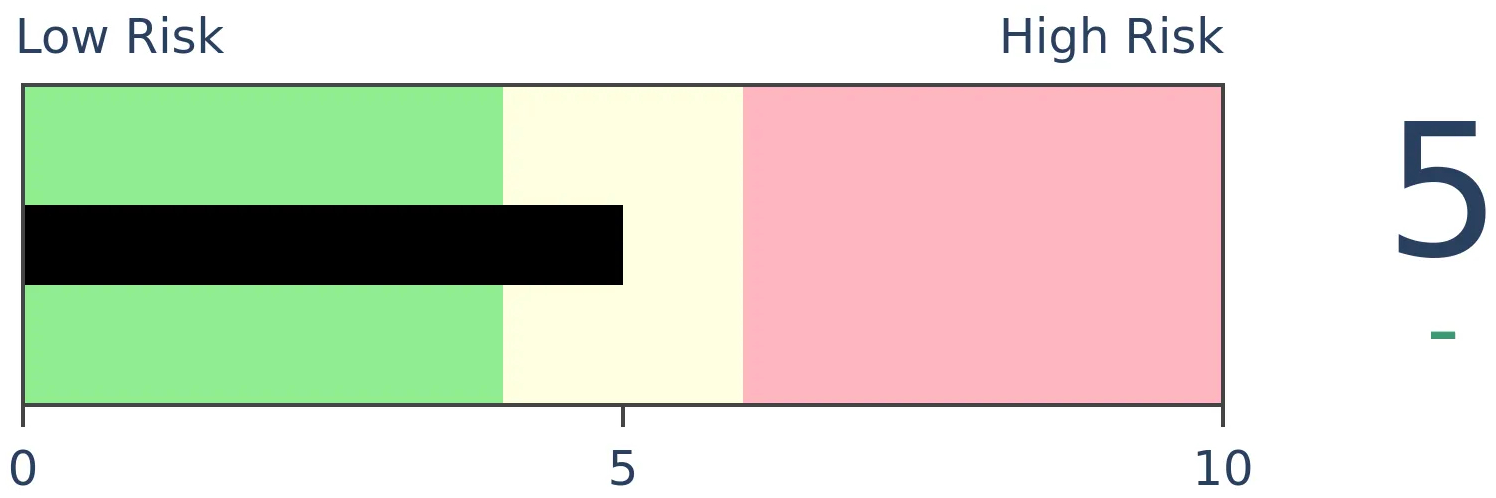
Risk Levels
Stocks Short-Term
|
Stocks Medium-Term
|
|
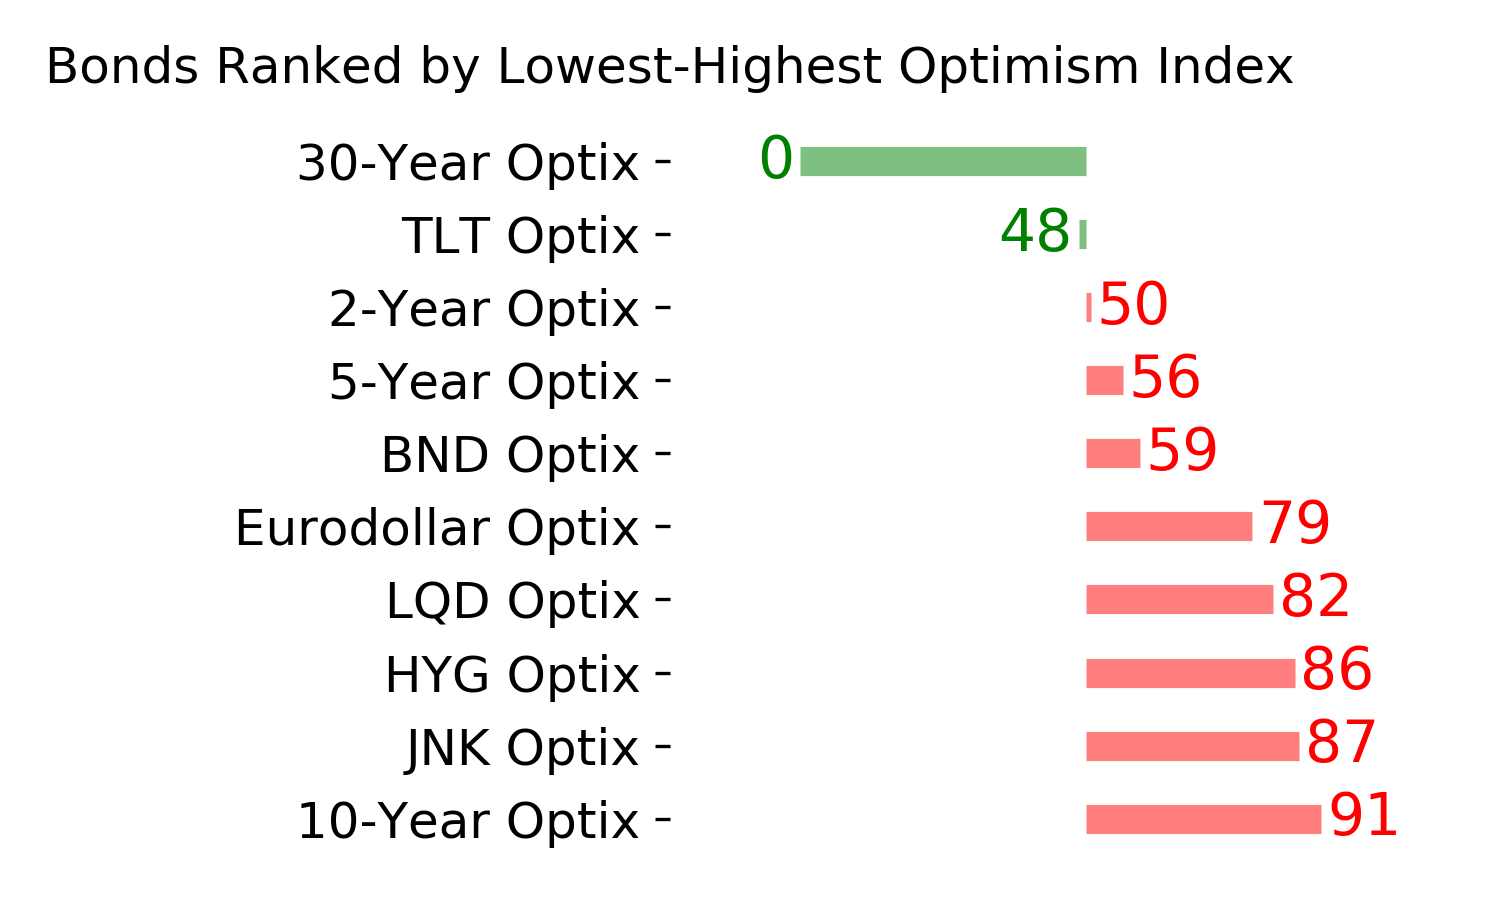
Bonds
|
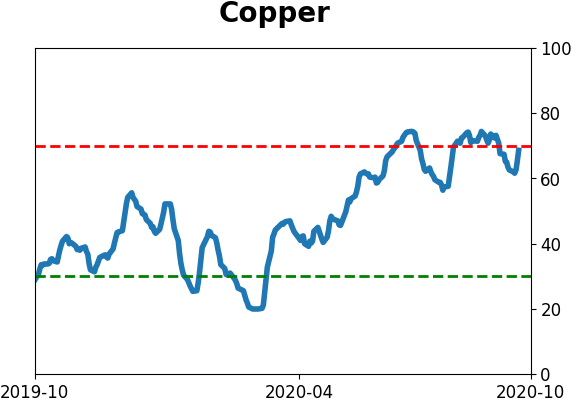
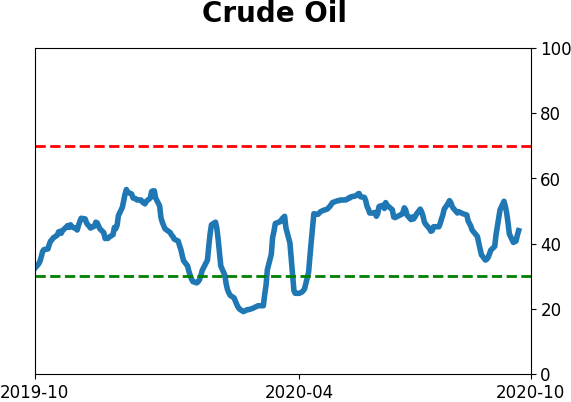
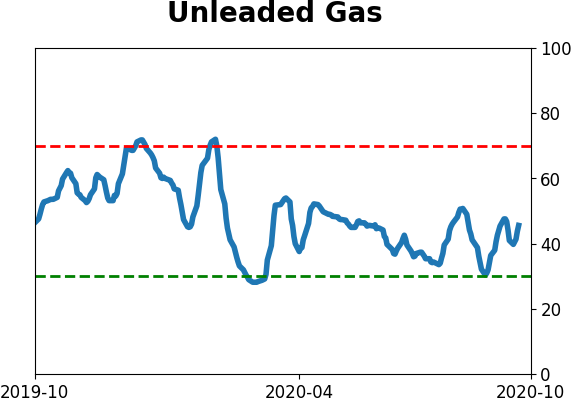
Crude Oil
|
|
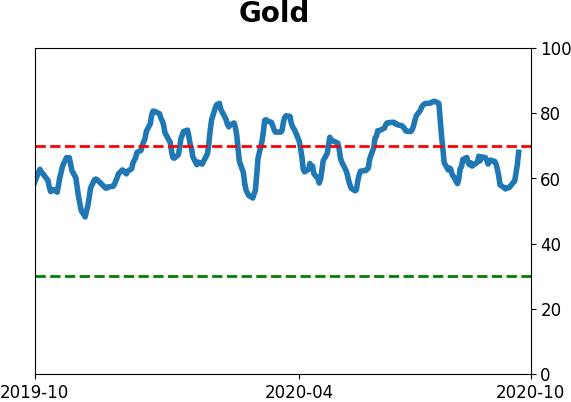
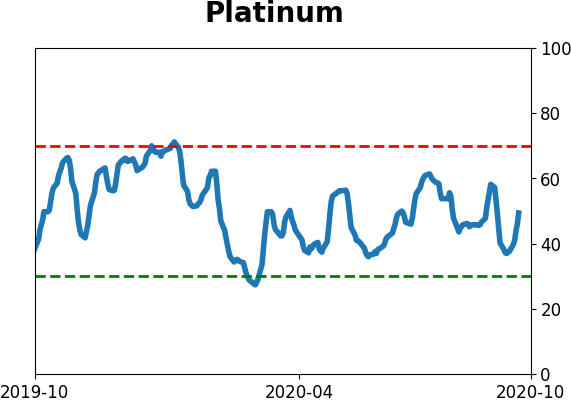
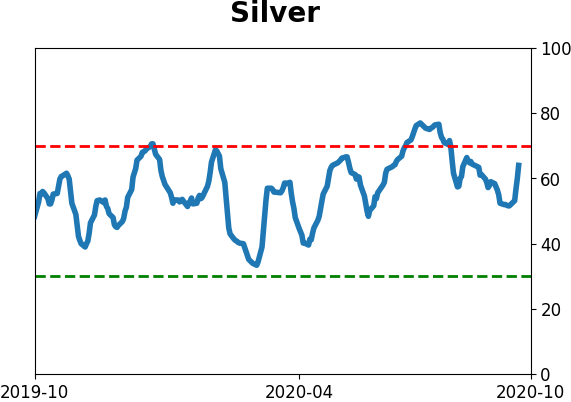
Gold
|
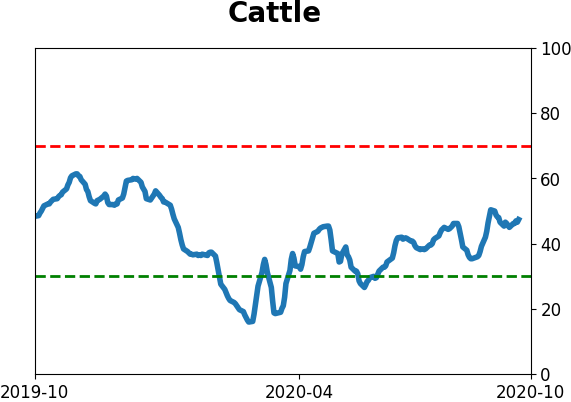
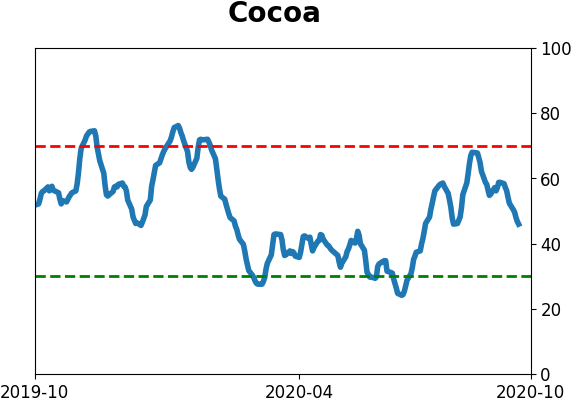
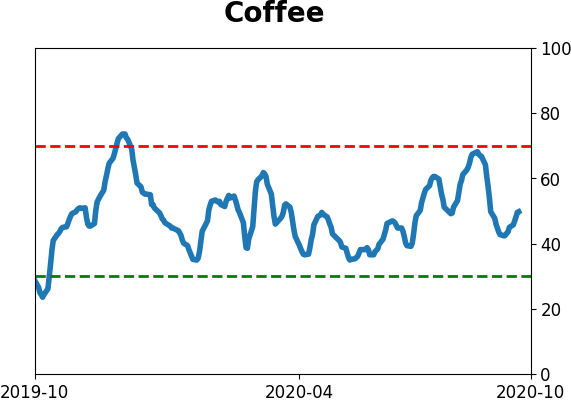
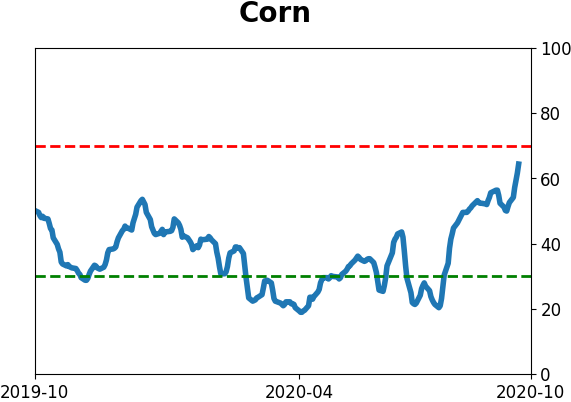
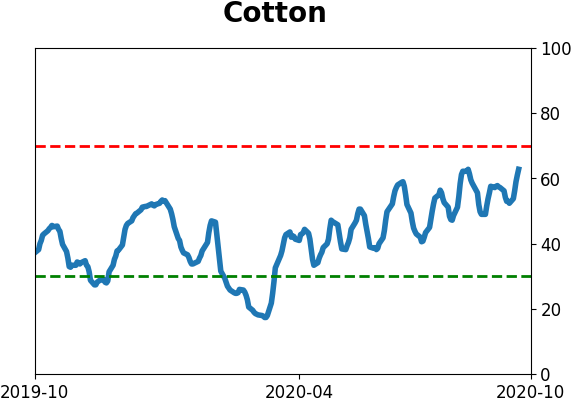
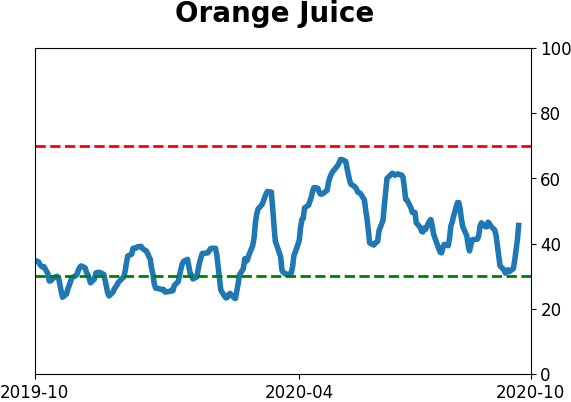
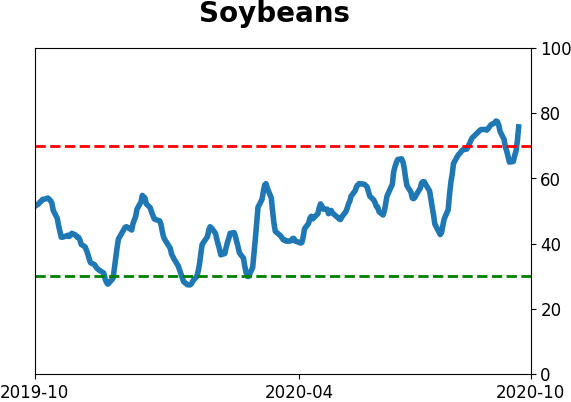
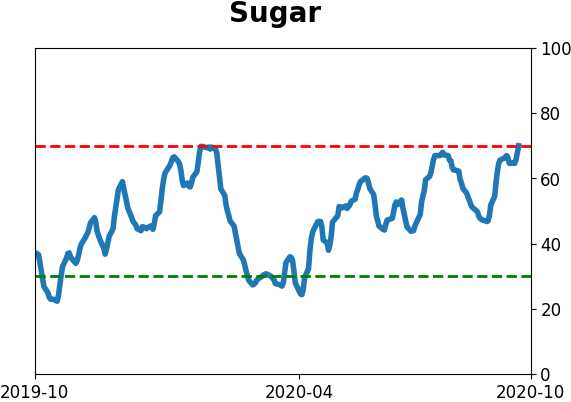
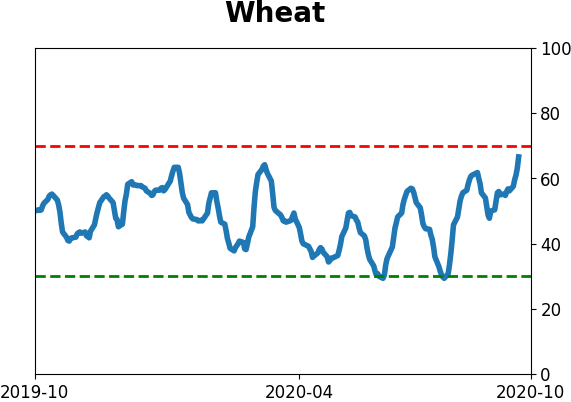
Agriculture
|
|
Research
BOTTOM LINE
Last week, options traders returned to their speculative ways. It's not as extreme as it was in August, but Gamma Exposure has spiked again and overall speculative activity ranks among the highest 2% of all weeks in 20 years.
FORECAST / TIMEFRAME
None
|
The "stocks only go up" mentality that caught fire in July turned into a raging inferno by the end of August, especially in names like Amazon and Tesla. That triggered warnings about what might happen once some of those options expired.
That preceded a nearly 12% drop in the Nasdaq 100 at its low point in September. While that served to wipe out some of the speculative fervor, it didn't completely destroy it. And now some of those traders are back for more.
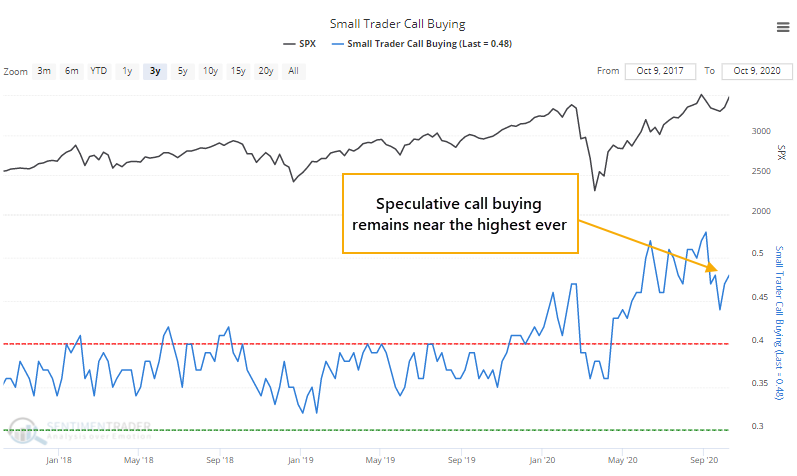
Last week, the smallest of options traders spent 48% of their volume on buying to open speculative call options. That's higher than 98% of all other weeks since the year 2000 though still below the peak from late August / early September.
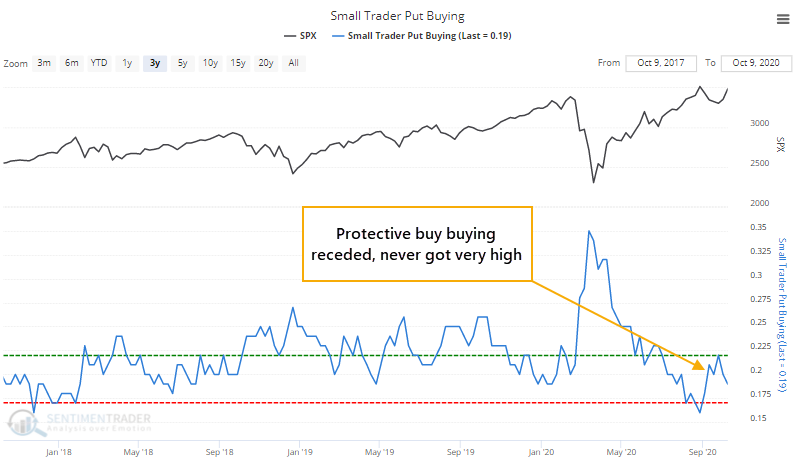
They also reduced the number of hedges, with protective put buying dropping to 19% of total volume. Again, not quite as extreme as before.
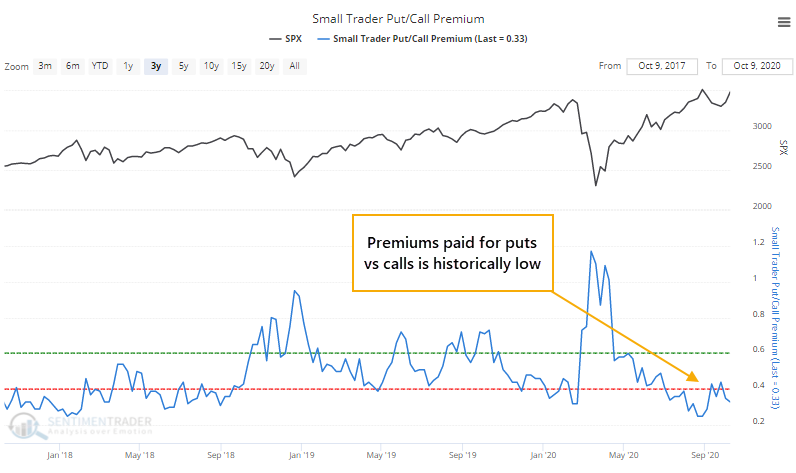
One of the oddities from a month ago was that implied volatility was rising along with stock prices. That hasn't happened this time around. Because the options contain less pumped up premiums, the ratio of premiums spent on puts versus calls also isn't as extreme as it was before. But it's still historically low.
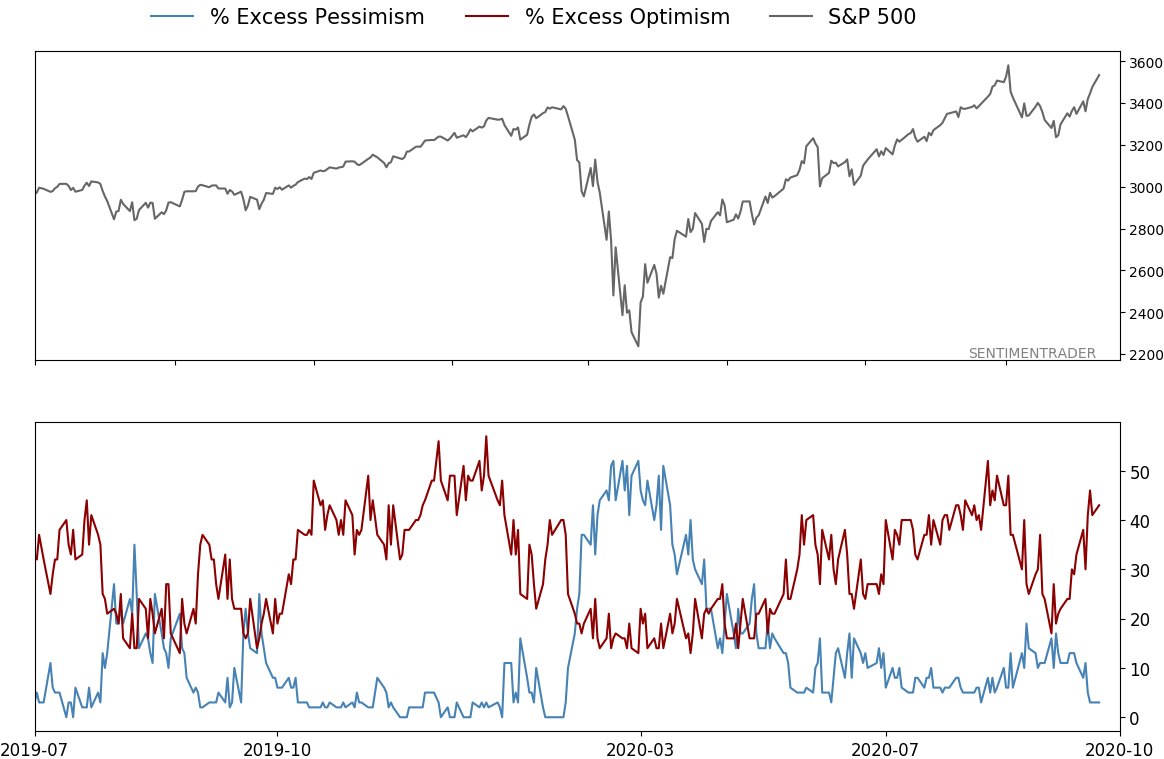
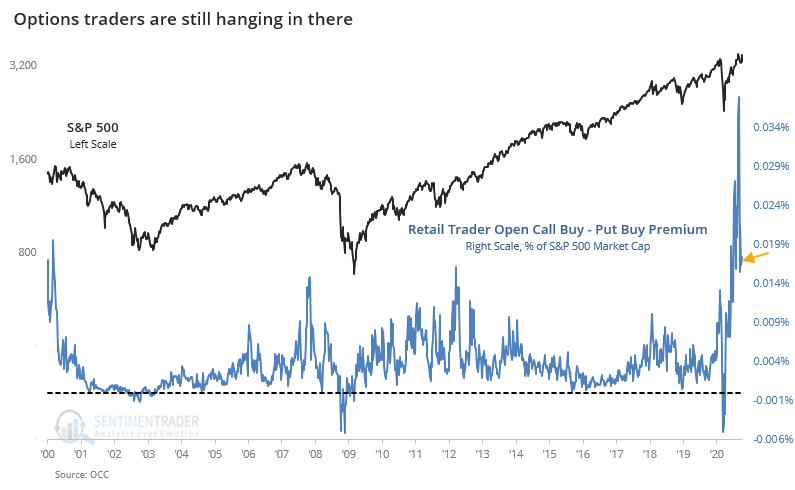
If we look at a broader view, it's clear that speculative activity has subsided but remains disturbingly high. Among retail traders, buying fewer than 50 contracts at a time, the premiums spent on calls vs. puts as a percentage of the S&P 500's market capitalization has dropped quite a bit from its earlier peak.
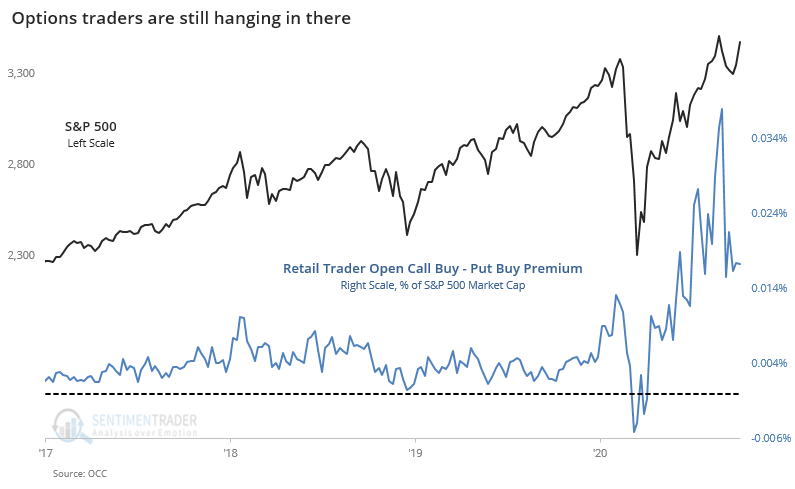
But that hardly matters when looking at the past 20 years. It's still higher than almost all other peaks in speculative fervor.
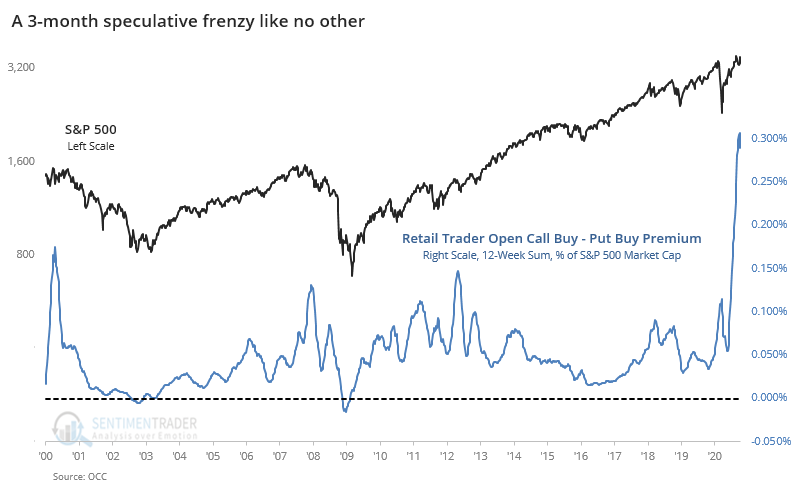
If we sum up this activity over the past 12 weeks, we can better see just how proracted and extreme their behavior has been.
Another worry is that late last week, estimated Gamma Exposure spiked according to SqueezeMetrics. This is a rough estimate for how much dealers may sell for every 1% rise in the S&P 500.
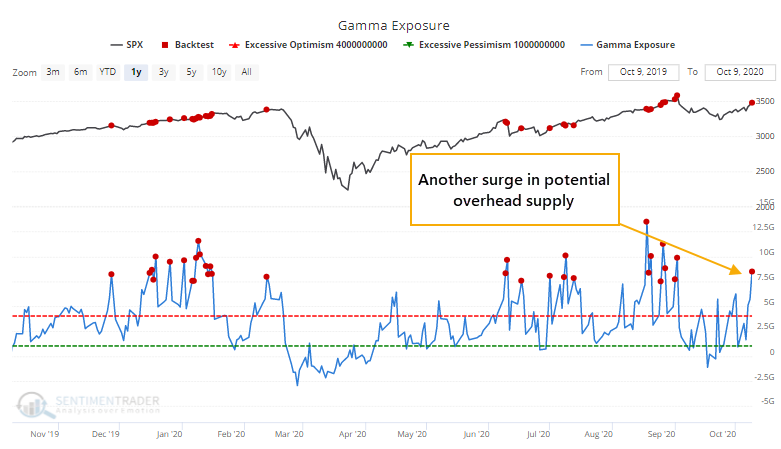
The index has not done well when Gamma Exposure was high according to the Backtest Engine.
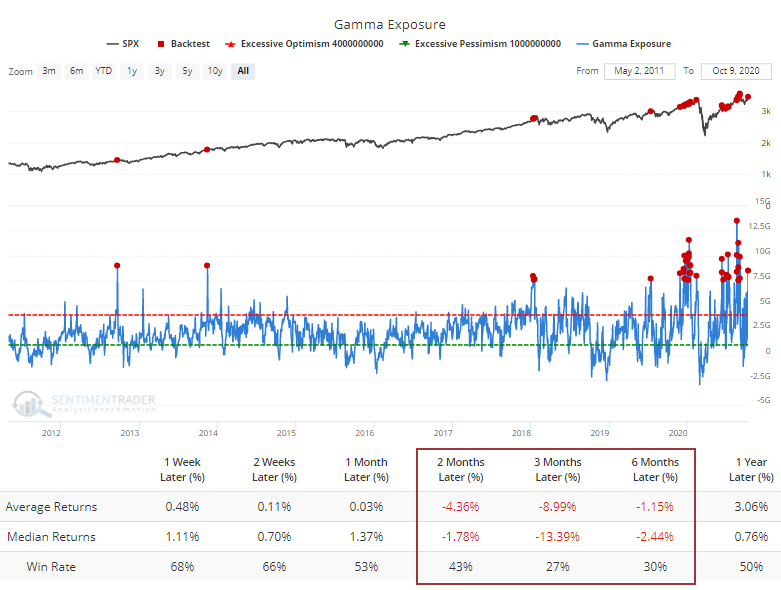
When we saw this behavior in August, it was especially worrying because there were consistent signs of trouble underlying the indexes. On some days, the major indexes like S&P 500 or Nasdaq Composite would jump 1% or more while most of the stocks in those indexes were declining.
We're most assuredly not seeing that now, as last week witnessed some of the best internal dynamics in months. That takes quite a lot of the bite out of the newest resurgence in speculative juices. It's hard to see how this kind of behavior gets rewarded - markets simply aren't that accommodating. But given last week's impressive, and important, recovery in major breadth metrics, this options activity isn't as big of a worry as it was a month+ ago.
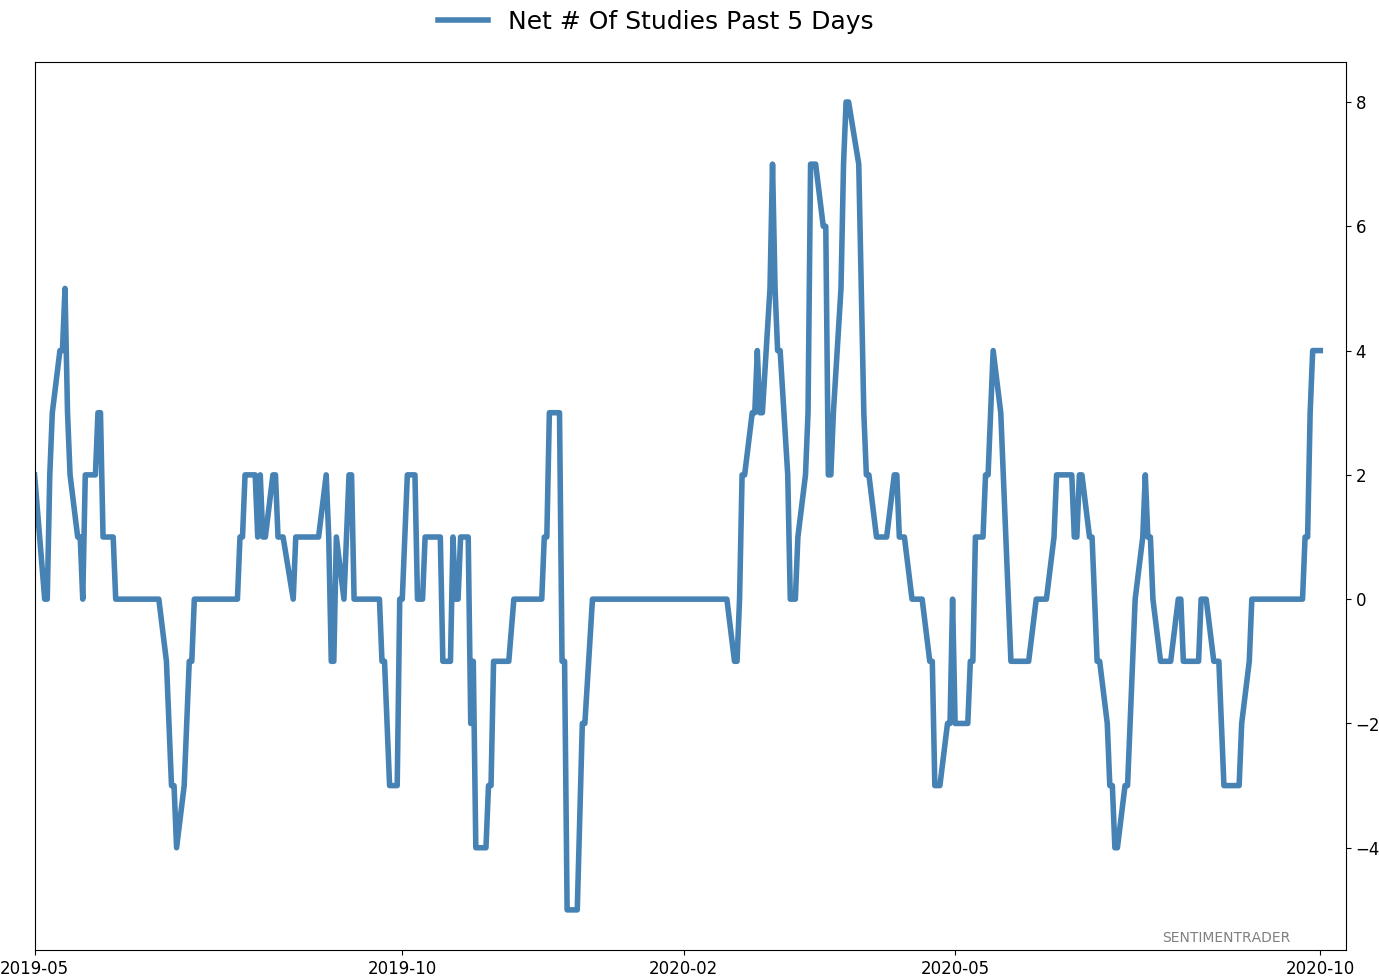
Active Studies
| Time Frame | Bullish | Bearish | | Short-Term | 0 | 0 | | Medium-Term | 4 | 8 | | Long-Term | 48 | 2 |
|
Indicators at Extremes
Portfolio
| Position | Description | Weight % | Added / Reduced | Date | | Stocks | 15.6% RSP, 10.1% VWO, 7.6% XLE | 33.3 | Added 11% | 2020-10-08 | | Bonds | 10% BND, 10% SCHP, 10% ANGL | 29.7 | Reduced 0.1% | 2020-10-02 | | Commodities | GCC | 2.4 | Reduced 2.1%
| 2020-09-04 | | Precious Metals | GDX | 4.6 | Added 5% | 2020-09-09 | | Special Situations | | 0.0 | Reduced 5% | 2020-10-02 | | Cash | | 30.0 | | |
|
Updates (Changes made today are underlined)
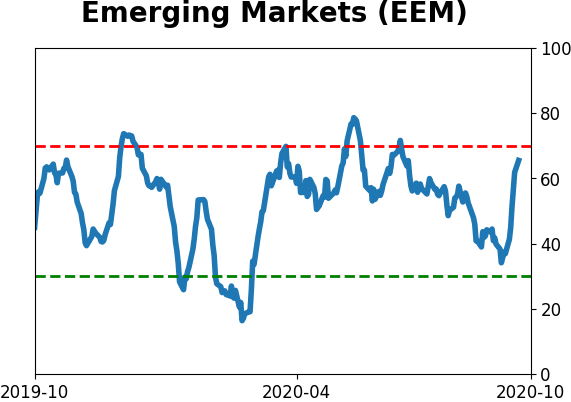
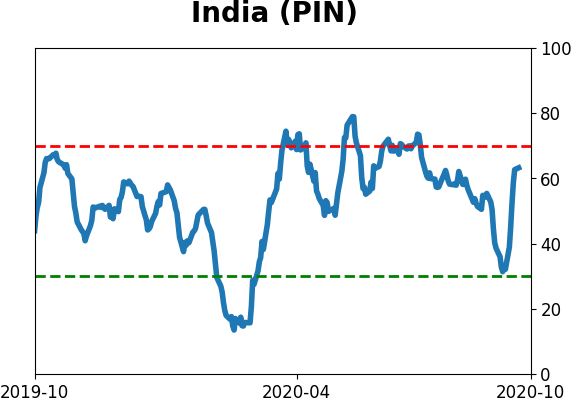
It's been a really mixed picture lately. In stocks, we saw huge momentum and a spike in speculation, then September managed to wring much of that out, except in the options market which is still a worry. There seem to be offsetting positives and negatives, with a mixed market environment, not the kind of setup where I feel comfortable being aggressive. I did add a bit to energy. The older I get, the less interested I am in short-term gyrations, and I don't really care about the coming days or even weeks. I'm fairly confident that the total return will be positive over a longer time frame given some of the developments we've looked in over the past week. With bonds, I decided to swap TLT for ANGL, a high-yield corporate fund with a heavy focus on energy bonds. Hedgers are heavily short 10-year Treasuries, and the high-yield market has held up well internally. I'm not generally a fan of buying into rising prices, but with the internal recovery in emerging markets from a compelling position (here and here), I started a position.
RETURN YTD: 0.2% 2019: 12.6%, 2018: 0.6%, 2017: 3.8%, 2016: 17.1%, 2015: 9.2%, 2014: 14.5%, 2013: 2.2%, 2012: 10.8%, 2011: 16.5%, 2010: 15.3%, 2009: 23.9%, 2008: 16.2%, 2007: 7.8%
|
|
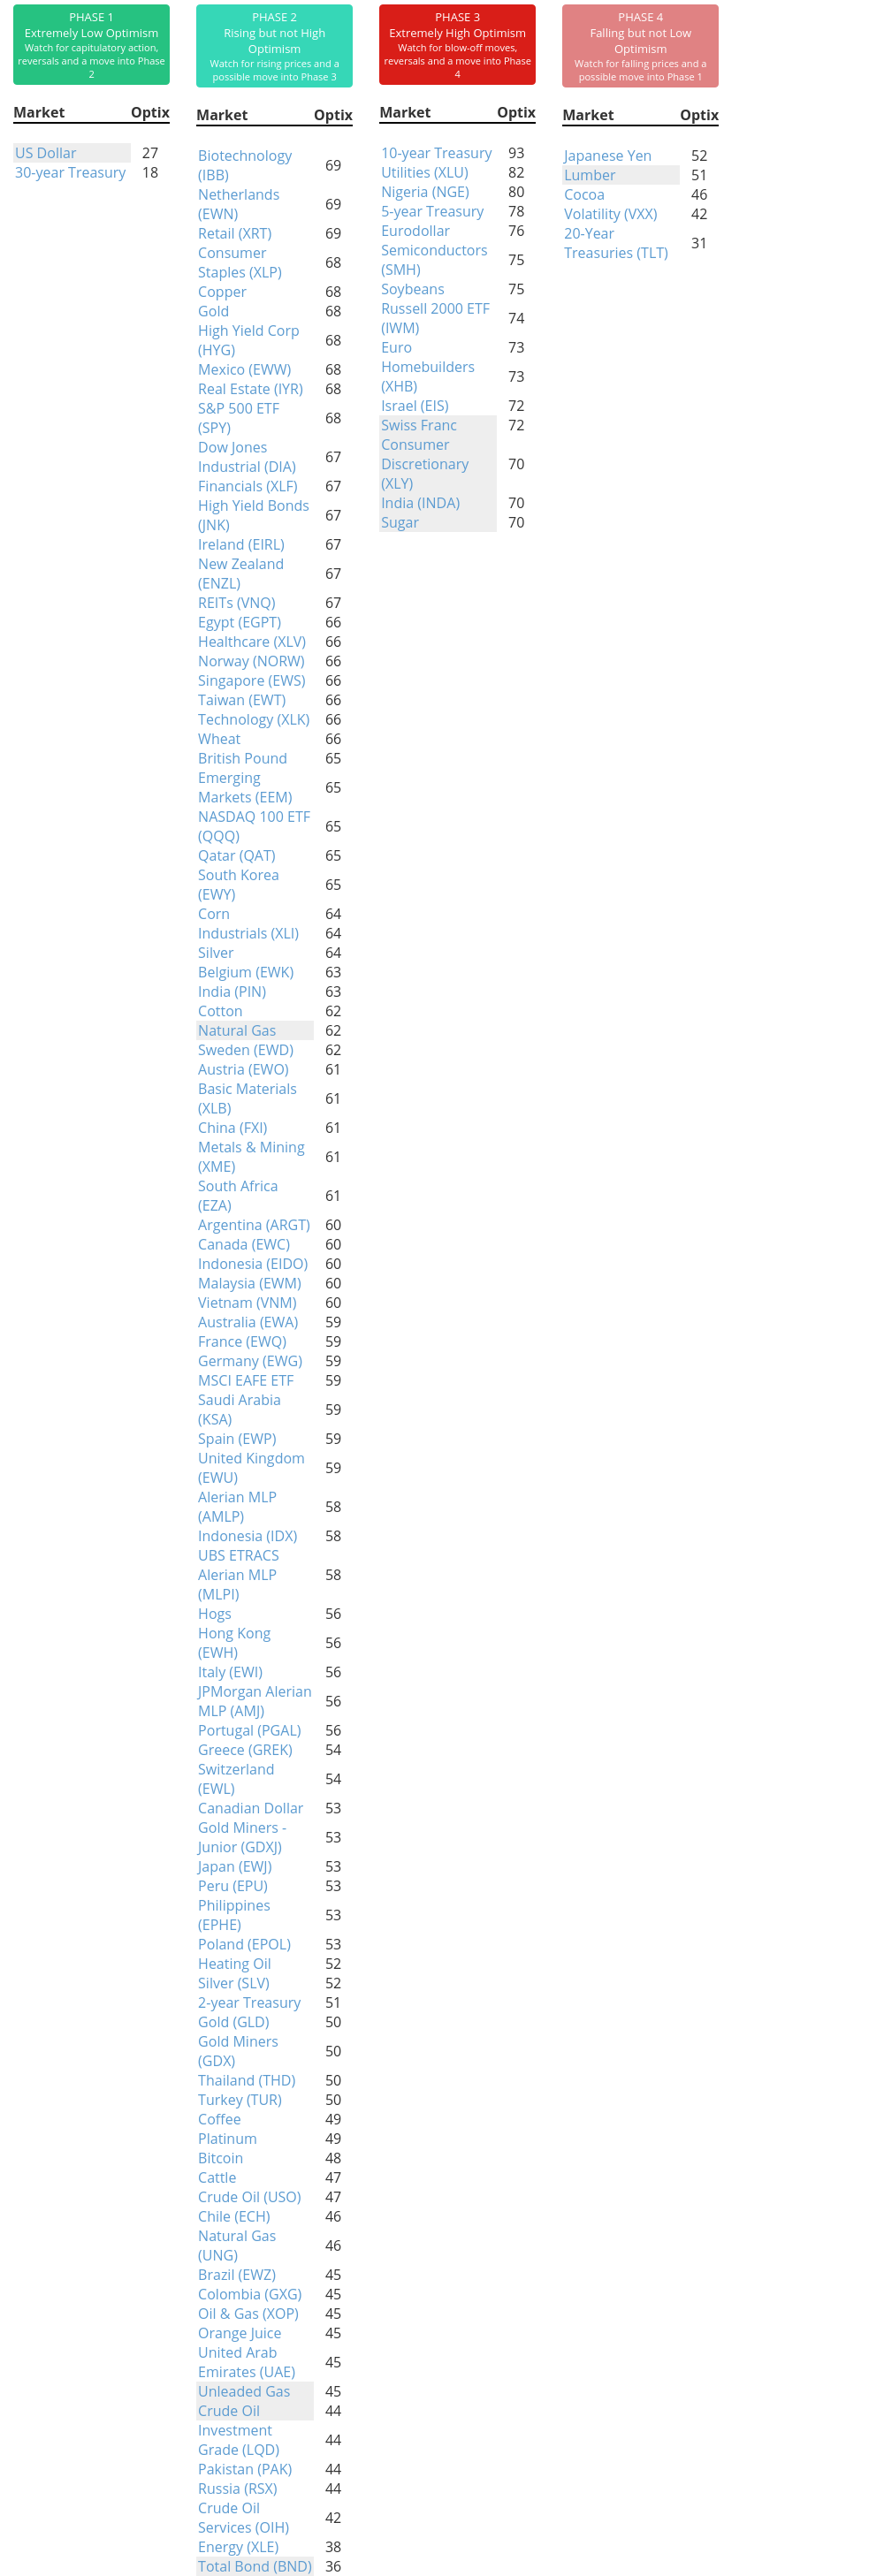
Phase Table
Ranks
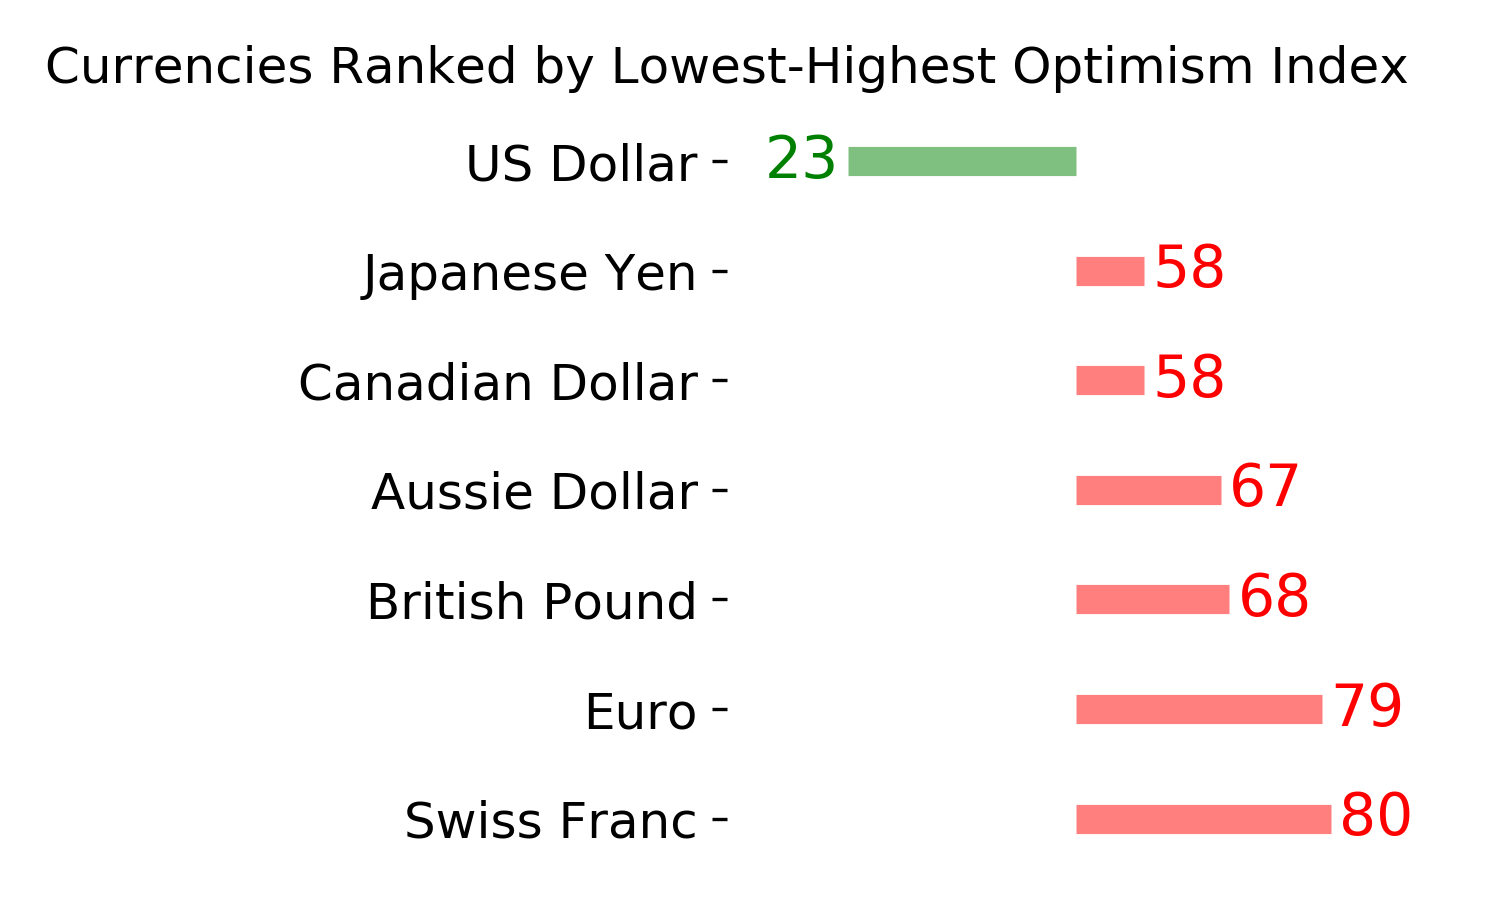
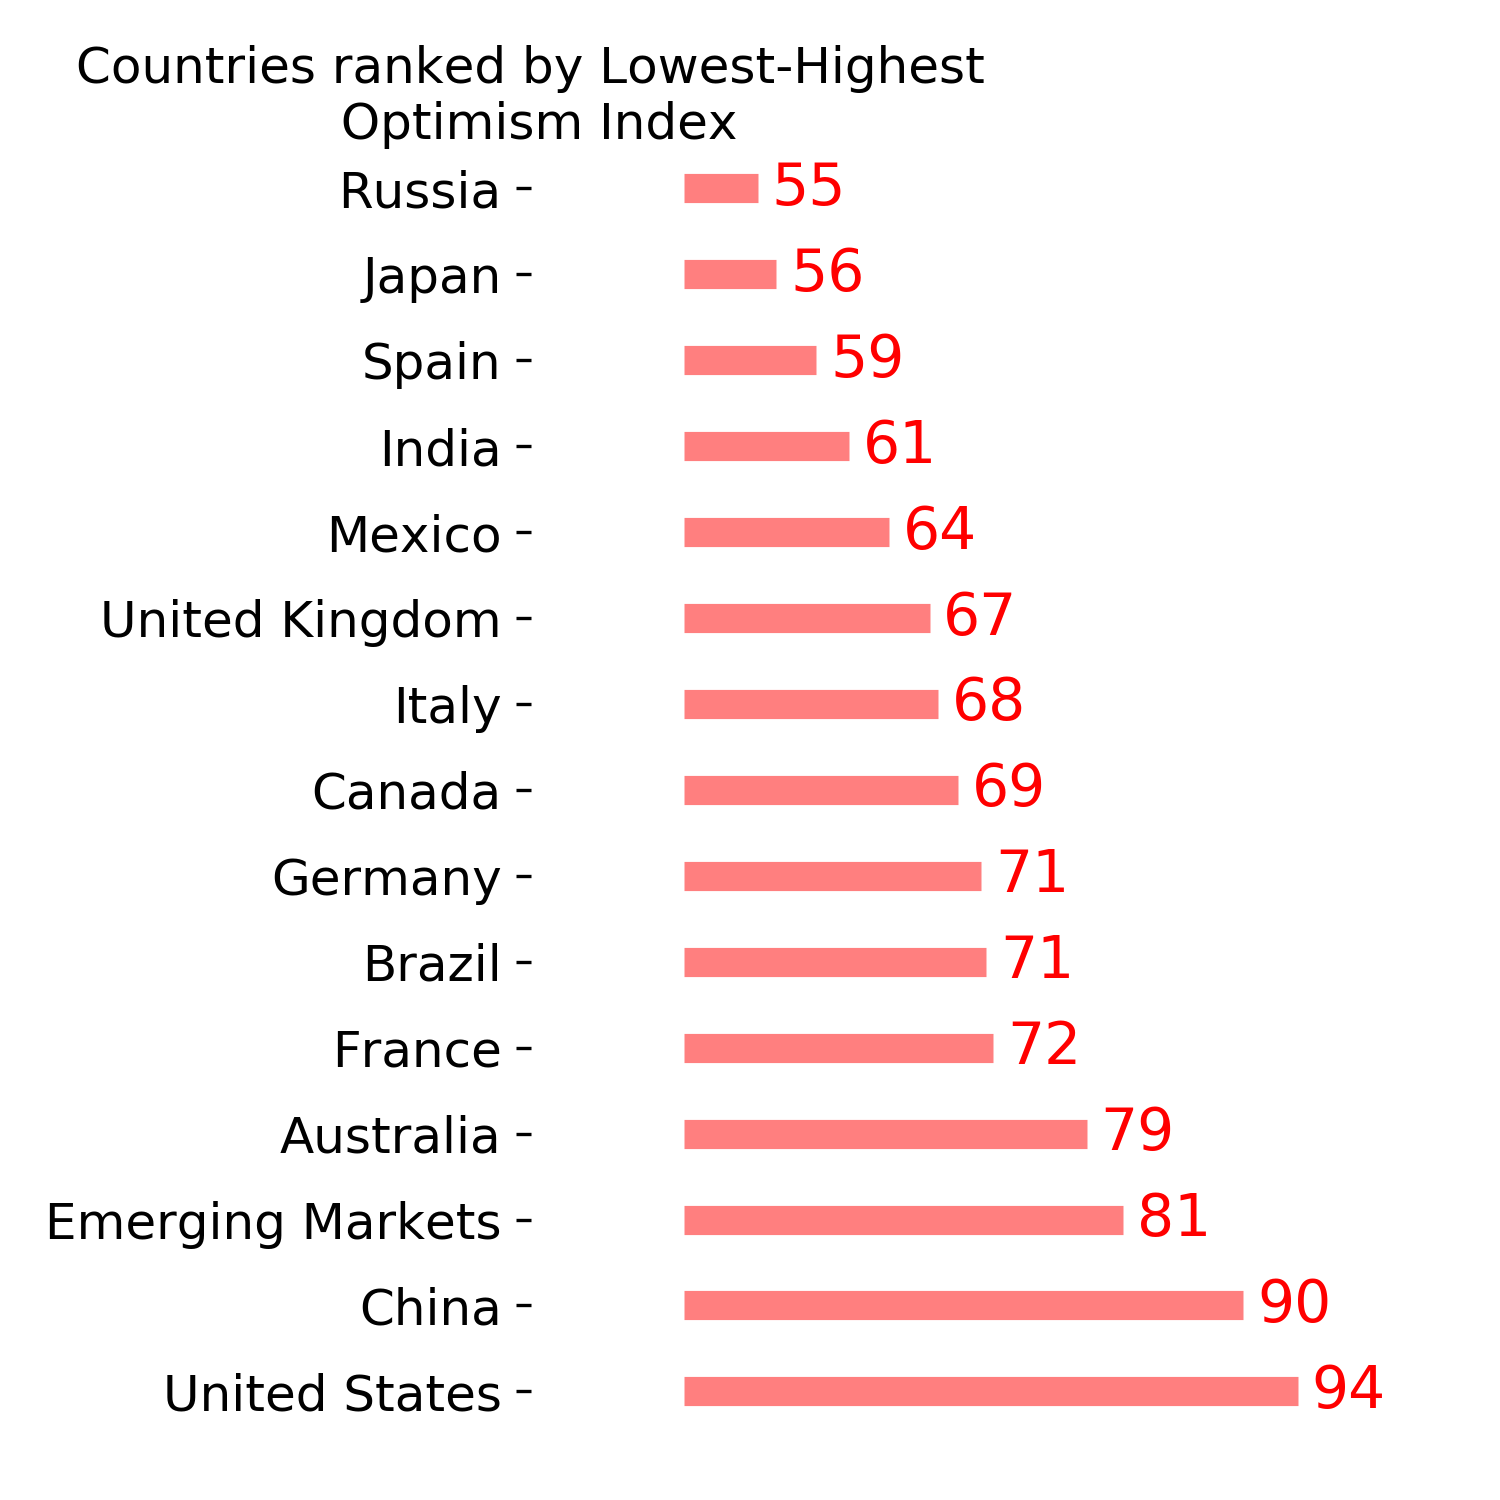
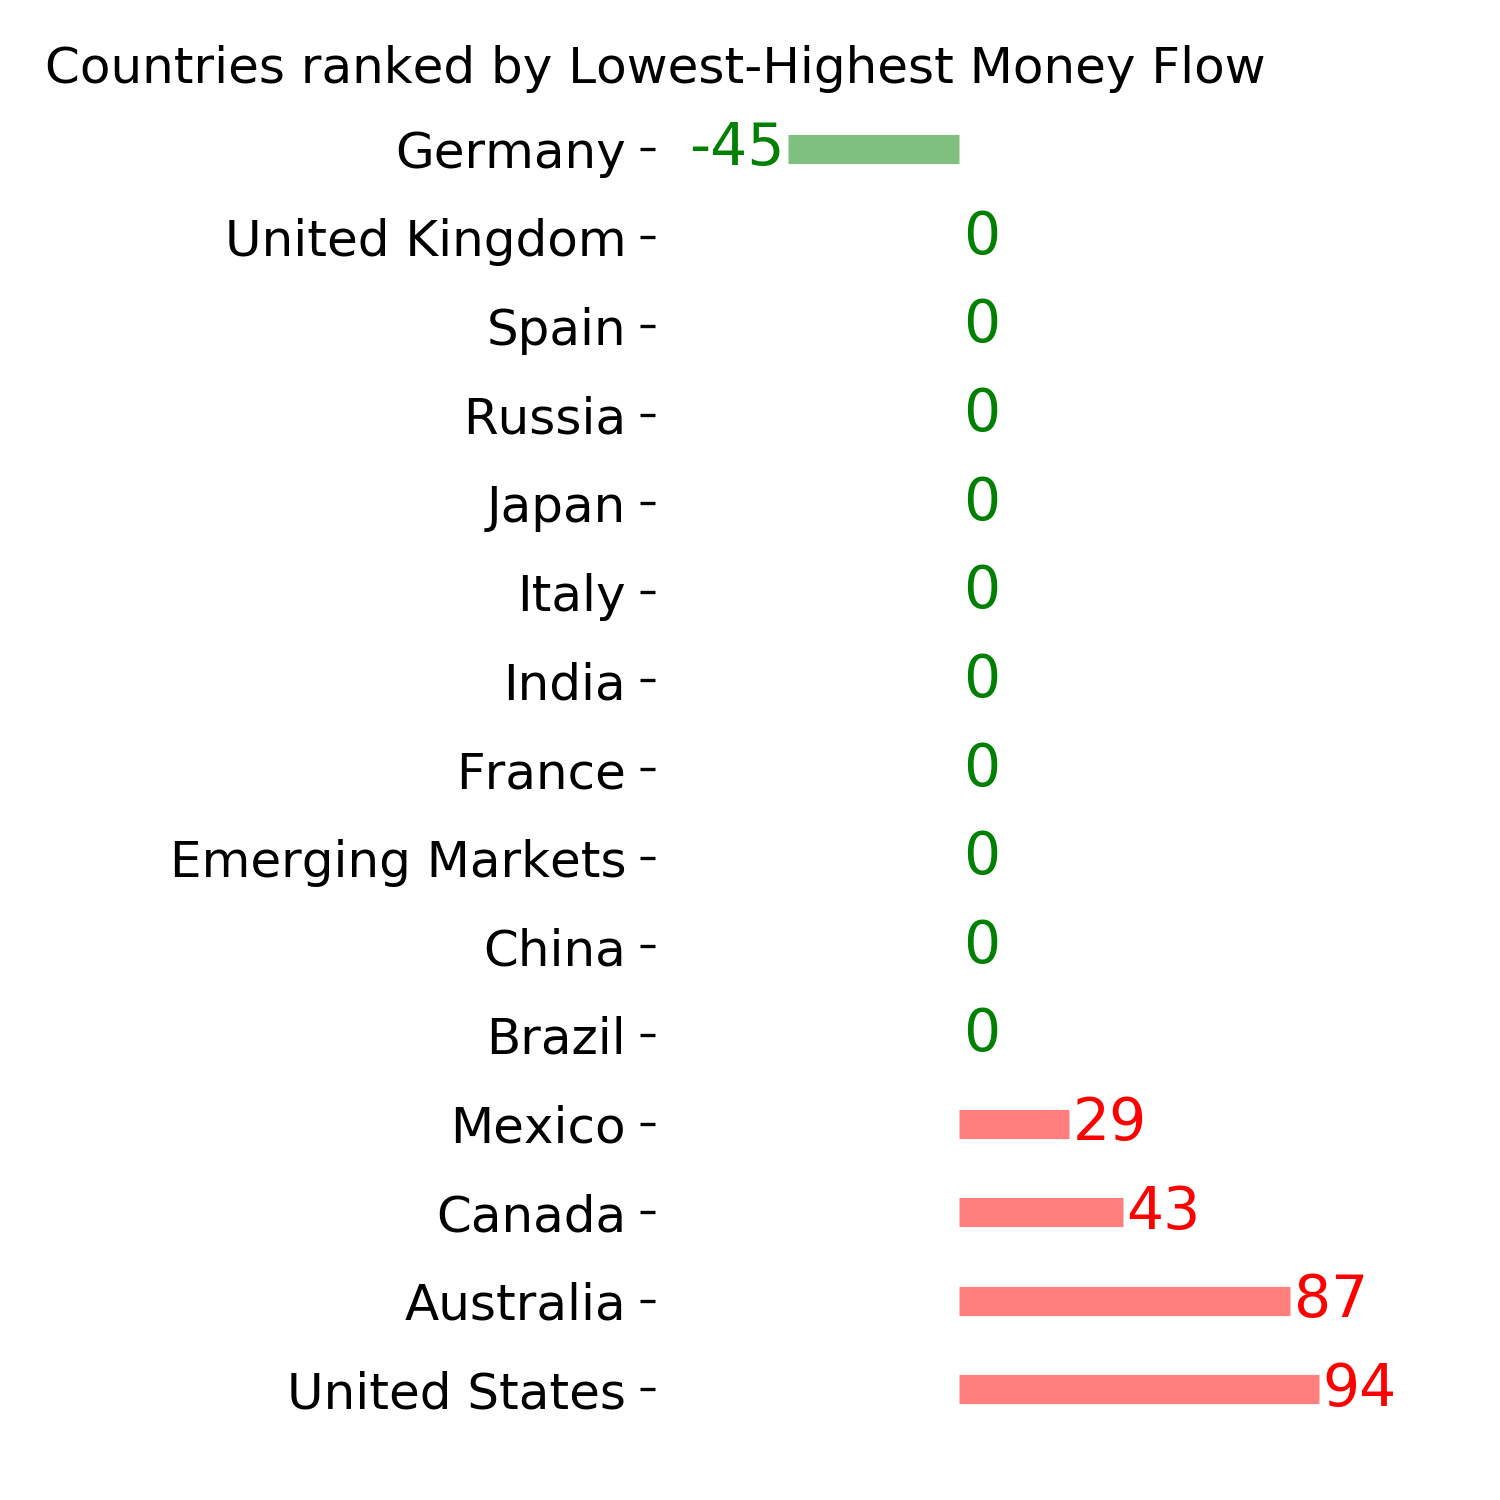
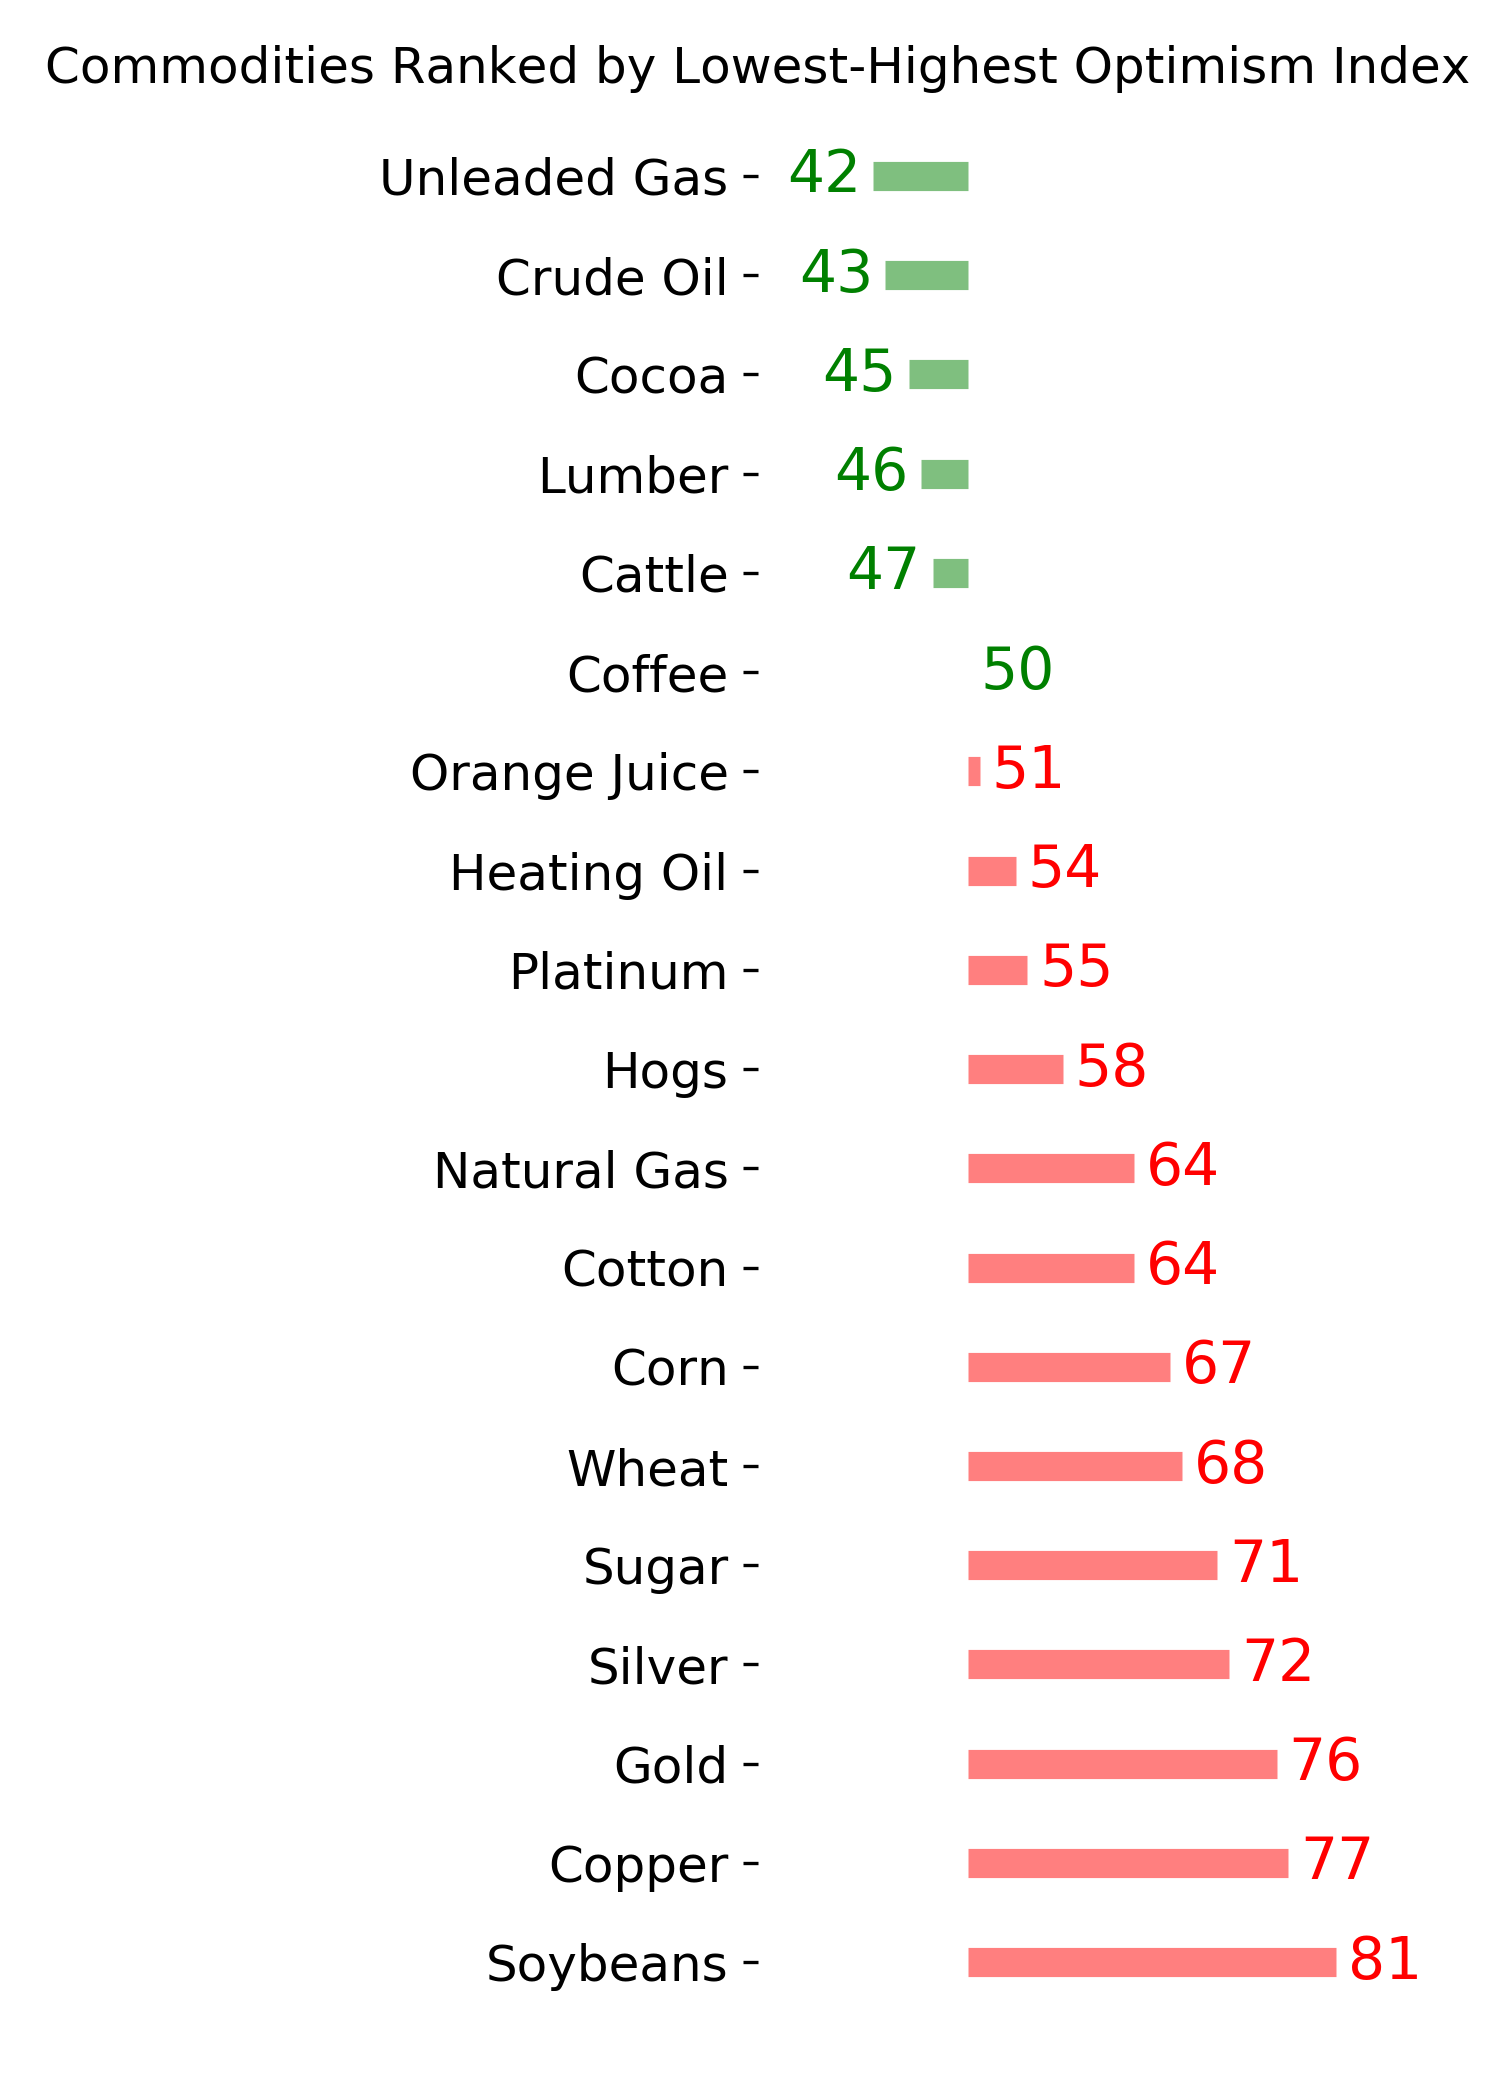
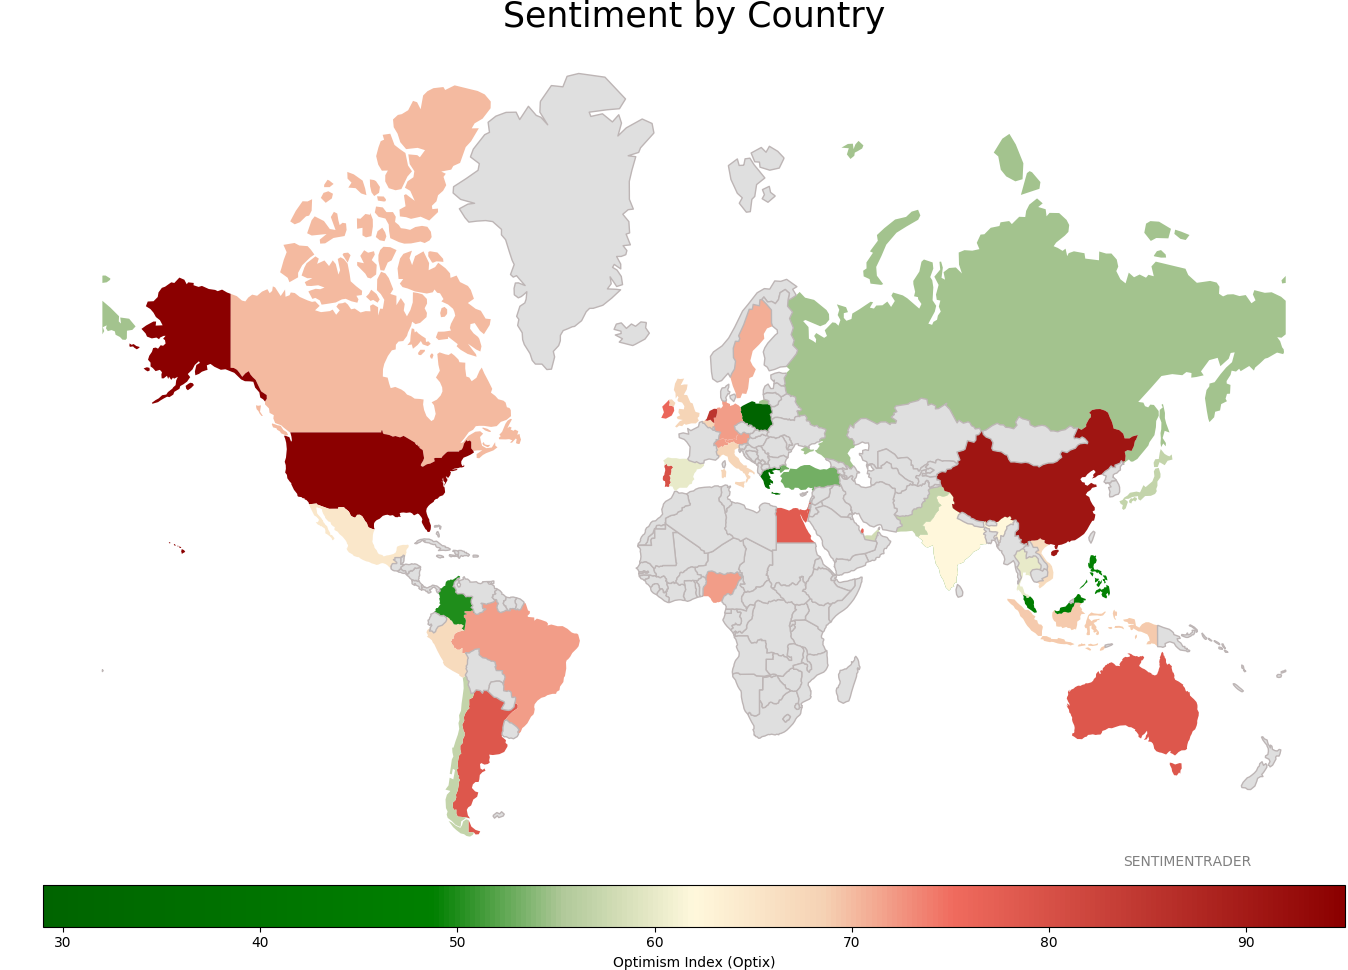
Sentiment Around The World
Optimism Index Thumbnails
|
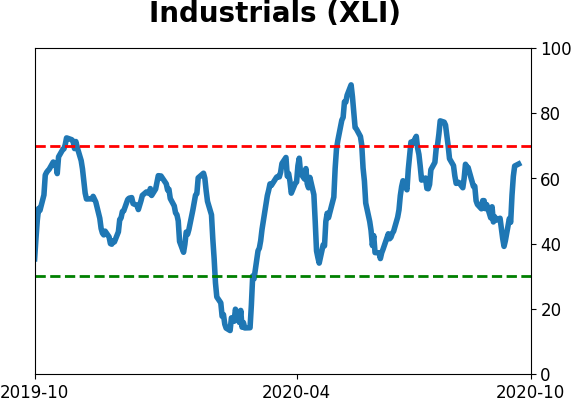
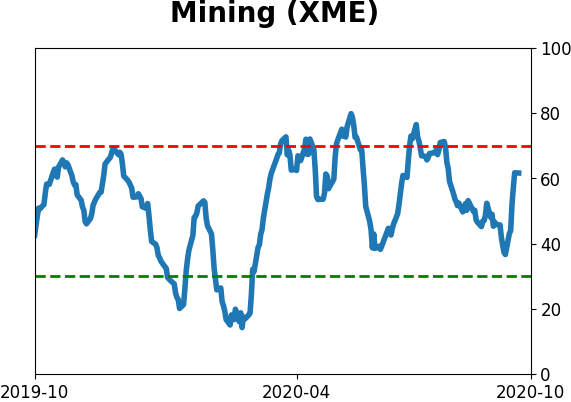
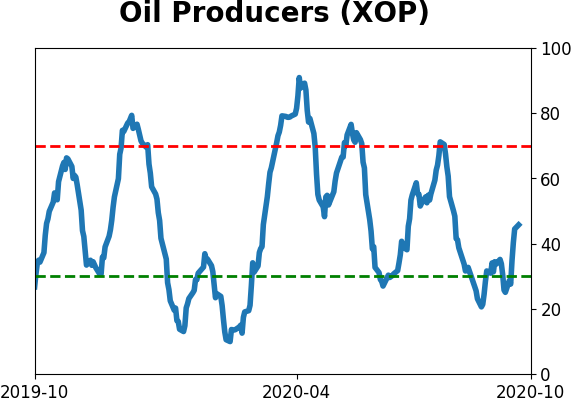
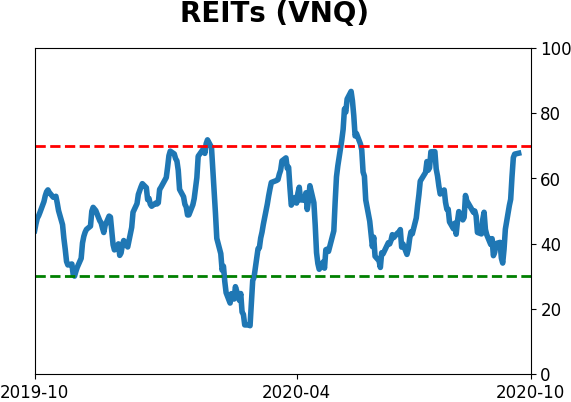
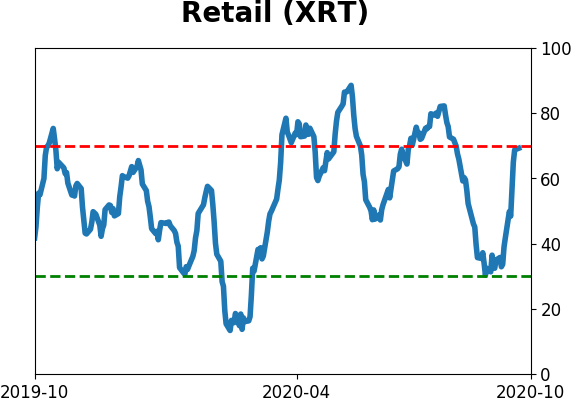
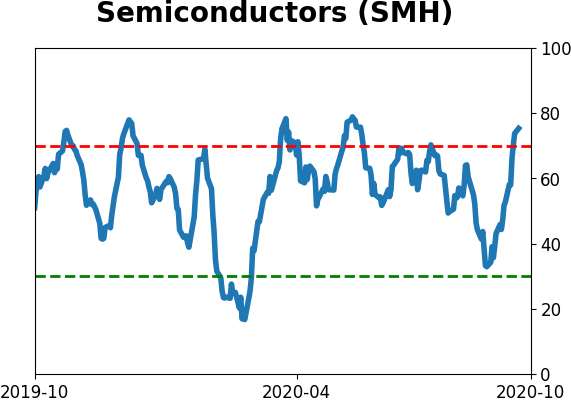
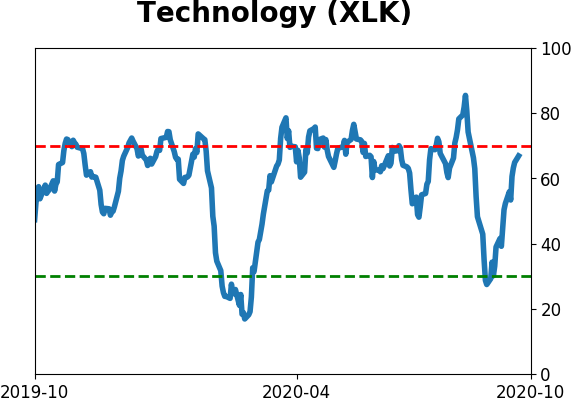
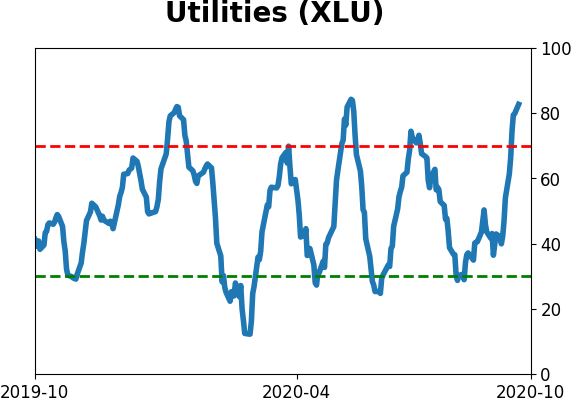
Sector ETF's - 10-Day Moving Average
|
|
|
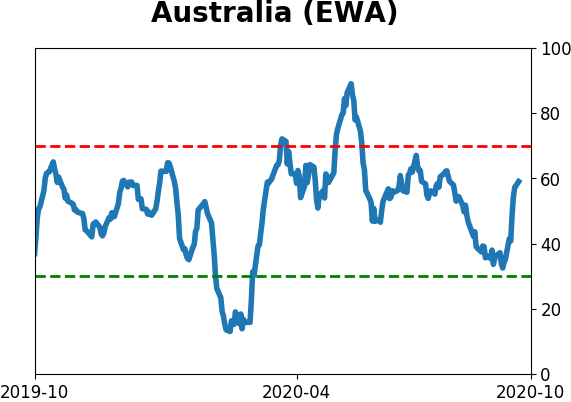
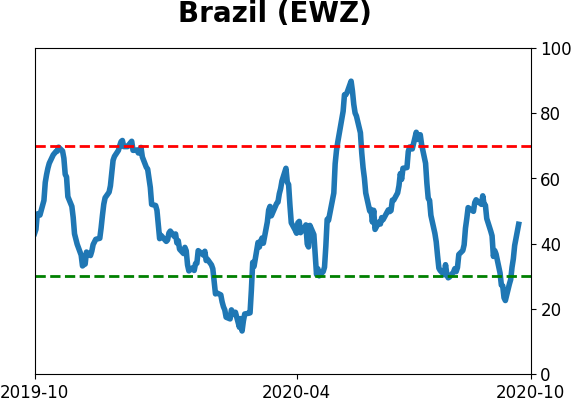
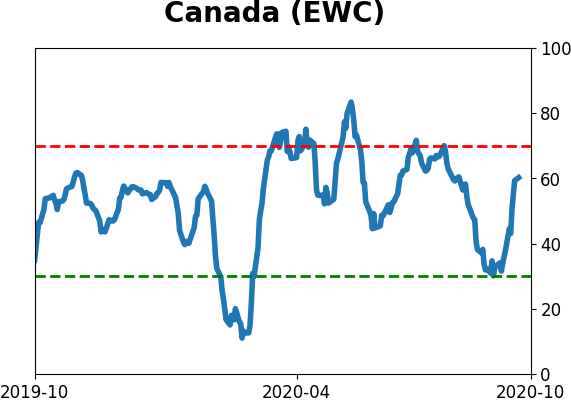
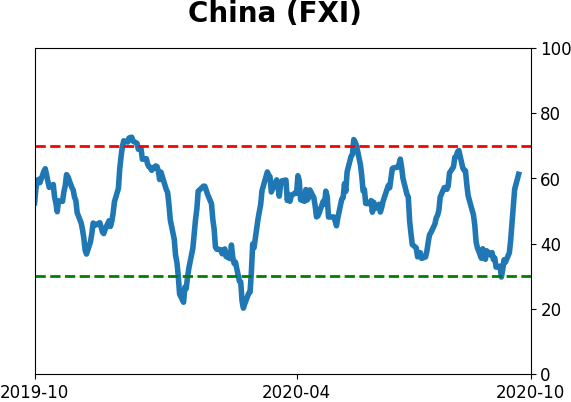
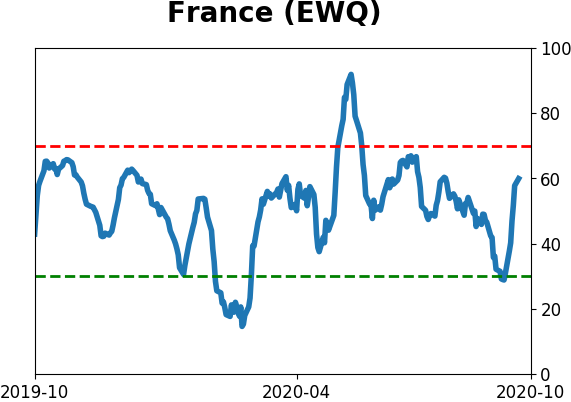
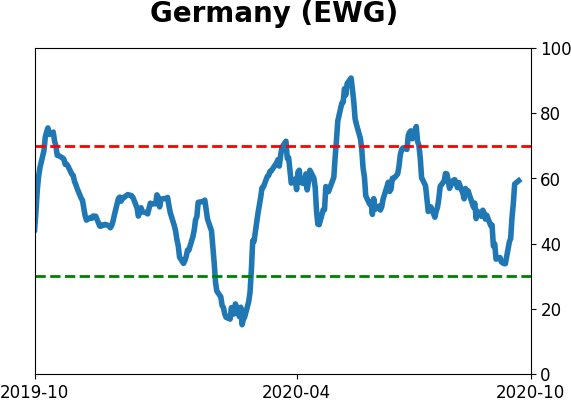
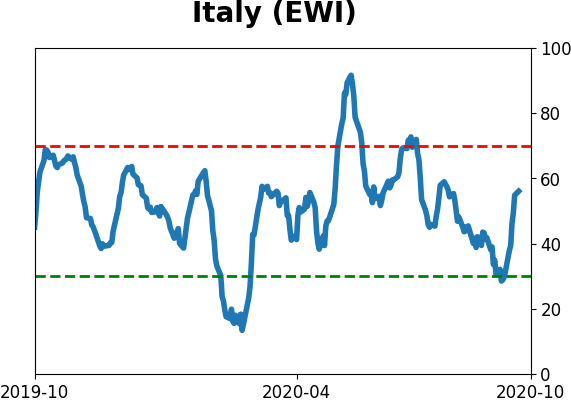
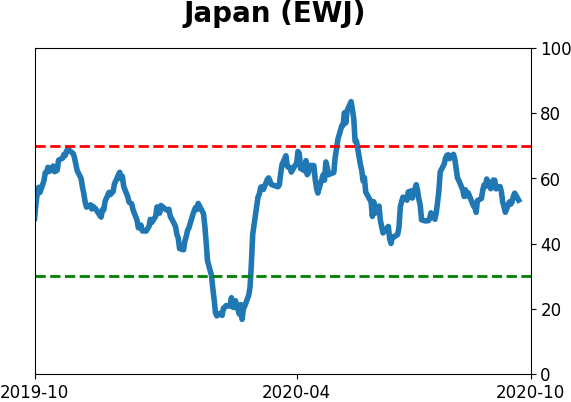
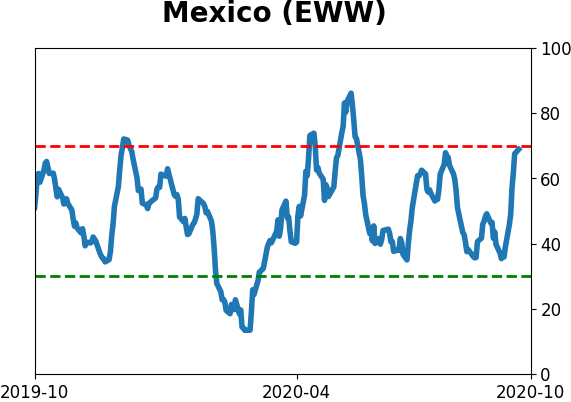
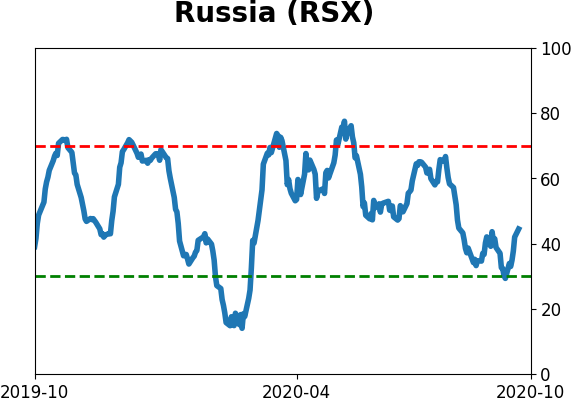
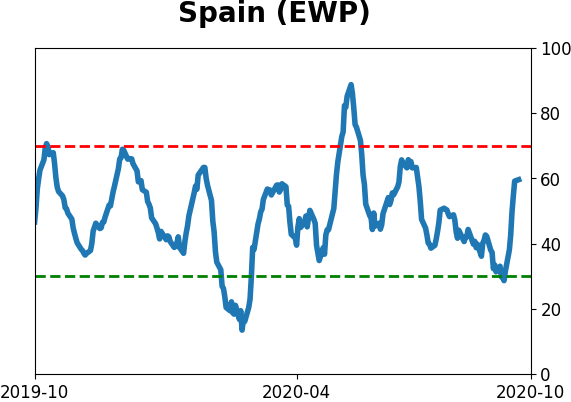
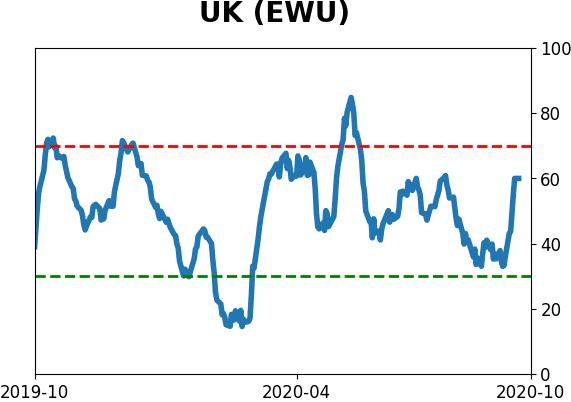
Country ETF's - 10-Day Moving Average
|
|
|
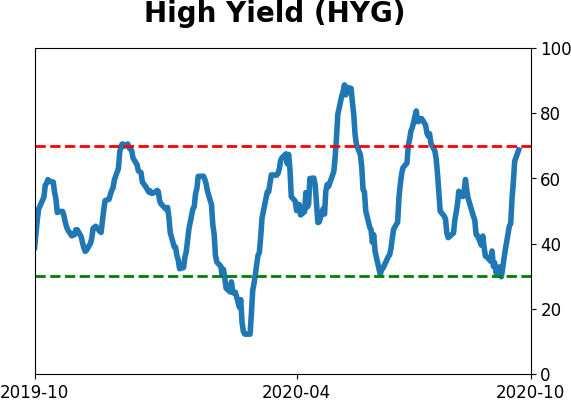
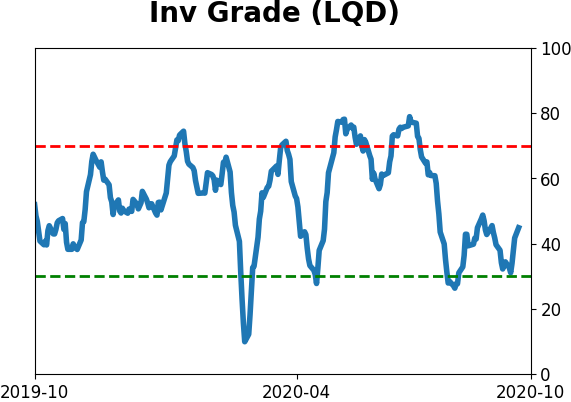
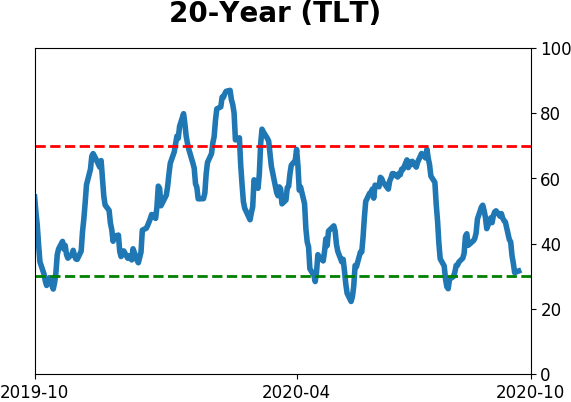
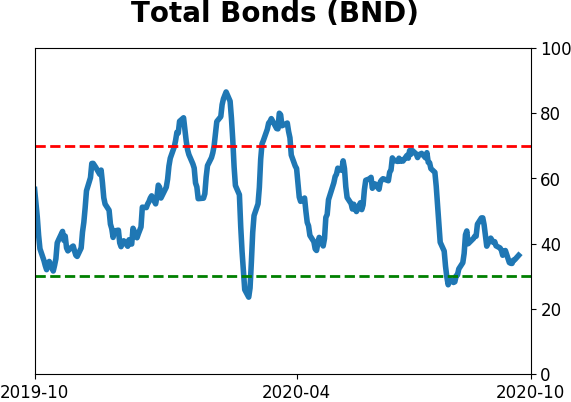
Bond ETF's - 10-Day Moving Average
|
|
|
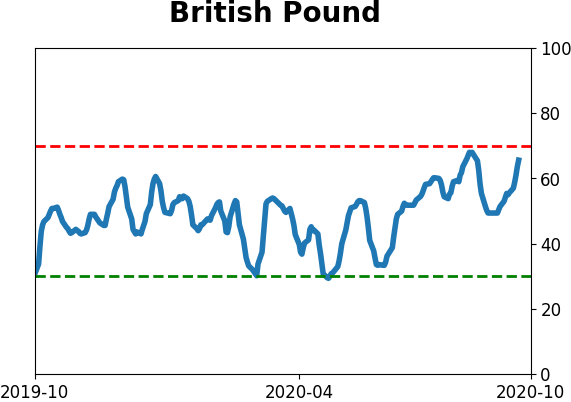
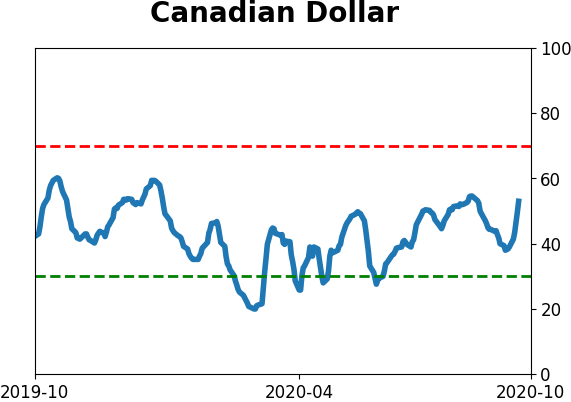
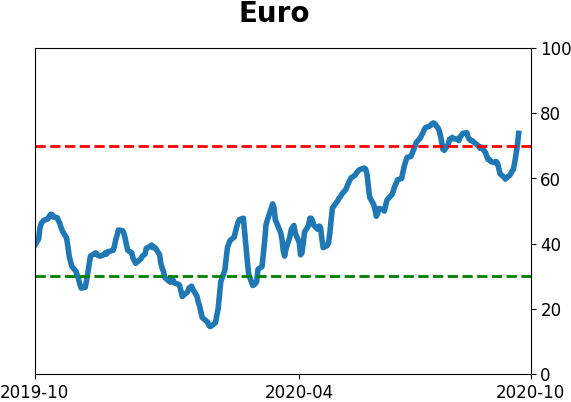
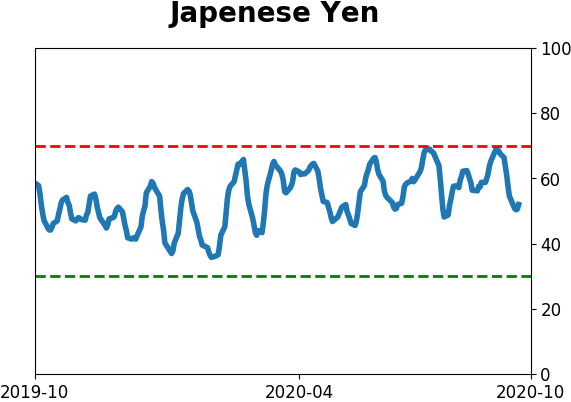
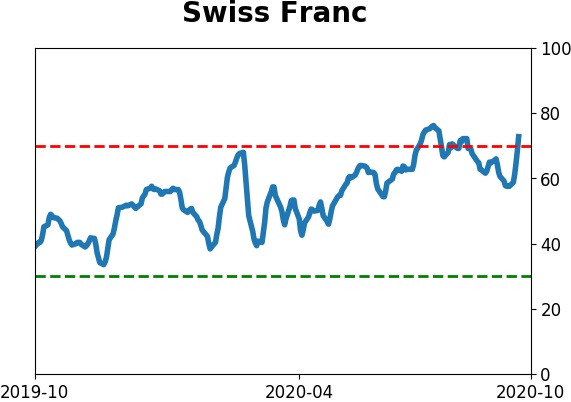
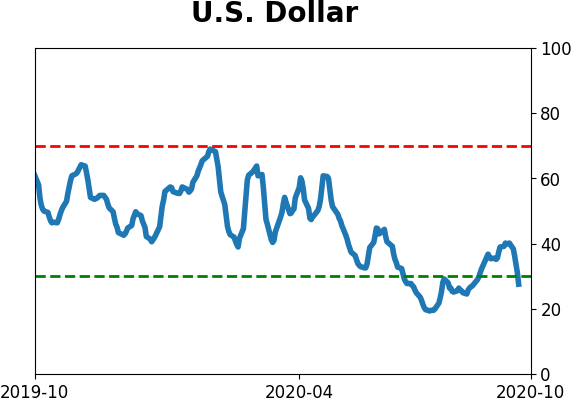
Currency ETF's - 5-Day Moving Average
|
|
|
Commodity ETF's - 5-Day Moving Average
|
|